To nourish, delight and serve our world.
29
INVESTOR PRESENTATION Second Quarter 2014 To nourish, delight and serve our world. Alimentar, deleitar y servir a nuestro mundo. Alimentar, deliciar e servir a nosso mundo 哺育, 愉悦和服务我们的世界 Nourrir, réjouir et servir notre monde
Transcript of To nourish, delight and serve our world.

INVESTOR PRESENTATION
Second Quarter 2014
To nourish, delight and serve our world.
Alimentar, deleitar y servir a nuestro mundo.
Alimentar, deliciar e servir a nosso mundo
哺育, 愉悦和服务我们的世界
Nourrir, réjouir et servir notre monde

Central and South America
Europe Asia Mexico US & Canada
Revenues2 EBITDA2 Countries Plants Routes Distribution
Centers POS Associates Brands Products
US$13.7Bn US$1.3Bn 22 171 ≈ 53,000 ≈ 1,600 ≈ 2.3 mm ≈ 130,000 ≈100 ≈10,000
_______________ 1. As of July 23, 2014 in US$ at the FX rate of 12.9 Ps./US$ 2. LTM 2Q’14 revenues in US$ at the average LTM FX rate
Market Cap
US$ 14.9 bn1 Control Group: 77% Float: 23%

Where do we stand?
3
A Global Consumer Products Company and the leader in the baking industry space
Remarkable growth story with financial stability
Investments on manufacturing and logistics capabilities targeted to foster
productivity
Unyielding discipline on a conservative financial policy
Successful culture of business integration, recently in the US and Canada
Relentless effort on innovation and sustainability to increase brand equity
_______________ Source: Datamonitor 1. According to Company Research 2. LTM 2Q’14 converted to US$ with the average FX rate
4
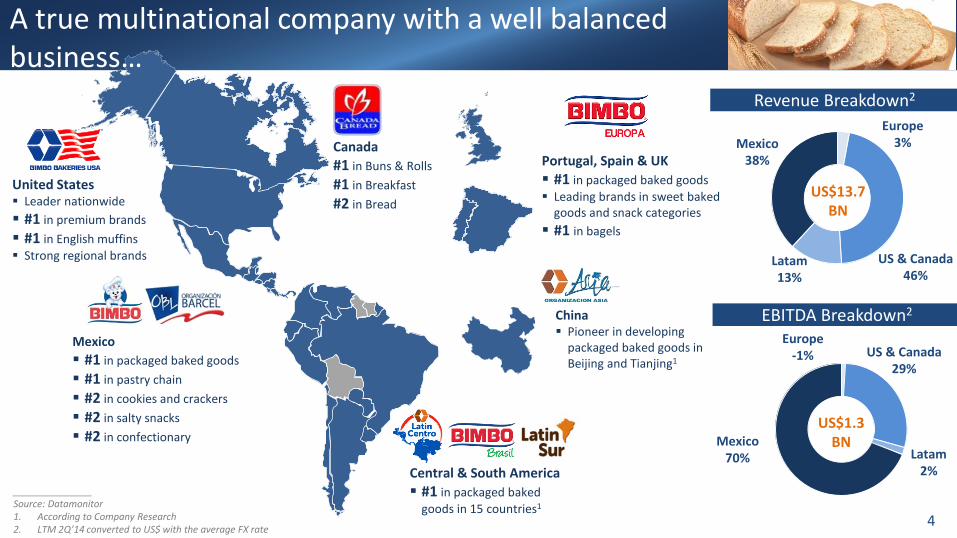
A true multinational company with a well balanced business…
United States Leader nationwide
#1 in premium brands
#1 in English muffins
Strong regional brands
Mexico
#1 in packaged baked goods
#1 in pastry chain
#2 in cookies and crackers
#2 in salty snacks
#2 in confectionary
Portugal, Spain & UK
#1 in packaged baked goods
Leading brands in sweet baked goods and snack categories
#1 in bagels
Central & South America
#1 in packaged baked goods in 15 countries1
China
Pioneer in developing packaged baked goods in Beijing and Tianjing1
Canada
#1 in Buns & Rolls
#1 in Breakfast
#2 in Bread
Revenue Breakdown2
EBITDA Breakdown2
Mexico 38%
US & Canada 46%
Europe 3%
Latam 13%
US$13.7 BN
Mexico 70%
US & Canada 29%
Europe -1%
Latam 2%
US$1.3 BN

Successful Growth Case
Strict Reinvestment
1945
2009
2011
2014
00s
90s
60s 70s 80s
50s
Long term view and a strict reinvestment policy
Innovation and execution continue to drive organic growth
Acquisitions have been a key component to gain global reach
Leadership position in both, mature and high growth markets
Accelerated international expansion during the last decade

Key Success Drivers
Over the last decade GB shifted from a strong local player to a leader in the Americas
Experienced Management
Team and Strong Corporate
Governance
Responsible Financial
Management
Long Run Player in a Very
Attractive and Non-Cyclical
Industry
Dedication to Bakery Industry
Exceptional & Unparalleled Distribution
Network
Socially & Environmentally
Responsible
Brand Equity
Innovation &
Deep Consumer Understanding
6

Leading player in an attractive, stable industry
7
Attractive industry fundamentals Key success drivers for large scale players
Resilience to major economic downturns
Non-discretionary consumer products
High-frequency consumption
Aimed at the general public
Scale and diversification
Strong franchise and brand equity
Product quality
Innovation capabilities
Distribution and logistics
64% 62%
33% 27% 25% 17%
11% 8% 7%
Packaged bread penetration¹
_______________ 1. Datamonitor 2013 in volume. Industrial bread and rolls, Industrial cakes & pastries, Industrial morning goods

Strong Brand Equity and Deep Consumer Understanding
8
Extraordinary
Brand Awareness
Taking innovative products around the world Every meal, every
occasion, every
consumer group
Broad portfolio
Deep
consumer
understanding
4 R&D
Institutes
BIMBO: one of the most valuable
brands in Latin America1
Products that have changed
the
industry’s course
Keep up with
evolving consumer
trends 1. Source: Study conducted by “MillwardBrown Optimor” in September, 2013
Leadership
in core products and
markets
8

Exceptional Distribution Network and Manufacturing Facilities
9
+53,000 routes
Attuned distribution model for
each channel
On of the largest fleets
in the Americas
Unique
expertise in moving high volume
products
Access to unmatched
technological equipment
9
Low cost increase
manufacturing CAPEX

Seasoned Management Team, Sound Governance & Strong Corporate Identity
Finance & Planning Committee
(7 members, 1 independent)
Compensation & Benefits Committee
(5 members, 2 independent)
Javier A. González Deputy CEO of Grupo Bimbo
Fred Penny President of Bimbo
Bakeries USA (BBU)
Guillermo Quiroz CFO
Pablo Elizondo Deputy CEO of Grupo Bimbo
Barry McLean President of
Canada Bread, Ltd
Reynaldo Reyna Chief Information
and Strategy
Miguel A. Espinoza President of Bimbo
Mexico
1. According to the Reputation Institute (September 26, 2011)
Daniel Servitje Chairman of the Board
Daniel Servitje CEO
Gary Prince Deputy CEO of Grupo Bimbo
10
Audit Committee and Corporate Practices
(6 independent members)
Management
Positioned the Company as market leader in the products and
countries where present
Proven track record of stability and sustainable growth
Developed innovative ideas and best practices in manufacturing
Successfully completed and integrated 45 acquisitions over the last 10
years
Governance
Corporate Governance aligned with shareholders’ interest
44% of board members are independent
3 corporate committees
Identity, corporate culture & citizenship
GB ranks among the most respected companies of the world¹
Reputation built on a strong corporate identity and brand equity
Key component of GB’s corporate identity is its company-wide Social Responsibility Program
Complies with WHO’s Global Strategy on Diet and Physical Activity &
Health

Strong Financial Performance
8,619 9,273 10,733
13,164
2009 2010 2011* 2012* 2013* LTM 2Q'14*
Europe Latin America U.S. & Canada Mexico
Revenue Growth1 EBITDA Growth1
(US$ in millions) (US$ in millions)
____________________ 1.Figures converted to USD using the 12M average FX rate for each year * Figures after 2011 in IFRS
EBITDA Margin
5 year CAGR in USD1:
Mexico 6.4%
USA 11.1%
Latam 11.5%
13.6%
16.5%
7.0%
11.5%
13.2%
16.6%
4.6%
10.9%
11.0%
14.3%
1.7%
9.8%
GB
MX
U.S.
LatAm
Iberia -18.6%
8.1%
13.8%
-1.1%
6.4%
-8.7%
9.8%
15.8%
0.7%
7.3%
-3.8%
11
13,786
1,173 1,224 1,183 1,070
1,357
2009 2010 2011* 2012* 2013* LTM 2Q'14*
9.8%
16.2%
1.6%
6.2%
-2.3%
13,719
1,340

9.7
7.0 8.2
9.3 9.7 9.9 10.3 9.7
7.2 7.1 8.0
9.3 9.2 8.9 8.9 10.4 9.7
7.1
4.3 5.9 6.1
13
9.5
12.3 13.5 13.8 13.7 14.1 13.6
10.7 10.3 11.1 12.8 12.2 12.0 11.9
13.6 13.2
11.0
8.1 9.8 9.8
53.3
48.6 47.9
51.2 53.1
54.8 56.2 56.7
53.7 53.3 53.0 54.0 53.4 52.8 51.1
52.8 52.8 51.0 50.7
52.3 53.0
1994 1995 1996 1997 1998 1999 2000 2001 2002 2003 2004 2005 2006 2007 2008 2009 2010 2011 2012 2013 LTM2Q'14
EBIT % EBITDA % Gross %
Financial Stability
Mexican Crisis US Recession World Financial Crisis
____________________ .Figures for 2011, 2012, 2013 & 2014 registered according to IFRS
IFRS
12
Integration efforts

30 33 44 52 40 48 56 54 63 33
127
2005 2006 2007 2008 2009 2010 2011 2012 2013
Ordinary Dividends Extraordinary Dividends
Responsible Financial Policies
1.2 1.1
0.7 0.9
2.4 2.2
3.1 3.0
2.3
3.12 3.31 3.4
0.6 0.4
0.2 0.4
2.0 1.9
2.9 2.7
2.2
2005 2006 2007 2008 2009 2010 2011* 2012* 2013* LTM2Q'14*
Total Debt/EBITDA
#REF!Net Debt/ EBITDA
Conservative Dividend Policy3
(US$ in millions)
Leverage
0.9% 0.6% 0.7% 0.7% 1.0% 0.5%
0.7%
0.5% 0.5%
Flexible Capital Structure
Rapid deleveraging: target <2x
Investment grade ratings: Baa2/BBB/BBB
(Moody’s/Fitch/S&P)
Strict management of CAPEX & Working Capital
Conservative Dividend Policy
Responsible risk management
____________________ 1. Pro forma Weston Foods, Inc, acquisition 2. Taking into account 11 months of pro forma EBITDA of Canada
Bread 3. Figures converted to US$ using the FX of the day dividends
were paid * 2011, 2012, 2013 & 2014 in IFRS
Dividend Yield
0.4%
0.9%

14
Responsible Financial Management Amortization Schedule1
0 384 384
800 800 800
500
2014 2015 2016 2017 2018 2019 2020 2021 2022 2023 2024 ... 2044
Local Bonds RCF International Bonds New Bonds
Debt Structure1
564
Fixed 87%
Float 13%
CAD 30%
MXN 2%
USD 68%
By coupon
Denomination
Total Debt1 US $4,232 mm
Avg. Tenor 9.2 yrs
Avg. Cost 4.3%
1.Totaal debt does not Include subsidiaries debt 2. Pro forma Canada Bread acquisition
(US$ in millions)

Building a Sustainable Future
We understand there is no conflict in doing good and doing well
WHO and SSA guidelines
Trans fats removed from 99.5% of products
133 reformulated products in 2013
Our wind farm in Mexico represents 23% of total energy consumption
Water consumption down 312k m3
91% of wastes are recycled
+300K credits to family owned business
68K students benefited with nutritional education
“Limpiemos Mexico” +36K tonnes of trash collection
+130K associates in 22 countries
Solid ethics
Strong focus on leadership development
15

16
Looking Ahead

Synergistic Transaction
The New BBU
One time costs are necessary to capture synergies
1. Cost 2. Revenue
Manufacturing Distribution S&A
Efficient operation with value creation to consumers
Strong CF generation
Industry Transformation
Time to Improve Profitability
Think Big, Think Future
Long Term Vision- Do It Right
IT
Leadership
Growth
EFICIENCY
17
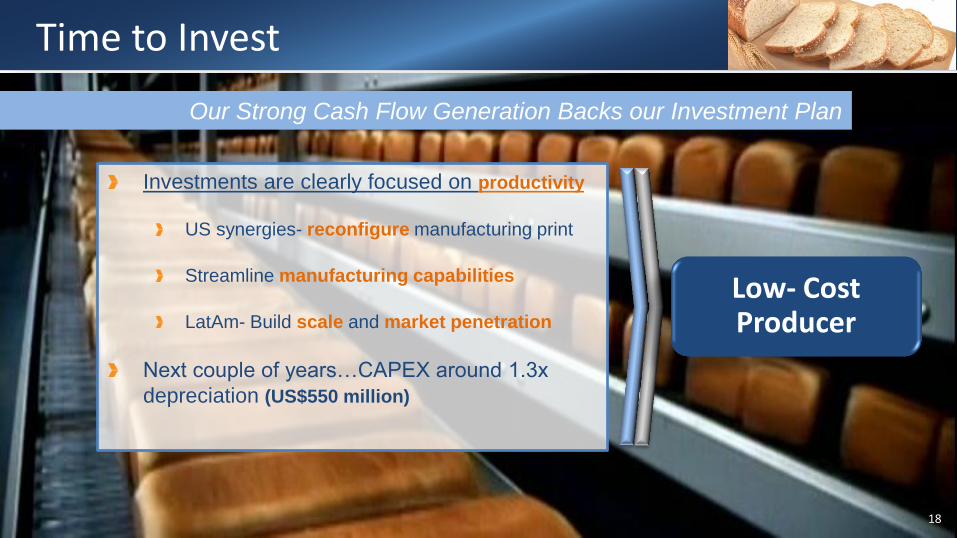
Time to Invest
Investments are clearly focused on productivity
US synergies- reconfigure manufacturing print
Streamline manufacturing capabilities
LatAm- Build scale and market penetration
Next couple of years…CAPEX around 1.3x
depreciation (US$550 million)
Our Strong Cash Flow Generation Backs our Investment Plan
Low- Cost Producer
18

0.9x 1.1x
2.5x
1.9x
1.5x 1.2x 1.1x
0.7x
3.3x1
2.3x
2.2x
3.1x 3.0x
2.3x
3.1x2
2000 2001 2002 2003 2004 2005 2006 2007 2008 2009 2010 2011* 2012* 2013* LTM2Q'14*
Weston West
Time to Deleverage
1.Pro forma figures with Weston Foods acquisition
2. Taking into account 11 months of pro forma EBITDA of Canada Bread
* 2011, 2012, 2013 & 2014 in IFRS
Total Debt/ EBITDA
19
Weston East Sara Lee Canada Bread
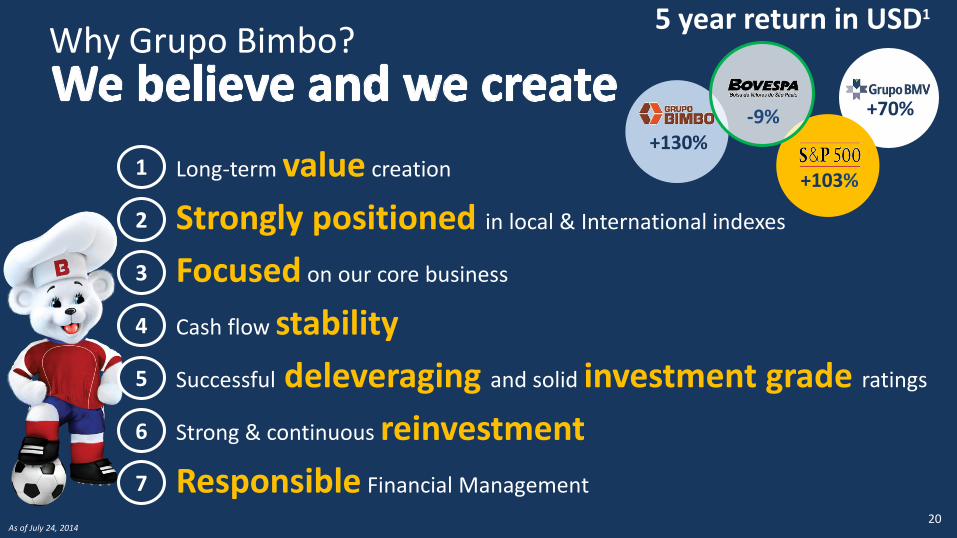
Long-term value creation
Strongly positioned in local & International indexes
Focused on our core business
Cash flow stability
Successful deleveraging and solid investment grade ratings
Strong & continuous reinvestment
Responsible Financial Management
Why Grupo Bimbo?
1
2
3
4
5
6
+70%
+130%
+103%
5 year return in USD1
As of July 24, 2014
7
-9%
20
21
Annex: Financial Results by Region & Recent Acquisitions

Lower inputs cost in Mexico and Europe Production efficiencies - waste reduction / synergies in the US Benefit of the Canada Bread integration
Higher distribution costs in all regions Integration expenses in U.S.
Grupo Bimbo - Quarterly Results
41,449
43,275
42,115
45,540
1Q 2Q 6M
Sales '13 Sales '14
Revenue Growth EBITDA
(MXN$ in millions) (MXN$ in millions)
3,225 4,281
2,977
4,684
7.8% 9.9%
8.9%
7.1%
10.3%
8.7%
1Q 2Q 6M
EBITDA '13 EBITDA '14 EBITDA margin '13 EBITDA margin '14
Canada Bread acquisition Solid growth Latam and Europe
Weak performance in Mexico and U.S.
1.6%
22
3.5%
5.2% 84,730
87,654
7,506
7,661

Mexico- Quarterly Results
Lower raw materials Higher distribution costs
17,740 17,775 17,709 17,692
1Q 2Q 6M
Sales '13 Sales '14
Revenue Growth EBITDA
(MXN$ in millions) (MXN$ in millions)
-0.2%
2,071 2,519
2,071 2,782
11.7%
14.2% 12.9%
11.7%
15.7%
13.7%
0
1,0 00
2,0 00
3,0 00
4,0 00
5,0 00
6,0 00
7,0 00
8,0 00
9,0 00
1Q 2Q 6M
EBITDA '13 EBITDA '14 EBITDA margin '13 EBITDA margin '14
Pricing actions taken since the 4Q’13 Volume decline Challenging industry dynamics
23
-0.3%
35,515 35,402
-0.5%
4,590 4,854

1,278 1,636
801
1,727
7.0%
8.2% 7.6%
4.4%
8.0% 6.3%
0
1,0 00
2,0 00
3,0 00
4,0 00
5,0 00
6,0 00
1Q 2Q 6M
EBITDA '13 EBITDA '14 EBITDA margin '13 EBITDA margin '14
US & Canada- Quarterly Results
Production efficiencies- waste reduction/ synergies Higher distribution expenses Integration related expenses
18,216 19,986
18,415
21,548
1Q 2Q 6M
Sales '13 Sales '14
Revenue Growth EBITDA
(MXN$ in millions) (MXN$ in millions)
Canada Bread acquisition Favorable FX The breakfast and snacks categories outperformed
Volume decline California divestiture More competitive market environment
1.1%
24
4.6%
7.8% 38,203
39,963
2,914 2,528

5,208 5,348 5,629 5,758
1Q 2Q 6M
Sales '13 Sales '14
Latin America- Quarterly Results
Revenue Growth EBITDA
(MXN$ in millions) (MXN$ in millions)
8.1%
Positive sales growth (in local currencies) Notable performance in Colombia, Chile and Costa
Rica
25
Lower raw materials Higher distribution expenses: market penetration efforts
-60
171 111
154 181
335
-1.2%
3.2%
1.1%
2.7%
3.2%
2.9%
-465
-265
-65
135
335
535
735
1Q 2Q 6M
EBITDA '13 EBITDA '14 EBITDA margin '13 EBITDA margin '14
7.7%
7.9%
10,556 11,387

Europe - Quarterly Results
Lower raw materials More efficient cost structure – operational
improvements
1,219 1,269 1,451 1,637
1Q 2Q 6M
Sales '13 Sales '14
Revenue Growth EBITDA
(MXN$ in millions) (MXN$ in millions)
Integration of the UK operation Favorable FX Strong organic growth
19.0%
26
24.1%
-75 -49 -124 -47 -9 -56
-6.2% -3.9% -5.0%
-3.3% -0.5% -1.8%
-465
-265
-65
135
335
535
735
1Q 2Q 6M
EBITDA '13 EBITDA '14 EBITDA margin '13 EBITDA margin '14
29.0% 2,488 3,088

UK: #1 bagel brand
Recent Acquisition Canada Bread
27
Purchase price: CAD$1,830 million
Annual Revenues: CAD$1,439 million1
Annual EBITDA: CAD$185 million1 (12.9% margin)
Canada Bread is one of the leading manufacturers and marketers of bakery
products with presence in Canada, North America and the U.K.
Leading brands, solid margins, accretive to EPS, diversify cash flows, frozen
category opportunity
Canada – 16 Bakeries
U.S.- 3 & Canada - 4 Frozen Bakeries
U.K. – 2 Bakeries
____________________
1 Figures after Grupo Bimbo’s assessment of the earnings capacity of the business that was used for valuation purposes
2 Considers a cash balance of approximately CAN$100 mm
3 Nielsen Market Track (in Canadian dollars), latest 52 weeks as of 7/27/13
4 Includes licensed brands Sun-Maid and Cinnabon
Product Categories Competitive
Position3 Canada Brands
Bread #2
Buns & Rolls #1
Breakfast #1
Tortillas #1
Fruit/ Sweet Bread4 #1
Frozen (US &
Canada): #1 pie shell category
National
Quebec
Maritimes Western
Implied transaction multiples
FV2/LTM Revenues1: 1.2x
FV2/LTM EBITDA1: 9.3x

Thank you
28

The information contained herein has been prepared by Grupo Bimbo, S.A.B. de C.V. (the “Company") solely for use at investors´ presentations. The information herein is only a summary and does not purport to be complete. This material has been prepared solely for informational purposes and should not be construed as a solicitation or an offer to buy or sell any securities and should not be relied upon as advice to potential investors. No representation or warranty, either express or implied, is made as to the accuracy, reliability or completeness of the information presented herein. This material should not be regarded by recipients as a substitute for the exercise of their own judgment. Any opinion expressed herein is subject to change without notice, and the Company is under no obligation to update or keep current the information herein. The Company accepts no liability whatsoever for any loss or damage of any kind arising out of the use of all or any part of this material. This presentation includes forward-looking statements. Such forward-looking statements are based on current expectations and projections about future events and trends that may affect the Company’s business and are not guarantees of future performance. Investors are cautioned that any such forward-looking statements are and will be, as the case may be, subject to many risks, uncertainties and factors, including those relating to the operations and business of the Company. These and various other factors may adversely affect the estimates and assumptions on which these forward-looking statements are based, many of which are beyond our control. While the Company may elect to update forward-looking statements at some point in the future, it specifically disclaims any obligation to do so, even if its estimates change. We undertake no obligation to update publicly or to revise this presentation because of new information, future events or other factors. Our independent public auditors have neither examined nor compiled this presentation and, accordingly, do not provide any assurance with respect to any statements. In light of the risks and uncertainties described above, the future events and circumstances discussed in this presentation might not occur and are not guarantees of future performance. Neither this presentation nor anything contained herein shall form the basis of any contract or commitment whatsoever.
29