To my parents and my husband for their unconditional love...
132
1 ACQUISITION OF ANOIKIS RESISTANCE BY ATTENUATION OF MITOCHONDRIAL RESPIRATION AND REACTIVE OXYGEN SPECIES By SUSHAMA KAMARAJUGADDA A DISSERTATION PRESENTED TO THE GRADUATE SCHOOL OF THE UNIVERSITY OF FLORIDA IN PARTIAL FULFILLMENT OF THE REQUIREMENTS FOR THE DEGREE OF DOCTOR OF PHILOSOPHY UNIVERSITY OF FLORIDA 2011
Transcript of To my parents and my husband for their unconditional love...

1
ACQUISITION OF ANOIKIS RESISTANCE BY ATTENUATION OF MITOCHONDRIAL RESPIRATION AND REACTIVE OXYGEN SPECIES
By
SUSHAMA KAMARAJUGADDA
A DISSERTATION PRESENTED TO THE GRADUATE SCHOOL OF THE UNIVERSITY OF FLORIDA IN PARTIAL FULFILLMENT
OF THE REQUIREMENTS FOR THE DEGREE OF DOCTOR OF PHILOSOPHY
UNIVERSITY OF FLORIDA
2011

2
© 2011 Sushama Kamarajugadda

3
To my parents and my husband for their unconditional love and support

4
ACKNOWLEDGMENTS
Firstly, I would like to thank my advisor Dr. Jianrong Lu for giving me an
opportunity to work in his lab. He is a great scientist and has exceptional intellectual
ability. His guidance and technical expertise have helped me achieve my research
goals. His enthusiasm and ardent zeal for science keeps all of our lab members
motivated. I sincerely thank him for his support and encouragement during my Ph.D.
program.
Next, I would like to thank my committee members; Dr. Kevin Brown, Dr. Jorg
Bungert, Dr. Susan Frost, and Dr. Lizi Wu. They have been very supportive of my
research project. Their insight has always helped my project go in the right direction. I
thank them for their valuable comments, guidance and critical evaluation of my work.
I would like to Dr. Brown for his advice and guidance all through my Ph.D. He
has always been my second mentor in giving both personal and professional advices. I
am very thankful to him for all his help at every step of my Ph.D. program. I would like to
thank Dr. Susan Frost for her valuable advice during my Medical guild research
competition. She is an amazing teacher and has always made sure to correct my
mistakes. I thank Dr. Frost for all her guidance. I would like to thank Dr. Jorg Bungert for
providing me with his input for my qualifying proposal. I thank him for all his help and
support.
Next, I would like to thank Dr. Nicholas Simpson for teaching me NMR technique.
He is a great teacher. I admire his enthusiasm, patience and perseverance. I had a
great time working with him and thank him very much for all his help. I would like to
thank Dr. Anna Maria from Christiaan Leeuwenburgh’s lab for her advice and technical
assistance.

5
Next, I would like to thank all current and past lab members for all their help and
advice. I would like to thank my undergraduate Ms. Lauren Stemboroski for helping me
with my experiments. She is very diligent and hard working undergraduate.
I thank my friends: Dr. Vasumathi Kode, Dr. Mansi Parekh, Dr. Su Nayak, Dr.
Lisa Dyer and Dr. Carolina Pardo for their help, advice and support. They are all
wonderful people.
This entire journey would not have been complete without my family’s support
and encouragement. I thank my parents, older brother and my loving husband for their
unconditional love and support. I specially thank my husband for putting up with me all
through my Ph.D. program. He has always been my confidence booster and a great
critic of my work.

6
TABLE OF CONTENTS page
ACKNOWLEDGMENTS .................................................................................................. 4
LIST OF TABLES ............................................................................................................ 9
LIST OF FIGURES ........................................................................................................ 10
LIST OF ABBREVIATIONS ........................................................................................... 12
ABSTRACT ................................................................................................................... 15
CHAPTER
1 INTRODUCTION .................................................................................................... 17
Overview ................................................................................................................. 17
Anoikis in Normal Cells ..................................................................................... 17
Definition and significance ......................................................................... 17
Mechanisms underlying anoikis ................................................................. 17
Anoikis Resistance in Tumor Cells ................................................................... 19
Signficance of anoikis resistance ............................................................... 19
Mechanisms underlying anoikis resistance ................................................ 19
Glucose Metabolism ......................................................................................... 21
Importance and significance ...................................................................... 21
Lactate dehydrogenase (LDH) ................................................................... 21
Pyruvate dehydrogenase complex (PDC) .................................................. 22
Regulation of PDC enzyme complex ......................................................... 23
Reactive oxygen species (ROS) ................................................................ 25
Tumor Metabolism ............................................................................................ 27
Warburg effect and its significance ............................................................ 27
Advantages of Warburg effect .................................................................... 27
Oncogenes inducing the Warburg effect .................................................... 29
Mutations in mitochondrial enzymes that favor the Warburg effect ............ 30
Human Breast Cancer ...................................................................................... 31
Types of Breast cancer .............................................................................. 31
2 MATERIALS AND METHODS ................................................................................ 37
Cell Culture ............................................................................................................. 37
Reagents ................................................................................................................ 37
Plasmids ................................................................................................................. 38
Poly-Hema Coated Plates for Suspension Culture Cells ........................................ 38
RNA Isolation, and Northern blotting....................................................................... 38
Reverse Transcription, and Real-Time PCR ........................................................... 39
Short-hairpin RNA (shRNA) Vector Construction .................................................... 40

7
Plasmid DNA MiniPrep ........................................................................................... 42
Retroviral Short Hairpin RNA Production and Transduction of Target Cells ........... 42
Protein Isolation and Immunoblotting ...................................................................... 44
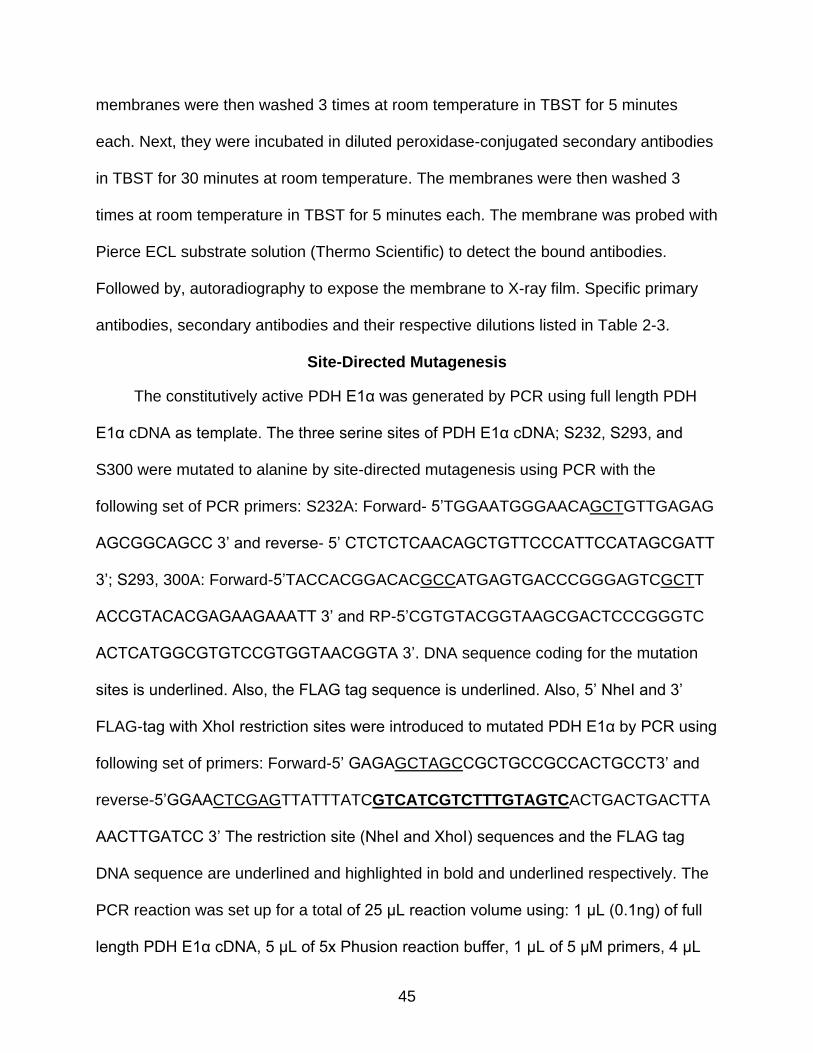
Site-Directed Mutagenesis ...................................................................................... 45
Lentiviral Over Expression of Constitutively Active FLAG-tagged PDH E1α ........... 46
Measurement of PDH Activity ................................................................................. 47
Trypan Blue Exclusion Assay ................................................................................. 48
Caspase 3/7 Activity Assay ..................................................................................... 48
Annexin V/7-AAD Analysis ...................................................................................... 49
Measurement of Oxygen Consumption Rate .......................................................... 49
Measurement of Intracellular ROS .......................................................................... 50
Measurement of Intracellular Lactate ...................................................................... 50
Experimental Metastasis Assay in Mice .................................................................. 51
Tissue Sectioning and H&E Staining ...................................................................... 51
Statistics ................................................................................................................. 52
3 INFLUENCE OF GLUCOSE METABOLISM ON ANCHORAGE-INDEPENDENT SURIVIVAL IN MAMMARY EPITHELIAL CELLS ................................................... 55
Background ............................................................................................................. 55
Results .................................................................................................................... 56
Induction of PDK upon Detachment from ECM ................................................ 56
Upregulation of PDK4 Antagonizes Anoikis ...................................................... 57
Activation of PDH Sensitizes Cells to Anoikis ................................................... 59
Depletion of PDK4 Increases Mitochondrial Oxidation ..................................... 60
Treatment with Antioxidant Rescues PDK4-Depleted Cells from Anoikis ......... 61
Estrogen-Related Receptor Activates PDK4 in Response to Cell Detachment ................................................................................................... 62
Summary ................................................................................................................ 64
4 PDK PROMOTES ANOIKIS RESISTANCE AND TUMOR METASTASIS IN BREAST CANCER CELLS ..................................................................................... 80
Background ............................................................................................................. 80
Results .................................................................................................................... 81
Induction of PDK4 Promotes Anoikis Resistance in RAS-Transformed Mammary Epithelial Cells .............................................................................. 81
Induction of PDK4 in Ras-transformed MCF10A cells (10ACA1.1) ............ 81
PDK4 resists anoikis in Ras-transformed MCF10A cells (MCF10ACA1.1) ..................................................................................... 82
Warburg Effect Promotes Anoikis Resistance and Metastasis in Breast Tumor Cells ................................................................................................... 82
Matrix detachment favors Warburg effect in MDA-MB-231 cells ................ 82
Forced activation of mitochondrial oxidation induces anoikis in MDA-MB-231 ................................................................................................... 83
PDK1 enhances Warburg effect in matrix detached MDA-MB-231 cells .... 84

8
Depletion of PDK1 activates mitochondrial oxidation and abrogates anoikis resistance in MDA-MB-231 cells ................................................. 85
PDK1 enhances breast tumor metastasis in vivo ....................................... 86
Summary ................................................................................................................ 87
5 ANTIOXIDANT PROTECTION FROM DETACHMENT INDUCED OXIDATIVE STRESS IN MAMMARY EPITHELIAL CELLS ........................................................ 98
Background ............................................................................................................. 98
Endogenous Antioxidants Defense System ...................................................... 98
Manganese Superoxide Dismutase (MnSOD) .................................................. 98
Good ROS and Bad ROS ................................................................................. 99
Results .................................................................................................................. 100
Induction of MnSOD in Matrix Detached Mammary Epithelial Cells ............... 100
Depletion of MnSOD Sensitizes Mammary Epithelial Cells to Anoikis ........... 101
Epistatic Relationship Between PDK4 and MnSOD upon Matrix Detachment 102
Summary .............................................................................................................. 102
6 CONCLUSIONS AND FUTURE DIRECTIONS .................................................... 109
Conclusions .......................................................................................................... 109
Future Directions .................................................................................................. 116
LIST OF REFERENCES ............................................................................................. 120
BIOGRAPHICAL SKETCH .......................................................................................... 132

9
LIST OF TABLES
Table page 2-1 Primers used for real-time RT-PCR ................................................................... 54
2-2 shRNA Oligos designed for retrovirus-mediated knockdown ............................. 54
2-3 Antibodies used for Immunoblotting (IB) ............................................................ 54
10
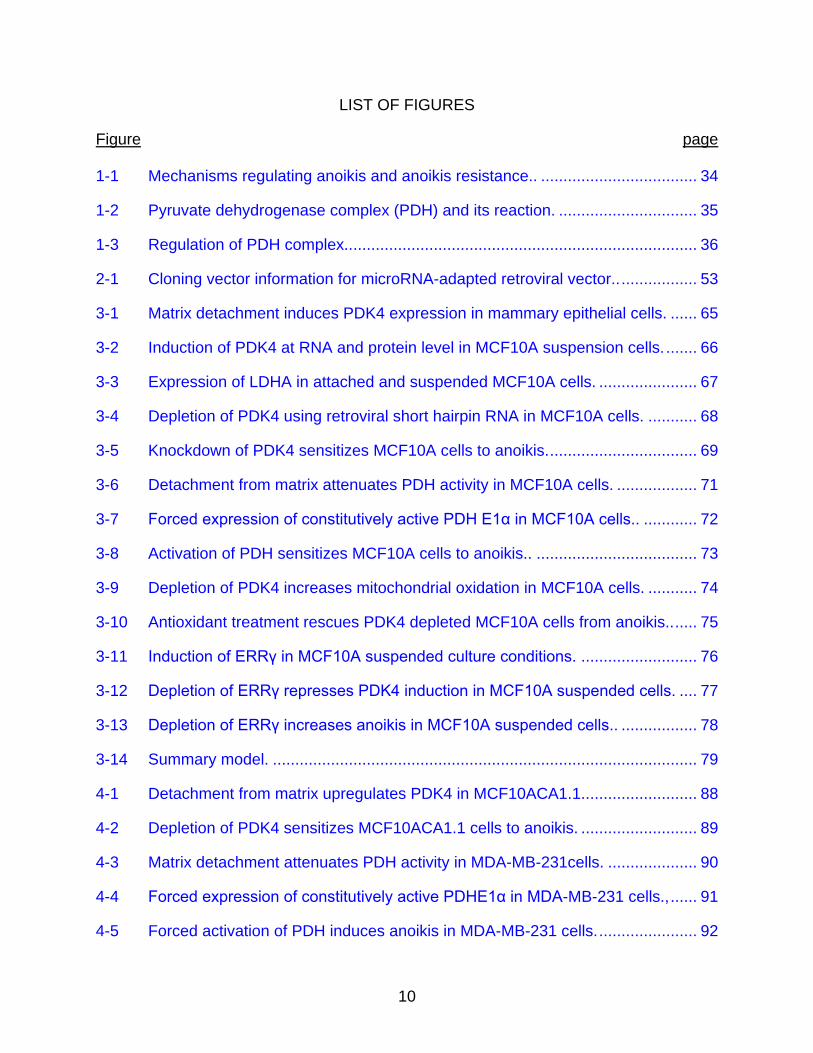
LIST OF FIGURES
Figure page 1-1 Mechanisms regulating anoikis and anoikis resistance.. ................................... 34
1-2 Pyruvate dehydrogenase complex (PDH) and its reaction. ............................... 35
1-3 Regulation of PDH complex............................................................................... 36
2-1 Cloning vector information for microRNA-adapted retroviral vector.. ................. 53
3-1 Matrix detachment induces PDK4 expression in mammary epithelial cells. ...... 65
3-2 Induction of PDK4 at RNA and protein level in MCF10A suspension cells. ....... 66
3-3 Expression of LDHA in attached and suspended MCF10A cells. ...................... 67
3-4 Depletion of PDK4 using retroviral short hairpin RNA in MCF10A cells. ........... 68
3-5 Knockdown of PDK4 sensitizes MCF10A cells to anoikis. ................................. 69
3-6 Detachment from matrix attenuates PDH activity in MCF10A cells. .................. 71
3-7 Forced expression of constitutively active PDH E1α in MCF10A cells.. ............ 72
3-8 Activation of PDH sensitizes MCF10A cells to anoikis.. .................................... 73
3-9 Depletion of PDK4 increases mitochondrial oxidation in MCF10A cells. ........... 74
3-10 Antioxidant treatment rescues PDK4 depleted MCF10A cells from anoikis.. ..... 75
3-11 Induction of ERRγ in MCF10A suspended culture conditions. .......................... 76
3-12 Depletion of ERRγ represses PDK4 induction in MCF10A suspended cells. .... 77
3-13 Depletion of ERRγ increases anoikis in MCF10A suspended cells.. ................. 78
3-14 Summary model. ............................................................................................... 79
4-1 Detachment from matrix upregulates PDK4 in MCF10ACA1.1.. ........................ 88
4-2 Depletion of PDK4 sensitizes MCF10ACA1.1 cells to anoikis. .......................... 89
4-3 Matrix detachment attenuates PDH activity in MDA-MB-231cells. .................... 90
4-4 Forced expression of constitutively active PDHE1α in MDA-MB-231 cells., ...... 91
4-5 Forced activation of PDH induces anoikis in MDA-MB-231 cells. ...................... 92

11
4-6 Induction of PDK1 at protein level in MDA-MB231 cells .................................... 93
4-7 Depletion of PDK1 switches glucose metabolism in MDA-MB-231 cells.. ......... 95
4-8 Depletion of PDK1 abolishes anoikis resistance in MDA-MB-231 cells.. ........... 96
4-9 Depletion of PDK1 abrogates tumor metastasis in vivo.. ................................... 97
5-1 Induction of MnSOD in HMEC and MCF10A suspended cells.. ...................... 103
5-2 Knockdown of MnSOD in MCF10A cells. ........................................................ 104
5-3 Depletion of MnSOD leads to increased anoikis in MCF10A.. ......................... 105
5-4 Epistatic relationship between PDK4 and MnSOD in MCF10A cells.. ............. 107
5-5 Summary model. ............................................................................................. 108
6-1 Expression of PDK4 in different tumor cells lines. ........................................... 119
12
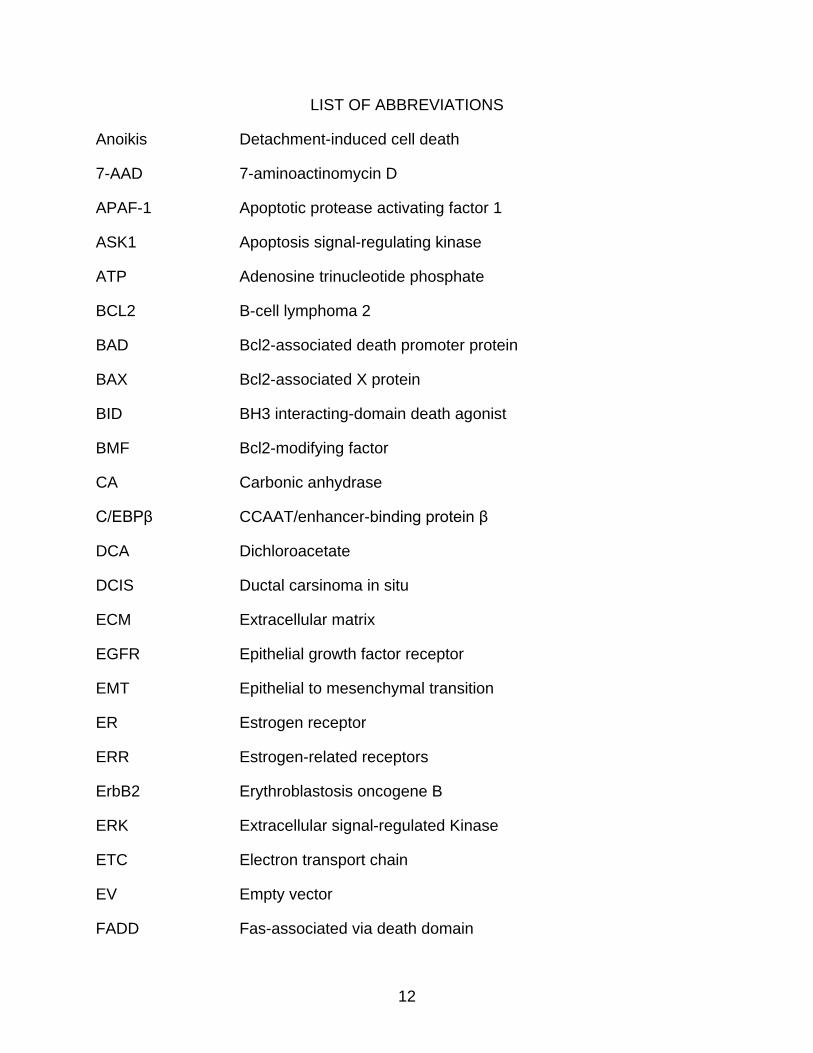
LIST OF ABBREVIATIONS
Anoikis Detachment-induced cell death
7-AAD 7-aminoactinomycin D
APAF-1 Apoptotic protease activating factor 1
ASK1 Apoptosis signal-regulating kinase
ATP Adenosine trinucleotide phosphate
BCL2 B-cell lymphoma 2
BAD Bcl2-associated death promoter protein
BAX Bcl2-associated X protein
BID BH3 interacting-domain death agonist
BMF Bcl2-modifying factor
CA Carbonic anhydrase
C/EBPβ CCAAT/enhancer-binding protein β
DCA Dichloroacetate
DCIS Ductal carsinoma in situ
ECM Extracellular matrix
EGFR Epithelial growth factor receptor
EMT Epithelial to mesenchymal transition
ER Estrogen receptor
ERR Estrogen-related receptors
ErbB2 Erythroblastosis oncogene B
ERK Extracellular signal-regulated Kinase
ETC Electron transport chain
EV Empty vector
FADD Fas-associated via death domain

13
FADH2 Flavin adenosine dinucleotide
FAK Focal adhesion kinase
FH Fumarate hydratase
FLIP FLICE (FADD-like IL-1β-converting enzyme)-inhibitory protein
FOXO3A Forkhead family of transcription factor 3a
G6P Glucose-6-phosphate
GPx Glutathione peroxidase
GSH L-Glutathione (reduced form)
HER2 Human epidermal growth factor receptor 2
H&E Hematoxylin and Eosin
HK Hexokinase
IDC Invasive ductal carcinoma
IDH2 Isocitrate dehydrogenase 2
ILC Invasive lobular carcinoma
ILK Integrin-linked kinase
LA Lipoic acid
LCIS Lobular carcinoma in situ
LDH Lactate dehydrogenase
MCL1 Myeloid cell leukemia 1 protein
MEK Mitogen-activated protein kinase kinase
MnSOD Manganese superoxide dismutase
NADH Nicotinamide adenine dinucleotide
NADPH Nicotinamide adenine dinucleotide phosphate
NFκB Nuclear factor kappa-light-chain-enhancer of activated B cells
OCR Oxygen consumption rate

14
PE Phycoerythrin
Poly-Hema Poly(2-hydroxyethyl methacrylate)
PPP Pentose phosphate pathway
PTEN Phosphatase and tensin homolog
PI3K Phosphoinositide 3-Kinase
PDH/C Pyruvate dehydrogenase complex
PDK Pyruvate dehydrogenase kinase
PFK 1 Phosphofructokinase 1
PGC 1α Peroxisome proliferator-activated receptor γ coactivator-1 alpha
PKM2 Phospho fructokinase isoform M2
PPARα Peroxisome proliferator-activated receptor-
PR Progesterone receptor
p53 Tumor protein 53
ROS Reactive oxygen species
SDH Succinate dehydrogenase (SDH)
shRNA short-hairpin RNA
SOD Superoxide dismutase
TCA Tricarboxylic acid cycle
TNFα Tumor necrosis factor α
VEGF Vascular endothelial growth factor
VHL von-Hippel Lindau
v-Src Viral sarcoma
XIAP X-linked inhibitor of apoptosis protein

15
Abstract of Dissertation Presented to the Graduate School of the University of Florida in Partial Fulfillment of the Requirements for the Degree of Doctor of Philosophy
ACQUISITION OF ANOIKIS RESISTANCE BY ATTENUATION OF MITOCHONDRIAL
RESPIRATION AND REACTIVE OXYGEN SPECIES
By
Sushama Kamarajugadda
December 2011
Chair: Jianrong Lu Major: Medical Sciences - Biochemistry and Molecular Biology
Cancer cells commonly exhibit aberrant glucose metabolism characterized by a
preference for aerobic glycolysis rather than mitochondrial oxidation. However, the
significance of this phenomenon, known as the Warburg effect, remains incompletely
understood. To metastasize, cancer cells must overcome matrix detachment-induced
apoptosis, or anoikis. It is unclear whether tumor metabolism contributes to anoikis
resistance and metastasis. Here we show when detached from matrix, untransformed
mammary epithelial cells (MCF10A) undergo metabolic reprogramming by markedly
upregulating pyruvate dehydrogenase (PDH) kinase 4 (PDK4) through estrogen-related
receptor gamma (ERRγ), thereby attenuating the flux of pyruvate into mitochondrial
oxidation. Depletion of PDK4 or activation of PDH enhances mitochondrial respiration
and oxidative stress in suspended MCF10A cells and sensitizes them to anoikis.
Therefore, decreased glucose oxidation confers resistance to anoikis in untransformed
mammary epithelial cells. Consistent with this finding, matrix-detached MCF10A cells
also elevate the antioxidant manganese superoxide dismutase (MnSOD) to alleviate
oxidative stress and prolong survival in suspension.

16
Cancer cells, due to reduced glucose oxidation, inherently possess survival
advantage in suspension. Normalization of glucose metabolism by activating PDH
restores anoikis in metastatic breast cancer cells MDA-MB-231. Depletion of PDK1
curtails MDA-MB-231 cells metastatic potential by reducing the lung tumor incidence in
vivo. Taken together, our study suggests that intervention of tumor metabolism by
developing therapy against PDK may open new avenues for anti-metastasis treatment.

17
CHAPTER 1 INTRODUCTION
Overview
Anoikis in Normal Cells
Definition and significance
Anoikis is a Greek term meaning “homelessness”. It is a kind of cell death
triggered by loss of cell adhesion or inappropriate cell anchorage1. It prevents a
detached cell from reattaching to an inadequate or inappropriate matrix2. The
physiological relevance of anoikis is to maintain tissue homeostasis, and proper
development3. Binding of integrin proteins to the extracellular matrix (ECM) provides
survival signals, which helps in establishing appropriate cell-matrix interactions. Any
association of detached cells with inappropriate matrix would lead to incorrect integrin
engagement followed by activation of proapoptotic genes, and consequently anoikis4.
Mechanisms underlying anoikis
Under normal physiological conditions, cells are protected from anoikis in three
different scenarios: (i) During reattachment of the cell to an appropriate matrix, (ii)
detachment of a cell to move towards a chemo attractant, and (iii) through cell-cell
contacts2. It is well established that the integrins associated with the ECM are critical for
cell survival4. They are activated by various signaling molecules such as focal adhesion
kinase (FAK), integrin linked kinase (ILK), phosphoinositide 3 kinase (PI3K)/Akt or
protein kinase B (PKB), and extracellular signal-related kinase (ERK)5,6.
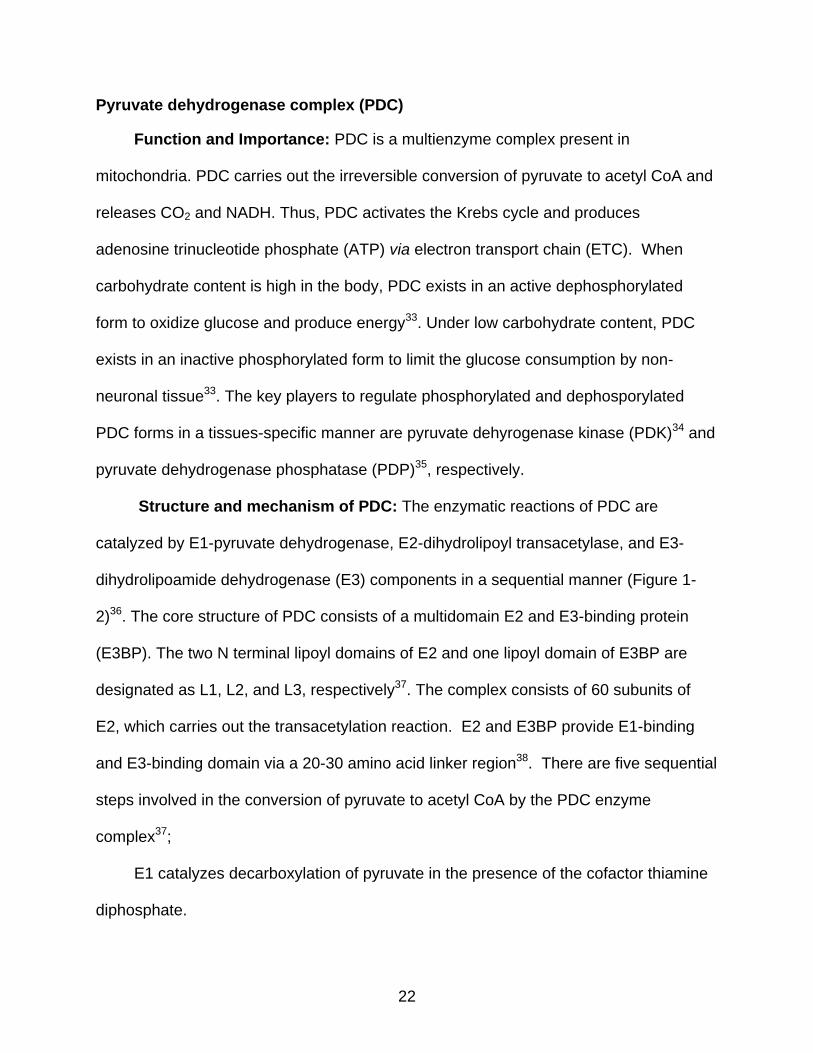
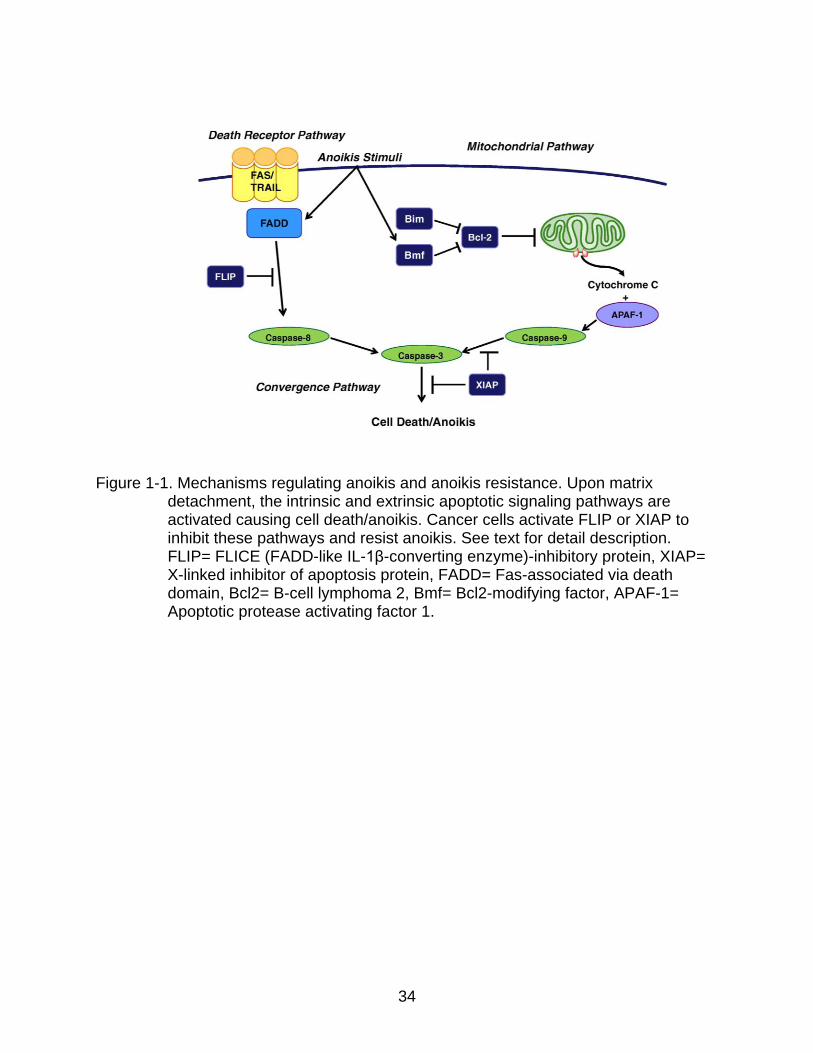
Upon detachment of cells from ECM, anoikis is activated either by an extrinsic
/death receptor pathway7,8 or an intrinsic/mitochondrial pathway9 (Figure 1-1). In the
intrinsic pathway, cells undergo apoptosis due to activation of pro-apoptotic B-cell

18
lymphoma 2 (BCL2) family proteins. This is followed by release of cytochrome C from
mitochondria and activation of downstream caspase events. Several reports have
shown that pro-apoptotic BH3 only proteins of BCL2 family like Bim5, Bcl2-modifying
factor (BMF)9-11, and Bcl2-associated death promoter protein (BAD)12 are activated
during cell detachment and trigger anoikis. These pro-apoptotic genes are activated by
different signaling pathways such as fork head family of transcription factor 3a
(FOXO3a) signaling13. Matrix detachment inactivates survival signaling pathways such
as epidermal growth factor receptor-mitogen-activated protein kinase kinase-
extracellular signal-regulated kinase (ERK1/2) 14 and epithelial growth factor receptor
(EGFR) involving PI3K pathways5, which may result in activation of certain pro-apoptotic
genes. Therefore, oncogenes such as erythroblastosis oncogene B2 (ErbB2) and viral
sarcoma (v-Src) suppress anoikis through ERK-mitogen-protein kinase pathway in
cultured mammary epithelial acini15. It has been shown that hypoxia suppresses Bim
and BMF expression via ERK signaling and inhibits luminal clearing during
morphogenesis in an in vitro three-dimensional mammary epithelial culture16. On the
other hand, the extrinsic pathway involving death receptors like Fas and tumor necrosis
factor α (TNF) may trigger apoptosis in certain cells upon detachment17. This pathway
activates caspase 8, which may trigger apoptosis with or without the involvement of
intrinsic pathway. The pro-apoptotic BH3 interacting-domain death agonist (BID) protein
is cleaved by caspase 8 and the truncated BID activates the intrinsic pathway during
anoikis18. To date, the involvement of the death receptor pathway in anoikis is
ambiguous. However, the involvement of intrinsic pathway is well established.
19
Another mechanism driving anoikis during detachment is protein 53 (p53). p53 is a
crucial molecule that regulates cell cycle, maintains genomic stability, inhibits
angiogenesis and is hence known as a tumor suppressor protein. It has been shown
that inhibition of p53 increases anoikis resistance in fibroblasts19 and thyroid epithelial
cells20. Furthermore, inhibition of αvβ3 integrin activates p53 leading to anoikis in
endothelial cells21. The tumor suppressor gene phosphatase and tensin homolog
(PTEN), which is transactivated by p53, restores anoikis in breast cancer cells22. These
studies confirm the role of p53 in inducing anoikis upon detachment from ECM in
different cell lines.
Anoikis Resistance in Tumor Cells
Signficance of anoikis resistance
Unlike normal cells, tumor cells are resistant to anoikis. Anoikis resistance is a
hallmark of malignant tumors for an anchorage independent growth and survival23. The
underlying purpose of evading anoikis by a tumor cell is to survive in an environment
outside its own niche. Anoikis resistance has been implicated in tumor invasion and
metastasis.
Mechanisms underlying anoikis resistance
Tumor cells adopt different mechanisms to evade anoikis. One of them is the
constitutive activation of survival signals like PI3K, mitogen-activated protein kinase
kinase (MEK)/ERK etc, for proliferation, survival, and migration24. Another common
strategy is the activation of epithelial to mesenchymal transition (EMT) by activating
transcription factors such as snail, twist, slug, etc., EMT changes the tumor cell
morphology by suppressing epithelial markers like E-Cadherin and up regulating
mesenchymal markers like vimentin and fibronectin25, allowing the tumor cells to
20
migrate and invade the distant organs even in the absence of matrix. In addition, a
change in the expression pattern of integrin proteins plays a critical role in anoikis
resistance. It has been shown that MCF10A cells overexpressing ErbB2 upregulate
integrin α5 protein, which in turn enhances anoikis resistance by activating ErbB2
tyrosine phosphorylation26. Another plausible protection from anoikis implicates reactive
oxygen species (ROS) in tumor cells. A recent report suggested that detachment from
extracellular matrix leads to accumulation of ROS in prostrate cancer cells, which
results in the activation of survival signals such as EGFR via src kinase27. However, the
implication of ROS in anoikis is still controversial. Tumor cells upregulate apoptosis
inhibiting proteins such as FLICE (FADD-like IL-1β-converting enzyme)-inhibitory
protein (FLIP), an inhibitor of caspase 8, and X-linked inhibitor of apoptosis protein
(XIAP), an inhibitor of caspase 3/7, upon loss of anchorage to evade apoptosis23 (Figure
1-1). Over-expression of oncogenes such as ras has been reported in some tumor
cells, which would activate survival-signaling pathways28. The hypoxic environment
prevailing within a tumor also helps in promoting anoikis resistance by upregulating
different survival and proliferation genes29. Hypoxia-regulated genes will be discussed in
detail in tumor metabolism section.
Apart from the signaling pathways and the inhibitors of pro apoptotic genes, the
role of metabolism in regulating anoikis resistance is quite intriguing. A genome wide
micro-array study performed by Schmelzle T et al., showed an upregulation of pyruvate
dehydrogenase kinase isozyme 4 (PDK4), an important enzyme that regulates glucose
metabolism, in MCF10A suspension culture10. The microarray data indicate a plausible

21
involvement of glucose metabolism in regulating anoikis. A detailed description of
glucose metabolism is in the following section.
Glucose Metabolism
Importance and significance
Glucose metabolism is one of the major fuels for energy production. Glucose is
transported across the plasma membrane via glucose receptors (Glut). The first rate-
determing step in glucose metabolism is conversion of glucose to glucose-6-phosphate
(G6P), which is carried out by Hexokinase (HK) enzyme. G6P enters the glycolytic
pathway to generate Nicotinamide adenine dinucleotide (NADH), Adenosine
triphosphate (ATP), and pyruvate and/or the pentose phosphate pathway (PPP) to
generate Nicotinamide adenine dinucleotide phosphate (NADPH) and pentose sugars
for nucleotide biosynthesis. In the presence of oxygen, pyruvate will enter mitochondria
and be processed in the Krebs cycle or tricarboxylic acid (TCA) cycle to produce energy
in the form of ATP required to drive various cellular processes. However, in the absence
of oxygen (anaerobic condition), pyruvate is converted into lactate.
Lactate dehydrogenase (LDH)
LDH is an enzyme that catalyzes the interconversion of pyruvate to lactate under
low oxygen conditions. LDH has five isoenzymes produced from two polypeptide chains
M and H in different combinations30. The two genes LDHA and LDHB encode the
polypeptide chains M and H respectively. The five isoenzymes are; LDH1-B4, LDH2-
B3A1, LDH3-B2A2, LDH4-BA3, LDH5-A431. Of all the isoforms, LDH5 is considered to
be efficient in catalyzing pyruvate to lactate conversion. LDH1 is efficient in pyruvate
formation, which is fed into the Krebs cycle32.
22
Pyruvate dehydrogenase complex (PDC)
Function and Importance: PDC is a multienzyme complex present in
mitochondria. PDC carries out the irreversible conversion of pyruvate to acetyl CoA and
releases CO2 and NADH. Thus, PDC activates the Krebs cycle and produces
adenosine trinucleotide phosphate (ATP) via electron transport chain (ETC). When
carbohydrate content is high in the body, PDC exists in an active dephosphorylated
form to oxidize glucose and produce energy33. Under low carbohydrate content, PDC
exists in an inactive phosphorylated form to limit the glucose consumption by non-
neuronal tissue33. The key players to regulate phosphorylated and dephosporylated
PDC forms in a tissues-specific manner are pyruvate dehyrogenase kinase (PDK)34 and
pyruvate dehydrogenase phosphatase (PDP)35, respectively.
Structure and mechanism of PDC: The enzymatic reactions of PDC are
catalyzed by E1-pyruvate dehydrogenase, E2-dihydrolipoyl transacetylase, and E3-
dihydrolipoamide dehydrogenase (E3) components in a sequential manner (Figure 1-
2)36. The core structure of PDC consists of a multidomain E2 and E3-binding protein
(E3BP). The two N terminal lipoyl domains of E2 and one lipoyl domain of E3BP are
designated as L1, L2, and L3, respectively37. The complex consists of 60 subunits of
E2, which carries out the transacetylation reaction. E2 and E3BP provide E1-binding
and E3-binding domain via a 20-30 amino acid linker region38. There are five sequential
steps involved in the conversion of pyruvate to acetyl CoA by the PDC enzyme
complex37;
E1 catalyzes decarboxylation of pyruvate in the presence of the cofactor thiamine
diphosphate.
23
E1 catalyzes reductive acetylation of lipoyl-lysine prosthetic groups present on the
lipoyl domains of E2 and E3BP. It is considered to be the rate-limiting step.
E2 catalyzes the transfer of the acetyl group from dihydrolipoyl prosthetic groups
to CoA (Cofactor).
E3 accepts the reducing equivalents and regenerates lipoyl prosthetic groups and
meanwhile, reduces the thiol-FAD system.
E3 further transfers the reducing equivalents from FAD to NAD+, thus producing
NADH+H+.
Regulation of PDC enzyme complex
As mentioned above, the PDC complex is highly regulated by PDK and PDP
enzymes to maintain the glucose metabolic homeostasis within the tissues depending
on carbohydrate availability (Figure 1-3)34. Below they are discussed in detail;
(i) Pyruvate dehydrogenase kinase (PDK): PDK is a serine kinase family
enzyme, which regulates glucose metabolism by its inhibitory effects on PDC enzyme.
PDK inactivates PDC enzyme by phosphorylating the E1α subunit. It exists as four
different isoenzymes designated as PDK1, PDK2, PDK3, and PDK435. The expression
pattern for four isoenzymes is tissue-specific, which helps in regulating PDC activity
depending on their metabolic requirements39. Of all, PDK2 is widely distributed with high
expression in liver, heart and kidney. PDK4 is expressed in liver, heart, kidney, and
oxidative skeletal muscle whereas expression of PDK1 is limited to heart, and PDK3 is
abundantly expressed in testis39.
PDK is a dimer consisting of a C-terminal catalytic domain (cat) and a regulatory N
terminal (R domain)38. The ATP/ADP binding site is located on the cat domain and
binding of regulatory ligands occurs at the R domain. PDK binds to the PDC complex

24
via the lipoyl domain of E2 and thus obtains access to the E1 substrate38. The binding
affinity of the four isoforms for the lipoyl domain of E2 subunit is different, which in turn
regulates their enzymatic activity. Greatest binding affinity is observed for PDK3
followed by PDK1=PDK2 and PDK4, respectively36. PDC complex is phosphorylated at
E1α subunit by PDK enzyme. PDK enzyme phosphorylates E1α subunit at three
different serine residues; ser-293 (phosphorylation site 1), ser-300 (phosphorylation site
2) and, ser-232 (phosphorylaiton site 3)40. The activity of PDK is enhanced by PDH
products i.e., acetyl CoA and NADH+H+. On the other hand, ADP and increased
pyruvate levels inhibit PDK activity to reactivate PDC39. Of all four isoenzymes, PDK2 is
very sensitive to its regulatory effectors like NADH and acetyl CoA (positive regulators)
and, ADP and pyruvate (negative regulators). On the other hand, PDK3 is insensitive to
the inhibitory effects of pyruvate and ADP when compared with PDK1, 2, and 436,39.
PDK141,42 and PDK343,44 genes are activated by hypoxia inducible transcription
factor (HIF1α) under hypoxic condition to reduce mitochondrial respiration and promote
tumor growth. PDK2 and PDK4 genes are elevated during starvation45 and diabetes46 in
various tissues to reduce the oxidation of pyruvate to acetyl CoA . The different
activators of PDK2 and PDK4 are: peroxisome proliferator-activated receptor γ
coactivator-1 alpha (PGC-1α)47, estrogen-related receptors (ERRalpha and
ERRgamma)48, peroxisome proliferator-activated receptor- (PPAR)42,49 , thyroid
hormone (T(3))50, and CCAAT/enhancer-binding protein β (C/EBPβ)51.
Inhibition of PDK to activate PDC is an important therapeutic strategy in the
treatment of diabetes52, heart ischemia, and in cancer53. PDK4 activity is inhibited in
diabetic obese zuker mice by AZ7545 inhibitor52. AZ7545 binds to lipoyl domain of E2
25
component and prevents binding of PDK. Dichloroacetate (DCA) is another inhibitor of
PDK, which is widely used to treat lactic acidosis in children deficient of PDC54, and in
cancer cells where activation of PDC leads to tumor regression53. DCA prevents PDK
activity by binding to L2 binding pocket at N-terminal region of PDK55.
(ii) Pyruvate dehyrogenase phosphatase (PDP): PDP belongs to 2c class of
protein phosphatases. It activates PDH enzyme by dephosphorylating the E1α subunit.
PDP has two isoforms, PDP1 and PDP2 consisting of ~56kda catalytic subunit (PDPc)
and a large ~95.6kDa regulatory subunit (PDPr)35. Both isoforms require Mg+2 for their
activation and their activity is highly regulated by this metal. Insulin upregulates PDP
activity and activates the PDC complex to metabolize the high glucose content present
within the tissue37.
Reactive oxygen species (ROS)
Reactive oxygen species (ROS) are the free radicals derived from the molecular
oxygen. They are highly unstable, reactive and cause damage to the DNA, protein, and
lipids. The major source of ROS production is the mitochondrial electron transport chain
(ETC)56. The TCA cycle not only oxidizes acetyl CoA to CO2 but also produces reducing
equivalents such as NADH+ and flavin adenine dinucleotide (FADH2). These reducing
equivalents’ are the source for electrons, which reduce the oxygen molecule to generate
water molecule via ETC. During this process, some electrons are leaked out of the
respiratory complexes and react with oxygen molecule to form reactive oxygen
species57. The first ROS species produced is the highly unstable superoxide anion
(O2−), which is readily dismutated by superoxide dismutases to generate hydroperoxyl
(HO2). The two molecules of HO2
with each other react to form hydrogen peroxide
(H2O2) and water (H2O). Unlike superoxide anion, H2O2 is not a strong oxidant. In the

26
presence of transition metal ions such as Fe2+, H2O2 is converted into a powerful
oxidizing agent that damages the DNA and leads to lipid oxidation58. Another initial ROS
species generated is nitric oxide (NO). The sources of NO are vascular endothelium,
nerve terminals and mitochondrial NO synthase (NOS)59. The interaction between NO
and O2− produces ONOO−, which is quickly converted into a very cytotoxic
peroxynitrous acid (ONOOH) radical.
Lower levels of ROS helps in cellular proliferation and gene transcription by
activating signaling pathways60. Higher levels of ROS damage the cellular DNA, lipid or
proteins. Therefore, maintaining redox balance within the cell is crucial for cell survival
and maintenance. Increased ROS levels are eliminated by upregulation of ROS
scavengers such as superoxide dismutase (SOD1, 2, and 3), glutathione peroxidase,
peroxiredoxins, glutaredoxin, thioredoxin and catalase. A more detailed description
about endogenous antioxidants is provided in Chapter five.
Apart from mitochondria, ROS are generated during detoxification of cytochrome
P45061 and b5 families of enxymes62, peroxisomes63, and plasma membrane bound
oxidases such as phagocytic NADPH oxidase64 etc.
The role of reactive oxygen species in regulating anoikis is controversial. Several
reports suggest that the impact of ROS on anoikis is both positive65 and negative66.
Although, the growing body of evidence indicates accumulation of ROS upon
detachment from ECM leads to cell death in endothelial cells67, mammary epithelial
cells68, keratinocytes69 etc.
Glucose metabolism is one of the major fuels to produce ATP and in the process
generates ROS in normal cells. However, cancer cells have altered glucose

27
metabolism, which helps them survive and proliferate in varying microenvironments. A
detailed description is in the following section.
Tumor Metabolism
Warburg effect and its significance
Aberrant energy metabolism is one of the hallmarks of cancer cells70. Tumor cells
have an altered glucose metabolism when compared with normal cells. Unlike normal
cells, tumor cells utilize glycolysis (conversion of pyruvate to lactate) for their energy
production even in the presence of oxygen termed as “aerobic glycolysis”71. Otto
Warburg first observed this phenomenon in 1920 and it is therefore known as the
“Warburg effect”. It is now well accepted that enhanced glycolysis facilitates cell
proliferation72, which requires not only ATP but also synthesis of nucleotides, lipids, and
proteins.
Advantages of Warburg effect
Mitochondrial respiration yields higher energy (38 ATP) when compared with
glycolysis (2ATP). Despite this advantage, most tumor cells favor glycolysis over
mitochondrial respiration. Initially, Otto Warburg assumed that cancer cells favor aerobic
glycolysis due to damaged mitochondria71. However, subsequent reports disproved this
assumption by showing functional and intact mitochondria in different tumor cells72-74,
making it difficult to understand the significance of less energy efficient aerobic
glycolysis over mitochondrial respiration in cancer cells.
In general, cancer cells consume much more glucose through increased glucose
uptake and glycolysis. There are several theories to explain the advantages of the
Warburg effect or the altered glucose metabolism in cancer cells. The first and the most
popular theory attributed to hypoxic environment in tumors. Hypoxia stabilizes and

28
induces the hypoxia inducible transcription factor 1 alpha (HIF1α), which upregulates
several glycolytic genes such as Glut1 receptors, Hexokinase II, LDHA75, PDK141,42,
and PDK343 etc., So, mitochondrial respiration may be very efficient in producing 18
times the ATP per mole of glucose but the rate of anaerobic glycolysis is 100 times
higher in tumor cells76. In addition, increased glycolysis within the tumor cells result in
increased release of H+ ions into the surrounding environment leading to acidosis75. The
acidified environment of tumor cells increases the expression of H+ transporters and
Na+2-H+ exchangers to attenuate the surrounding cellular toxicity.
The second theory to explain the selective advantage of Warburg effect in tumor
cells is due to the stimulation of pentose phosphate pathway (PPP). The PPP pathway
has both oxidative and non-oxidative branches. The oxidative branch utilizes glucose to
yield ribose, which is used for the production of building blocks such as RNA and DNA.
It has been shown that tumor cells upregulate transketolase, an important enzyme of
PPP pathway, for their proliferation77. The oxidative branch also generates NADPH.
NADPH is an important cofactor of glutathione reductase, which is an endogenous
antioxidant. Thus, the production of NADPH induces antioxidant defense mechanism
within the cells to prevent oxidative damage78. Moreover, the highly proliferating cancer
cells require increasing amounts of biomass (amino acids, lipids and DNA) for their
growth and survival. To meet these demands, the intermediate metabolites produced
during glycolysis may be shunted as anabolic precursors for the synthesis of amino
acids and nucleosides72.
The third theory to explain the preferential use of aerobic glycolysis in tumor cells
is to escape ROS from mitochondria. Since mitochondria are the major source of ROS

29
production, the actively dividing tumor cells may evade mitochondrial respiration to
prevent excessive release of ROS. There have been some reports that support this
theory: (1) forced expression of PDK1 in HIF1α mutant cells increased ATP levels,
reduced ROS production, rescued the cells from apoptotic induction42, and reduced the
tumor size in mice xenograft models79, (2) pharmacological inhibition of PDK2 with DCA
induced apoptosis in Hela cells by decreasing mitochondrial membrane potential, and
increasing H2O2 production and Kv channels53, and (3) Depletion of LDHA has reduced
tumor growth and maintenance due to increased ROS levels73.
Therefore, the Warburg effect in cancer cells not only provides macromolecular
biosynthetic elements required for its growth and survival, but also maintains cellular
redox homeostasis. However, it is unclear how glucose metabolism regulates tumor
cells during metastasis.
Oncogenes inducing the Warburg effect
While the Warburg effect is favored by most of the cancer cells, it is still unclear
whether it is the cause or the effect of malignant phenotype. Cancer is a genetic
disease resulting from mutations in cellular pathways that trigger abnormal cell growth
and proliferation. Several oncogenes and tumor suppressors are closely connected to
metabolic pathways and any alteration in their activity can promote aerobic glycolysis80.
The activated Ras or Src oncogenes have been shown to increase glucose uptake
and activate a number of glycolytic enzymes81. Another oncogenic transcription factor
Myc has been shown to directly upregulate LDHA at RNA level82 and several other
glycolytic genes as well83. Further, Myc induces phosphofructose kinase isoform M2
(PKM2), which converts phosphoenolpyruvate to pyruvate84. Thus, establishing the
critical role of Myc in inducing aerobic glycolysis similar to HIF 1. The oncogene AKT,

30
which is activated by PI3K signaling, enhances aerobic glycolysis by activating
hexokinase 2, phosphofructokinase 1 (PFK 1), and several other glycolytic genes85.
Apart from oncogenes, the loss of tumor suppressor gene functions such as
PTEN86, and p5387 favor aerobic glycolysis in some tumor cells.
Mutations in mitochondrial enzymes that favor the Warburg effect
The mutations in mitochondrial metabolic enzymes have reinforced the role of
metabolism in tumorigenesis. The three key enzymes of TCA cycle with mutations are:
Fumarate hydratase (FH), succinate dehydrogenase (SDH), and isocitrate
dehydrogenase 2 (IDH2). The mutations in FH and SDH lead to accumulation of
fumarate and succinate intermediates, which inhibits prolyl hydroxylases that are
responsible for the degradation of HIF 1α 88. As a result, even in the presence of normal
oxygen levels, these mutations stabilize HIF 1α transcription factor and enhances
aerobic glycolysis to trigger tumorigenesis in some tumors89. IDH2 mutations have been
found in low-grade gliomas90,91. Similar to FH and SDH mutations, IDH2 mutation
stabilizes HIF 1α gene.
The altered glucose metabolism and its role in tumor growth and survival have
been well studied. Another important feature of cancer cells is to metastasize and
invade distant organs. Resistance to anoikis is a critical step for the tumor cells to
undergo metastasis. Therefore, it is very important to explore the key regulators that
promote anoikis resistance. Since the Warburg effect has been implicated in solid tumor
growth, it is quite intriguing to understand its role in anoikis resistance and tumor
metastasis in vivo. To elucidate the functional role of glucose metabolism in anoikis
resistance and tumor metastasis, we have chosen human breast cancer as our model
system.

31
Human Breast Cancer
Breast cancer is the cancer that begins in different areas of breast; the ducts, and
the lobules. It is the second-most common cancer in the United States for women and
its incidence rate is 122.8 per 100,000 women each year92. Recent advances of early
detection and diagnosis of breast cancer has reduced the risk of death. But, if tumor
metastasizes to distant organs, the mortality rate is still high. Breast cancer can invade
different organs such as lung, liver, brain and bones via the lymphatic system. Breast
cancer is highly heterogeneous in nature.
Types of Breast cancer
The different types of breast cancers include non-invasive, invasive, recurrent and
metastatic types. These classifications are based on their invasiveness, point of origin,
and hormone receptor status.
Ductal Carcinoma in situ (DCIS) - It is non-invasive type of breast cancer
occurring inside the milk ducts and has not spread beyond its point of origin. This
cancer has the best prognosis because they express hormone-receptor positive cells
(ACS). It is not life threatening but the recurrence rate is under 30%
Invasive Ductal Carcinoma (IDC) - It is sometimes referred to as infiltrating
ductal carcinoma and is the most common type of breast cancer. It is invasive type of
ductal carcinoma, which invades the fatty tissues of breast and the lymph nodes (ACS).
It can affect women of any age but most common in older women (ACS). About 80% of
all invasive breast cancers are IDS.
Lobular Carcinoma In Situ (LCIS) - It is the non-invasive type of breast cancer
occurring in the milk-producing lobules. Like DCIS, they are responsive to hormone
therapy as they contain hormone receptor cells.

32
Invasive Lobular Carcinoma (ILC) - it is the second most common type of breast
cancer after IDS. About 10% of all invasive breast cancers are ILC. The cancer begins
in the milk-producing lobules of the breast. Over the time, ILC can spread to lymph
nodes and the other areas of the body.
In our entire study, we use untransformed immortalized mammary epithelial cell
lines MCF10A, primary immortalized human mammary epithelial cell lines (HMEC),
Ras-transformed mammary epithelial cell line (10ACA1.1), and triple negative (Estrogen
receptor-negative (ER-), progesterone receptor-negative (PR-), and human epidermal
growth factor receptor 2 (HER2-) negative), breast cancer cell line (MBDA-MB-231) to
study the role of glucose metabolism in promoting anoikis resistance and tumor
metastasis. MCF10A cells are derived from fibrotic tissue and they are ER negative,
EGF receptor-negative, HER2 negative but E-Cadherin positive. They are immortalized
but do not form tumors in vivo. HMEC cells are derived from normal human reduction
mammoplasty tissue, immortalized and ER positive cells. They do not form tumors in
vivo. Therefore, these two cell lines are used as control or normal cells. MDA-MB-231 is
a triple negative and derived from an adenocarcinoma tissue. It is a highly aggressive
and metastatic tumor cell line.
The goal of our study is to elucidate the role of glucose metabolism in regulating
anoikis in both normal and metastatic breast cell lines. We discovered that upon
detachment from matrix, the normal mammary epithelial cells and metastatic breast
cancer cells upregulate PDK to reduce mitochondrial oxidation to evade ROS and resist
anoikis. Further, we demonstrated that either forced activation of PDH or depletion of
PDK4 sensitized these cells to anoikis in suspension culture condition. We further

33
demonstrated that metastatic breast tumor cells take advantage of the Warburg effect
upon detachment from matrix to resist anoikis and metastasize to distant organs. Our
study implicates PDKs as potential therapeutic targets for the breast tumor metastasis.
34
Figure 1-1. Mechanisms regulating anoikis and anoikis resistance. Upon matrix detachment, the intrinsic and extrinsic apoptotic signaling pathways are activated causing cell death/anoikis. Cancer cells activate FLIP or XIAP to inhibit these pathways and resist anoikis. See text for detail description. FLIP= FLICE (FADD-like IL-1β-converting enzyme)-inhibitory protein, XIAP= X-linked inhibitor of apoptosis protein, FADD= Fas-associated via death domain, Bcl2= B-cell lymphoma 2, Bmf= Bcl2-modifying factor, APAF-1= Apoptotic protease activating factor 1.

35
Figure 1-2. Pyruvate dehydrogenase complex (PDH) and its reaction. Schematic
representation of PDH structure showing its subunits E1, E2, and E3. The chemical equation of the reaction carried out by PDH enzyme is represented below. For more detailed description of this complex, see the text. E1-pyruvate dehydrogenase, E2-dihydrolipoyl transacetylase, and E3-dihydrolipoamide dehydrogenase.

36
Figure 1-3. Regulation of PDH complex. The diagram represents the negative and
positive regulators of PDH complex. A detailed description is provided in the text. PDH= Pyurvate dehydrogenase complex, PDK= Pyruvate dehydrogenase kinase, PDP= Pyruvate dehydrogenase phosphatase.
37
CHAPTER 2 MATERIALS AND METHODS
Cell Culture
The immortalized human breast epithelial cell line MCF10A and primary human
mammary epithelial cells HMEC were purchased from ATCC. The Ras-transformed
MCF10CA1.1 cells were obtained from Barbara Ann Karmanos Cancer Institute. All
these three cell lines were cultured in Dulbecco’ Modified Eagle Medium/Ham’s F12
50/50 mix (DMEM/F12) medium (Cellgro, #10-090-CV) supplemented with 5% horse
serum (GIBCO #16050122), 20 ng/mL epidermal growth factor (EGF, Sigma #E-9644),
10 μg/mL insulin (Sigma #I-1882), 0.5 μg/mL hydrocortisone (Sigma #H-0135), 100
μg/mL streptomycin and 100 units/mL penicillin (Cell gro #30-002-CI).
The transformed Human embryonic kidney (HEK) 293 cells Pheonix A and
HEK293-FT cells were purchased from ATCC. The metastatic breast cancer cell line
MDA-MB-231 was a kind gift from Dr. Kevin Brown (University of Florida). All these cell
lines were cultured in Dulbecco’ Modified Eagle Medium (DMEM) (#40-101-CV)
supplemented with 10% bovine calf serum (BCS, HyClone #SH30072.03), 100 μg/mL
streptomycin and 100 units/mL penicillin.
All assays in MCF10A and HMEC were performed 24 hours after incubation and in
MCF10ACA1.1 and MDA-MB-231 were performed 48 hours after incubation under
attached and suspended conditions unless otherwise noted.
Reagents
Poly(2-hydroxyethyl methacrylate) (Poly-Hema) was obtained from Sigma,Cat
#P3932. The pharmacological ROS scavengers or antioxidants the reduced form of L-
38
glutathione (GSH) (Cat no #G4251) and α-Lipoic acid (Cat no #T5625) were purchased
from Sigma-Aldrich.
Plasmids
Full length human cDNAs of PDH E1α (Cat no. #MHS1011-58712), PDK1 (Cat no.
#MHS1010-7429799), 2 (Cat no. #MHS1011-61425), 3 (Cat no. #MHS1010-73978),
and 4 (Cat no. #MHS1010-7429396) were obtained from OpenBiosystems.
Poly-Hema Coated Plates for Suspension Culture Cells
The adherent cells were cultured under suspension culture conditions by coating
the plates with poly-hema chemical solution following manufacturer’s protocol. 10
mg/mL of Poly-Hema (10x Stock) was made by dissolving in 95% ethanol and rotating
overnight at 65°C incubator for complete solubility. The plates were coated with 1:10
dilution of 10X stock (final conc of 12 mg/mL) dissolved in 95% ethanol and air-dried.
For 35 mm plates, 0.5 mL of 12 mg/mL poly-hema respectively was used to completely
coat the plates. Once the plates were completely dry, the cells were added and grown
with specific culture media for a specific time period depending on the assay performed.
RNA Isolation, and Northern blotting
RNA was extracted from both attached and suspended MCF10A cells following
Invitrogen’s protocol. The MCF10A cells were grown under normal adherent and poly-
hema coated suspended culture conditions in 35 mm plates for 24 hours incubation. For
the adherent cells, the media was aspirated and 1 mL Trizol reagent (Invitrogen,
#15596-026) was added to homogenize the cells. The suspended cells were collected
by centrifugation at 900 rpm for 3 minutes, followed by homogenization of cells with 1
mL Trizol reagent. To separate RNA from DNA and protein contents, 0.1 mL of
chloroform was added to each homogenized samples. Followed by, centrifugation at

39
12,000 x g for 15 minutes at 4°C to separate aqueous and phenol-chloroform phases.
Approximately 500 μL of aqueous solution was extracted from each sample to a new
tube. The RNA was precipitated with 75% isopropanol (v/v) and centrifuged at 12,000 g
for 10 minutes at 4°C. Later, the RNA pellets were washed with 1 mL of 75% ethanol.
After washing, the RNA pellets were air-dried for 5 minutes before dissolving in sterile-
filtered TE (10mM Tris pH 8.0, 1mM EDTA) and stored at -80°C until used. The
concentration of extracted RNA was measured at 260/280 nm wavelength using UV
spectrophotometer.
Approximately 10 μg of RNA from attached and suspension samples were loaded
onto 0.8% agarose gel to separate the RNA using gel electrophoresis. After separation,
the RNA from the agarose gel was transferred to nylon membrane in 10X SSC buffer
(made from 20X SSC: 3 M NaCl, 0.3 M Na3Citrate.H2O, adjust the pH to 7.0 with 1N
HCl) overnight at room temperature. After transfer, the membrane was hybridized with a
specific probe radioactively labeled with 32P in a hybridization buffer (Millipore, #S4031)
at 42°C overnight in a rotating incubator. The probes were ~2.3 kb, ~1.5 kb, ~0.8 kb,
and ~0.4 kb targeted to PDK1, PDK2, PDK3, and PDK4 respectively. They were
generated by excising a part of cDNA from each gene with a suitable restriction enzyme
digestion. After 24 hours of incubation with radiolabeled probe, the membrane was
washed with 100 mL of 0.2X SSC with 0.1% SDS at 55°C for 5 -15 minutes until the
background noise was reduced. Later, the membrane was dried, wrapped in a saran
wrap to perform autoradiography.
Reverse Transcription, and Real-Time PCR
RNA was extracted from the target cells following the same procedure as described
above. Approximately 1 μg of total RNA from attached and suspended cells was added
40
to a reaction mixture containing DEPC-treated ddH2O, 2.5 μM dNTP, and 5 nM random
primers to a total volume of entire mixture was incubated at 70°C for 5
minutes, and quenched quickly on ice. Later, 2 μL of 10X M-MuLV RT buffer (NEB), 1
μL RNase inhibitor (Promega), and 1 μL M-MuLV Reverse Transcriptase (NEB) were
added to the reaction to make up a final volume of 20 μL. Then, the samples were
incubated at 42°C for 1 hour. Followed by heat-inactivation at 65°C for 20 minutes,
dilution of the sample with ddH2O to 200 μL.
Each real-time PCR reaction mixture consisted of; 1 μL of cDNA generated from
reverse transcription, 1 μL of 5 μM primer mix working solution, 8 μL ddH2O, and 10 μL
of 2X SYBR Green PCR Master Mix (Applied Biosystems). The primers used for four
PDKs were from the published report 93. All the samples were run in triplicates for each
reaction and results were expressed after normalization with endogenous beta-actin
expression as relative quantities. Reactions with no template were also included on
real-time PCR plate for each set of primers as negative control. More than two-fold
difference in gene expression was considered as significant. The thermal cycling
parameters were: 95°C for 10 minutes, 40 cycles of 95°C for 15 seconds for denaturing
step and 60°C for 60 seconds for product extension. At the end of each run, melting
curve analysis was performed. StepOne (48-well), or StepOnePlus (96-well) real-time
PCR machines (Applied Biosystems) were used for data collection. Primers used were
listed in Table 2-1.
Short-hairpin RNA (shRNA) Vector Construction
Oligos for shRNA construction were designed using shRNA psm2 designer at
RNAi Central (http://cancan.cshl.edu/RNAi_central/RNAi.cgi?type=shRNA). The
accession numbers for human PDK1, PDK4, MnSOD, and ERRγ were entered to
41
design specific shRNAs. The target sequences for all the genes were listed in Table 2-
2. To generate a high-fidelity oligo, it was broken into two fragments when ordering from
Invitrogen (Table 2-2). The breaks in the two fragments were designed with overlapping,
complimentary loop regions so they anneal and extend during PCR into the full-length
oligo. The desiccated oligos were dissolved in TE buffer and combined to a final
working solution of 1 μM. 5 μM mir30 PCR primers were used for amplification using
Phusion High-Fidelity DNA Polymerase (Finnzymes). Mir30 primer sequences were as
follows: Forward 5'-AAGCCCTTTGTACACCCTAAGCCT-3' and reverse 5'-
ACCTGGTGAAACTCACCCAGGGATT-3'.
The PCR was performed by mixing 1 μL of 1 μM mixed oligos, 1 μL of 5 μM mir30
PCR primers, 1 μL of Phusion polymerase, 2 μL of 10 mM dNTP mix, and distilled water
to a final volume of 20 μL. The reaction was first denatured at 98˚C for 30 seconds,
followed by 35 cycles of 1) denaturation at 98˚C for 10 seconds, 2) annealing at 60˚C
for 30 seconds, and 3) extension at 72˚C for 30 seconds. The reaction included a final
round of extension at 72˚C for 5 minutes. After PCR, the fragment was gel purified using
QIAquick Gel Extraction Kit (Qiagen). The purified fragment was digested with XhoI and
EcoRI restriction enzymes for at least 2 hours at 37˚C. The retrovirus vector pLMP was
also digested in parallel. The pLMP vector sequence and information can be found in
Figure 2-1 (Openbiosystems). The enzymes were heat inactivated at 65˚C for 30
minutes. The digested fragment and vector were mixed at a 7:1 ratio, respectively and
ligated with 1 μL of T4 DNA ligase and 1X ligase buffer (NEB) in 10 μL final volume for 1
hour - overnight. The ligated DNA was transformed into DH5α competent E. Coli cells
by heat-shock at 37˚C for 45 seconds. The cells were allowed to recover in LB,

42
incubated at 37˚C for 30 minutes with agitation. The cells were plated onto 50 μg per
mL ampicillin LB agar plates and incubated overnight at 37˚C for selection of positive
clones. Clones were manually picked and amplified in 5 mL LB culture with 50 μg per
mL ampicillin selection overnight at 37˚C with agitation.
Plasmid DNA MiniPrep
1 mL of the overnight culture was transferred to a microcentrifuge tube. The
bacterial cells were centrifuged at 8000 rpm for 1 minute. The cell pellets were
resuspended with 200 μL P1 Buffer (50 mM Tris-Cl pH 8.0, 10 mM EDTA) each. The
cells were then lysed by adding 200 μL P2 Lysis Buffer (200mM NaOH, 1% SDS w/v) to
each tube and mixed by inversion. Next, 200 μL P3 Neutralization Buffer (3 M
potassium acetate) were added to each tube and mixed by inversion. The samples were
centrifuged at 14000 rpm for 5 minutes to pellet precipitated proteins. 0.5 mL of the
supernatant was transferred to a new tube and reserved. The protein pellet was
discarded. 1 mL of 100% ethanol was added to the reserved supernatant and mixed to
precipitate DNA. The precipitated DNA was pelleted by centrifugation at 14000 rpm for
10 minutes. The supernatant was discarded. The DNA pellets were washed once in 1
mL 70% ethanol and the supernatants were removed. The DNA pellets were air dried
for 5 to10 minutes. The DNA was dissolved in 30 to 50 μL TE (1 M Tris-Cl, 0.5 M EDTA
pH 8) containing 20 μg/mL RNase A.
Retroviral Short Hairpin RNA Production and Transduction of Target Cells
Purified DNA was sequenced to confirm shRNA oligo insertion prior to retrovirus
production. To generate retroviral particles, 1.5 μg of shRNA vector (Figure 2-1)
containing the specific knockdown sequence was transiently transfected into

43
transformed HEK293 cells called Phoenix. The Phoenix cells were co-transfected with
retroviral helper plasmids; 1 μg each of Gag-Pol and Env to facilitate packaging of
shRNA into retroviral particles and increase their production. Cells were seeded at
~60% confluency 24 hours prior to transfection. They were transfected using Turbofect
Transfection Reagent (Fermentos, #R0531) by 2 μL of the transfection reagent in 200
μL PBS. The two diluted reagents were incubated at room temperature for 20 minutes
to form a cationic lipid-mediated transfection complex. The complex was added directly
to cells dropwise. The cells were then incubated from 12 hours to overnight before
switching to fresh media. The cells were incubated for an additional 48 hours. The virus-
containing media was collected and passed through a 45 μm filter to exclude cell debris.
The viral media was aliquoted and used immediately to infect target cells. Excess
aliquots were stored at -80˚C, or disposed after bleaching.
Target cells were trypsinized and plated 24 hours prior to retroviral infection.
Adherent cells were infected by replacing culture media with the infection cocktail, which
46 consisted of 1:1 viral media: culture media and 4 μg/mL polybrene. The cells were
incubated for 24 hours, and then the infection cocktail was replaced with fresh media.
The cells were incubated for an additional 24 hours.
After the 24 hours of recovery in fresh media, the cells were treated with 2 μg/mL
puromycin dihydrochloride (Cellgro) to begin selection of transformed cell. Uninfected
target cells were treated in parallel to estimate selection completion, which is typically
complete 48 hours after addition of puromycin. The selection media was replaced with
fresh culture media after selection and transformed cells were allowed to expand to
desired density. The cells were then trypsinized and dissociated into a uniform

44
suspension and aliquoted. The transformed cell stocks were stored in freezing media
(bovine serum albumin containing 10% v/v DMSO) at -80˚C, maintained as polyclonal
culture, or further selected for monoclonal culture.
Protein Isolation and Immunoblotting
Cells grown under attached and suspended culture conditions were first washed in
cold PBS for two times. Then, the cells were lysed with 50-200 μL of lysis buffer (50 mM
Tris pH7.5, 1 mM EDTA, 1% (v/v) SDS, 1% 2-β mercaptoethanol, 20 mM dithiothreitol).
The samples were boiled for 10 minutes to completely lyse the cells. Later, 6X sample
lading buffer (4X Tris-SDS pH 6.8, 30% glycerol. 10% SDS, 0.6M dithiothreitol, 0.012%
bromophenol blue) was added to all the samples. The samples were either stored at -
20°C until use or loaed onto the SDS-PAGE gel for analysis.
The samples were resolved by first adding the appropriate amount of 6X sample
buffer and boiled for 5 minutes. The samples were loaded onto 10% Tris-HCl
polyacrylamide separating gels /4% stacking gel at 1mm thickness for electroporation in
1X running buffer (25 mM Tris, 190 mM glycine, 0.2% SDS). The gel was then
electrotransferred onto polyvinylidene fluoride (PVDF) membrane using Trans-Blot
Semi-Dry Electrophoretic Transfer Cell (BioRad) in 1X transfer buffer (20 mM Tris, 192
mM glycine, 10% methanol). Membranes were stained with Fast Green (0.1% Fast
Green FCF, 50% methanol, 10% acetic acid) for 5 minutes at room temperature to
ensure transfer and equal loading. Stained membranes were washed 2-3 times in TBST
(30 mM Tris pH 7.5, 200 mM NaCl, 0.1% (v/v) Tween-20), and incubated in 3% (w/v)
non-fat dry milk in TBST blocking solution for one hour at room temperature on a
shaker. Blocked membranes were rinsed in TBST, followed by, probing with diluted
primary antibody in TBST for one hour at room temperature, or overnight at 4˚C. The
45
membranes were then washed 3 times at room temperature in TBST for 5 minutes
each. Next, they were incubated in diluted peroxidase-conjugated secondary antibodies
in TBST for 30 minutes at room temperature. The membranes were then washed 3
times at room temperature in TBST for 5 minutes each. The membrane was probed with
Pierce ECL substrate solution (Thermo Scientific) to detect the bound antibodies.
Followed by, autoradiography to expose the membrane to X-ray film. Specific primary
antibodies, secondary antibodies and their respective dilutions listed in Table 2-3.
Site-Directed Mutagenesis
The constitutively active PDH E1α was generated by PCR using full length PDH
E1α cDNA as template. The three serine sites of PDH E1α cDNA; S232, S293, and
S300 were mutated to alanine by site-directed mutagenesis using PCR with the
following set of PCR primers: S232A: Forward- 5’TGGAATGGGAACAGCTGTTGAGAG
AGCGGCAGCC 3’ and reverse- 5’ CTCTCTCAACAGCTGTTCCCATTCCATAGCGATT
3’; S293, 300A: Forward-5’TACCACGGACACGCCATGAGTGACCCGGGAGTCGCTT
ACCGTACACGAGAAGAAATT 3’ and RP-5’CGTGTACGGTAAGCGACTCCCGGGTC
ACTCATGGCGTGTCCGTGGTAACGGTA 3’. DNA sequence coding for the mutation
sites is underlined. Also, the FLAG tag sequence is underlined. Also, 5’ NheI and 3’
FLAG-tag with XhoI restriction sites were introduced to mutated PDH E1α by PCR using
following set of primers: Forward-5’ GAGAGCTAGCCGCTGCCGCCACTGCCT3’ and
reverse-5’GGAACTCGAGTTATTTATCGTCATCGTCTTTGTAGTCACTGACTGACTTA
AACTTGATCC 3’ The restriction site (NheI and XhoI) sequences and the FLAG tag
DNA sequence are underlined and highlighted in bold and underlined respectively. The
PCR reaction was set up for a total of 25 μL reaction volume using: 1 μL (0.1ng) of full
length PDH E1α cDNA, 5 μL of 5x Phusion reaction buffer, 1 μL of 5 μM primers, 4 μL

46
of 2.5 mM dNTPs, 0.5 μL of Phusion DNA polymerase enzyme, and 13.5 μL of ddH20.
The PCR cycling conditions were: denaturing step at 98˚C for 30 seconds, followed by
35 cycles of 1) denaturing at 98˚C for 10 seconds, 2) annealing at 60˚C for 30 seconds,
and 3) extension at 72˚C for 30 seconds. Followed by, final extension step at 72˚C for 5
minutes. The amplicon was cloned into a lentiviral expression vector pCSCGW2 using
restriction enzyme digestion of NheI and XhoI.
Lentiviral Over Expression of Constitutively Active FLAG-tagged PDH E1α
To produce lentiviral particles, 1.5 μg each of the pCSCGW2 plasmid containing
constitutively active PDH E1α and pCSCGW2 alone as empty vector (EV) were
transiently transfected into the HEK293FT a transformed HEK293 cell line using 2 μL of
TurboFect as transfection reagent. Along with the above-mentioned plasmids, 1 μg
each of two lentiviral helper plasmids; MD2G (envelope plasmid) and PAX (packing
plasmid) were co-transfected to facilitate virus production and packaging. After 48 hours
post-transfection, the media carrying viral particles was collected and filtered through a
45 μm filter to eliminate cell debris. The viral media was harvested to either infect the
target cells, or stored at -80°C.
To over express constitutively active PDH E1α, MCF10A and MDA-MB-231 cells
were plated 24 hours prior to lentiviral infection in a 60 mm petriplates. After 24 hours,
the media from the cultured cells (MCF10A and MDA-MB-231) was replaced with viral
cocktail containing 1 part of viral media carrying either EV or FPDH E1α and 1 part of
culture media. 4 μg/mL of polybrene was added to the viral cocktail to increase viral
transduction efficiency. After 24 hours of incubation, the viral media was replaced with
fresh media for the recovery of the cells. After 48 hours post-infection, the cells are
transferred from 60 mm to 100 mm plates for amplication. Later, the cells were sorted

47
for GFP-positive cells using FACSORT instrument at ICBR Flow Cytometry Core facility,
University of Florida. After sorting, one million GFP positive cells were collected from
each group; EV and FPDH E1α carrying MCF10A and MDA231 cells respectively. After
recovery of GFP sorted cells, immunoblotting (IB) was performed using anti-FLAG
antibody to confirm the expression of FLAG-tagged PDH E1α expression in both
MCF10A and MDA-MB-231 cells.
Measurement of PDH Activity
PDH activity was measured using Dipstick assay kit from MitoSciences (# MSP30)
following their protocol. Cells were grown under attached and suspended culture
conditions in 35 mm plates. Then the cells were trypsinized, washed twice in cold PBS
and collected by centrifugation at 900 rpm for 3 minutes. After washing, the cells were
lysed by adding 5 volumes of 10X sample buffer and 1/10 volume of detergent provided
by the kit. The samples were incubated for 10 minutes on ice followed by centrifugation
at 3000 rpm for 10 minutes. During this step, the mitochondrial extract was isolated as
supernatant from the cell debris. The extract was immediately used for protein
concentration using BCA kit.
One mg of extract from each sample was loaded onto 96-well plate. The equal
volume of blocking solution provided by the kit was added to the wells with the sample.
The dipsticks provided by the kit were gently added to the sample mix in the microplate
well. The samples were allowed to wick up onto the dipsticks towards wicking pads
within an hour. Later, 40 μL of sample buffer was added to each microwell plate with
dipstick to wash. After 5-15 minutes, 300 μL of activity buffer (330 μL of sample buffer,
16.6 μL of 20X reaction mix, 13.3 μL of diaphorase, and 0.7 μL of NBT reagent provided
by kit per one dipstick) was added to an empty microwell for each dipstick. Now, the

48
wicking pad was removed from each dipstick and placed in a well with activity buffer.
The signal appeared 5-7mm from the bottom of the dipstick within 20 minutes. After one
hour, the signal was completely developed. So, the dipsticks were transferred to
another microwell plate containing 300 μL of deionized water to wash the stick. The
dipsticks were dried and the signal was measured by using Canon flatbed scanner. The
PDH activity was represented in arbitrary units and the experiment was repeated at
three different times.
Trypan Blue Exclusion Assay
Cells were grown under attached and suspended culture conditions in 35 mm
plates. The suspended cells were collected by centrifugation at 900 rpm for 3 minutes.
Then both the attached and suspended cells were trypsinized, washed in PBS once,
and resuspended in 1 mL PBS. To 50 μL of sample, equal volume of 0.4% Trypan blue
dye was added. 10 μL of the sample mixture was added to the hemocytometer slide and
the number of live (unstained) vs dead (stained blue) cells were counted. The
percentage of cell viability was determined by dividing total number of unstained cells to
total number of stained+unstained cells X 100. The experiment was repeated at least for
three different times in duplicates.
Caspase 3/7 Activity Assay
Caspase 3/7 assay was performed using caspase 3/7 glo assay kit (# G8090) from
Promega. Cells were grown under attached and suspended culture conditions in 35 mm
plates. The suspended cells were collected by centrifugation at 900 rpm for 3 minutes.
Then both the attached and suspended cells were trypsinized, washed in PBS twice
and resuspended in 3 volumes of hypertonic buffer (HTB). Cells were lysed in
hypertonic buffer (HTB: 10 mM HEPES, pH7.9 at 4°C, 1.5 mM MgCl2, 10 mM KCl, add

49
0.2 mM PMSF, 0.5 M DTT freshly added before use). The protein concentration of
samples was measured using the BCA kit. 75-100 g of protein samples were loaded in
each of the 96-well microplates. The volume of each sample was adjusted to 20 μL
using HTB. Equal volume of caspase 3/7 substrate provided by the kit was added to all
the samples in the wells. The samples were incubated for 30 minutes at room
temperature on a shaker. Later, caspase 3/7 activity was measured in relative
luminiscence unit (RLU) per second using luminometer following the manufacturer’s
instruction. The samples were assayed in duplicates at three independent experiments.
Annexin V/7-AAD Analysis
Cells were grown under attached and suspended culture conditions in 35 mm
plates. The suspended cells were collected by centrifugation at 900 rpm for 3 minutes.
The attached were trypsinized. Both attached and suspended cells were washed twice
with PBS, followed by, 1x10⁵ cells staining with 5 μL each of PE Annexin V
(Phycoerythrin) and 7-AAD (aminoactinomycin D) from BD Pharmingen for 15 minutes
at room temperature. Cells were analyzed within an hour using Becton Dickson’s
Facsort. Cellquest software was used to analyze the data as in [FL2H, FL3H] log scale
two-dimensional diagram. The results were from three independent samples.
Measurement of Oxygen Consumption Rate
Oxygen consumption was measured using 96-well Oxygen biosensor plates from
BD Biosciences. Cells were grown under attached and suspended culture conditions in
35 mm plates. Adherent cells were trypsinized and counted. One million cells from
attached and suspension cultures were loaded to 96-well BD biosensor plate to
measure oxygen consumption rate for two hours at 10 minutes interval. Fluorescence

50
was measured using excitation/emission (Ex/Em) 590/630. The assay was performed in
duplicates from three independent samples.
Measurement of Intracellular ROS
Intracellular ROS was measured using the Amplex red hydrogen peroxide /
peroxidase kit from Invitrogen. Cells were grown under attached and suspension
conditions in 35 mm plates. Cells were trypsinized, washed twice in PBS, followed by,
lysis using hypertonic buffer (HTB: 10 mM HEPES, pH7.9 at 4°C, 1.5 mM MgCl2, 10
mM KCl, add 0.2 mM PMSF fresh before use). Equal amount of protein was loaded in
96 well plate and ROS levels were measured by adding equal volume of amplex red
hydrogen peroxide/ peroxidase substrate as per manufacturer’s protocol. Fluorescence
measured using Ex/EM of 590/630. The assay was performed in duplicates from three
independent samples.
Measurement of Intracellular Lactate
Intracellular lactate was measured using the lactate assay kit from Biovision (#
K607-100). Cells were grown under attached and suspended culture conditions in 35
mm plates. The suspended cells were collected by centrifugation at 900 rpm for 3
minutes. Then both the attached and suspended cells were trypsinized, washed in PBS
twice and resuspended in 1 mL PBS. One million cells were added to 96-well
microplate. The volume was adjusted to 50 μL using lactate assay buffer provided by
the kit. Equal volume of reaction mix (46 μL lactate assay buffer, 2 μL probe, and 2 μL
enzyme mix provided by kit) was added to each well with sample. The samples were
incubated for 30 minutes at room temperature. Later, measured lactate levels for
fluorescence at Ex/Em of 590/630. The assay was performed in duplicates from three
independent samples.

51
Experimental Metastasis Assay in Mice
Four to five weeks old female SCID/Beige mice were purchased from Harlan.
Empty vector and PDK1 depleted MDA-MB-231 cells were cultured under adherent
conditions. After trypsinization, two million cells were resuspended in 200 μL PBS, and
injected via intravenous route in a total number of six mice for each group. Forty days
post injection; lungs were harvested from the mice after euthanasia. After harvesting,
the lungs were washed twice in 5 mL PBS. 10 mL Bouin’s solution was added to each
lung and incubated overnight on a shaker for fixation. The tumor nodules turned white
after bouin’s fixation and the number of lung tumor nodules was counted manually from
the surface of each lung. The University of Florida IACUC approved all procedures.
Tissue Sectioning and H&E Staining
Tissue sectioning, processing, and Hematoxylin and Eosin (H&E) staining were
performed by the Cell and Tissue Analysis Core (CTAC) facility at University of Florida.
Lung tissues were paraffin-embedded and sectioned at 5 μm. For H&E staining, the
sections were deparaffinized and rehydrated. For deparafinization, the following steps
were followed; the slides with lung sections were dipped for 2 minutes in xylene. This
step was repeated three additional times followed by, two times wash in absolute
ethanol for 1 minute each. Then, washed the slide twice in 95% ethanol for 30 seconds,
70% ethanol for 45 seconds and finally in water for 1 min). After deparaffinization, the
sections were stained with Hematoxylin, a basic dye that stains the nuclei. The sections
were washed with water and citric acid, known as clarifier. It removes the excess
hemotoxylin dye from the sections. Then, the slides were treated with potassium
hydroxide followed by a quick rinse in water. The sections were equilibrated in 95%
ethanol. Then, the sections were stained with Eosin for 15-30 seconds. Eosin is an acid

52
dye used most commonly to counterstain hematoxylin. After Eosin staining, the slides
were washed three times in 100% ethanol followed by xylene wash. After staining, the
sections were mounted and pictures were taken using upright light microscopy at 5X
magnification.
Statistics
Data were represented as the mean ± S.D. Student’s two-tailed t-test was used to
calculate p-values and p<0.05 regarded as statistically significant.
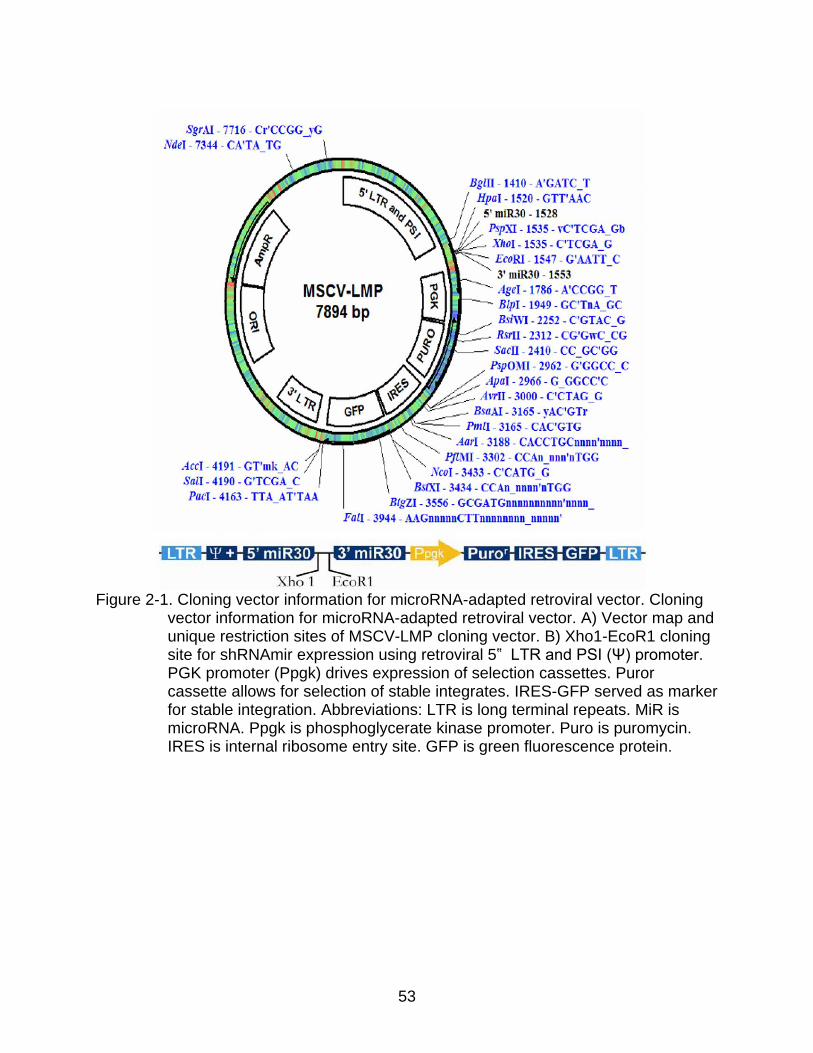
53
Figure 2-1. Cloning vector information for microRNA-adapted retroviral vector. Cloning
vector information for microRNA-adapted retroviral vector. A) Vector map and unique restriction sites of MSCV-LMP cloning vector. B) Xho1-EcoR1 cloning site for shRNAmir expression using retroviral 5‟ LTR and PSI (Ψ) promoter. PGK promoter (Ppgk) drives expression of selection cassettes. Puror cassette allows for selection of stable integrates. IRES-GFP served as marker for stable integration. Abbreviations: LTR is long terminal repeats. MiR is microRNA. Ppgk is phosphoglycerate kinase promoter. Puro is puromycin. IRES is internal ribosome entry site. GFP is green fluorescence protein.

54
Table 2-1. Primers used for real-time RT-PCR
Name Forward Reverse Tm
PDK1 CTATGAAAATGCTAGGCGTCTGT
AACCACTTGTATTGGCTGTCC 60°C
PDK2 AGGACACCTACGGCGATGA TGCCGATGTGTTTGGGATGG 60°C PDK3 GCCAAAGCGCCAGACAAAC CAACTGTCGCTCTCATTGAGT 60°C PDK4 TTATACATACTCCACTGCACCA ATAGACTCAGAAGACAAAGC
CT 60°C
MnSOD TACGTGAACAACCTGAAC TATCTGGGCTGTAACATCT 60°C ERRγ TCTTGCTAATTCAGACTCCAT GCAGTGTCATCAGCATCTTG 60°C β-Actin AGAAAATCTGGCACCACACC AGAGGCGTACAGGGATAGCA 60°C
Table 2-2. shRNA Oligos designed for retrovirus-mediated knockdown
Oligo Name Gene targeted Sequence
shPDK1 PDK1 TTCTACATGAGTCGCATTTCAA shPDK4-1 PDK4 ACCAACGCCTGTGATGGATAAT shPDK4-2 PDK4 TATTTATCATCTCCAGAATTAA shMnSOD MnSOD AAGGAACAACAGGCCTTATTCC shERRγ ERRγ CAGTGGGAGCTACAGTTCA
Table 2-3. Antibodies used for Immunoblotting (IB)
Antibody Species Isotype Company Catolog number
Dilution
FLAG N/A Mouse-IgG Sigma F-1804 1:3000 PDK1 Human Rabbit-IgG Cell Signaling 3820s 1:1000 PDK2 Human Rabbit-IgG Epitomics 2282-1 1:2000 PDK4 Human Rabbit-IgG Abgent AP7041b 1:500 MnSOD Human Rabbit-IgG Santa Cruz 30080 1:1000 LDHA Human Rabbit-IgG Cell Signaling 2012s 1:1000 ERRα Human Rabbit-IgG Gene Tex 108166s 1:2000 α-Tubulin Human Mouse-IgG Sigma T-6199 1:5000 HRP-Donkey anti-Mouse
Mouse Donkey-IgG Jackson Immunoresearch
715-035150 1:5000
HRP-Donkey anti-Rabbit
Rabbit Donkey-IgG Jackson Immunoresearch
715-035152 1:8000
55
CHAPTER 3 INFLUENCE OF GLUCOSE METABOLISM ON ANCHORAGE-INDEPENDENT
SURIVIVAL IN MAMMARY EPITHELIAL CELLS
Background
Apart from providing energy and biofuels for the maintenance of life, glucose
metabolism also regulates cell death processes such as necrosis, autophagy and
apoptosis94. Of these processes, the effect of glucose metabolism on apoptosis is very
well studied. Several groups demonstrated that glucose deprivation leads to
attenuation of anti-apoptotic genes such as myeloid cell leukemia 1 protein (MCL-1),
activation of BH3-only proteins such as Noxa and Bim95, and activation of proapoptotic
genes such as Bcl2-associated X protein (BAX)96,97. Furthermore, it has been reported
that NADPH, which is primarily generated from the pentose phosphate pathway (PPP),
protects cells from apoptosis by reducing ROS levels under various conditions98.
The impact of glucose metabolism on anoikis (detachment induced cell death) is
still being studied. Schafer et al., demonstrated when detached from ECM, the
untransformed mammary epithelial cells reduce glucose uptake leading to ATP
deficiency known as “metabolic defect”68. Furthermore, the attenuation of glucose
uptake due to matrix detachment reduces the pentose phosphate pathway (PPP),
hence, reduces antioxidant capacity, and consequently increases ROS production68.
The above study focused on antioxidant rescue from anchorage-independent cell death,
but it is not clear how the metabolic impairment is connected to anoikis/detachment-
induced cell death.
The main focus of our study is to understand how glucose metabolism influences
anchorage-independent survival in human mammary epithelial cells. Our study provides
evidence that decreased glucose oxidation promotes anchorage-independent survival

56
by attenuating ROS production. Furthermore, we show for the first time the functional
role of PDKs in cell survival. PDKs inhibit the entry of pyruvate into TCA cycle and
hence reduce glucose oxidation, promoting anoikis resistance in untransformed
mammary epithelial cells.
Results
Induction of PDK upon Detachment from ECM
Pyruvate, derived from glycolytic activity, is primarily converted to acetyl-CoA in
the mitochondria by the pyruvate dehydrogenase (PDH) complex in normal cells. In
most cancer cells, pyruvate is mostly converted into lactate by the lactate
dehydrogenase (LDH). Thus, the fate of pyruvate represents a pivotal point between
normal and tumor cell metabolism. Furthermore, glucose metabolism plays a critical role
in regulating cell viability under variety of stressful conditions98. As normal cells show
increased sensitivity to anoikis when detached from matrix, we decided to investigate
the influence of glucose metabolism on anoikis in normal mammary epithelial cells by
examining the regulation of PDH and LDH upon cell detachment from ECM.
As described in introduction, PDH is a multi-subunit enzymatic complex and its
activity is inhibited by phosphorylation on the E1α subunit by pyruvate dehydrogenase
kinases (PDKs) 1-499. We examined the expression of all four PDK isoenzymes at RNA
level by quantitative RT-PCR in two different mammary epithelial cell models; primary
human mammary epithelial cell line (HMEC) and untransformed human mammry
epithelial cell line (MCF10A) under attached and suspended conditions. PDK4 transcript
in suspended HMEC cells (Figure 3-1A), and PDK2 and PDK4 isoenzymes in
suspended MCF10A cells (Figure 3-1B) were significantly upregulated, whereas PDK1

57
and PDK3 showed only marginal changes (Figure 3-1). Thus, the results demonstrate
that upon matrix detachment PDK4 is induced in HMEC and MCF10A cells.
The rest of the study is focused on MCF10A (untransformed, immortalized
mammary epithelial cell line). To validate if PDK4 is the major PDK isoenzyme in
suspended MCF10A cells, we measured the absolute quantity of all four PDK RNAs.
PDK1 and PDK4 transcripts were found to be the most abundant PDKs in suspended
MCF10A cells, whereas PDK2 was negligible (Figure 3-2A). Consistent with RNA
expression, PDK4 isoenzyme was abundant at the protein level in suspended MCF10A
cells and not detected under adherent conditions (Figure 3-2B). Although PDK1 was
upregulated at the RNA level in suspended MCF10A cells (Figure 3-1B), no significant
change at the protein level was observed under attached and suspended conditions
(Figure 3-2B). PDK2 was not detectable at the protein level regardless of the cell matrix
contact status (Figure 3-2B).
Another important enzyme that regulates the fate of pyruvate is LDH enzyme. It
interconverts pyruvate to lactate in the cytoplasm. Therefore, we decided to examine its
role in matrix detachment. As mentioned in introduction, LDH5 is the most efficient
isoenzyme encoded by the LDHA gene. Hence, we investigated the expression of
LDHA in MCF10A under attached and suspended conditions. Western blotting showed
no significant change in protein levels of LDHA when cells lost adhesion to ECM (Figure
3-3). Thus, the results confirm the induction of PDK4 when detached from matrix but no
significant change in the LDH enzyme.
Upregulation of PDK4 Antagonizes Anoikis
To define the effect of matrix detachment-induced PDK4 on anoikis, we depleted
PDK4 in MCF10A cells using two independent retroviral short hairpin RNAs (shRNAs).
58
In parallel, we transduced MCF10A cells with retrovirus carrying empty vector (EV) to
serve as a control. The efficient knockdown of PDK4 was verified by both Northern
blotting analysis (Figure 3-4A) and quantitative RT-PCR (Figure 3-4B) in attached and
suspended MCF10A cells. Thus, the two independent shRNAs targeted against PDK4
significantly diminished 80% of PDK4 expression.
We further investigated if the depletion of PDK4 caused increased anoikis in
MCF10A cells. Normally, MCF10A cells undergo anoikis or detachment-induced cell
death upon detachment from matrix15,16. Depletion of PDK4 showed a further increase
of cell death in MCF10A suspension cells (based on Trypan blue exclusion assay)
(Figure 3-5A). Since PDK4 was not expressed in adherent MCF10A cells, knockdown of
PDK4 did not induce any significant cell death (Figure 3-5A). To validate that the
increase in cell death was due to increased apoptosis, we first measured the caspase
3/7 activity using Promega’s caspase 3/7 glo assay. When cells were attached to
matrix, no significant induction of caspase activity was observed in either EV or PDK4-
depleted MCF10A cells (Figure 3-5B). Upon detachment, PDK4-depleted MCF10A cells
displayed higher caspase activity than the suspended EV cells (Figure 3-5B). To further
validate that depletion of PDK4 enhanced apoptosis in MCF10A suspension cells, we
performed another apoptosis assay i.e., PE annexin V/7-AAD analysis. Similar to
caspase activity, no significant difference in PE annexinV/7-AAD staining was detected
between the EV and PDK4-depleted MCF10A attached cells (Figure 3-5C and 3-5D).
However, detachment from matrix showed an increased PE annexinV/7-AAD staining in
both cell groups (Figure 3-5C). Compared to EV cells, PDK4-depleted cells exhibited
elevated early stage (29% vs. 14%) and late stage (11% vs. 5%) apoptosis when
59
detached from matrix (Figure 3-5D). Thus, the results suggest that upon detachment
from matrix, mammary epithelial cells upregulate PDK4 to resist anoikis and prolong
their survival in suspension.
Activation of PDH Sensitizes Cells to Anoikis
PDKs phosphorylate PDH enzyme and inactivate its activity. Since MCF10A cells
showed a significant upregulation of PDK4 in suspension cells, we measured the PDH
activity using Mitosciences DipStick assay kit under attached and suspended culture
conditions. The PDH activity was significantly downregulated in matrix-detached cells
compared with attached cells (Figure 3-6). The results suggest the mammary epithelial
cells potently activate PDK enzyme when detached from matrix to reduce glucose
oxidation by decreasing PDH activity.
To investigate the functional significance of reduced PDH activity in matrix
detached cells, we decided to study the effect of PDH activation on anoikis. PDKs
inactivate PDH by phosphorylating the E1α subunit at three serine residues 232,
293,and 30099. We constructed a constitutively active form of PDH E1α by substituting
these serines with alanines, inserted a FLAG peptide at the C-terminal end, and
introduced it into MCF10A cells by lentiviral infection. Forced expression of PDH E1α
was confirmed by Western blotting using anti-FLAG antibody (Figure 3-7A). To confirm
if the forced overexpression of constitutively active PDH E1α in MCF10A is functional,
we measured PDH activity. As expected, the MCF10A transduced with active PDH E1α
displayed increased PDH activity under both attached and suspended conditions
(Figure 3-7B).
We investigated the effect of increased PDH activation on anoikis. When MCF10A
cells were transduced with constitutively active PDH E1α, they showed an enhanced

60
cell death under suspended conditions (Figure 3-8A). No detectable cell death by PDH
E1α was observed under attached conditions (Figure 3-8A). To determine if the
increased cell death is due to increased apoptosis, we measured caspase 3/7 activity.
As expected, the MCF10A cells transduced with active PDH E1α showed increased
caspase activity in suspension cells (Figure 3-8B). These findings suggest that
increased PDH activity sensitizes MCF10A cells to anoikis. Because activation of PDH
essentially phenocopied depletion of PDK4, we conclude that PDK4 modulates anoikis
through PDH.
Depletion of PDK4 Increases Mitochondrial Oxidation
Pyruvate is converted irreversibly into acetyl CoA by the PDH enzyme to turn on
the TCA cycle. As described in the introduction, PDH is tightly regulated by PDK and
PDPs. PDKs inhibit PDH activity and attenuate the TCA cycle. Therefore, we expect
that depletion of PDK4 in MCF10A would lead to increased PDH activity. An increased
PDH activity would increase the TCA cycle to produce ATP or energy for other
biosynthetic process. During the process of ATP production by oxidative
phosphorylation, the reactive oxygen species (ROS) would be generated as a
byproduct. Infact, mitochondrion is the main source for the production of ROS.
Therefore, we hypothesize that depletion of PDK4 increases ROS levels in MCF10A
suspension cells.
To test this model, we measured PDH activity in PDK4-depleted MCF10A cells
grown under attached and suspended conditions. As expected, the knockdown of PDK4
increased PDH in suspended cells (Figure 3-9A). Since PDK4 was not expressed in
adherent cells, depletion of PDK4 did not alter the PDH activity in MCF10A attached
cells (Figure 3-9A). Increased PDH activity should increase mitochondrial oxidation of

61
glucose and this in turn increases oxygen consumption rate. To test this, we measured
the oxygen consumption rate (OCR) in PDK4-depleted cells using BD oxygen biosensor
plates. There was no significant difference in OCR between EV and PDK4-depleted
MCF10A cells under adherent condition (Figure 3-9B). Upon detachment, MCF10A
carrying EV cells significantly reduced the oxygen consumption rate (Figure 3-9B),
which was consistent with increased PDK4 expression (Figure 3-1B) and reduced PDH
activity (Figure 3-6) during the process. The suspended PDK4-depleted MCF10A cells
showed significantly higher OCR than the suspended control cells (Figure 3-9B).
As the depletion of PDK increased mitochondrial respiration in MCF10A
suspended cells, we investigated if the depletion of PDK4 had any impact on the ROS
production. We measured the intracellular ROS levels using Invitrogen’s Amplex red
hydrogen peroxide/peroxidase assay kit. Although the MCF10A cells undergo anoikis,
but no significant increase in ROS levels was observed in suspended cells compared to
adherent ones (Figure 3-9C). Consistent with increased mitochondrial activity, PDK4-
depleted MCF10A cells accumulated higher ROS levels compared to the control cells
under suspension culture (Figure 3-9C). Thus, our results suggest that depletion of
PDK4 augments mitochondrial oxidation and ROS levels specifically in matrix detached
MCF10A cells.
Treatment with Antioxidant Rescues PDK4-Depleted Cells from Anoikis
Based on our results; we infer that depletion of PDK4 or increased PDH activity
sensitizes cells to anoikis. Furthermore, depletion of PDK4 increased ROS levels in
suspended MCF10A cells. ROS are known to cause damage to all cellular components
due to their oxidative nature. Since Mitochondria are the major sources for ROS
production and plays a critical role in the regulation of cell death especially intrinsic

62
apoptotic pathway (as described in the introduction), we decided to investigate the
impact of ROS on anoikis in PDK4-depleted MCF10A cells.
To test if ROS contributed to anoikis, we treated cells with two different
antioxidants: reduced form of glutathione (GSH) and α-lipoic acid (LA), to scavenge the
intracellular ROS. GSH is one of the most prevalent intracellular reducing agents to
maintain redox homeostasis. GSH reacts with ROS to form a relatively less stable
GSSG (oxidized form), which is quickly converted back to the reduced form (GSH) by
endogenous glutathione reductase. Thus, the reduced form of glutathione removes
ROS. α-lipoic acid (LA) is another antioxidant that is readily converted into the reduced
form by intracellular antioxidant enzymes such as glutathione reductase. The reduced
form has potent antioxidant effects, which scavenges ROS. The treatment with
antioxidants had little or no effect on apoptosis of adherent cells, but significantly
suppressed detachment-induced apoptosis in both EV and PDK4-depleted MCF10A
cells, as measured by caspase 3/7 activity (Figure 3-10). Although MCF10A-EV cells
did not show any increase in ROS levels upon detachment, the antioxidant treatment
rescued these cells from anoikis. The plausible explanation could be upon detachment
from matrix, the epithelial cells may become sensitive to ROS.
Taken together, our results suggest that when detached from matrix, mammary
epithelial cells upregulate PDK4 to attenuate PDH activity and hence the mitochondrial
oxidation of pyruvate. This metabolic reprogramming reduces oxidative stress, and
promotes resistance to anoikis.
Estrogen-Related Receptor Activates PDK4 in Response to Cell Detachment
Our study indicates that PDK4 plays a critical role in matrix detachment-induced
metabolic shift and promotes anoikis resistance. Therefore, it is important to determine

63
the key activator of PDK4 following matrix detachment. It was well established that
PDK4 was a direct target of the estrogen-related receptors (ERRs)100-103. ERRs are
orphan nuclear receptors and play a key role in regulating mitochondrial biogenesis and
fatty acid oxidation104. ERR have three members: ERR, ERR, and ERR. The first
two members are expressed in metabolically active tissues, whereas ERR is largely
restricted to embryonic cells104.
We first examined the expression of ERR and ERR in MCF10A cells under
attached and suspended culture conditions. The western blotting of ERR did not
display any significant change at protein level upon detachment (Figure 3-11A). By
contrast, ERR was significantly induced at RNA level by cell detachment (Figure 3-
11B). Since ERR was dramatically upregulated in suspended cells, we investigated its
role in the induction of PDK4. To test that, we efficiently depleted ERR with a lentiviral
shRNA, as shown by qRT-PCR (Figure 3-12A). Upon depletion of ERR, the induction
of PDK4 was substantially reduced at RNA level in MCF10A suspended cells (Figure 3-
12B). Next, we tested if the depletion of ERR had a similar effect on anoikis as PDK4
depletion in MCF10A. Consistent with PDK4 depleted MCF10A cells, depletion of ERR
significantly induced cell death in suspended cells as shown by trypan blue exclusion
assay (Figure 3-13A). Furthermore, this increased cell death was due to increased
apoptosis (as shown by caspase 3/7 assay) in ERR-depleted MCF10A suspended
cells (Figure 3-13B). No significant cell death (Figure 3-13A) or apoptosis (Figure 3-
13B) was observed in ERR-depleted adherent cells. Thus, our results confirm that the
induction of PDK4 in MCF10A suspension culture cells is by ERR and depletion of
ERRγ sensitizes cells to anoikis, which is consistent with PDK4 depletion.

64
Summary
Glucose metabolism not only produces energy in the form of ATP but also
regulates cell death processes. Anoikis is a form of cell death that occurs when an
epithelial cell detaches from ECM. We focused on understanding how glucose
metabolism was affected by matrix detachment and how it impacted anoikis or
detachment-induced apoptosis. Based on our results, we conclude that upon
detachment from matrix, untransformed mammary epithelial cells potently upregulate
ERR expression, which in turn activates the transcription of PDK4 and, consequently
results in decreased glucose oxidation and prolonged cell survival in suspension (Figure
3-14).

65
Figure 3-1. Matrix detachment induces PDK4 expression in mammary epithelial cells.
HMEC and MCF10A cells were grown in a 35 mm plates under attached and poly-hema coated suspended culture conditions for 24 hrs. After 24 hrs of incubation, the cells were collected to extract RNA using Trizol reagent. 2 μg of RNA was used from each sample to synthesize cDNA by Moloney Murine Leukemia Virus (M-MulV) reverse transcriptase. 1 μL of cDNA was used to run realtime quantitative PCR reaction with SYBR® green PCR mix. The relative RNA levels of PDK1, PDK2, PDK3, and PDK4 were normalized to endogenous β-Actin in (A) HMEC and (B) MCF10A. These data represent triplicate experiments. Error bars were expressed as standard error of the mean (S.E.M.). Statistical analysis was performed using paired Student’s t-test. Att = Attached, Susp = Suspended, and PDK = Pyruvate dehydrogenase kinase isozyme 1, 2, 3, and 4.

66
Figure 3-2. Induction of PDK4 at RNA and protein level in MCF10A suspension cells.
MCF10A cells were grown in a 35 mm plates under attached and poly-hema coated suspended culture conditions for 24 hrs. (A) Realtime qRT-PCR. After 24 hrs of incubation, the cells were collected to extract RNA using Trizol reagent. 2 μg of RNA was used from each sample to synthesize cDNA by Moloney Murine Leukemia Virus (M-MulV) reverse transcriptase. 1 μL of cDNA was used to run realtime quantitative PCR reaction with SYBR® green PCR mix. 100 ng of pure cDNAs of PDK1, 2, 3, and 4 respectively were diluted to 1, 10, 100, and1000 times and realtime quantitative PCR was run simultaneously to generate standard curve for each PDK isozyme. The absolute expression of PDK1, 2,3 and 4 under attached and suspended culture conditions in MCF10A cells were obtained by comparing the ct values with the respective PDK standard curve. The data represent three independent experiments. Error bars were expressed as standard error of the mean (S.E.M.). Statistical analysis was performed using paired Student’s t-test. (B) Immunoblotting. After 24 hrs of incubation, the cells under attached and suspended culture conditions were collected and lysed in denature lysis buffer with 0.1 % β-Mercaptoethanol. The samples were analyzed by 10% SDS-PAGE, followed by Immunoblotting using antibodies against PDK1, 2, 4, and α-Tubulin as loading control. Att =Attached, Susp = Suspended, and PDK = Pyruvate dehydrogenase kinase isozyme 1, 2, 3, and 4.

67
Figure 3-3. Expression of LDHA in attached and suspended MCF10A cells. MCF10A
cells were grown in a 35 mm plates under attached and poly-hema coated suspended culture conditions for 24 hrs. After 24 hrs of incubation, the cells under attached and suspended culture conditions were collected and lysed in denature lysis buffer with 0.1 % β-Mercaptoethanol. The samples were analyzed by 12% SDS-PAGE, followed by Immunoblotting using polyclonal anti-LDHA antibody and mouse anti-tubulin antibody as loading control. Att = Attached, Susp = Suspended, and LDHA = Lactate dehyrogenase isoform A.

68
Figure 3-4. Depletion of PDK4 using retroviral short hairpin RNA in MCF10A cells.
MCF10A-EV and PDK4 depleted MCF10A cells were grown in a 35 mm plates under attached and poly-hema coated suspended culture conditions for 24 hrs. After 24 hrs of incubation, the cells were collected to extract RNA using Trizol reagent. (A) Northern blotting. 10 μg of RNA from each sample was loaded onto 0.8% agarose gel, followed by 32P-labeled northern blotting was performed to analyze knockdown efficiency of PDK4 using PDK4 specific probe. 18s RNA was used for loading. (B) Realtime qRT-PCR. 2 μg of RNA was used from each sample to synthesize cDNA by Moloney Murine Leukemia Virus (M-MulV) reverse transcriptase. 1 μL of cDNA was used to run realtime quantitative PCR reaction with SYBR® green PCR mix. The relative RNA levels of PDK4 were normalized to endogenous β-Actin. These data represent triplicate experiments. Error bars were expressed as standard error of the mean (S.E.M.). Statistical analysis was performed using paired Student’s t-test. A or Att = Attached, S or Susp = Suspended, EV = Empty vector, sh = shorthairpin RNA 1 and 2, and PDK4 = Pyruvate dehydrogenase kinase isozyme 4.

69
Figure 3-5. Knockdown of PDK4 sensitizes MCF10A cells to anoikis. MCF10A-EV and
PDK4 depleted MCF10A cells were grown in a 35 mm plates under attached and poly-hema coated suspended culture conditions. (A) Trypan Blue (TB) exclusion assay After 48 hrs of incubation, the cells were collected from all the samples, trypzined, washed, and resuspended in 1 mL PBS. 1:1 ratio of 0.4% trypan blue dye was added to 50 μL of sample. The percentage of viable cells was counted by excluding dead cells stained blue using hemocytometer. (B) Caspase 3/7 glo assay. After 24 hrs of incubation, the cells were collected, washed and lyed in hypertonic buffer (HTB) to extract cytoplasmic protein. 100 μg of protein lysate adjusted to 20 μL volume by HTB for each sample was loaded onto 96-well microplate. Equal volume of caspase 3/7 glo substrate was added to measure caspase 3/7 activity using Luminometer. (C, D) PE-Annexin V/ 7-AAD analysis. After 24hr of incubation, the cells were collected washed twice in PBS and 1*105 cells were resuspended in 100 μL of PBS. 5 μL each of PE-Annexin V and 7-AAD were added to the cells and incubated for 15 minutes at room temperature. Later, the cells were immediately analyzed by FACScan machine. A total number of 10,000 cells were analyzed for each sample (C) The dot plot representing the percentage of total number of cells that were unstained or live (Lower left
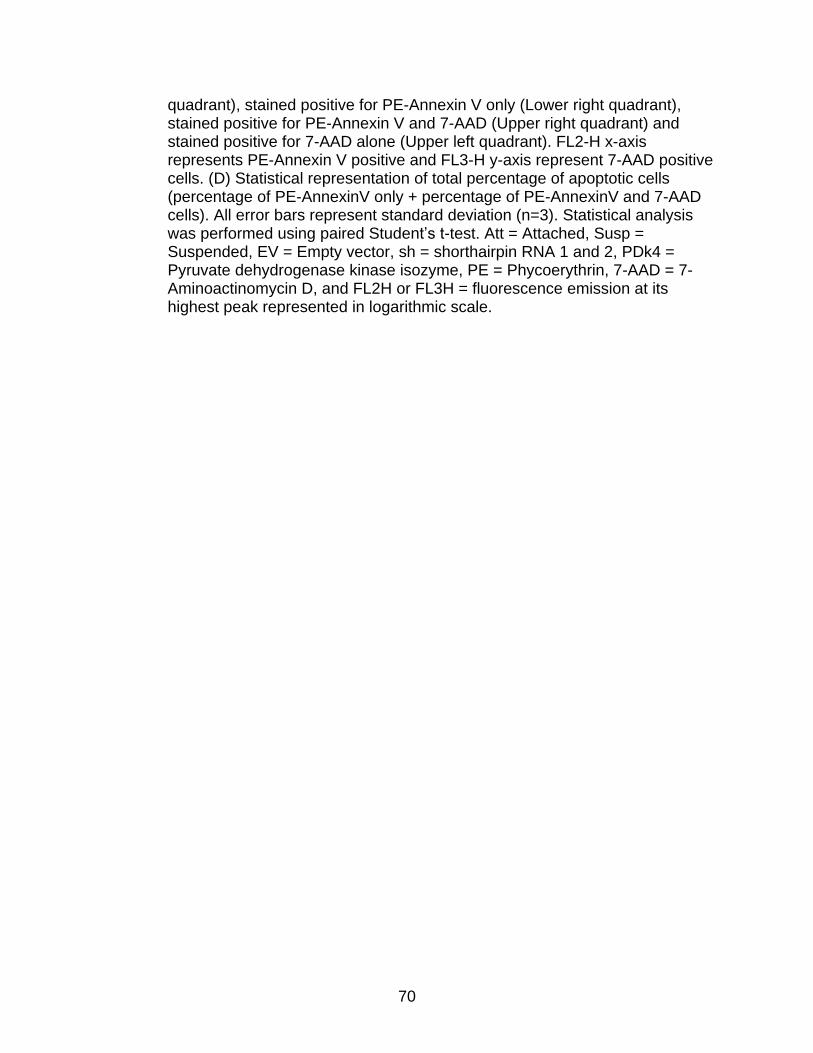
70
quadrant), stained positive for PE-Annexin V only (Lower right quadrant), stained positive for PE-Annexin V and 7-AAD (Upper right quadrant) and stained positive for 7-AAD alone (Upper left quadrant). FL2-H x-axis represents PE-Annexin V positive and FL3-H y-axis represent 7-AAD positive cells. (D) Statistical representation of total percentage of apoptotic cells (percentage of PE-AnnexinV only + percentage of PE-AnnexinV and 7-AAD cells). All error bars represent standard deviation (n=3). Statistical analysis was performed using paired Student’s t-test. Att = Attached, Susp = Suspended, EV = Empty vector, sh = shorthairpin RNA 1 and 2, PDk4 = Pyruvate dehydrogenase kinase isozyme, PE = Phycoerythrin, 7-AAD = 7- Aminoactinomycin D, and FL2H or FL3H = fluorescence emission at its highest peak represented in logarithmic scale.

71
Figure 3-6. Detachment from matrix attenuates PDH activity in MCF10A cells. PDH
activity was measured using Mitosciences PDH Dipstick assay kit. MCF10A cells were grown in a 35 mm plates under attached and poly-hema coated suspended culture conditions for 24 hrs. After 24 hrs of incubation, the cells were collected, washed in PBS, and lysed by adding 5 volumes of 10X sample buffer + 1/10 volume of detergent provided by the PDH activity measured using Mitoscience dipstick assay kit. After measuring protein concentration using BCA kit, 1 mg of protein was loaded onto 96-well microplate to analyze PDH activity by the kit. The signal produced by PDH activity was quantitatively represented as arbitrary units using densitometry. The data represent n=3. Att = Attached, Susp = Suspended, and PDH = Pyruvate dehydrogenase complex.

72
Figure 3-7. Forced expression of constitutively active PDH E1α in MCF10A cells.
MCF10A cells were transduced with lentivirus carrying empty vector and FLAG-tagged PDH E1α. MCF10A-EV and 10A-FPDH E1α cells were grown in a 35 mm plates under attached and poly-hema coated suspended culture conditions for 24 hrs. (A) Immunoblotting. After 24 hrs of incubation, the cells under attached and suspended culture conditions were collected and lysed in denature lysis buffer with 0.1 % β-Mercaptoethanol. The samples were analyzed by 10% SDS-PAGE, followed by Immunoblotting using mouse polyclonal anti-FLAG antibody (1:2000) and mouse anti-tubulin antibody (1:5000) as loading control. (B) PDH activity assay. After 24 hrs of incubation, the cells were collected, washed in PBS, and lysed by adding 5 volumes of 10X sample buffer + 1/10 volume of detergent provided by the PDH activity measured using Mitoscience dipstick assay kit. After measuring protein concentration using BCA kit, 1 mg of protein was loaded onto 96-well microplate to analyze PDH activity by the kit. Att = Attached, Susp = Suspended, EV = Empty vector, and FPDH E1α = FLAG tagged E1α subunit of pyruvate dehydrogenase complex.
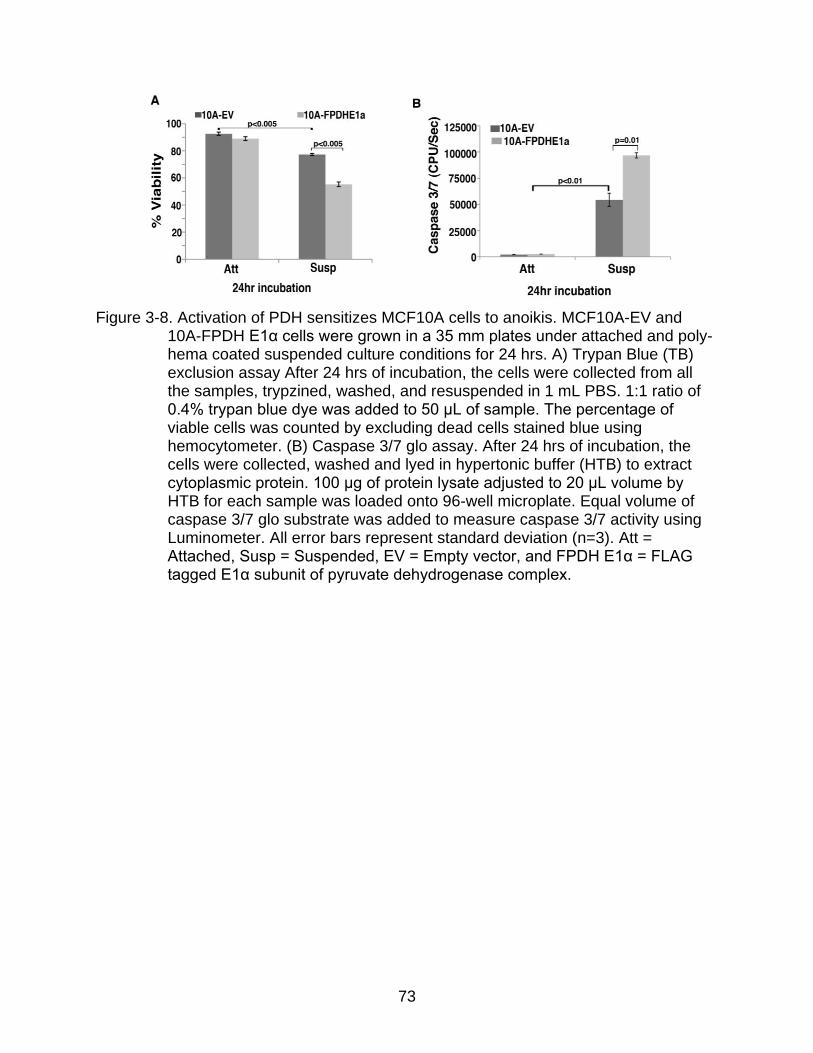
73
Figure 3-8. Activation of PDH sensitizes MCF10A cells to anoikis. MCF10A-EV and
10A-FPDH E1α cells were grown in a 35 mm plates under attached and poly-hema coated suspended culture conditions for 24 hrs. A) Trypan Blue (TB) exclusion assay After 24 hrs of incubation, the cells were collected from all the samples, trypzined, washed, and resuspended in 1 mL PBS. 1:1 ratio of 0.4% trypan blue dye was added to 50 μL of sample. The percentage of viable cells was counted by excluding dead cells stained blue using hemocytometer. (B) Caspase 3/7 glo assay. After 24 hrs of incubation, the cells were collected, washed and lyed in hypertonic buffer (HTB) to extract cytoplasmic protein. 100 μg of protein lysate adjusted to 20 μL volume by HTB for each sample was loaded onto 96-well microplate. Equal volume of caspase 3/7 glo substrate was added to measure caspase 3/7 activity using Luminometer. All error bars represent standard deviation (n=3). Att = Attached, Susp = Suspended, EV = Empty vector, and FPDH E1α = FLAG tagged E1α subunit of pyruvate dehydrogenase complex.

74
Figure 3-9. Depletion of PDK4 increases mitochondrial oxidation in MCF10A suspended
cells. MCF10A-EV and PDK4 depleted MCF10A cells were grown in a 35 mm plates under attached and poly-hema coated suspended culture conditions for 24 hrs. (A) PDH activity assay. After 24hr of incubation, the cells were collected, washed in PBS, and lysed by adding 5 volumes of 10X sample buffer + 1/10 volume of detergent provided by the PDH activity measured using Mitoscience dipstick assay kit. After measuring protein concentration using BCA kit, 1 mg of protein was loaded onto 96-well microplate to analyze PDH activity by the kit. The signal produced by PDH activity was quantitatively represented as arbitrary units using densitometry. (B) Measurement of oxygen consumption rate (OCR). After 24 hrs of incubation, one million cells were loaded onto the 96-well BD Oxygen biosensor plates to measure oxygen consumption for 2hrs at 10 min interval. (C) Measurement of ROS by Amplex red hydrogen peroxide/peroxidase assay. After 24 hrs incubation, the cells were collected, washed in PBS, and lysed the cells with hypertonic buffer. Equal amount of protein was loaded onto 96-well microplate and Amplex red hydrogen peroxide/peroxidase substrate was added to analyze the ROS levels at fluorescence wavelength of 590/630 nm
75
(excitation/emission). All error bars represent standard deviation (n=3). Att = Attached, Susp = Suspended, EV = Empty vector, sh = short hairpin RNA, PDK4 = Pyruvate dehydrogenase kinase isozyme, PDH= Pyruvate dehydrogenase complex, OCR= Oxygen consumption rate, ROS = Reactive oxygen species, and FLU= Fluoroscence units.
Figure 3-10. Antioxidant treatment rescues PDK4 depleted MCF10A cells from anoikis.
Caspase 3/7 glo assay. MCF10A-EV and PDK4 depleted MCF10A cells were grown in a 35 mm plates under attached and poly-hema coated suspended culture conditions for 48 hrs. The cells were treated with (i) untreated represented as -, (ii) 2.5 mM L-glutathione represented as GSH, and (iii) 100 μM α-Lipoic acid represented as LA for 48 hrs. After 48 hrs of incubation, the cells were collected, washed and lyed in hypertonic buffer (HTB) to extract cytoplasmic protein. 100 μg of protein lysate adjusted to 20 μL volume by HTB for each sample was loaded onto 96-well microplate. Equal volume of caspase 3/7 glo substrate was added to measure caspase 3/7 activity using Luminometer. All error bars represent standard deviation (n=3). Att = Attached, Susp = Suspended, EV = Empty, sh = short hairpin RNA, PDK4 = Pyruvate dehydrogenase kinase isozyme 4, (-) = untreated, GSH = L-glutathione, and LA= α-Lipoic acid.

76
Figure 3-11. Induction of ERRγ in MCF10A suspended culture conditions. MCF10A
cells were grown in a 35 mm plates under attached and poly-hema coated suspended culture conditions for 24 hrs. (A) Immunoblotting. After 24 hrs of incubation, the cells under attached and suspended culture conditions were collected and lysed in denature lysis buffer with 0.1 % β-Mercaptoethanol. The samples were analyzed by 10% SDS-PAGE, followed by Immunoblotting using polyclonal anti-ERRα antibody and mouse anti-tubulin antibody as loading control. (B) Realtime qRT-PCR. After 24 hrs of incubation, the cells were collected to extract RNA using Trizol reagent. 2 μg of RNA was used from each sample to synthesize cDNA by Moloney Murine Leukemia Virus (M-MulV) reverse transcriptase. 1 μL of cDNA was used to run realtime quantitative PCR reaction with SYBR® green PCR mix. The relative RNA levels of ERRγ were normalized to endogenous β-Actin. All error bars represent standard deviation (n=3) Att = Attached, Susp = Suspended, ERRa = Estrogen related receptor isoform alpha, and ERRg = Estrogen related receptor isoform gamma.

77
Figure 3-12. Depletion of ERRγ represses PDK4 induction in MCF10A suspended cells.
MCF10A cells were transduced with a retroviral empty vector ("EV") or
shRNA targeting ERR ("shERRg"). Cells were grown in a 35 mm plates under attached and poly-hema coated suspended culture conditions for 24 hrs and total RNA was extracted and analyzed by quantitative RT-PCR. (A)
Depletion of ERR in MCF10A. (B) Attenuation of PDK4 induction following
cell detachment in ERR depleted MCF10A. All error bars represent standard deviation (n=3). Att = Attached, Susp = Suspended, ERRg = Estrogen related receptor isoform gamma, and PDK4 = Pyruvate dehydrogenase kinase, sh = shorthairpin RNA.
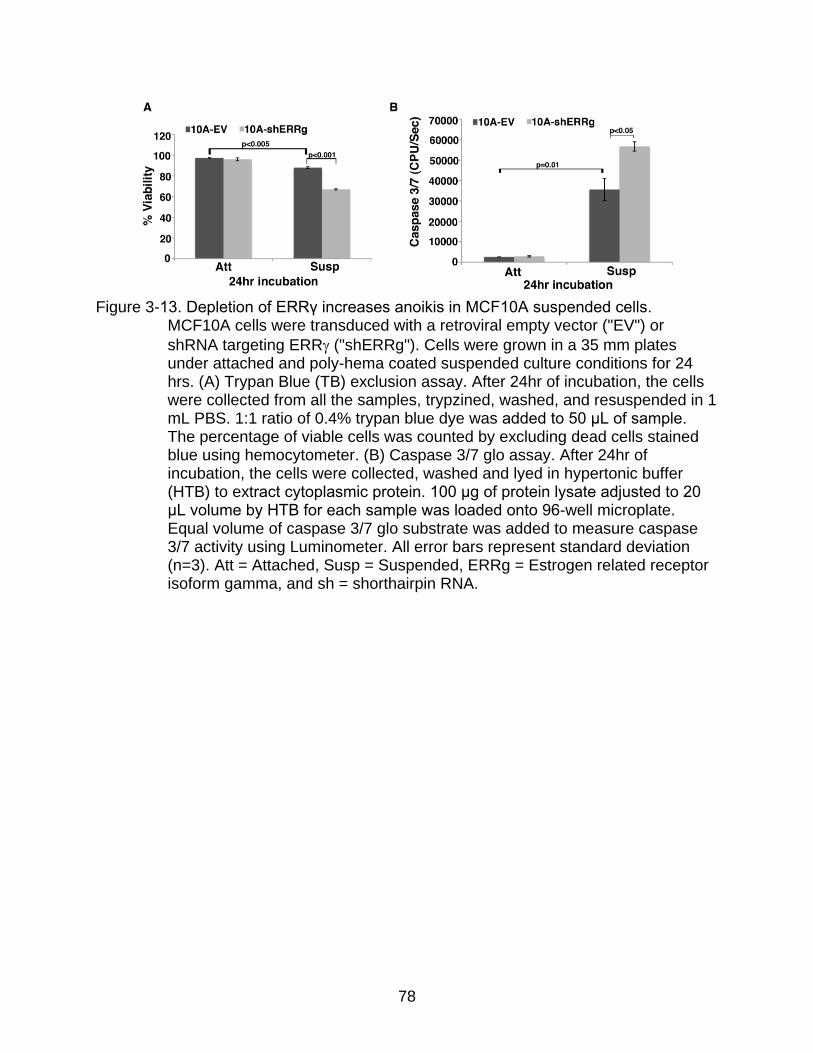
78
Figure 3-13. Depletion of ERRγ increases anoikis in MCF10A suspended cells.
MCF10A cells were transduced with a retroviral empty vector ("EV") or
shRNA targeting ERR ("shERRg"). Cells were grown in a 35 mm plates under attached and poly-hema coated suspended culture conditions for 24 hrs. (A) Trypan Blue (TB) exclusion assay. After 24hr of incubation, the cells were collected from all the samples, trypzined, washed, and resuspended in 1 mL PBS. 1:1 ratio of 0.4% trypan blue dye was added to 50 μL of sample. The percentage of viable cells was counted by excluding dead cells stained blue using hemocytometer. (B) Caspase 3/7 glo assay. After 24hr of incubation, the cells were collected, washed and lyed in hypertonic buffer (HTB) to extract cytoplasmic protein. 100 μg of protein lysate adjusted to 20 μL volume by HTB for each sample was loaded onto 96-well microplate. Equal volume of caspase 3/7 glo substrate was added to measure caspase 3/7 activity using Luminometer. All error bars represent standard deviation (n=3). Att = Attached, Susp = Suspended, ERRg = Estrogen related receptor isoform gamma, and sh = shorthairpin RNA.

79
Figure 3-14. Summary model. Upon detachment from ECM, the MCF10A cells
upregulate ERRγ to induce PDK4 to attenuate mitochondrial oxidation in order to prevent ROS production and thereby resist anoikis.

80
CHAPTER 4 PDK PROMOTES ANOIKIS RESISTANCE AND TUMOR METASTASIS IN BREAST
CANCER CELLS
Background
Tumor cells are formed due to genetic alterations in signaling pathways leading to
abnormal cell growth and survival. The two major signaling pathways that are often
found mutated in different tumors are Ras-extracellular signal-regulated kinase (ERK)
and the Phosphatidyllinositol-3-OH kinase (PI(3)K)-AKT pathways29. These aberrant
mutations cause inappropriate cell growth and survival. The rapidly dividing and
proliferating tumor cells eventually outgrow their vascular supply, resulting in a hypoxic
environment (low oxygen levels). The major consequence of hypoxia is to activate
different hypoxia-inducible genes, which include glycolysis related genes such as
Hexokinase II, Glut1 receptors, LDHA, PDK1, PDK3, pH regulated genes such as
Carbonic anhydrase 9 and CA12, and angiogenic genes such as vascular endothelial
growth factor (VEGF) and angiopoietin 2105. All these genes help tumor growth and
invasion. Furthermore, the hypoxic environment favors tumor metastasis by activating
epithelial to mesenchymal transition (EMT), regulating integrin interactions to facilitate
tissue rupture and invasion, and upregulating vascular endothelial growth factor (VEGF)
for angiogenesis and vascular formation106.
Cancer cells possess both altered energy metabolism and resistance to anoikis,
but the connection between them is yet to be elucidated. Schafer et al., were the first to
demonstrate the potential link between glucose metabolism and anoikis in
untransformed mammary epithelial cells68. Their report showed that detachment from
ECM led to metabolic defect in MCF10A cells. Forced overexpression of oncoprotein
ErbB2/HER2 rescued these cells from oxidative stress, restored ATP generation, and

81
supported anchorage-independent cell survival. However, it is less clear how ATP
deficiency is linked to cell death.
In the current study, we show that breast tumor cells have attenuated oxidative
metabolism of glucose compared to the normal cells. Furthermore, detachment from
ECM in cancer cells exhibits a dramatic shift from mitochondrial respiration towards
glycolysis by upregulating PDKs. In other words, the tumor cells show a further increase
in aerobic glycolysis to survive and metastasize to distant organs. Activation of
mitochondrial oxidation either by depletion of PDK or forced over-expression of PDH
E1α sensitizes cancer cells to anoikis and abrogates their metastatic potential. These
observations indicate that the Warburg effect in tumor cells promotes anoikis resistance
and contributes to the malignant phenotypes.
Results
Induction of PDK4 Promotes Anoikis Resistance in RAS-Transformed Mammary Epithelial Cells
Induction of PDK4 in Ras-transformed MCF10A cells (10ACA1.1)
Our study has demonstrated that matrix detachment induced PDK4 via ERRγ in
untransformed mammary epithelial cells (Chapter 3). Next, we investigated if a similar
survival mechanism existed in Ras- transformed MCF10A derivative cell line (MCF10A
CA1.1). These cells not only harbor the activated oncogene Ras but also certain
unindentified spontaneous mutations which led to generation of a highly tumorogenic
cell line107. Similar to MCF10A, MCF10CA1.1 cells upregulated PDK4 at RNA level
under the detached condition as shown by northern blotting (Figure 4-1). No detectable
expression of PDK4 was observed under attached culture condition (Figure 4-1).

82
PDK4 resists anoikis in Ras-transformed MCF10A cells (MCF10ACA1.1)
To test the functional significance of PDK4 in MCF10ACA1.1, PDK4 was depleted in
MCF10CA1.1 cells with two independent retroviral shRNAs and their knockdown
efficiency was confirmed by northern blotting. The depletion of PDK4 in MCF10ACA1.1
was approximately 80% by shPDK4-1 and ~90% by shPDK4-2 when compared to the
empty vector (EV) under detached condition (Figure 4-1). Unlike untransformed
MCF10A cells, MCF10CA1.1 transduced with EV did not exhibit significant cell death
when placed in suspension; however, depletion of PDK4 sensitized them to cell death
(Figure 4-2A). The significant decrease in cell viability in PDK4 depleted MCF10ACA1.1
detached cells was due to increased anoikis as shown by caspase 3/7activity (Figure 4-
2B).
Collectively, our results indicate that matrix detachment leads to induction of PDK4 to
promote anoikis resistance in both untransformed and malignant mammary epithelial
cells.
Warburg Effect Promotes Anoikis Resistance and Metastasis in Breast Tumor Cells
Matrix detachment favors Warburg effect in MDA-MB-231 cells
The hallmark of cancer cells is anoikis resistance. Since most cancer cells prefer
aerobic glycolysis to mitochondrial respiration, we hypothesized that reduced
mitochondrial oxidation provides survival advantage to malignant tumor cells when
detached from matrix. To test our hypothesis, we investigated the impact of Warburg
effect on anoikis resistance in an aggressive, metastatic, and highly glycolytic triple-
negative breast cancer cell line MDA-MB-231108. First, we compared the PDH activity in
MDA-MB-231 cells cultured under attached and suspended conditions. As expected,
83
the MDA-MB-231 cells displayed lower PDH activity under attached conditions (Figure
4-3) compared to MCF10A (Figure 1-7); however, the suspended MDA-MB-231 cells
demonstrated a significant decrease in PDH activity compared to attached cells (Figure
4-3). Thus, our data suggest that upon detachment from matrix, breast tumor cells
demonstrate a further reduction in mitochondrial activity.
Forced activation of mitochondrial oxidation induces anoikis in MDA-MB-231
We investigated the significance of reduced mitochondrial activity in MDA-MB-231
under suspension culture conditions. As performed in MCF10A, we ectopically
expressed the constitutively active form of PDH E1α with c-terminal FLAG tag in MDA-
MB-231 using lentiviral transduction method. Meanwhile, we infected MDA-MB-231 with
lentivirus carrying empty vector (EV) as control. Overexpression of PDH E1α was
confirmed by western blotting (Figure 4-4A). To test if the ectopically expressed PDH
E1α was enzymatically active, we measured PDH activity in these cells. The MDA-MB-
231 cells expressing constitutively active form of PDH E1α showed significantly
increased PDH activity compared to MDA-MB-231 cells expressing EV (Figure 4-4B).
Next, we investigated the impact of increased mitochondrial activity on anoikis in
MDA-MB-231 cells. Since cancer cells are resistant to detachment-induced cell death,
MDA-MB-231 cells transduced with EV did not display significant cell death under
detached culture conditions (Figure 4-5A); however, forced increase of PDH activity
sensitized MDA-MB-231 cells to cell death only under detached culture conditions
(Figures 4-5A). The increased anoikis was attributed to increased apoptosis in MDA-
MB-231 cells expressing constitutively active form of PDH E1α (Figure 4-5B). These
results suggest that breast tumor cells significantly attenuate mitochondrial oxidation to
survive longer after detachment from matrix.

84
PDK1 enhances Warburg effect in matrix detached MDA-MB-231 cells
To this point, our results suggest that breast tumor cells display a significant
decrease of mitochondrial oxidation upon matrix detachment to survive longer. To test if
the PDK isozymes regulate the mitochondrial activity under detached condition as
observed in MCF10A and RAS-transformed MCF10A cells, we examined the
expression of all four PDKs under attached and suspended culture conditions. PDK4
RNA was significantly upregulated in MDA-MB-231 cells upon matrix detachment
(Figure 4-6A), but its overall abundance was trivial when compared with other PDKs
(Figure 4-6B). PDK1 was the predominant PDK isoenzyme in MDA-MB-231 cells both
under attached and detached culture conditions as identified by quantitative RT-PCR
(Figure 4-6B). Although the RNA level of PDK1 in MDA-MB-231 cells did not change
upon detachment from matrix, its protein level was significantly increased compared to
attached cells (Figure 4-6C).
These data indicate that MDA-MB-231 cells upregulate PDK1 to downregulate
mitochondrial oxidation in suspension. Therefore, to activate mitochondrial oxidation in
MDA-MB-231 cells, we depleted the predominant PDK isoenzyme i.e., PDK1 using two
independent retroviral short hairpin RNAs. The knockdown efficiency of PDK1 was
confirmed by western blotting (Figure 4-7A). The depletion of PDK1 led to increased
PDH activity in MDA-MB-231 cells both under attached and detached culture conditions
(Figure 4-7B), indicating a glucose metabolic shift toward mitochondrial oxidation from
glycolysis. To test that, we measured intracellular lactate levels in PDK1 depleted MDA-
MB-231 cells. As expected, MDA-MB-231 cells carrying EV produced increased lactate
levels in suspended cells compared to attached ones (Figure 4-7C); however, depletion
of PDK1 significantly decreased lactate production both under attached and detached

85
culture conditions (Figure 4-7C). Since we observed a significant decrease in lactate
levels and increase in PDH activity, we measured the oxygen consumption rate (OCR)
in PDK1 depleted MDA-MB-231 cells to confirm an increase in mitochondrial
respiration. Consistent with our observations, MDA-MB-231 cells displayed decreased
OCR in detached cells compared to attached cells (Figure 4-7D), but knockdown of
PDK1 increased O2 consumption rate in these cells both under attached and suspended
culture conditions (Figure 4-7D). These results suggest that matrix detachment further
enhances the glycolytic phenotype in MDA-MB-231 cells and depletion of PDK1 in
these cells reverses the Warburg effect, shifting glucose metabolism from glycolysis
towards mitochondrial oxidation.
Depletion of PDK1 activates mitochondrial oxidation and abrogates anoikis resistance in MDA-MB-231 cells
Depletion of PDK1 significantly reversed the Warburg effect in MDA-MB-231 cells
both under attached and detached culture conditions; therefore, we investigated the
potential effect of this metabolic shift on anoikis. Not surprisingly, MDA-MB-231 cells
expressing EV did not show any significant cell death (Figure 4-8A) or apoptosis (Figure
4-8B) when grown in suspension. Although depletion of PDK1 increased PDH activity
and reversed the Warburg effect in MDA-MB-231 cells under attached culture condition,
it did not induce cell death (Figure 4-8A) or apoptosis (Figure 4-8B). Only when MDA-
MB-231 cells were detached from matrix did depletion of PDK1 induce cell death
(Figure 4-8A) and apoptosis (Figure 4-8B).
Together, these results suggest that normalization of glucose metabolism by
depletion of PDK or activation of PDH is capable of restoring anoikis in breast cancer
cells.
86
PDK1 enhances breast tumor metastasis in vivo
Resistance to anoikis is one of the critical steps for tumor metastasis. Depletion of
PDK1 sensitized the highly malignant MDA-MB-231 cells to anoikis by reversing the
Warburg effect in vitro, therefore, we examined the physiological relevance of this
metabolic manipulation on cancer metastasis. A common experimental model to
analyze tumor metastasis in vivo is tail vein injection experimental metastasis assay. It
measures the ability of cancer cells to survive in the blood circulation, extravasate, and
form metastatic colonies at distant secondary sites.
MDA-MB-231 cells carrying EV and PDK1-depleted MDA-MB-231 cells were
cultured under adherent conditions, then trypsinized, and equal number of cells (1*106
cells/200 μL) from each group were intravenously injected into immunodeficient mice
(Six mice in each group). After 40 days post-injection, control MDA-MB-231 cells gave
rise to about 100 tumor nodules per lung in all 6 mice analyzed (Figure 4-9A).
Consistent with our in vitro observations, the mice injected with PDK1-depleted MDA-
MB-231 cells produced significantly less number of lung tumor nodules (Figure 4-9A).
The immunohistochemical staining of Hemotoxylin and Eosin (H&E) did not show any
significant morphological differences between control and PDK1-depleted lung tumor
tissues (Figure 4-9A). There was a five-fold decrease in the lung tumor nodule formation
in mice injected with PDK1-depleted MDA-MB-231 cells compared to control mice
(Figure 4-9B). Therefore, reversal of the Warburg effect by depletion of PDK1 not only
sensitized metastatic cancer cells to anoikis in vitro, but also profoundly decreased their
metastatic potential in vivo.
87
Summary
Tumor cells exhibit aerobic glycolysis / Warburg effect and resistance to anoikis to
survive and thrive the harsh environments. It has been well established that Warburg
effect helps tumor growth and survival. However, its role in promoting anoikis resistance
and tumor metastasis glucose is still not clear. Therefore, we focused our study
understanding the role of altered glucose metabolism in regulating anoikis resistance to
promote metastasis in vivo. Based on our results, we conclude that upon detachment
from ECM, tumor cells take advantage of their altered glucose metabolism i.e., Warburg
effect by upregulating the PDKs to survive and invade the distant organs. Furthermore,
depletion of PDK or forced activation of PDH increases mitochondrial respiration and,
thus sensitizes these tumor cells to anoikis and abrogates their metastatic potential in
vivo. Therefore, our study implicates that the PDK enzymes are potential therapeutic
drug targets to prevent both tumor growth and metastasis.

88
Figure 4-1. Detachment from matrix upregulates PDK4 in Ras-transformed MCF10A
cells (MCF10ACA1.1). Northern blotting. 10ACA1.1-EV and PDK4 depleted 10ACA1.1 cells were grown in a 35 mm plates under attached and poly-hema coated suspended culture conditions for 48 hrs. After 48 hrs of incubation, the cells were collected to extract RNA using Trizol reagent. 10 μg of RNA from each sample was loaded onto 0.8% agarose gel, followed by 32P-labeled northern blotting was performed to analyze knockdown efficiency of PDK4 using PDK4 specific probe. 18s RNA was used for loading. A = Attached, S = Suspended, EV= Empty vector, sh = Shorthairpin, and PDK4 = Pyruvate dehydrogenase kinase isozyme 4.

89
Figure 4-2. Depletion of PDK4 sensitizes MCF10ACA1.1 cells to anoikis. Activation of
PDH sensitizes MCF10A cells to anoikis. 10ACA1.1-EV and PDK4 depleted 10ACA1.1 cells were grown in a 35 mm plates under attached and poly-hema coated suspended culture conditions for 48 hrs. (A) Trypan Blue (TB) exclusion assay After 48hr of incubation, the cells were collected from all the samples, trypzined, washed, and resuspended in 1 mL PBS. 1:1 ratio of 0.4% trypan blue dye was added to 50 μL of sample. The percentage of viable cells was counted by excluding dead cells stained blue using hemocytometer. (B) Caspase 3/7 glo assay. Only 10ACA1.1-shPDK4-2 was used for this assay. After 48 hrs of incubation, the cells were collected, washed and lyed in hypertonic buffer (HTB) to extract cytoplasmic protein. 100 μg of protein lysate adjusted to 20 μL volume by HTB for each sample was loaded onto 96-well microplate. Equal volume of caspase 3/7 glo substrate was added to measure caspase 3/7 activity using Luminometer. All error bars represent standard deviation (n=3). Att = Attached, Susp = Suspended, EV = Empty vector, sh =Shorthairpin, and PDK4=Pyruvate dehydrogenase kinase isozyme 4.
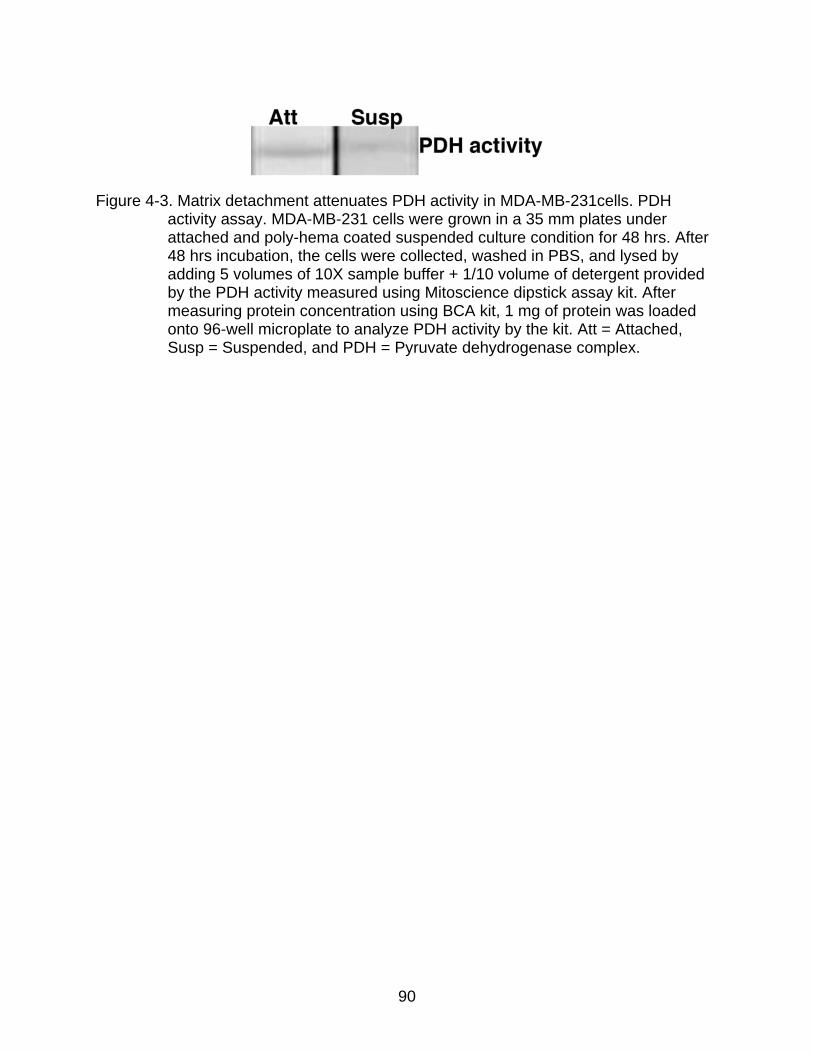
90
Figure 4-3. Matrix detachment attenuates PDH activity in MDA-MB-231cells. PDH
activity assay. MDA-MB-231 cells were grown in a 35 mm plates under attached and poly-hema coated suspended culture condition for 48 hrs. After 48 hrs incubation, the cells were collected, washed in PBS, and lysed by adding 5 volumes of 10X sample buffer + 1/10 volume of detergent provided by the PDH activity measured using Mitoscience dipstick assay kit. After measuring protein concentration using BCA kit, 1 mg of protein was loaded onto 96-well microplate to analyze PDH activity by the kit. Att = Attached, Susp = Suspended, and PDH = Pyruvate dehydrogenase complex.

91
Figure 4-4. Forced expression of constitutively active PDHE1α in MDA-MB-231 cells.
MDA-MB-231 cells were transduced with lentivirus carrying empty vector and FLAG-tagged PDH E1α. (A) Immunoblotting. MDA231-EV and MDA231-FPDH E1α cells were grown in a 35 mm plates under attached and poly-hema coated suspended culture conditions for 48 hrs. After 48 hrs of incubation, the cells under attached and suspended culture conditions were collected and lysed in denature lysis buffer with 0.1 % β-Mercaptoethanol. The samples were analyzed by 10% SDS-PAGE, followed by Immunoblotting using mouse polyclonal anti-FLAG antibody (1:2000) and mouse anti-tubulin antibody (1:5000) as loading control. (B) PDH activity assay. MDA231-EV and MDA231-FPDH E1α cells were grown in a 35 mm plates under attached culture condition for 48 hrs. After 48 hrs of incubation, the cells were collected, washed in PBS, and lysed by adding 5 volumes of 10X sample buffer + 1/10 volume of detergent provided by the PDH activity measured using Mitoscience dipstick assay kit. After measuring protein concentration using BCA kit, 1 mg of protein was loaded onto 96-well microplate to analyze PDH activity by the kit. Att = Attached, Susp = Suspended, EV = Empty vector, and FPDH E1α = FLAG tagged E1α subunit of pyruvate dehydrogenase complex.
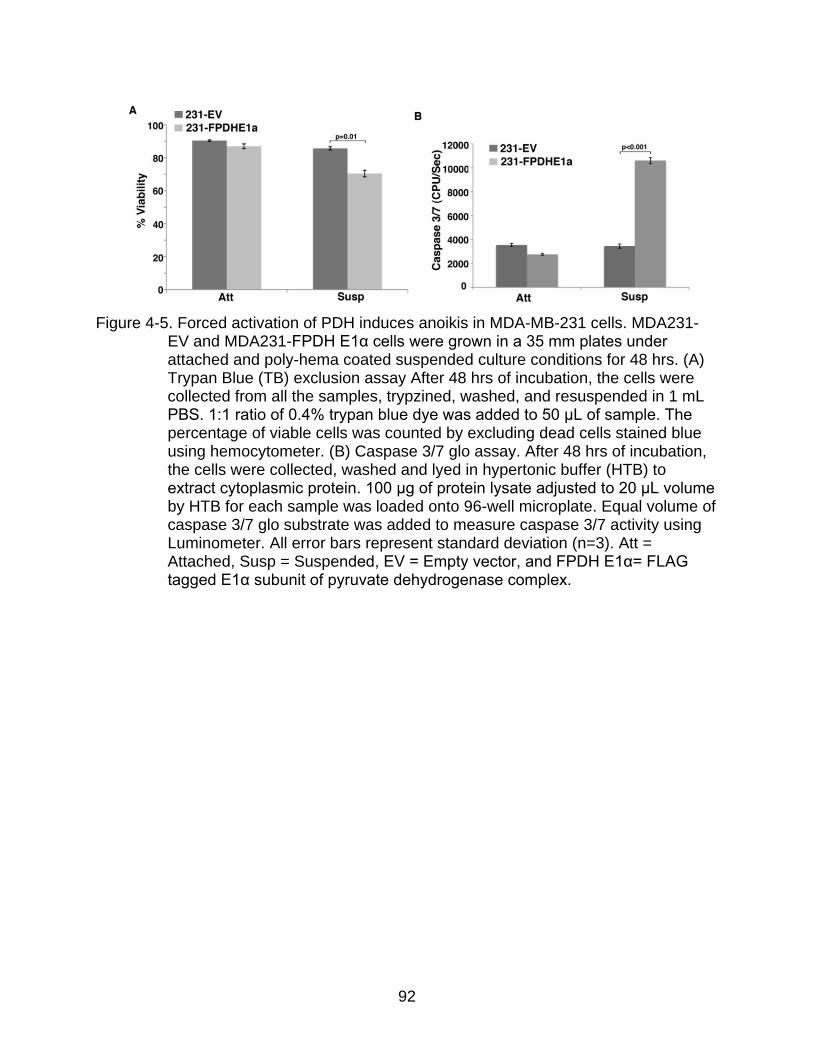
92
Figure 4-5. Forced activation of PDH induces anoikis in MDA-MB-231 cells. MDA231-
EV and MDA231-FPDH E1α cells were grown in a 35 mm plates under attached and poly-hema coated suspended culture conditions for 48 hrs. (A) Trypan Blue (TB) exclusion assay After 48 hrs of incubation, the cells were collected from all the samples, trypzined, washed, and resuspended in 1 mL PBS. 1:1 ratio of 0.4% trypan blue dye was added to 50 μL of sample. The percentage of viable cells was counted by excluding dead cells stained blue using hemocytometer. (B) Caspase 3/7 glo assay. After 48 hrs of incubation, the cells were collected, washed and lyed in hypertonic buffer (HTB) to extract cytoplasmic protein. 100 μg of protein lysate adjusted to 20 μL volume by HTB for each sample was loaded onto 96-well microplate. Equal volume of caspase 3/7 glo substrate was added to measure caspase 3/7 activity using Luminometer. All error bars represent standard deviation (n=3). Att = Attached, Susp = Suspended, EV = Empty vector, and FPDH E1α= FLAG tagged E1α subunit of pyruvate dehydrogenase complex.

93
Figure 4-6. Induction of PDK1 at protein level in MDA-MB231 upon detachment from
matrix. MDA-MB-231 cells were grown in a 35 mm plates under attached and poly-hema coated suspended culture conditions for 48 hrs. (A, B) After 48 hrs of incubation, the cells were collected to extract RNA using Trizol reagent. 2 μg of RNA was used from each sample to synthesize cDNA by Moloney Murine Leukemia Virus (M-MulV) reverse transcriptase. 1 μL of cDNA was used to run realtime quantitative PCR reaction with SYBR® green PCR mix. (A) Relative PDK expression. The relative RNA levels of PDK1, PDK2, PDK3, and PDK4 were normalized to endogenous β-Actin. (B) Absolute PDK expression. 100 ng of pure cDNAs of PDK1, 2, 3, and 4 respectively were diluted to 1, 10, 100, and1000 times and realtime quantitative PCR was run simultaneously to generate standard curve for each PDK isozyme. The absolute expression of PDK1, 2,3 and 4 under attached and suspended culture conditions in MDA-MB-231 cells were obtained by comparing the ct values with the respective PDK standard curve. (C) Immunoblotting. After 48 hrs of incubation, the cells under attached and suspended culture conditions were collected and lysed in denature lysis buffer with 0.1 % β-Mercaptoethanol. The samples were analyzed by 10% SDS-PAGE, followed by Immunoblotting using rabbit polyclonal anti-PDK1 (1:1000) and mouse anti-α-Tubulin antibody (1:5000) as loading control. The data represent three independent experiments. Error bars were expressed as standard error of the mean (S.E.M.). Statistical analysis was performed using paired Student’s t-

94
test. Att = Attached, Susp = Suspended, and PDK = Pyruvate dehydrogenase kinase isozyme 1, 2, 3, and 4.
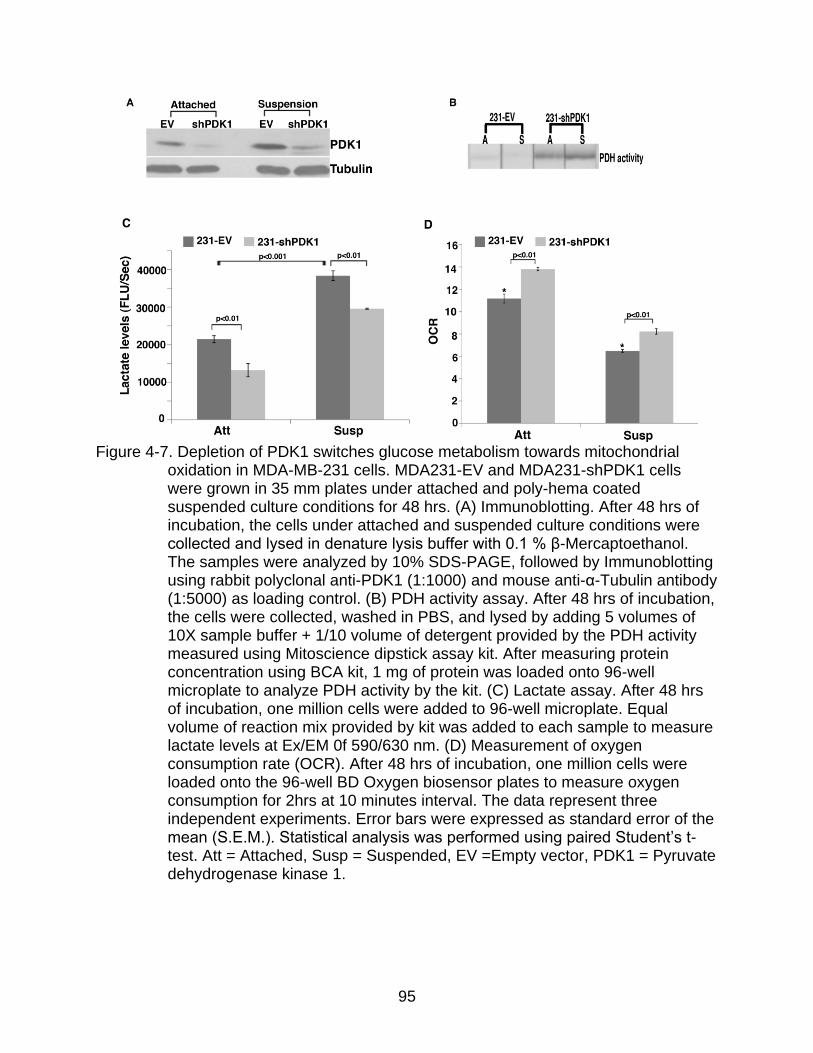
95
Figure 4-7. Depletion of PDK1 switches glucose metabolism towards mitochondrial
oxidation in MDA-MB-231 cells. MDA231-EV and MDA231-shPDK1 cells were grown in 35 mm plates under attached and poly-hema coated suspended culture conditions for 48 hrs. (A) Immunoblotting. After 48 hrs of incubation, the cells under attached and suspended culture conditions were collected and lysed in denature lysis buffer with 0.1 % β-Mercaptoethanol. The samples were analyzed by 10% SDS-PAGE, followed by Immunoblotting using rabbit polyclonal anti-PDK1 (1:1000) and mouse anti-α-Tubulin antibody (1:5000) as loading control. (B) PDH activity assay. After 48 hrs of incubation, the cells were collected, washed in PBS, and lysed by adding 5 volumes of 10X sample buffer + 1/10 volume of detergent provided by the PDH activity measured using Mitoscience dipstick assay kit. After measuring protein concentration using BCA kit, 1 mg of protein was loaded onto 96-well microplate to analyze PDH activity by the kit. (C) Lactate assay. After 48 hrs of incubation, one million cells were added to 96-well microplate. Equal volume of reaction mix provided by kit was added to each sample to measure lactate levels at Ex/EM 0f 590/630 nm. (D) Measurement of oxygen consumption rate (OCR). After 48 hrs of incubation, one million cells were loaded onto the 96-well BD Oxygen biosensor plates to measure oxygen consumption for 2hrs at 10 minutes interval. The data represent three independent experiments. Error bars were expressed as standard error of the mean (S.E.M.). Statistical analysis was performed using paired Student’s t-test. Att = Attached, Susp = Suspended, EV =Empty vector, PDK1 = Pyruvate dehydrogenase kinase 1.
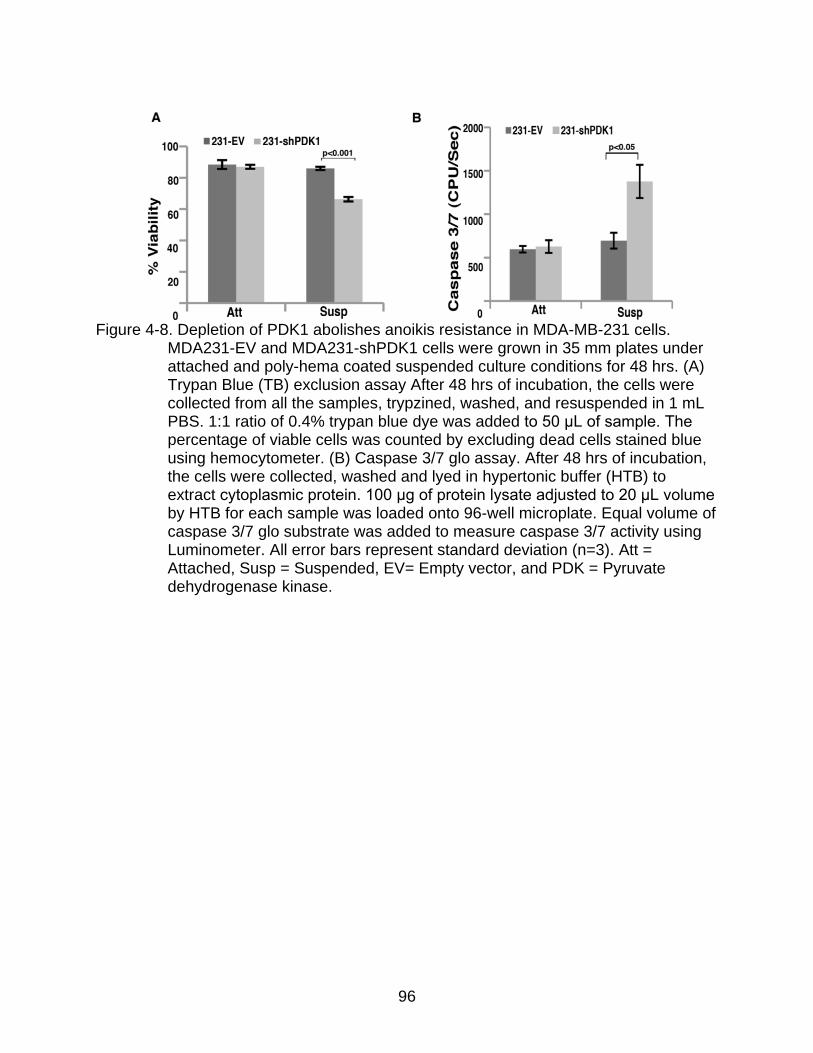
96
Figure 4-8. Depletion of PDK1 abolishes anoikis resistance in MDA-MB-231 cells.
MDA231-EV and MDA231-shPDK1 cells were grown in 35 mm plates under attached and poly-hema coated suspended culture conditions for 48 hrs. (A) Trypan Blue (TB) exclusion assay After 48 hrs of incubation, the cells were collected from all the samples, trypzined, washed, and resuspended in 1 mL PBS. 1:1 ratio of 0.4% trypan blue dye was added to 50 μL of sample. The percentage of viable cells was counted by excluding dead cells stained blue using hemocytometer. (B) Caspase 3/7 glo assay. After 48 hrs of incubation, the cells were collected, washed and lyed in hypertonic buffer (HTB) to extract cytoplasmic protein. 100 μg of protein lysate adjusted to 20 μL volume by HTB for each sample was loaded onto 96-well microplate. Equal volume of caspase 3/7 glo substrate was added to measure caspase 3/7 activity using Luminometer. All error bars represent standard deviation (n=3). Att = Attached, Susp = Suspended, EV= Empty vector, and PDK = Pyruvate dehydrogenase kinase.
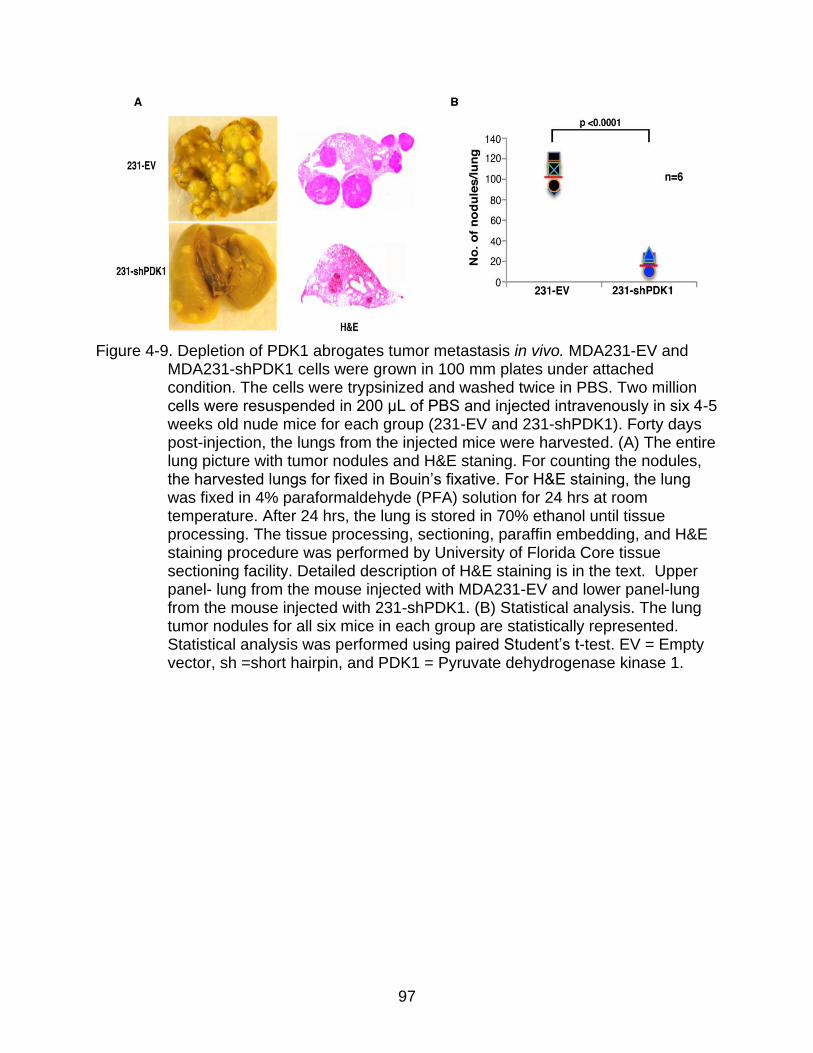
97
Figure 4-9. Depletion of PDK1 abrogates tumor metastasis in vivo. MDA231-EV and
MDA231-shPDK1 cells were grown in 100 mm plates under attached condition. The cells were trypsinized and washed twice in PBS. Two million cells were resuspended in 200 μL of PBS and injected intravenously in six 4-5 weeks old nude mice for each group (231-EV and 231-shPDK1). Forty days post-injection, the lungs from the injected mice were harvested. (A) The entire lung picture with tumor nodules and H&E staning. For counting the nodules, the harvested lungs for fixed in Bouin’s fixative. For H&E staining, the lung was fixed in 4% paraformaldehyde (PFA) solution for 24 hrs at room temperature. After 24 hrs, the lung is stored in 70% ethanol until tissue processing. The tissue processing, sectioning, paraffin embedding, and H&E staining procedure was performed by University of Florida Core tissue sectioning facility. Detailed description of H&E staining is in the text. Upper panel- lung from the mouse injected with MDA231-EV and lower panel-lung from the mouse injected with 231-shPDK1. (B) Statistical analysis. The lung tumor nodules for all six mice in each group are statistically represented. Statistical analysis was performed using paired Student’s t-test. EV = Empty vector, sh =short hairpin, and PDK1 = Pyruvate dehydrogenase kinase 1.

98
CHAPTER 5 ANTIOXIDANT PROTECTION FROM DETACHMENT INDUCED OXIDATIVE STRESS
IN MAMMARY EPITHELIAL CELLS
Background
Endogenous Antioxidants Defense System
The endogenous ROS levels are tightly regulated by both non-enzymatic and
enzymatic antioxidant components. The non-enzymatic antioxidants include hydrophilic
and lipophilic radical components such as α-tocopherol, ascorbic acid, reduced
coenzyme Q10 and glutathione109. The enzymatic antioxidant defense system includes
superoxide dismutases (SOD), which dismutase highly reactive superoxide anion to
less reactive hydrogen peroxide. There are three different forms of SOD enzyme
localized at different regions; SOD1 or copper superoxide dismutase (CuSOD) in
cytosol110, SOD2 or manganese superoxide dismutase (MnSOD) in mitochondrion111,
and SOD3 in extracellular matrix region112. Hydrogen peroxide is maintained at low
levels by catalase and glutathione peroxidase (Gpx) enzymes, which convert H2O2 to
H2O and O2113. The other enzymes that are involved in the reduction of oxidized forms
of antioxidant molecules are; thioredoxin reductase, glutathione reductases and
peroxiredoxin113. Therefore, the endogenous antioxidants balance the ROS levels to
prevent damage from oxidative stress and maintain redox homeostasis.
Manganese Superoxide Dismutase (MnSOD)
MnSOD is one of the major antioxidants that scavenge the superoxide anion to
generate hydrogen peroxide. It is a tetrameric enzyme localized to mitochondrion
encoded by a nuclear gene located on chromosome 6q25. MnSOD is an antioxidant
that resists apoptosis and protects cells from oxidative stress114, inflammatory cytokines
and ionizing radiation115. The mice lacking MnSOD enzyme die immediately after birth,

99
thus, illustrating its importance in maintenance of life116,117. The mice carrying
heterozygous MnSOD gene display reduction in MnSOD activity, increase in
mitochondrial oxidative damage, and higher incidence of tumor in older mice118.
Several reports state that MnSOD acts as a tumor suppressor gene119,120. High
levels of MnSOD have been reported to increase tumor metastasis and invasion121,122.
MnSOD is highly expressed in estrogen receptor (ER) negative human breast cancer
lines (MDA-MB-231, SKBR3) compared to ER-dependent human breast cancer cell
lines (MCF7, T47D)123. The role of MnSOD in tumor growth, invasion and metastasis is
controversial, but it is an important antioxidant that prevents oxidative stress and inhibits
apoptosis.
Good ROS and Bad ROS
The physiological role of ROS is very dynamic and depends on its overall
production. Mitochondrion generates ROS in a continuous process under aerobic
conditions. Low or transient levels of ROS is beneficial for normal cells because it
stimulates cellular proliferation and survival signaling pathways124. ROS oxidizes the
cysteine residues of kinases and phosphotases and thus, activates the signaling
molecules involved in proliferation, survival and growth. Some of those molecules may
include apoptosis signal-regulating kinase (ASK1)125, ERK126, PI3K/AKT127, and HIF1128
etc.
Excessive production of ROS causes damage to all cellular components leading to
cell death or senescence. The oxidative nature of ROS leads to alterations in
mitochondrial membrane components such as lipid peroxidation, or protein thiol
oxidation, which results in mitochondrial membrane permeabilization129. This is
followed by release of apoptosis-inducing factors including cytochrome c from

100
mitochondria, and subsequent activation of the caspase cascade130. Furthermore,
increased ROS production oxidizes cytochrome c leading to pro-apoptotic activity130.
Under physiological conditions, oxidants and anti-oxidants are in harmony to
maintain redox homeostasis. Any perturbation that causes imbalance between these
two components leads to oxidative stress.
Matrix detachment causes an increase in the level of ROS in endothelial cells67
and mammary epithelial cells68. Our data indicate that upon detachment, mammary
epithelial cells modulate glucose metabolism by upregulating PDK4 to attenuate
mitochondrial respiration to evade ROS production and resist anoikis (Figure 1-15).
Furthermore, treatment with antioxidants not only rescued PDK4 depleted MCF10A
cells but also the control MCF10A cells from apoptosis under detached culture
conditions (Figure 1-11), suggesting matrix detachment renders mammary epithelial
cells sensitive to ROS. To validate our observations, we examined the consequence of
increased oxidative stress resulting from depletion of an endogenous antioxidant. Since
our work mainly focuses on mitochondrial metabolism and ROS generated from it, we
studied the impact of mitochondria antioxidant manganese superoxide dismutase
(MnSOD or SOD2) on anoikis or detachment-induced apoptosis. Our work
demonstrates for the first time that when detached from ECM, the mammary epithelial
cells also modulate their endogenous antioxidant MnSOD levels to reduce oxidative
stress and promote anoikis resistance.
Results
Induction of MnSOD in Matrix Detached Mammary Epithelial Cells
MnSOD catalyzes the dismutation of mitochondrial superoxide into hydrogen
peroxide and oxygen, and hence is a key antioxidant. Also, our data suggest that matrix

101
detachment in mammary epithelial cells modulate glucose metabolism to evade ROS
production from mitochondria. Therefore, we first examined the induction of MnSOD in
HMEC and MCF10A at RNA level under attached and suspended culture conditions.
We unexpectedly found that like PDK4, MnSOD RNA levels were significantly increased
following detachment of HMEC (Figure 5-1A) and MCF10A cells (Figure 5-1B).
Consistent with RNA level, the protein level of MnSOD was also markedly
elevated in MCF10A suspended culture cells (Figure 5-2). Thus, the data indicate upon
detachment from extracellular matrix, mammary epithelial cells induce antioxidant
MnSOD to combat oxidative stress to protect from anoikis.
Depletion of MnSOD Sensitizes Mammary Epithelial Cells to Anoikis
We further investigated the effect of MnSOD depletion on anoikis in MCF10A.
MnSOD was depleted using retroviral shRNA and the knockdown efficiency was
confirmed by western blotting (Figure 5-2).
Although MnSOD was expressed under attached culture conditions, depletion of
MnSOD had little effect on cell death (Figure 5-3A). While in suspension culture
conditions, knockdown of MnSOD significantly induced cell death in detached MCF10A
cells (Figure 5-3A). To investigate if the increased cell death is due to increased
apoptosis, we performed caspase 3/7 activity and PE annexin V/7-AAD staining in
MnSOD depleted MCF10A cells in attached and suspended culture cells. As expected,
knockdown of MnSOD displayed increased caspase 3/7 activity (Figure 5-3B) and PE
annexin V/7-AAD staining (Figure 5-3C) when cells were in suspension. Compared to
control cells, MnSOD-depleted cells exhibited elevated early stage (22% vs. 14%) and
late stage (10% vs. 5%) apoptosis when detached from matrix (Figure 5-3D). Consistent
with TB exclusion assay, no significant increase in apoptosis was observed in MnSOD

102
depleted MCF10A cells under adherent culture condition. These results support that
increased oxidative stress enhances anoikis.
Epistatic Relationship Between PDK4 and MnSOD upon Matrix Detachment
Upon detachment, mammary epithelial cells upregulated both PDK4 and MnSOD.
Our data provide evidence that depletion of either gene sensitized MCF10A to anoikis.
Therefore, we decided to investigate if these two genes have an epistatic relationship.
At RNA level, PDK4-depleted MCF10A cells expressed significantly higher MnSOD
levels than control cells following cell detachment (Figure 5-4A). Conversely, MnSOD-
depleted MCF10A cells induced more PDK4 than control cells in suspended culture
condition (Figure 5-4B). However, the induction of MnSOD in PDK4-depleted MCF10A
suspended cells was significantly higher than PDK4 induction in MnSOD-depleted
MCF10A suspended culture cells. In addition, unlike PDK4, induction of MnSOD was
not dependent on ERR (Figure 5-4C). But, like PDK4-depleted MCF10A cells, ERR-
depleted MCF10A cells induced more MnSOD suspended cells (Figure 5-4C). These
findings suggest that upon matrix detachment, PDK4 and MnSOD genes may
compensate each other to evade ROS production and resist anoikis.
Summary
Taken together, we conclude that upon detachment, mammary epithelial cells
simultaneously upregulate both ERR-PDK4 and MnSOD to reduce ROS levels (Figure
2-5). The loss of one gene may compensate for the other. Thus, it suggests an epistatic
relationship exists between the two genes. These alterations in both metabolism and
endogenous antioxidant system confer increased resistance to anoikis by eliminating
oxidative stress and extend survival of cells in suspension (Figure 5-5).

103
Figure 5-1. Induction of MnSOD in HMEC and MCF10A suspended cells. HMEC and
MCF10A cells were grown in a 35 mm plates under attached and poly-hema coated suspended culture conditions for 24 hrs. After 24 hrs of incubation, the cells were collected to extract RNA using Trizol reagent. 2 μg of RNA was used from each sample to synthesize cDNA by Moloney Murine Leukemia Virus (M-MulV) reverse transcriptase. 1 μL of cDNA was used to run realtime quantitative PCR reaction with SYBR® green PCR mix. The relative RNA levels of MnSOD were normalized to endogenous β-Actin in (A) HMEC and (B) MCF10A. These data represent triplicate experiments. Error bars were expressed as standard error of the mean (S.E.M.). Statistical analysis was performed using paired Student’s t-test. Att = Attached, Susp = Suspended, and MnSOD = Manganese superoxide dismutase.
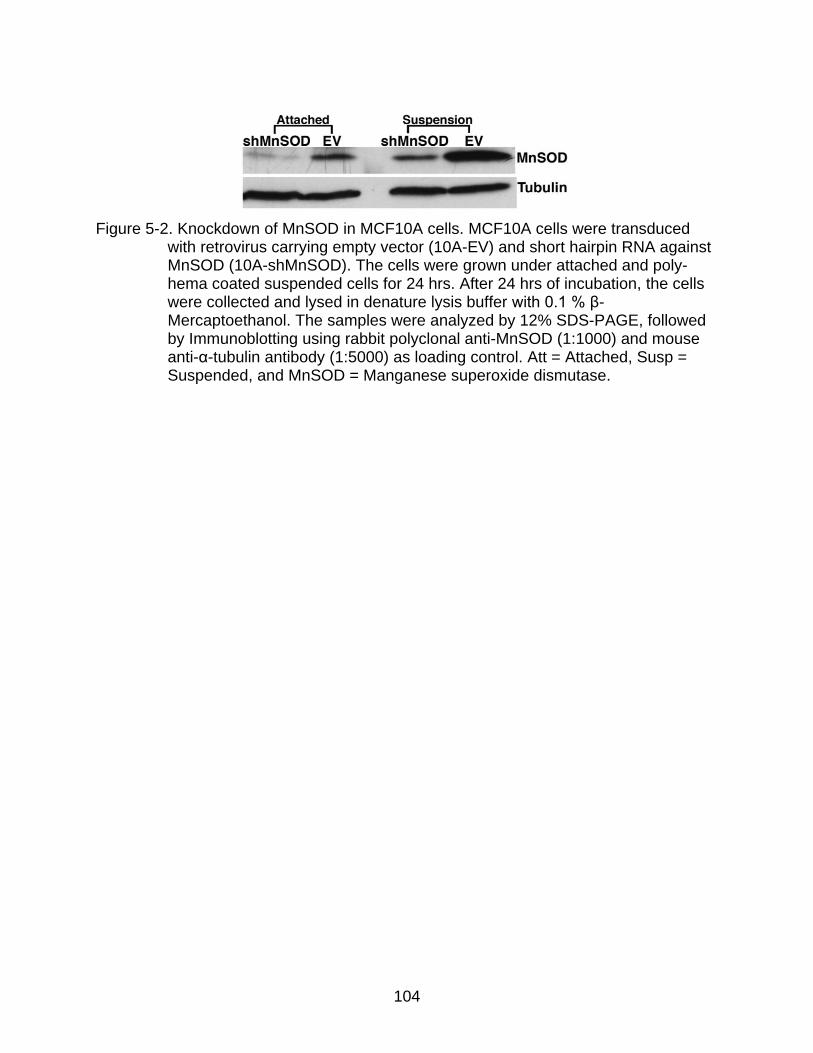
104
Figure 5-2. Knockdown of MnSOD in MCF10A cells. MCF10A cells were transduced
with retrovirus carrying empty vector (10A-EV) and short hairpin RNA against MnSOD (10A-shMnSOD). The cells were grown under attached and poly-hema coated suspended cells for 24 hrs. After 24 hrs of incubation, the cells were collected and lysed in denature lysis buffer with 0.1 % β-Mercaptoethanol. The samples were analyzed by 12% SDS-PAGE, followed by Immunoblotting using rabbit polyclonal anti-MnSOD (1:1000) and mouse anti-α-tubulin antibody (1:5000) as loading control. Att = Attached, Susp = Suspended, and MnSOD = Manganese superoxide dismutase.
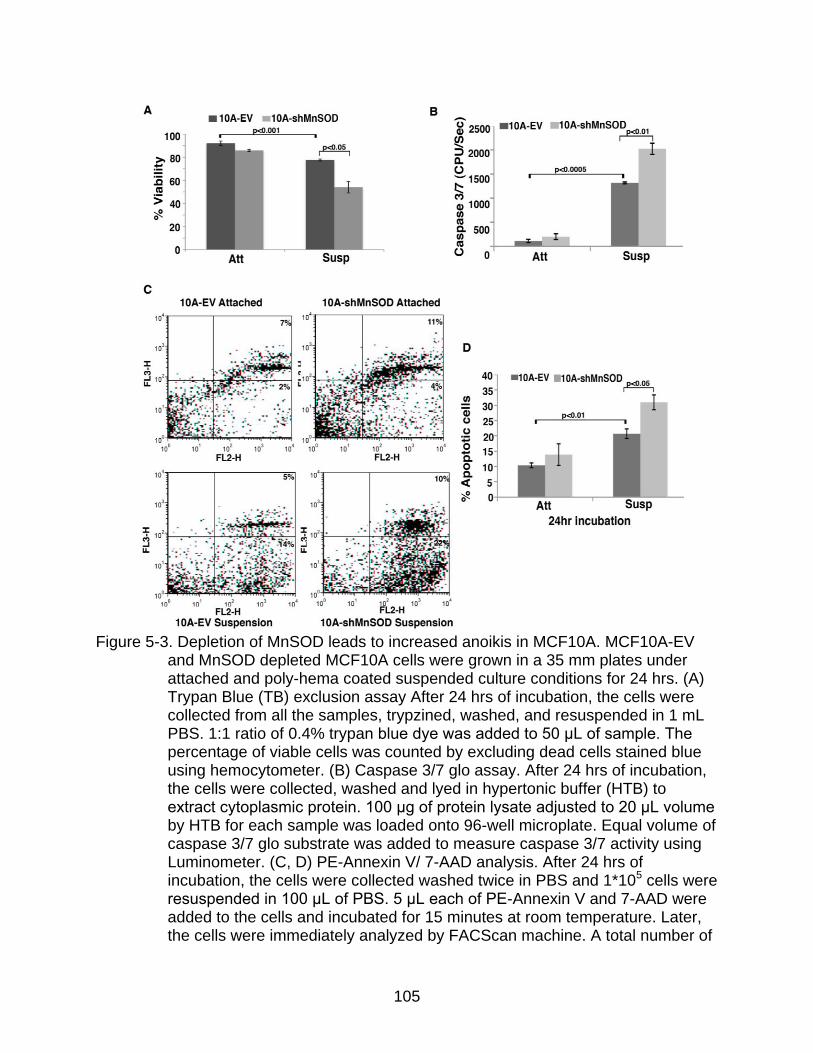
105
Figure 5-3. Depletion of MnSOD leads to increased anoikis in MCF10A. MCF10A-EV
and MnSOD depleted MCF10A cells were grown in a 35 mm plates under attached and poly-hema coated suspended culture conditions for 24 hrs. (A) Trypan Blue (TB) exclusion assay After 24 hrs of incubation, the cells were collected from all the samples, trypzined, washed, and resuspended in 1 mL PBS. 1:1 ratio of 0.4% trypan blue dye was added to 50 μL of sample. The percentage of viable cells was counted by excluding dead cells stained blue using hemocytometer. (B) Caspase 3/7 glo assay. After 24 hrs of incubation, the cells were collected, washed and lyed in hypertonic buffer (HTB) to extract cytoplasmic protein. 100 μg of protein lysate adjusted to 20 μL volume by HTB for each sample was loaded onto 96-well microplate. Equal volume of caspase 3/7 glo substrate was added to measure caspase 3/7 activity using Luminometer. (C, D) PE-Annexin V/ 7-AAD analysis. After 24 hrs of incubation, the cells were collected washed twice in PBS and 1*105 cells were resuspended in 100 μL of PBS. 5 μL each of PE-Annexin V and 7-AAD were added to the cells and incubated for 15 minutes at room temperature. Later, the cells were immediately analyzed by FACScan machine. A total number of

106
10,000 cells were analyzed for each sample (C) The dot plot representing the percentage of total number of cells that were unstained or live (Lower left quadrant), stained positive for PE-Annexin V only (Lower right quadrant), stained positive for PE-Annexin V and 7-AAD (Upper right quadrant) and stained positive for 7-AAD alone (Upper left quadrant). FL2-H x-axis represents PE-Annexin V positive and FL3-H y-axis represent 7-AAD positive cells. (D) Statistical representation of total percentage of apoptotic cells (percentage of PE-AnnexinV only + percentage of PE-AnnexinV and 7-AAD cells). All error bars represent standard deviation (n=3). Statistical analysis was performed using paired Student’s t-test. Att = Attached, Susp = Suspended, EV = Empty vector, MnSOD = Manganese superoxide dismutase, PE = Phycoerythrin, 7-AAD = 7- Aminoactinomycin D, and FL2H or FL3H= fluorescence emission at its highest peak represented in logarithmic scale.
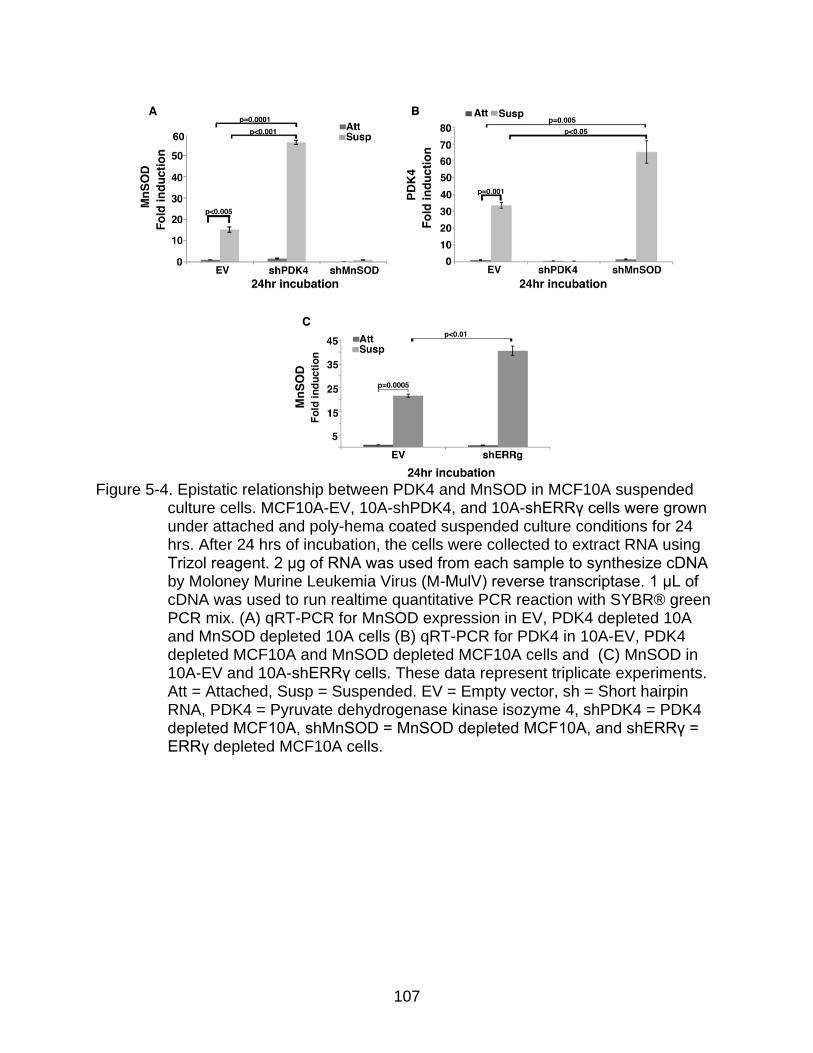
107
Figure 5-4. Epistatic relationship between PDK4 and MnSOD in MCF10A suspended
culture cells. MCF10A-EV, 10A-shPDK4, and 10A-shERRγ cells were grown under attached and poly-hema coated suspended culture conditions for 24 hrs. After 24 hrs of incubation, the cells were collected to extract RNA using Trizol reagent. 2 μg of RNA was used from each sample to synthesize cDNA by Moloney Murine Leukemia Virus (M-MulV) reverse transcriptase. 1 μL of cDNA was used to run realtime quantitative PCR reaction with SYBR® green PCR mix. (A) qRT-PCR for MnSOD expression in EV, PDK4 depleted 10A and MnSOD depleted 10A cells (B) qRT-PCR for PDK4 in 10A-EV, PDK4 depleted MCF10A and MnSOD depleted MCF10A cells and (C) MnSOD in 10A-EV and 10A-shERRγ cells. These data represent triplicate experiments. Att = Attached, Susp = Suspended. EV = Empty vector, sh = Short hairpin RNA, PDK4 = Pyruvate dehydrogenase kinase isozyme 4, shPDK4 = PDK4 depleted MCF10A, shMnSOD = MnSOD depleted MCF10A, and shERRγ = ERRγ depleted MCF10A cells.

108
Figure 5-5. Summary model. Detachment from ECM induces MnSOD in MCF10A in
parallel with ERRγ-PDK4 to prevent ROS production and resist anoikis. The loss of PDK4 is compromised by MnSOD and vice versa in order to evade oxidative stress during detachment and prolong cell survival.

109
CHAPTER 6 CONCLUSIONS AND FUTURE DIRECTIONS
Conclusions
The present study examines the role of glucose metabolism in the regulation of
anoikis or detachment-induced cell death and its impact on breast cancer metastasis in
vivo. Upon detachment from ECM, the normal epithelial cells undergo cell death known
as anoikis to prevent irregular growth. Unlike normal cells, tumor cells resist anoikis to
survive through blood circulation, invade and metastasize to distant organs. Compared
to normal cells, tumor cells have altered glucose metabolism known as aerobic
glycolysis or the Warburg effect. Since tumor metastasis is one of the leading causes of
death among cancer patients, it is critical to understand the molecular mechanisms that
contribute to this process. Although the Warburg effect contributes to tumor initiation,
growth, and survival, its role in tumor metastasis is yet to be elucidated. To study the
role of glucose metabolism in the development of anoikis resistance and tumor
metastasis, we used untransformed mammary epithelial cells (MCF10A and HMEC),
Ras-transformed mammary epithelial cells (MCF10ACA1.1) and highly metastatic
breast cancer cells (MDA-MB-231) as our model systems.
The first part of this work examines the impact of glucose metabolism on cell
survival during detachment in normal mammary epithelial cells. We have demonstrated
that in response to cell detachment, HMEC and MCF10A cells markedly upregulate
PDK4 to inhibit PDH, thereby attenuating the conversion of glycolysis-derived pyruvate
to acetyl-CoA in the mitochondria and subsequent flux into the TCA cycle. This
metabolic reprogramming diverts glucose-derived carbons away from mitochondrial
oxidative metabolism, decreases oxygen consumption and mitochondrial ROS

110
production in MCF10A cells specifically under suspension culture conditions. These
data indicate that matrix attachment has a profound effect on glucose oxidation in
mammary epithelial cells. While Brugge et al., concomitantly reported the induction of
PDK4 leading to attenuation of mitochondrial activity in MCF10A suspension cells131,
the impact of detachment-triggered metabolic shift on anoikis proves to be the novel
aspect of this study.
In evaluating the functional significance of PDK4 induction in MCF10A cells
specifically under suspension culture conditions, we have demonstrated that depletion
of PDK4 accelerates anoikis by activating intrinsic apoptotic pathway. This increased
cell death in MCF10A suspension cells by depletion of PDK4 is due to the activation of
PDH, which in turn increases mitochondrial respiration and oxidative stress. In other
words, MCF10A cells attenuate mitochondrial respiration by upregulating PDK4 to delay
apoptosis upon matrix detachment. To prove that attenuation of mitochondrial oxidation
prolongs cell survival under suspension culture conditions, we have constitutively
activated PDH in MCF10A cells. Not surprisingly, activation of PDH sensitizes MCF10A
cells to anoikis. These findings reveal how untransformed mammary epithelial cells
manage to survive longer in the absence of matrix by reprogramming glucose
metabolism. This study also provides direct evidence that decreased glucose oxidation
promotes anoikis resistance in normal mammary epithelial cells.
Depletion of PDK4 induces significant cell death in MCF10A suspension cells but
demonstrates a slight shift towards glucose oxidation. In other words, elimination of
PDK4 may not have completely relieved PDH enzyme activity and hence we observe a
partial increase in glucose oxidation. One possible explanation for this incomplete

111
activation of PDH enzyme is the presence of other PDK isozymes. Although PDK4 and
PDK2 are induced upon matrix detachment in MCF10A cells, PDK1 and PDK4 are the
most abundant of all the four isozymes. Also, the enzymatic inhibitory effect of PDK1 is
higher than PDK4. Therefore, depletion of PDK4 in MCF10A cells partially activates the
PDH enzyme due to the existence of PDK1. Similar to PDK4 depletion, it is possible
that depletion of PDK1 in MCF10A cells may sensitize them to anoikis.
PDK4 depleted MCF10A cells markedly undergo anoikis in suspension due to
increased oxidative stress through mitochondrial respiration. Pharmacological treatment
with antioxidants rescued both the control and PDK4-depleted MCF10A cells from
apoptosis under suspension culture conditions. Schafer et al., demonstrated that matrix
detachment increases ROS production in MCF10A68, but our data indicate no significant
change in ROS levels. A plausible reason for antioxidants to protect control MCF10A
cells from anoikis could be that matrix detachment may render cells sensitive to
oxidative stress. This observation is further reinforced when MCF10A cells exhibited
increased apoptosis due to forced activation of PDH specifically in suspension cells but
not in attached ones. In other words, forced activation of PDH increases oxidative stress
in MCF10A cells both under attached and suspended culture conditions but only
suspension cells are sensitive to oxidative stress and therefore undergo anoikis.
It is intriguing that MCF10A cells activate the ERR-PDK4 axis following matrix
detachment. Expression of PDK4 is usually stimulated by starvation, which
consequently suppresses PDH and curtails glucose oxidation. This response conserves
glucose reserves and allows the switch from the utilization of glucose to fatty acids as
an energy source. On the other hand, ERRs are key regulators of fatty acid oxidation. It

112
was recently observed that matrix detachment led to reduced glucose uptake in
MCF10A cells68. Therefore, cell detachment may mimic glucose starvation, and trigger
the ERR-PDK4 program and metabolic shift in MCF10A cells.
Consistent with cell's metabolic shift to reduce glucose oxidation and oxidative
stress response to detachment, MCF10A and HMEC suspended cells also stimulate
expression of MnSOD, which mitigates the oxidative stress and extends the viability of
cells in suspension. Coupling of a decrease in ROS generation and an increase in
cellular antioxidant capacity to scavenge ROS represents an integrated strategy for
cells to avoid oxidative damage and survive longer under the stress of matrix
detachment. These observations reveal how cells manage to control oxidative stress to
resist anoikis. Consistent with our observations, it has been reported that expression of
MnSOD is elevated in aggressive breast cancer cells and contributes to tumor
invasiveness and metastasis123.
Our data provide the first direct evidence that attenuation of mitochondrial
respiration promotes anoikis resistance in normal mammary epithelial cells. The second
part of our work focuses on examining the influence of glucose metabolism on anoikis
resistance and tumor metastasis in breast cancer cells. Since the untransformed
mammary epithelial cells induce PDK4 to resist anoikis, we decided to examine the role
of PDKs in Ras-transformed mammary epithelial cells (MCF10ACA1.1). As expected,
MCF10ACA1.1 cells significantly upregulate PDK4 upon matrix detachment to protect
cells from anoikis. Although MCF10ACA1.1 are highly metastatic in nature and induced
PDK4 upon matrix detachment, they do not form significantly larger tumor nodules in
vivo (data not shown). It is more clinically relevant to study the impact of glucose

113
metabolism on anoikis resistance in a breast cancer cell line derived from human
patients. Therefore, we have focused our attention to a highly metastatic, aggressive,
and triple negative breast cancer cell line MDA-MB-231.
MDA-MB-231 cells are highly glycolytic in nature. Because cancer cells exhibit a
preference for aerobic glycolysis and a low rate of mitochondrial oxidation of glucose,
we hypothesize that the Warburg effect intrinsically bestows a survival advantage upon
cancer cells when they are detached from the matrix, and facilitates their metastatic
spreading. Consistent with our hypothesis, MDA-MB-231 cells exhibit significantly lower
PDH activity than the normal mammary epithelial cells under adherent culture
conditions. Surprisingly, matrix detachment significantly attenuates PDH activity,
increases lactate levels and decreases OCR in MDA-MB-231 cells. These observations
prove that upon detachment from matrix, the highly aggressive breast cancer MDA-MB-
231 cells further enhance the Warburg effect to promote anoikis resistance. Indeed,
normalization of glucose metabolism in MDA-MB-231 cells by activation of PDH
redirects pyruvate towards mitochondrial oxidation and restores their sensitivity to
anoikis. Therefore, the attenuation of mitochondrial respiration protects breast cancer
cells from detachment-induced cell death by evading oxidative stress from
mitochondria.
Like MCF10A, HMEC and MCF10ACA1.1 cell lines, MDA-MB-231 cells induce
PDK4 upon detachment from matrix. But, the abundance of PDK1 is significantly higher
than all other three PDK isozyme. Also, PDK1 protein levels are upregulated when
detached from the matrix in MDA-MB-231 cells. Therefore, we have decided to examine
its role in attenuating mitochondrial oxidation and promoting anoikis resistance and

114
tumor metastasis in vivo. As expected, depletion of PDK1 in MDA-MB-231 enhances
mitochondrial PDH activity, decreases lactate levels and increases OCR both under
attached and detached culture conditions. However, this metabolic shift does not effect
the MDA-MB-231 cells under adherent conditions but markedly promotes anoikis in
detached cells. These data help explain why breast cancer cells enhance the Warburg
effect upon detachment from the matrix.
Anoikis resistance is an important step during tumor metastasis. For cancer cells
to metastasize to distant organs, they need to detach from the primary tumor site, enter
the circulatory system or lymphatic system, develop resistance to anoikis to survive
through circulation and thus invade the distant organs for secondary site. So, resistance
to detachment-induced cell death (anoikis) is a critical step for cancer cells to survive
and metastasize. Our work has demonstrated that PDK1 is a key molecule for
promoting anoikis resistance in MDA-MB-231 cells. Consistent with our in vitro data,
depletion of PDK1 in MDA-MB-231 cells markedly reduced lung tumor nodules in an in
vivo metastatic experimental assay. Altered glucose metabolism is believed to support
tumor cell proliferation and our results add new insights into the significance of the
Warburg effect in cancer metastasis, and establish PDKs as an important regulator of
anchorage-independent cell survival as well as tumor metastasis. The latter may serve
as the basis for anti-metastasis therapeutic interventions. Reprogramming tumor
metabolism, in particular inhibition of PDKs to stimulate glucose oxidation, should
sensitize cancer cells to anoikis, and hence may impede the detachment of cancer cells
from the primary site, kill circulating tumor cells, and eradicate disseminated tumor cells
at secondary sites before they re-establish conducive cell-matrix interactions.

115
Increased glucose uptake and glycolysis in cancer cells provides substrates for
macromolecular biosynthesis required for cell proliferation. This convincingly explains at
least part of the advantage provided by the Warburg effect. However, it is puzzling as to
why after the glycolytic process, the end product pyruvate in cancer cells is primarily
dispensed as lactate instead of entering the TCA cycle even under normal oxygen
tensions. This phenomenon might be attributed to the detrimental consequence of
mitochondrial oxidation. Increased glucose consumption through aerobic glycolysis by
cancer cells (for the need of biosynthesis) conceivably gives rise to increased pyruvate
production. If most pyruvate enters the mitochondrial oxidative pathway as in normal
cells, the resultant increased ROS would probably disrupt the cellular redox balance
and jeopardize cancer cells' capability to cope with stressful conditions such as loss of
matrix attachment. By shunting pyruvate away from mitochondria, the Warburg effect
helps cancer cells avoid generation of excessive ROS and resist anoikis. In this regard,
increased aerobic glycolysis also stimulates the reactions of the PPP, which is a
principal pathway to generate the reducing equivalent, NADPH. By evading production
of extra ROS and increasing antioxidant defense, the Warburg effect maintains redox
homeostasis, and thus promotes anoikis resistance and metastasis.
It is well established that under hypoxic condition, HIF1α induces PDK1 and PDK3
molecules to promote solid tumor growth and survival41,43. DCA is a potential drug
available to inhibit PDK enzyme activity by preventing the phosphorylation of PDH
enzyme. DCA is a well-studied molecule to prevent lactic acidosis in children54. Several
recent reports have demonstrated that treatment with DCA activates mitochondrial
respiration in cancer cells leading to mitochondrial membrane permeabilization, restores

116
apoptosis, kills cancer cells in vitro and shrinks tumor in rats53. Further, Michelakis and
group performed phase II clinical trials using DCA to treat glioblastoma patients132. DCA
successfully regressed the tumor with minimal side effects in all four out of five patients.
Although, DCA has been successful in treating certain cancer models, higher dosage of
DCA (>25mg/kg/day) causes peripheral neuropathy, neurotoxicity, and gait
disturbances. In addition, unlike PDK2, PDK1 and PDK4 are highly resistant to DCA133.
Therefore, inhibition of PDK1 and PDK4 requires higher amounts of DCA, which might
presumably cause severe neuropathic symptoms. Based on our work, it is evident that
PDK1 promotes anoikis resistance and tumor metastasis in breast cancer cells.
Therefore, it is critical to design additional drugs that can potentially inhibit PDK1 to
prevent both cancer growth and metastatic spreading.
Future Directions
The present study focuses mainly on understanding the role of glucose
metabolism in regulating anoikis resistance in both normal mammary epithelial cells and
metastatic breast cancer cells. We have demonstrated that upon detachment,
mammary epithelial cells simultaneously upregulate PDK to attenuate mitochondrial
oxidation and MnSOD to evade oxidative stress. This is an important strategy for normal
mammary epithelial cells to survive longer under detached conditions. Also, we have
established that metastatic breast cancer cells further enhance the Warburg effect upon
detachment from matrix by upregulating PDK1 to promote anoikis resistance and tumor
metastasis in vivo.
Based on our work, it is quite evident that detachment from matrix induces
MnSOD in MCF10A cells. Also, MnSOD has been implicated in tumor progression and
metastasis. Therefore, it is imperative to identify the molecule that activates MnSOD
117
during detachment. Several studies have reported that the nuclear factor kappa-light-
chain-enhancer of activated B cells (NFκB) is one of the potential regulators of
MnSOD134. It is well established that detachment activates NFκB, which delays
apoptosis in several cell lines135,136. So, depleting RelA (p65), an important molecule in
the NFκB pathway that induces NFκB-regulated genes is an important future direction.
We have obtained the two independent shRNA targeting p65 from Kevin Brown’s lab.
After depletion of p65 in MCF10A, we will examine the expression of MnSOD in these
cells both under attached and detached culture conditions. According to our hypothesis,
the depletion of p65 may repress the MnSOD RNA levels in detached cells but not in
adherent cells. Thus, we may be able to provide the detailed information of NFkB-
MnSOD pathway and how it regulates anoikis resistance in mammary epithelial cells.
Our data provide evidence that normal mammary epithelial cells induce PDK4
upon detachment to prevent anoikis and survive longer. Although MDA-MB-231 induced
PDK4 upon detachment, its overall abundance is trivial. Therefore, it will be quite
intriguing to examine the expression of PDK4 in different tumor cells other than breast
cancer cells. Based on Standford microarray-profiling, A549 (Lung adenocarcinoma)
and SKMEL5 (Melanoma cell line) cells show higher PDK4 expression levels. Our
preliminary experiments confirm that the expression of PDK4 at RNA level is higher in
A549 and SKMEL5 when compared with MCF10A (Figure 6-1). So, future work will
include depletion of PDK4 and perform anoikis assay to test its functional significance in
these tumor cells.
Finally, the key finding of our work is that PDK1 can be utilized as a potential drug
target for breast cancer metastasis. Thus, future work will focus on developing effective

118
drug inhibiting PDK1 activity. Additionally, since DCA is not effective in inhibiting PDK1
enzyme, it is essential to design potential inhibitors for PDK1 to prevent tumor
metastasis in vivo.

119
Figure 6-1. Expression of PDK4 in different tumor cells lines. MCF10A, A549 and
SKMEL5 cells were grown in 35 mm plates under attached condition for 24 hrs. After 24 hrs of incubation, the cells were collected to extract RNA by Trizol reagent. 2 μg of RNA was used for cDNA synthesis. 1 μL of cDNA was used from each sample to run quantitative RT-PCR. The relative PDK4 RNAL levels were normalized to β-actin. After normalization, the fold induction of PDK4 expression in MCF10A was set to one. The fold induction of PDK4 in A549 and SKMEL5 cells were compared to PDK expression in MCF10A. These data represent n=3. A549= lung adenocarcinoma cells, and SKMEL5= melanoma cells.

120
LIST OF REFERENCES
1 Frisch, S. M. & Francis, H. Disruption of epithelial cell-matrix interactions induces apoptosis. Journal of Cell Biology 124, 619-626, doi:10.1083/jcb.124.4.619 (1994).
2 Chiarugi, P. & Giannoni, E. Anoikis: A necessary death program for anchorage-dependent cells. Biochemical Pharmacology 76, 1352-1364, doi:10.1016/j.bcp.2008.07.023 (2008).
3 Gilmore, A. P. Anoikis. Cell Death and Differentiation 12, 1473-1477, doi:10.1038/sj.cdd.4401723 (2005).
4 Frisch, S. M. & Screaton, R. A. Anoikis mechanisms. Current Opinion in Cell Biology 13, 555-562, doi:10.1016/s0955-0674(00)00251-9 (2001).
5 Reginato, M. J. et al. Integrins and EGFR coordinately regulate the pro-apoptotic protein Bim to prevent anoikis. Nature Cell Biology 5, 733-740, doi:10.1038/ncb1026 (2003).
6 Parsons, J. T. Focal adhesion kinase: the first ten years. Journal of Cell Science 116, 1409-1416, doi:10.1242/jcs.00373 (2003).
7 Frisch, S. M. Evidence for a function of death-receptor-related, death-domain-containing proteins in anoikis. Current Biology 9, 1047-1049, doi:10.1016/s0960-9822(99)80455-2 (1999).
8 Rytomaa, M., Martins, L. M. & Downward, J. Involvement of FADD and caspase-8 signalling in detachment-induced apoptosis. Current Biology 9, 1043-1046, doi:10.1016/s0960-9822(99)80454-0 (1999).
9 Puthalakath, H. et al. Bmf: A proapoptotic BH3-only protein regulated by interaction with the myosin V actin motor complex, activated by anoikis. Science 293, 1829-1832, doi:10.1126/science.1062257 (2001).
10 Schmelzle, T. et al. Functional role and oncogene-regulated expression of the BH3-only factor Bmf in mammary epithelial anoikis and morphogenesis. Proceedings of the National Academy of Sciences of the United States of America 104, 3787-3792, doi:10.1073/pnas.0700115104 (2007).
11 Hausmann, M. et al. BCL-2 modifying factor (BMF) is a central regulator of anoikis in human intestinal epithelial Cells. Journal of Biological Chemistry 286, 26533-26540, doi:10.1074/jbc.M111.265322 (2011).
12 Idogawa, M., Adachi, M., Minami, T., Yasui, H. & Imai, K. Overexpression of bad preferentially augments anoikis. International Journal of Cancer 107, 215-223, doi:10.1002/ijc.11399 (2003).
121
13 Gilley, J., Coffer, P. J. & Ham, J. FOXO transcription factors directly activate bim gene expression and promote apoptosis in sympathetic neurons. Journal of Cell Biology 162, 613-622, doi:10.1083/jcb.200303026 (2003).
14 Ley, R. et al. Extracellular signal-regulated kinases 1/2 are serum-stimulated "Bim(EL) kinases" that bind to the BH3-only protein Bim(EL) causing its phosphorylation and turnover. Journal of Biological Chemistry 279, 8837-8847, doi:10.1074/jbc.M311578200 (2004).
15 Reginato, M. J. et al. Bim regulation of lumen formation in cultured mammary epithelial acini is targeted by oncogenes. Molecular and Cellular Biology 25, 4591-4601, doi:10.1128/mcb.25.11.4591-4601.2005 (2005).
16 Whelan, K. A. et al. Hypoxia Suppression of Bim and Bmf Blocks Anoikis and Luminal Clearing during Mammary Morphogenesis. Molecular Biology of the Cell 21, 3829-3837, doi:10.1091/mbc.E10-04-0353 (2010).
17 Valentijn, A. J., Zouq, N. & Gilmore, A. P. Anoikis. Biochemical Society Transactions 32, 421-425, doi:10.1042/bst0320421 (2004).
18 Valentijn, A. J. & Gilmore, A. P. Translocation of full-length bid to mitochondria during anoikis. Journal of Biological Chemistry 279, 32848-32857, doi:10.1074/jbc.M313375200 (2004).
19 Ilic, D. et al. Extracellular matrix survival signals transduced by focal adhesion kinase suppress p53-mediated apoptosis. Journal of Cell Biology 143, 547-560 (1998).
20 Vitale, M. et al. Apoptosis induced by denied adhesion to extracellular matrix (anoikis) in thyroid epithelial cells is p53 dependent but fails to correlate with modulation of p53 expression. Febs Letters 462, 57-60, doi:10.1016/s0014-5793(99)01512-4 (1999).
21 Stromblad, S., Becker, J. C., Yebra, M., Brooks, P. C. & Cheresh, D. A. Suppression of p53 activity and p21(WAF1/CIP1) expression by vascular cell integrin alpha v beta 3 during angiogenesis. Journal of Clinical Investigation 98, 426-433, doi:10.1172/jci118808 (1996).
22 Lu, Y. L. et al. The PTEN/MMAC1/TEP tumor suppressor gene decreases cell growth and induces apoptosis and anoikis in breast cancer cells. Oncogene 18, 7034-7045, doi:10.1038/sj.onc.1203183 (1999).
23 Simpson, C. D., Anyiwe, K. & Schimmer, A. D. Anoikis resistance and tumor metastasis. Cancer Letters 272, 177-185, doi:10.1016/j.canlet.2008.05.029 (2008).
24 Liotta, L. A. & Kohn, E. C. The microenvironment of the tumour-host interface. Nature 411, 375-379, doi:10.1038/35077241 (2001).

122
25 Lopez, D., Niu, G., Huber, P. & Carter, W. B. Tumor-induced upregulation of Twist, Snail, and Slug represses the activity of the human VE-cadherin promoter. Archives of Biochemistry and Biophysics 482, 77-82, doi:10.1016/j.abb.2008.11.016 (2009).
26 Haenssen, K. K. et al. ErbB2 requires integrin alpha 5 for anoikis resistance via Src regulation of receptor activity in human mammary epithelial cells. Journal of Cell Science 123, 1373-1382, doi:10.1242/jcs.050906 (2010).
27 Giannoni, E. et al. Redox regulation of anoikis: reactive oxygen species as essential mediators of cell survival. Cell Death and Differentiation 15, 867-878, doi:10.1038/cdd.2008.3 (2008).
28 Liu, Z. P. et al. Oncogenic Ras inhibits anoikis of intestinal epithelial cells by preventing the release of a mitochondrial pro-apoptotic protein Omi/HtrA2 into the cytoplasm. Journal of Biological Chemistry 281, 14738-14747, doi:10.1074/jbc.M508664200 (2006).
29 Pouyssegur, J., Dayan, F. & Mazure, N. M. Hypoxia signalling in cancer and approaches to enforce tumour regression. Nature 441, 437-443, doi:10.1038/nature04871 (2006).
30 Markert, C. L., Shaklee, J. B. & Whitt, G. S. Evolution of a gene. Science 189, 102-114, doi:10.1126/science.1138367 (1975).
31 Thornburg, J. M. et al. Targeting aspartate aminotransferase in breast cancer. Breast Cancer Research 10, doi:R8410.1186/bcr2154 (2008).
32 Giatromanolaki, A. et al. Lactate dehydrogenase 5 expression in non-Hodgkin B-cell lymphomas is associated with hypoxia regulated proteins. Leukemia & Lymphoma 49, 2181-2186, doi:10.1080/10428190802450629 (2008).
33 Sugden, M. C. & Holness, M. J. Mechanisms underlying regulation of the expression and activities of the mammalian pyruvate dehydrogenase kinases. Archives of Physiology and Biochemistry 112, 139-149, doi:10.1080/13813450600935263 (2006).
34 Gudi, R., Bowkerkinley, M. M., Kedishvili, N. Y., Zhao, Y. & Popov, K. M. Diversity of the pyruvate-dehydrogenase kinase gene family in humans. Journal of Biological Chemistry 270, 28989-28994 (1995).
35 Huang, B. L., Wu, P. F., Popov, K. M. & Harris, R. A. Starvation and diabetes reduce the amount of pyruvate dehydrogenase phosphatase in rat heart and kidney. Diabetes 52, 1371-1376, doi:10.2337/diabetes.52.6.1371 (2003).
36 Baker, J. C., Yan, X. H., Peng, T., Kasten, S. & Roche, T. E. Marked differences between two isoforms of human pyruvate dehydrogenase kinase. Journal of Biological Chemistry 275, 15773-15781, doi:10.1074/jbc.M909488199 (2000).
123
37 Roche, T. E. & Hiromasa, Y. Pyruvate dehydrogenase kinase regulatory mechanisms and inhibition in treating diabetes, heart ischemia, and cancer. Cellular and Molecular Life Sciences 64, 830-849, doi:10.1007/s00018-007-6380-z (2007).
38 Hiromasa, Y. & Roche, T. E. Facilitated interaction between the pyruvate dehydrogenase kinase isoform 2 and the dihydrolipoyl acetyltransferase. Journal of Biological Chemistry 278, 33681-33693, doi:10.1074/jbc.M212733200 (2003).
39 Bowker-Kinley, M. M., Davis, W. I., Wu, P. F., Harris, R. A. & Popov, K. M. Evidence for existence of tissue-specific regulation of the mammalian pyruvate dehydrogenase complex. Biochemical Journal 329, 191-196 (1998).
40 Korotchkina, L. G. & Patel, M. S. Site specificity of four pyruvate dehydrogenase kinase isoenzymes toward the three phosphorylation sites of human pyruvate dehydrogenase. Journal of Biological Chemistry 276, 37223-37229, doi:10.1074/jbc.M103069200 (2001).
41 Papandreou, I., Cairns, R. A., Fontana, L., Lim, A. L. & Denko, N. C. HIF-1 mediates adaptation to hypoxia by actively downregulating mitochondrial oxygen consumption. Cell Metabolism 3, 187-197, doi:10.1016/j.cmet.2006.01.012 (2006).
42 Kim, J. W., Tchernyshyov, I., Semenza, G. L. & Dang, C. V. HIF-1-mediated expression of pyruvate dehydrogenase kinase: A metabolic switch required for cellular adaptation to hypoxia. Cell Metabolism 3, 177-185, doi:10.1016/j.cmet.2006.02.002 (2006).
43 Lu, C.-W., Lin, S.-C., Chen, K.-F., Lai, Y.-Y. & Tsai, S.-J. Induction of pyruvate dehydrogenase kinase-3 by hypoxia-inducible factor-1 promotes metabolic switch and drug resistance. Journal of Biological Chemistry 283, 28106-28114, doi:10.1074/jbc.M803508200 (2008).
44 Lu, C.-W. et al. Overexpression of pyruvate dehydrogenase kinase 3 increases drug resistance and early recurrence in colon cancer. The American journal of pathology 179, 1405-1414 (2011).
45 Sugden, M. C., Orfali, K. A., Fryer, L. G. D., Holness, M. J. & Priestman, D. A. Molecular mechanisms underlying the long-term impact of dietary fat to increase cardiac pyruvate dehydrogenase kinase: Regulation by insulin, cyclic AMP and pyruvate. Journal of Molecular and Cellular Cardiology 29, 1867-1875, doi:10.1006/jmcc.1997.0425 (1997).
46 Harris, R. A., Huang, B. L. & Wu, P. F. Control of pyruvate dehydrogenase kinase gene expression. Advances in Enzyme Regulation, Vol 41 41, 269-288, doi:10.1016/s0065-2571(00)00020-0 (2001).
124
47 Ma, K., Zhang, Y., Elam, M. B., Cook, G. A. & Park, E. A. Cloning of the rat pyruvate dehydrogenase kinase 4 gene promoter - Activation of pyruvate dehydrogenase kinase 4 by the peroxisome proliferator-activated receptor gamma coactivator. Journal of Biological Chemistry 280, 29525-29532, doi:10.1074/jbc.M502236200 (2005).
48 Zhang, Y. et al. Estrogen-related receptors stimulate pyruvate dehydrogenase kinase isoform 4 gene expression. Journal of Biological Chemistry 281, 39897-39906, doi:10.1074/jbc.M608657200 (2006).
49 Wu, P. F., Peters, J. M. & Harris, R. A. Adaptive increase in pyruvate dehydrogenase kinase 4 during starvation is mediated by peroxisome proliferator-activated receptor alpha. Biochemical and Biophysical Research Communications 287, 391-396, doi:10.1006/bbrc.2001.5608 (2001).
50 Attia, R. R. et al. Regulation of Pyruvate Dehydrogenase Kinase 4 (PDK4) by Thyroid Hormone role of the peroxisome proliferator-activated receptor gamma COACTIVATOR (PGC-1 alpha). Journal of Biological Chemistry 285, 2375-2385, doi:10.1074/jbc.M109.039081 (2010).
51 Attia, R. R. et al. Regulation of Pyruvate Dehydrogenase Kinase 4 (PDK4) by CCAAT/Enhancer-binding Protein beta (C/EBP beta). Journal of Biological Chemistry 286, 23799-23807, doi:10.1074/jbc.M111.246389 (2011).
52 Mayers, R. M. et al. AZD7545, a novel inhibitor of pyruvate dehydrogenase kinase 2 (PDHK2), activates pyruvate dehydrogenase in vivo and improves blood glucose control in obese (fa/fa) Zucker rats. Biochemical Society Transactions 31, 1165-1167 (2003).
53 Bonnet, S. et al. A mitochondria-K+ channel axis is suppressed in cancer and its normalization promotes apoptosis and inhibits cancer growth. Cancer Cell 11, 37-51, doi:10.1016/j.ccr.2006.10.020 (2007).
54 Stacpoole, P. W. et al. Controlled clinical trial of dichloroacetate for treatment of congenital lactic acidosis in children. Pediatrics 117, 1519-1531, doi:10.1542/peds.2005-1226 (2006).
55 Kato, M., Li, J., Chuang, J. L. & Chuang, D. T. Distinct structural mechanisms for inhibition of pyruvate dehydrogenase kinase isoforms by AZD7545, dichloroacetate, and radicicol. Structure 15, 992-1004, doi:10.1016/j.str.2007.07.001 (2007).
56 Turrens, J. F. Mitochondrial formation of reactive oxygen species. Journal of Physiology-London 552, 335-344, doi:10.1111/j.1469-7793.2003.00335.x (2003).

125
57 Stowe, D. F. & Camara, A. K. S. Mitochondrial Reactive Oxygen Species Production in Excitable Cells: Modulators of Mitochondrial and Cell Function. Antioxidants & Redox Signaling 11, 1373-1414, doi:10.1089/ars.2008.2331 (2009).
58 Rush, J. D., Maskos, Z. & Koppenol, W. H. Distinction between hyroxyl radical and ferryl species. Methods in Enzymology 186, 148-156 (1990).
59 Gao, S. J. et al. Docking of endothelial nitric oxide synthase (eNOS) to the mitochondrial outer membrane - A pentabasic amino acid sequence in the autoinhibitory domain of eNOS targets a proteinase K-cleavable peptide on the cytoplasmic face of mitochondria. Journal of Biological Chemistry 279, 15968-15974, doi:10.1074/jbc.M308504200 (2004).
60 Droge, W. Free radicals in the physiological control of cell function. Physiological Reviews 82, 47-95 (2002).
61 Trachootham, D., Alexandre, J. & Huang, P. Targeting cancer cells by ROS-mediated mechanisms: a radical therapeutic approach? Nature Reviews Drug Discovery 8, 579-591, doi:10.1038/nrd2803 (2009).
62 Thannickal, V. J. & Fanburg, B. L. Reactive oxygen species in cell signaling. American Journal of Physiology-Lung Cellular and Molecular Physiology 279, L1005-L1028 (2000).
63 Tolbert, N. E. & Essner, E. Microbodies-peroxisomes and glyoxysomes. Journal of Cell Biology 91, S271-S283, doi:10.1083/jcb.91.3.271s (1981).
64 Babior, B. M. NADPH oxidase: An update. Blood 93, 1464-1476 (1999).
65 Giannoni, E., Fiaschi, T., Ramponi, G. & Chiarugi, P. Redox regulation of anoikis resistance of metastatic prostate cancer cells: key role for Src and EGFR-mediated pro-survival signals. Oncogene 28, 2074-2086, doi:10.1038/onc.2009.77 (2009).
66 Young, C. D. & Anderson, S. M. Rah, rah, ROS: metabolic changes caused by loss of adhesion induce cell death. Breast Cancer Research 11, doi:30710.1186/bcr2417 (2009).
67 Li, A. E. et al. A role for reactive oxygen species in endothelial cell anoikis. Circulation Research 85, 304-310 (1999).
68 Schafer, Z. T. et al. Antioxidant and oncogene rescue of metabolic defects caused by loss of matrix attachment. Nature 461, 109-U118, doi:10.1038/nature08268 (2009).

126
69 Lam, C. R. I. et al. TAK1 regulates SCF expression to modulate PKB alpha activity that protects keratinocytes from ROS-induced apoptosis. Cell Death and Differentiation 18, 1120-1129, doi:10.1038/cdd.2010.182 (2011).
70 Hanahan, D. & Weinberg, R. A. Hallmarks of Cancer: The Next Generation. Cell 144, 646-674, doi:10.1016/j.cell.2011.02.013 (2011).
71 Warburg, O. Origin of cancer cells. Science 123, 309-314, doi:10.1126/science.123.3191.309 (1956).
72 Vander Heiden, M. G., Cantley, L. C. & Thompson, C. B. Understanding the Warburg effect: the metabolic requirements of cell proliferation. Science (New York, N.Y.) 324, 1029-1033 (2009).
73 Fantin, V. R., St-Pierre, J. & Leder, P. Attenuation of LDH-A expression uncovers a link between glycolysis, mitochondrial physiology, and tumor maintenance. Cancer Cell 9, 425-434, doi:10.1016/j.ccr.2006.04.023 (2006).
74 Moreno-Sanchez, R., Rodriguez-Enriquez, S., Marin-Hernandez, A. & Saavedra, E. Energy metabolism in tumor cells. Febs Journal 274, 1393-1418, doi:10.1111/j.1742-4658.2007.05686.x (2007).
75 Gillies, R. J., Robey, I. & Gatenby, R. A. Causes and consequences of increased glucose metabolism of cancers. Journal of Nuclear Medicine 49, 24S-42S, doi:10.2967/jnumed.107.047258 (2008).
76 Bartrons, R. & Caro, J. Hypoxia, glucose metabolism and the Warburg's effect. Journal of Bioenergetics and Biomembranes 39, 223-229, doi:10.1007/s10863-007-9080-3 (2007).
77 Boros, L. G. et al. Oxythiamine and dehydroepiandrosterone inhibit the nonoxidative synthesis of ribose and tumor cell proliferation. Cancer Research 57, 4242-4248 (1997).
78 Cairns, R. A., Harris, I. S. & Mak, T. W. Regulation of cancer cell metabolism. Nature Reviews Cancer 11, 85-95, doi:10.1038/nrc2981 (2011).
79 McFate, T. et al. Pyruvate dehydrogenase complex activity controls metabolic and malignant phenotype in cancer cells. Journal of Biological Chemistry 283, 22700-22708, doi:10.1074/jbc.M801765200 (2008).
80 Koppenol, W. H., Bounds, P. L. & Dang, C. V. Otto Warburg's contributions to current concepts of cancer metabolism. Nature Reviews Cancer 11, 325-337, doi:10.1038/nrc3038 (2011).
81 Flier, J. S., Mueckler, M. M., Usher, P. & Lodish, H. F. Elevated levels of glucose-transport and transporter messenger-RNA are induced by ras or src oncogenes. Science 235, 1492-1495, doi:10.1126/science.3103217 (1987).
127
82 Shim, H. et al. c-Myc transactivation of LDH-A: Implications for tumor metabolism and growth. Proceedings of the National Academy of Sciences of the United States of America 94, 6658-6663, doi:10.1073/pnas.94.13.6658 (1997).
83 Dang, C. V. c-myc target genes involved in cell growth, apoptosis, and metabolism. Molecular and Cellular Biology 19, 1-11 (1999).
84 David, C. J., Chen, M., Assanah, M., Canoll, P. & Manley, J. L. HnRNP proteins controlled by c-Myc deregulate pyruvate kinase mRNA splicing in cancer. Nature 463, 364-U114, doi:10.1038/nature08697 (2010).
85 Robey, R. B. & Hay, N. Is Akt the "Warburg kinase"?-Akt-energy metabolism interactions and oncogenesis. Seminars in Cancer Biology 19, 25-31, doi:10.1016/j.semcancer.2008.11.010 (2009).
86 Zundel, W. et al. Loss of PTEN facilitates HIF-1-mediated gene expression. Genes & Development 14, 391-396 (2000).
87 Bensaad, K. et al. TIGAR, a p53-inducible regulator of glycolysis and apoptosis. Cell 126, 107-120, doi:10.1016/j.cell.2006.05.036 (2006).
88 Pollard, P. J. et al. Accumulation of Krebs cycle intermediates and over-expression of HIF1 alpha in tumours which result from germline FH and SDH mutations. Human Molecular Genetics 14, 2231-2239, doi:10.1093/hmg/ddi227 (2005).
89 Porcelli, A. M. et al. The genetic and metabolic signature of oncocytic transformation implicates HIF1 alpha destabilization. Human Molecular Genetics 19, 1019-1032, doi:10.1093/hmg/ddp566 (2010).
90 Reitman, Z. J., Parsons, D. W. & Yan, H. IDH1 and IDH2: not your typical oncogenes. Cancer Cell 17, 215-216, doi:10.1016/j.ccr.2010.02.024 (2010).
91 Gross, S. et al. Cancer-associated metabolite 2-hydroxyglutarate accumulates in acute myelogenous leukemia with isocitrate dehydrogenase 1 and 2 mutations. Journal of Experimental Medicine 207, 339-344, doi:10.1084/jem.20092506 (2010).
92 Altekruse, S. F., McGlynn, K. A. & Reichman, M. E. Hepatocellular Carcinoma Incidence, Mortality, and Survival Trends in the United States From 1975 to 2005. Journal of Clinical Oncology 27, 1485-1491, doi:10.1200/jco.2008.20.7753 (2009).
93 Degenhardt, T. et al. Three members of the human pyruvate dehydrogenase kinase gene family are direct targets of the peroxisome proliferator-activated receptor beta/delta. Journal of Molecular Biology 372, 341-355, doi:10.1016/j.jmb.2007.06.091 (2007).

128
94 Edinger, A. L. & Thompson, C. B. Death by design: apoptosis, necrosis and autophagy. Current Opinion in Cell Biology 16, 663-669, doi:10.1016/j.ceb.2004.09.011 (2004).
95 Alves, N. L. et al. The Noxa/Mcl-1 axis regulates susceptibility to apoptosis under glucose limitation in dividing T cells. Immunity 24, 703-716, doi:10.1016/j.immuni.2006.03.018 (2006).
96 Chi, M. M. Y., Pingsterhaus, J., Carayannopoulos, M. & Moley, K. H. Decreased glucose transporter expression triggers BAX-dependent apoptosis in the murine blastocyst. Journal of Biological Chemistry 275, 40252-40257, doi:10.1074/jbc.M005508200 (2000).
97 Vander Heiden, M. G. et al. Growth factors can influence cell growth and survival through effects on glucose metabolism. Molecular and Cellular Biology 21, 5899-5912, doi:10.1128/mcb.21.17.5899-5912.2001 (2001).
98 Zhao, Y., Wieman, H. L., Jacobs, S. R. & Rathmell, J. C. Mechanisms and methods in glucose metabolism and cell death. Programmed Cell Death, General Principles for Studying Cell Death, Pt A 442, 439-457, doi:10.1016/s0076-0879(08)01422-5 (2008).
99 Patel, M. S. & Korotchkina, L. G. Regulation of the pyruvate dehydrogenase complex. Biochemical Society Transactions 34, 217-222 (2006).
100 Wende, A. R., Huss, J. M., Schaeffer, P. J., Giguere, V. & Kelly, D. P. PGC-1 alpha coactivates PDK4 gene expression via the orphan nuclear receptor ERR alpha: a mechanism for transcriptional control of muscle glucose metabolism. Molecular and Cellular Biology 25, 10684-10694, doi:10.1128/mcb.25.24.10684-10694.2005 (2005).
101 Araki, M. & Motojima, K. Identification of ERR alpha as a specific partner of PGC-1 alpha for the activation of PDK4 gene expression in muscle. Febs Journal 273, 1669-1680, doi:10.1111/j.1742-4658.2006.05183.x (2006).
102 Dufour, C. R. et al. Genome-wide orchestration of cardiac functions by the orphan nuclear receptors ERR alpha and gamma. Cell Metabolism 5, 345-356, doi:10.1016/j.cmet.2007.03.007 (2007).
103 Giguere, V. Transcriptional Control of Energy Homeostasis by the Estrogen-Related Receptors. Endocrine Reviews 29, 677-696, doi:10.1210/er.2008-0017 (2008).
104 Eichner, L. J. & Giguere, V. Estrogen related receptors (ERRs): A new dawn in transcriptional control of mitochondrial gene networks. Mitochondrion 11, 544-552, doi:10.1016/j.mito.2011.03.121 (2011).
129
105 Carroll, V. A. & Ashcroft, M. Targeting the molecular basis for tumour hypoxia. Expert Reviews in Molecular Medicine 7, 1-16, doi:10.1017/s1462399405009117 (2005).
106 Sullivan, R. & Graham, C. H. Hypoxia-driven selection of the metastatic phenotype. Cancer and Metastasis Reviews 26, 319-331, doi:10.1007/s10555-007-9062-2 (2007).
107 Santner, S. J. et al. Malignant MCF10CA1 cell lines derived from premalignant human breast epithelial MCF10AT cells. Breast Cancer Research and Treatment 65, 101-110, doi:10.1023/a:1006461422273 (2001).
108 Gatenby, R. A. & Gillies, R. J. Why do cancers have high aerobic glycolysis? Nature Reviews Cancer 4, 891-899, doi:10.1038/nrc1478 (2004).
109 Addabbo, F., Montagnani, M. & Goligorsky, M. S. Mitochondria and Reactive Oxygen Species. Hypertension 53, 885-892, doi:10.1161/hypertensionaha.109.130054 (2009).
110 Chen, Y., Azad, M. B. & Gibson, S. B. Superoxide is the major reactive oxygen species regulating autophagy. Cell Death and Differentiation 16, 1040-1052, doi:10.1038/cdd.2009.49 (2009).
111 Kahl, R., Kampkotter, A., Watjen, W. & Chovolou, Y. Antioxidant enzymes and apoptosis. Drug Metabolism Reviews 36, 747-762, doi:10.1081/dmr-200033488 (2004).
112 Kinnula, V. L. & Crapo, J. D. Superoxide dismutases in the lung and human lung diseases. American Journal of Respiratory and Critical Care Medicine 167, 1600-1619, doi:10.1164/rccm.200212-1479SO (2003).
113 Mates, J. M. Effects of antioxidant enzymes in the molecular control of reactive oxygen species toxicology. Toxicology 153, 83-104 (2000).
114 Mohr, A., Bueneker, C., Gough, R. P. & Zwacka, R. M. MnSOD protects colorectal cancer cells from TRAIL-induced apoptosis by inhibition of Smac/DIABLO release. Oncogene 27, 763-774, doi:10.1038/sj.onc.1210673 (2008).
115 Kiningham, K. K., Oberley, T. D., Lin, S. M., Mattingly, C. A. & St Clair, D. K. Overexpression of manganese superoxide dismutase protects against mitochondrial-initiated poly(ADP-ribose) polymerase-mediated cell death. Faseb Journal 13, 1601-1610 (1999).
116 Li, Y. B. et al. Dilated cardiomyopathy and neonatal lethality in mutant mice lacking manganese superoxide-dismutase. Nature Genetics 11, 376-381, doi:10.1038/ng1295-376 (1995).

130
117 Lebovitz, R. M. et al. Neurodegeneration, myocardial injury, and perinatal death in mitochondrial superoxide dismutase-deficient mice. Proceedings of the National Academy of Sciences of the United States of America 93, 9782-9787, doi:10.1073/pnas.93.18.9782 (1996).
118 Van Remmen, H. et al. Life-long reduction in MnSOD activity results in increased DNA damage and higher incidence of cancer but does not accelerate aging. Physiological Genomics 16, 29-37, doi:10.1152/physiolgenomics.00122.2003 (2003).
119 Church, S. L. et al. Increased manganese superoxide-dismutase expression suppresses the malignant phenotype of human-melanoma cells. Proceedings of the National Academy of Sciences of the United States of America 90, 3113-3117, doi:10.1073/pnas.90.7.3113 (1993).
120 Cullen, J. J. et al. Dicumarol inhibition of NADPH: Quinone oxidoreductase induces growth inhibition of pancreatic cancer via a superoxide-mediated mechanism. Cancer Research 63, 5513-5520 (2003).
121 Malafa, M., Margenthaler, J., Webb, B., Neitzel, L. & Christophersen, M. MnSOD expression is increased in metastatic gastric cancer. Journal of Surgical Research 88, 130-134, doi:10.1006/jsre.1999.5773 (2000).
122 Janssen, A. M. L. et al. Superoxide dismutases in gastric and esophageal cancer and the prognostic impact in gastric cancer. Clinical Cancer Research 6, 3183-3192 (2000).
123 Kattan, Z., Minig, V., Leroy, P., Dauca, M. & Becuwe, P. Role of manganese superoxide dismutase on growth and invasive properties of human estrogen-independent breast cancer cells. Breast Cancer Research and Treatment 108, 203-215, doi:10.1007/s10549-007-9597-5 (2008).
124 Weinberg, F. & Chandel, N. S. Reactive oxygen species-dependent signaling regulates cancer. Cellular and Molecular Life Sciences 66, 3663-3673, doi:10.1007/s00018-009-0099-y (2009).
125 Saitoh, M. et al. Mammalian thioredoxin is a direct inhibitor of apoptosis signal-regulating kinase (ASK) 1. Embo Journal 17, 2596-2606, doi:10.1093/emboj/17.9.2596 (1998).
126 Knebel, A., Rahmsdorf, H. J., Ullrich, A. & Herrlich, P. Dephosphorylation of receptor tyrosine kinases as target of regulation by radiation, oxidants or alkylating agents. Embo Journal 15, 5314-5325 (1996).
127 Sachsenmaier, C. et al. Involvement of growth-factor receptors in the mammalian UVC response. Cell 78, 963-972, doi:10.1016/0092-8674(94)90272-0 (1994).

131
128 Vercesi, A. E., Kowaltowski, A. J., Grijalba, M. T., Meinicke, A. R. & Castilho, R. F. The role of reactive oxygen species in mitochondrial permeability transition. Bioscience Reports 17, 43-52, doi:10.1023/a:1027335217774 (1997).
129 Orrenius, S., Gogvadze, V. & Zhivotovsky, B. Mitochondrial oxidative stress: Implications for cell death. Annual Review of Pharmacology and Toxicology 47, 143-183, doi:10.1146/annurev.pharmtox.47.120505.105122 (2007).
130 Vaughn, A. E. & Deshmukh, M. Glucose metabolism inhibits apoptosis in neurons and cancer cells by redox inactivation of cytochrome c. Nature Cell Biology 10, 1477-U1228, doi:10.1038/ncb1807 (2008).
131 Grassian, A. R., Metallo, C. M., Coloff, J. L., Stephanopoulos, G. & Brugge, J. S. Erk regulation of pyruvate dehydrogenase flux through PDK4 modulates cell proliferation. Genes & Development 25, 1716-1733, doi:10.1101/gad.16771811 (2011).
132 Michelakis, E. D. et al. Metabolic Modulation of Glioblastoma with Dichloroacetate. Science Translational Medicine 2, doi:31ra3410.1126/scitranslmed.3000677 (2010).
133 Whitehou.S, Cooper, R. H. & Randle, P. J. Mechanism of activation of pyruvate-dehydrogenase by dichloroacetate and other halogenated carboxylic -acids. Biochemical Journal 141, 761-774 (1974).
134 Morgan, M. J. & Liu, Z.-g. Crosstalk of reactive oxygen species and NF-kappa B signaling. Cell Research 21, 103-115, doi:10.1038/cr.2010.178 (2011).
135 Yan, S. R. et al. Activation of NF-kappa B following detachment delays apoptosis in intestinal epithelial cells. Oncogene 24, 6482-6491, doi:10.1038/sj.onc.1208810 (2005).
136 Lin, D.-C. et al. PLK1 Is Transcriptionally Activated by NF-kappa B during Cell Detachment and Enhances Anoikis Resistance through Inhibiting beta-Catenin Degradation in Esophageal Squamous Cell Carcinoma. Clinical Cancer Research 17, 4285-4295, doi:10.1158/1078-0432.ccr-10-3236 (2011).

132
BIOGRAPHICAL SKETCH
Sushama Kamarajugadda was born and brought up in India. She graduated from Holy
Mary Girls High School. Her undergraduate degree was in agricultural sciences at
Acharya N.G. Ranga Agricultural University. After completion of her bachelor’s degree,
Sushama Kamarajugadda moved to United States to pursue higher education. In the fall
of 2004, she was admitted into master’s program in the department of molecular biology
& microbiology at University of Central Florida, Orlando. In the summer of 2004, she
joined Dr. Henry Daniell’s laboratory to conduct her thesis research on the development
of malaria vaccine in transgenic plants using chloroplast transformation technique.
During her master’s program, she also taught microbiology and immunology laboratory
courses for undergraduate students. She graduated from her master’s degree in the
summer, 2006. In the fall of 2006, Sushama Kamarajugadda was admitted into the
interdisciplinary program (IDP) in biomedical sciences at the College of Medicine at the
University of Florida. She joined Jianrong Lu’s lab to conduct her doctoral research
project. She worked on breast cancer and her main focus was to understand the role of
glucose metabolism in promoting anoikis resistance and tumor metastasis.