
To My Lovely Wife - wfrec.ifas.ufl.edu · role of nitrogen and clipping-return on turf growth and...
68
ROLE OF NITROGEN AND CLIPPING-RETURN ON TURF GROWTH AND NITRATE LEACHING IN ZOYSIAGRASS (Zoysia japonica Steud.) By JINYONG BAE A THESIS PRESENTED TO THE GRADUATE SCHOOL OF THE UNIVERSITY OF FLORIDA IN PARTIAL FULFILLMENT OF THE REQUIREMENTS FOR THE DEGREE OF MASTER OF SCIENCE UNIVERSITY OF FLORIDA 2009 1
Transcript of To My Lovely Wife - wfrec.ifas.ufl.edu · role of nitrogen and clipping-return on turf growth and...
ROLE OF NITROGEN AND CLIPPING-RETURN ON TURF GROWTH AND NITRATE LEACHING IN ZOYSIAGRASS (Zoysia japonica Steud.)
By
JINYONG BAE
A THESIS PRESENTED TO THE GRADUATE SCHOOL OF THE UNIVERSITY OF FLORIDA IN PARTIAL FULFILLMENT
OF THE REQUIREMENTS FOR THE DEGREE OF MASTER OF SCIENCE
UNIVERSITY OF FLORIDA
2009
1

© 2009 Jinyong Bae
2

To My Lovely Wife
3

ACKNOWLEDGMENTS
I express my gratitude to Dr. Laurie E. Trenholm (chair of my supervisory committee) for
her excellent guidance, time and support. Her assistance during the course of my graduate work
gave me the opportunity to reach my goal. I would like to thank my committee members, Dr.
Jerry Sartain and Dr. Jason Deffman-Kruse for their advice, support, and inspiration. I also
would like to acknowledge Florida Department of Environmental Protection (FDEP) for funding
of this research. I appreciate the support and comments of Dr. Robert McGovern, the director of
Doctor of Plant Medicine (DPM) program, who allowed me to pursue dual degree, DPM and
Masters. I would like to thank Basil Wetherington for technical support of my study and for his
valuable suggestions. I am grateful to Tommy Deberry, Ronald Castillo, Amy Cai and Shweta
Sharma for their help in my research. I am deeply grateful to my parents (Mr. Bae, Duk-Chul and
Mrs. Yoon, Jung-Hee) and my parents-in-law (Mr. Jung, Jong-Chul and Mrs. Kim, Kyung-Soon)
for their love and moral support. I thank my wife, Kyung-Hee Jung, for her love,
encouragement and patience, and would like to express deep love to my lovely sons (Terang and
Da-Ul). Finally, I would like to give thanks to God who has guided me with His goodness and
love.
4

TABLE OF CONTENTS page
ACKNOWLEDGMENTS ...............................................................................................................4
LIST OF TABLES...........................................................................................................................7
LIST OF FIGURES .........................................................................................................................8
ABSTRACT.....................................................................................................................................9
CHAPTER
1. INTRODUCTION .....................................................................................................................11
Nitrogen Physiology in Turf ...................................................................................................11 Water and Nitrogen Leaching.................................................................................................12 Empire Zoysiagrass ................................................................................................................15 Clipping Management ............................................................................................................15 MultiSpectral Reflectance (MSR) ..........................................................................................19
2. MATERIALS AND METHODS...............................................................................................21
3. EFFECT OF CLIPPING MANAGEMENT ON NITRATE LEACHING AND TURF QUALITY AND GROWTH IN EMPIRE ZOYSIAGRASS.................................................25
Introduction.............................................................................................................................25 Materials and Methods ...........................................................................................................27 Results and Discussion ...........................................................................................................30
Nitrate Leaching ..............................................................................................................30 Shoot and Root Growth ...................................................................................................34 Tissue N concentration ....................................................................................................34 Visual Quality and Color.................................................................................................35 Chlorophyll Content (CC) ...............................................................................................36 Correlation between N rate vs. CM vs. Quality vs. Color vs. Chlorophyll Level vs.
NO3-N leaching vs. Shoot Growth...............................................................................36 Conclusions.............................................................................................................................36
4. EFFECT OF MULTISPECTRAL REFLECTANCE AND CORRELATION of QUALITY AND LEACHING IN EMPIRE ZOYSIAGRASS..............................................51
Introduction.............................................................................................................................51 Materials and Methods ...........................................................................................................53 Results and Discussion ...........................................................................................................55
MultiSpectral Reflectance (MSR) ...................................................................................55 Correlation between Multispectral Reflectance (MSR) vs. N rate, CM, Growth, and
Quality..........................................................................................................................56
5
N Rate vs. Reflectance .............................................................................................56 CM vs. Reflectance ..................................................................................................56 Visual Quality and Color vs. Reflectance ................................................................57 NO3-N Leaching vs. Reflectance .............................................................................57 Shoot Growth vs. Reflectance..................................................................................58
Conclusions.............................................................................................................................58
5. CONCLUSIONS........................................................................................................................62
LIST OF REFERENCES...............................................................................................................64
BIOGRAPHICAL SKETCH .........................................................................................................68
6
LIST OF TABLES
Table page 3-1 N leaching (mg m-2) of Empire Zoysiagrass in response to N rates and Clipping
Management (CM)..................................................................................................................38
3-2 Correlation (r2) between NO3-N leaching of 294 kg N ha-1 rate for CRT plots vs. Rainfall during trial period .....................................................................................................39
3-3 NO3-N leaching mass (mg m-2) and concentration (mg L-1) of 294 kg N ha-1 rate for CRT and Rainfall* (mm) during trial period. .........................................................................39
3-4 Percentage loss of applied fertilizer N from Zoysiagrass soil under varying N rates, and Clipping Management (CM). ..................................................................................................39
3-5 N leaching (mg L-1) of Empire Zoysiagrass in response to N rates and Clipping Management (CM) ..................................................................................................................40
3-6 Turf shoot and root growth in response to N rates and Clipping Management (CM).............41
3-7 Total Kjeldahl Nitrogen percentage and N uptake of Empire Zoysiagrass in response to N rates and Clipping Management. ........................................................................................42
3-8 Visual quality and color score of Empire Zoysiagrass in response to N rates and Clipping Management (CM) in a field experiment ................................................................43
3-9 Chlorophyll Index of Empire Zoysiagrass in response to N rates and Clipping Management (CM)..................................................................................................................44
3-10 Correlation coefficients for N rate, clipping management, quality, color, chlorophyll, NO3-N Leaching, and Shoot growth. ...................................................................................45
4-1 Reflectance by clipping practice and varying N rate 6 weeks after first fertilizer treatment (6 WAFT‡). ............................................................................................................59
4-2 Reflectance by clipping practice and varying N rate 1 week after second fertilizer treatment (1 WAST)................................................................................................................60
4-3 Correlation Coefficients for reflectance vs. N rate, clipping management, quality, color, chlorophyll, N leaching, and shoot growth. ............................................................................61
7

LIST OF FIGURES
Figure page 3-1 Interaction between clipping management (CM) and N rate with respect to NO3-N
leaching (mg m-2) from Empire Zoysiagrass in June (a), July (b), August (c), October (d), and total (e). (NS: Not significant, ***: Significant at p=0.05 between N rates) ...........46
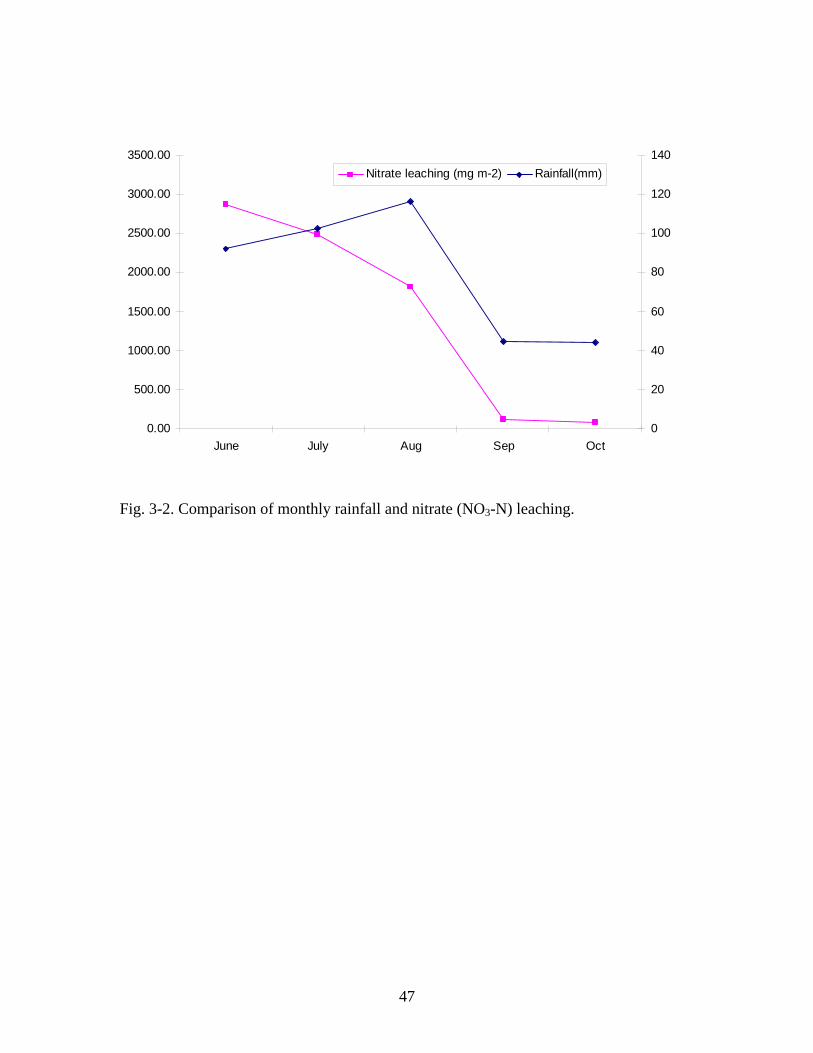
3-2 Comparison of monthly rainfall and nitrate (NO3-N) leaching...............................................47
3-3 Interaction between clipping management (CM) and N rate with respect to NO3-N leaching (mg L-1) from Empire Zoysiagrass in June (upper left), July (upper right), August (bottom left), and October (bottom right). ..................................................................48
3-4 Interaction between clipping management (CM) and N rate with respect to shoot weight (g m-2day-1) from Empire Zoysiagrass in August...................................................................49
3-5 Interaction between clipping management (CM) and N rate with respect to N uptake (g m-2) from Empire Zoysiagrass in August ...............................................................................49
3-6 Chlorophyll level by N rate treatment for ‘Empire’ Zoysiagrass............................................50
3-7 Chlorophyll level by Clipping treatment for ‘Empire’ Zoysiagrass........................................50
8
Abstract of Thesis Presented to the Graduate School of the University of Florida in Partial Fulfillment of the
Requirements for the Degree of Master of Science
ROLE OF NITROGEN AND CLIPPING-RETURN ON N BALANCE AND NITRATE LEACHING IN ZOYSIAGRASS (Zoysia japonica Steud.)
By
Jinyong Bae
August 2009 Chair: Laurie E. Trenholm Major: Horticultural Science
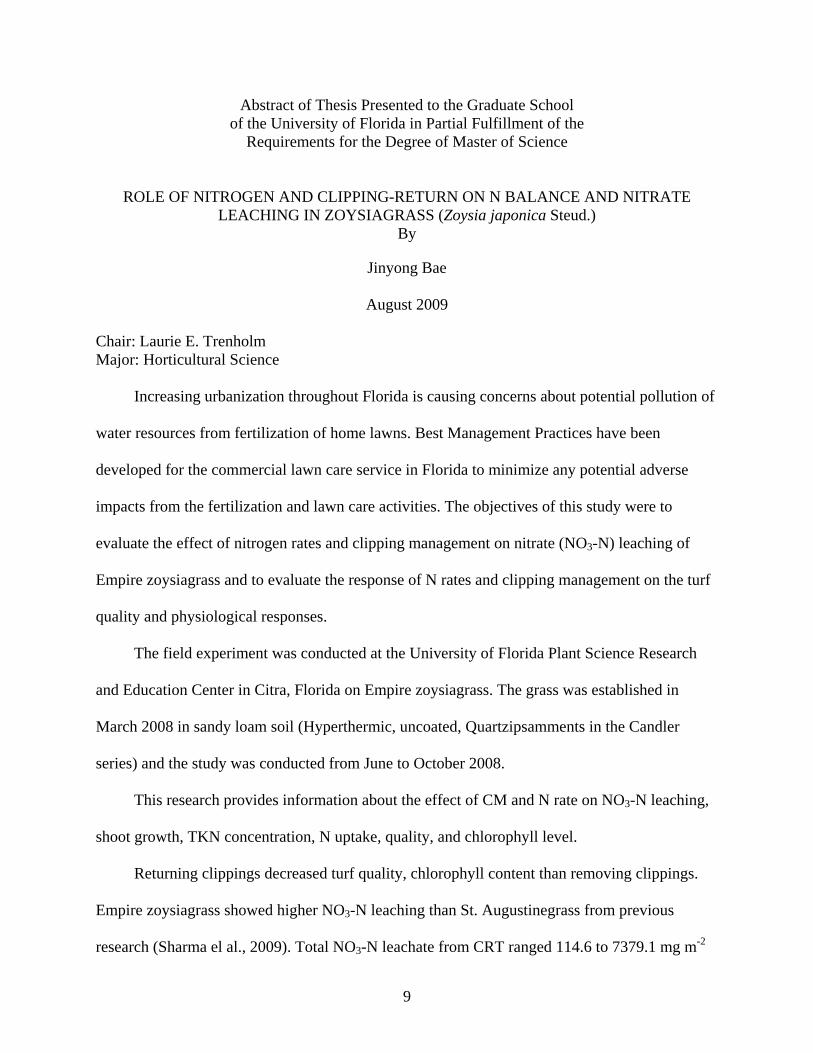
Increasing urbanization throughout Florida is causing concerns about potential pollution of
water resources from fertilization of home lawns. Best Management Practices have been
developed for the commercial lawn care service in Florida to minimize any potential adverse
impacts from the fertilization and lawn care activities. The objectives of this study were to
evaluate the effect of nitrogen rates and clipping management on nitrate (NO3-N) leaching of
Empire zoysiagrass and to evaluate the response of N rates and clipping management on the turf
quality and physiological responses.
The field experiment was conducted at the University of Florida Plant Science Research
and Education Center in Citra, Florida on Empire zoysiagrass. The grass was established in
March 2008 in sandy loam soil (Hyperthermic, uncoated, Quartzipsamments in the Candler
series) and the study was conducted from June to October 2008.
This research provides information about the effect of CM and N rate on NO3-N leaching,
shoot growth, TKN concentration, N uptake, quality, and chlorophyll level.
Returning clippings decreased turf quality, chlorophyll content than removing clippings.
Empire zoysiagrass showed higher NO3-N leaching than St. Augustinegrass from previous
research (Sharma el al., 2009). Total NO3-N leachate from CRT ranged 114.6 to 7379.1 mg m-2
9

and 123.1 to 1537.6 mg m-2 from CRM. The average concentration of NO3-N leaching ranged
0.23 to 6.47 mg L-2. The highest N rate (294 kg N ha-1) produced significantly greater NO3-N
leaching compared to the other N rates. To avoid NO3-N leaching, it is important to apply N at
rates below 196 kg N ha-1 at each application.
In addition, NO3-N leaching was significantly correlated with rainfall. These results would
indicate that exceeding the currently recommended N fertilization rates may contribute to NO3-N
leaching during raining summer season (June to Aug) in Florida.
MSR data at varying wavelengths did not differ due to CM. However, responses of
growth and stress indices were significant due to CM. The CRT showed less turf growth and
higher stress than CRM treatment through entire experiment period. Stress indices were also
lower under higher N rates throughout the experiment. Growth and stress indices such as NDVI,
Stress, and IR/R showed significant and consistent linear correlation with all evaluations used in
this study.
These results generally contradict previous studies on CM, which reported positive results
of clipping-return on NO3-N leaching in research conducted on cool-season grasses.
10

CHAPTER 1 INTRODUCTION
Nitrogen Physiology in Turf
There are many sources of nitrogen (N) in our environment, some of which are available
for plant use. The atmospheric is about 80% N, although it is not readily usable by plants in the
element form. The N content of surface mineral soil ranges from 0.02 to 0.5% (Brady, 1990),
and may be available to plants, depending on the form in which it is stored in the soil. Nitrogen
is one of the major mineral nutrients required by plants, providing the building blocks for growth
and physiological functioning. Nitrogen is a component of amino acids, nucleic acids,
chlorophyll, and enzymes. Nitrogen also stimulates plant shoot and root growth and
development, and is essential for carbohydrate use in plants. In general, higher rates of
fertilization with N deliver better quality of turf, regardless of fertilizer sources (Heckman et al.,
2000). Both organic and inorganic fertilizers have similar effects on warm-season turfgrass
systems (Trenholm and Unruh, 2005b).
Turfgrass absorbs N as ammonium (NH4+) or nitrate (NO3
-). Nitrate and NH4+ are
typically present at similar concentrations in soil (Hull and Liu, 2005). However, in soil water,
NO3- concentration is five to ten times higher than that of NH4
+ (Bowman et al. 1989; Hull and
Liu, 2005). Because soil is negatively charged, the cationic NH4+ ions are attracted to cation
exchange sites, and remain at a relatively lower rate in the soil solution. The NO3- ions move
freely in the solution due to the repulsion by soil particles. Thus, turfgrass roots absorb less
NH4+ because of the immobility of NH4
+ in soil (Below, 2001) and primarily take up N as the
NO3- form.
Both NO3- and NH4
+ forms are rapidly absorbed by plant roots. Bowman et al. (1989)
demonstrated this by applying 5 g N m-2 of NO3- and NH4
+ to separate field plots of Kentucky
11

bluegrass (Poa pratensis L.). After 24 hours, only 20 to 30% of both NO3- and NH4
+ could be
extracted from the soil-thatch phase of the turf. None of the N applied could be extracted in
either form after 48 hours.
Uptake of most nutrients, including nitrogen, occurs mainly through root hairs, which can
effectively absorb water and nutrients via their enlarged surface area (Bloom et al., 2003). Root
hairs enhance root capacity to take up immobile nutrients such as phosphate and NH4+ (Hull and
Liu, 2005). A dense of fibrous root, which can improve competition for N against soil microbes,
is also an important strategy for uptake of immobile ions in soil (Jackson et al., 2008)
Water and Nitrogen Leaching
Water is essential for the survival and maintenance of life. Fresh water consists of surface
and groundwater, the latter constituting 97% of the sources for global drinking water.
According to the US Environmental Protection Agency (EPA), excessive nitrate
concentration in drinking water has caused severe illness and even death in infants less than six
months of age (EPA, 2006). Nitrate is converted to nitrite in the mammalian body, and this
process rapidly reduces the oxygen-carrying capacity in the blood stream of children. A ‘blue
baby’ syndrome occurs. Thus, EPA set the drinking water standard at 10 ppm for nitrate and 1
ppm for nitrite (EPA, 2006). Elevated levels of nitrate in drinking water can also cause serious
health issues in adults. Some of these include methemoglobinemia, cancer, neurological effects,
or abortion (Gupta et al., 2008; EPA, 2006). Nitrate levels in groundwater remain stable over
time and a measurement of nitrate in water can indicate longer periods of exposure (Ruckart et
al., 2008). Thus, this stable nature of nitrate causes a reduction in the safety of our environment
and health. In addition, nitrogen is one of the nutrients most often identified in stormwater
runoff, which picks up surface pollutants and carries them along as the water reenters the ground
or surface water system (FDEP, 2007). In surface waters, nitrogen in stormwater can also lead to
12

heavy algae growth, eutrophication and low dissolved oxygen levels as a non-point source
pollution (Shaver et al., 2007), which has led to the initiation of Best Management Practices
(BMPs) (Trenholm et. al., 2002). The Florida Green Industries BMPs have been developed to
minimize nonpoint source pollution resulting from fertilization while providing education on
fertilizer management to the landscape maintenance industries of Florida since 2003. The
program funded by the Florida Department of Environmental Protection (FDEP) helped the
commercial lawn and landscape industry to increase awareness regarding nutrient leaching and
runoff. (FDEP, 2007; Trenholm, 2007).
Fertilizers, when used properly, can maintain the health and quality of turf. Nitrogen is the
element required in greatest quantity by turf for healthy growth and functioning (Trenholm and
Unruh, 2005a). In most cases, slow-release N sources can reduce the potential loss of N relative
to water-soluble, quick-release N sources (Saha et al, 2007; Heckman et al., 2000).
Rooting patterns (depth) can reduce the total amount of NO3-N leachate from the soil.
Deep-rooted turf absorbs N more efficiently than shallow-rooted turf (Bowman el al. 1998).
Nitrate leaching from turf has been shown to increase as rates of applied N become excessive
(Morton et al., 1988; Kopp and Guillard, 2005; Frank et al., 2006).
Lee et al. (2003) evaluated the influence of fertilization and mineralization on soil nitrate
level in bermudagrass (Cynodon spp.) systems established on 50- and 70-year-old golf courses.
Results indicated that NO3-N levels were consistently low (below 4 mg kg-1 soil) and similar to
the N level of an adjacent natural area. They also found that soil nitrate levels under different
fertilization regimes were not significantly different from those in adjacent, nonfertilized areas.
Bowman et al. (2002) compared NO3-N leaching and N use efficiency among six warm-
season grasses under greenhouse condition for one year. They analyzed NO3-N and NH4-N in
13

samples of leachate and clippings. St. Augustinegrass (Stenotaphrum secundatum (Walt.)
Kuntze) was most efficient at minimizing NO3-N leaching, and ‘Meyer’ Zoysiagrass (Zoysia
japonica Steud) was least efficient at minimizing NO3-N leaching. Species selection is thus an
important factor for reduction of NO3-N leaching from turfgrass systems. The N leaching rate
also depends on plant species. Erickson et al. (2001) reported the difference of N leaching
between St. Augustinegrass and a mixed-species landscape. They concluded that N leaching loss
was significantly greater on the mixed-species landscape (48.3 kg N ha-1) than St.
Augustinegrasss (4.1 kg N ha-1). On the contrary, there is a study to suggest that management
practices is more important than species composition for reducing N leaching from residential
land use (Erickson et al., 2008). Through St. Augustinegrass (SA) and a mixed-species
landscape (MS), Erickson et al.(2008) observed that cumulative N leaching for 3 yr was 4.1 kg
ha–1 and 7.4 kg ha–1 for the SA and MS landscapes, respectively. The MS had significantly
greater inorganic-N leaching (5.2 kg ha-1) in year 1 of the study compared to the SA landscape
(1.3 kg ha-1). However, after year 1, inorganic-N leaching was comparable on both landscapes,
and was low (<2% of applied N) on both landscapes following establishment.
The ability of grass to take up N depends on age. Miltner et al. (1996) examined the fate
of heavy isotope 15N applied to Kentucky bluegrass, which had been established one year before
the experiment. Urea-N was applied at an annual total rate of 196 kg N ha-1. In general, the
NO3-N in leachate was below 1 mg N L-1, and only 0.23% of applied labeled fertilizer N was
collected in leachate. Frank et al. (2006) conducted an experiment similar to that of Miltner et al.
(1996), but modified the design by using 10-year-old Kentucky bluegrass and two fertilizer
treatments with an annual rate of 98 and 245kg N ha-1. The NO3-N in the leachate at the low rate
(98 kg N ha-1) was typically below 5 mg L-1, whereas the NO3-N concentration at the high rate
14

(245 kg N ha-1) was often greater than 20 mg L-1. The latter value is 2 times greater than the EPA
standard for drinking water.
Empire Zoysiagrass
Zoysiagrass (Zoysia spp. Willd.) originated from the Orient (Christians, 2007) with ten
species, which include Korean (or Japanese) lawngrass (Zoysia japonica Steud.), which is the
most widely used species in the United States (Christians, 2007). Zoysia japonica is well
adapted to use on golf courses fairways and tees as well as homelawns, because it has excellent
cold tolerance (Trenholm and Unruh, 2005a), fair shade, and salinity tolerance (Christians, 2007).
It also grows well to traffic and droughty conditions while maintaining relatively low level of
disease and insect damage (Christians, 2007). ‘Empire’ zoysiagrass is a native proprietary
selection of Zoysia japonica. It has performed well in sandy and clay soils with dark and green
in color and a wide leaf blade (Trenholm and Unruh, 2005a).
Clipping Management
Turf shoot clippings have often been considered a nuisance product to dispose of, although
the clippings contain abundant nutrients and are a source of organic matter. Removing clipping
from turf causes N loss from the system. Starr and DeRoo (1981) examined the various effects
of clipping-return while evaluating the fate of N fertilizer with Kentucky bluegrass mix (Poa
pratensis L.) and creeping red fescue (Festuca rubra L.). The study spanned 3 years and used a
suction lysimeter with 15N labeling to trace the fate of N from clippings and fertilizer. Return of
clippings to the turf increased the total N uptake of the harvested grass by 19, 41, and 74% for
the 3 consecutive years of the experiment. In the clipping returned treatment, yield and growth
of the grass increased by about 30%. The tissue N concentration from clipping-removed
treatment was derived equally from soil and fertilizer, whereas the tissue N concentration from
clipping-returned treatment was derived from equal amounts of N from soil, fertilizer, and
15

clipping-return. Nitrate-nitrogen concentrations in the leachate on average were 1.9 mg L-1 for
clipping-removed and 2.0 mg L-1 for clipping-returned treatment, indicating that NO3-N leaching
was not significantly reduced by clipping treatments.
To reduce nitrate leaching, returning clipping has potential importance in turf management.
Liu and Hull (2006) investigated overall growth and N recovery from clippings using 10
cultivars each of three cool-season grasses (kentucky bluegrass (Poa pratensis L.), perennial
ryegrass (Lolium perenne L.), and tall fescue (Festuca arundinacea Schreb.) under field
condition. All turf was maintained under an N fertilization rate of 147 kg N ha-1 year-1 for two
growing seasons (May through October). Clipping yields ranged from 5,152 kg dry weight ha-1
for tall fescue and 3,680 kg ha-1 for perennial ryegrass. In terms of N recovery, Kentucky
bluegrass had greater recovery than tall fescue, and perennial ryegrass. Total N recovered from
clippings exceeded the amount of N applied as fertilizer, ranging from 260 to 111 kg N ha-1 yr-1.
Clippings alone were shown to be an effective N source for turf maintenance when
clippings were provided from well fertilized turf (Bigelow et al., 2005). Tall fescue (Festuca
arundinacea 'Rebel') was treated with 0, 1, 2, 3, or 4 plot-equivalents of clippings from adjacent
donor plots treated with 220 kg N ha-1 year-1 for two growing seasons. During the first year of
the research, N recovery from clippings was linear, and all turf plots showed N deficiency,
regardless of how many clippings were returned. However, in the second year, N recovery
demonstrated a quadratic response, with tissue N maintained adequately in instances where
clippings applications were highest.
Little research has been directed towards the ‘clipping-return’ effect on turf quality or N-
use efficiency. Heckman et al. (2000) examined the effect of returning clippings to Kentucky
bluegrass by using a mulching mower for 4 years (1994-1997). Results suggested that clipping-
16

return treatment improved color of the turf and reduced need for N fertilization by 50%. In
addition, Heckman et al. (2000) found that the use of slow-release fertilizer reduced the problem
of turf quality such as unsightly clippings or undesirable growth surge. Kopp and Guillard
(2002a) examined the response of turf growth and quality to clipping-return at varying rates of N
fertilization. Two clipping management strategies (removed or returned) and four N fertilization
rates (0, 98, 196, and 392 kg N ha-1) were compared. The clipping-returned treatment enhanced
clipping dry matter from 30 to 72%, and increased total N uptake from 48 to 60%. Also, N-use-
efficiency increased from 52 to 71%. The authors concluded that N fertilization rate could be
reduced at least 50% while maintaining turf quality if grass clippings were returned.
The question of whether clippings contribute to thatch was considered a negative effect of
clipping-return. Research has shown that thatch is accumulated not by grass clippings, but rather,
from roots, horizontal stems (stolons and rhizomes), and mature sheaths and blades (McCarty et
al., 2007). Soper et al. (1998) found that returning clippings increased thatch by 3.4% and
decreased the tiller density by 12% in ‘Meyer’ Zoysiagrass (Zoysia japonica Steud). The
reduction of tiller density may be due to shading effects of clippings within the turf canopy.
Clipping removal was not recommended for thatch control because of the benefits provided by
clippings as a nutrient source. (Soper et al. 1998)
Qian et al. (2003) applied an ecosystem model, and used this to predict long-term effects of
clipping management and NO3-N leaching. Prior to long-term prediction, 3 years of field
research with Kentucky bluegrass (Poa pratensis L.) was used to generate the predictions.
Results indicated that when the clippings were returned, N fertilizer requirements would be
reduced by 25% during the first of 10 years after turf establishment, by another 50% from 25 to
50 years, and by 60% after 50 years.
17
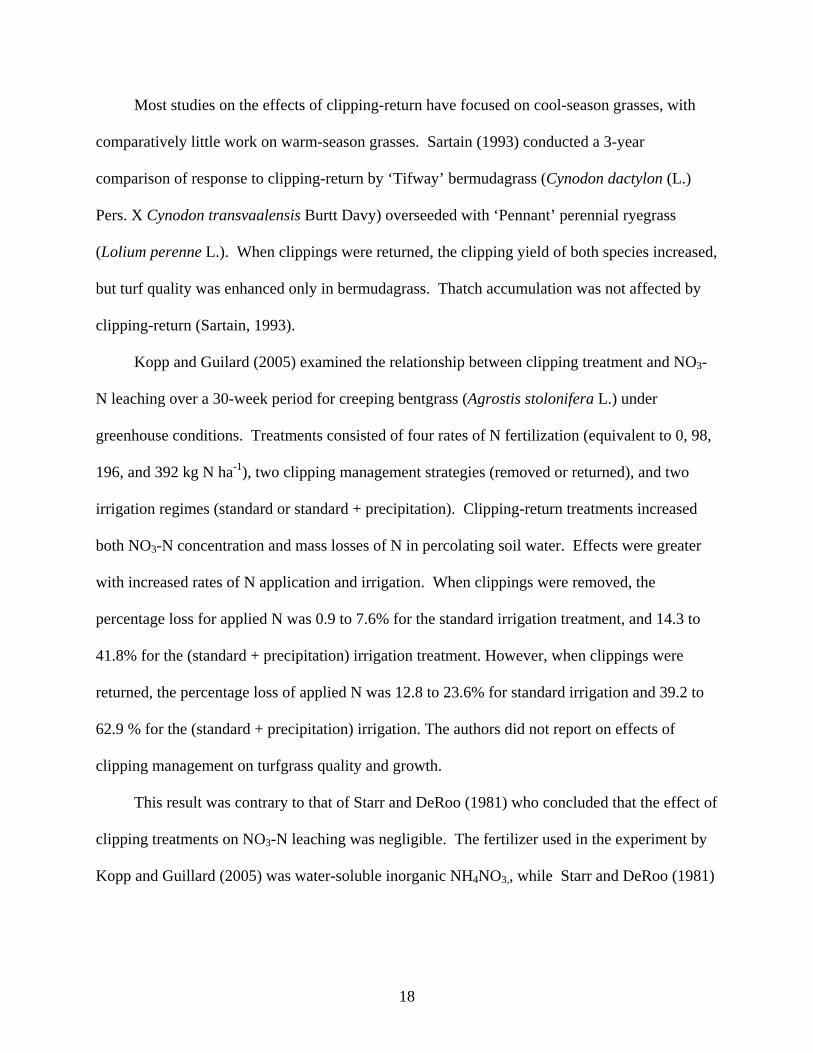
Most studies on the effects of clipping-return have focused on cool-season grasses, with
comparatively little work on warm-season grasses. Sartain (1993) conducted a 3-year
comparison of response to clipping-return by ‘Tifway’ bermudagrass (Cynodon dactylon (L.)
Pers. X Cynodon transvaalensis Burtt Davy) overseeded with ‘Pennant’ perennial ryegrass
(Lolium perenne L.). When clippings were returned, the clipping yield of both species increased,
but turf quality was enhanced only in bermudagrass. Thatch accumulation was not affected by
clipping-return (Sartain, 1993).
Kopp and Guilard (2005) examined the relationship between clipping treatment and NO3-
N leaching over a 30-week period for creeping bentgrass (Agrostis stolonifera L.) under
greenhouse conditions. Treatments consisted of four rates of N fertilization (equivalent to 0, 98,
196, and 392 kg N ha-1), two clipping management strategies (removed or returned), and two
irrigation regimes (standard or standard + precipitation). Clipping-return treatments increased
both NO3-N concentration and mass losses of N in percolating soil water. Effects were greater
with increased rates of N application and irrigation. When clippings were removed, the
percentage loss for applied N was 0.9 to 7.6% for the standard irrigation treatment, and 14.3 to
41.8% for the (standard + precipitation) irrigation treatment. However, when clippings were
returned, the percentage loss of applied N was 12.8 to 23.6% for standard irrigation and 39.2 to
62.9 % for the (standard + precipitation) irrigation. The authors did not report on effects of
clipping management on turfgrass quality and growth.
This result was contrary to that of Starr and DeRoo (1981) who concluded that the effect of
clipping treatments on NO3-N leaching was negligible. The fertilizer used in the experiment by
Kopp and Guillard (2005) was water-soluble inorganic NH4NO3,, while Starr and DeRoo (1981)
18

used ureaformaldehyde, an organic, slow release N source. The different N sources may have
contributed to the difference in NO3-N leached.
Apparently, clipping-return can play a substantial role in reducing N fertilizer use in cool-
season turfgrasses and maximizing the efficiency of N use in turf. Returning clippings to
turfgrass can be a solution for more efficient, environmentally-sound fertilizer use when applied
with adequate amount of N fertilizer.
The majority of the research looking at clipping effects has focused on cool-season grasses
rather than warm-season grasses. Thus, the objective of this research was to evaluate the NO3-N
leaching, turf growth, quality, and spectral reflectance of ‘Empire’ zoysiagrass due to N rate and
clipping management.
MultiSpectral Reflectance (MSR)
Qualitative measurement such as quality and color are commonly utilized in turfgrass
research to compare or assess turf growth and health (Turgeon, 1991; Heckman et al., 2000).
Recently multispectral radiometry has been used to quantitatively distinguish between stressed
and non-stressed plants (Carter, 1993; Carter and Miller, 1994) including turfgrass (Trenholm et
al., 1999a and 1999b). Thus, multispectral radiometry can quantitatively provide information on
overall health, growth and vigor of turfgrass. A multispectral radiometer measures the amount of
light plant absorb at particular wavelengths, thereby indicating how the plant effectively uses
photosynthetically active radiation (PAR).
Visible (VIS) and near infrared (NIR) regions of spectrum are useful range for determining
plant response when a treatment applies. Leaf reflectance of PAR (400 to 700nm) is highly
negatively correlated (r2>0.97) with concentration of chlorophyll, so a healthy plant has
relatively low reflectance of PAR (Trenholm, 2000). However, more than 700nm of reflectance
is positively correlated with cellular water concentration in the leaf cell. Thus, a stressed plant
19

has high reflectance value at the PAR range, and low reflectance value above 700nm (Trenholm
et al, 1999a; Trenholm, 2000).
Asrar et al. (1984) showed that the ratios normalized difference vegetation index (NDVI),
which computed as (R935-R661)/( R935+R661), correlated well (r2 =0.97) with absorbed
photosynthetically active radiation (APAR) in wheat (Triticum aestivum L.).
Trenholm et al. (1999a) reported the significance of spectral data as quantitative tool on
seven seashore paspalum (Paspalurn vaginaturn Swartz) ecotypes and three hybrid
bermudagrass (Cynodon dactylon L. X C. trunsvaalensis Burtt-Davy) cultivars. They concluded
that NDVI, infrared/red (IR/R), Stress I (ST-1) (R706/R760 ) and Stress II (ST-2) (R706/R813 ) were
highly correlated with visual quality, shoot density, and shoot tissue injury rating except with
shoot growth (Trenholm et al. 1999a).
Relatively little information is available on the spectral responses for turfgrass system.
Moreover, because of lack of research on the effect of clipping-return in warm-season grasses,
the objectives of this study were to evaluate responses of zoysiagrass to N rate and clipping
treatment using spectral data and to determine correlation between value of multispectral
radiometer and other measurements such as quality, color and shoot growth.
20

CHAPTER 2 MATERIALS AND METHODS
A field experiment was conducted at the University of Florida Plant Science Research
and Education Center in Citra, Florida on ‘Empire’ zoysiagrass (Zoysia japonica Steud.). The
grass was established in March 2008 in sandy loam soil (Hyperthermic, uncoated,
Quartzipsamments in the Candler series) and the study was conducted from June to October
2008.
Plots measured 4.0m x 4.0m. High-density polyethylene (HDPE) lysimeters were
installed in the center of each plot, approximately 10 cm below the soil surface. Lysimeters
measured 57 cm diam. and 88 cm in height with a volume of 168 L. Lysimeters were assembled
by placing cylinders into a single piece galvanized steel base unit measuring 25.4 cm in height. A
bulkhead fitting was inserted into the base of each unit, to which collection tubing (0.95 cm low
density polyethylene) was attached. The tubing was run underground to central aboveground
collection portals. Lysimeters were installed by boring and removing soil in 15.2 cm sections to a
depth of 107 cm. Lysimeters were placed in holes and bases of the units were filled with washed
egg rock (1.9 – 6.4 cm) for a volume of 38 L. The gravel was covered with fitted non-woven
polyolefin cloth that was secured with a hoop of 1.3 cm HDPE tubing to reduce soil intrusion
into the reservoir. Soil was replaced into the lysimeters as it had been removed from the soil
profile. Soil was gently tamped with a tamping tool (17 kg and 858 cm2) to approximate original
soil bulk density.
Clipping-management (CM) and nitrogen (N) fertilizer treatments were as follows:
• CM #1 consisted of clipping-return, in which clippings were left in the experimental field
after mowing with a conventional rotary mower.
21

• CM#2 consisted of clipping-removal, in which clippings were taken from the field by
attaching a collection bag to the mower.
Mowing height was set at 6.3 cm (2.5 inches). The plots were mowed once a week throughout
the study period.
Fertilizer treatments consisted of six levels of total N rates (equivalent to 0 lbs, 1 lbs, 2
lbs, 3 lbs, 4 lbs or 6lbs N 1,000 ft-2 yr-1 or 0 kg, 49 kg, 98 kg, 147 kg, 196 kg, or 294 kg N ha-1 yr-
1). Treatments were applied at 2-mo intervals for a total of two treatment applications. A 50%
quick-release fertilizer (QRF) and 50% slow-release fertilizer (SRF) of 15N-0P-15K were used.
The area was irrigated to replace evapotranspiration (ET) as needed to maintain healthy turf.
Turf was evaluated visually for quality and color, which was rated immediately after
mowing. A scale of 1 to 9 was used, in which 9 represents optimal, dark green color and 1
represents dead, brown turf. A rating of 6 was considered minimally acceptable for a home lawn.
Soil moisture (SM), canopy temperature (CT), chlorophyll content (CC), and
multispectral reflectance (MSR) were also measured. Soil moisture content was quantified
weekly using a Time Domain Reflectometer (TRD) (IMIKO Micromodule Technik GmbH;
Ettingen, Germany).
The CC was taken weekly using Field Scout CM-1000 Chlorophyll meter (Spectrum
Technologies, Plainfield, IL). The measurement was taken at approximately 1.2 m from the turf
canopy. This provided an evaluation of circular area approximately 144 cm2 per measurement.
The CT was also taken weekly with a Raytek Raynger infrared thermometer (Raytek,
Santa Cruz, CA). Temperature was averaged with three random points in each plot.
The MSR was measured six times at 1, 3, and 6 weeks after first N treatment, and at 1, 3,
and 5 weeks after second N treatment using a Cropscan model MSR 16R (CROPSCAN, Inc.,
22

Rochester, MN). The radiometer was fitted with filter wavelengths to measure reflectance at 450,
550, 660, 694, 710, 760, 810, and 930 nm. In addition, the following growth and stress indices
were evaluated:
NDVI (normalized difference vegetation index) growth index computed as R930 -R660/R930 + R660. Best = highest value.
IR/R (leaf area index) growth index computed as R930/R660. Best = highest value.
Stress1 index computed as R710/R760. Best = lowest value.
Stress2 index computed as R710/R810. Best = lowest value.
Clippings were collected to determine shoot growth once a month and dried at 75ºC for
48h. They were ground in a Wiley mill and then weighed. Clippings were analyzed for total
Kjeldahl nitrogen (TKN). Roots were sampled by taking three 3.8-cm diameter root cores per
plot once a year. Root weight and length were measured after washing soil from them. Total N
uptake (TNU) was also calculated from the TKN (%) and dry weight of clippings (DWC)
(g m-2).
TNU (mg m-2) = DWC (g m-2) × TKN (%) × 1000mg g-1 (Eq.2-1)
Samples were collected by applying a vacuum to the collection tubing and withdrawing
percolate from the reservoir of the lysimeter until dry. 20-ml aliquots of the leachate were
transferred to collection vials and placed on ice in the field and then frozen at 0O C until nitrate
analysis was done. Nitrate concentration was measured using an AutoAnalyzer 3 continuous
segmented flow analyzer (Seal Analytical, Mequon, WI) at the UF Analytical Research
Laboratory in Gainesville. Leachate volumes were also calculated for each plot. Nitrate leaching
data are presented as total cumulative nitrate-N leached over the study period and percent of
applied N leached. Minimum detection limit (MDL) for the flow analyzer was 0.05. A baseline
23

leachate sample was collected prior to first treatment application yearly, those values were used
to correct for all other N mass values for each sampling event.
TNC (mg) = Nitrate concentration (mg L-1) × Leached water volume (L). (Eq.2-2)
This experiment was arranged as a nested design by CM, with fertilizer treatments
randomized within. There were three replications. Data were analyzed with the SAS procedure
ANOVA (SAS Institute Inc., Cary, NC). Significance was determined at the 0.05 probability
level.
24

CHAPTER 3 EFFECT OF CLIPPING MANAGEMENT ON NITRATE LEACHING AND TURF QUALITY
AND GROWTH IN EMPIRE ZOYSIAGRASS.
Introduction
Water is essential for survival and maintenance of life. For humans, 97% fresh drinking
water comes from a combination of surface and groundwater. However, excessive or
improper use of nitrogen (N) fertilizer may increase nitrate leaching that could potentially
lead to nonpoint source pollution of ground or surface waters. Nitrate-N (NO3-N) in water
bodies causes eutrophication, which can produce detrimental toxins and lower the oxygen
concentration in water (Glass, 2003). In addition, the USEPA reports that excessive nitrate
concentration in drinking water may cause severe illness and even death in infants less than
six months of age (EPA, 2006). Nitrate is converted to nitrite in the body, and this
conversion leads to a rapid reduction in the oxygen-carrying capacity of blood especially in
young children. A ‘blue baby’ syndrome or methemoglobinemia can result. Elevated levels
of nitrate in drinking water can cause serious health issues in adults as well such as cancer,
neurological effects, or abortion.
While urban turfgrass fertilization is often considered a major source of potential
pollution to water bodies, numerous reports indicate that a mature turfgrass system leaches
very low levels of nitrate-N (Geron et al., 1993; Lee et al., 2003; Qian et al., 2003). Nitrate
leaching from turfgrass can be increased due to excessive N application rate (Morton et al.,
1988; Kopp and Guillard, 2005; Frank et al., 2006), excessive irrigation or rainfall (Morton
et al., 1988; Kopp and Guillard, 2005), timing (Bowman et al., 1998), N source (Snyder et
al., 1984; Heckman et al., 2000 ; Guillard and Kopp, 2004; Saha et al, 2007), root density
(Bowman el al. 1998), soil depth (Gross et al., 1990), turf establishment (Geron, 1993), turf
species (Bowman et al., 2002) and other factors. These reports, however, indicate that when
25

fertilizer is applied at the appropriate rates, timings, and with the correct irrigation, virtually
all of the N is used by the turfgrass with very little lost to leaching. Gross et al. (1990)
showed that there was no difference in leaching whether nitrogen was applied as liquid or
granule. However, concerns over nitrogen leaching in Florida have led to numerous local
ordinances and a state law requiring certification and licensing of all commercial fertilizer
applicators.
Reducing potential nonpoint source pollution from urban turfgrass involves more than just
fertilizer management. For example, turfgrass clippings may contribute to nutrient movement if
left on impervious surfaces or if deposited incorrectly. Clippings produced from mowed grass
retain considerable levels of nutrients such as N, P, K, and are easily decomposed (Sartain, 2004).
Decomposition rate is related to turf species due to different content of lignin and cellulose in
clippings (Sartain, 2004). It is also possible that returning clippings to turf may reduce fertilizer
requirements. Research has reported that recycling grass clippings can help maintain high quality
turf characteristics while reducing fertilizer use in bermudagrass (Sartain, 1993 and 2004),
Kentucky bluegrass (Heckman et al., 2000) and a mixture of Kentucky bluegrass (Poa pratensis
L.)-perennial ryegrass (Lolium perenne L.)- red fescue (Festuca rubra L.) (Kopp and Guillard,
2002a).
‘Empire’ zoysiagrass (Zoysia japonica Steud.) is increasingly used as a home lawn
grass throughout Florida. Recommendations from the University of Florida for fertilization
of zoysiagrass vary, depending on location in Florida, from 147 to 294 kg N ha-1 yr-1 (Unruh
et al., 2006). In north Florida, 147 to 245 kg N ha-1 yr-1 is recommended, while in central
and south Florida 147 to 294 kg N ha-1 yr-1and 196 to 294 kg N ha-1 yr-1, respectively, are
recommended (Unruh et al., 2006). However, research (Trenholm and Unruh, 2009) has
26

indicated that the cultivar Empire may perform best with lower rates of N than those
suggested in the official recommendations. There are currently no other published reports on
responses of Empire to fertilization rates.
The Florida Green Industries Best Management Practices (BMPs) were developed in
2002 to minimize nonpoint source pollution resulting from fertilization and to provide
education on fertilizer management to the landscape maintenance industries of Florida. Use
of grass clippings may represent a source of critical nutrients and can also provide organic
matter. Due to lack of information regarding the effect of clipping-return on nitrate leaching
in Empire zoysiagrass, the objectives of this study were to determine the effects of N rate
and clipping management on NO3-N leaching and turf quality of Empire zoysiagrass.
Materials and Methods
The field experiment was conducted at the University of Florida Plant Science Research
and Education Center in Citra, Florida on Empire zoysiagrass. The grass was established in
March 2008 in sandy loam soil (Hyperthermic, uncoated, Quartzipsamments in the Candler
series) and the study was conducted from June to October 2008.
Plots measured 4.0m x 4.0m. High-density polyethylene (HDPE) lysimeters were
installed in the center of each plot, approximately 10 cm below the soil surface. Lysimeters
measured 57 cm diam. and 88 cm in height with a volume of 168 L. Lysimeters were assembled
by placing cylinders into a single piece galvanized steel base unit measuring 25.4 cm in height. A
bulkhead fitting was inserted into the base of each unit, to which collection tubing (0.95 cm low
density polyethylene) was attached. The tubing was run underground to central aboveground
collection portals. Lysimeters were installed by boring and removing soil in 15.2 cm sections to a
depth of 107 cm. Lysimeters were placed in holes and bases of the units were filled with washed
egg rock (1.9 – 6.4 cm) for a volume of 38 L. The gravel was covered with fitted non-woven
27

polyolefin cloth that was secured with a hoop of 1.3 cm HDPE tubing to reduce soil intrusion
into the reservoir. Soil was replaced into the lysimeters as it had been removed from the soil
profile. Soil was gently tamped with a tamping tool (17 kg and 858 cm2) to approximate original
soil bulk density.
Clipping-management (CM) and nitrogen (N) fertilizer treatments were as follows:
• CM #1 consisted of clipping-return (CRT), in which clippings were left in the experimental field after mowing with a conventional rotary mower.
• CM#2 consisted of clipping-removal (CRM), in which clippings were taken from the field by attaching a collection bag to the same rotary mower.
Mowing height for both management strategies was set at 6.3 cm (2.5 inches). The plots were
mowed once a week during the growing season.
Fertilizer treatments consisted of six levels of total N rates applied over the study period
that were equivalent to 0 lbs, 1 lbs, 2 lbs, 3 lbs, 4 lbs or 6lbs N 1,000 ft-2 (0 kg, 49 kg, 98 kg, 147
kg, 196 kg, or 294 kg N ha-1). Treatments were applied at 2-mo intervals for a total of two
treatment applications. A 50% slow-release N fertilizer (Urea N) with an analysis of 15N-0P-
15K was used. The area was irrigated to replace evapotranspiration (ET) as needed to maintain
good quality turf.
Turf was evaluated visually for quality and color, immediately after mowing every week.
A scale of 1 to 9 was used, in which 9 represents optimal, dark green color and 1 represents dead,
brown turf. A rating of 6 was considered minimally acceptable for a home lawn.
Soil moisture (SM), canopy temperature (CT), and chlorophyll content (CC) were also
measured. The SM was quantified weekly using a Time Domain Reflectometer (TRD) (IMIKO
Micromodule Technik GmbH; Ettingen, Germany).
28

Chlorophyll content of the leaf tissue was measured weekly using a Field Scout CM-1000
Chlorophyll meter (Spectrum Technologies, Plainfield, IL). The measurement was taken at
approximately 1.2 m from the turf canopy
Turf CT was also taken weekly with a Raytek Raynger infrared thermometer (Raytek,
Santa Cruz, CA). Temperature was averaged from reading of three random points in each plot.
Clippings were collected to determine shoot growth once a month and dried at 75ºC for
48h. They were ground in a Wiley mill and then weighed. The total N concentration was
analyzed with 0.2 g of dried clippings by the total Kjeldahl N (TKN) procedure. Roots were
sampled by taking three 3.8-cm diameter root cores per plot once a year. Root weight and length
were measured after washing them free of soil. Total N uptake (TNU) was also calculated from
the TKN (%) and dry weight of clippings (DWC) (g m-2).
Nitrate-N leachate samples were collected by applying a vacuum to the collection tubing
and withdrawing percolate from the reservoir of the lysimeter until dry. 20-ml aliquots of the
leachate were transferred to collection vials and placed on ice in the field and then frozen at 0O C
until nitrate analysis was done. Nitrate concentration was measured using an AutoAnalyzer 3
continuous segmented flow analyzer (Seal Analytical, Mequon, WI) at the UF Analytical
Research Laboratory in Gainesville. Leachate volumes were also calculated for each plot. Nitrate
leaching data are presented as total cumulative NO3-N leached over the study period and percent
of applied NO3-N leached. Minimum detection limit (MDL) for the flow analyzer was 0.05. A
baseline leachate sample was collected prior to first treatment application yearly, with those
values used to correct for all other N mass values for each sampling event.
This experiment was arranged as a nested design by CM, with fertilizer treatments
randomized within. There were three replications. Data were analyzed with the SAS procedure
29

ANOVA (SAS institute Inc., Cary. NC) and means were separated by Tukey’s method.
Significance was determined at the 0.05 probability level.
Results and Discussion
Nitrate Leaching
In all evaluation periods, there were differences due to N rates (Table 3-1). Greater
amounts of NO3-N leached from the 294 kg N ha-1 rate than from the other rates. High N rate has
previously been shown to increase nitrate-N leaching (Morton et al., 1988; Kopp and Guillard,
2005; Frank et al., 2006) in other grass species. The highest rate applied here (294 kg N ha-1)
represents a 3-fold increase in recommended application rates from the University of Florida.
Even at the next highest rate of 196 kg N ha-1, nitrate-N leaching did not differ from the lower
rates or from the control.
There were also differences in NO3-N leaching due to CM and the interaction of N rate
and CM for all month with exceptions of Aug and Sep (Table 3-1 and Fig 3-1). The amount of
NO3-N leaching for CRT plots dramatically increased at 294 kg N ha-1 rate during June to Aug.
There was no increase in NO3-N leaching from CRM plots, regardless of N rate during June to
Aug. In contrast to this, in Oct there was no difference between N rates for CRT and NO3-N
leached in CRM plots increased remarkably over CRT plots (Fig 3-1).
These results of high NO3-N leached for the highest N rate in CRT plots were correlated
with the amount of monthly rainfall (Table 3-2). The peak of NO3-N leaching was in June
(2867.7 mg m-2) and the lowest was in October (84.2 mg m-2) (Table 3-3, Fig 3-2). This is
positively correlated with rainfall during this study period (r2=0.372, p=0.0157) (Table 3-2), with
approximately 78% of the rain received was during the first three months (June to Aug) (Table 3-
3). Heavy rainfall has previously been shown to increase leaching (Kopp and Guillard, 2005).
This shows that heavy rainfall in Florida can accelerate the risk of NO3-N leaching combined
30

with high N rate. This field was established 3 months before this research. Root system of the
zoysiagrass was not fully established and grown during June to Aug, when N from CRT may be
mobilized quickly under rainfall. There was no correlation in NO3-N leaching (mg m-2) at any N
rate for CRM (Data not shown).
Starr and DeRoo (1981) reported no response of NO3-N leaching due to CM in a mixture
of Kentucky bluegrass and creeping red fescue. They applied N fertilizer at a rate of 195 kg N
ha-1 in the first 2 years and 180 kg N ha-1 in the 3rd year. Their research result was similar to this
research when compared with the rate of 194 kg N ha-1 or less in this research.
There were differences in the percent of total applied N that leached over the trial period
due to N rate and interaction between CM and N rate (Table 3-4), with means ranging from 0 to
11.97% for CRT and 0.09 to 2.16 % for CRM. Percentage loss of applied fertilizer N was less
than 0.84 and 2.08 %, respectively, for CRT and CRM except at the 294 kg N ha-1, which had
leaching percentages of 11.97 and 2.16, respectively.
Nitrate-N leaching by concentration (mg L-1) also peaked at the highest N rate (Table 3-5),
similar to NO3-N leaching (mg m-2). The concentration of NO3-N leached ranged from 0.15 to
28.1 mg L-1. These NO3-N concentrations were less than the USEPA drinking water standard of
10 mg L-1 (10 ppm) with the exception of the highest N rate in June (28.1 mg L-1), July (18.5 mg
L-1) and August (11.0 mg L-1) only for CRT plots. There were differences in concentration of
NO3-N leached due to N rate and CM (Table 3-5). The interaction between N rate and CM was
also significant in June (p=0.0007), July (p=<.0001), August (p=0.0003) and October (p=0.0027).
The concentration of NO3-N leachate dramatically increased when the highest N rate (294 kg N
ha-1) was combined with CRT treatment during June to August, resulting in NO3-N leaching
exceeding the USEPA standard (Fig. 3-3).
31

There are a limited number of studies on the effect of N rate on NO3-N leaching in warms-
season grasses. Sharma et al. (2009) observed very low levels of NO3-N leaching in healthy St.
Augustinegrass even at the highest N rate of 296 kg N ha-1. At four different N rates (75, 147,
222, and 294 kg N ha-1), there were no differences in NO3-N leaching due to N rate during the
first and second fertilizer cycle (FC) because of the healthy condition of the turf. However,
during the third FC, when there was injury due to mite and scale insects, higher N rate caused
higher NO3-N leaching. The NO3-N concentrations of percolate ranged from 0.58 to 66.95 g N
m-2, and an average of 0.08 to 0.40 % of applied N leached. The range of application rates of N
fertilizer used in this previous research study was similar to this study’s; however, the previous
research was done on St. Augustinegrass, rather than zoysiagrass. The reduction in NO3-N
leaching previously reported in St. Augustinegrass may be due to the deeper and better
developed root system of. St. Augustinegrass as compared to zoysiagrass.
Saha et al. (2007) compared nitrate leaching from ‘Floratam’ St. Augustinegrass with a
mix of common Florida ornamentals, including canna (Canna generalis L.H. Bailey), nandina
(Nandina domestica Thunb.), ligustrum (Ligustrum japonicum Thunb.), and allamanda
(Allamanda cathartica L.). Less NO3-N leached from St. Augustinegrass than from ornamentals,
and more NO3-N leached from quick-release fertilizer than from slow-release fertilizer when
applied at a rate of 294 kg N ha . The -1 NO3-N concentration from the turf ranged from 0.11 to
0.21 mg L and from ornamentals ranged 0.23 to 0.52mg L . -1 -1
Erickson et al. (2001) observed that a greater amount of NO3-N was leached from
ornamentals (1.46 mg L-1) in comparison to newly established turf (<0.2 mg L-1) when a
fertilizer was applied at a rate of 300 kg N ha-1 for turf and 150 kg N ha-1 for ornamentals. In
2008, Erickson et al. (2008) reported that NO3-N concentration of ornamental (0.44±0.12 mg L-
32
1) was higher than St. Augustinegrass (0.05 ± 0.01 mg L-1). In all of these previous reports, less
nitrate-N leached from St. Augustinegrass than was reported here from zoysiagrass,
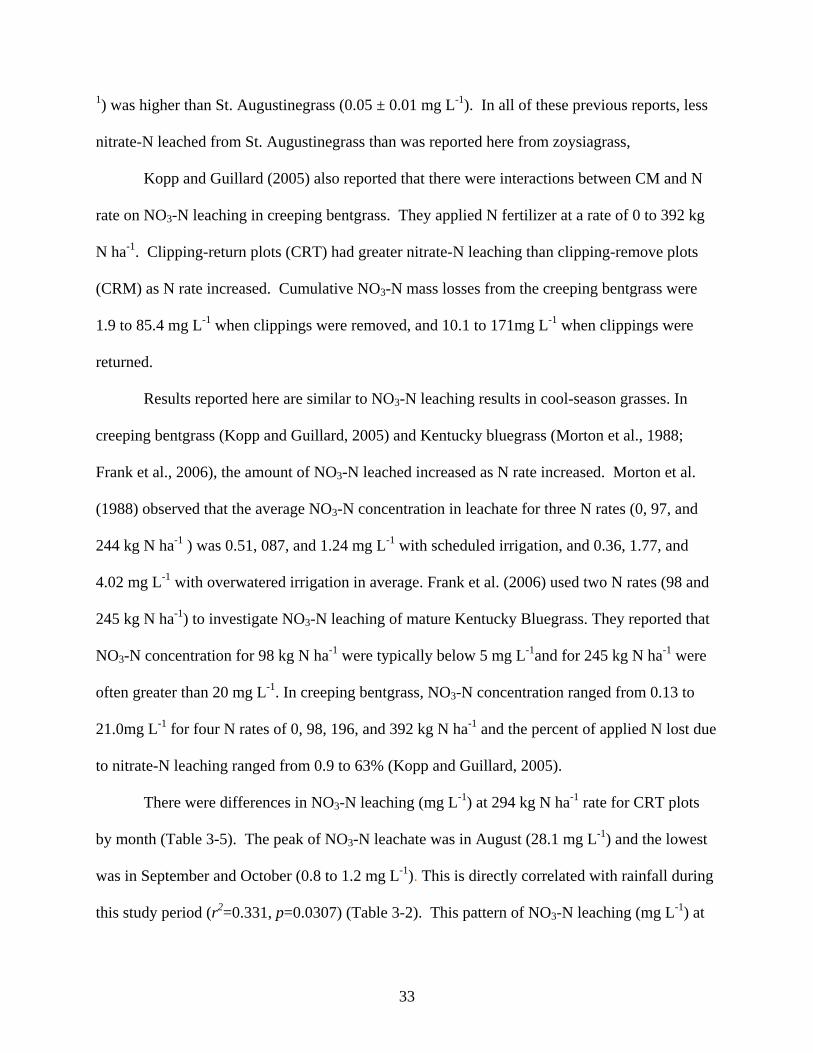
Kopp and Guillard (2005) also reported that there were interactions between CM and N
rate on NO3-N leaching in creeping bentgrass. They applied N fertilizer at a rate of 0 to 392 kg
N ha-1. Clipping-return plots (CRT) had greater nitrate-N leaching than clipping-remove plots
(CRM) as N rate increased. Cumulative NO3-N mass losses from the creeping bentgrass were
1.9 to 85.4 mg L-1 when clippings were removed, and 10.1 to 171mg L-1 when clippings were
returned.
Results reported here are similar to NO3-N leaching results in cool-season grasses. In
creeping bentgrass (Kopp and Guillard, 2005) and Kentucky bluegrass (Morton et al., 1988;
Frank et al., 2006), the amount of NO3-N leached increased as N rate increased. Morton et al.
(1988) observed that the average NO3-N concentration in leachate for three N rates (0, 97, and
244 kg N ha-1 ) was 0.51, 087, and 1.24 mg L-1 with scheduled irrigation, and 0.36, 1.77, and
4.02 mg L-1 with overwatered irrigation in average. Frank et al. (2006) used two N rates (98 and
245 kg N ha-1) to investigate NO3-N leaching of mature Kentucky Bluegrass. They reported that
NO3-N concentration for 98 kg N ha-1 were typically below 5 mg L-1and for 245 kg N ha-1 were
often greater than 20 mg L-1. In creeping bentgrass, NO3-N concentration ranged from 0.13 to
21.0mg L-1 for four N rates of 0, 98, 196, and 392 kg N ha-1 and the percent of applied N lost due
to nitrate-N leaching ranged from 0.9 to 63% (Kopp and Guillard, 2005).
There were differences in NO3-N leaching (mg L-1) at 294 kg N ha-1 rate for CRT plots
by month (Table 3-5). The peak of NO3-N leachate was in August (28.1 mg L-1) and the lowest
was in September and October (0.8 to 1.2 mg L-1). This is directly correlated with rainfall during
this study period (r2=0.331, p=0.0307) (Table 3-2). This pattern of NO3-N leaching (mg L-1) at
33

the highest N rate for CRT was similar to that of mass of NO3-N leaching (mg m-2) (Table 3-2
and 3-3). There was no correlation in NO3-N leaching (mg L-1) at any N rate for CRM (Data not
shown).
Shoot and Root Growth
There were differences in shoot growth due to N rate for all months and the average of
the harvests (Table 3-6). In July, Aug, and Sept, there were differences in shoot growth due to
CM, with more clippings in July and Sept when clippings were removed. The response in July
and Sept are most probably due to N treatment application 2 wks prior to harvest, while in Aug,
there was no N treatment application. The response may also have been related to limited
rainfall during Sept and Oct (Table 3-3). Less rainfall resulted in less NO3-N leaching, which
resulted in production of maximum shoot growth in Oct (Table 3-1 and 3-6).
There was an interaction of N rate and CM in Aug (Fig 3-4). CRT treatment produced
greater clippings than CRM treatment as N rates increased. These results were similar to
previous reports on shoot growth in cool-season grasses. Shoot growth from CRT treatment
exceeded the amount of clippings from CRM (Liu and Hull, 2006; Kopp and Guillard, 2002a).
Ten cultivars of three cool-season grasses produced clippings ranged from 515g dry weight m-2
for tall fescue and 368g m-2 for perennial ryegrass while applied 15g N m-2 in a year for two
growing season (Liu and Hull, 2006). CRT treatment enhanced clipping dry matter from 30 to
72%, and increased total N uptake from 48 to 60% with a cool-season grass mixture for 2-year
(Kopp and Guillard, 2002a). There was no difference in root weight due to any treatment effect.
Tissue N concentration
Leaf TKN differed due to N rate in Sept and Oct and due to CM in Oct only (Table 3-7).
This may indicate that CRT increasingly affects tissue N concentration over time. There were no
interactions for TKN. There were differences of N uptake due to N rate in every month and for
34

the average of the trial period and due to CM in July, Aug, and Sept. There was an interaction
for N uptake between N rate and CM in Sept (Table 3-7; Fig. 3-5). Both CRT and CRM
treatment increased N as N rates increased. However, N uptake was steeply increased in CRT
plots.
Visual Quality and Color
Turf visual quality and color differed due to N rate for each month and when averaged over
the entire trial period (Table 3-8). Average quality ranged from 6.75 to 8.20, and average color
from 6.67 to 7.92, with higher scores as N rate increased. There were also differences in quality
due to CM in June through Aug and for color in June and July, where CRM plots had better
quality and color than CRT plots. Average quality was 7.41 for CRT and 7.67 for CRM. This
result was contrary to Sartain (1993 and 2004), who found increased visual quality of
bermudagrass when clippings were returned over a 3-yr period. The author reported no
difference of quality for ryegrass due to CM. Similar results were reported by Kopp and
Guillard (2002a, 2002b) with a bluegrass–ryegrass–fescue mixture, and Heckman et al. (2000)
with Kentucky bluegrass. Turf color was generally better where clippings were returned
(Heckman et al., 2000). Kopp and Guillard (2002) also reported that clipping-return may reduce
more than 50% of N fertilization use without negative effect on turf quality.
The reason that quality and color rating decreased may be from clipping size, which can
cause delay of clipping decomposition. The rotary mower used in this research had less
efficiency to chop clippings rather than the mulching mower used by Heckman et al. (2000).
Bigger clippings remain on the turf surface longer, covering the surface and reducing
photosynthesis activity of turf. This is likely to reduce quality and color as well as chlorophyll
level in shoot.
35
Chlorophyll Content (CC)
Chlorophyll index ranged from 216.8 to 303.1 (Table 3-9; Fig 3-6), with higher levels
occurring at the higher N rates. There were also differences due to CM for Sept, Oct, and when
averaged over the trial period (Table 3-9). Higher chlorophyll level was found when clippings
were removed (Fig.3-7). Chlorophyll level is related to photosynthesis activity in leaf tissue.
Photosynthesis may be reduced due to shading effect of clippings left on leaf tissue, resulting in
lower CC levels observed here. Use of a mulching mower may reduce this shading effect and
increase CC.
Correlation between N rate vs. CM vs. Quality vs. Color vs. Chlorophyll Level vs. NO3-N leaching vs. Shoot Growth.
Nitrogen rate was correlated with quality, color, chlorophyll, NO3-N leaching, and shoot
growth (Table 3-10). The strongest associations (r values ranging from 0.736 – 0.875) occurred
in correlation with quality, color, chlorophyll and shoot growth (Table 3-10). There was no
significant correlation between CM and other evaluations (Table 3-10). The strongest correlation
(r = 0.93) occurred between visual quality and color ratings (Table 3-10).
Chlorophyll level was positively correlated with N rate, quality, color and shoot growth
(Table 3-10). Correlation of chlorophyll level and shoot growth were generally high (r = 0.645)
with significantly correlated evaluations. NO3-N leaching was also correlated with N rate,
quality, color, and shoot growth. When shoot growth increased, the NO3-N leaching decreased
in general. This not surprising, as more shoot growth provides more ground cover more tissue to
absorb applied N.
Conclusions
This research provides information about the effect of CM and N rate on NO3-N leaching,
shoot growth, TKN concentration, N uptake, quality, and chlorophyll level.
36

37
Returning clippings resulted in lower turf quality and chlorophyll index than removing clippings.
Total NO3-N leached from CRT ranged from 114.6 to 7379.1 mg m-2 , while the range was from
123.1 to 1537.6 mg m-2 under CRM. The average concentration of NO3-N leached ranged 0.23
to 6.47 mg L-2, with significantly higher NO3-N leached From the highest N rate (294 kg N ha-1).
From the results of this research, it is important to apply N at rates below 196 kg N ha-1 per
application to avoid NO3-N leaching in Empire zoysiagrass. The potential for leaching was
greater under a combination of CRT and high N rates, particularly under heavy rainfall.
These results generally contradict previous studies on clipping-return effect, which showed
reduced NO3-N leaching under CRT in cool-season grasses. Thus, further research is required to
verify verify the effect of clipping management and N rate on NO3-N leaching and turf quality in
Empire zoysiagrass.

38
Table 3-1. N leaching (mg m-2) of Empire Zoysiagrass in response to N rates and Clipping Management (CM) June July Aug Oct Total N-rate
(kg ha-1) CRT† CRM‡ CRT CRM CRT CRMSep
CRT CRM CRT CRM
0 9.8b 20.5 3.7b 5.6 3.5b 11.2b 1.6 b§ 0.8b 2.7b 114.6 b 242.5 b 49 5.7b 12.8 2.3b 3.2 4.6b 3.7b 1.3 b 3.7b 1.3b 121.2 b 123.1 b 98 10.0b 12.8 1.9b 7.5 3.1b 5.2b 2.6 b 4.2b 9.2b 131.0 b 261.5 b 147 20.1b 16.0 2.1b 18.1 4.6b 6.8b 2.0 b 2.6b 5.5b 146.3 b 363.0 b 196 85.8b 75.6 11.7b 7.6 16.9b 3.1b 2.1 b 5.1ab 13.6b 530.2 b 412.6 b 294 1307.7a 32.3 225.4a 30.5 206.6a 50.9a 12.6 a 9.6a 60.6a 7379.1 a 1537.6 a
ANOVA
N-rate (N) 0.0067 <.0001 <.0001 <.0001 0.0010 <.0001
CM 0.0220 0.0375 NS NS 0.0247 NS
N × CM 0.0073 <.0001 0.0160 NS 0.0218 0.0061 §Means followed by the same letter within each column for each N rate and clipping management are not significantly different at P=0.05. NS= not significant †CRT-Clippings returned. ‡CRM-clippings removed.

39
Table 3-2. Correlation (r2) between NO3-N leaching of 294 kg N ha-1 rate for CRT plots vs. Rainfall during trial period
Rainfall r2 p-value
mg m-2 0.372 0.0157* NO3-N
Leaching mg L-1 0.331 0.0307*
*, **, *** Significant at the 0.05, 0.01, and 0.001 probability levels, respectively. Table 3-3. NO3-N leaching mass (mg m-2) and concentration (mg L-1) of 294 kg N ha-1 rate for
CRT and Rainfall* (mm) during trial period. Jun Jul Aug Sep Oct
(mg m-2) 2867.7 2493.3 1812.3 121.6 84.2 NO3-N leaching (mg L-1) 28.1 a§ 18.5 ab 11.0 ab 1.2 b 0.8 b
Rainfall (mm) 91.9 102.6 116.1 44.5 43.9 *Data from Florida Automated Weather Network (FAWN) were edited §Means followed by the same letter within each column for each N rate and clipping management are not significantly different at P=0.05. Table 3-4. Percentage loss of applied fertilizer N from Zoysiagrass soil under varying N rates,
and Clipping Management (CM). Percentage Loss of Applied N N Rate
CRT CRM Kg N ha-1
%
49 -0.19 0.09 98 -0.01 2.08 147 0.26 1.97 196 0.84 1.47 294 11.97 2.16
ANOVA N-rate (N) 0.0037
CM NS N × CM 0.0119
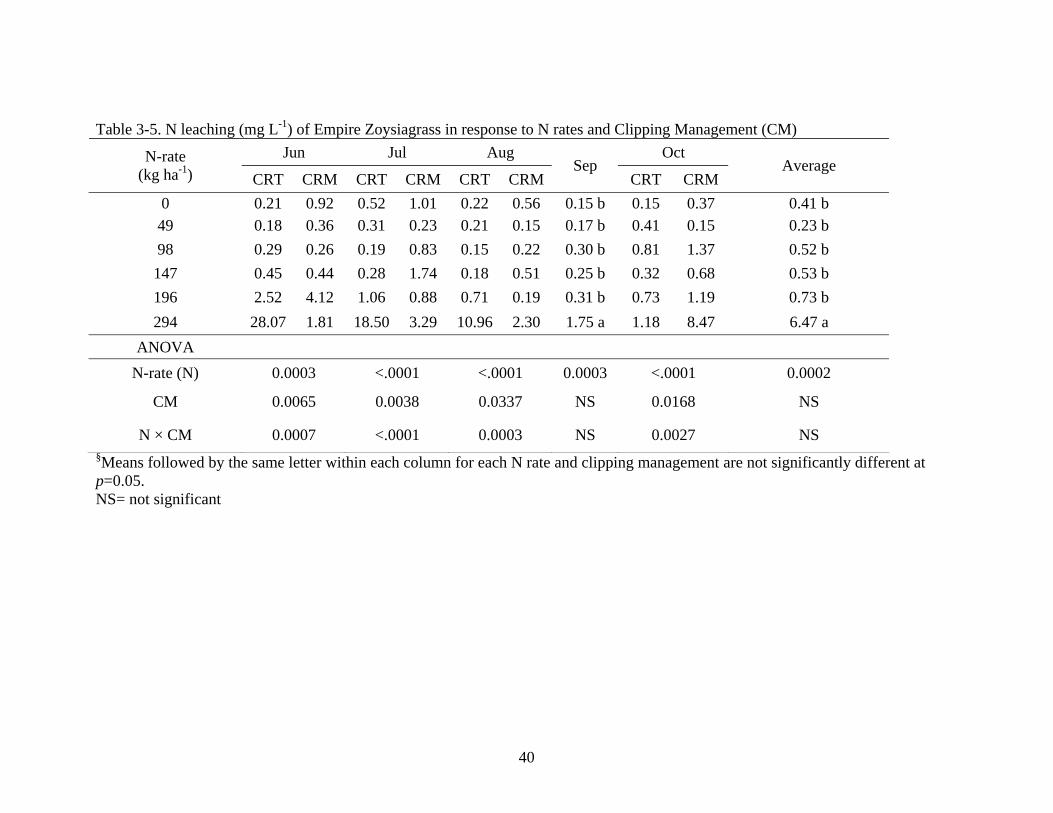
Table 3-5. N leaching (mg L-1) of Empire Zoysiagrass in response to N rates and Clipping Management (CM) Jun Jul Aug Oct N-rate
(kg ha-1) CRT CRM CRT CRM CRT CRMSep
CRT CRMAverage
0 0.21 0.92 0.52 1.01 0.22 0.56 0.15 b 0.15 0.37 0.41 b 49 0.18 0.36 0.31 0.23 0.21 0.15 0.17 b 0.41 0.15 0.23 b 98 0.29 0.26 0.19 0.83 0.15 0.22 0.30 b 0.81 1.37 0.52 b 147 0.45 0.44 0.28 1.74 0.18 0.51 0.25 b 0.32 0.68 0.53 b 196 2.52 4.12 1.06 0.88 0.71 0.19 0.31 b 0.73 1.19 0.73 b 294 28.07 1.81 18.50 3.29 10.96 2.30 1.75 a 1.18 8.47 6.47 a
ANOVA N-rate (N) 0.0003 <.0001 <.0001 0.0003 <.0001 0.0002
CM 0.0065 0.0038 0.0337 NS 0.0168 NS
N × CM 0.0007 <.0001 0.0003 NS 0.0027 NS §Means followed by the same letter within each column for each N rate and clipping management are not significantly different at p=0.05. NS= not significant
40

Table 3-6. Turf shoot and root growth in response to N rates and Clipping Management (CM). Shoot growth (g m-2 day-1) N-rate
(kg ha-1) Jul Aug Sep Oct Average Root
Weight (g)
0 3.26 c 0.91 d 3.31 d 8.37 c 3.96 d 1.03 49 6.55 c 1.65 d 6.67 cd 17.18 bc 8.01 cd 0.62 98 7.83 c 2.38 cd 11.04 c 22.48 bc 10.93 bcd 0.80 147 23.13 b 3.77 bc 19.74 b 28.94 b 18.89 b 0.72 196 16.14 b 4.37 ab 19.52 b 27.72 b 16.94 bc 0.77
294 41.84 a 5.88 a 29.65 a 47.32 a 31.18 a 0.53 CM
Return 11.11 b 4.52 a 12.42 b 24.39 13.11 0.69 Remove 21.81 a 1.80 b 17.55 a 26.29 16.86 0.80 ANOVA
N-rate (N) <0.0001 <0.0001 <0.0001 0.0050 <0.0001 NS§
CM <0.0001 <0.0001 0.0062 NS NS NS N × CM NS 0.0026 NS NS NS NS
§Means followed by the same letter within each column for each N rate and clipping management are not significantly different at P=0.05. NS= not significant
41

Table 3-7. Total Kjeldahl Nitrogen percentage and N uptake of Empire Zoysiagrass in response to N rates and Clipping Management. % TKN N uptake‡ (mg m-2) N-rate
(kg ha-1) Jul Aug Sep Oct Average Jul Aug Sep Oct Average0 1.55 1.70 1.48 b§ 1.43 ab 1.54 50.5 d 13.9 d 50.8 c 127.9 c 60.8 c 49 1.73 1.67 1.53 ab 1.37 b 1.58 102.2 cd 25.7 d 104.7 c 268.2 bc 125.2 bc98 1.72 1.69 1.53 ab 1.42 ab 1.59 123.7 cd 37.8 cd 174.7 bc 354.1 bc 172.6 bc147 1.45 1.78 1.58 ab 1.45 ab 1.57 365.8 b 58.3 bc 313.1 b 447.4 b 296.1 b 196 1.62 1.83 1.75 ab 1.41 ab 1.65 264.6 bc 74.9 ab 322.6 b 457.6 b 279.9 b 294 1.59 1.79 1.80 a 1.59 a 1.70 709.3 a 99.9 a 503.9 a 804.2 a 529.3 a
Clipping Management
Return 1.56 1.74 1.57 1.52 a 1.60 182.3 b 74.4 a 202.9 b 398.4 214.5 Remove 1.66 1.75 1.65 1.38 b 1.61 356.4 a 29.1 b 287.0 a 421.4 273.5 ANOVA
N-rate (N) NS NS 0.0185 0.0233 NS <0.0001 <0.0001 <0.0001 0.0033 <0.0001 Clipping (C) NS NS NS 0.0004 NS <0.0001 <0.0001 0.0142 NS NS
N × C NS NS NS NS NS NS 0.0035 NS NS NS §Means followed by the same letter within each column for each N rate and clipping management are not significantly different at P=0.05. ‡N uptake (mg m-2) = Dry Shoot growth × % TKN
42

43
Table 3-8. Visual quality and color score of Empire Zoysiagrass in response to N rates and Clipping Management (CM) in a field experiment
Quality Color N-rate (kg ha-1) Jun Jul Aug Sep Oct Average Jun Jul Aug Sep Oct Average
0 5.78d§ 6.55d 7.03d 7.01c 7.32d 6.75d 6.02d 6.57c 6.83d 7.01d 6.87d 6.67c 49 6.40c 7.05c 7.68bc 7.57b 7.95c 7.33c 6.43c 7.10b 7.47c 7.70c 7.30c 7.18b 98 6.32c 7.03c 7.65c 7.80b 8.02bc 7.35c 6.45c 7.23b 7.62bc 7.90b 7.50bc 7.33b 147 7.10b 7.72b 8.07a 8.10a 8.28ab 7.87b 7.13b 7.87a 7.88ab 8.20a 7.70ab 7.73a 196 6.63c 7.75ab 8.02ab 8.12a 8.30ab 7.75b 6.77bc 7.88a 7.87ab 8.17a 7.72ab 7.68a 294 7.90a 8.13a 8.25a 8.28a 8.43a 8.20a 7.65 a 8.05a 7.93a 8.22a 7.73a 7.92a CM
Return 6.57b 7.17b 7.58b 7.78 7.98 7.41 b 6.60 b 7.28 b 7.58 7.89 7.52 7.36 Remove 6.81a 7.57a 7.98a 7.87 8.12 7.67 a 6.88 a 7.62 a 7.62 7.86 7.42 7.48 ANOVA
N-rate (N) *** *** *** *** *** *** *** *** *** *** *** *** CM * *** *** NS NS ** * ** NS NS NS NS
N × CM NS NS NS NS NS NS NS NS NS NS NS NS *, **, *** Significant at the 0.05, 0.01, and 0.001 probability levels, respectively. / NS: Not Significant §Means followed by the same letter within each column for each N rate and clipping management are not significantly different at P=0.05. NS= Not Significant at P=0.05

44
Table 3-9. Chlorophyll Index of Empire Zoysiagrass in response to N rates and Clipping Management (CM).
Chlorophyll Index N-rate (kg ha-1) Jul Aug Sep Oct Average
0 236.5 c§ 220.50 d 213.2 c 197.2 c 216.8 d 49 306.3 b 271.8 bc 253.4 b 209.8 bc 260.2 c 98 323.5 b 299.92 a 273.1 ab 227.1 ab 280.9 b
147 374.8 a 285.0 ab 276.9 ab 230.5 a 291.8 ab 196 381.2 a 303.08 a 287.27 a 240.6 a 303.1 a
294 381.9 a 257.08 c 274.4 ab 231.0 a 286.1 ab CM
Return 330.01 a 279.1 a 238.9 b 212.8 b 265.2 b Remove 338.04 a 266.5 a 287.2 a 232.6 a 281.1 a ANOVA
N-rate (N) <0.0001 <0.0001 <0.0001 0.0015 <0.0001 CM NS 0.0509 <0.0001 0.0015 0.0047
N × CM NS NS NS NS NS §Means followed by the same letter within each column for each N rate and clipping management are not significantly different at P=0.05.

Table 3-10. Correlation coefficients for N rate, clipping management, quality, color, chlorophyll, NO3-N Leaching, and Shoot growth. N-rates CM Quality Color Chlorophyll NO3-N Leaching Shoot growth
r - 0.000 0.858 0.875 0.736 0.519 0.812 N-rates P - 1.000 <0.0001 <0.0001 <0.0001 0.0012 <0.0001 r 0.000 - -0.255 -0.128 -0.247 0.24 -0.183
CM P 1.000 - 0.134 0.4557 0.1472 0.1587 0.286 r 0.858 -0.255 - 0.93 0.823 0.382 0.866
Quality P <0.0001 0.134 - <0.0001 <0.0001 0.0214 <0.0001 r 0.875 -0.128 0.93 - 0.824 0.443 0.859
Color P <0.0001 0.4557 <0.0001 - <0.0001 0.0069 <0.0001 r 0.736 -0.247 0.823 0.824 - 0.082 0.645 Chlorophyll P <0.0001 0.1472 <0.0001 <0.0001 - 0.6358 <0.0001 r 0.519 0.24 0.382 0.443 0.082 - 0.51 NO3-N
Leaching P 0.0012 0.1587 0.0214 0.0069 0.6358 - 0.0015 r 0.812 -0.183 0.866 0.859 0.645 0.51 -
Shoot growth P <0.0001 0.286 <0.0001 <0.0001 <0.0001 -0.0015 -
45

0
200
400
600
800
1000
1200
1400
0 49 98 147 196 294
NO 3
-N (m
g m
-2)
(a)
(NS) (NS) (NS) (NS) (NS) (***)
0
50
100
150
200
250
0 49 98 147 196 294
NO 3
-N (m
g m
-2)
(NS) (NS) (NS) (NS) (NS) (***)
(b)
0
50
100
150
200
250
0 49 98 147 196 294
N rate (kg ha-1 yr-1)
NO 3
-N (m
g m
-2)
CRT CRM
(NS) (NS) (NS) (NS) (NS) (***)
(c)
0
10
20
30
40
50
60
70
0 49 98 147 196 294
N rate (kg ha-1 yr-1)
NO 3
-N (m
g m
-2)
CRT CRM
(NS) (NS) (NS) (NS) (NS) (***)
(d)
010002000
3000400050006000
70008000
0 49 98 147 196 294
N rate (kg ha-1 yr-1)
NO 3-
N (m
g m
-2)
CRT CRM
(NS) (NS) (NS) (NS) (***) (NS)
(e)
Figure 3-1. Interaction between clipping management (CM) and N rate with respect to
NO3-N leaching (mg m-2) from Empire Zoysiagrass in June (a), July (b), August (c), October (d), and total (e). (NS: Not significant, ***: Significant at p=0.05 between N rates)
46
0.00
500.00
1000.00
1500.00
2000.00
2500.00
3000.00
3500.00
June July Aug Sep Oct0
20
40
60
80
100
120
140Nitrate leaching (mg m-2) Rainfall(mm)
Fig. 3-2. Comparison of monthly rainfall and nitrate (NO3-N) leaching.
47

`
0
2
4
6
8
10
12
14
16
18
20
0 49 98 147 196 294
N rate (Kg ha-1 yr-1)
0
5
10
15
20
25
30
0 49 98 147 196 294
N rate (Kg ha-1 yr-1)
Con
cent
ratio
n (m
g L
-1) o
f NO 3
-N
leac
hing
June July August October
Figure 3-3. Interaction between clipping management (CM) and N rate with respect to NO3-N leaching (mg L-1) from Empire Zoysiagrass in June (upper left), July (upper right), August (bottom left), and October (bottom right).
0
2
4
6
8
12
10
0 49 98 147 196 294
N rate (Kg ha-1 yr-1)
Con
cent
ratio
n (m
g L
-1) o
f NO 3
-N
leac
hing
0
2
4
6
8
10
0 49 98 147 196 294
N rat e ( Kg ha - 1 yr - 1 )
CRT CRMCRT CRM
48

0
5
10
15
20
25
30
35
0 49 98 147 196 294
N rate (kg ha-1)
Shoo
t Wei
ght (
g m
-2)
Clipping-returnClipping-remove
Figure 3-4. Interaction between clipping management (CM) and N rate with respect to shoot weight (g m-2day-1) from Empire Zoysiagrass in August
0.00
20.00
40.00
60.00
80.00
100.00
120.00
140.00
160.00
180.00
0 49 98 147 196 294
N rate (kg ha-1)
N up
take
(mg
m-2
)
Clipping-returnClipping-remove
Figure 3-5. Interaction between clipping management (CM) and N rate with respect to N
uptake (g m-2) from Empire Zoysiagrass in August
49

150
170
190
210
230
250
270
290Ch
loro
phyl
l lev
el
N rates
Control 49 kg N ha-1 98 kg N ha-1 147 kg N ha-1 196 kg N ha-1 294 kg N ha-1
D AB B C AB A
Figure 3-6. Chlorophyll level by N rate treatment for ‘Empire’ Zoysiagrass
255
260
265
270
275
280
285
Chl
orop
hyll
leve
l
Clipping Management
Clipping-Remove Clipping-Remove
AB
Figure 3-7. Chlorophyll level by Clipping treatment for ‘Empire’ Zoysiagrass
50

CHAPTER 4 EFFECT OF MULTISPECTRAL REFLECTANCE AND CORRELATION OF
QUALITY AND LEACHING IN EMPIRE ZOYSIAGRASS
Introduction
Turfgrass research typically uses qualitative visual measurements to compare effects
of treatments. These measurements include over all turf quality and may often include
related parameters such as turf color, density, percent green or injured, etc. While these
ratings may produce solid statistical data, technology has been developed to determine
ability to quantify these subjective ratings. Use of multispectral reflectance has been used
by a number of researchers in turf systems. Trenholm et al. (1999a) observed that
reflectance at particular wavelengths throughout the visible spectrum was highly
correlated with visual turf quality scores, shoot density, and shoot tissue injury in
seashore paspalum (Paspalum vaginatum Swartz.) and hybrid bermudagrass (Cynodon
dactylon x C. transvaalensis Burtt-Davy). Reflectance at 661 and 813 nm had the
strongest correlations, as did several growth and stress indices using both visual spectrum
and near infrared (NIR) wavelengths. Trenholm et al. (1999b) further observed that
reflectance could be reliably used to discriminate between wear injury. Spectral
reflectance was also used to distinguish between N application, herbicide stress, and C3
vs. C4 grasses (Trenholm et al., 2000). Higher reflectance in the visible range (400-700
nm) indicates less plant light attenuation and utilization at those wavelengths and has
been associated with stress or nutritional deficiency. Growth indices NDVI (normalized
difference vegetation index)and LAI (leaf area index) have been associated with crop
growth and yield (Asrar et al., 1984) and with healthy turfgrass growth and shoot density
(Trenholm, et al., 1999). Higher values indicate optimal performance, and Stress1
(reflectance at wavelength 710/wavelength 760) and Stress2 (reflectance at wavelength
51

710/wavelength 810) indices are associated with turf stress response, where lower values
indicate lower stress levels and better performance.
There are at least 10 species of zoysiagrass (Zoysia spp. Willd.), all of which have
originated from the Orient (Christians, 2007). They include Korean (or Japanese)
lawngrass (Zoysia japonica Steud.), which is the most widely used species in the United
States (Christians, 2007). Zoysia japonica is well adapted to use on golf courses
fairways and tees and some cultivars appear to be well suited to home lawn use
(Trenholm and Unruh, 2005a), fair shade, and salinity tolerance (Christians, 2007). It also
stands up well to traffic and has been reported to tolerate drought while maintaining
relatively low levels of disease and insect damage (Christians, 2007). ‘Empire’
zoysiagrass is a native proprietary selection of Zoysia japonica. It has performed well in
trials in Florida and appears to require less nitrogen than other zoysiagrass cultivars
(Trenholm and Unruh, 2009). It is currently being used increasingly in home lawns
throughout Florida.
Turf shoot clippings have often been considered a nuisance product to dispose of,
although the clippings contain abundant nutrients and are a source of organic matter.
Removing clippings from turf causes N loss from the system. Starr and DeRoo (1981)
examined the various effects of clipping-return while evaluating the fate of N fertilizer
with Kentucky bluegrass mix (Poa pratensis L.) and creeping red fescue (Festuca rubra
L.). The study spanned 3 years and used a suction lysimeter with 15N labeling to trace the
fate of N from clippings and fertilizer. Return of clippings to the turf increased the total N
uptake of the harvested grass by 19, 41, and 74% for the 3 consecutive years of the
experiment. In the clipping returned treatment, yield and growth of the grass increased
52

by about 30%. The tissue N concentration from clipping-removed treatment was derived
equally from soil and fertilizer, whereas the tissue N concentration from clipping-
returned treatment was derived from equal amounts of N from soil, fertilizer, and
clipping-return.
No information is available on the spectral responses for turfgrasses due to clipping
management. Therefore, the objectives of this study were to evaluate responses of
zoysiagrass to N rate and clipping treatment using spectral reflectance data and to
determine the degree of association between reflectance values and other measurements
such as nitrate leaching, quality, color and shoot growth.
Materials and Methods
The field experiment was conducted at the University of Florida Plant Science
Research and Education Center in Citra, Florida on ‘Empire’ zoysiagrass (Zoysia
japonica Steud.). The grass was established in March 2008 and the study was conducted
from June to October 2008.
Clipping-management (CM) and nitrogen (N) fertilizer treatments were as
follows:
• CM #1 consisted of clipping-return, in which clippings were left in the experimental field after mowing with a conventional rotary mower.
• CM#2 consisted of clipping-removal, in which clippings were taken from the field by attaching a collection bag to the mower.
Mowing height was set at 6.3 cm (2.5 inches). The plots were mowed once a week
throughout the study period.
Fertilizer treatments consisted of six levels of total N rates (equivalent to 0 lbs, 1
lbs, 2 lbs, 3 lbs, 4 lbs or 6lbs N 1,000 ft-2 or 0 kg, 49 kg, 98 kg, 147 kg, 196 kg, or 294 kg
53

N ha-1). Treatments were applied at 2-mo intervals for a total of two treatment
applications. A 50% quick-release fertilizer (QRF) and 50% slow-release fertilizer (SRF)
of 15N-0P-15K were used. The area was irrigated to replace evapotranspiration (ET) as
needed to maintain healthy turf.
Turf was evaluated visually for quality and color, which were rated immediately
after mowing. A scale of 1 to 9 was used, in which 9 represents optimal, dark green color
and 1 represents dead, brown turf. A rating of 6 was considered minimally acceptable for
a home lawn.
Soil moisture (SM), canopy temperature (CT), chlorophyll content (CC), and
multispectral reflectance (MSR) were also measured. Soil moisture content was
quantified weekly using a Time Domain Reflectometer (TRD) (IMIKO Micromodule
Technik GmbH; Ettingen, Germany).
Multispectral reflectance readings were taken every 7-10 days with a Cropscan
MSR16 radiometer (Cropscan, Inc., Rochester, MN); The radiometer was fitted with
filter wavelengths to measure reflectance at 450, 550, 660, 694, 710, 760, 810, and 930
nm. In addition, the following growth and stress indices were evaluated:
• NDVI (normalized difference vegetation index) growth index computed as R930 -R660/R930 + R660. Best = highest value.
• IR/R (leaf area index) growth index computed as R930/R660. Best = highest value.
• Stress1 index computed as R710/R760. Best = lowest value.
• Stress2 index computed as R710/R810. Best = lowest value.
Nitrate leaching and shoot growth collection methodologies were previously described in
Chapter 3.
54
This experiment was arranged as a nested design by CM, with fertilizer treatments
randomized within. There were three replications. Data were analyzed with the SAS
procedure ANOVA or CORR (SAS institute Inc., Cary. NC). Significance was
determined at the 0.05 probability level.
Results and Discussion
MultiSpectral Reflectance (MSR)
There were few differences in reflectance scores due to CM f in the weeks
following the first fertilizer treatment (WAFT), (Table 4-1). There were differences in
reflectance at all wavelengths and in all indices (P<0.001) at 1 week after second
treatment (WAST), with better values occurring in CRM plots (Table 4-2), which means
that CRT plots had more stress than CRM plots (Table 4-2). At 3 WAST, stress indices
also showed that the CRT plots had more stress than the CRM plots (data not shown).
Reflectance at 450 nm at 5 WAST consistently showed that the CRT plots had more
stress than the CRM plots (data not shown).
In general, N treatment had significant difference at PAR range (450-710) and
growth (NDVI, and IR/R) and stress (ST-1, and ST-2) indices at between 1 WAFT and 1
WAST (Table 4-1). At 3 WAST, stress indices showed that lower N rate plots had higher
reflectance and therefore less ability to assimilate and use light at the various
wavelengths measeured than higher rate plots (data not shown). Throughout the
evaluation period, higher N rate plots generally had lower reflectance than lower N rate
(Table 4-1 and 4-2). Similar results were reported by Trenholm et al. (2000). They
observed that there were consistent differences due to N rate throughout the visible range
wavelengths. The reflectance was consistently greater at the lowest N.
55

Correlation between Multispectral Reflectance (MSR) vs. N rate, CM, Growth, and Quality.
N Rate vs. Reflectance
N rate was correlated with spectral reflectance at 450 and 550 nm and the ratios
NDVI, ST-1, ST-2, and IR/R (Table 4-3). Highest r values (0.490-0.638) were obtained
from 450 nm, NDVI, ST-1, ST-2, IR/R (Table 4-3). Lower N rate indicated higher
reflectance and stress (ST-1, and ST-2) caused by N deficiency (Table 4-3).
CM vs. Reflectance
There was no correlation between any of the wavelengths evaluated and CM
(Table 4-4). However, response of CM to growth and stress indices was significant (r =
0.383-0.458), with lowest vales seen with IR/R and highest with NDVI (Table 4-4). The
negative correlation between CM and growth indices (NDVI and IR/R) and positive
correlation between CM and Stress indices implies that CRT had less turf growth and
higher stress than CRM treatment (Table 4-4). This was different from the result of
Heckman et al.(2000) who reported a productive effect of CRT on shoot growth and turf
quality.
There are several possibilities about the effect of CRT on turf health. First
possibility was evaluation timing for MSR, which was evaluated immediately after
mowing event. Clippings in CRT plots possibly affected reflectance readings.
Second, for zoysiagrass, CRT may require longer time periods for satisfactory
effect on turf growth and health due to their physiological difference from cool-season
grasses. Sartain (1993) reported that the clipping yield and quality of one warm-season
grass (‘Tifway’ bermudagrass) species and one cool-season grass (‘Pennant’ perennial
ryegrass) increased when clippings were returned for three years. The other possibility
56

may result from mower difference. Regular rotary mower was used rather than mulching
mower Heckman et al (2000) used. In general, warm-season grasses grow faster and
more active in summer than cool-season grasses. We mowed weekly with cutting height
of 6.3 cm regardless of growing status. Clippings may cover turf effectively from
sunlight while reducing chlorophyll level of tissue. NDVI is related to chlorophyll
concentration (Filella et al., 1995). The NDVI index (-0.458) showed that CRT treatment
had less chlorophyll concentration (Table 4-3).
Visual Quality and Color vs. Reflectance
Similar responses were seen for visual quality and color at varying reflectance.
Quality and color were negatively correlated with reflectance at 450 and 660 nm, (Table
4-3). The correlation coefficient ranged from -0.358 to -0.702 for quality, and -0.335 to -
0.627 for color (Table 4-3). Turf quality and color were highly correlated with all growth
and stress indices (Table 4-3). Correlation coefficients all showed a high degree of
association with quality (0.698-0.804) and color (0.639-0.762); relations were positively
associated for growth indices NDVI and IR/R and were negatively for the stress indices
(Table 4-3).
NO3-N Leaching vs. Reflectance
Reflectance was not correlated with NO3-N leaching data at any individual
wavelength or indices (Table 4-3). This is somewhat surprising, since NO3-N leaching
was positively correlated with N rate, quality, color, and chlorophyll level (r=0.382 to
0.519) (Table 3-9) and it could be speculated that stronger, more dense grass associated
with increased N rate, quality, and color would reduce leaching.
57

58
Shoot Growth vs. Reflectance
Reflectance at 450 nm was correlated with shoot growth (Table 4-3). In this
study, highest values were found in reflectance at wavelength 450nm, NDVI, ST-1, ST-2,
and IR/R (r = -0.529, 0.548, -0.655, -0.656, and 0.661, respectively) (Table 4-3).
Conclusions
This research provides information about the effect of CM and N rate on spectral
reflectance responses of Empire zoysiagrass. There was very little response to any
reflectance values to CM, except for the values taken the week following the second
fertilizer application. Reflectance values did vary due to N rate and showed several strong
associations with other measured parameters.
From the results of this research, it appears that CM has little effect on turf light
attenuation through the visible range wavelengths and that it has little effect on the
associated physiological functions. Results also indicate that it is not practical to use this
methodology to predict nitrate leaching from Empire zoysiagrass
Further research should be done to determine if multiple years will provide
similar results regarding nitrate leaching and spectral reflectance correlations and
responses.
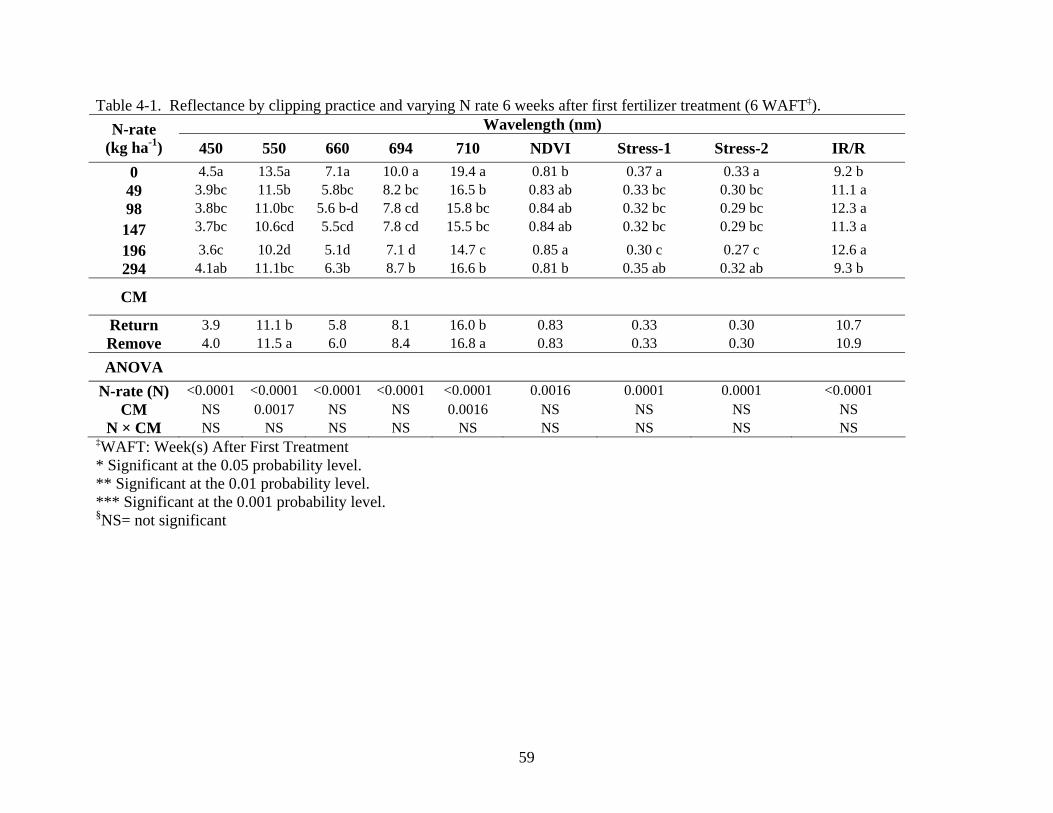
Table 4-1. Reflectance by clipping practice and varying N rate 6 weeks after first fertilizer treatment (6 WAFT‡). Wavelength (nm) N-rate
(kg ha-1) 450 550 660 694 710 NDVI Stress-1 Stress-2 IR/R 0 4.5a 13.5a 7.1a 10.0 a 19.4 a 0.81 b 0.37 a 0.33 a 9.2 b 49 3.9bc 11.5b 5.8bc 8.2 bc 16.5 b 0.83 ab 0.33 bc 0.30 bc 11.1 a 98 3.8bc 11.0bc 5.6 b-d 7.8 cd 15.8 bc 0.84 ab 0.32 bc 0.29 bc 12.3 a 147 3.7bc 10.6cd 5.5cd 7.8 cd 15.5 bc 0.84 ab 0.32 bc 0.29 bc 11.3 a 196 3.6c 10.2d 5.1d 7.1 d 14.7 c 0.85 a 0.30 c 0.27 c 12.6 a 294 4.1ab 11.1bc 6.3b 8.7 b 16.6 b 0.81 b 0.35 ab 0.32 ab 9.3 b
CM
Return 3.9 11.1 b 5.8 8.1 16.0 b 0.83 0.33 0.30 10.7 Remove 4.0 11.5 a 6.0 8.4 16.8 a 0.83 0.33 0.30 10.9 ANOVA
N-rate (N) <0.0001 <0.0001 <0.0001 <0.0001 <0.0001 0.0016 0.0001 0.0001 <0.0001 CM NS 0.0017 NS NS 0.0016 NS NS NS NS
N × CM NS NS NS NS NS NS NS NS NS ‡WAFT: Week(s) After First Treatment * Significant at the 0.05 probability level. ** Significant at the 0.01 probability level. *** Significant at the 0.001 probability level. §NS= not significant
59

Table 4-2. Reflectance by clipping practice and varying N rate 1 week after second fertilizer treatment (1 WAST). Wavelength (nm) N-rate
(kg ha-1) 450 550 660 694 710 NDVI Stress-1 Stress-2 IR/R 0 4.3 a 13.8 a 8.4 a 12.2 a 22.1 a 0.75 0.43 a 0.41 a 6.3 b 49 3.6 b 11.5 b 6.8 ab 10.1ab 18.9 b 0.77 0.40 ab 0.38 ab 7.7 ab 98 3.4 b 10.6bc 6.7 ab 9.7 b 17.9 bc 0.77 0.40 ab 0.37 ab 8.0 ab 147 3.3 b 10.1b-d 6.3 b 9.0 b 16.8 b-d 0.78 0.37 ab 0.35 ab 8.5 ab 196 3.0 b 9.3 d 5.4 b 7.9 b 15.2 d 0.81 0.33 b 0.31 b 10.1 a 294 3.3 b 9.6 d 6.2 b 8.7 b 15.7 cd 0.78 0.37 ab 0.34 ab 9.1 a CM
Return 3.8 a 11.5 a 7.5 a 10.8 a 19.2 a 0.74 b 0.43 a 0.41 a 6.8 b Remove 3.2 b 10.2 b 5.7 b 8.4 b 16.3 b 0.81 a 0.33 b 0.31 b 9.7 a ANOVA
N-rate (N) <.0001 <.0001 0.002 0.0003 <.0001 NS 0.050 0.0266 0.004 CM 0.0002 <.0001 <.0001 <.0001 <.0001 <.0001 <.0001 <.0001 <.0001
N × CM NS NS NS NS NS NS NS NS NS * Significant at the 0.05 probability level. ** Significant at the 0.01 probability level. *** Significant at the 0.001 probability level. §NS= not significant
60

Table 4-3. Correlation Coefficients for reflectance vs. N rate, clipping management, quality, color, chlorophyll, N leaching, and shoot growth.
61
Wavelength (nm)
450 550 660 694
760 810 NDVI Stress-1 Stress-2 IR/R
N-rates -0.545 (0.0006)
-0.344 (0.040)
-0.304 (NS)
-0.190 (NS)
0.226 (NS)
0.243 (NS)
0.490 (0.002)
-0.626 (<0.0001)
-0.638 (<0.0001)
0.561 (0.0004)
CM 0.249 (NS)
-0.021 (NS)
0.199 (NS)
0.105 (NS)
-0.253 (NS)
-0.245 (NS)
-0.458 (0.005)
0.418 (0.011)
0.397 (0.017)
-0.383 (0.021)
Quality -0.702 (<0.0001)
-0.358 (0.032)
-0.417 (0.011)
-0.254 (NS)
0.338 (0.044)
0.364 (0.029)
0.698 (<0.0001)
-0.795 (<0.0001)
-0.804 (<0.0001)
0.771 (<0.0001)
Color -0.627 (<0.0001)
-0.335 (0.046)
-0.358 (0.032)
-0.207 (NS)
0.342 (0.041)
0.368 (0.027)
0.639 (<0.0001)
-0.750 (<0.0001)
-0.762 (<0.0001)
0.726 (<0.0001)
Chlorophyll -0.760 (<0.0001)
-0.479 (0.003)
-0.554 (0.0005)
-0.404 (0.015)
0.226 (NS)
0.265 (NS)
0.737 (<0.0001)
-0.830 (<0.0001)
-0.839 (<0.0001)
0.812 (<0.0001)
N-leaching -0.017 (NS)
0.094 (NS)
0.219 (NS)
0.242 (NS)
0.188 (NS)
0.159 (NS)
-0.105 (NS)
-0.010 (NS)
-0.015 (NS)
-0.042 (NS)
Shoot Yield -0.529 (0.0009)
-0.222 (NS)
-0.262 (NS)
-0.134 (NS)
0.338 (0.044)
0.350 (0.037)
0.548 (0.0005)
-0.655 (<0.0001)
-0.656 (<0.0001)
0.661 (<0.0001)
( ): p-value §NS= not significant

CHAPTER 5 CONCLUSIONS
Six different N rates and two clipping management (return vs. remove) were studied for
their effects on NO3-N leaching, shoot growth, TKN concentration, turf visual quality and color,
chlorophyll content, and multispectral reflectance (MSR) in Empire zoysiagrass in 2008.
There were differences in NO3-N leaching, shoot growth, turf visual quality and color,
and chlorophyll content due to N rate. Interestingly, however, there were no significant
difference in NO3-N leaching, shoot growth, TKN concentration, and turf visual color between
CRT and CRM treatment. Even CRM had higher score in turf visual quality and chlorophyll
content than CRT treatment. However, there was significant interaction for NO3-N leaching
between CM and N rate treatment during all trial periods except Sep. The NO3-N leachate
dramatically increased when the highest N rate (294 kg N ha-1) was combined with more CRT
treatment than CRM, resulting in nitrate-N leaching exceeding the USEPA standard. This result
implies that N returned from clippings increases in condition of high N rate. Thus, if to maintain
N environmentally safe is a goal through avoiding NO3-N leaching, it is important to abstain
from applying high N rate (over 196 kg N ha-1) combined with returning clippings to turf. If turf
grass clippings are returned, fertilizer rates should be reduced in high N rate.
These results are well supported through MSR data, in which any reflectance at varying
wavelengths had no differences with CM. However, responses of CM to growth and stress
indices were significantly different. The CRT showed less turf growth and higher stress than
CRM treatment through entire experiment period. Consistent results were also shown that higher
N rate plots generally had less stress than lower N rate.
Growth and stress indices such as NDVI, Stress, and IR/R showed the significant and
consistent linear correlation with all evaluations used in this study.

In sum, we conclude that CRT treatment caused higher stress and less turf health than
CRM treatment for Empire zoysiagrass in 2008. This may result from clipping size, which can
cause delay of clipping decomposition, by using rotary mower. Bigger clippings remain on the
turf surface longer, covering the surface and reducing photosynthesis activity of turf. This is
likely to reduce quality and color as well as chlorophyll level in shoot.
Because of different conclusions from previous research about the effect of CM, and
because of physiological or inter-species difference from other turf system, further studies on
mower effect of CM and other warm-season grasses are needed.

LIST OF REFERENCES
1. Asrar, G., M. Fuchs, E.T. Kanemasu, and J.L. Hatfield. 1984. Estimating absorbed photosynthetic radiation and leaf area index from spectral reflectance in wheat. Agron. J. 76:300-306.
2. Below, F.E. 2001. Nitrogen metabolism and crop productivity In Pessarakli, M (Ed.). Handbook of Plant and Crop Physiology, 2nd Ed. New York: Marcel Dekker, Inc. pp385-406.
3. Bigelow, C.A., D.W. Waddill, and D.R. Chalmers. 2005. Turf-type tall fescue lawn turf response to added clippings. Int. Turfgrass Soc. Res. J. 10:916-922.
4. Bloom, A.J., P.A. Meyerhoff, A.R. Taylor, and T.L. Rost. 2003. Root development and absorption of ammonium and nitrate from the rhizosphere. J. Plant Growth Regul. 21:416-431.
5. Bowman, D.C., J.L. Paul, W.B. Davis, and S.H. Nelson. 1989. Rapid depletion of nitrogen applied to Kenturky bluegrass turf. J. Am. Soc. Hortic. Sci. 114:229-233.
6. Bowman, D.C., D.A. Devitt, M.C. Engelke, and T.W. Rufty Jr. 1998. Root architecture affects nitrate leaching from bentgrass turf. Crop Sci. 38:1633-1639.
7. Bowman, D.C., C.T. Cherney, and T.W. Rufty, Jr. 2002. Fate and transport of nitrogen applied to six warm-season turfgrasses. Crop Sci. 42:833-841.
8. Brady, N.C. 1990. The Nature and Properties of Soils, 10th ed. New York: Macmillan Publishing. pp.315-338.
9. Carter, G.A. 1993. Responses of leaf spectral reflectance to plant stress, Am. J. Bot. 80:230-243
10. Carter, G.A. and R.L. Miller. 1994. Early detection of plant stress by digital imaging within narrow stress-sensitive wavebands. Remote Sens. Environ. 50:295-302.
11. Christians, N.E. 2007. Fundamentals of turfgrass management 3rd Ed. Hoboken, NJ: John Wiley & Sons, Inc. pp 9-12.
12. Environmental Protection Agency (EPA). 2006. National primary drinking water regulations: Technical factsheet on: Nitrate/nitrite. http://www.epa.gov/ogwdw000/dwh/t-ioc/nitrates.html (verified 18 September, 2008)
13. Erickson, J.E., J.L. Cisar, J.C. Volin, and G. H. Snyder. 2001. Comparing nitrogen runoff and leaching and between newly established St. Augustinegrass turf and an alternative residential landscape. Crop Sci.41: 1889-1895.

14. Erickson, J.E., J.L. Cisar, G.H. Snyder, D.M. Park, K.E. Williams. 2008. Does a mixed-species landscape reduce inorganic-nitrogen leaching compared to a conventional St. Augustinegrass lawn?. Crop Sci. 48: 1586-1594
15. Filella, I., L. Serrano, J. Serra and J. Peñuelas. 1995. Evaluating wheat nitrogen status with canopy reflectance indices and discriminant analysis. Crop Sci. 35:1400-1405.
16. Florida Department of Environmental Protection (FDEP). 2007. Best Management Practices for the enhancement of environmental quality on Florida golf courses.
17. Frank, K.W., O'Reilly, K. M., Crum, J. R., and Calhoun, R. N. 2006. The fate of nitrogen applied to a mature Kentucky bluegrass turf. Crop Sci. 46:209-215.
18. Geron, C.A., T.K. Danneberger, S.J. Traina, T.J. Logan, and J.R. Street. 1993. The effect of establishment methods and fertilization practices on nitrate leaching from turfgrass. J. Enriron. Qual. 22:119-125.
19. Glass, A.D.M. 2003. Nitrogen use efficiency of crop plants: Physiological constraints upon nitrogen absorption. Crit. Rev. Plant Sci. 22:453-470.
20. Gross, C.M., J.S. Angle, and M.S. Welterlen. 1990. Nutrient and sediment losses from turfgrass. J. Environ. Qual. 19:663-668.
21. Guillard, K., and K.L. Kopp. 2004. Nitrogen fertilizer form and associated nitrate leaching from cool-season lawn turf. J. Environ. Qual. 33:1822-1827.
22. Gupta, S.K., R.C. Gupta, S.K. Chhabra, S. Eskiocak, A.B. Gupta, and R. Gupta. 2008. Health issues related to N pollution in water and air. Current Sci. 94:1469-1477.
23. Heckman, J.R., H. Liu, W. Hill, M. DeMilia, and W.L. Anastasia. 2000. Kentucky bluegrass responses to mowing practice and nitrogen fertility management. J. Sustain Agr. 15:25-33.
24. Hull, R.J., and H. Liu. 2005. Turfgrass nitrogen: Physiology and environmental impacts. Int. Turfgrass Soc. Res. J. 10:962-975.
25. Jackson, L.E., M. Burger, and T.R. Cavagnaro. 2008. Roots, nitrogen transformations, and ecosystem services. Annu. Rev. Plant Biol. 59:341-363.
26. Kopp, K.L., and K. Guillard. 2002a. Clipping management and nitrogen fertilization of turfgrass: Growth, nitrogen utilization, and quality. Crop Sci. 42:1225-1231.
27. Kopp, K.L., and K. Guillard. 2002b. Adjusting nitrogen rates when clippings are returned: Returning clippings to fairways and roughs boosts natural nitrogen levels and reduces the need for inputs. Golf Course Management. 70(10): 60-64.

28. Kopp, K.L., and K. Guillard. 2005. Clipping contributions to nitrate leaching from creeping bentgrass under varying irrigation and N rates background. Int. Turfgrass Soc Res. J. 10:80-85.
29. Lee, D.J., D.C. Bowman, D.K. Cassel, C.H. Peacock, and T.W. Rufry, Jr. 2003. Soil inorganic nitrogen under fertilized bermudagrass turf. Crop Sci. 43:247-257.
30. Liu, H. B., and R.J. Hull. 2006. Comparing cultivars of three cool-season turfgrasses for nitrogen recovery in clippings. HortScience. 41:827-831.
31. McCarty, L.B., M.F. Gregg, and J.E. Toler. 2007. Thatch and mat management in an established creeping bentgrass golf green. Agron. J. 99:1530-1537.
32. Miltner, E.D., B.E. Branham, E.A. Paul, and P.E. Rieke. 1996. Leaching and mass balance of 15N-labeled urea applied to Kenturky bluegrass turf. Crop Sci. 36:1427-1433.
33. Morton, T.G., A.J. Gold, and W.M. Sullivan. 1988. Influence of overwatering and fertilization on nitrogen losses from home lawns.J. Environ. Qual. 17:124–130.
34. Qian, Y. L., W. Bandaranayakea, W. J. Partonb, B. Mechamc, M. A. Harivandid and A. R. Mosiere. 2003. Long-term effects of clipping and nitrogen management in turfgrass on soil organic carbon and nitrogen dynamics: The CENTURY model simulation. J. Environ. Qual. 32:1694-1700.
35. Ruckart, P.Z., A.K. Henderson, M.L. Black, and M.D. Flanders. 2008. Are nitrate levels in groundwater stable over time?. J. Expo. Sci. Env. Epid. 18:129-133.
36. Saha, S.K., L.E. Trenholm, J.B. Unruh. 2007. Effect of fertilizer source on nitrate leaching and St. Augustinegrass turfgrass quality. HortScience. 42:1478-1481.
37. Sartain, J.B. 1993. Interrelationships among turfgrass, clipping recycling, thatch, and applied calcium, magnesium, and potassium. Agron. J. 85:40-43.
38. Sartain, J.B. 2004. Returning clippings reduces fertilizer losses. Grounds Maintenance. 39(4): 12-23.
39. SAS Institute. 2002-2003. SAS Statistic program. 9th ed. SAS Inst., Cary, NC.
40. Sharma, S. 2009. Effect of nitrogen rates and mowing heights on nitrogen leaching, turf quality and spectral reflectance in Floratam St. Augustinegrass. Masters Thesis. University of Florida.
41. Shaver, E., R. Horner, J. Skupien, C. May, and G. Ridley. 2007. Fundamentals of urban runoff management. Technical and Institutional Issues. 2nd Ed. Madison, FL. North American Lake Management Society. pp 44-52.
42. Snyder, G.H., B.J. Augustin, and J.M. Davidson. 1984. Moisture sensor-controlled irrigation for reducing N leaching in bermudagrass turf. Agron. J. 76:965-969.

43. Soper, D.Z., J.H. Dunn, D.D. Minner, and D.A. Sleper. 1988. Effects of clipping disposal, nitrogen, and growth retardants on thatch and tiller density in Zoysiagrass. Crop Sci. 28:325-328.
44. Starr, J.L., and H.C. DeRoo. 1981. The fate of nitrogen applied to turfgrass. Crop Sci. 21:531-536.
45. Trenholm, L.E., R.N. Carrow, and R.R. Duncan. 1999a. Relationship of multispectral radiometry data to qualitative data in turfgrass research. Crop Sci. 39:763-769.
46. Trenholm, L.E., R.R. Duncan, and R.N. Carrow. 1999b. Wear tolerance, shoot performance, and spectral reflectance of seashore paspalum and bermudagrass. Crop Sci. 39:1147-1152.
47. Trenholm, L.E. 2000. Spectral analysis: A valuable tool for selecting stress-tolerant turfgrasses and managing stands. Diversity. 16(1/2): 57-58.
48. Trenholm, L.E., M.J. Schlossberg, G. Lee, and W. Parks. 2000. An evaluation of multi-spectral responses on selected turfgrass species. Int. J. Remote Sens. 21:709-721.
49. Trenholm, LE., E.F. Gilman, G.W. Knox, and R.J. Black. 2002. Fertilizatation and irrigation needs for Florida lawns and landscapes . Univ. of Fla. Coop. Ext. Serv., ENH 860. Univ. of Florida, Gainesville, FL.
50. Trenholm, L.E., and J.B. Unruh. 2005a. The Florida Lawn Hanbook: Best Management Practices for your home lawn in Florida. Gainesville, FL: University Press of Florida. pp45-53
51. Trenholm, L.E., and J.B. Unruh. 2005b. Warm-season turfgrass response to fertilizer rates and sources. J. Plant Nutr. 28:991-999.
52. Trenholm, L.E. 2007. Florida's green industries Best Management Practices educational program. Abstracts: 2007 International Annual Meetings[ASA/CSSA/SSSA]. p. 1.
53. Trenholm, L.E., and J.B. Unruh. 2009. Nitrate leaching during turf establishment: sodded St. Augustinegrass and Zoysiagrass. Abstracts: 2009 International Annual Meetings [ASA/CSSA/SSSA].
54. Turgeon, A. 1991. Turfgrass management. Prentice-Hall, Eaglewood Cliffs, NJ.
55. Unruh, J.B. L.E. Trenholm, and J.L. Cisar. 2006. Zoysiagrass in Florida (Fact Sheet ENH 11). Florida Cooperative Extension Service, Institute of Food and Agricultural Sciences, University of Florida.

BIOGRAPHICAL SKETCH
Jinyong Bae was born in 1976 in Seoul, South Korea. He completed his undergraduate
from Seoul National University, South Korea in 1998. After graduating, he served at Air Force
as an officer of Nuclear, Biological, and Chemical Defense (NBC) for seven years. After he was
honorably discharged from military service, he joined the Doctor of Plant Medicine program in
the University of Florida in fall 2006 and added his M.S. degree process from fall of 2008 at
Environmental Horticulture department. He graduated with M.S. degree in environmental
horticulture in 2009. After graduating he will join the U.S. Army in September 2009.


![Chapter 3 Providers - IntechOpen · Ornamental Paulownia tomentosa (Thunb.) Steud. China [31 ] Robinia pseudoacacia L. North America [48 50 ] Pueraria montana var. lobata (Willd.)](https://static.fdocuments.us/doc/165x107/5e70fc25abf3ed53802dc70d/chapter-3-providers-intechopen-ornamental-paulownia-tomentosa-thunb-steud.jpg)