
to modernization - Deloitte US | Audit, consulting ... · PDF fileenergy providers, were not...
32
From growth to modernization The changing capital focus of the US utility sector
Transcript of to modernization - Deloitte US | Audit, consulting ... · PDF fileenergy providers, were not...

From growth to modernization The changing capital focus of the US utility sector

Brochure / report title goes here | Section title goes here
03
Executive summary 1
A decade of growth in utility capital spending 2
Transmission and distribution spending takes 3 center stage as utilities upgrade infrastructure
Generation spending poised to moderate 8 after active period of fuel switching
Environmental spending to drop slightly, 13 but further regulation is expected
Renewable spending projected to ease, 13 though several drivers continue to support it
Natural gas infrastructure spending grows 14 amidst opportunities across the value chain
Are current spending levels sustainable? 15
Conclusion 20
Appendix: Exploring company investment patterns 21
Endnotes 26
Let’s talk 29
From growth to modernization | The changing capital focus of the US utility sector
1
Executive summary
In Deloitte’s “math series,” published from 2012-2014, we analyzed the trends prompting US electric power companies to increase capital spending and examined the “dilemma” they could face as the costs to produce electricity rise, while demand remains fairly stagnant.1 Since then, as these trends have played out, spending has predictably climbed to unprecedented levels. US electric and gas utility capital expenditures soared from $69 billion in 2008, to an all-time high estimated for 2016—about $115 billion.2 Drivers behind the spending vary and include:
• The need to upgrade and reinforce electric and gas infrastructure due to age, increasingly severe weather, and cyber and physical threats
• The equally critical need to deploy information technology to boost the systems’ efficiency, effectiveness, and resilience; accommodate the surge of new technologies and devices; and respond to customer demand for more flexible and customized products
• The need to address environmental concerns with an increasingly clean energy slate
• The opportunity to take advantage of burgeoning supplies of domestic natural gas
In addition, the quest for predictable growth in earnings may be shifting the focus back to regulated investments with relatively stable rates of return.
These drivers are evolving and changing the pattern of investment across individual companies and the industry as a whole. The group of electric and gas utility companies examined in this report generally project capital spending plans across five segments: electric transmission and distribution (T&D), generation; environmental; renewables; and natural gas pipelines, distribution, and storage.* Electric T&D spending has dominated the mix in recent years, and will likely grow further. At the same time, generation investments are projected to ramp down, while expenditures on natural gas pipelines, storage, and distribution are slated to continue to grow. Overall, company projections indicate that capital expenditures will likely remain substantial, which is not surprising, since key drivers behind the spending continue.
So, the question arises whether spending at today’s levels can be sustained. Rapidly rising expenditures are beginning to boost retail electricity rates, and while much of the cost is being offset by lower fuel costs thanks to abundant, moderately priced shale gas, the specter of potentially rising natural gas prices, increasing interest rates, higher taxes, or a host of other possibilities could intervene to alter capital investment momentum.
*Electric power industry subsectors that do not segment expenditures similarly, such as alternative energy developers and retail energy providers, were not included in the analysis, since comparisons would not be consistent.

From growth to modernization | The changing capital focus of the US utility sector
2
A decade of growth in utility capital spending
In Figure 1, we see the aggregate capital spending for a representative group of publicly traded electric and gas
companies—laddering up each year from 2010 to the present, and projected to remain substantial as the new decade approaches.
Figure 1. Capex breakdown by category for 47 investor-owned electric and gas utilities—Historical and projected (2008-2018E)
($ Billion)
Note: Historical segmentation prior to 2008 is not available
Source: RRA and SNL Energy, Deloitte analysis. RRA and SNL Energy are offerings of S&P Global Market Intelligence.
Electric T&D
Renewables
Generation
Gas pipeline storage/distribution
Environmental
Other
0
20
40
60
80
100
120
2008 2009 2010 2011 2012 2013 2014 2015 2016E 2017E 2018E
$Bill
ion
26.2
694.2
32.0
66
30.6
65
31.7
71
27.5
9.54.34.3
86
26.7
7.7
86
21.4
11.6
89
25.7
14.9
7.999
28.8
23.8
6.94.0
5.8115
21.6
22.1
101
20.4
21.0
97
32.2 26.6 28.2 27.835.3 37.0 39.2 41.6 45.1 47.3 45.6
6.9
8.76.4 4.6 4.32.8 1.9
2.8
3.4 3.4
4.1
2.9 3.03.2 2.76.05.2
6.2 4.05.0
5.3
5.3
Methodology – The data shown in Figures 1 and 2 is based on SNL Energy’s RRA Index of the largest publicly traded US electric and gas companies, including regulated, merchant, and hybrid enterprises. This includes electric companies with more than 400,000 customers and gas companies with more than 900,000. The resulting universe of 47 companies covers roughly 89% of the current total market capitalization of the 84 companies in these categories.
Most of the companies segment their capital expenditures by category in projections and in estimates for the current year, but do not do so when reporting final expenditures at yearend.
Therefore, to derive the historical segmentation in Figures 1 and 2, we extrapolated the companies’ projected breakdowns across the final amount expended. This may not be an exact reflection of historical spending, but it is likely a strong indicator. In addition, periodic changes to the index occur as companies are added or subtracted due to restructuring; consequently, historical comparisons are not exact.
Finally, some companies began projecting environmental and renewable expenditures separately in 2012. For others, and for all companies before 2012, these expenditures are typically included in the generation category.
From growth to modernization | The changing capital focus of the US utility sector
3
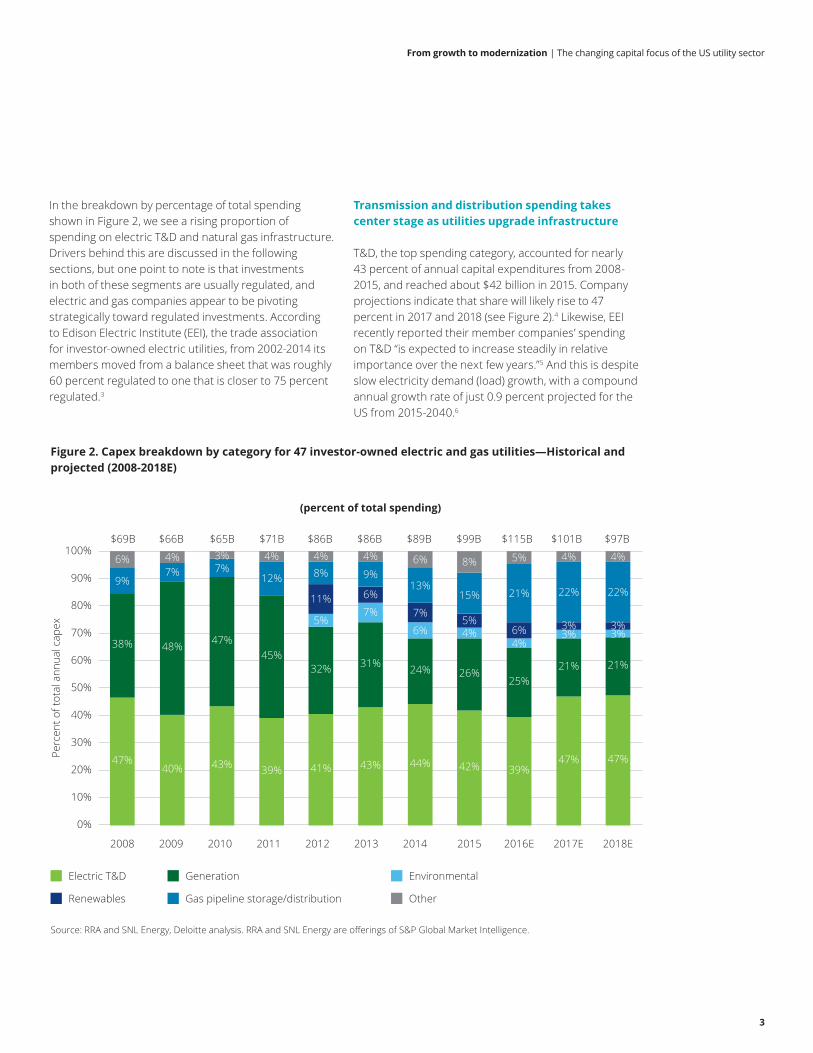
In the breakdown by percentage of total spending shown in Figure 2, we see a rising proportion of spending on electric T&D and natural gas infrastructure. Drivers behind this are discussed in the following sections, but one point to note is that investments in both of these segments are usually regulated, and electric and gas companies appear to be pivoting strategically toward regulated investments. According to Edison Electric Institute (EEI), the trade association for investor-owned electric utilities, from 2002-2014 its members moved from a balance sheet that was roughly 60 percent regulated to one that is closer to 75 percent regulated.3
Transmission and distribution spending takes center stage as utilities upgrade infrastructure
T&D, the top spending category, accounted for nearly 43 percent of annual capital expenditures from 2008-2015, and reached about $42 billion in 2015. Company projections indicate that share will likely rise to 47 percent in 2017 and 2018 (see Figure 2).4 Likewise, EEI recently reported their member companies’ spending on T&D “is expected to increase steadily in relative importance over the next few years.”5 And this is despite slow electricity demand (load) growth, with a compound annual growth rate of just 0.9 percent projected for the US from 2015-2040.6
Figure 2. Capex breakdown by category for 47 investor-owned electric and gas utilities—Historical and projected (2008-2018E)
(percent of total spending)
0%
10%
30%
50%
70%
20%
40%
60%
80%
90%
100%
Perc
ent o
f tot
al a
nnua
l cap
ex
38%
47%
48%
40%
47%
43%
45%
39%
32%
41% 44% 39%47% 47%
24%25%
21% 21%
5%6%
4%3% 3%
11%7%
6% 3% 3%
9%7% 7%
12% 8%13%
21% 22% 22%
6%
$66B $65B $71B $86B $86B $89B $99B $115B $101B $97B$69B
4% 3% 4% 4%
31%
43%
7%
6%
9%
4% 6%
42%
26%
4%5%
15%
8% 5% 4% 4%
2008 2009 2010 2011 2012 2013 2014 2015 2016E 2017E 2018E
Source: RRA and SNL Energy, Deloitte analysis. RRA and SNL Energy are offerings of S&P Global Market Intelligence.
Electric T&D
Renewables
Generation
Gas pipeline storage/distribution
Environmental
Other

From growth to modernization | The changing capital focus of the US utility sector
4
The T&D category of spending includes both physical upgrades of infrastructure, as well as the application of “smart” technology to make the electric grid more efficient, reliable, and responsive—and to pave the way for two-way power flows from an expanding array of distributed energy resources. The discussion below details drivers and recent expenditures in transmission, distribution, and grid modernization, all of which fall under T&D.
• Transmission Transmission expenditures reported to the Federal Energy Regulatory Commission (FERC) by investor-owned utilities, transmission companies, and generation/transmission companies nearly tripled in the last decade, increasing from $5.8 billion annually in 2006 to about $15.9 billion in 2015, as
illustrated in Figure 3.7 Towers, poles, fixtures, and overhead conductors were some of the largest and fastest growing categories of investment during the period, combined with a hefty chunk of spending on substations and related equipment. Investment is driven by the need to boost grid reliability, resiliency, and security; harden structures against severe weather or physical attack; replace aging infrastructure; reduce grid congestion; integrate renewable energy resources; adjust to regional shifts in electricity demand; and enable system flexibility to accommodate distributed resources. In addition, transmission system expenditures are rising in tandem with construction labor and raw materials costs.8
Figure 3. Major electric utility transmission spending by category (2006-2015)
Note: The transmission and distribution expenditure data in Figures 3 and 4 are not directly comparable to T&D segment estimates in Figures 1 and 2 due to differences in the reporting universe, timeframe, and items included
Source: SNL Energy, FERC Form 1. SNL Energy is an offering of S&P Global Market Intelligence.
Land and land rights
Towers and fixtures
Underground conduit
Structures and improvements
Poles and fixtures
Underground conductors
Station equipment
Overhead conductors
Roads and trails
0
2
4
6
8
10
12
14
16
18
2006 2007 2008 2009 2010 2011 2012 2013 2014 2015
$ B
illio
n
From growth to modernization | The changing capital focus of the US utility sector
5
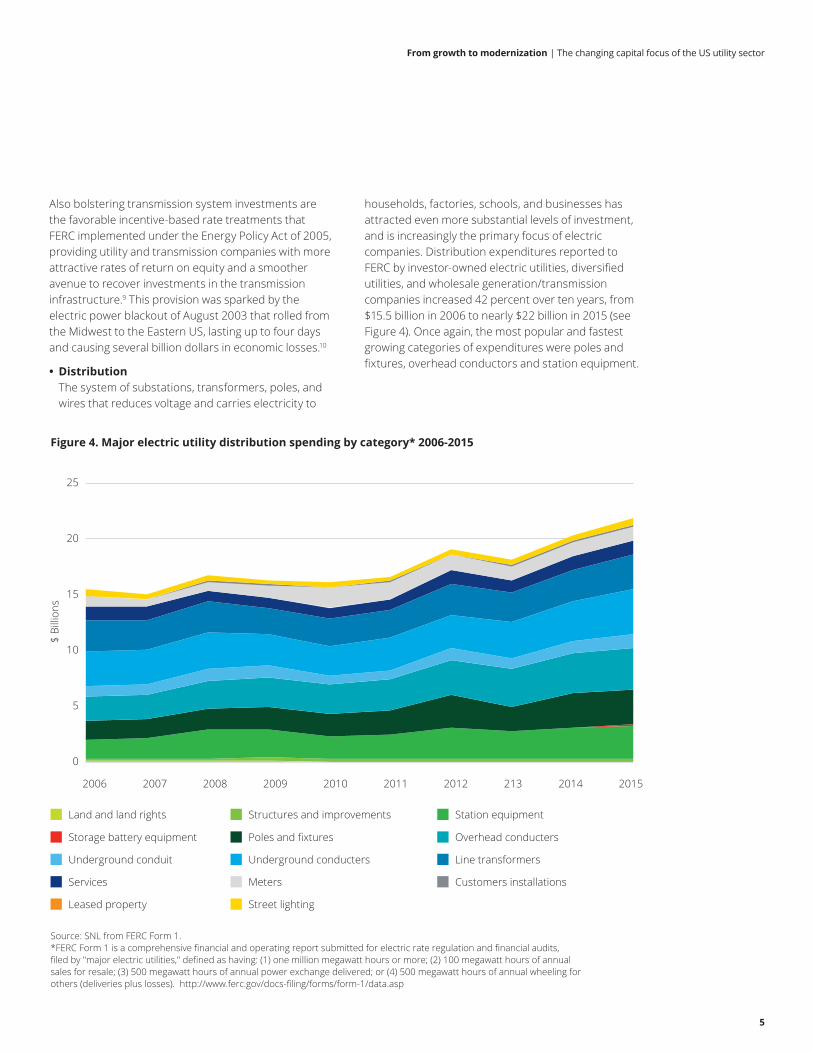
Figure 4. Major electric utility distribution spending by category* 2006-2015
Source: SNL from FERC Form 1.*FERC Form 1 is a comprehensive financial and operating report submitted for electric rate regulation and financial audits, filed by "major electric utilities," defined as having: (1) one million megawatt hours or more; (2) 100 megawatt hours of annual sales for resale; (3) 500 megawatt hours of annual power exchange delivered; or (4) 500 megawatt hours of annual wheeling for others (deliveries plus losses). http://www.ferc.gov/docs-filing/forms/form-1/data.asp
Land and land rights Structures and improvements Station equipment
Storage battery equipment Poles and fixtures Overhead conducters
Underground conduit Underground conducters Line transformers
Services Meters Customers installations
Leased property Street lighting
$ B
illio
ns
0
5
10
15
20
25
2006 2007 2008 2009 2010 2011 2012 213 2014 2015
Also bolstering transmission system investments are the favorable incentive-based rate treatments that FERC implemented under the Energy Policy Act of 2005, providing utility and transmission companies with more attractive rates of return on equity and a smoother avenue to recover investments in the transmission infrastructure.9 This provision was sparked by the electric power blackout of August 2003 that rolled from the Midwest to the Eastern US, lasting up to four days and causing several billion dollars in economic losses.10
• Distribution The system of substations, transformers, poles, and wires that reduces voltage and carries electricity to
households, factories, schools, and businesses has attracted even more substantial levels of investment, and is increasingly the primary focus of electric companies. Distribution expenditures reported to FERC by investor-owned electric utilities, diversified utilities, and wholesale generation/transmission companies increased 42 percent over ten years, from $15.5 billion in 2006 to nearly $22 billion in 2015 (see Figure 4). Once again, the most popular and fastest growing categories of expenditures were poles and fixtures, overhead conductors and station equipment.

From growth to modernization | The changing capital focus of the US utility sector
6
Much of this spending aims to harden the system against outages from calamitous weather events like hurricanes, blizzards, tornadoes, ice storms, and floods. Lawrence Berkeley National Laboratory and Stanford University researchers say you’re not imagining it if you think the US electric grid has been impacted by increasingly severe weather events in recent years. Outages have lasted longer on average, and there’s a distinct correlation with adverse weather events.11
The ability to recover quickly from outages is called “resiliency,” and has become a key focus area for the electric power industry. Regulators are targeting the same goal, and several state public utility commissions have issued rulings designed to encourage strengthening the distribution infrastructure, where about 90 percent of outages occur.12 There are many ways to boost resiliency—such as reinforcing and elevating substations in low-lying areas; upgrading
and strengthening poles and lines; and burying lines when circumstances, and funding, permit. Adding transmission lines is another step utilities are taking to increase flexibility and resilience, as is deployment of smart grid technology, detailed further below.
• Grid modernization Utilities are investing in smart grid technologies to enhance resiliency, improve operating efficiency, and prepare for the growing influx of distributed energy resources (DER) on the grid, such as rooftop solar, battery storage, electric vehicles, microgrids, and demand response applications. These “grid modernization” initiatives will enhance flexibility and responsiveness, which are key to operating in the new world of two-way power flows, intermittent renewable power sources, and a growing array of new products and services.
Deployment and integration of smart grid devices, components, and systems is advancing in three phases, reflected in the spending categories represented in Figure 5, and discussed further in Deloitte’s “The power is on: How IoT technology is driving energy innovation.”13 They are:
– Resilience - Utilities are deploying smart meters and networked sensors and control devices to gather data, improve resilience, and monitor and control new distributed energy resources (DER). For example, smart meters at customer sites allow utilities to detect outages and expedite restoration of service. Smart inverters installed with rooftop solar systems can help utilities balance and integrate intermittent solar output with other grid resources.
– Enablement - Utilities are using platforms, such as advanced distribution management systems (ADMS), to aggregate and analyze the data gathered through smart devices and actively manage and control resources. One goal is a “self-healing grid,” which can automatically respond to system faults by rerouting power through automated feeder switches or dispatching DERs to reduce the number of customers affected by outages.

From growth to modernization | The changing capital focus of the US utility sector
7
– Optimization – In this phase, utilities and other stakeholders will be able to use the data and insights generated in the enablement phase to make informed business decisions that optimize the use of DERs across the system. For example, utilities could use a feeder-level profitability assessment tool to evaluate which grid investments would be profitable and which are better left for the market to satisfy.
Grid modernization got a boost from $4 billion in Smart Grid Investment Grants (SGIG) under the American Recovery and Reinvestment Act of 2009 (the Stimulus Act) which, combined with industry spending, led to nearly $8 billion in related projects.14 Nearly half of the funding went to advanced metering infrastructure, another $2 billion was invested in the distribution grid, and the rest in customer systems and transmission projects. More recently, the US Department of Energy
Figure 5. US smart grid spending by segment ($ billion)
Source: Business Council for Sustainable Energy (BSCE), Sustainable Energy in America Factbook, 2016, p. 131. Data from Bloomberg New Energy Finance (BNEF) and Edison Electric Institute (EEI)
Smart metering Distribution automation Advanced smart grid
2008 2009 2010 2011 2012 2013 2014 2015
0.7
0.6
$1.3
1.7
0.8
$2.6
3.0
1.0
0.5
$4.6
3.1
1.2
0.8
$5.1
2.6
1.3
1.0
$4.9
1.3
1.4
0.7
$3.5
0.9
1.5
0.3
$2.8
0.8
1.6
0.3
$2.7
.1
From growth to modernization | The changing capital focus of the US utility sector
8
allocated $220 million in grid modernization funding through the Smart Grid Interoperability Panel (SGIP) to support research and development in advanced storage systems, clean energy integration, standards and test procedures, and other key areas.15 At the same time, utility commissions in at least ten states have begun investigating the paths to grid modernization and some, like California, have ordered their state’s utilities to prepare distribution grids for increased penetration of distributed resources.16 New York, through its “Reforming the Energy Vision” regulatory program, is encouraging utilities to make DER integration a central focus.17
Despite these initiatives, much remains to be done. While nearly 65 million smart meters were installed nationwide by the end of 2015, it still represented less than 40 percent of US electricity customers.18 According to an industry executive, the industry is “sorely behind the curve” in managing the enormous amounts of data required to optimize the modern distribution system.19 About $17 to $24 billion per year would be needed to fully deploy smart grid technologies through 2030, according to the Electric Power Research Institute (EPRI), but benefits would far outweigh costs.20 That amount far exceeds current spending (Figure 5), so it’s clear that more funding and state initiatives combined with regulatory incentives or mandates would be required to drive such investment.
Generation spending poised to moderate after active period of fuel switching
Generation was the second largest category of spending from 2008-2015. This category originally comprised new utility-scale generating capacity of all types, including renewables, as well as upgrades and retrofits to existing plants, often to comply with environmental mandates. However, by 2012, as environmental rulings and renewable requirements ramped up, many companies began reporting “environmental” and “renewable” spending separately. Other companies continued to group them together, so we’ll start by taking a look at spending trends for all three combined.
The generation category by itself peaked at $32 billion in 2009, or about 48 percent of capital expenditures for the group (see Figures 1 and 2). In 2012, when you combine generation, environmental and renewable spending, the total spiked to $41.3 billion, and it’s expected to climb nearly that high again in 2016, with current estimates totaling $39.7 billion.21
What’s been driving generation spending? As previously noted, it’s not due to rising consumption—although with US migration to Sun Belt cities in the South and West resuming after a recessionary lull, there may be some regional requirements for new generation.22 On the whole, however, generation spending is being driven largely by fuel-switching from coal to natural gas and the movement toward a cleaner generation slate. In recent years, low-priced, abundant shale gas and multiple environmental mandates combined to render a large number of aging coal plants uneconomic and ripe for retirement. At the height of this trend in 2015, about 14 GW of coal generating capacity was retired, as the industry faced a market awash with cheap natural gas and a compliance deadline for the Environmental Protection Agency’s (EPA) much-litigated Mercury and Air Toxics Standard (MATS).23 This far exceeds the 4 GW of coal capacity retired in 2014, and the 7 GW slated to close in 2016. In fact, the total amount of coal capacity marked for retirement from 2016-2020 is more

From growth to modernization | The changing capital focus of the US utility sector
9
than 17 GW, plus about 12 GW of other generating capacity, primarily older, gas-fired plants.24 Many other non-compliant coal plants have been retrofitted with emissions control equipment during the period, or converted to burn natural gas, biomass, or other fuels.
To replace this retiring capacity, the industry has overwhelmingly chosen natural gas and renewables. Much has been written about growing supplies of low-priced gas spiking a wave of natural gas-fired generation build, and the evidence of that is clear in Figure 6. The other big story, also illustrated in Figure 6, is new wind and solar capacity, which have been built not only to
meet environmental mandates, but also to achieve state Renewable Portfolio Standards (RPS), take advantage of tax credits and declining technology costs, and diversify the generation portfolio. While companies are building new nuclear plants in some areas of the country, in other areas existing nuclear plants are being pressured by prices below the break-even point in competitive power capacity markets, largely due to low natural gas prices.25 EIA calculates the levelized cost of energy (LCOE) for an advanced nuclear power plant entering service in 2022 at $95.2/MWh, while an advanced combined cycle natural gas plant would be $72.6/MWh.26
Figure 6. New generating capacity by fuel 2011-2015 (GW)
2011
11.09.3
12.3
1.9
4.7
6.8
1.11.9
21.8
29.4
15.9
19.417.3
3.8
5.3
9.26.0
8.2
2.6
7.4
3.8
1.7
1.5
2012 2013 2014 2015
35
35
30
25
20
15
10
0
Gig
awat
ts (G
W)
Source: Federal Energy Regulatory Commission (FERC), Office of Energy Projects, Energy Infrastructure Updates from December 2012-2015 http://www.ferc.gov/legal/staff-reports/2015/dec-infrastructure.pdf Includes utility-scale plants with nameplate capacity of 1 MW or greater
Natural Gas HydroWind CoalSolar Nuclear Other

From growth to modernization | The changing capital focus of the US utility sector
10
For the past decade, in addition to building new plants, electric power companies have also acquired more renewable and natural gas generation assets than any other fuel types, as illustrated in Figure 7. After 2008, the number of gas and coal asset deals began to decline, while by 2011, wind and solar deals were gathering momentum. Some companies include these types of asset purchases in capital expenditure totals,
while others do not. Electric companies also acquire electricity from wind and solar plants through power purchase agreements, which are not included in capital expenditures. Beyond generation, electric power companies acquired a number of other assets during the decade, most notably electric and natural gas transmission, distribution and production assets.27
Figure 7. US electric company generation asset deals 2006-2015
(number of deals)
Wind Solar Gas Coal BiomassMixed
fuel types
Water Other* Total
2006 16 1 32 6 9 10 3 6 83
2007 18 0 27 4 9 6 2 4 70
2008 16 1 25 6 9 4 6 3 70
2009 15 5 12 4 7 5 3 2 53
2010 11 9 11 2 7 3 4 3 50
2011 24 14 19 1 3 0 2 1 64
2012 22 12 14 2 3 3 3 1 60
2013 27 26 8 0 7 0 6 0 74
2014 24 29 11 2 2 5 1 3 77
2015 23 56 14 4 2 2 1 6 108
Total 196 153 173 31 58 38 31 29 709
Source: SNL Energy, includes all deals in the SNL database that involve electric power companies acquiring generation assets*Other includes geothermal (12), nuclear (10) and oil (7). SNL Energy is an offering of S&P Global Market Intelligence.
From growth to modernization | The changing capital focus of the US utility sector
11
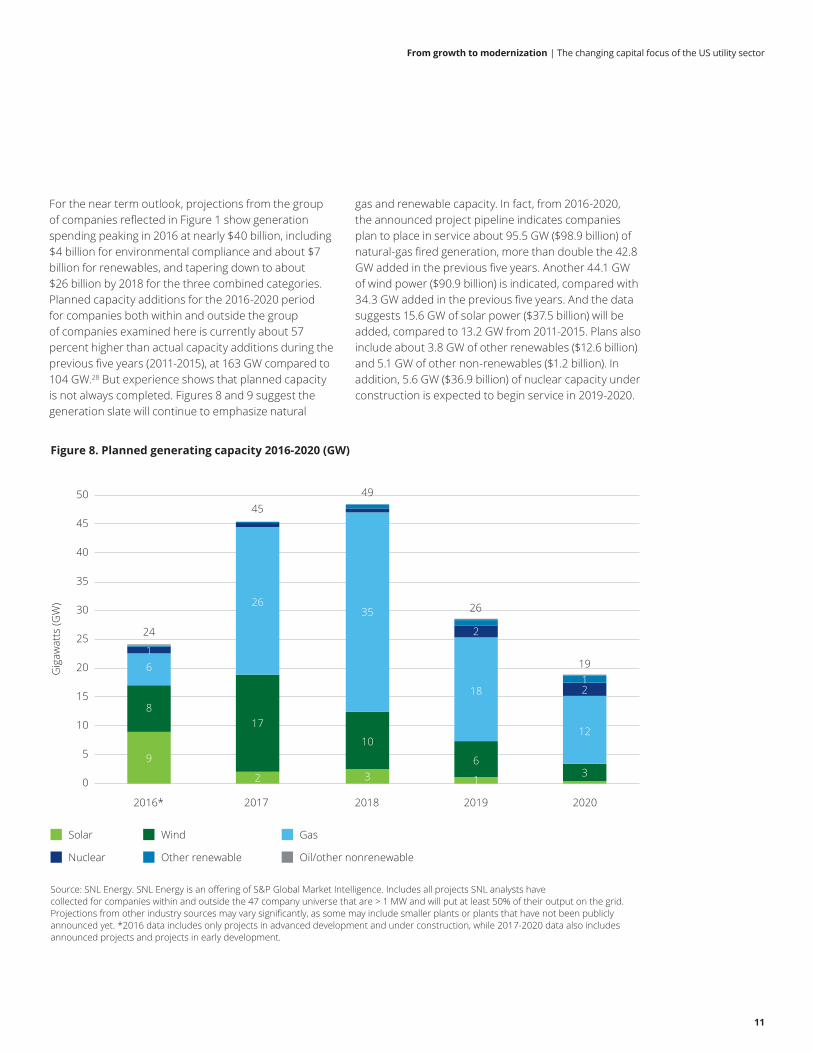
Figure 8. Planned generating capacity 2016-2020 (GW)
Gig
awat
ts (G
W)
Source: SNL Energy. SNL Energy is an offering of S&P Global Market Intelligence. Includes all projects SNL analysts have collected for companies within and outside the 47 company universe that are > 1 MW and will put at least 50% of their output on the grid. Projections from other industry sources may vary significantly, as some may include smaller plants or plants that have not been publicly announced yet. *2016 data includes only projects in advanced development and under construction, while 2017-2020 data also includes announced projects and projects in early development.
Solar
Nuclear
Wind
Other renewable
Gas
Oil/other nonrenewable
0
5
10
15
20
25
30
35
40
45
50
2016* 2017 2018 2019 2020
17
26
45
24
3
10
35
49
12
21
19
9
8
61
6
18
2
26
2 13
For the near term outlook, projections from the group of companies reflected in Figure 1 show generation spending peaking in 2016 at nearly $40 billion, including $4 billion for environmental compliance and about $7 billion for renewables, and tapering down to about $26 billion by 2018 for the three combined categories. Planned capacity additions for the 2016-2020 period for companies both within and outside the group of companies examined here is currently about 57 percent higher than actual capacity additions during the previous five years (2011-2015), at 163 GW compared to 104 GW.28 But experience shows that planned capacity is not always completed. Figures 8 and 9 suggest the generation slate will continue to emphasize natural
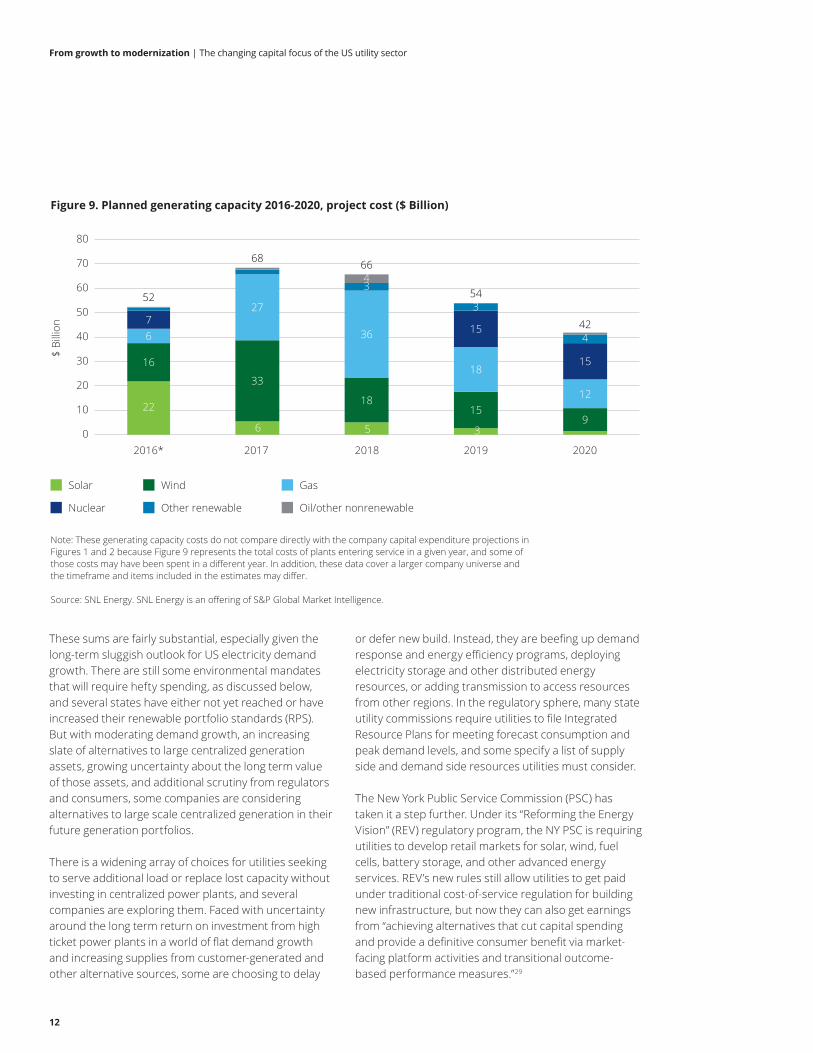
gas and renewable capacity. In fact, from 2016-2020, the announced project pipeline indicates companies plan to place in service about 95.5 GW ($98.9 billion) of natural-gas fired generation, more than double the 42.8 GW added in the previous five years. Another 44.1 GW of wind power ($90.9 billion) is indicated, compared with 34.3 GW added in the previous five years. And the data suggests 15.6 GW of solar power ($37.5 billion) will be added, compared to 13.2 GW from 2011-2015. Plans also include about 3.8 GW of other renewables ($12.6 billion) and 5.1 GW of other non-renewables ($1.2 billion). In addition, 5.6 GW ($36.9 billion) of nuclear capacity under construction is expected to begin service in 2019-2020.
From growth to modernization | The changing capital focus of the US utility sector
12
Note: These generating capacity costs do not compare directly with the company capital expenditure projections in Figures 1 and 2 because Figure 9 represents the total costs of plants entering service in a given year, and some of those costs may have been spent in a different year. In addition, these data cover a larger company universe and the timeframe and items included in the estimates may differ.
Source: SNL Energy. SNL Energy is an offering of S&P Global Market Intelligence.
Solar
Nuclear
Wind
Other renewable
Gas
Oil/other nonrenewable
Figure 9. Planned generating capacity 2016-2020, project cost ($ Billion)
$ Bi
llion
0
10
20
30
40
50
60
70
80
2016* 2017 2018 2019 2020
16
22
67
52
33
6
27
68
18
5
36
34
66
15
18
15
354
9
12
15
442
3
These sums are fairly substantial, especially given the long-term sluggish outlook for US electricity demand growth. There are still some environmental mandates that will require hefty spending, as discussed below, and several states have either not yet reached or have increased their renewable portfolio standards (RPS). But with moderating demand growth, an increasing slate of alternatives to large centralized generation assets, growing uncertainty about the long term value of those assets, and additional scrutiny from regulators and consumers, some companies are considering alternatives to large scale centralized generation in their future generation portfolios.
There is a widening array of choices for utilities seeking to serve additional load or replace lost capacity without investing in centralized power plants, and several companies are exploring them. Faced with uncertainty around the long term return on investment from high ticket power plants in a world of flat demand growth and increasing supplies from customer-generated and other alternative sources, some are choosing to delay
or defer new build. Instead, they are beefing up demand response and energy efficiency programs, deploying electricity storage and other distributed energy resources, or adding transmission to access resources from other regions. In the regulatory sphere, many state utility commissions require utilities to file Integrated Resource Plans for meeting forecast consumption and peak demand levels, and some specify a list of supply side and demand side resources utilities must consider.
The New York Public Service Commission (PSC) has taken it a step further. Under its “Reforming the Energy Vision” (REV) regulatory program, the NY PSC is requiring utilities to develop retail markets for solar, wind, fuel cells, battery storage, and other advanced energy services. REV’s new rules still allow utilities to get paid under traditional cost-of-service regulation for building new infrastructure, but now they can also get earnings from “achieving alternatives that cut capital spending and provide a definitive consumer benefit via market-facing platform activities and transitional outcome-based performance measures.”29

From growth to modernization | The changing capital focus of the US utility sector
13
Initiatives like these may gradually change the pattern of utility investments. In the meantime, there are still some strong drivers for Environmental and Renewable spending over the next few years, as follows.
Environmental spending to drop slightly, but further regulation is expected In the years leading up to 2015, electric power industry spending on compliance with environmental mandates rose as the industry prepared to meet the EPA’s Mercury and Air Toxics Standard (MATS), a rule that aims to reduce power plant emissions of mercury, arsenic, and other metals under amendments to the 1990 Clean Air Act.30 Although the courts remanded MATS to the EPA for revision in June 2015, the regulation is still being enforced and electric companies have invested billions to comply.31 In another move to enforce the Clean Air Act, the EPA issued the Clean Power Plan (CPP) in 2015, with the goal to reduce power sector greenhouse gas emissions by 32 percent below 2005 levels by 2030.32 The CPP was stayed by the Supreme Court in February 2016 and may be in litigation for some time, but it is nevertheless spurring additional plans and investment in the transition to a cleaner generation fleet, which much of the industry sees as “writing on the wall” regardless of the outcome of the case. Other environmental regulations that may require long-term capital investments include rules addressing coal combustion residuals, effluent limitation guidelines, and cooling water intake structures.33
Renewable spending projected to ease, though several drivers continue to support itAccording to EEI, the electric power industry has built virtually all of the wind, geothermal, and hydropower generation capacity in the US today, as well as about 60 percent of the solar power capacity, and is spending about $9 billion per year on renewable energy.34 The $9 billion figure may be higher than the capex breakdowns cited in this report because not all companies report renewables spending separately and the reporting universe differs. There are a number of drivers for sustained high investment in renewables.
A primary driver is RPS goals and mandates. Currently 37 states, four US territories, and the District of Columbia have RPS or voluntary goals that require a certain percentage of electricity sold by utilities be from renewable sources by a target date.35 The target years
range from 2015 to 2045 and renewable percentage goals vary widely. Some of the most ambitious are California’s mandate to reach 50 percent by 2030, Vermont’s goal to reach 75 percent by 2032, and Hawaii’s target of 100 percent by 2045.36
Other drivers of electric industry renewable investment include tax incentives, declining costs of wind and solar power, increasing customer demand for renewables, generation portfolio diversification, price transparency, and anticipation of additional environmental regulation, especially the Clean Power Plan (CPP). On the tax front, under the December 2015 omnibus spending bill, the federal 30 percent Investment Tax credit (ITC) for solar was extended for projects beginning construction before December 2019, gradually stepping down to 10 percent for those beginning after 2021. The wind Production Tax Credit (PTC) was extended through 2019, with annual phasedowns beginning in 2017.37 In addition, the costs of building both utility-scale wind and solar power plants declined about 60 percent from 2010-2015.38
Further, electric utilities are responding to their customers’ growing interest in electricity from renewable sources. In Deloitte’s sixth annual nationwide study of energy customer perspectives, the Deloitte Resources 2016 Study, 56 percent of consumers surveyed rated the statement “Utilize clean energy sources
From growth to modernization | The changing capital focus of the US utility sector
14
to be better stewards of the environment for future generations” as one of the top three energy issues most important to them.39 For electric companies, wind and solar power provide an increasingly attractive option to diversify their generation slates to avoid reliance on just one or two energy sources that may be susceptible to fuel price volatility or supply disruptions. In addition, companies that build renewable generation know they can often sell the power to other utilities at higher prices than fossil fuel-generated power, since many utilities have requirements to purchase electricity from renewable sources to meet state RPS.40
Finally, if the Clean Power Plan emerges from litigation and is implemented, the North American Electric Reliability Corporation (NERC) estimates it could spark an additional 10-20 GW of wind and solar capacity by 2030 on top of the 100-110 GW of renewable capacity additions already projected for the period.41
Natural gas infrastructure spending grows amidst opportunities across the value chain
Investment in natural gas pipelines, storage and distribution has been the fastest growing spending
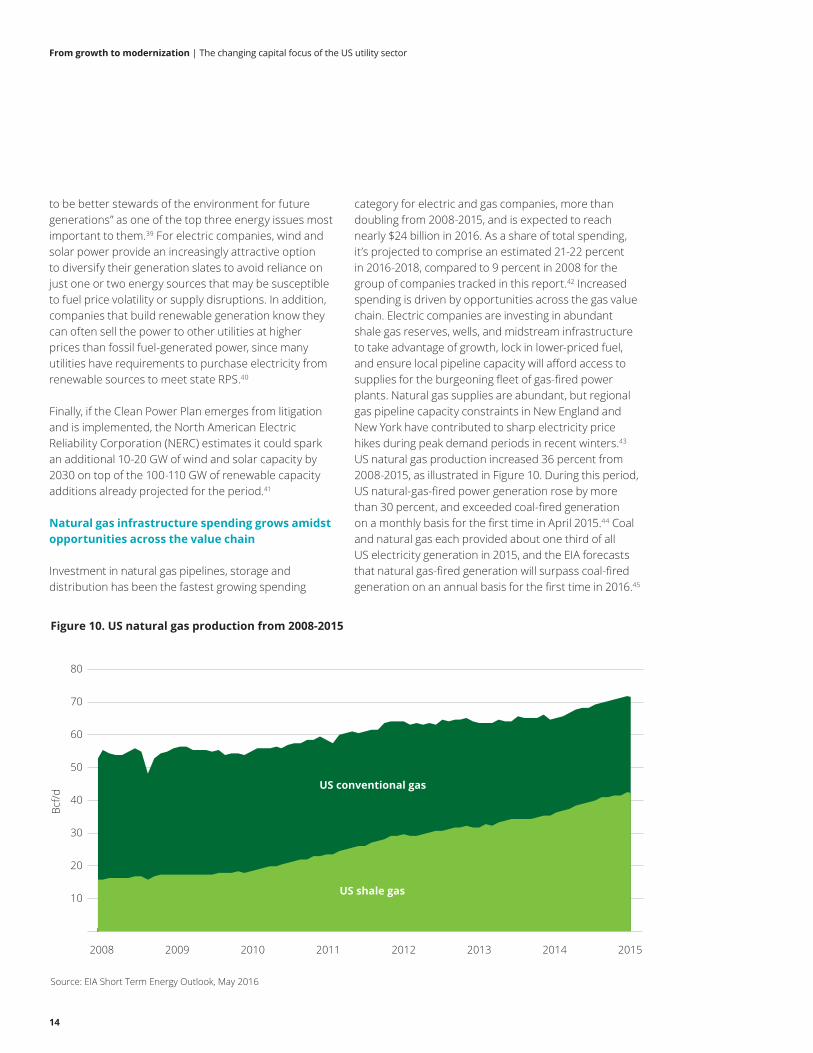
category for electric and gas companies, more than doubling from 2008-2015, and is expected to reach nearly $24 billion in 2016. As a share of total spending, it’s projected to comprise an estimated 21-22 percent in 2016-2018, compared to 9 percent in 2008 for the group of companies tracked in this report.42 Increased spending is driven by opportunities across the gas value chain. Electric companies are investing in abundant shale gas reserves, wells, and midstream infrastructure to take advantage of growth, lock in lower-priced fuel, and ensure local pipeline capacity will afford access to supplies for the burgeoning fleet of gas-fired power plants. Natural gas supplies are abundant, but regional gas pipeline capacity constraints in New England and New York have contributed to sharp electricity price hikes during peak demand periods in recent winters.43 US natural gas production increased 36 percent from 2008-2015, as illustrated in Figure 10. During this period, US natural-gas-fired power generation rose by more than 30 percent, and exceeded coal-fired generation on a monthly basis for the first time in April 2015.44 Coal and natural gas each provided about one third of all US electricity generation in 2015, and the EIA forecasts that natural gas-fired generation will surpass coal-fired generation on an annual basis for the first time in 2016.45
Figure 10. US natural gas production from 2008-2015
10
20
30
40
50
60
70
80
Bcf/d
Source: EIA Short Term Energy Outlook, May 2016
2008 2009 2010 2011 2012 2013 2014 2015
US conventional gas
US shale gas

From growth to modernization | The changing capital focus of the US utility sector
15
Figure 11. Total capital expenditures for 47 company universe, historical and forecast
$ Bi
llion
Source: RRA and SNL Energy. SNL Energy is an offering of S&P Global Market Intelligence.
5260
69 66 6571
86 86 89
99
115
10197
0
20
40
60
80
100
120
140
2006 2007 2008 2009 2010 2011 2012 2013 2014 2015 2016E 2017E 2018E
At the same time, electric and gas companies are upgrading and expanding the country’s aging gas distribution infrastructure to serve new facilities, address safety considerations, and comply with state and federal regulations. According to American Gas Association CEO Dave McCurdy, the gas industry is spending $22 billion annually to help enhance the safety of natural gas distribution and transmission systems.46 Another driving factor is that these investments in natural gas transmission and distribution are a source of relatively stable, regulated returns for utility companies.
Further investment in the gas space is also reflected in the recent spate of electric power company mergers with gas utilities, such as the Southern Company/AGL Resources, Duke Energy/Piedmont Natural Gas, and Dominion Resources/Questar Corporation deals. Transactions like these are driven by efforts to ensure gas supply, lock in lower gas prices, provide stable revenue opportunities as electric power demand growth moderates, and capitalize on the move to a cleaner power generation slate.
Are current spending levels sustainable?
Electric and gas industry capital expenditures for this group of companies nearly doubled over the decade from 2006-2015, rising from $52 billion to $99 billion. What’s more, spending is estimated to reach an unprecedented $115 billion this year, and even though projections show it moderating slightly in 2017-2018, the amounts are still substantial. In addition, analysts note that current year forecasts are sometimes overestimated, while expenditures for two years out are often underestimated.47 There are a number of drivers for continued high spending levels, as previously discussed, so it would not be surprising if 2017-2018 spending rose above the amounts in Figure 11.
How long can these spending levels continue? The answer depends partly on whether the costs are passed on to customers through rate increases. As Figure 12 shows, state utility commissions decided 953 cases involving the amount of revenue regulated electric and gas utilities are permitted to collect from ratepayers in

From growth to modernization | The changing capital focus of the US utility sector
16
the decade from 2006 to 2015, which resulted in close to $33 billion in additional revenue requirements over the ten year period, including almost $28 billion for electricity customers.
Electric and gas utilities began to file more rate cases in 2007, after a decade of low activity due in part to restructuring-related rate freezes and falling interest rates.48 By 2007, most of the rate freezes had expired and companies began planning for the substantial new investment required to upgrade infrastructure and comply with environmental regulations in a period of uncertain demand growth. Rate case activity peaked in 2010, with 128 cases decided and $5.7 billion in base rate increases (Figure 12), and it has remained substantial since then.
But customers may not have felt the full impact of these rate increases so far, because just as electric utilities’ capital spending programs were beginning to ramp up in 2008-2011, something else was happening: shale gas production was rising fast, and natural gas prices were falling sharply. In fact, the effect of electric utility rate
increases on customer bills has been softened in many cases by declining gas prices, which utilities have passed through as fuel rate decreases, sometimes offsetting electric rate increases. Low natural gas prices were the key driver behind 27 to 37 percent reductions in on-peak wholesale electricity prices at major US trading hubs in 2015, and even steeper declines in 2016.49 In fact, electricity prices have fallen so sharply that they are now about one third of a typical residential electric bill, down from about half eight years ago.50
However, despite lower wholesale gas and electricity prices, high capital expenditures and resulting rate increases have pushed overall electric bills up nearly 22 percent for residential customers over the last ten years, and about 12 percent for commercial and industrial customers (see Figure 13). Notably, after adjusting for inflation, the price changes amount to about a 4 percent increase for residential customers, and an effective decrease of nearly 6 percent for commercial and industrial customers, since rate increases in those segments have been outpaced by inflation.
Figure 12. Electric and gas base rate changes 2006-2015*
Year Electric base rate changes ($M)
Number of electric rate cases
Gas Base rate changes ($M)
Number of gas rate cases
2006 1,318.1 39 392.5 23
2007 1,405.7 43 645.4 43
2008 2,823.3 44 700.1 40
2009 4,191.6 58 483.9 36
2010 4,922.4 78 776.8 50
2011 2,595.2 57 367 31
2012 3,080.6 71 263.8 41
2013 3,326.5 63 495.1 39
2014 2,053.9 51 529 50
2015 1,887.0 56 487.6 40
Total 27,604.3 560 5,141.2 393
Source: RRA and SNL Energy. SNL Energy is an offering of S&P Global Market Intelligence. Includes data for the largest investor-owned/privately held electric and gas utilities in the US, excluding municipals, cooperatives, and government owned power authorities; tracks only cases in which the company has requested a rate change of at least $5 million or a rate change of at least $3 million was authorized.* Base rate changes are the aggregated revenue requirements from regulatory rulings in general rate cases each year, excluding rate changes from adjustment clauses (which may include fuel and purchased power costs) or rider mechanisms.

From growth to modernization | The changing capital focus of the US utility sector
17
So, while consumers are beginning to see the effects of high capital spending in their electric bills, the full price impact of the industry’s expansive capital program may not have been felt so far. Critical upgrades to the electric and gas transmission and distribution systems, grid modernization, and the move to lower emission generation sources are being partially funded thanks to low natural gas prices. Capital spending programs have also been aided by sustained low interest rates, bonus depreciation rules, and the fact that tax rates for dividends have not increased. But any of these factors can and may change over time, which could have a dampening effect on capital expenditures.
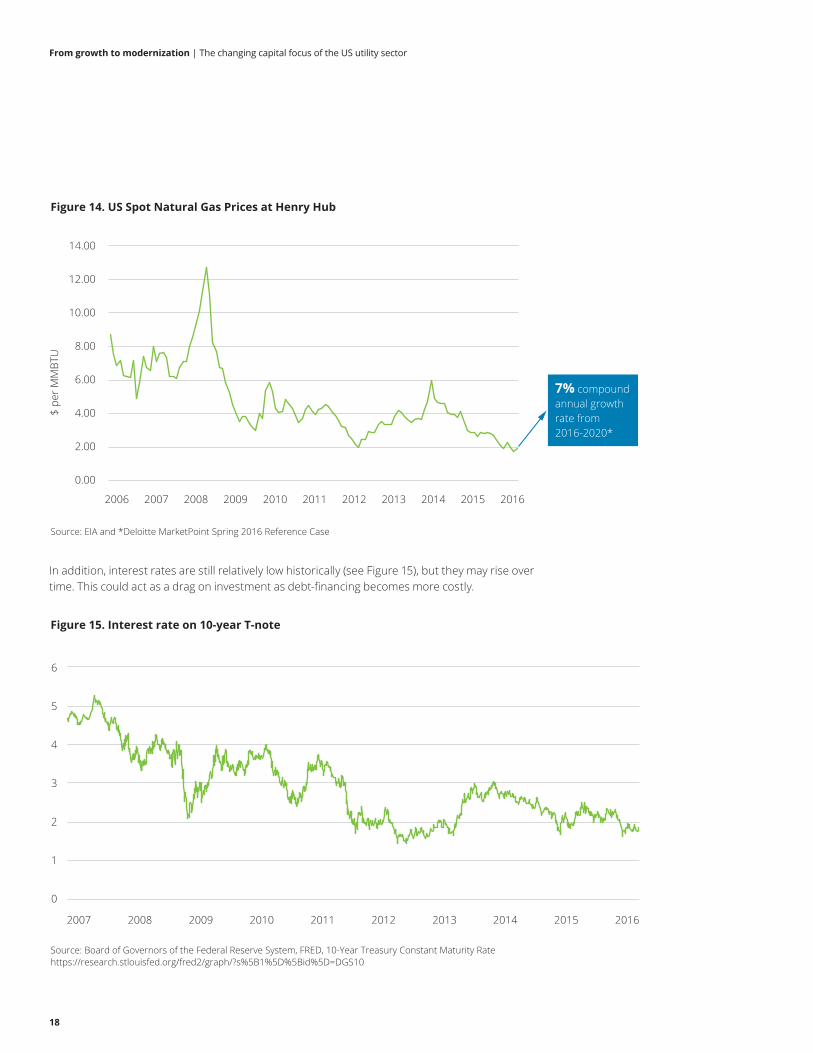
Take natural gas prices. The average May 2016 Henry Hub spot natural gas price was $1.92 per MMBTU, down 85 percent from its June 2008 peak of $12.69 per MMBTU. Deloitte MarketPoint sees the price firming at about a 7 percent compound annual growth rate (CAGR) from 2016 to 2020, approaching $4.00 to $4.25 per MMBTU by 2020 (see Figure 14). If fuel costs rise, the increase will be passed through to electricity customers, and rising retail electricity bills could prompt regulators to consider all options at their disposal rather than only rate increases. Rising customer electricity bills can also make electric utilities more vulnerable to competition, like rooftop solar and electricity storage providers.
Figure 13. US retail electricity price increases from 2006 to 2015
Average US retail price of electricity
2006Cts/kwh
2015Cts/kwh
10-year change
%
Inflation-adjusted
2006 price in 2015*Cts/kwh
10-year change inflation-adjustedCts/kwh
Inflation-adjusted
10-yr change %
Residential 10.4 12.67 21.8% 12.23 0.44 4.2%
Commercial 9.46 10.59 11.9% 11.12 -0.53 -5.6%
Industrial 6.16 6.89 11.9% 7.24 -0.35 -5.7%
Transportation 9.54 10.17 6.6% 11.22 -1.05 -11.0%
TOTAL all sectors 8.9 10.42 17.1% 10.46 -0.04 -0.4%
Source: EIA electricity data browser51 *Calculated using US Bureau of Labor Statistics inflation calculator at http://www.bls.gov/data/inflation_calculator.htm
From growth to modernization | The changing capital focus of the US utility sector
18
In addition, interest rates are still relatively low historically (see Figure 15), but they may rise over time. This could act as a drag on investment as debt-financing becomes more costly.
Figure 14. US Spot Natural Gas Prices at Henry Hub
Source: EIA and *Deloitte MarketPoint Spring 2016 Reference Case
0.00
2.00
4.00
6.00
8.00
10.00
12.00
14.00
2006 2007 2008 2009 2010 2011 2012 2013 2014 2015 2016
$ pe
r MM
BTU
7% compound annual growth rate from 2016-2020*
Figure 15. Interest rate on 10-year T-note
0
1
2
3
4
5
6
Source: Board of Governors of the Federal Reserve System, FRED, 10-Year Treasury Constant Maturity Ratehttps://research.stlouisfed.org/fred2/graph/?s%5B1%5D%5Bid%5D=DGS10
2007 2008 2009 2010 2011 2012 2013 2014 2015 2016
From growth to modernization | The changing capital focus of the US utility sector
19
Another factor that could change and adversely impact the capital investment outlook is tax reform. For example, bonus depreciation, which allows taxpayers including investor-owned utilities (IOUs) to further accelerate depreciation deductions for properties they acquire or build such as generation, transmission, and distribution assets, was extended in December 2015 through 2019.52 By allowing faster depreciation of assets, bonus depreciation reduces taxable income and can increase cash flow, which may help fund additional investment. However, as bonus depreciation phases down from 50 percent to 30 percent in the coming years, it could slow investment. At the same time, the policy is a double-edged sword for regulated utilities because it does not always increase cash flow. Faster depreciation and the resulting lower taxes may reduce a utility’s rate base, which could decrease revenue requirements. The availability of bonus depreciation since 2008 has resulted in some IOUs experiencing net operating losses (NOLs) and being unable to immediately realize these tax benefits.
In addition, the utility industry has lobbied consistently against an increase in dividend tax rates, but if a future tax reform plan ever succeeds at targeting dividends, it could reduce investor interest in the traditionally high dividend utility sector, potentially increasing cost of capital and dampening utility expenditures. Other proposals related to comprehensive tax reform would reduce the corporate income tax rate and repeal
accelerated tax depreciation. Such a combination of tax changes would also affect availability of cash as well as rate base and could impact capital investments.
In sum, the sustained trend of historically high capital expenditures in the electric and gas industry depends on a variety of economic and political factors, which will likely change over time.
From growth to modernization | The changing capital focus of the US utility sector
20
Conclusion
The last decade’s doubling of capital expenditures has helped accomplish some critical upgrades to the US electric and natural gas infrastructure. It is already beginning to make the electric grid more reliable, resilient, flexible, and clean. Similarly, gas infrastructure investment is enhancing pipeline safety, bringing new shale supplies to market and sharply reducing natural gas and electricity commodity prices for customers. In several areas of investment, like grid modernization and upgrading the gas distribution system, there is still a long way to go and substantial additional investment will be needed over many years. But most of these investments will bring future benefits by enabling the flexible grid of the future, and helping to avoid costly and potentially tragic disasters such as long-term, large-scale electricity outages or gas system explosions.
So far, these investments have been partially offset by lower fuel costs enabled by the shale revolution and the general downturn in oil and gas prices. Most utility customers have not seen sharp increases in their bills, but that could change. Factors such as rising natural gas prices could increase customer bills and make state utility commissions less amenable to rate hikes to cover capital investment programs.
For electric utilities, it will be important to plan for multiple scenarios and prioritize investments to ensure they’re investing in assets with long term growth potential. This can be challenging in a transforming industry, where new technologies, products, and competitors emerge regularly. In this environment, large capital outlays for centralized generation assets may become less common as regulatory systems evolve and electric companies consider all of the alternatives.
In the future, both electric and gas utilities will continue to invest in a safer, more reliable, and environmentally responsible energy infrastructure, but they might have to renew their focus on efforts to keep energy supplies affordable.
From growth to modernization | The changing capital focus of the US utility sector
21
Appendix: Exploring company investment patterns
A closer look at individual company expenditure profiles and financial metrics helps uncover common characteristics among companies with similar capital allocation patterns or companies with the highest levels of total capital expenditures.
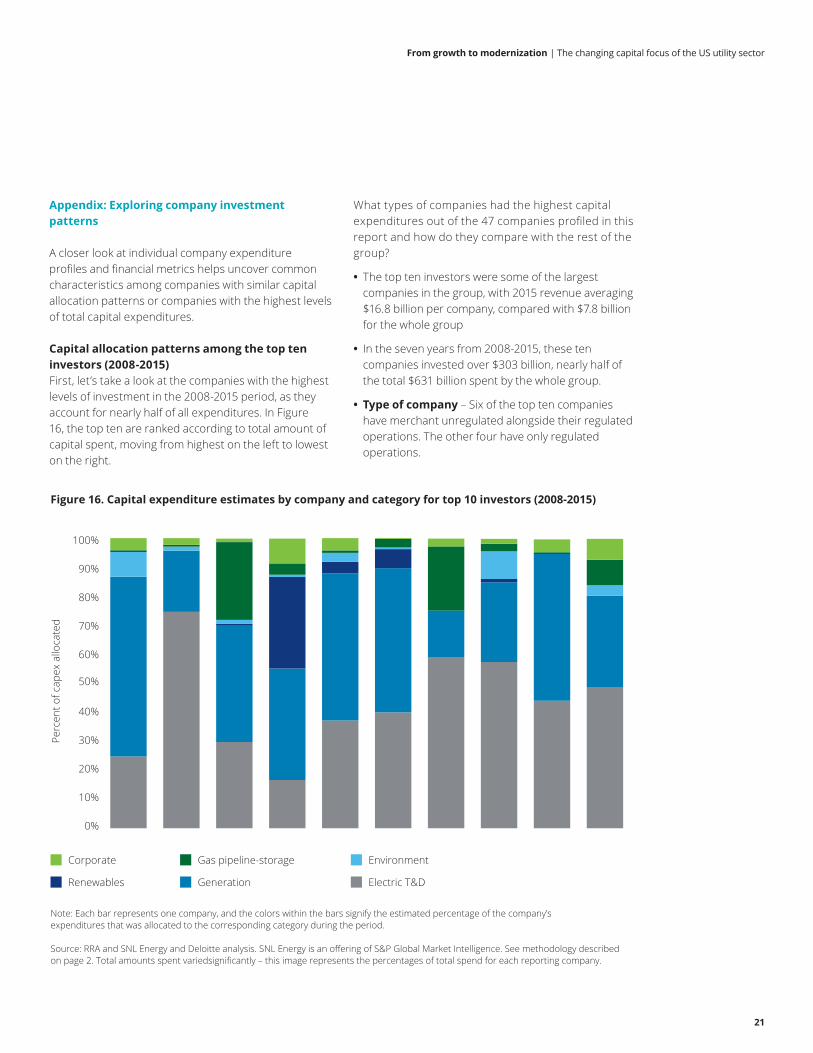
Capital allocation patterns among the top ten investors (2008-2015) First, let’s take a look at the companies with the highest levels of investment in the 2008-2015 period, as they account for nearly half of all expenditures. In Figure 16, the top ten are ranked according to total amount of capital spent, moving from highest on the left to lowest on the right.
What types of companies had the highest capital expenditures out of the 47 companies profiled in this report and how do they compare with the rest of the group?
• The top ten investors were some of the largest companies in the group, with 2015 revenue averaging $16.8 billion per company, compared with $7.8 billion for the whole group
• In the seven years from 2008-2015, these ten companies invested over $303 billion, nearly half of the total $631 billion spent by the whole group.
• Type of company – Six of the top ten companies have merchant unregulated alongside their regulated operations. The other four have only regulated operations.
Figure 16. Capital expenditure estimates by company and category for top 10 investors (2008-2015)
100%
90%
80%
70%
60%
50%
40%
30%
20%
10%
0%
Note: Each bar represents one company, and the colors within the bars signify the estimated percentage of the company’s expenditures that was allocated to the corresponding category during the period.
Source: RRA and SNL Energy and Deloitte analysis. SNL Energy is an offering of S&P Global Market Intelligence. See methodology described on page 2. Total amounts spent variedsignificantly – this image represents the percentages of total spend for each reporting company.
Corporate
Renewables
Gas pipeline-storage
Generation
Environment
Electric T&D
Perc
ent o
f cap
ex a
lloca
ted
From growth to modernization | The changing capital focus of the US utility sector
22
• Region – The top ten investors shown in Figure 16 are primarily located in Southern states (half), while two are located in the West, two in the Midwest, and one in the Northeast (according to US census regions).
• Return on invested capital (ROIC) – The companies had an average annual ROIC over the period of 4.9 percent, slightly higher than the average ROIC of 4.6 percent for the whole group. Individual companies’ ROIC ranged from 3.4 to 7.4 percent.
• Total shareholder return (TSR) – TSR for the group over the seven year period averaged 54 percent, which was significantly less than the larger group average of 98 percent and the midpoint of 99 percent. Among the top ten investors, TSR varied greatly—from -51 to 127 percent. Three in ten of the companies had a TSR above 100 percent, while three others had negative TSR. The midpoint was 75 percent.
• Revenue growth – Average CAGR for revenue for this group over the seven year period was 1.87 percent, although it ranged widely, from -2.9 to 8.6 percent across individual companies. Average CAGR for the larger group was zero percent.
• Bond ratings – Five of the top 10 companies shown in Figure 16 companies currently have S&P bond ratings of A- , two have BBB+ ratings and three are rated BBB. Ratings of A- to BBB+ were typical of the larger group as well.
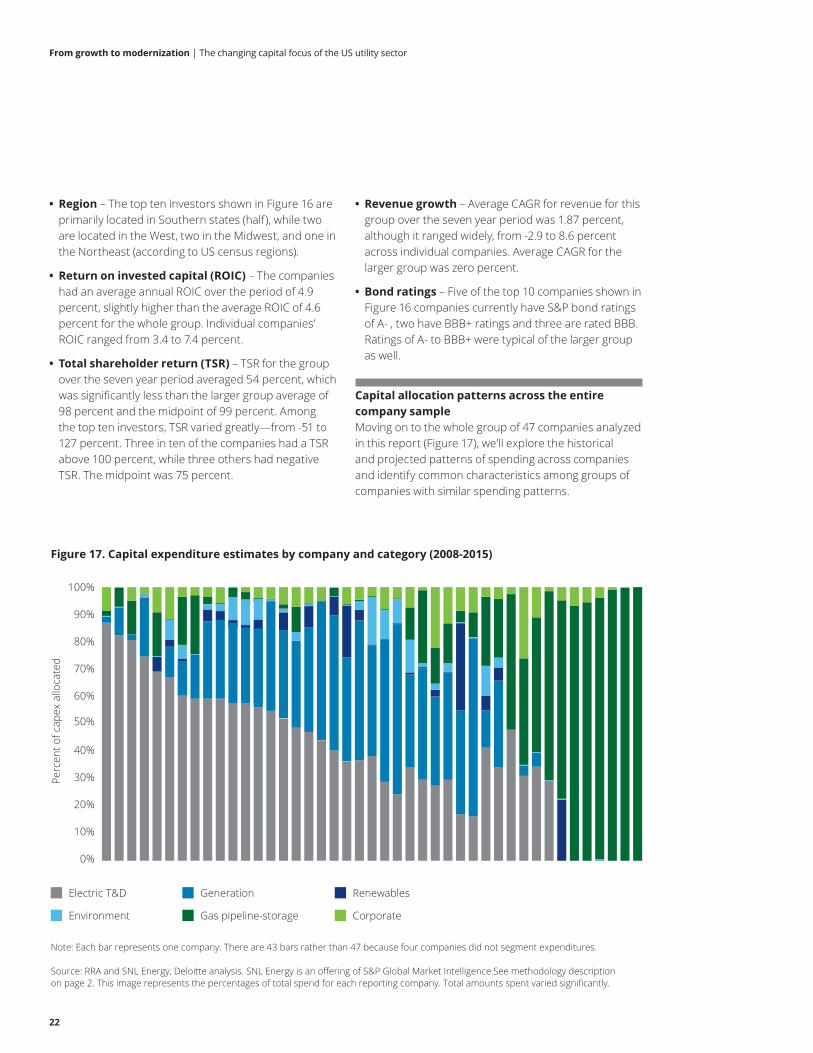
Capital allocation patterns across the entire company sampleMoving on to the whole group of 47 companies analyzed in this report (Figure 17), we’ll explore the historical and projected patterns of spending across companies and identify common characteristics among groups of companies with similar spending patterns.
Figure 17. Capital expenditure estimates by company and category (2008-2015)
Note: Each bar represents one company. There are 43 bars rather than 47 because four companies did not segment expenditures.
Source: RRA and SNL Energy, Deloitte analysis. SNL Energy is an offering of S&P Global Market Intelligence.See methodology description on page 2. This image represents the percentages of total spend for each reporting company. Total amounts spent varied significantly.
Corporate
Renewables
Gas pipeline-storage
Generation
Environment
Electric T&D
100%
90%
80%
70%
60%
50%
40%
30%
20%
10%
0%
Perc
ent o
f cap
ex a
lloca
ted
From growth to modernization | The changing capital focus of the US utility sector
23
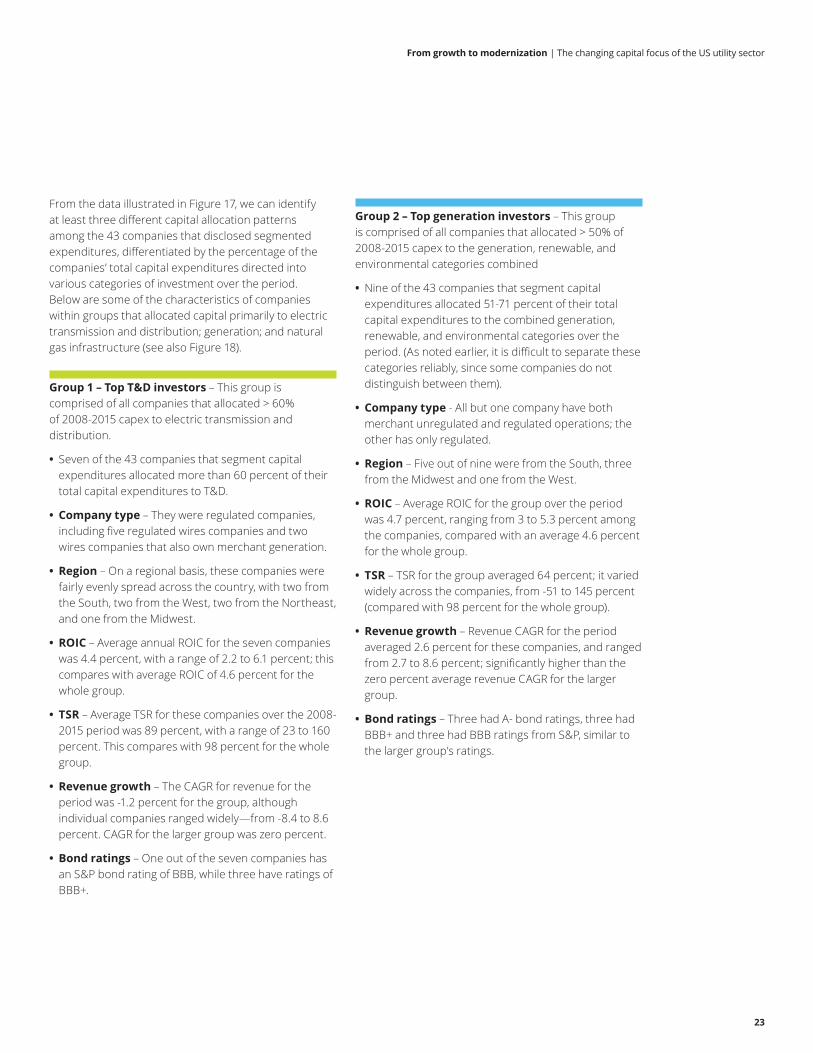
From the data illustrated in Figure 17, we can identify at least three different capital allocation patterns among the 43 companies that disclosed segmented expenditures, differentiated by the percentage of the companies’ total capital expenditures directed into various categories of investment over the period. Below are some of the characteristics of companies within groups that allocated capital primarily to electric transmission and distribution; generation; and natural gas infrastructure (see also Figure 18).
Group 1 – Top T&D investors – This group is comprised of all companies that allocated > 60% of 2008-2015 capex to electric transmission and distribution.
• Seven of the 43 companies that segment capital expenditures allocated more than 60 percent of their total capital expenditures to T&D.
• Company type – They were regulated companies, including five regulated wires companies and two wires companies that also own merchant generation.
• Region – On a regional basis, these companies were fairly evenly spread across the country, with two from the South, two from the West, two from the Northeast, and one from the Midwest.
• ROIC – Average annual ROIC for the seven companies was 4.4 percent, with a range of 2.2 to 6.1 percent; this compares with average ROIC of 4.6 percent for the whole group.
• TSR – Average TSR for these companies over the 2008-2015 period was 89 percent, with a range of 23 to 160 percent. This compares with 98 percent for the whole group.
• Revenue growth – The CAGR for revenue for the period was -1.2 percent for the group, although individual companies ranged widely—from -8.4 to 8.6 percent. CAGR for the larger group was zero percent.
• Bond ratings – One out of the seven companies has an S&P bond rating of BBB, while three have ratings of BBB+.
Group 2 – Top generation investors – This group is comprised of all companies that allocated > 50% of 2008-2015 capex to the generation, renewable, and environmental categories combined
• Nine of the 43 companies that segment capital expenditures allocated 51-71 percent of their total capital expenditures to the combined generation, renewable, and environmental categories over the period. (As noted earlier, it is difficult to separate these categories reliably, since some companies do not distinguish between them).
• Company type - All but one company have both merchant unregulated and regulated operations; the other has only regulated.
• Region – Five out of nine were from the South, three from the Midwest and one from the West.
• ROIC – Average ROIC for the group over the period was 4.7 percent, ranging from 3 to 5.3 percent among the companies, compared with an average 4.6 percent for the whole group.
• TSR – TSR for the group averaged 64 percent; it varied widely across the companies, from -51 to 145 percent (compared with 98 percent for the whole group).
• Revenue growth – Revenue CAGR for the period averaged 2.6 percent for these companies, and ranged from 2.7 to 8.6 percent; significantly higher than the zero percent average revenue CAGR for the larger group.
• Bond ratings – Three had A- bond ratings, three had BBB+ and three had BBB ratings from S&P, similar to the larger group’s ratings.
From growth to modernization | The changing capital focus of the US utility sector
24
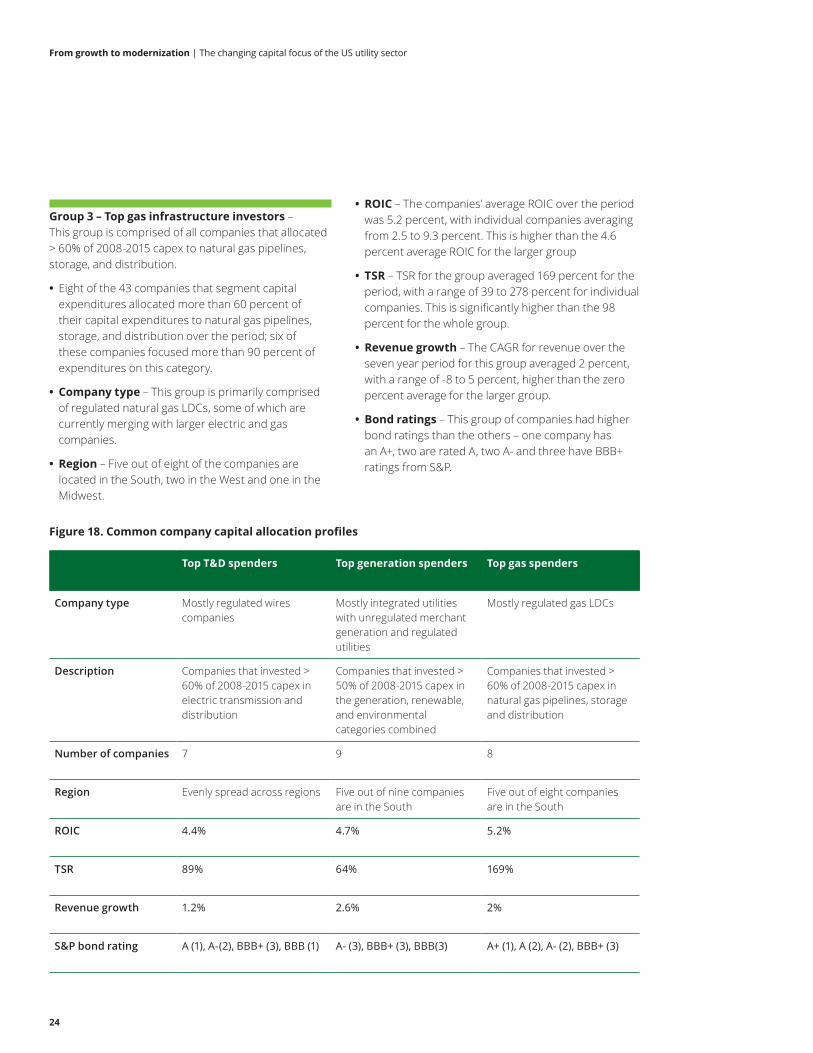
Group 3 – Top gas infrastructure investors – This group is comprised of all companies that allocated > 60% of 2008-2015 capex to natural gas pipelines, storage, and distribution.
• Eight of the 43 companies that segment capital expenditures allocated more than 60 percent of their capital expenditures to natural gas pipelines, storage, and distribution over the period; six of these companies focused more than 90 percent of expenditures on this category.
• Company type – This group is primarily comprised of regulated natural gas LDCs, some of which are currently merging with larger electric and gas companies.
• Region – Five out of eight of the companies are located in the South, two in the West and one in the Midwest.
Figure 18. Common company capital allocation profiles
Top T&D spenders Top generation spenders Top gas spenders
Company type Mostly regulated wires companies
Mostly integrated utilities with unregulated merchant generation and regulated utilities
Mostly regulated gas LDCs
Description Companies that invested > 60% of 2008-2015 capex in electric transmission and distribution
Companies that invested > 50% of 2008-2015 capex in the generation, renewable, and environmental categories combined
Companies that invested > 60% of 2008-2015 capex in natural gas pipelines, storage and distribution
Number of companies 7 9 8
Region Evenly spread across regions Five out of nine companies are in the South
Five out of eight companies are in the South
ROIC 4.4% 4.7% 5.2%
TSR 89% 64% 169%
Revenue growth 1.2% 2.6% 2%
S&P bond rating A (1), A-(2), BBB+ (3), BBB (1) A- (3), BBB+ (3), BBB(3) A+ (1), A (2), A- (2), BBB+ (3)
• ROIC – The companies’ average ROIC over the period was 5.2 percent, with individual companies averaging from 2.5 to 9.3 percent. This is higher than the 4.6 percent average ROIC for the larger group
• TSR – TSR for the group averaged 169 percent for the period, with a range of 39 to 278 percent for individual companies. This is significantly higher than the 98 percent for the whole group.
• Revenue growth – The CAGR for revenue over the seven year period for this group averaged 2 percent, with a range of -8 to 5 percent, higher than the zero percent average for the larger group.
• Bond ratings – This group of companies had higher bond ratings than the others – one company has an A+, two are rated A, two A- and three have BBB+ ratings from S&P.

From growth to modernization | The changing capital focus of the US utility sector
25
Over the next 3-4 years, individual company projections reveal an increased emphasis on natural gas investment as a proportion of individual company spending compared with the 2008-2015 period. This is also borne out in the projections for overall spending by segment in Figure 2, where the proportion of spending for all companies in the natural gas category rises from 15 percent in 2015 to 25 percent in 2016, and remains above 20 percent in the following years. These company projections also show a reduced emphasis on generation when compared with the recent patterns of company spending in Figure 17, a factor also seen in the aggregate spending projections in Figure 2.
Figure 19. Projected capital expenditures by company and category (2016-2019)
100%
90%
80%
70%
60%
50%
40%
30%
20%
10%
0%
Source: RRA and SNL Energy, Deloitte analysis. SNL Energy is an offering of S&P Global Market Intelligence. See methodology described on page 2. Total amounts spent variedsignificantly – this image represents the percentages of total spend for each reporting company.
Corporate
Renewables
Gas pipeline-storage
Generation
Environment
T&D
Perc
ent o
f cap
ex p
roje
cted

From growth to modernization | The changing capital focus of the US utility sector
26
Endnotes
1. Greg Aliff, The math series: Solving for disruption in the US electric power industry, Deloitte Center for Energy Solutions, November 2012, March 2013 and March 2014, http://www2.deloitte.com/us/en/pages/energy-and-resources/articles/the-math-series-solving-for-disruption-in-US-electric-power-industry.html
2. Charlotte Cox, Brian Collins, Tom Serzan and Rob Schain, Financial Focus Special Report, Capital Expenditure Update, SNL Energy, May 13, 2016, p. 1. https://www.snl.com/Sectors/Energy/ElectricPower.aspx
3. Thomas R. Kuhn, The Promise of Tomorrow: Electric Power Industry Outlook, presented at the Edison Electric Institute’s 2016 Wall St. Briefing, New York, February 20, 2016, p. 3. http://www.eei.org/resourcesandmedia/newsroom/Pages/Press%20Releases/EEI%20to%20Wall%20Street%20The%20Promise%20of%20Tomorrow.aspx
4. SNL Energy, Capital Expenditure database, 2008-2016, accessed May 2016.
5. Kuhn, The Promise of Tomorrow, p. 2.
6. Annual Energy Outlook 2016 Early Release: Annotated Summary of Two Cases, US Energy Information Administration, May 17, 2016, p. 17, http://www.eia.gov/forecasts/aeo/er/pdf/0383er(2016).pdf
7. SNL Energy, Transmission and distribution expenditure database, with data reported by companies in Federal Energy Regulatory Commission (FERC) Form 1. FERC Form 1 is an annual regulatory requirement for major electric utilities, licensees and others, accessed May 2016.http://www.ferc.gov/docs-filing/forms/form-1/form-1.pdf
8. Lori Aniti, Today in Energy: Investment in electricity transmission infrastructure shows steady increase, US Energy Information Administration (EIA), August 25, 2014. http://www.eia.gov/todayinenergy/detail.cfm?id=17711
9. Federal Energy Regulatory Commission (FERC), “Transmission Investment,” March 17, 2016, http://www.ferc.gov/industries/electric/indus-act/trans-invest.asp
10. Aniti, Today in Energy
11. Peter H. Larson, Lawrence Berkeley National Laboratory (LBNL) and Stanford University, Christina H. Lacommare and Joseph H. Ito, LBNL, and James L. Sweeney, Stanford University, Assessing changes in the reliability of the US electric power system, prepared for the US Office of Electricity Delivery and Energy Reliability, National Electricity Delivery Division, US Department of Energy, August 2015, pp. 62-63 https://emp.lbl.gov/sites/all/files/lbnl-188741.pdf
12. Executive Office of the President, White House Economic Council, The economic benefits of increasing electric grid resilience to weather outages, August 2013, p. 13. http://www.google.com/url?sa=t&rct=j&q=&esrc=s&source=web&cd=1&ved=0ahUKEwiiyoGw8IXNAhWBdT4KHXPQD34QFggfMAA&url=http%3A%2F%2Fenergy.gov%2Fsites%2Fprod%2Ffiles%2F2013%2F08%2Ff2%2FGrid%2520Resiliency%2520Report_FINAL.pdf&usg=AFQjCNFExUc4-H2WXFcT5Dv6I-tx6tSTuw&bvm=bv.123325700,d.cWw
13. Rob Young, John McCue and Christian Grant, The Power is on: How IoT technology is driving energy innovation, Deloitte University Press, January 21, 2016, http://dupress.com/articles/internet-of-things-iot-in-electric-power-industry/
14. Katherine Tweed, “Where will the next $400B in grid investment come from?” Greentechmedia.com, March 25, 2014, http://www.greentechmedia.com/articles/read/where-will-the-next-400b-in-grid-investment-come-from
15. Barbara Vergetis Lundin, “Well positioned: SGIP ready to take on challenges with grid modernization funding,” smartgridnews.com, February 7, 2016,http://www.smartgridnews.com/story/well-positioned-sgip-ready-take-challenges-grid-modernization-funding/2016-02-07
16. Coley Girouard, “Utility regulators were busy in 2015. Here are the top 10 issues they dealt with,” Greentechmedia.com, December 22, 2015, https://www.greentechmedia.com/articles/read/top-10-utility-commission-issues-of-2015
17. Gavin Bade, ”New York PSC enacts new revenue models for utilities in REV proceeding,” utilitydive.com, May 20, 2016, http://www.utilitydive.com/news/new-york-psc-enacts-new-revenue-models-for-utilities-in-rev-proceeding/419596/
18. Business Council for Sustainable Energy, Sustainable Energy in America Factbook, Bloomberg New Energy Finance, 2016, p. 131. http://www.bcse.org/sustainableenergyfactbook/#
19. Institute for Electric Innovation (IEI), book launch for Thought leaders speak out: Key trends driving change in the electric power industry, quote from presentation by Frank Prager, vice president, policy and federal affairs, Xcel Energy, Washington DC, December 12, 2015, http://www.edisonfoundation.net/iei/Documents/IEI_KeyTrendsDrivingChange_FINAL.pdf
20. Electric Power Research Institute, News Spotlight, June 2015, http://www.epri.com/Documents/in%20the%20news/News%20Spotlight%202015%20June.PDF , accessed May 2016.
21. SNL Energy, Capital Expenditure database
22. Tim Henderson, “Americans are moving South, West again,” pewtrusts.org, January 2016, http://www.pewtrusts.org/en/research-and-analysis/blogs/stateline/2016/01/08/americans-are-moving-south-west-again , accessed May 2016.
From growth to modernization | The changing capital focus of the US utility sector
27
23. Owen Comstock, “Coal made up more than 80% of retired electricity generating capacity in 2015,” Today in Energy, US EIA, March 8, 2016, https://www.eia.gov/todayinenergy/detail.cfm?id=25272, accessed May 2016
24. US EIA, Electric Power Monthly with data for March 2016, Table 6.6, Planned US electric generating unit retirements, https://www.eia.gov/electricity/monthly/pdf/epm.pdf, accessed May 2016.
25. Cox, SNL Energy Financial Focus, p. 4.
26. US EIA, Annual Energy Outlook 2015, “Levelized Cost and Levelized Avoided Cost of New Generation Resources in the Annual Energy Outlook 2015,” June 3, 2015, http://www.eia.gov/forecasts/aeo/electricity_generation.cfm , accessed May 2016.
27. SNL Energy M&A League Tables, http://www.snl.com/Sectors/Energy/ElectricPower.aspx , accessed May 2016.
28. Federal Energy Regulatory Commission (FERC), “New generation in-service,” Office of Energy Projects, Energy Infrastructure Updates, December 2012-2015 http://www.ferc.gov/legal/staff-reports/2015/dec-infrastructure.pdf, accessed May 2016.
29. “New York PSC enacts new utility revenue model,” Smartgridtoday.com, May 20, 2016, http://www.smartgridtoday.com/public/New-York-PSC-enacts-new-utilityrevenue-model.cfm, accessed May 2016.
30. US Environmental Protection Agency, “Mercury and Air Toxics Standards,” https://www.epa.gov/mats, accessed May 2016.
31. Gavin Bade, “Court ruling lets EPA enforce MATS rule despite Supreme Court rejection,” utilitydive.com, December 15, 2015, http://www.utilitydive.com/news/court-ruling-lets-epa-enforce-mats-rule-despite-supreme-court-rejection/410862/ , accessed May 2016.
32. Quinlan J Shea III, The Promise of Tomorrow: Electric Power Industry Outlook, presented at the Edison Electric Institute’s 2016 Wall St. Briefing, New York, February 20, 2016, p. 8, http://www.eei.org/resourcesandmedia/newsroom/Pages/Press%20Releases/EEI%20to%20Wall%20Street%20The%20Promise%20of%20Tomorrow.aspx , accessed May 2016.
33. Ibid, p. 9.
34. Thomas R. Kuhn, president, EEI, remarks at USEA 12th Annual State of the Energy Industry Forum, Washington DC, January 21, 2016, and The Promise of Tomorrow: Electric Power Industry Outlook, remarks by Richard F. McMahon, Jr., vice president, energy supply and finance at the Edison Electric Institute’s 2016 Wall St. Briefing, New York, February 20, 2016, p. 6.
35. Jocelyn Durkay, “State Renewable Portfolio Standards and Goals,” National Conference of State Legislatures (NCSL), March 23, 2016, http://www.ncsl.org/research/energy/renewable-portfolio-standards.aspx , accessed May 2016. Find map of US state RPS policies at: http://ncsolarcen-prod.s3.amazonaws.com/wp-content/uploads/2015/11/Renewable-Portfolio-Standards.pdf
36. Cara Marcy, “Hawaii and Vermont set high renewable portfolio standard targets,” Today in Energy, US EIA, June 29, 2015, https://www.eia.gov/todayinenergy/detail.cfm?id=21852 , accessed May 2016.
37. Cox, SNL Energy Financial Focus, p. 7.
38. Chris Arnold, “Tax Breaks, Falling Costs Are Boosting Wind And Solar,” All Things Considered, NPR, December 29, 2015, http://www.npr.org/2015/12/29/460812946/tax-breaks-falling-costs-are-boosting-wind-and-solar and Business Council for Sustainable Energy, Sustainable Energy in America Factbook, p. 57. http://www.bcse.org/sustainableenergyfactbook/ , accessed May 2016.
39. Andrew Clinton, John McCue, and Marlene Motyka, Deloitte Resources 2016 Study - Energy Management: Navigating the headwinds, Deloitte Center for Energy Solutions, June 21, 2016, p, 8, http://www2.deloitte.com/us/en/pages/energy-and-resources/articles/resources.html
40. Cassandra Sweet, “U.S. Utilities Boost Investments in Wind, Solar Power,” wsj.com, May 9, 2016,http://www.wsj.com/articles/u-s-utilities-boost-investments-in-wind-solar-power-1462825903 , accessed May 2016.
41. Robert Walton, “NERC: Clean Power Plan will halve US power demand growth, spur renewables,” utilitydive.com, May 20, 2016, http://www.utilitydive.com/news/nerc-clean-power-plan-will-halve-us-power-demand-growth-spur-renewables/419581/ , accessed May 2016.
42. SNL Energy, Capital Expenditure database
43. April Lee, Tim Shear, and Katie Teller, “Mild weather, ample natural gas supply curb Northeast winter power and natural gas prices,” Today in Energy, US EIA, April 5, 2016, http://www.eia.gov/todayinenergy/detail.cfm?id=25672 , accessed May 2016.
44. Victoria Zaretskaya, “Many natural gas-fired power plants under construction are near major shale plays,” Today in Energy, US EIA, May 19, 2016, http://www.eia.gov/todayinenergy/detail.cfm?id=26312 , accessed May 2016.
45. Tyler Hodge, “Natural gas expected to surpass coal in mix of fuel used for US power generation in 2016,” Today in Energy, US EIA, March 16, 2016, http://www.eia.gov/todayinenergy/detail.cfm?id=25392 , accessed May 2016.
46. Dave McCurdy, President and Chief Executive Officer, American Gas Association, remarks at USEA 12th Annual State of the Energy Industry Forum, Washington DC, January 21, 2016.

From growth to modernization | The changing capital focus of the US utility sector
28
47. Cox, SNL Energy Financial Focus, p. 1.
48. RRA Regulatory Focus, “Themes in Energy Utility Regulation” February 3, 2016, pp 2-3.
49. Tim Shear, “Wholesale power prices decrease across the country in 2015,” Today in Energy, US EIA, January 11, 2016, http://www.eia.gov/todayinenergy/detail.cfm?id=24492 and US EIA, Electricity Monthly Update with data for March 2016, https://www.eia.gov/electricity/monthly/update/wholesale_markets.cfm, accessed May 2016.
50. Jonathan N. Crawford and Naureen S. Malik, “Why your utility bill’s still rising even when power’s so cheap,” bloomberg.com, April 4, 2016, http://www.bloomberg.com/news/articles/2016-04-04/why-your-utility-bill-s-still-rising-even-when-power-s-so-cheap , accessed May 2016.
51. US EIA, Electricity Data Browser,average retail price of electricity, annual, http://www.eia.gov/electricity/data/browser/#/topic/7?agg=0,1&geo=g&endsec=vg&linechart=ELEC.PRICE.US-ALL.A~ELEC.PRICE.US-RES.A~ELEC.PRICE.US-COM.A~ELEC.PRICE.US-IND.A&columnchart=ELEC.PRICE.US-ALL.A~ELEC.PRICE.US-RES.A~ELEC.PRICE.US-COM.A~ELEC.PRICE.US-IND.A&map=ELEC.PRICE.US-ALL.A&freq=A&start=2006&end=2015&ctype=linechart<ype=pin&rtype=s&pin=&rse=0&maptype=0 , accessed May 2016.

Let’s talk
John McCueVice Chairman, US Energy & Resources LeaderDeloitte LLP+1 216 830 [email protected]@JMcCue624
Key contributors
Suzanna SanbornSenior Manager, Market InsightsEnergy & ResourcesDeloitte Services LP+1 703 251 [email protected]@SuzannaSanborn
Andrew SlaughterDirector, Deloitte Center for Energy SolutionsDeloitte LLP+1 713 982 [email protected]
• Kartikay Sharma, Senior Analyst, Deloitte Support Services India Pvt. Ltd.
• Deepak Vasantl Shah, Senior Analyst, Deloitte Support Services India Pvt. Ltd.
• Negina Rood, Research Manager, Deloitte Services LP
• Rob Young, Manager and Senior Sector Specialist, Deloitte Consulting LLP
• James Loo, Advisory Consultant, Deloitte & Touche LLP

This publication contains general information only and Deloitte is not, by means of this publication, rendering accounting, business, financial, investment, legal, tax, or other professional advice or services. This publication is not a substitute for such professional advice or services, nor should it be used as a basis for any decision or action that may affect your business. Before making any decision or taking any action that may affect your business, you should consult a qualified professional advisor. Deloitte shall not be responsible for any loss sustained by any person who relies on this publication.
About Deloitte Deloitte refers to one or more of Deloitte Touche Tohmatsu Limited, a UK private company limited by guarantee (“DTTL”), its network of member firms, and their related entities. DTTL and each of its member firms are legally separate and independent entities. DTTL (also referred to as “Deloitte Global”) does not provide services to clients. Please see www.deloitte.com/about for a detailed description of DTTL and its member firms. Please see www.deloitte.com/us/about for a detailed description of the legal structure of Deloitte LLP and its subsidiaries. Certain services may not be available to attest clients under the rules and regulations of public accounting.
Copyright © 2016 Deloitte Development LLC. All rights reserved.Member of Deloitte Touche Tohmatsu Limited
The Deloitte Center for Energy Solutions (the “Center”) provides a forum for innovation, thought leadership, groundbreaking research, and industry collaboration to help companies solve the most complex energy challenges.
Through the Center, Deloitte’s Energy & Resources group leads the debate on critical topics on the minds of executives–from the impact of legislative and regulatory policy, to operational efficiency, to sustainable and profitable growth. We provide comprehensive solutions through a global network of specialists and thought leaders.
With locations in Houston and Washington, DC, the Center offers interaction through seminars, roundtables, and other forms of engagement, where established and growing companies can come together to learn, discuss, and debate.
www.deloitte.com/us/energysolutions
@Deloitte4Energy
We want your feedback In an effort to capture your feedback, so we can continue to provide you with the most relevant and valuable publication material, we have created this brief survey to better understand your needs. Thank you for your participation.
www.deloitte.com/us/er-tl/survey