To look at post-apartheid population redistribution patterns in SA Movements of different...
28
Population redistribution trends South Africa
-
date post
19-Dec-2015 -
Category
Documents
-
view
218 -
download
0
Transcript of To look at post-apartheid population redistribution patterns in SA Movements of different...

Population redistribution trends
South Africa
Objective
To look at post-apartheid population redistribution patterns in SA Movements of different population groups at the national level Redistribution trends inside the large metropolitan areas To compare the latter to current urban development policy

REDISTRIBUTION TRENDS OVERALL
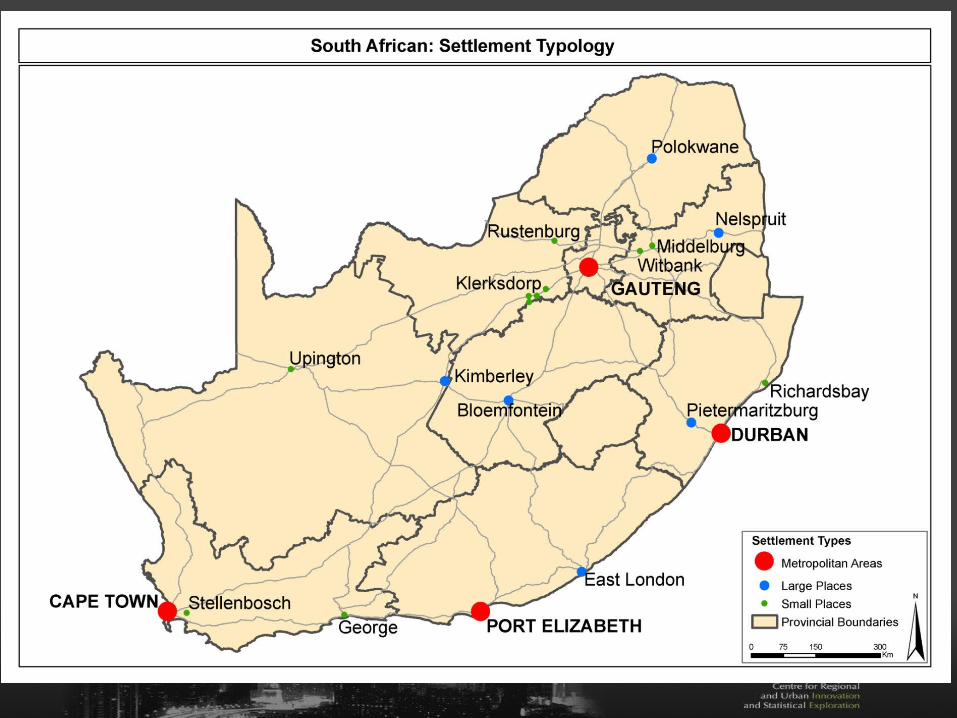
INCOME
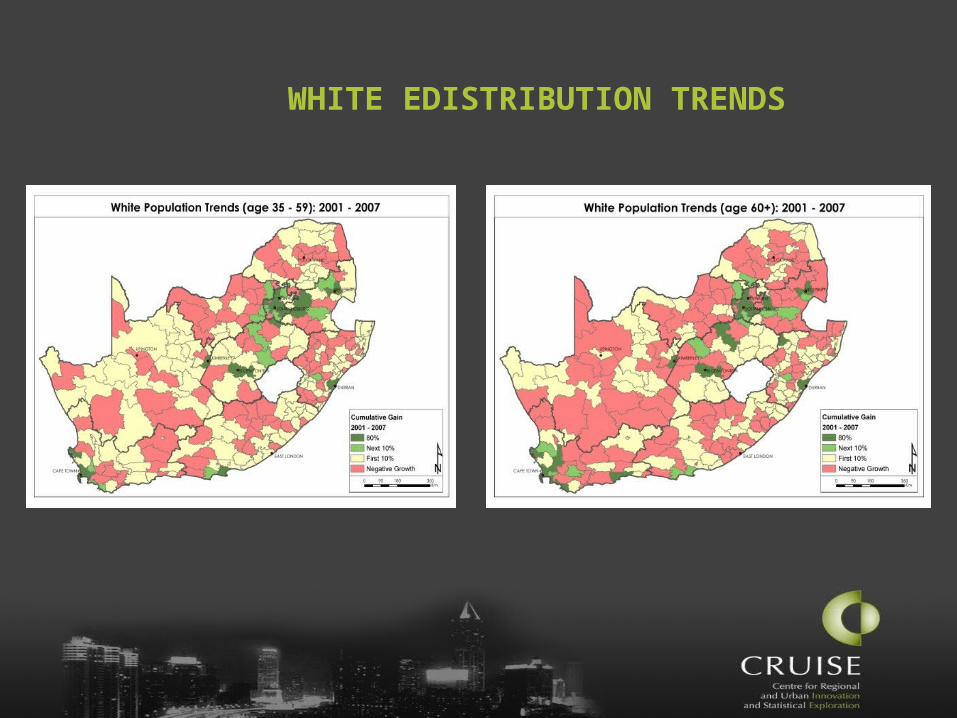
WHITE EDISTRIBUTION TRENDS
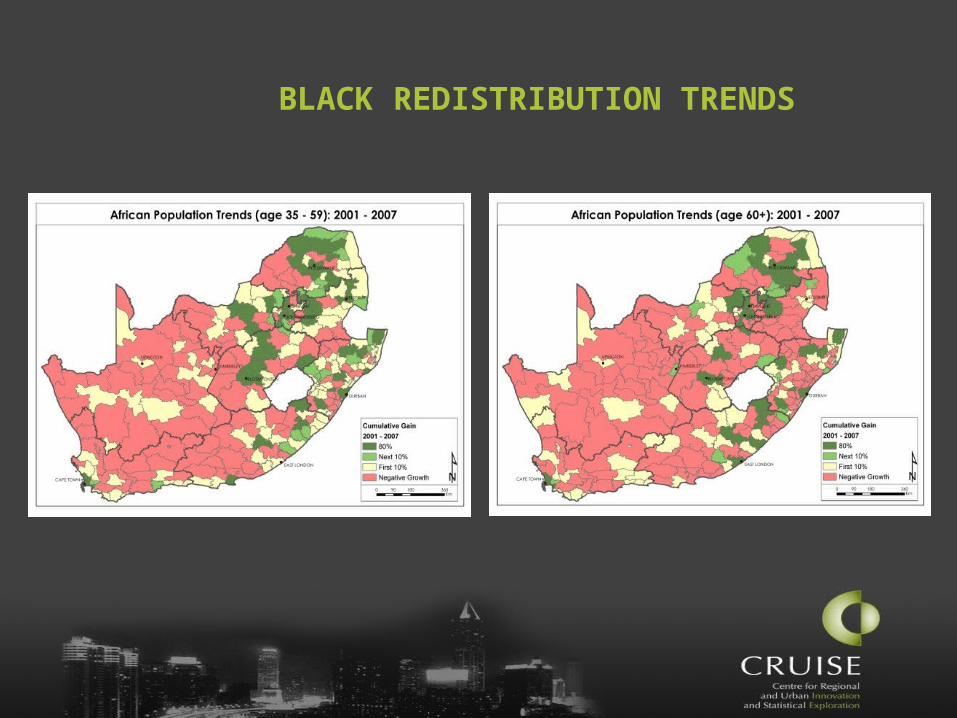
BLACK REDISTRIBUTION TRENDS
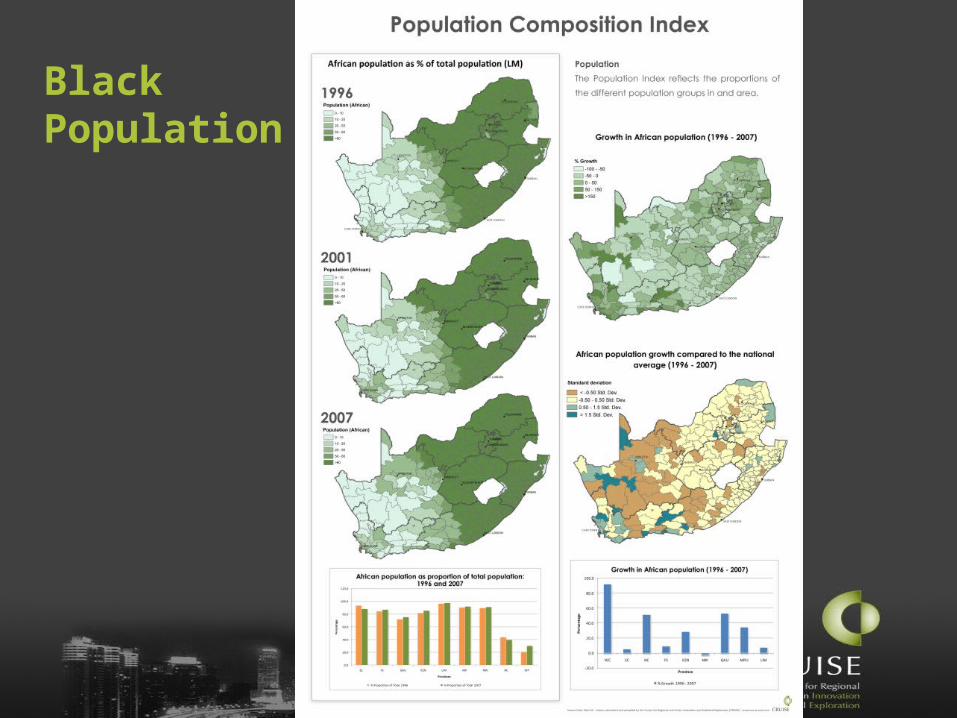
Black Population
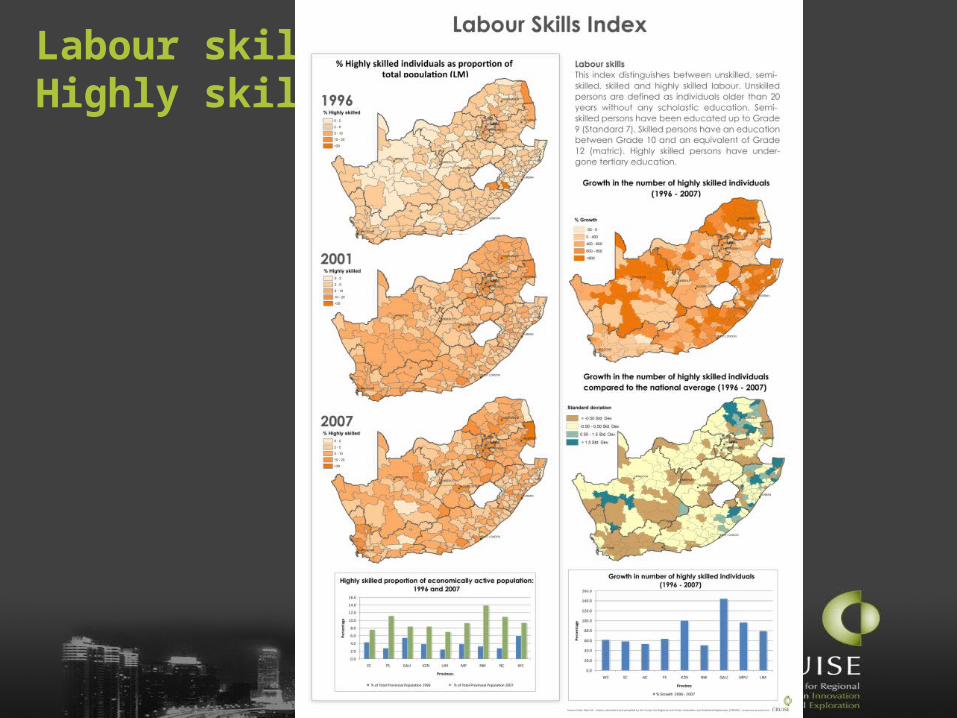
Labour skillsHighly skilled
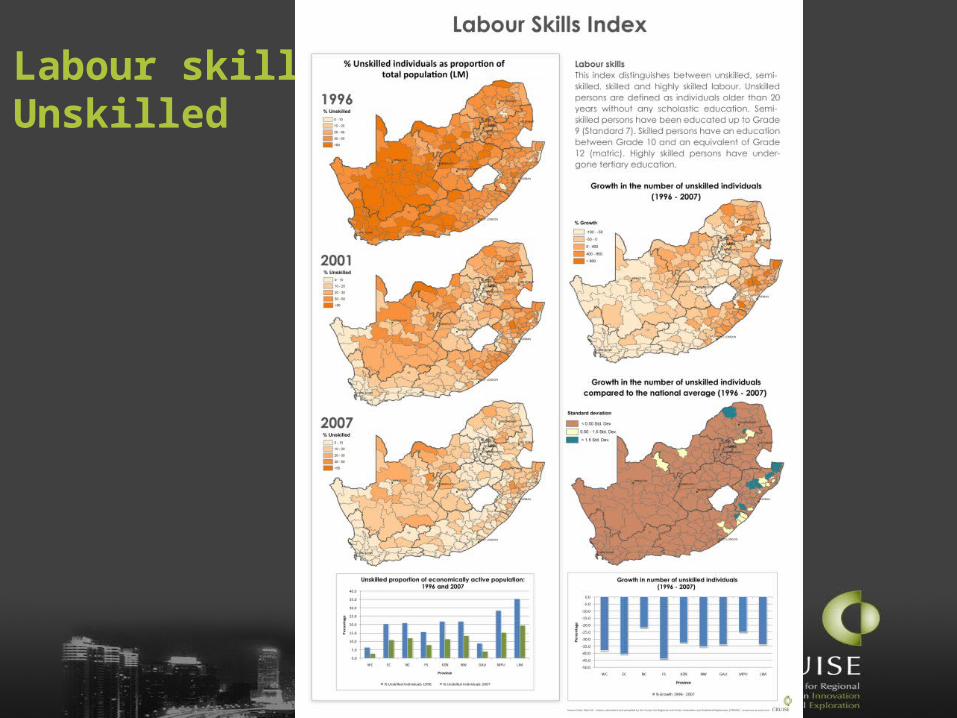
Labour skillsUnskilled

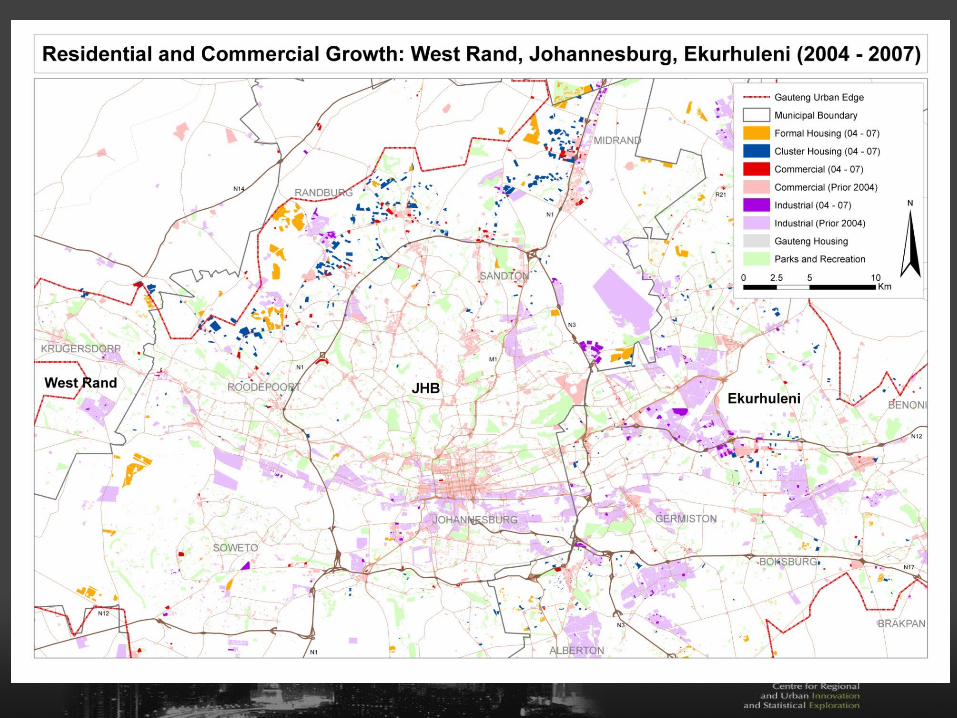
GAUTENG

GAUTENG
Formal
Cluster
Informal
0
20
40
60
80
0
10
20
30
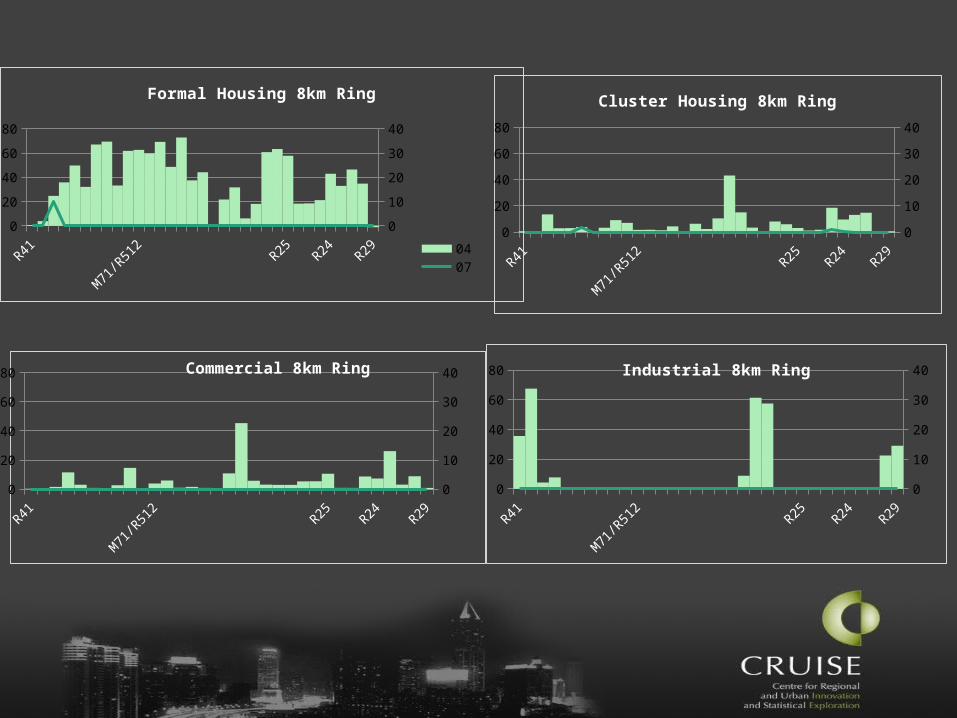
40Commercial 8km Ring
R41
M71/R
512
R25 R24 R290
20
40
60
80
0
10
20
30
40Industrial 8km Ring
R41
M71
/R51
2R25 R24 R29
0
20
40
60
80
0
10
20
30
40
Cluster Housing 8km Ring
R41
M71/R
512
R25 R24 R290
20
40
60
80
0
10
20
30
40
Formal Housing 8km Ring
0407

R24 M5R51
2R55 R25 N12
0
20
40
60
80
0
10
20
30
40
Commercial 18km Ring
R24 M5
R512
R55 R25 N120
20
40
60
80
0
10
20
30
40Industrial 18km Ring
R24 M5R51
2R55 R25 N12
0
20
40
60
80
0
10
20
30
40
Cluster Housing 18km RingR
41
R24
R47
M5
R512
R511
R55
N1
R25
R24
N12
R29
01020304050607080
0510152025303540
Formal Housing 18km Ring
0407
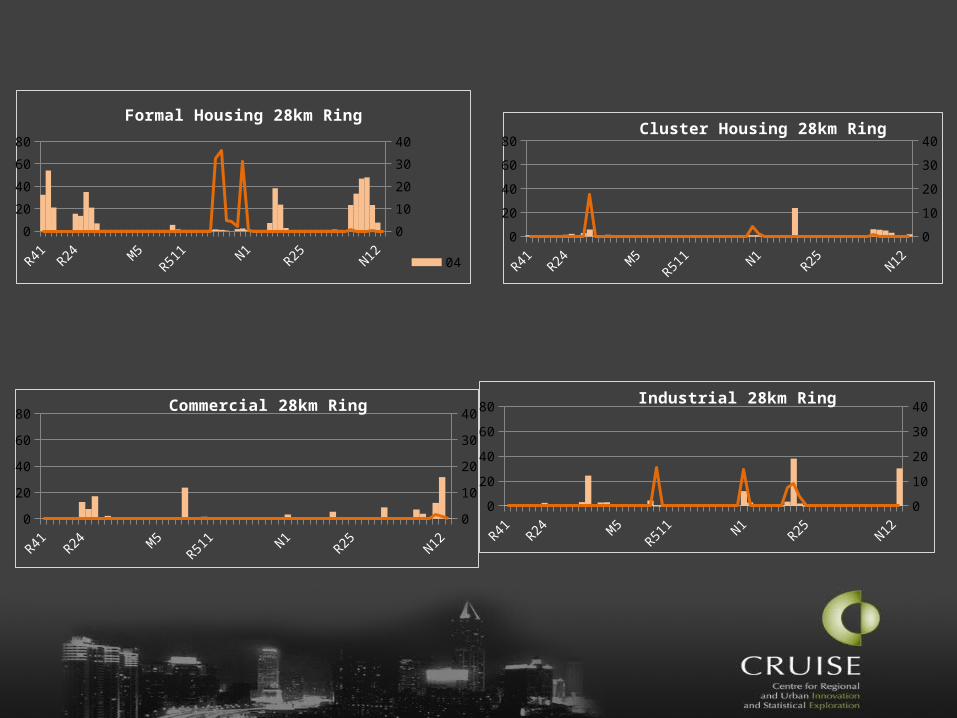
R41 R24 M5
R511 N1
R25 N120
20
40
60
80
0
10
20
30
40Commercial 28km Ring
R41 R24 M5R51
1 N1R25 N12
0
20
40
60
80
0
10
20
30
40Industrial 28km Ring
0
20
40
60
80
0
10
20
30
40Cluster Housing 28km Ring
0
20
40
60
80
0
10
20
30
40
Formal Housing 28km Ring
0407
68 (R24) 112 (R511) 136 (N1) 182 (R29)0
20
40
60
80
0
10
20
30
40Commercial 38km Ring
07
68 (R24) 112 (R511) 136 (N1) 182 (R29)0
20
40
60
80
0
10
20
30
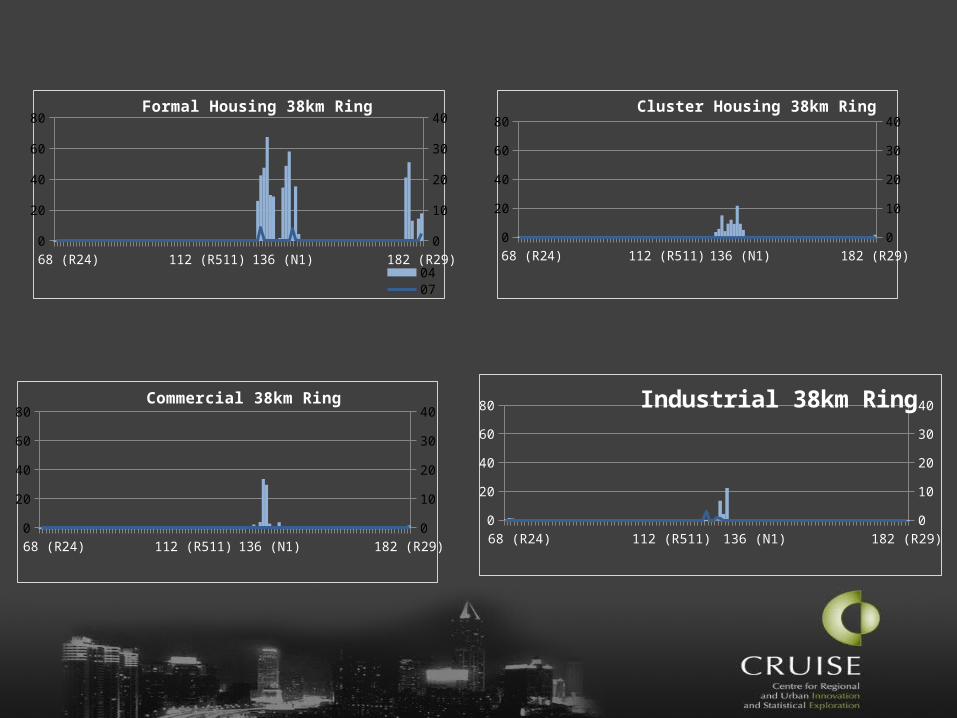
40Industrial 38km Ring
68 (R24) 112 (R511) 136 (N1) 182 (R29)0
20
40
60
80
0
10
20
30
40Cluster Housing 38km Ring
68 (R24) 112 (R511) 136 (N1) 182 (R29)0
1020304050607080
0510152025303540
Formal Housing 38km Ring
0407
8km 18km 28km 38km0
10
20
30
40
50
60
70
0
5
10
15
20
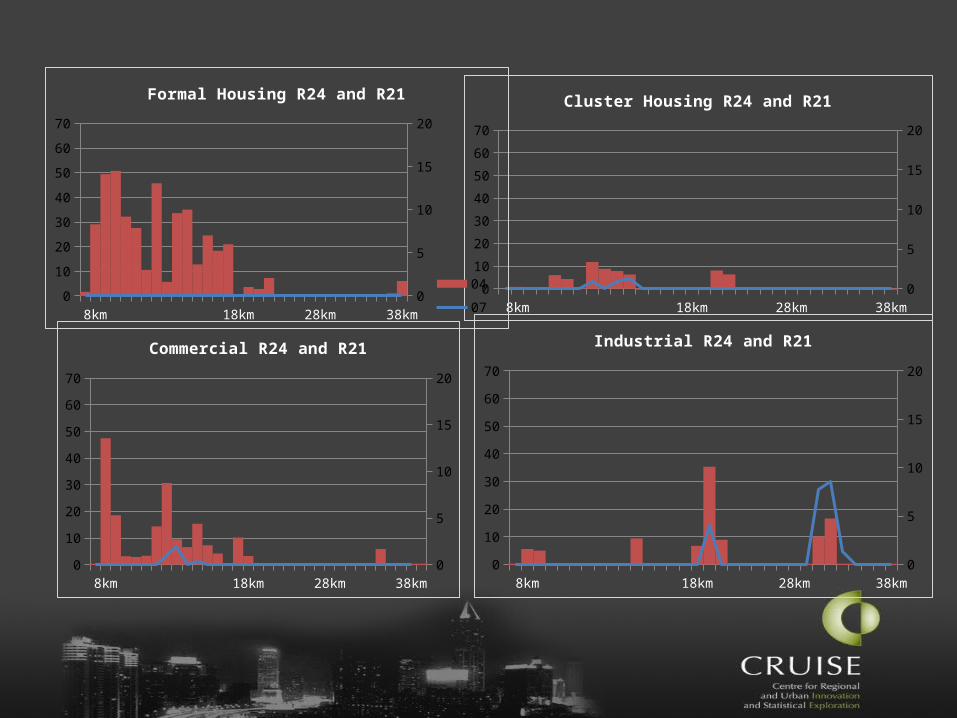
Commercial R24 and R21
8km 18km 28km 38km0
10
20
30
40
50
60
70
0
5
10
15
20
Industrial R24 and R21
8km 18km 28km 38km0
10
20
30
40
50
60
70
0
5
10
15
20
Cluster Housing R24 and R21
8km 18km 28km 38km0
10
20
30
40
50
60
70
0
5
10
15
20
Formal Housing R24 and R21
04
07
8km 18km 28km 38km0
10
20
30
40
50
60
70
0
2
4
6
8
10
12
14
16
18
20
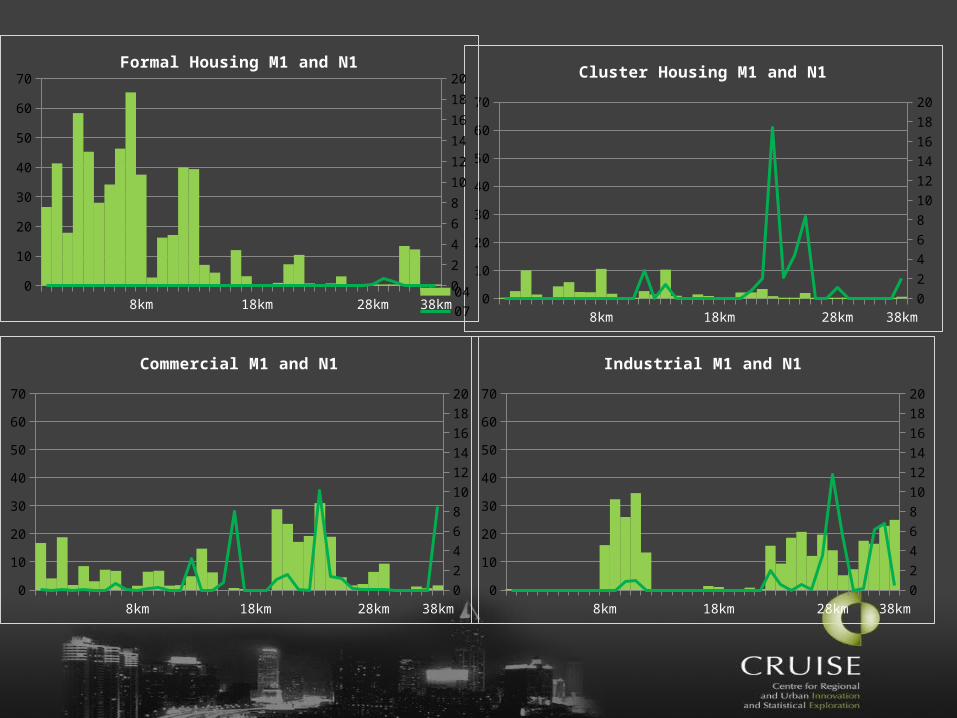
Commercial M1 and N1
8km 18km 28km 38km0
10
20
30
40
50
60
70
0
2
4
6
8
10
12
14
16
18
20
Industrial M1 and N1
8km 18km 28km 38km0
10
20
30
40
50
60
70
0
2
4
6
8
10
12
14
16
18
20
Cluster Housing M1 and N1
8km 18km 28km 38km0
10
20
30
40
50
60
70
0
2
4
6
8
10
12
14
16
18
20Formal Housing M1 and N1
0407
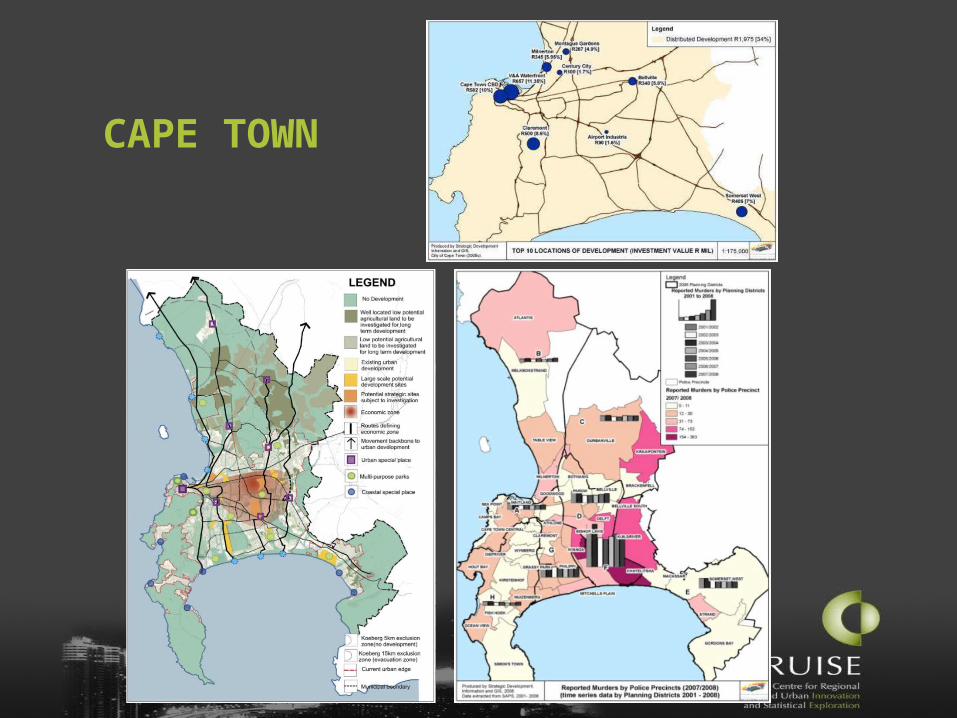
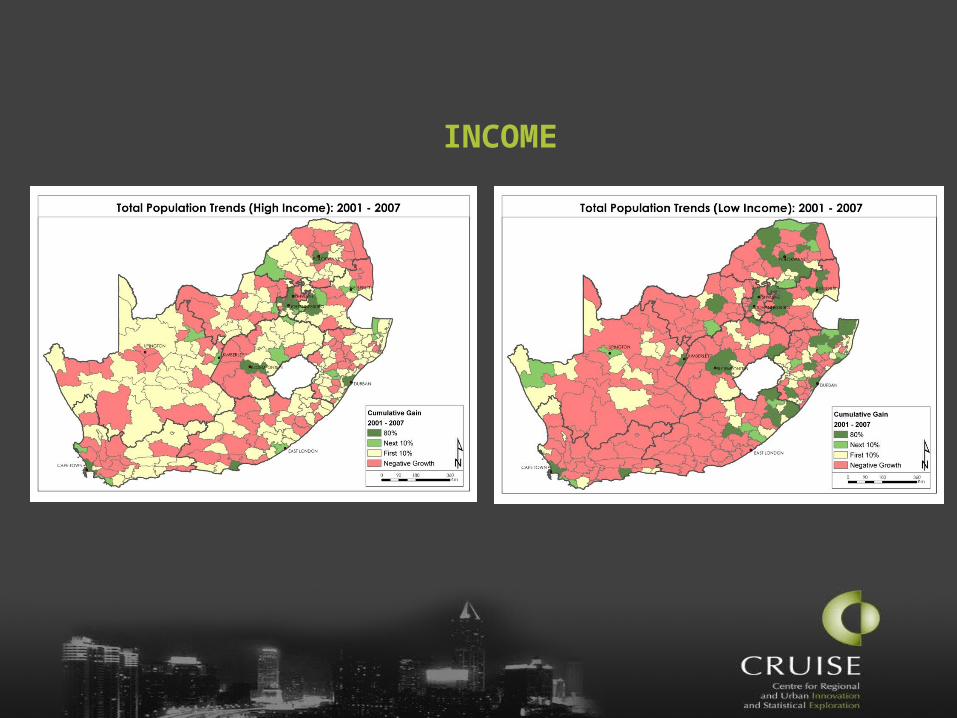
CAPE TOWN
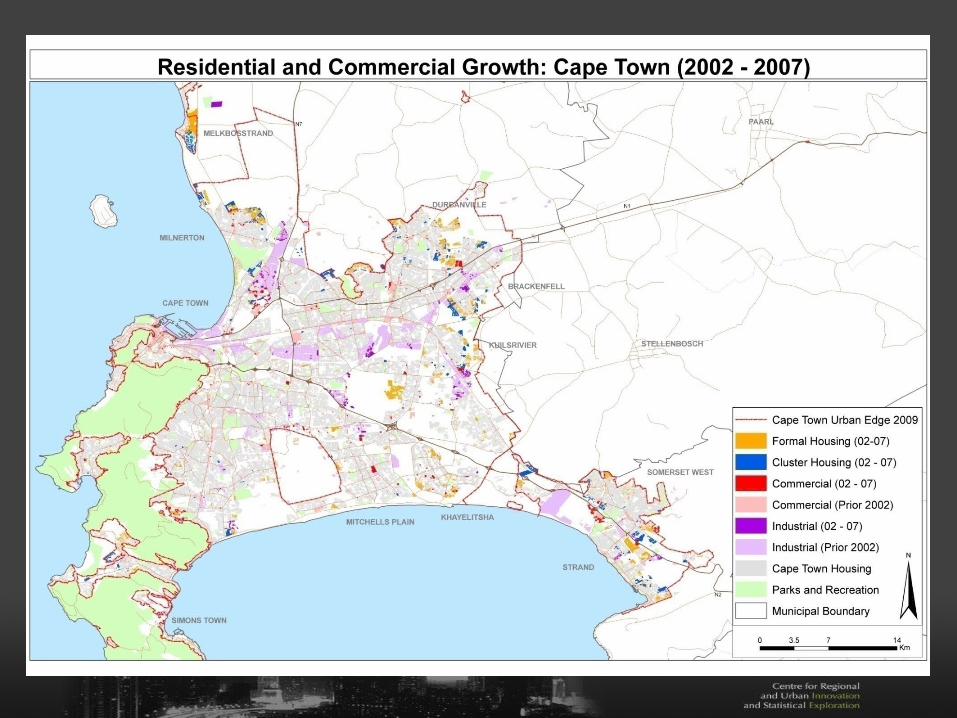

Low density residential development

Cluster housing development
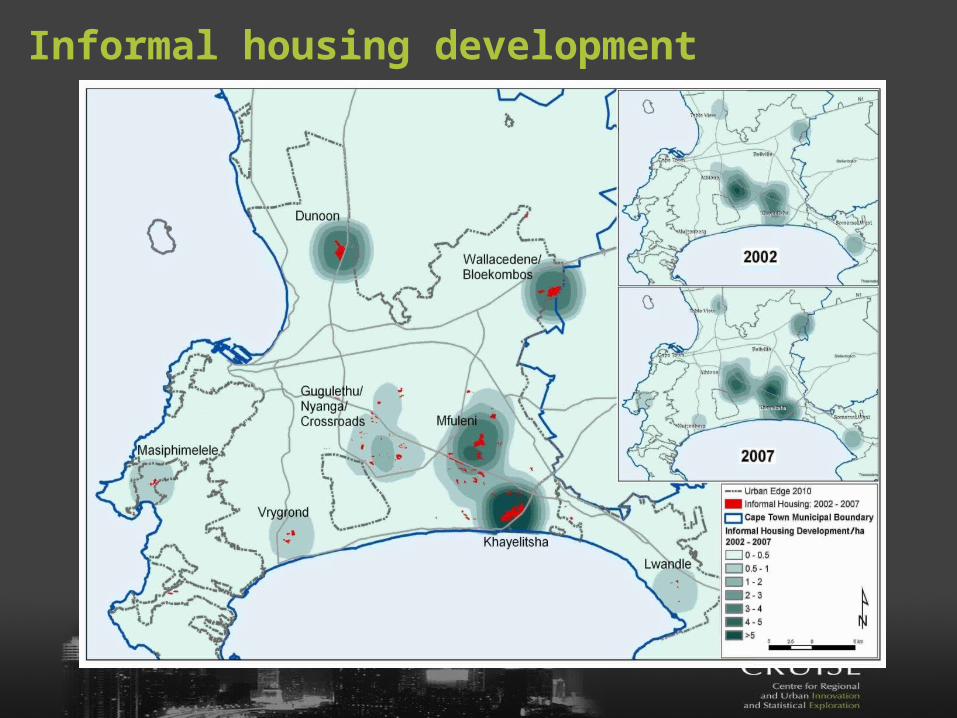
Informal housing development
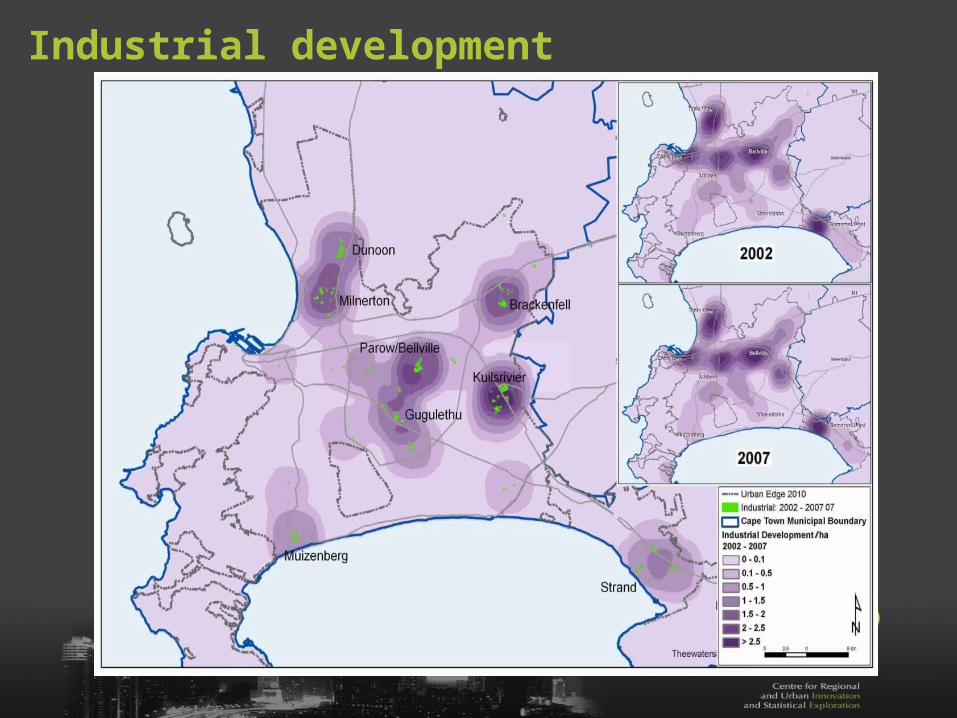
Industrial development
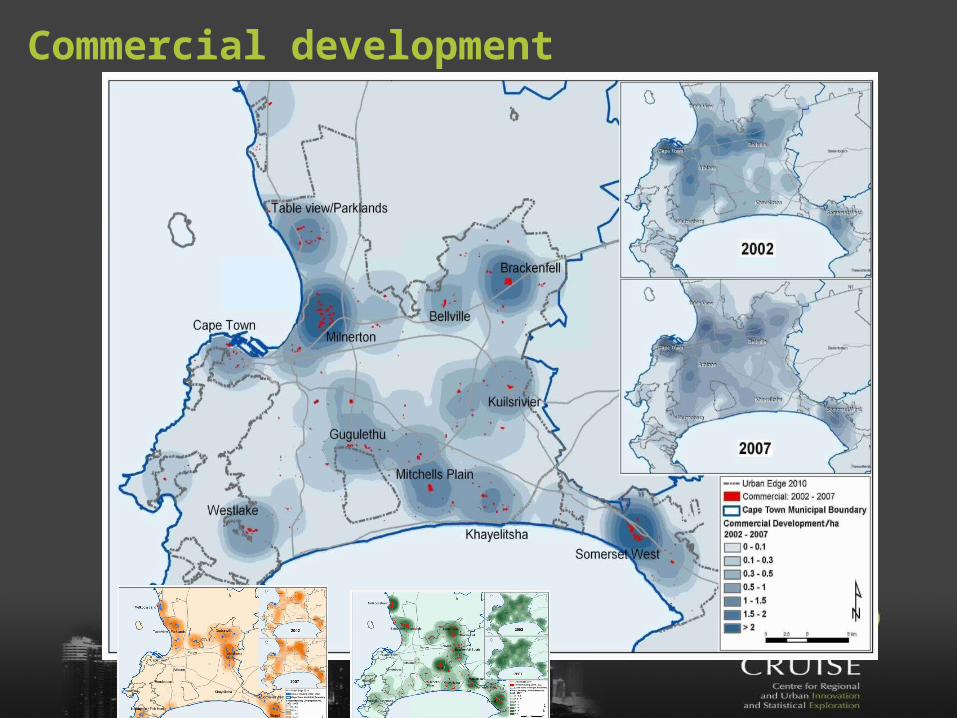
Commercial development
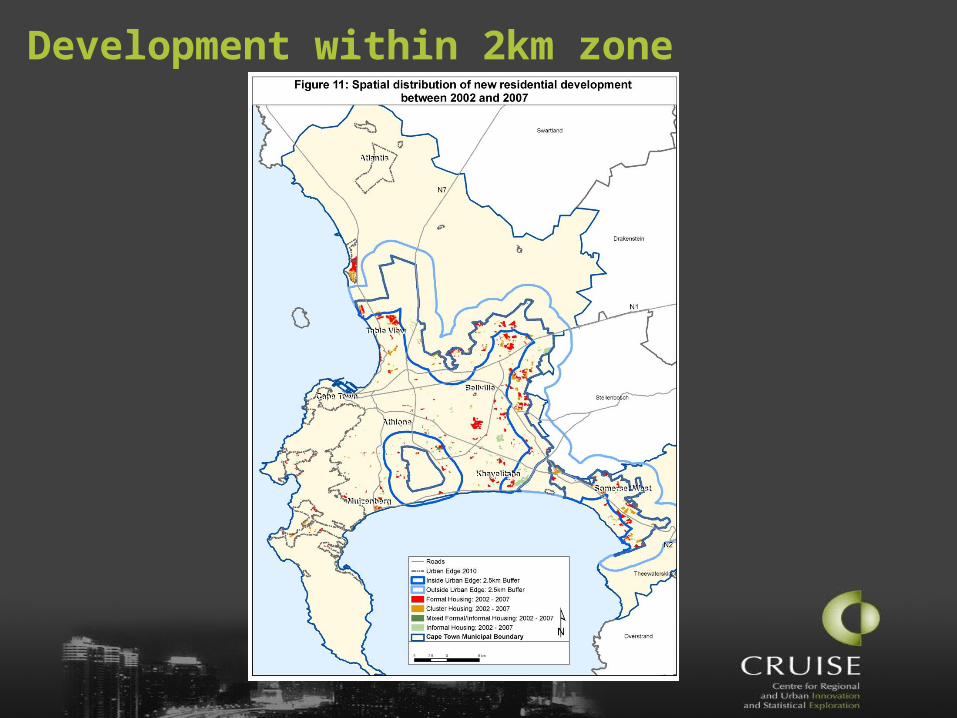
Development within 2km zone

Conclusions Blacks migrated to metros and Intermediate sized cities Still large concentrations in former Homelands Whites moved mainly to areas in and around Gauteng and
Cape Town as well as to the south coast Whites left metros along the east coast People in the metros vote with their feet – deconcentration Policy to attract people to inner city areas not successful Industrial and commercial enterprises locate along main
collector roads but generally in the direction of where the people are moving