IEEE Region 7 GOLD Chair Training Verona Wong IEEE Region 7 GOLD Coordinator.
Upload
vuongquynhCategory
view
220download
4
Proposals to Improve the National System of Technical Vocational Education and Training in the Philippines
Aniceto Orbeta*August 2015
* With assistance from NEDA and TESDA

Outline
• Review of the Characteristics • Assessment of Performance• Proposal to Improve the system
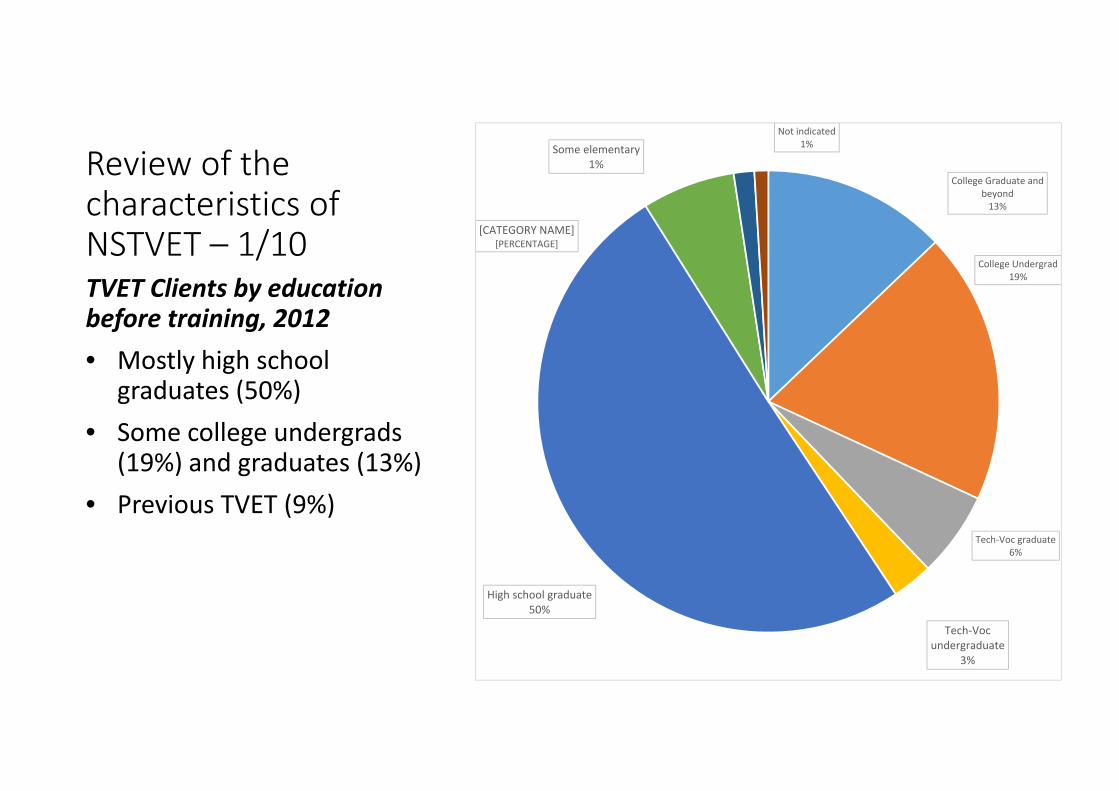
Review of the characteristics of NSTVET – 1/10TVET Clients by education before training, 2012• Mostly high school
graduates (50%)• Some college undergrads
(19%) and graduates (13%)• Previous TVET (9%)
College Graduate and beyond13%
College Undergrad19%
Tech‐Voc graduate6%
Tech‐Voc undergraduate
3%
High school graduate50%
[CATEGORY NAME][PERCENTAGE]
Some elementary1%
Not indicated1%

Review of the characteristics of NSTVET ‐2/10Reason for taking TVET, 2012• Biggest for
employment / to get job (45%)
• Next to gain skills (38%)
• Next skills upgrading / enhancement (7%)
For employment/to get job45%
To gain skills38%
For skills upgrading/enhancement
7%
Personal use2%
TVET qualification is popular(many are
enrolling)2%
Not indicated2%
Others2%
For promotion/ Increase in income
1%
Nothing to do1%
Reasons for taking TVET
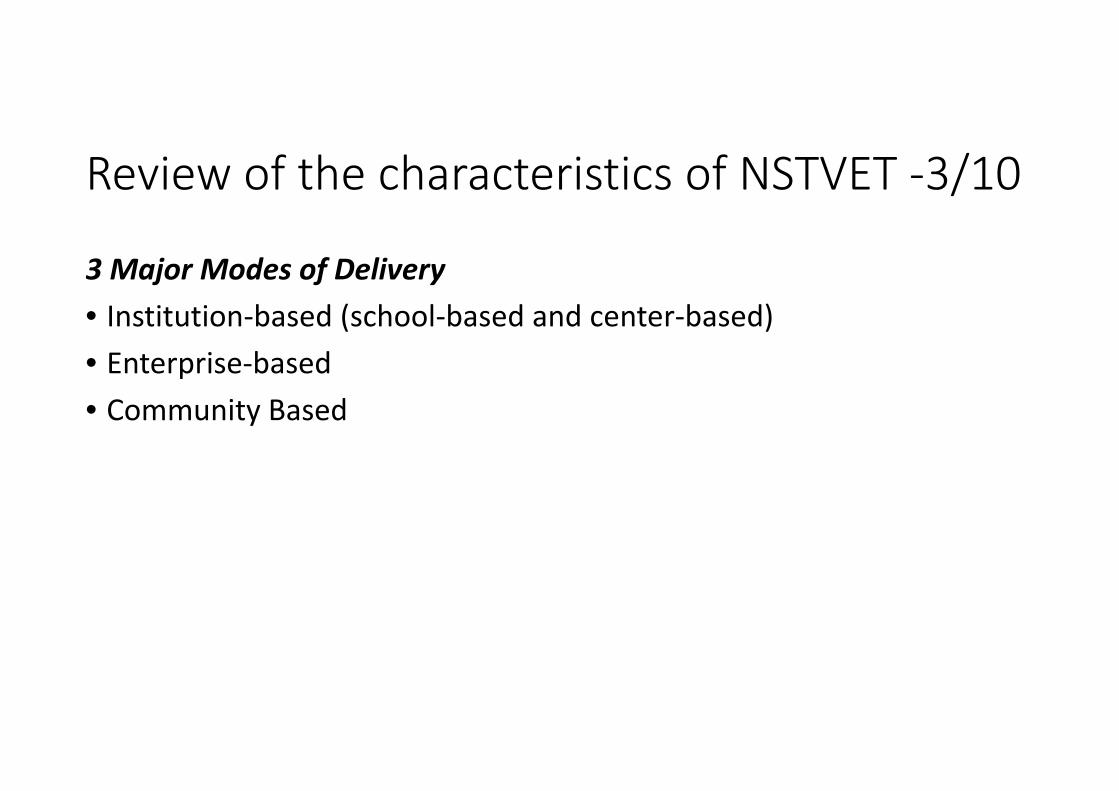
Review of the characteristics of NSTVET ‐3/10
3 Major Modes of Delivery• Institution‐based (school‐based and center‐based)• Enterprise‐based• Community Based

Review of the characteristics of NSTVET ‐4/10
2006 2009 2010 2011 2012 2013Community‐based 866,410 946,281 620,720 615,974 672,075 826,381
Enterprise‐based 98,329 127,708 86,978 80,309 90,707 77,518Institution‐based 772,126 910,657 860,919 875,848 1,041,960 1,039,690
0
500,000
1,000,000
1,500,000
2,000,000
2,500,000
Enrolled
Institution‐based Enterprise‐based Community‐based
2006 2009 2010 2011 2012 2013Community‐based 879,248 907,730 599,531 581,363 663,744 800,518
Enterprise‐based 72,592 122,505 73,352 72,082 80,370 68,659Institution‐based 388,780 873,558 671,488 679,306 856,544 896,580
0
200,000
400,000
600,000
800,000
1,000,000
1,200,000
1,400,000
1,600,000
1,800,000
2,000,000
Graduates
Institution‐based Enterprise‐based Community‐based
Enrollment & Graduation: Biggest proportions are institution‐based, followed by community based, a tiny proportion enterprise‐based
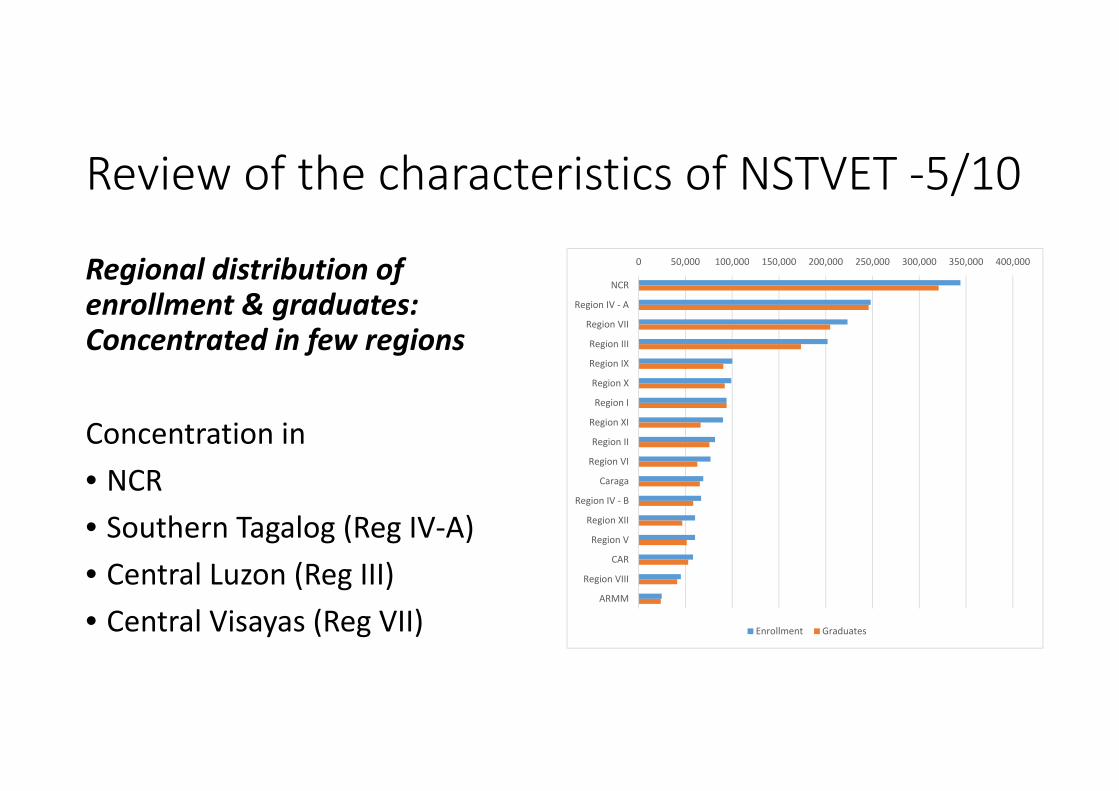
Review of the characteristics of NSTVET ‐5/10
Regional distribution of enrollment & graduates: Concentrated in few regions
Concentration in• NCR• Southern Tagalog (Reg IV‐A)• Central Luzon (Reg III)• Central Visayas (Reg VII)
0 50,000 100,000 150,000 200,000 250,000 300,000 350,000 400,000
NCR
Region IV ‐ A
Region VII
Region III
Region IX
Region X
Region I
Region XI
Region II
Region VI
Caraga
Region IV ‐ B
Region XII
Region V
CAR
Region VIII
ARMM
Enrollment Graduates

Review of the characteristics of NSTVET ‐6/10
Regional distribution of number of TVIs with registered programs: Concentrated in even fewer regions
Concentration in• NCR (1,117)• Southern Tagalog (Reg IV‐A) (417)
• Central Luzon (Reg III) (380) 0 200 400 600 800 1000 1200
CARAGA
ARMM
IV‐B
ll
IX
VIII
CAR
XII
X
XI
VI
V
VII
l
III
IV‐A
NCR
Private Public
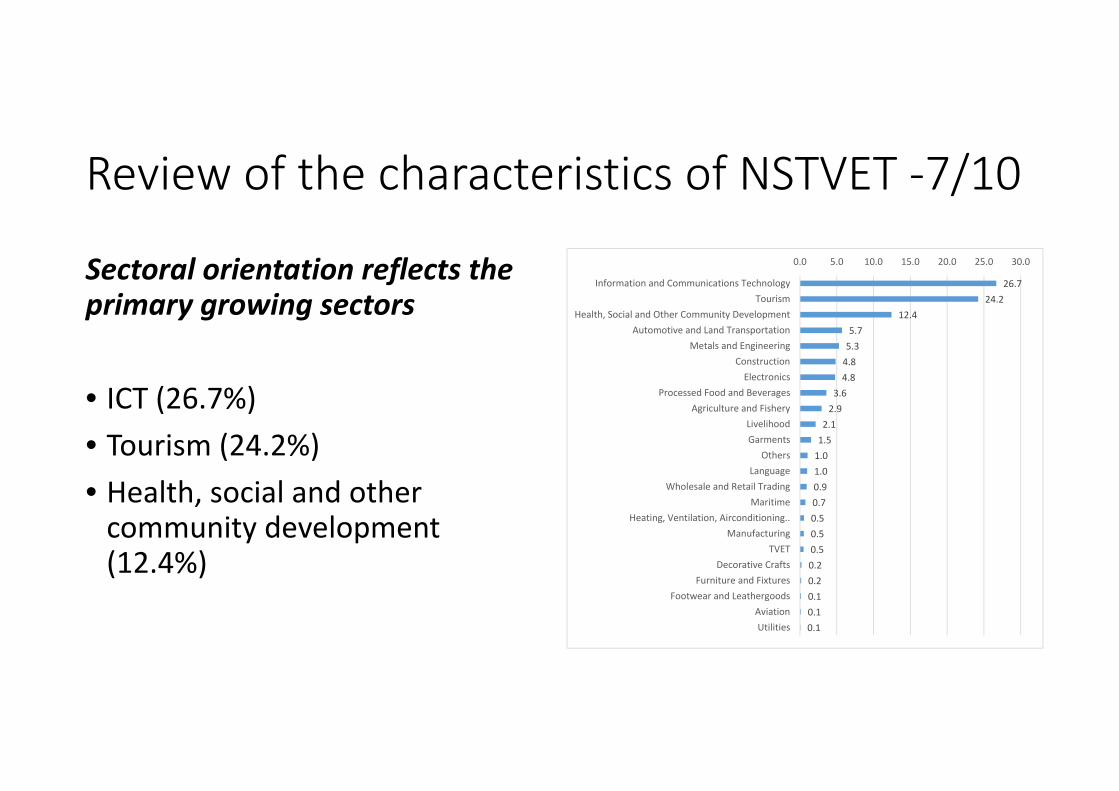
Review of the characteristics of NSTVET ‐7/10
Sectoral orientation reflects the primary growing sectors
• ICT (26.7%)• Tourism (24.2%)• Health, social and other community development (12.4%)
26.724.2
12.45.75.34.84.8
3.62.9
2.11.51.01.00.90.70.50.50.50.20.20.10.10.1
0.0 5.0 10.0 15.0 20.0 25.0 30.0
Information and Communications TechnologyTourism
Health, Social and Other Community DevelopmentAutomotive and Land Transportation
Metals and EngineeringConstructionElectronics
Processed Food and BeveragesAgriculture and Fishery
LivelihoodGarments
OthersLanguage
Wholesale and Retail TradingMaritime
Heating, Ventilation, Airconditioning..Manufacturing
TVETDecorative Crafts
Furniture and FixturesFootwear and Leathergoods
AviationUtilities

Review of the characteristics of NSTVET ‐8/10
TVI By Type Institution, Numbers Graduates by Type of TVIs, Graduates 2012
Public46710%
Private4,26690%
Other Public21%
Private68%
TTI11%
Distribution by Type: Public accounts in terms of number of institution 10%; in terms of graduates 32%
Review of the characteristics of NSTVET – 9/10
Governance and Management• TESDA
• Regulator• Provider – 120 TTIs; 21 regional training centers, 43 provincial training centers, and 56 technical vocational schools
• Regulate private sector through an established quality assurance system• Provides technical assistance to community‐based training programs
Review of the characteristics of NSTVET ‐10/10Quality Assurance system• Mandatory program registration• Promulgation of training regulations (TR)
• Convenes experts from respective industries to develop TRs• Revisited and updated every 3‐5 years• As of July 2015, 91% of the 20,329 registered TVET programs have TRs• Defines assessment competencies
• Assessment center accreditation – primary venue of assessment• Assessment done only in the presence of with TESDA personnel at all times • Trainer certification – 4 levels, regularly updated• Graduate certification – mandatory assessment; full national certification (NC) or by competency area (COC)
Assessment of Performance of the Existing System ‐1/9Estimation of Demand for TVET Services• Enrollment and Graduation reflects the distribution of TVIs• Sector concentration in growth areas such as ICT, tourism and health and social services
• Best estimate of total proportion of population/labor force who have had TVET training
• Since 2012, added the question of who had graduated from TVET• LFS April 2014: 3.2 million (4.8%) of 66.2 million working age population graduated from TVET
Assessment of Performance of the Existing System ‐2/9Access by Workers• No readily available profile data on enrollees, only graduates from IES
Access by Vulnerable groups• By age group: dominated by young age group 15‐24 (61%) and 25‐34 (23%)
Assessment of Performance of the Existing System ‐3/9
25.019.3
10.09.7
9.16.9
5.52.9
2.11.61.41.11.11.00.80.60.60.60.30.20.10.10.0
0.0 5.0 10.0 15.0 20.0 25.0 30.0
Information and Communications Techno..Tourism
Automotive and Land TransportationMetals and Engineering
ConstructionHealth, Social and Other Community De..
ElectronicsAgriculture and Fishery
Processed Food and BeveragesLivelihoodMaritimeGarments
Heating, Ventilation, Airconditioning..Language
OthersManufacturing
TVETWholesale and Retail Trading
Furniture and FixturesAviation
Footwear and LeathergoodsUtilities
Decorative Crafts
Male By Sector, 2012
29.128.3
17.95.1
4.13.02.61.91.51.21.21.01.00.70.40.40.40.20.10.0
0.0 5.0 10.0 15.0 20.0 25.0 30.0 35.0
TourismInformation and Communications Techno..Health, Social and Other Community De..
Processed Food and BeveragesElectronics
Agriculture and FisheryLivelihoodGarments
Automotive and Land TransportationWholesale and Retail Trading
OthersLanguage
Metals and EngineeringConstruction
ManufacturingDecorative Crafts
TVETFootwear and Leathergoods
MaritimeHeating, Ventilation, Airconditioning..
Female by Sector, 2012
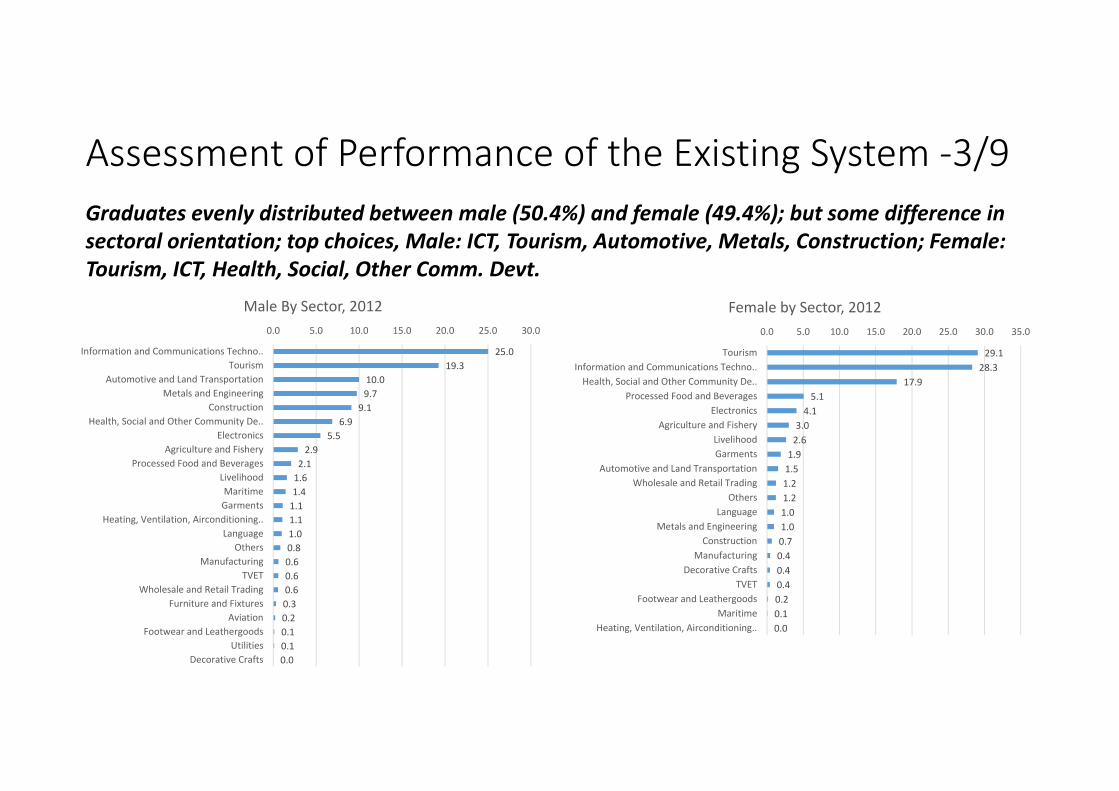
Graduates evenly distributed between male (50.4%) and female (49.4%); but some difference in sectoral orientation; top choices, Male: ICT, Tourism, Automotive, Metals, Construction; Female: Tourism, ICT, Health, Social, Other Comm. Devt.
Assessment of Performance of the Existing System ‐4/9
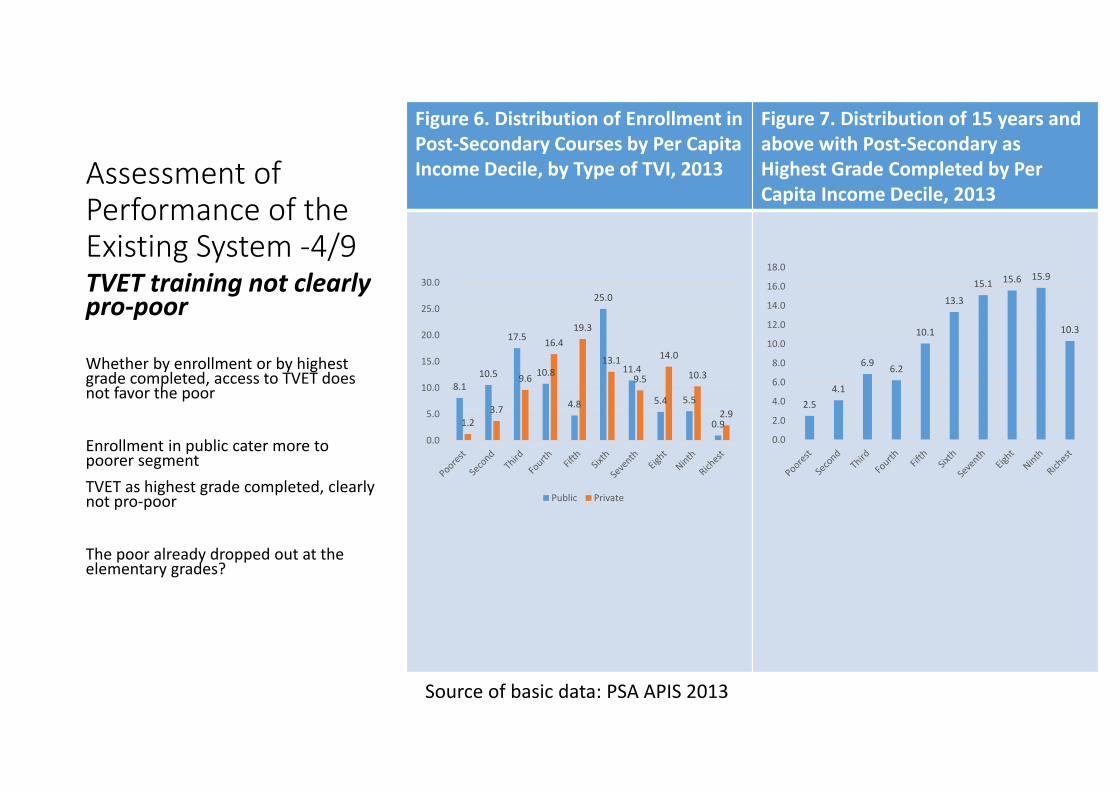
Figure 6. Distribution of Enrollment in Post‐Secondary Courses by Per Capita Income Decile, by Type of TVI, 2013
Figure 7. Distribution of 15 years and above with Post‐Secondary as Highest Grade Completed by Per Capita Income Decile, 2013
TVET training not clearly pro‐poor
Whether by enrollment or by highest grade completed, access to TVET does not favor the poor
Enrollment in public cater more to poorer segment TVET as highest grade completed, clearly not pro‐poor
The poor already dropped out at the elementary grades?
8.110.5
17.5
10.8
4.8
25.0
11.4
5.4 5.5
0.91.23.7
9.6
16.419.3
13.1
9.5
14.0
10.3
2.9
0.0
5.0
10.0
15.0
20.0
25.0
30.0
Public Private
2.54.1
6.9 6.2
10.1
13.3
15.1 15.6 15.9
10.3
0.0
2.0
4.0
6.0
8.0
10.0
12.0
14.0
16.0
18.0
Source of basic data: PSA APIS 2013
Assessment of Performance of the Existing System ‐5/9
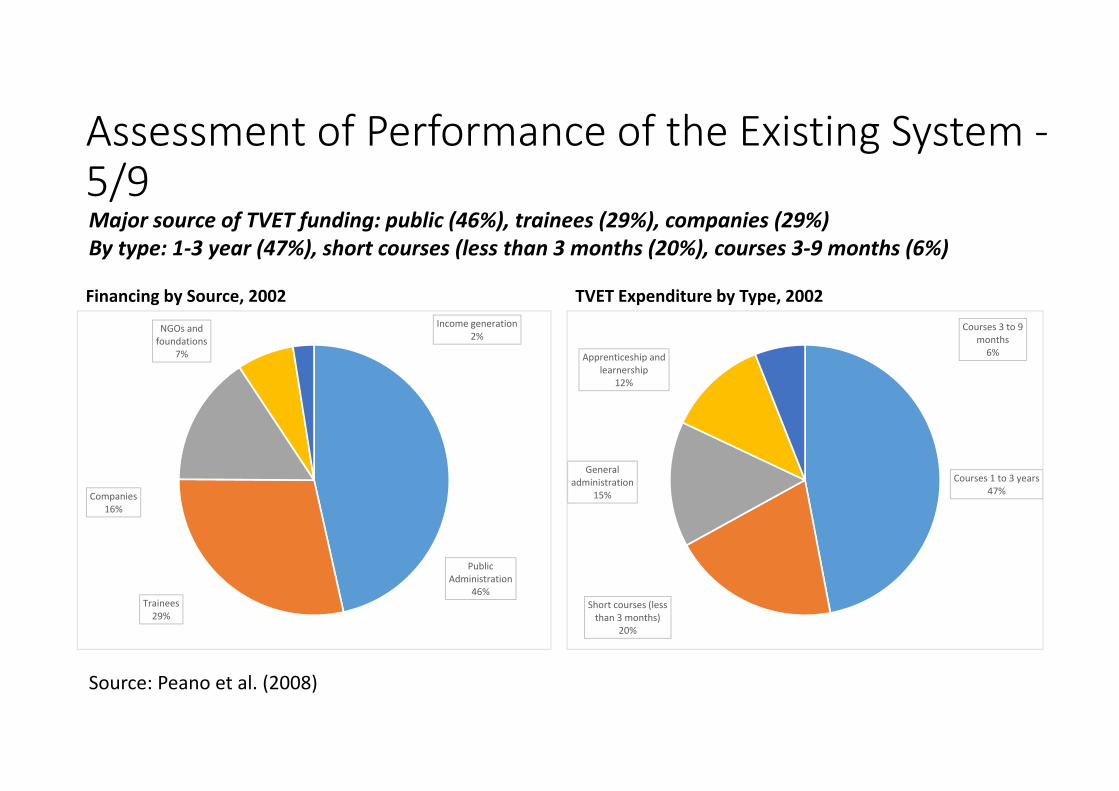
Financing by Source, 2002 TVET Expenditure by Type, 2002
Public Administration
46%Trainees29%
Companies16%
NGOs and foundations
7%
Income generation2%
Courses 1 to 3 years47%
Short courses (less than 3 months)
20%
General administration
15%
Apprenticeship and learnership
12%
Courses 3 to 9 months6%
Major source of TVET funding: public (46%), trainees (29%), companies (29%)By type: 1‐3 year (47%), short courses (less than 3 months (20%), courses 3‐9 months (6%)
Source: Peano et al. (2008)
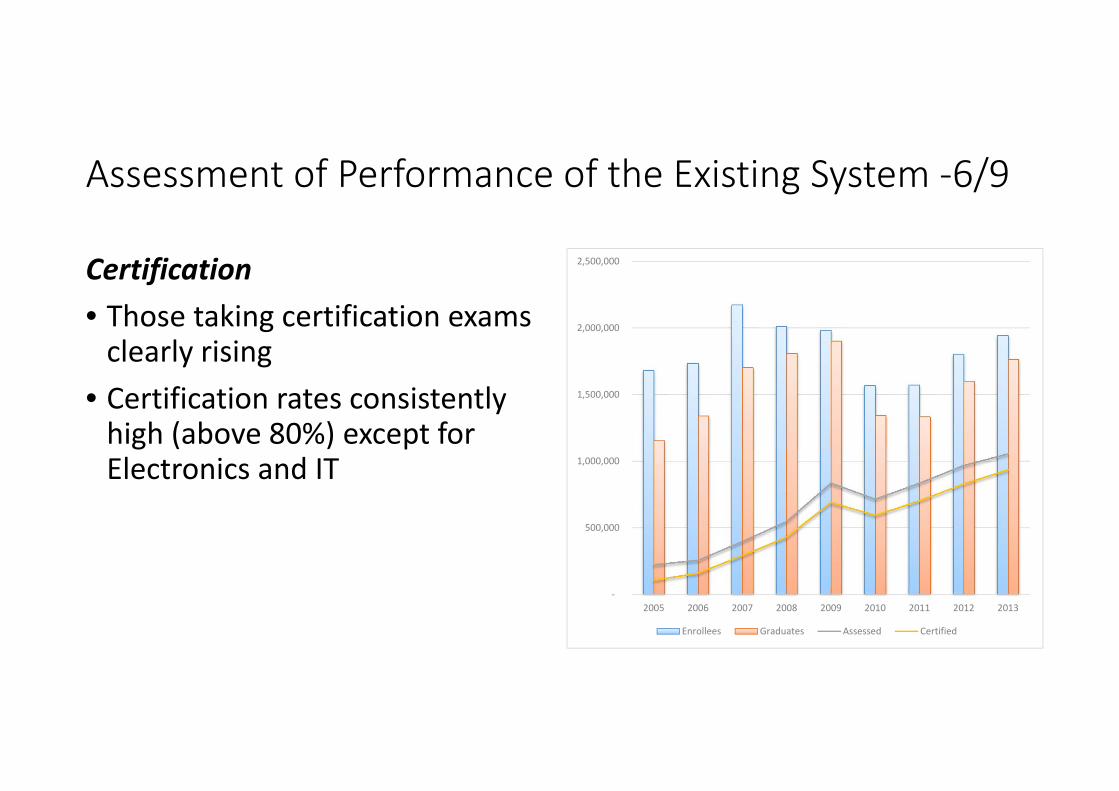
Assessment of Performance of the Existing System ‐6/9
Certification• Those taking certification exams clearly rising
• Certification rates consistently high (above 80%) except for Electronics and IT
‐
500,000
1,000,000
1,500,000
2,000,000
2,500,000
2005 2006 2007 2008 2009 2010 2011 2012 2013
Enrollees Graduates Assessed Certified
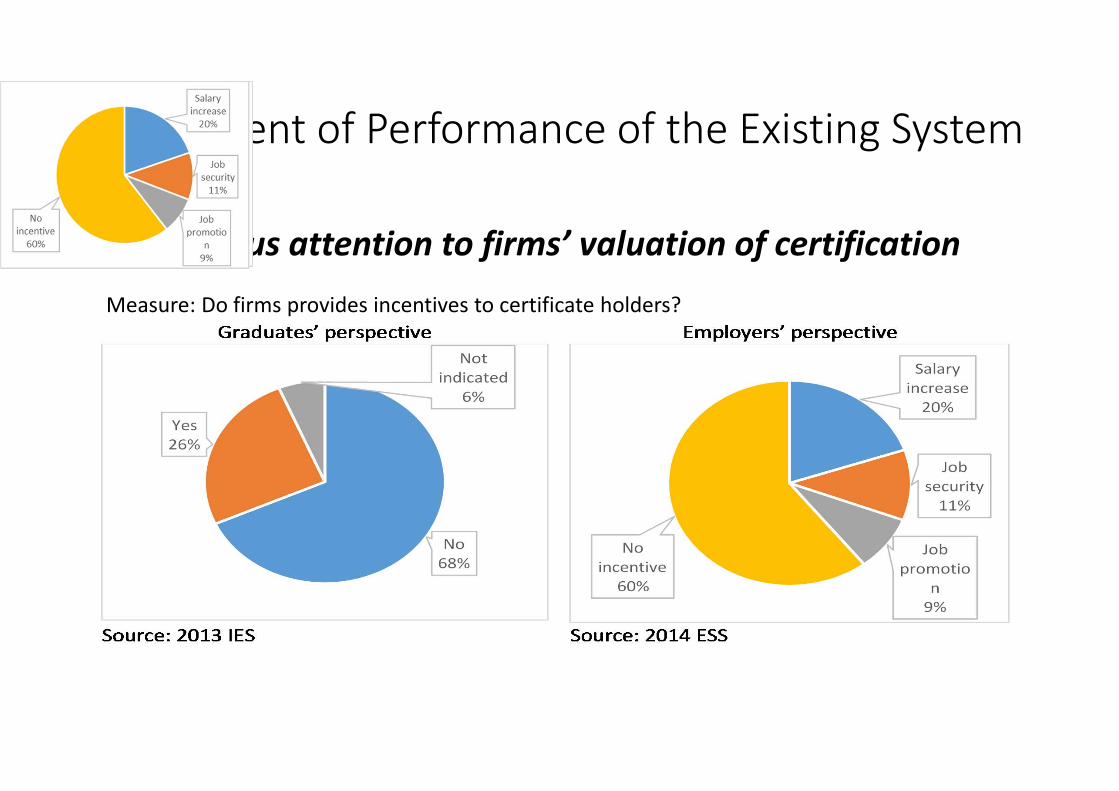
Assessment of Performance of the Existing System ‐7/9Continuous attention to firms’ valuation of certificationMeasure: Do firms provides incentives to certificate holders?
Assessment of Performance of the Existing System ‐8/9
Organizational structure and coordination across institutions• TESDA is both a regulator and a provider• TESDA Board, the highest policy making body, the primary point of coordination at the policy level
• At the operational level, development and continuous review of TRs• TESDA accredits assessment centers and assessors• TESDA doing a good service by continuously doing the IES; it is the only data the provides trainee‐level profile; should be made available to researchers to improve data quality and support more analyses
• TESDA also do regular Employers’ Satisfaction Survey (ESS)
Assessment of Performance of the Existing System ‐9/9
Links with other labor market policies• Primary link with labor market policies is the TESDA Board, particularly, the Secretary of Labor – the chair
• No clear system how labor market information are supplied • Even much less clear how whatever information is supplied been used to inform decision to review TRs, course offering of TVIs and decision of would be trainees
Proposals to Improve Philippine NSTVET ‐1/9
TESDA should focus more on regulation and information provision• Global trend: government should primarily be in regulation and information provision; leave much of training delivery to private sector
• TESDA is currently both a regulator and operator 120 training institutions
• Information generation and provision should be continuously improved and provided regularly
Proposals to Improve Philippine NSTVET ‐3/9
Greater emphasis on enterprise‐based training• Preferred mode of delivery by many analysts but the thinnest amongst the modes of delivery
• Key issue: Understanding Better Enterprise‐based Training• “If it is that good, why aren’t we doing more of it?”• What hinders it from expanding?• Incompatibilities in underlying incentives and sources of financing?• Wage‐training contract difficult to monitor, hence, also difficult to enforce?

Proposals to Improve Philippine NSTVET ‐4/9
Making training continuously relevant to industry needs• Continuous review of curriculum and training regulations• Interaction between government, TVET Institutions, firms and workers should be at all levels, not just at the national level
• Regular convening of industry councils for continuous labor market signaling
• Address skills needs of roadmaps and value chains• Enhancing TVI‐industry linkages

Proposals to Improve Philippine NSTVET ‐5/9
Ensuring Quality in Community‐Based Training• Contributing a substantial component of TVET graduates• Fear that this is mostly supply‐driven training with little regulation• It is registering respectable employment rates• It there really a problem in quality?• Are they more responsive to community needs?• Proper regulation means improvement in coverage of training registration

Proposals to Improve Philippine NSTVET ‐6/9
Greater performance orientation in access to public training funds• Learning from the experience in collaboration with industry associations such as the experience with Information Technology‐Business Process Associaton (IT‐BPAP)
• Clear performance standards• Competitive contracting• Use Public Training Fund to Achieve Strategic Development Objectives
• Use the considerable amount of training money to nudge TVET to achieve strategic development objectives? i.e. increasing more private sector training, really reduce unemployment rates of the young; increase the labor productivity of the poor
Proposals to Improve Philippine NSTVET ‐7/9
Improve targeting of financial assistance for TVET• Experience from scholarship programs show that more transparent selection criteria minimize influence peddling in the section of beneficiaries
• Proper targeting of financial assistance – GIA for the poor, loans for the non‐poor
• Proper assessment of grantees to improve satisfactory completion
Proposals to Improve Philippine NSTVET ‐8/9
Improving Data generation and Dissemination on TVIs and Trainers• As TESDA focus more on regulation, effective regulation require better information
• One of the weak points in TVET data is the characteristics of TVIs and trainers
• It seems that data is available; what might be lacking is processing into useful information and wider dissemination
• List of TVIs with registered training programs• List of trainers with certifications
Proposals to Improve Philippine NSTVET ‐9/9
Improving TESDA’s capacity for monitoring and evaluation• As TESDA shifts more into regulation and strategic financing, capacity to design better instruments, test them and analyze their impacts rigorously should be systematically built up in the institution

Thank you!