TO - DTIC · The AN/SSQ-41 sonobuoy is latnched from an aircraft at speeds between 150 and 250...
52
UNCLASSIFIED AD NUMBER AD849291 NEW LIMITATION CHANGE TO Approved for public release, distribution unlimited FROM Distribution authorized to U.S. Gov't. agencies and their contractors; Administrative/Operational Use; NOV 1968. Other requests shall be referred to Naval Oceanographic Office, Washington, DC. AUTHORITY USNOO ltr 25 Jan 1972 THIS PAGE IS UNCLASSIFIED
Transcript of TO - DTIC · The AN/SSQ-41 sonobuoy is latnched from an aircraft at speeds between 150 and 250...

UNCLASSIFIED
AD NUMBER
AD849291
NEW LIMITATION CHANGE
TOApproved for public release, distributionunlimited
FROMDistribution authorized to U.S. Gov't.agencies and their contractors;Administrative/Operational Use; NOV 1968.Other requests shall be referred to NavalOceanographic Office, Washington, DC.
AUTHORITY
USNOO ltr 25 Jan 1972
THIS PAGE IS UNCLASSIFIED

LK, TR-2,11
TECHNIC-AL REPORT
MDIFICATION, AND UTILIZATION
OF ANJSQ -41 SONOBUQYS- FQR
0 THE CQOLLECTI ON OF VOLUME
AERVERBERATION DATA FROM AIRCRAFT
- '~NOVEMBER 1968
~~ ~ ~t iab~et to Sp0oit 3. Oiz.-4~w~b£
tprres~yotiutvoI:4 <' riravroa a

FOREWORD
The widespread interest in the envircnmental and frequency dependentcharacteristics of volume reverberation resulting from marine organisms hasproduced a requirement for the rapid acquisition of volume scattering data.With the cooperation of the Naval Air Systems Command, Naval OrdtanceLaboratory, and the Oceanographic Air Surveys Unit, the Naval OceanographicOffice has modified, tested, and determined the feasibility of using sonobuoysfor collecting volume sca~terir'g data from aircraft and through this report hasproduced a guide for the urilization of sonobuoys for such measurements.
T. K. TREADWELLCaptain, U. S. NavyCommanderU. S. Naval Oceanographic Office

ACKNOWLEDGEMENTS
The authors wish to thank Mr. R. J, Urick of the Naval Ordnance
Laboratory under whose initial guidance this study was undertaken.
The authors also thank Mr. P. Rand of the Naval Ordnance LaboratoryAcoustic Facility, Mr. H. Lawry and his associates at the Vocaline Corporationof American, South Bristol, Maine, for their assist-ance in the testing andmodification of the prototype sonobuoys and LCDR E. Wilson, Commander ofASWEPS Aircraft "EL COYOTE" and his crew for their assistance in the fieldmeasurements.
v

TABLE OF CONTENTS
Page
INTRODUCTION ....... ................................ 1
AN/SSQ-41 SONOBUOY .................................. I
AN/SSQ-41 MODIFICATIONS ......................... 2
CALIBRATION AND ELECTRONIC ADJUSTMENTS ............... 6
FIELD TEST OF AN/SSQ-41 SONCBUOYS .................. 20
POST-FIELD TEST EXAMINATION OF SONOBUOYS ................ 23
TEST AND FEASIBILITY FIELD MEASUREMENTS ................... 23
CONCLUSIONS ....... ................................ 38
REFERENCES .................................. 43
FIGURES
1. Sonobuoy AN/SSQ-41 Block Diagram ................... 3
2. Audio Board Schematic ........................... 4
3. Response of Audio Amplifier ............................. 5
4. Directivity Pattern, 1.5 kHz .............................. 7
5. Directivity Pattern, 3.5 kHz ............................. 8
6. Directivity Pattern, 6 kHz ............................... 9
7. Directivity Pattern, 2 kHz, After Modification .................. 10
8. Directivity Pattern, 6 kHz, After Modification .................. 11
9a. Hydrophone Before Modification .......................... 12
9b. Hydrophone After Modification ........................... 13
10. Sonobuoy Response Curves ............................... 14
vii

FIGURES (CONTI NUED)
Page
11Io. Two Level Calibration Circuit for Sonobuoys .................. 15
11b. Calibration Board Part Layout ........................... 16
12. Calibration Pulse ....... ............................. 17
13. Instrument Block Diagram for Deviation Adjustments .............. 19
14a. Deviation Meter Output ...... ......................... 21
14b. Transmitted Calibration Pulse ........................... 21
15a. Calibration Pulse Transmitted by Good Sonobuoy ............... 22
15b. Calibration Pulse Transmitted by Damaged Sonobuoy ............. 22
16. Deviation kHz Vs. Voltage ...... ........................ 24
17. Temperature Vs. Deviation kHz and Battery Voltage .............. 25
18. Calibration Board Tests ...... .......................... 26
19. Location of Sonobuoy Stations ...... ...................... 27
20. Logarithmic Record of Volume Reverberation Vs. Time ............ 29
21. Scattering Strength/Octave Analysis Vs. One-Third Octave Analysis 31
22. Scattering Strength, Site No. 1 .......................... 33
23. ScatteringStrength, Site No. I..................... 34
24. Scattering Strength, Site No. 1 .......................... 35
25. Scattering Strength, Site No. 2 ......................... 36
26. Scattering Strength, Site No. 2 .......................... 37
27. Scattering Strength, Site No. 2 ......................... 9
viii

FIGURES (CONTiNUED)
Page
28. Scattering Strength, Site No. 2 .. .. .. .. ... . .. . ... ... 40I29. Scattering strength, Site No. 2. .. .. .. .... . . . . .. .. .. 41
30. Scattering Strength, Site No. 2 .. .. .. .. .. .. . .. . ... ... 42
* ix

INTRODUCTION
Many experiments have been conducted to investigate the acousticcharacteristics of biological scatterer. located primarily in the deep scatteringlayers (DSL). These studies indicate that the dominant cause of volume rever-beration from deep scattering layers results from resonant scattering frombathypelagic fishes possessing swimbladders. Present day advances in sonartechnology have increased requirements for investigating the diurnal, seasonaland geographic variations of the volume scattering produced by the presence ofthe scattering layer.
Aircraft techniques using sonobuoys and underwater sound signals areideally suited for the investigation and rapid acquisition of volume scatteringdata over large geographic regions. Earlier experimentation by Urick et al(1965) has demonstrated that acoustic data such as bottom reflectivity can becollected from aircraft using sonobuoys. Consequently, in the fall of 1966,an experimental research program was jointly undertaken by the Naval Oceano-graphic Office and the Naval Ordnance Laboratory to further develop airborneacoustic data collection techniques; particularly for collecting volume scatteringinformation.
This report discusses the modifications, tests, calibration, and use ofstandard AN/SSQ-41 sonobuoys for the collection of volume reverberation datafrom aircraft. The results of the test and feasibility measurements using theprototype sonobuoys are also presented.
I. AN/SSQ-41 SONOBUOY
The AN/SSQ-41 sonobuoy is latnched from an aircraft at speeds between150 and 250 knots, and at altitudes between 500 and 10,000 feet. On contactwith the water the sonobuoy deploys a shaded line hydroplione array and a pre-amplifier to a predetermined depth of 60 or 300 feet. The electronics system iscapable of transmitting data as soon as a 10-volt sea water battery is activated.
Each hvrlomhon,* ;n the deployed army is om nidiractlonial . The .. rhydrophone elements are spaced and connected in a series parallel configurutionto give a desired sensitivity and directionality.
The preamplifier is a single stage amplifier utilizing a field effect transis-tor to maintain low noise levels ard for improving the low frequency response ofthe sonobuoy. This preamplifier has a constant gain of 14.2 dB, a flat frequencyresponse between 0.02 kHz and 40 kHz, and a recovery time of approximately60 milliseconds for high input levels. A limiter circuit in the preamplifier is usedto protect the circuitry by clipping input signals above -14 dBv re 1 volt rms (dBv).

Additional amplification is obtained from an audio or sonic amplifierwhich consists of four stages. The gain of the audio stages can be adjusted andcontrolled by a variable potentiometer. This audio stage also contains an auto-matic gain control circuit (AGC).
The FM transmitter cperates at carrier frequencies between 162 and 174megacycles. The basic electronic components within the transmitter consistof a reactance modulator, crystal controlled oscillator, frequency quadrupler,a driver and final stage amplifier.
Each sonobuoy has a particular carrier frequency for transmitting to astandard receiver (ARR/52) onboard a monitoring aircraft. The sonobuoy receiversare capable of receiving and demodulatin& each frequency transmitted whichenables monitoring of one or more sonobuoys simultaneously. Figure 1 shows ablock diagram of the basic AN/SSQ-41 sonobuoy electronic system.
11. AN,/SSQ-47, MODIFICATIONS
Several tests, adjustments, and modifications were made in order to makethe AN/SSQ-41 sonobuoy suitable for volume reverberation measurements. Thesemodifications involve frequency response, hydrophone directivity, AGC and gaincontrols, and the limiter circuitry in the audio amplifier stage. In addition, acalibration circuit was designed and added to the electronic system of the sonobuoy.
The first step in the adjustment and modification of the existing sonobuoycircuitry is to disconnect the AGC circuit. By disabling this circuit the sonobuoyamplifier gain is maintained at a constant level for any signal intensity. Thisenables analysis and interpretation of reverberation levels without consideringvariance in system gain. The circuit is disconnected at point A on the audioboard shown in Figure 2.
Since volume reverberation is frequency dependent, an attempt was madeto improve and extend the usable frequency response of the sonobuoy withoutmajor redesign or modification of any sonobuoy components. In order t determinewhether it is possible to improve the frequency response of the sonobuoy at highfrequencies three shunt capacitors in the audio amplifier (C208, C213, C216 inFigure 2) were removed. However, removal of these capacitors enhanced ahydrophorne resonance occuring between 3.5 and 4.0 kHz. Since this resonanceis undesirable at higher frequencies it was necessary to replace the cuJpacitorsand operate within the original response of the sonobuoy. The frequency responsecurves obtained for the audio amplifier with the AGC disconnected and withsuccessive shunt capacitors removed are shown in Figure 3.
2

a U
P jU
LU U.,
< - <
<I I Z w
ii

ItI
LI u
Ue
S<
00
00
4<

+50 K
.140
LEGENDRESPONSE OF AUDIO AMPLIFIER
- CAPACITORS 208,213,216 REMOVED-CAPACITORS 208,213 REMOVED
/ CAPACITOR 208 REMOVEDSAGC REMOVED
+3 INPUT TO AUDIO STAGE -60OdB re IVOLT
30
.1 i 10FREQUENCY (kHz)
FIGURE 3. RESPONSE OF AUDIO AMPLIFIER
5
II

Conventional shipborne techniques for the collection of reverberationdata have utilized omnidirectional sound sources and receivers. To make thesonobuoy receiver system comparable to shipborne s/stems the sonobuoy'sshaded line hydrophone array, which has a preferential directional pattern atdifferent frequencies (Figures 4 to 6), was modified to produce an omnidirectionalhydrophone receiver pattern. Omnidirec4ionality was obtained by clumpingtogether and binding the sonobuoy's four individual omnidirectional hydrophonesand preamplifier securely within a plastic mesh. This teci.nique produced thedesired directivity pattern when tested. Also, one of a series of tests conductedat the U.S. Navy Sonobuoy Test Range at South Bristol, Maine, indicated thatthe hydrophones remained securely bound within the mesh and did not generateadditional noise from rubbing or vibration during deployment. Figures 7 and 8
indicate the directi :ty pattern at frequencies of 2 kHz and 6 kHz after modifica-tion. Figures 9a atad 9b show the hydrophone array before and after modification.
The frequency response of a typical sonobuoy with the AGC circuitdisabled and with the modified hydrophone array was obtained relative to acalibration frequency of 2.35 kHz and is illustrated in Figure 10. This curveindicates the total sensitivity of the sonobuoy hydrophone, preamplifier, andaudio stages. A relative curve was determined since the gain of each sonobuoyis changed during calibration (See Section Iii).
The transmitter portion of the sonobuoy does not require any adjustmentor modification. In order to produce a calibrated pulse that is used to checksystem linearity as well as to determine absolute reverberation levels transmittedby the sonobuoy, a circuit was designed and inserted into the sonobuoy ekctronicpackage. The circuit utilizes a multi-vibrator that gates a phase shift oscillator,und is designed to produce a two-level step, where the lower level is 20 dB belowthe maximum level. Each level is transmitted for approximately 100 millisecondsand the repetition rate of the step pulse is nominally 15 seconds. At each level,the phase shift oscillator has a frequency output of nominally 2.35 kHz. Anyvariations in calibration pulse parameters that occur are due to electronic com-ponent tolerance. A schematic and photograph of the circuit are shown inFigures I la and lb. Figure 12 is an example of the calibrat*on pulse.
After the calibration circ,,it is inserted into the sonobuoy electronics,the maximum level is adjusted to represent +25 dB re 1 dyne/cm2 of acousticpressure (dBa). The low level step then represents an acoustic pressure 20 dBbelow this maximum.
Ill. CALIBRATION AND ELECTRONIC ADJUSTMENTS
Underwater sound signals detected by the modified hydrophone passthrough an audio stage that is capable of frequency-modulating a VHF carrier
6

1800
FIGURE 4. DIRECTIVITY PATTERN, 1 .5 kHz, X-Y PLANE
7

* 27OW
1800
FIGURE 5. DIRECTIVITY PATTERN, 3.5 kHz, X-Y PLANE
8

1800
FIGURE 6. DIRECTIVITY PATTERN, 6 kHz, X-Y PLANE
9

00
10

270O9(
10

1 2
FIGURE 9o. HYDROPHONE BEFORE MODIFICATION.
12

PERSONNEL ON&h
D --
FIGURE 9b. HYDROPHONE AFTER MODIFICATION.
13

+10
> -20
LU.
TOTA RESONS OFRSEAMPO
0
-20
4)
401~-50
HYDUROPH. ON a PREMPLIFIECRVE
14

0000
00
o tj,
0H~jj0
C'J c 0) LL.
e4 1.-
It, 0 0
0II
LUI>J
0
R, Zo
(0 -j
C3 z
co0 0
ix6f
15

I ee
LI
0L
16J

CL
z0
LU
w
17

that is transmitted to an aircraft receiver and demodulatcr. The amount offrequency modulation, expressed in terms of kHz deviation, depends upon thelevel of the acoustic pressure incident on the hydrophone. The frequencydeviation available, for any input to the audio stage, is controlled by alimiter circuit consisting primarily of a potentiometer and two diodes. Thiscircuit functions as a protective network that prevents damage to the reactancemodulator in the VHF transmitter.
From previous reverberation data it is e.x.pe=cted that a maximum acousticpressure of +25 dBa and a minimum of -5 dBa are nominal levels to be recorded.This necessitates having an electronic system with at least a 30 dB dynamicrange, which is well with;n the 50 dB dynamic range of the sonobuoy. Utilizingthe nominal maximum level to be recorded, circuit adjustments were made so thatan acoustic pressure level of +25 dBa at a calibration frequency of 2.35 kHzwould produce a 75 kHz deviation at the output of the VHF transmitter. Theseadjustments are made while simulating a +25 dBa level at the 4nput of the audioamplifier and monitoring the output of the transmitter with a deviation meterto insure that the proper frequency deviation is obtained. Figure 13 shows theinstrument block diagram for adjusting to the proper deviation.
To calibrate the sonobuoy an equivalent acoustic pressure of +25 dBa issimulated and fed into the audio amplifier by using the output of a microvolterand feeding it to a dummy hydrophone-preamplifier package at the frequency ofthe calibration circuit phase shift oscillator. From the sensitivity and voltageoutput of the hydrophone, the level of the acoustic pressure is determined; orif the acoustic pressure is known, the voltage generated at the hydrophone pre-amplifier output can be obtained. For example, if the sensitivity of the hydro-phone preamplifier package at 2.35 kHz is -66 dBv/b/yd and the acousticpressure is +25 dBa, the input to the audio amplifier should be -41 dBv. Themicrovolter can then be adjusted to produce the correct voltage level for theaudio amplifier.
Once the input of the audio amplifier is determined the audio gain adjustpotentiometer (R205) and a limiter potentiometer (R227) are adjusted to producea 75 kHz deviation (see Schematic Figure ?) with the actual hydrophone andpreamplifier in the circuit to maintain proper electronic loading. It was deter-mined that neither the dummy hydrophone nor the actual hydrophone varied thecircuit loading. Since a limiter circuit protects the reactance modulator in thetransmitter stage, these adjustments must be performed carefully to insure that nodamage to the modulator occurs. It was found that a 75 kHz deviation does notdamage the reactance modulator in any way and observation of the signal waveform on an oscilloscope indicates no distortion occurs. Once the 75 kHzdeviation is obtained, the variable potentiometers are fixed and locked in position.
18

< zzz ZzO-
UjJLLJ
IpuJ
z0
0
z
LUIzC4,
5E: -
19

After the audio stage is adjusted for the proper deviation (+25 dBa at2.35 kHz equivalent to a 75 kHz deviation), the calibration circuit is activatedand fed into the input of the audio stage. Since the maximum calibration levelis equivalent to +25 dBa, a deviation of 75 kHz should be displayed on thedeviation meter or the level adjust potentiometer on the calibration board isadjusted until 75 kHz deviation is observed. The potentiometer is then lockedand fixed in position.
The maximum deviation and acoustic level each sonobuoy can transmitat the calibration frequency, without distortion to 'he signal, was also deter-mined. This distortion level was obtained by varyirg the output of the micro-volter unili visible distortion of the signal occur-.d on an oscilloscope monitoringthe audio amplifier output. This level is the maximum level that can be recordedand transmitted undistorted by the sonobuoy electronics.
The output of the frequency deviation meter indicates the character ofthe pulse received by a sonobuoy receiver. Figure 14a and 14b show a compari-son of the deviation meter output wi~h the z-onobuoy receiver output for trans-mission of the same calibration pulse. After correcting for different instrumentgains, the deviation parameter of the calibration pulse varied by 0.7 dB. Tinisis a check on the effect of the transmissior link on a calibration pulse.
IV. FIELD TEST OF AN/SSQ-41 SONOI3UOYS
A test drop of the prototype sorv-buoys was made from an aircraft at theSonobuoy Test Range. This test was made to determine the transmission charac-tersitics of each sonobuoy, deployment of the hydrophone package, impact testfor electronic components, and centrifugal effects (due to sonobuoy rotation)cn components after the sonobuoy is launched and descending to the water. Thequality and efficiency of the hydrophone deployment was judged from thecharacteristics of the ambient noise signal displayed on an oscilloscope, andwas determined to be of good quality. Each activated sonobuoy transmitted acalibration pulse at approximately 15 second intervals. The quality of thecalibration pulse also determined if impact or centrifugal forces had brokenor pulled apart any components in the sonobuoy.
Photographs were taken of several calibration pulses transmitted. Figure15a indicates the quality of a good calibration pulse. Figure 15b is an exampleof a calibration pulse that may be produced by a damaged sonobuoy.
Since the calibration pulse passes through the same electronics as adetected signal, it is expected that variations experienced in deviation by thecalibration signal would also be reflected in the recorded reverberation data.
20

FIGURE 14a. DEVIATION METER OUTPUT.
r-lmuumnm
o mmunmnnm i**E E
FIGURE 14b. TRANSMITTED CALIBRATION PULSE.
21

FIGURE 15c. CALIBRATION PULSE TRANSMITTEDBY GOOD SONOBUQY
FIGURE 15b. CALIBRATION PULSE TRANSMITTEDBY DAMAGED SONOBUQY
22
V. POST-FIELD TEST EXAMINATION OF SONOBUOYS
The sonobuoys were recovered at the test range and checked for damageand reliability of the electronic adjustments (discussed in Section Iil). Thetechniques used for the checkout procedure were the same as those used forinitially setting up the sonobuoys. Bench tests indicated variation within :0.5 dBof the original adjustments.
To determine the effect of fluctuating battery supply voltage on theelectronic system, a power supply was substituted for the sea water activatedbattery. The power supply was varied between 6 and 12 volts and the associatedfrequency deviation measured. As long as the battery voltage is 10 volts orgreater, the deviation will vary by a maximum of +0.25 dB. Figure 16 showsa curve of deviation versus voltage.
A temperature test was made on a representative sonobuoy battery (seawater activated) to determine if temperature variations effect its output. Figure17 graphically illustrates voltage and frequency deviation as a function oftemperature. The temperatures used were the minimum and maximum valuesexpected during the actual field measurements.
Temperature tests were also performed on the sonobuoy components. Atemperature range from 25*F to 120*F was applied to the audio stage. The gainand response varied by a maximum of 0.5 dB. A similar range of temperaturewas applied to the calibration circuit to determine if the calibration frequencyand level would change. Figure 18 summarizes the results of the data.
VI. TEST AND FEASIBILITY FIELD MEASUREMENTS
Two sites were slected in the western North Atlantic for the test andevaluation of the modified sonobuoys. In February 1967, two modified sonobuoyswere dropped at 250 28.5'N and 720 23'W (site 1). Later, in April, two additionalsonobuoys were dropped at 310 30'N and 750 30'W (site 2). Figure 19 shows thelocation of the test sites.
A. Da-C r22ito:: i2ra;:znde~ 0'k~ and4.0k~ AlThe AN/SSQ-41 sonobuoy is capable of detecting and transmitting
reverberation levels in the frequency band between 0.8 kHz and 4.0 kHz. All
reverberation levels were detected by the sonobuoy hydrophone set for a depth of60 or 300 feet. The underwater sound signals utilized to produce the scatteringenergy were Mk 61 Mod 0 or Mk 51 Mod 0, containing 1.8 poundsof TNT and a
0.07 pound tetryl booster, detonated at 50, 60, 350, or 800 feet.
23

85
75
N
2065
* w
55
45 I I6 7 8 9 10 Ii 12 13
POWER SUPPLY VOLTS
FIGURE 16. DEVIATION kHz VS. VOLTAGE
24

2 SJ.1OA
0
LA. N
w Z
0
w <
iAJ >
(0 >LI
0 C0O( 0
(ZH)I NOI.VIA3
25j

(ZHN) kON3nlO38.
N ~ ~ - - -
00 0 00
SV4 .L1OA I OI SP 13A3-10
-JI IL.N>Cj
o.,mwx 0
Y- J cr (
w0a.o
w cn 0
2 ~ ~ ~ U O' Z ~.C n~,
260

8 5 ° 8 0 ° 7 5 " 7 0 ° 5 040 T 40*
350 1 350
0 APRIL 1967
300 300
ATLANTIC OCEAN
2 FEB. 1967
zoo d - 200
15I I 15"
850 800 ?50 700 650
FIGURE 19. LOCATION OF SONOBUOY STATIONS
27

Volume reverberation data was simultaneously recorded on magnetictape and displayed on a logarithmic Sanborn Recorder in the field. A typicalrecord is shown in Figure 20 and events ma,'ked. The Sanborn record enablescursory examination of the data to insure that the results approximate a -30 log tdecay curve predicted from theoretical considerations (Machlup, 1951; Marshalland Chapman, 1964). This decay is characteristic of scattering for a scatteringlayer at depth.
The magnetic tape data were analyzed in the !aboratory using one-octave and one-third octave bandwidths. These data were displayed on aSanborn Recorder producing a logarithmic reverberation level ys time curvefrom which scattering strength is computed. Absolute reverberation levels weredetermined from the calibration signal transmitted by the sonobuoy. Since thiscalibration step is for a single frequency (nominally 2.35 kHz), a correctionfactor is applied to the data for the sonobuoy response.
An overlay was applied to the reverberation level vs time curvefor each analyzed band to determine if the data points lie on a -30 log t curve.Reverberation levels were determined at 0.5 second intervals after t = 0.5second and were read until the signal-to-noise ratio was 3 dB. At signal -to-noise ratios of 10 dB or less, an appropriate correction factor is applied. Beforet = 0.5 seconds the acoustic signals are clipped, since the levels exceed themaximum level that can be received by the sonobuoy (nominally 25 dB re 1 dyne/cm2 at 1 yard). Bubble pulse and sea surface reverberation normally predominateat less than 0.5 second and data points before this time would not be used todetermine a volume scattering strength.
The volume scattering strength equation has been derived by manyinvestigators (Machlup, 1951; Urick, 1962; Chapman, 1964; Gold, 1966). Theequation derived by Chapman (1964) was used to determine scattering strengthsfor the test reverberation data and is based on the following assumptions:
1. Isotropic sound source,
2. Isotropic scattering,
3. Source and receiver at same depth and same point,
4. Inverse square spreading law, and
5. Absorption is neglected.
28

z
0
I: Ii
LU
zz
0
0LLA
ILI-
0
-TE-0
UU-
4Ai E .:Z1
29

In its final form the equation is:
(1) 10 OglO f z M(z)dz = 20 loglo P(t) + 30 oglo t - 10 oglo E - 48.
091 0 fz M(z)dz = Scattering Strength (dB),
20 loglo P (t) = Reverberation Level (dB) in the frequency band of analysis,
t = time (seconds),
10 loglo E = Energy per unit area measured at 100 yards from the sound sourcein the frequency band of analysis (ergs per square centimenter), and
48 = Constant containing correction for four paths of reverberation reachinghydrophone.
If the receiver and hydrophone are not at the same point, the 30 loglo (t)term in equation (1) should be expressed as 30 loglo (t + te) where te is the time itwould take the direct signal to be incident on the hydrophone. Since detonationtime cannot be measured accurately from an aircraft this may introduce some errorin the computation of scattering strengths.
Scattering strengths were determined using equation (1) for one-octave and one-third octave analyses. Since scattering strength is frequencydependent a wide band analysis may introduce errors of several dB in its computa-tion as well as masking the frequency dependence of the scattering strength.Figure 21 compares the scattering strengths for several shots using the two anulysisbandwidths. The scattering strength was found to vary between four and ten dBfor the shots analyzed. To avoid any frequency smoothing resulting from a one-octave analysis a one-third octave analysis was used on all subsequent data.B'andwidth smoothing was also noted by Lamperez (1967).
It should be noted that geometry is a factor that is not readily controlledrrom an airefuKI . M aualle-c go !aal W -,. .,. ayed*
indicate time after the direct signal is incident on the hydi,phone. To convert therecord time to actual time, detonation time would have to be known accurately.This variability of time due to geomplry could result in errors of approximately twoto three dB in scattering strength.
At Site I, two sonobuoys were released with hydrophone deploymentsset for 60 feet. The sonobuoys were approximately 100 feet apart and drift duringthe course of the tests produced a maximum separation of 200 feet over a period
30

w~i
LU
00
V;
C.))
wLi-
-
C,))
040
010 000
(0 CL
(2P) HISNIS ON183iiVOS
31

of approximately three hours. Charges set for detonation depths of 60, 350 ind800 feet were released from several altitudes to vary the sonobuoy-chargegeometry. By varying the aircraft altitude charges were dropped 50, 250, and500 feet from the sonobuoy to study the effect of geometry cn recorded reverbera-tion levels. Since two sonobuoys were recording information from the same shotsa check on the consistency of the recorded data was obtained.
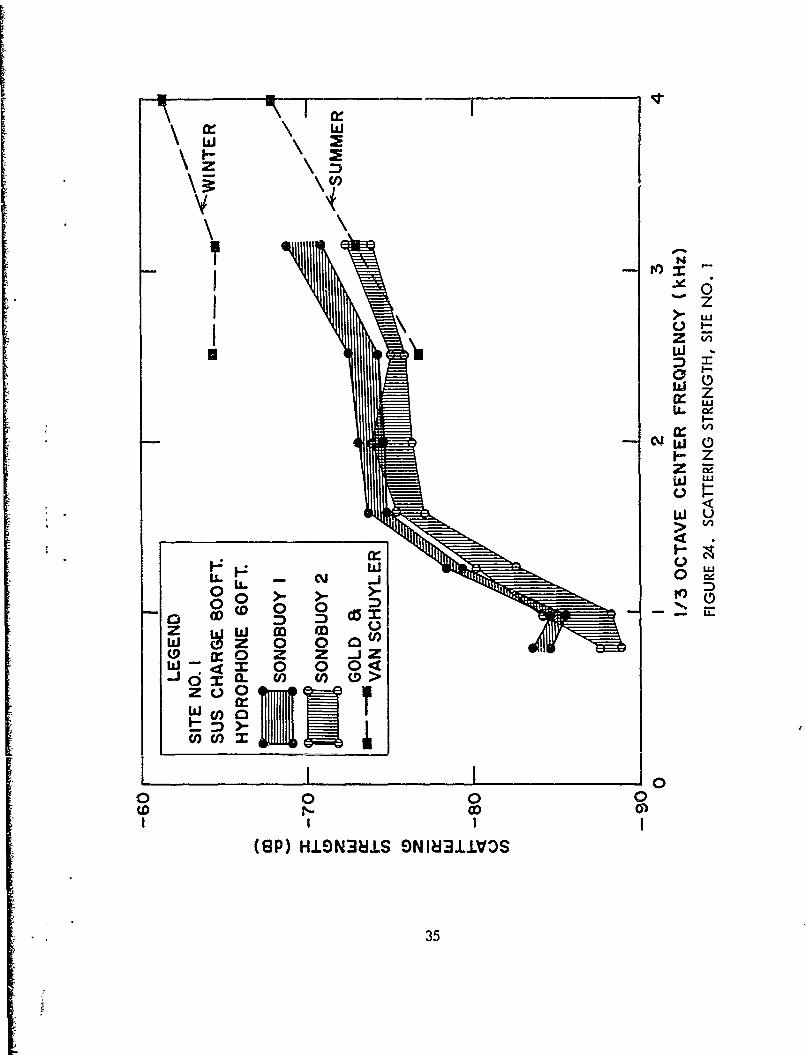
The analyzed data are presented as envelopes since the geometriesfor the noted shots were varied and the measurements at each particular detona-tion depth were made in approximately 40 to 60 minute intervals. It should benoted that the sonobuoys recorded fairly consistent data and that the scatteringstrength increases with frequency with a knee or peak present between 1 .0 and2.0 kHz. Figures 22 to 24 graphically illustrate scattering strength v s frequencyin one-third octave bands.
Figures 22 to 24 also show scattering strengths for winter and summermonths obtained by conventional shipborne systems (Gold, 1965; Gold and VanSchuyler, 1966). The winter measurements are 6 to 12 dB higher than summermeasurements and increase with increasing frequency. The present sonobuoymeasurements generally increase with increasing frequency and fall approximatelyat the lower limit delineating the ship measurements.
At Site 2, two sonobuoys were released, one deploying a hydrophoneto 60 feet and the other to 300 feet. After the sonobuoys were activated chargesset for detonation depths of 50, 60, 350, and 800 feet were released and droppedwithin 100 feet of the sonobuoys. Ambient noise was recorded and ship observa-tions in the test area indicated Sea State 3 conditions existed.
Sea state conditions are an important factor in the measurement ofvolume reverberation. At high sea states surface reverberation is increased andwill predominate while volume reverberation is masked. This is especially truefor deep charges and hydrophones. At Site 2, Figure 25, the analyzed dataindicate the effects of surface reverberation. Figure 25 shows scatteringstrength vs frequency for a shallow charge and hydrophone, a geometry whichproduces c rapid decay of surface reverberation, and a deep charge and hydro-
A comparison of a 350 Foot charge and a 60 foot hydrophone, witha 60 foot charge and 300 foot hydrophone, indicated interchangeability ofsource and receiver to produce similar reverberation levels. Figure 26 showsthat scattering strengths computed for each geometry are very similar with theexception of one point at a frequency at 3.15 kHz.
32

w l
"z
C I -
S0
Iw Lncw z
104
a: LU
0 0
(DL 0 U
o 0 Z 0 0)C tw D - :0 -
W < 0: 00o<z 0w 0
D -
00 0 0OD m
(SP) HIO~N38LLS ONIU311.VOS
33

w \ w
wZ
00
I- m 0
(6P)~~~~~ Z.IN~L N3LL3
34c
VV
0
I zI>LL
I--
I.zzEW V
C-1
0z~ 0 00
-J 0 ~. CL ) U) (D >
W E I I
00 0 0CD 0~
(SP) HL9NM8iS ONIN3J..VOS
35

LU
zLaJ
LL.Z0 8
z CuLL z
0100 u
0 I)(8P H.OaiL co ~i~
-j 0 C36

Z'LzJ
WZ%
w z
U
0 00
0 Z
00 0 0 0
(L2P) a.LN iIS£N±J.S
0 jr 0It U- 0 37

Figures 27 to 30 graphically display scattering strength vs frequencyfor several other shots. Variability was due to changing weather conditions andsea state during the test period. These chant. . may produce variations inscattering mechanisms and cause migrations or fluctuations of the scatteringsources. As at Site 1, scattering strength generally increases with increasingfrequency with a knee or peak present betwsen 1 .0 and 2.0 kHz.
VII. CONCLUSIONS
AN/SSQ-41 Sonobuoys were modified, calibrated and field tested forutilization in volume reverberation measurements. The frequency response ofthe modified sonobuoy is 0.8 to 4.0 kHz. Removal of an AGC circuit preventedgain fluctuation within the audio stages. A two-level calibration pulse wasdeveloped and is used for determining absolute reverberation levels and forchecking the linearity of the recording and transmitting system.
Modified sonobuoys were used to collect data at two sites in the westernNorth Atlantic. A one-third octave analysis was performed on the data toprevent bandwidth smoothing that may mask the dependence of scattering strengthwith frequency. Scattering strengths were found to increase with frequency witha knee or peak present between 1 .0 and 2.0 kHz.
The test and feasibility studies have indicated that modified sonobuoyscan be used to collect volume reverberation data.
38

z
W -C,)
(0 0D
1L: UI Z-I-
w a.9
z cOH.9N± 0NI{.iV3
C) cr39

=0
w
I-
0 0 w Z
w .wI
zLW 0 U. 0
w w Wa W
00
0 0 0l 00
(SP) HIZLSN381S ON18311.VOS
40

F:L0 0
c'JJO -JY. Z
a. a. LU
000
00 0
00 w~ w o
(8P)Z (j)N&L aNiUI±iV
41-

C'4z
LL;
zJ
L-
. 0L1- LL.
0 0
EL U WL~
wi (.90 CD 0f(
QWW ix crJIWL
a.a LC
w ww0
(SP w.IN8L EwW3L.V
z 0 cl42

REFERENCES
Gold, B. A., Measurements of Volume Scattering from a Deep Scattering Layer,J. Acoust. Soc. Am. AQ, 688-696 (1966).
Gold, B.A., Van Schuyler, P., Time Variability of 'Volume Scattering in aSmall Oceanic Area, J, Acoust. Soc. Am. 40, 1317-1321 (1966).
Handbook Operating Instructions for Sonobuoy 4.1,4/SSQ-41, NAVWEPS 16-3055Q41 -8,NAVWEPS 16-3055Q41 -9.
Lamperez, J., A Survey of Biological Scattering Measurements in the Western NorthAtlantic, USNADC Ref. AEST, 5 June 1967.
Machiup, S., Interpretation of Echos from Stratified Scatterers, Woods Hole O2ceano.Inst. Ref. 51-66 (1951).
Marshall, J. R., Chapman, R. P., Reverberat-ion fromn a Deep Scattering LayerMeasured with Explosive Sound Sources, J. Accus~ical Soc. Am. 36,;64-1-57 (1964).
Urick, R. J., Genejalized Form of the Sonar Equations, J. Acoust. Soc. Am.34547-550 (1962).
Urick, P. J., Kelly, C. E., Stripling, M. H., A Method of Airborne BottomReflectivity Surveying, NOLTR 65-99, 8 June 1965.
43

UNCLASSIFIEDS... tt.rit - Ia t fic at ion
DOCUMENT CONTROL DATA. R & DSg .,.Uy , la, ,If, aftr.4 A ill., 1,,d 1,I ,f h 1,,1.0I a... . .. .. .c' -tu, o be i, .. .1-1, the t tl report et, ,h
C. ,tIGINA TING AC I VI .1 111' ) 2a. Re PO$T S( C 'kl I Y C L A -. 1 I' AT ION
U. S. NAVAL OCEANOGRAPHIC OFFICE.UNCLASSIFIED
REPORT 1YlTF
MODIFICATION AND UTILIZATION OF AN/SSQ-41 SC NCW2$YS FOR THE COLLECTIONOF VOLUME REVERBERATION DATA FROM AIRCRAFT
4 OF.-,CRIPIPTl NOTES (Type "! rCp,-rt tl en I i're.h l )
Technical ReportI AU THOR 5; lFirl name, nrrddle Intial, 1at na.r)
Edward E. Davis, John B. Parham and Clyde E. Kelly
f, REPORT OATE 7a TOTAL NO OF ;-AGZS b NO OF f t
November 1968 49_ 8Ila CON TRACT OR GRANT NO 9a. l'IIATOR'S REP0R T ~''' '5
b PROJC T NO HF-05 552 301 TR-211
. 709-FD-DAD ,, O R REPO.T NOS (Any her, number, that., , be :,,',,th tr'port)
d. 62101N
s pu on eanog ce, W4 M 390f cceanog
Attn:. ode 40. _ _ _ _ _ _ _ _ _ _ _ _ _ _ _ _ _ _ _ _ _
11 SVPPLCMLNTARY NOTITS 1 'SPONSORING NtL 'AkY A rvTv
U. S. Naval Oceanographic OfficeIt AOSTRACT
AN/SQ-41 Sonobuoys were modified, calibrated and tested for utilization in thecollection of volume reverberation data from aircraft. The electronic modifications involvedremoval of an AGC circuit and gain adjustments in the amplifier stages. The sonobuoyhydrophone array was also modified to provide for omnidirectionality. A calibration circuitwas added for checking system linearity as well as for direct rad;ng of absolute reverberationlevels from collected data.
Test and feasibility studies using the modified sonobuoys were conducted in the I esternNorth Atlantic. The acoustic data obtained in fheoe studies were analyzed in one-third octavebandwidths in the frequency band between 0.8 and 4.0 kHz. Reverberation levels weredetermined by using a calibration pulse transmitted by the sonobuoy and a scattering strengthcomputed. The results of the analyzed data indicate scattering strength generally increa.eswith increasing frequency with a knee or peak occurring between 1 .0 kHz and 2.0 kHz.
DD -.. 7. 3 UNCLASSIFIED

UNCLASSIFIEDSecurity Classification
LINK A LINK 0 I-INK CKEY WORDS
RO.E WT ROLE WT ROLE W'
MODIFICATION AND UTILIZATION OF AN/SSQ-41SONOBUOYS FOR THE COLLECTION OF VOLUMEREVERBERATION DATA FROM AIRCRAFT
I
I I
DD F40v 1473 (BACK) UNCLASSIFIED
-. ccg ,, .IIC I~~