
To Comment Response No - Climate Change...Writing just AR4 without any reference is not useful to...
120
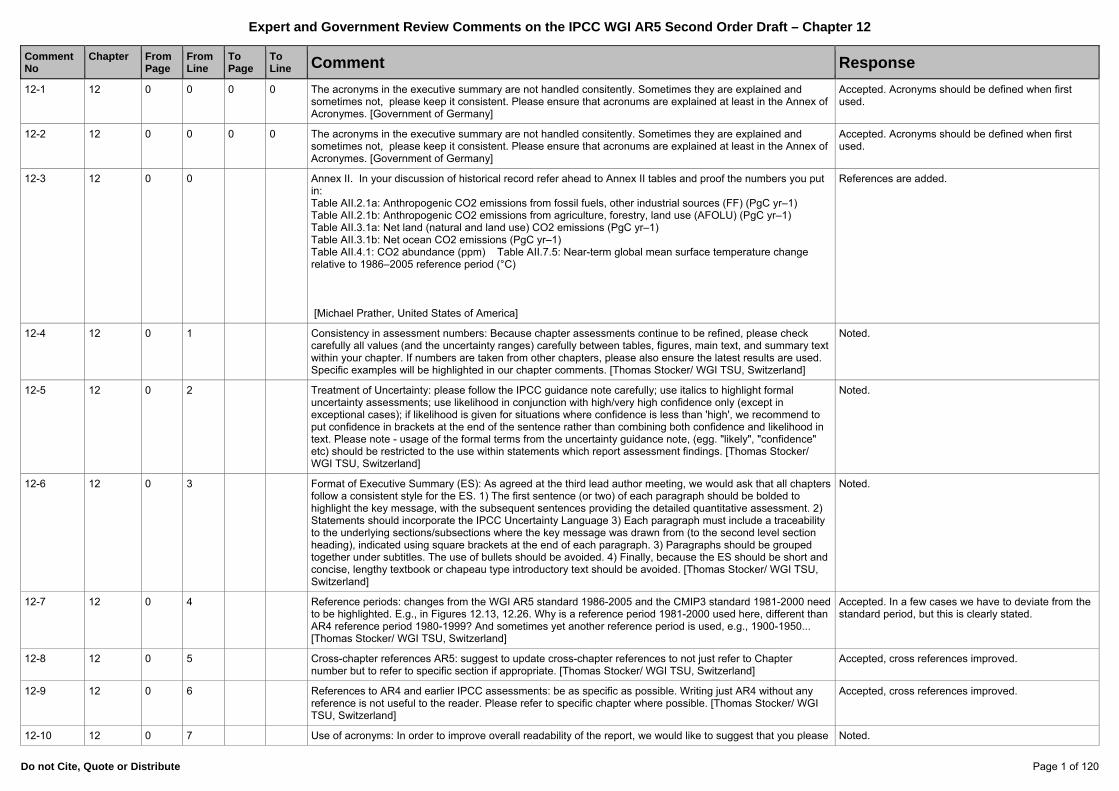
Expert and Government Review Comments on the IPCC WGI AR5 Second Order Draft – Chapter 12 Do not Cite, Quote or Distribute Page 1 of 120 Comment No Chapter From Page From Line To Page To Line Comment Response 12-1 12 0 0 0 0 The acronyms in the executive summary are not handled consitently. Sometimes they are explained and sometimes not, please keep it consistent. Please ensure that acronums are explained at least in the Annex of Acronymes. [Government of Germany] Accepted. Acronyms should be defined when first used. 12-2 12 0 0 0 0 The acronyms in the executive summary are not handled consitently. Sometimes they are explained and sometimes not, please keep it consistent. Please ensure that acronums are explained at least in the Annex of Acronymes. [Government of Germany] Accepted. Acronyms should be defined when first used. 12-3 12 0 0 Annex II. In your discussion of historical record refer ahead to Annex II tables and proof the numbers you put in: Table AII.2.1a: Anthropogenic CO2 emissions from fossil fuels, other industrial sources (FF) (PgC yr–1) Table AII.2.1b: Anthropogenic CO2 emissions from agriculture, forestry, land use (AFOLU) (PgC yr–1) Table AII.3.1a: Net land (natural and land use) CO2 emissions (PgC yr–1) Table AII.3.1b: Net ocean CO2 emissions (PgC yr–1) Table AII.4.1: CO2 abundance (ppm) Table AII.7.5: Near-term global mean surface temperature change relative to 1986–2005 reference period (°C) [Michael Prather, United States of America] References are added. 12-4 12 0 1 Consistency in assessment numbers: Because chapter assessments continue to be refined, please check carefully all values (and the uncertainty ranges) carefully between tables, figures, main text, and summary text within your chapter. If numbers are taken from other chapters, please also ensure the latest results are used. Specific examples will be highlighted in our chapter comments. [Thomas Stocker/ WGI TSU, Switzerland] Noted. 12-5 12 0 2 Treatment of Uncertainty: please follow the IPCC guidance note carefully; use italics to highlight formal uncertainty assessments; use likelihood in conjunction with high/very high confidence only (except in exceptional cases); if likelihood is given for situations where confidence is less than 'high', we recommend to put confidence in brackets at the end of the sentence rather than combining both confidence and likelihood in text. Please note - usage of the formal terms from the uncertainty guidance note, (egg. "likely", "confidence" etc) should be restricted to the use within statements which report assessment findings. [Thomas Stocker/ WGI TSU, Switzerland] Noted. 12-6 12 0 3 Format of Executive Summary (ES): As agreed at the third lead author meeting, we would ask that all chapters follow a consistent style for the ES. 1) The first sentence (or two) of each paragraph should be bolded to highlight the key message, with the subsequent sentences providing the detailed quantitative assessment. 2) Statements should incorporate the IPCC Uncertainty Language 3) Each paragraph must include a traceability to the underlying sections/subsections where the key message was drawn from (to the second level section heading), indicated using square brackets at the end of each paragraph. 3) Paragraphs should be grouped together under subtitles. The use of bullets should be avoided. 4) Finally, because the ES should be short and concise, lengthy textbook or chapeau type introductory text should be avoided. [Thomas Stocker/ WGI TSU, Switzerland] Noted. 12-7 12 0 4 Reference periods: changes from the WGI AR5 standard 1986-2005 and the CMIP3 standard 1981-2000 need to be highlighted. E.g., in Figures 12.13, 12.26. Why is a reference period 1981-2000 used here, different than AR4 reference period 1980-1999? And sometimes yet another reference period is used, e.g., 1900-1950... [Thomas Stocker/ WGI TSU, Switzerland] Accepted. In a few cases we have to deviate from the standard period, but this is clearly stated. 12-8 12 0 5 Cross-chapter references AR5: suggest to update cross-chapter references to not just refer to Chapter number but to refer to specific section if appropriate. [Thomas Stocker/ WGI TSU, Switzerland] Accepted, cross references improved. 12-9 12 0 6 References to AR4 and earlier IPCC assessments: be as specific as possible. Writing just AR4 without any reference is not useful to the reader. Please refer to specific chapter where possible. [Thomas Stocker/ WGI TSU, Switzerland] Accepted, cross references improved. 12-10 12 0 7 Use of acronyms: In order to improve overall readability of the report, we would like to suggest that you please Noted.
Transcript of To Comment Response No - Climate Change...Writing just AR4 without any reference is not useful to...
Expert and Government Review Comments on the IPCC WGI AR5 Second Order Draft – Chapter 12
Do not Cite, Quote or Distribute Page 1 of 120
Comment No
Chapter
FromPage
FromLine
To Page
To Line Comment Response
12-1 12 0 0 0 0 The acronyms in the executive summary are not handled consitently. Sometimes they are explained and sometimes not, please keep it consistent. Please ensure that acronums are explained at least in the Annex of Acronymes. [Government of Germany]
Accepted. Acronyms should be defined when first used.
12-2 12 0 0 0 0 The acronyms in the executive summary are not handled consitently. Sometimes they are explained and sometimes not, please keep it consistent. Please ensure that acronums are explained at least in the Annex of Acronymes. [Government of Germany]
Accepted. Acronyms should be defined when first used.
12-3 12 0 0 Annex II. In your discussion of historical record refer ahead to Annex II tables and proof the numbers you put in: Table AII.2.1a: Anthropogenic CO2 emissions from fossil fuels, other industrial sources (FF) (PgC yr–1) Table AII.2.1b: Anthropogenic CO2 emissions from agriculture, forestry, land use (AFOLU) (PgC yr–1) Table AII.3.1a: Net land (natural and land use) CO2 emissions (PgC yr–1) Table AII.3.1b: Net ocean CO2 emissions (PgC yr–1) Table AII.4.1: CO2 abundance (ppm) Table AII.7.5: Near-term global mean surface temperature change relative to 1986–2005 reference period (°C) [Michael Prather, United States of America]
References are added.
12-4 12 0 1 Consistency in assessment numbers: Because chapter assessments continue to be refined, please check carefully all values (and the uncertainty ranges) carefully between tables, figures, main text, and summary text within your chapter. If numbers are taken from other chapters, please also ensure the latest results are used. Specific examples will be highlighted in our chapter comments. [Thomas Stocker/ WGI TSU, Switzerland]
Noted.
12-5 12 0 2 Treatment of Uncertainty: please follow the IPCC guidance note carefully; use italics to highlight formal uncertainty assessments; use likelihood in conjunction with high/very high confidence only (except in exceptional cases); if likelihood is given for situations where confidence is less than 'high', we recommend to put confidence in brackets at the end of the sentence rather than combining both confidence and likelihood in text. Please note - usage of the formal terms from the uncertainty guidance note, (egg. "likely", "confidence" etc) should be restricted to the use within statements which report assessment findings. [Thomas Stocker/ WGI TSU, Switzerland]
Noted.
12-6 12 0 3 Format of Executive Summary (ES): As agreed at the third lead author meeting, we would ask that all chapters follow a consistent style for the ES. 1) The first sentence (or two) of each paragraph should be bolded to highlight the key message, with the subsequent sentences providing the detailed quantitative assessment. 2) Statements should incorporate the IPCC Uncertainty Language 3) Each paragraph must include a traceability to the underlying sections/subsections where the key message was drawn from (to the second level section heading), indicated using square brackets at the end of each paragraph. 3) Paragraphs should be grouped together under subtitles. The use of bullets should be avoided. 4) Finally, because the ES should be short and concise, lengthy textbook or chapeau type introductory text should be avoided. [Thomas Stocker/ WGI TSU, Switzerland]
Noted.
12-7 12 0 4 Reference periods: changes from the WGI AR5 standard 1986-2005 and the CMIP3 standard 1981-2000 need to be highlighted. E.g., in Figures 12.13, 12.26. Why is a reference period 1981-2000 used here, different than AR4 reference period 1980-1999? And sometimes yet another reference period is used, e.g., 1900-1950... [Thomas Stocker/ WGI TSU, Switzerland]
Accepted. In a few cases we have to deviate from the standard period, but this is clearly stated.
12-8 12 0 5 Cross-chapter references AR5: suggest to update cross-chapter references to not just refer to Chapter number but to refer to specific section if appropriate. [Thomas Stocker/ WGI TSU, Switzerland]
Accepted, cross references improved.
12-9 12 0 6 References to AR4 and earlier IPCC assessments: be as specific as possible. Writing just AR4 without any reference is not useful to the reader. Please refer to specific chapter where possible. [Thomas Stocker/ WGI TSU, Switzerland]
Accepted, cross references improved.
12-10 12 0 7 Use of acronyms: In order to improve overall readability of the report, we would like to suggest that you please Noted.

Expert and Government Review Comments on the IPCC WGI AR5 Second Order Draft – Chapter 12
Do not Cite, Quote or Distribute Page 2 of 120
Comment No
Chapter
FromPage
FromLine
To Page
To Line Comment Response
avoid acronyms that are not needed and/or are not used in more than one section of your chapter. [Thomas Stocker/ WGI TSU, Switzerland]
12-11 12 0 8 Personal pronouns: our strong preference is to minimize the usage of personal pronouns, e.g., we/us/our to the extent possible. Exceptions to this would be when the Chapter's assessments conclusions are presented as clear summary statements. [Thomas Stocker/ WGI TSU, Switzerland]
Noted.
12-12 12 0 9 Please make sure to provide updates of relevant data from your chapter that will be collected in Annex II - Climate System Scenario Tables, to the Annex II Chair. Also, please take the time to critically check all the entries in Annex II that are based on your Chapter assessment or that you are using in your chapter assessment. [Thomas Stocker/ WGI TSU, Switzerland]
Accepted.
12-13 12 0 0 The whole report is riddled with way too many acronyms. Its really hard to follow unless read in its entirity [Peter Clift, United States of America]
Noted. Acronyms are defined when first used.
12-14 12 0 Some consistency needs to be applied across Ch 2, 9,10,11,12,14 to the index names used for the extremes indices. For instance, annual maximum 5-day rainfall is referred to as R5dmax in Ch 12, RX5day in Ch 9, and R5d in Ch 14, and the warmest 10% of nights as TN90 in Ch10 and TN90p in Ch 2. This should be coordinated amongst all relevant chapters. [Lisa Alexander, Australia]
Noted.
12-15 12 0 The climate phenomena are discussed later in Chapter 14, however I think it is worth adding a caveat on how that variability may affect the mean and the extremes. For example a shift to stronger El Ninos will change the rainfall extremes more in one direction than a shift to stronger La Ninas or a weakening of the whole ENSO system. by providing plots showing regional distribution of changes you imply that this chapter is giving information at the regional scale. Really the chapter is about large scale changes and the reader needs to be directed to Ch 14 for more detailed information. [Jaclyn Brown, Australia]
Accepted, references to chapter 14 added.
12-16 12 0 This chapter in particular has many references to changes relative to pre-industrial, but this is not always very clearly defined. [John Caesar, United Kingdom of Great Britain & Northern Ireland]
Accepted, defined now in most instances, in particular in the context of climate targets.
12-17 12 0 Chapter 11 includes consideration of long-term (to 2100) projections of atmospheric composition. Possibly the links between the two chapters are not made clear enough in this respect. [John Caesar, United Kingdom of Great Britain & Northern Ireland]
Noted. Forcing in in 12.3, air quality in chapter 11
12-18 12 0 The Likelihood Table (Table 1.1) and Confidence figure (1.12) should be repeated in the SPM, TS and each Chapter and the terminology should be applied consistently. As an alternative to repeating the complete table/figure the material should be restated briefly in the SPM, TS, and each chapter. [Government of United States of America]
Accepted. Footnote added when used first.
12-19 12 0 There are many reference periods referred to in this chapter and this volume. Reference periods need to be clearly defined in order to avoid confusion. [Government of United States of America]
Accepted. This chapter uses mostly the 1986-2005 period which is standard for all projections, and in a few cases preindustrial (which is defined when used in most cases).
12-20 12 0 Acronyms need to be clearly defined in the glossary. [Government of United States of America] Accepted. A list of acronyms exists.
12-21 12 0 We feel that this chapter has missed presenting the larger picture due to its heavy focus on details. The breadth of topics and the level of documentation of each is generally thorough and impressive, the higher-level take-home messages (perhaps not quite at the level of Chapter Executive Summary bullets but at the intermediate level, above the sometimes myriad studies with reinforcing, complementary, slightly different, or widely opposed results). We recommend that the authors revisit the chapter and distill the important top-line messages resulting from all of the detailed results. Doing this would substantially improve the impact of the chapter. [Government of United States of America]
Accepted. The text has been revised, and in particular the summary has been shortened and sharpened.
12-22 12 0 Though the chapter generally does a good job of providing overarching caveats here, it is very important to make absolutely clear in each instance whether (and when) the basis for likelihood and confidence statements includes additional scientific evidence besides models. At times there is a tendency (maybe implicit?) to use the CMIP5 as a shorthand for uncertainty characterization. [Government of United States of America]
Accepted. We state in 12.2. clearly that the interpretation of CMIP5 as likelihood is not justified, and try to be explicit when an assessment of uncertainty is made vs. the cases where that is

Expert and Government Review Comments on the IPCC WGI AR5 Second Order Draft – Chapter 12
Do not Cite, Quote or Distribute Page 3 of 120
Comment No
Chapter
FromPage
FromLine
To Page
To Line Comment Response
impossible and only a model range is given.
12-23 12 0 A potential confusion for the reader is the switching back and forth between present-day/future and pre-industrial/future comparisons. These flips are sometimes in the same paragraph and, if passed over quickly, may lead to misleadingly assumed "apples-to-apples" comparisons of findings. [Government of United States of America]
Noted. The text is mostly using present day as a reference, except in the context of climate targets.
12-24 12 0 There is no discussion of low level jets, which are critical features contributing to regional moisture fluxes and precipitation. If the authors would like to include such a discussion, they may wish to consult the paper by Hu and Fend (“Low-level Jets and Precipitation Variations in the U.S. Great Plains Simulated and Predicted in the CMIP5 Models”), which details projections of low-level jet strength under the influence of climate change in the 21st century under the RCP 4.5 and 8.5 scenarios. [Government of United States of America]
Noted.
12-25 12 0 There is no discussion of how the Madden Julian Oscillation and Intraseasonal variability may change in the long-term projections of climate change resulting from the CMIP5 models. The authors might consider results from Jiang et al. (“Simulations of the Eastern North Pacific Intraseasonal Variability in CMIP5 GCMs”), who evaluate intraseasonal variability over the Eastern North Pacific, including expressions of the MJO on this region, and find that the amplitude of intraseasonal variability in the Eastern Pacific may change as shown by CMIP5 models forced by the RCP8.5 scenario. [Government of United States of America]
Noted. Climate phenomena are discussed in chapter 14.
12-26 12 0 The assertion here was "high confidence in these patterns of change…" The confidence behind such assertions, prominently discussed on p. 14, are based generally on consistency between model simulations (e.g.- If ENSO is not modeled correctly, then patterns of mid-latitude variability are typically not modeled correctly). Since ENSO variability is not modeled well in many/most AR5 simulations, this calls into question many of the assertions about the confidence one can have in regional patterns of climate variations. As a reference, see the Sardeshmukh presentation given at the WCRP Open Science conference and references therein. http://www.esrl.noaa.gov/psd/people/prashant.d.sardeshmukh/Sardeshmukh_talk_B1.pdf [Government of United States of America]
Noted. Online unpublished material cannot be used for the assessment. ENSO is discussed in chapter 14.
12-27 12 0 RCP scenarios need to be explained in simple terms and this should be reflected in other relevant chapters, the TS, and especially the SPM [Government of United Kingdom of Great Britain & Northern Ireland]
Taken into account - the text in Ch12 sections 12.2 and 12.3.1 links back to Ch1 (Box 1.1) in which RCPs are first introduced in relatively simple terms
12-28 12 0 standardise use of GtC or PgC – Ch6 has adopted PgC [Chris Jones, United Kingdom of Great Britain & Northern Ireland]
Accepted. PgC is used.
12-29 12 0 I believe there is a units error throughout the chapter through for the transient climate response to emissions. 2°C/1000 Gt C = 2°C/10^12 t C = 2°C/10^18 g C = 2°C/Eg C, not 2°C/Pg C. [Robert Kopp, United States]
Accepted. Typo fixed.
12-30 12 0 Maybe it is there and I missed it, but even then that is an important cue: When looking for the implied anthropogenic CO2 emissions from the CMIP5 projections, I first looked at Ch12 and didn't find them. By accident, I later found them in Ch06. That placement makes perfect sense, but it will be helpful for readers on the same quest as I to put a very clear pointer to Ch06, at a prominent location in Ch12. [Jochem Marotzke, Germany]
Accepted. Cross references have been added in many places in the chapter.
12-31 12 0 I thought this chapter read pretty well and flowed a lot better than the other chapter I read. Good effort! [David Sexton, United Kingdom]
Noted. Thank you!
12-32 12 0 It's great to see how much the chapter has progressed and matured from the FOD. One general comment: it would be helpful to the reader to have an assessment of where the projections and their likelihood/confidence have changed since AR4 and why. In other words, what's new since AR4? This would be especially useful in the ES. [Richard Wood, United Kingdom]
Noted. Where possible this is given, but space constraint imply this can't be done in all instances.
12-33 12 1 1 73 21 Text in Chapter 12 loosely used the terms 'region' and 'regional'. It is not clear to me if the terms are used referring to a consistent geographic scale. For the reader it would be useful if the authors would provide clear quantitative definitions in km2 for both 'region' and 'regional' since the scale can vary from "an urban region" to a "sub-continental region" (Tokyo = 13,500 km2; North Africa = 7,905,000 km2) [Robert Webb, United States of America]
Noted. It is hard to define this as it depends on the context, but in most cases is it large parts of a continent.
Expert and Government Review Comments on the IPCC WGI AR5 Second Order Draft – Chapter 12
Do not Cite, Quote or Distribute Page 4 of 120
Comment No
Chapter
FromPage
FromLine
To Page
To Line Comment Response
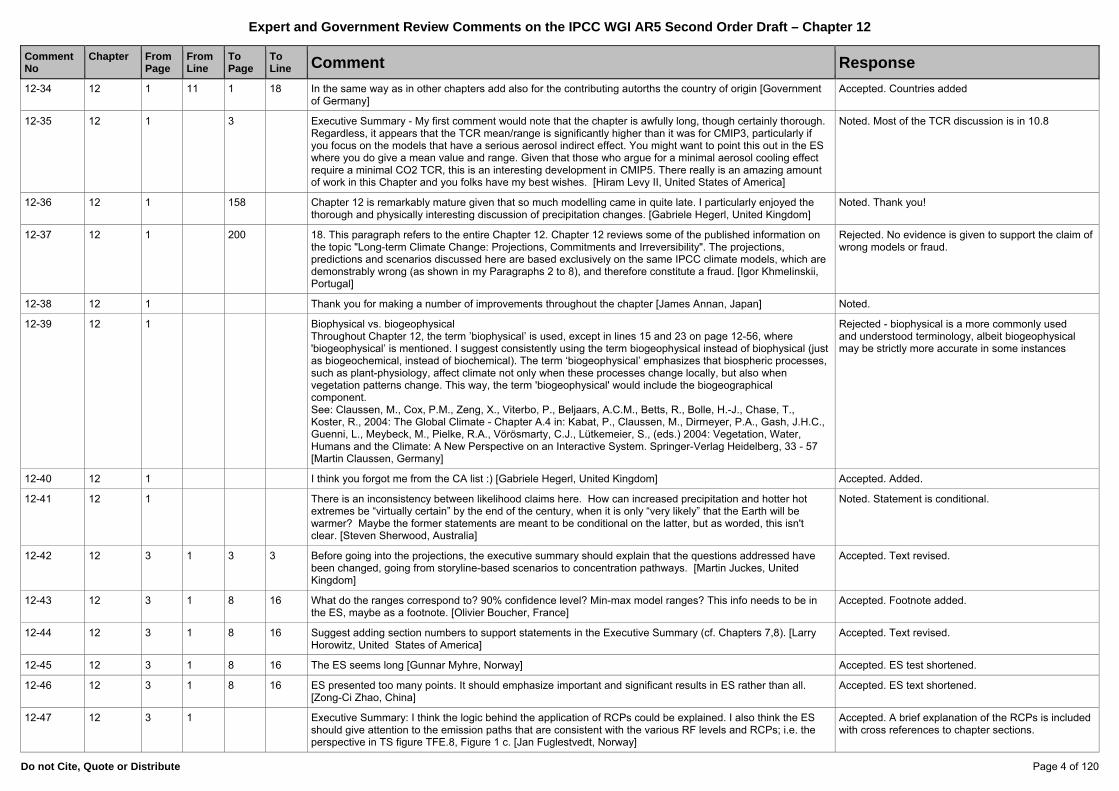
12-34 12 1 11 1 18 In the same way as in other chapters add also for the contributing autorths the country of origin [Government of Germany]
Accepted. Countries added
12-35 12 1 3 Executive Summary - My first comment would note that the chapter is awfully long, though certainly thorough. Regardless, it appears that the TCR mean/range is significantly higher than it was for CMIP3, particularly if you focus on the models that have a serious aerosol indirect effect. You might want to point this out in the ES where you do give a mean value and range. Given that those who argue for a minimal aerosol cooling effect require a minimal CO2 TCR, this is an interesting development in CMIP5. There really is an amazing amount of work in this Chapter and you folks have my best wishes. [Hiram Levy II, United States of America]
Noted. Most of the TCR discussion is in 10.8
12-36 12 1 158 Chapter 12 is remarkably mature given that so much modelling came in quite late. I particularly enjoyed the thorough and physically interesting discussion of precipitation changes. [Gabriele Hegerl, United Kingdom]
Noted. Thank you!
12-37 12 1 200 18. This paragraph refers to the entire Chapter 12. Chapter 12 reviews some of the published information on the topic "Long-term Climate Change: Projections, Commitments and Irreversibility". The projections, predictions and scenarios discussed here are based exclusively on the same IPCC climate models, which are demonstrably wrong (as shown in my Paragraphs 2 to 8), and therefore constitute a fraud. [Igor Khmelinskii, Portugal]
Rejected. No evidence is given to support the claim of wrong models or fraud.
12-38 12 1 Thank you for making a number of improvements throughout the chapter [James Annan, Japan] Noted.
12-39 12 1 Biophysical vs. biogeophysical Throughout Chapter 12, the term ’biophysical’ is used, except in lines 15 and 23 on page 12-56, where 'biogeophysical’ is mentioned. I suggest consistently using the term biogeophysical instead of biophysical (just as biogeochemical, instead of biochemical). The term ‘biogeophysical’ emphasizes that biospheric processes, such as plant-physiology, affect climate not only when these processes change locally, but also when vegetation patterns change. This way, the term 'biogeophysical' would include the biogeographical component. See: Claussen, M., Cox, P.M., Zeng, X., Viterbo, P., Beljaars, A.C.M., Betts, R., Bolle, H.-J., Chase, T., Koster, R., 2004: The Global Climate - Chapter A.4 in: Kabat, P., Claussen, M., Dirmeyer, P.A., Gash, J.H.C., Guenni, L., Meybeck, M., Pielke, R.A., Vörösmarty, C.J., Lütkemeier, S., (eds.) 2004: Vegetation, Water, Humans and the Climate: A New Perspective on an Interactive System. Springer-Verlag Heidelberg, 33 - 57 [Martin Claussen, Germany]
Rejected - biophysical is a more commonly used and understood terminology, albeit biogeophysical may be strictly more accurate in some instances
12-40 12 1 I think you forgot me from the CA list :) [Gabriele Hegerl, United Kingdom] Accepted. Added.
12-41 12 1 There is an inconsistency between likelihood claims here. How can increased precipitation and hotter hot extremes be “virtually certain” by the end of the century, when it is only “very likely” that the Earth will be warmer? Maybe the former statements are meant to be conditional on the latter, but as worded, this isn't clear. [Steven Sherwood, Australia]
Noted. Statement is conditional.
12-42 12 3 1 3 3 Before going into the projections, the executive summary should explain that the questions addressed have been changed, going from storyline-based scenarios to concentration pathways. [Martin Juckes, United Kingdom]
Accepted. Text revised.
12-43 12 3 1 8 16 What do the ranges correspond to? 90% confidence level? Min-max model ranges? This info needs to be in the ES, maybe as a footnote. [Olivier Boucher, France]
Accepted. Footnote added.
12-44 12 3 1 8 16 Suggest adding section numbers to support statements in the Executive Summary (cf. Chapters 7,8). [Larry Horowitz, United States of America]
Accepted. Text revised.
12-45 12 3 1 8 16 The ES seems long [Gunnar Myhre, Norway] Accepted. ES test shortened.
12-46 12 3 1 8 16 ES presented too many points. It should emphasize important and significant results in ES rather than all. [Zong-Ci Zhao, China]
Accepted. ES text shortened.
12-47 12 3 1 Executive Summary: I think the logic behind the application of RCPs could be explained. I also think the ES should give attention to the emission paths that are consistent with the various RF levels and RCPs; i.e. the perspective in TS figure TFE.8, Figure 1 c. [Jan Fuglestvedt, Norway]
Accepted. A brief explanation of the RCPs is included with cross references to chapter sections.

Expert and Government Review Comments on the IPCC WGI AR5 Second Order Draft – Chapter 12
Do not Cite, Quote or Distribute Page 5 of 120
Comment No
Chapter
FromPage
FromLine
To Page
To Line Comment Response
12-48 12 3 1 The ordering of material in this Executive Summary should be reconsidered, or at least some cross-referencing introduced. There is a reference, without expansion of the acronym, to "RCPs" as early as page 12.3, line 6, and many subsequent references to RCPs before one reaches page 12.7, line 42, and reads that "New scenarios called Representative Concentration Pathways (RCPs) have been ...". The RCPs have, of course, been discucussed in earlier chapters, but the ordering of the Executive Summary of chapter 12 needs reviewing, as there may be few readers who read the WG1 report from cover to cover. [Adrian Simmons, United Kingdom]
Accepted. Text re-ordered.
12-49 12 3 1 Executive Summary: It would be helpful if the statements (including statements of confidence and uncertainty) in the executive summary made clear whether they were largely based on model results, physical understanding or expert judgement. Ideally each statement should include a consistently formatted assessment of this. Consider for instance, the section on changes in the ocean. While the statement includes "based on the available models and the literature", the information is nevertheless presented in terms of a prediction of the 21st century real world. Has there been an assessment that the models are suitable for the quantification of weakening in the real world to this level of accuracy (20-30% in RCP4.5)? Is this "based on" models or rather a presentation of model results? It would be helpful for the reader to be able to make this distinction for each statement in the executive summary. [David Stainforth, United Kingdom]
Rejected. The rationale for each likelihood statement is explained in the chapter text but there is not enough space in the Exec Summary to spell out everything.
12-50 12 3 1 Executive Summary: As outlined in our general guidance, the ES should be as concise as possible. In our opinion, the Chapter 12 ES could be substantially shortened, and we therefore encourage the authors to focus and condense their ES. For example, the last general section on scenarios, ensembles, and uncertainties could be shortened. [Thomas Stocker/ WGI TSU, Switzerland]
Accepted. Text shortened.
12-51 12 3 1 Executive Summary: As outlined in our general guidance, the chapter 12 ES currently does not conform to the recommended AR5 style communicated at the third lead author meeting, in particular, the use of bulleted statements is inconsistent with the majority of chapters. [Thomas Stocker/ WGI TSU, Switzerland]
Accepted. Style modified.
12-52 12 3 1 Executive Summary: for some of the statements and some of the conclusions it's not clear which scenario or what time period it applies to -- suggest to be as specific as possible to avoid ambiguities. For example, are statements without time frame indicated generally assumed to be for the end of the 21st century? In addition, it would be very helpful to indicate, in cases where a specific conclusion is presented for one particular scenario, why this particular scenario was selected and whether the conclusion qualitatively holds for other scenarios as well. We found those cases most informative where the range from RCP2.6 to RCP8.5 was included in the conclusion. [Thomas Stocker/ WGI TSU, Switzerland]
Accepted. Statements now either conditioned on scenario or related to global mean temperature change.
12-53 12 3 2 3 6 An excellent point. [Robert Kandel, France] Noted.
12-54 12 3 3 8 16 All these figures are based on personal opinions of the value of untested models. We await with bated breath your future report on whether any of them are successful [Vincent Gray, New Zealand]
Noted.
12-55 12 3 5 3 5 The chapter needs to be made clear at the start whether the projections presented represent a considered assessment of what will happen in the real world, or are simply reporting on CMIP5 model results. [Government of Australia]
Accepted. Text revised to differentiate between such cases.
12-56 12 3 5 3 5 I suggest "21st century" instead of just "century". [Jonathan Gregory, United Kingdom] Accepted. Text revised.
12-57 12 3 5 3 25 The confidence statement for temperature ("very likely") is weaker than the confidence statement for precipitation ("virtually certain"). This seems odd given the exceptionally high confidence in model projections of temperature compared to precipitation. If the reason for the discrepancy has to do with the orientation of the statements (end of 21st century temperature vs. beginning compared to temperature increases implying precipitation increases), we suggest re-wording so that the temperature statement is at least as strong as the precipitation statement in terms of confidence. Although these statements aren't completely parallel given the wording (the statements are delta-T then delta-P), the sense is that there is more confidence in the precipitation projections than the temperature projections, which isn't the case. [Government of United States of America]
Accepted. It is now made clear where statements refer to projections under RCPs or are simply a consequence of global temperature rise.
12-58 12 3 7 3 7 "more strongly dependent on the scenario." Maybe needs an addition like "than on climate model spread". [Manoj Joshi, United Kingdom of Great Britain & Northern Ireland]
Rejected. This statement was deleted in the FGD and replaced by numerical values for each RCP.
Expert and Government Review Comments on the IPCC WGI AR5 Second Order Draft – Chapter 12
Do not Cite, Quote or Distribute Page 6 of 120
Comment No
Chapter
FromPage
FromLine
To Page
To Line Comment Response
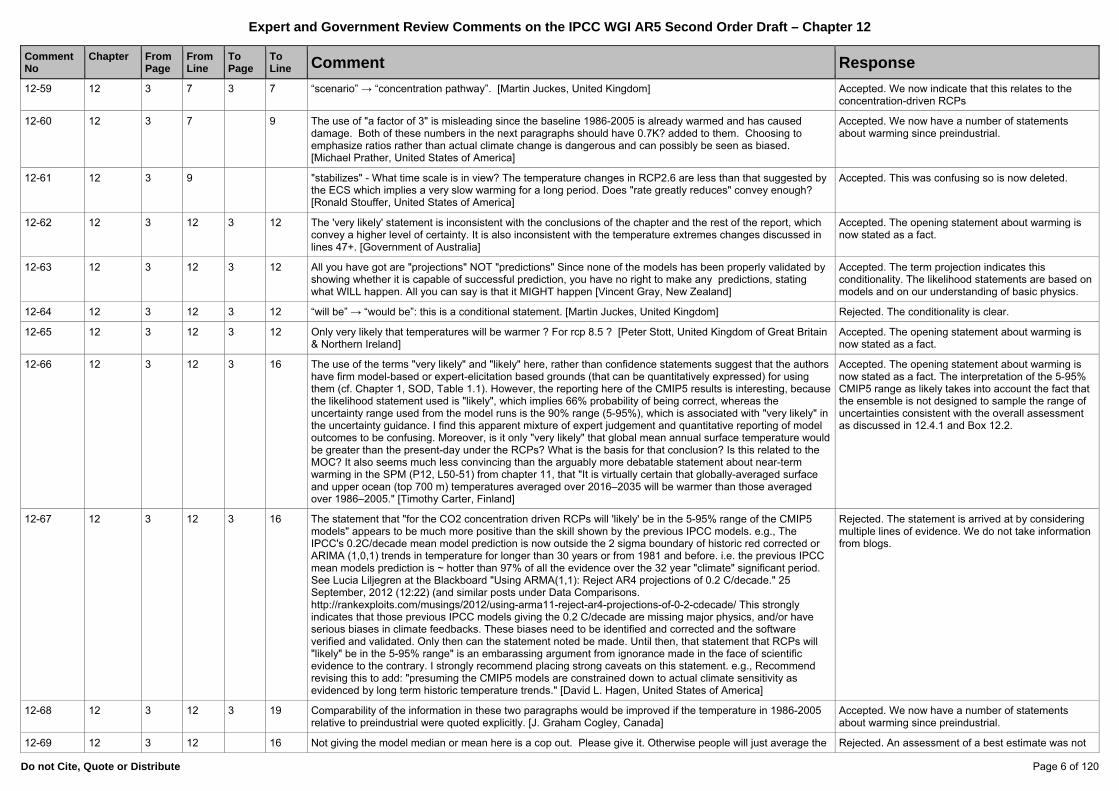
12-59 12 3 7 3 7 “scenario” → “concentration pathway”. [Martin Juckes, United Kingdom] Accepted. We now indicate that this relates to the concentration-driven RCPs
12-60 12 3 7 9 The use of "a factor of 3" is misleading since the baseline 1986-2005 is already warmed and has caused damage. Both of these numbers in the next paragraphs should have 0.7K? added to them. Choosing to emphasize ratios rather than actual climate change is dangerous and can possibly be seen as biased. [Michael Prather, United States of America]
Accepted. We now have a number of statements about warming since preindustrial.
12-61 12 3 9 "stabilizes" - What time scale is in view? The temperature changes in RCP2.6 are less than that suggested by the ECS which implies a very slow warming for a long period. Does "rate greatly reduces" convey enough? [Ronald Stouffer, United States of America]
Accepted. This was confusing so is now deleted.
12-62 12 3 12 3 12 The 'very likely' statement is inconsistent with the conclusions of the chapter and the rest of the report, which convey a higher level of certainty. It is also inconsistent with the temperature extremes changes discussed in lines 47+. [Government of Australia]
Accepted. The opening statement about warming is now stated as a fact.
12-63 12 3 12 3 12 All you have got are "projections" NOT "predictions" Since none of the models has been properly validated by showing whether it is capable of successful prediction, you have no right to make any predictions, stating what WILL happen. All you can say is that it MIGHT happen [Vincent Gray, New Zealand]
Accepted. The term projection indicates this conditionality. The likelihood statements are based on models and on our understanding of basic physics.
12-64 12 3 12 3 12 “will be” → “would be”: this is a conditional statement. [Martin Juckes, United Kingdom] Rejected. The conditionality is clear.
12-65 12 3 12 3 12 Only very likely that temperatures will be warmer ? For rcp 8.5 ? [Peter Stott, United Kingdom of Great Britain & Northern Ireland]
Accepted. The opening statement about warming is now stated as a fact.
12-66 12 3 12 3 16 The use of the terms "very likely" and "likely" here, rather than confidence statements suggest that the authors have firm model-based or expert-elicitation based grounds (that can be quantitatively expressed) for using them (cf. Chapter 1, SOD, Table 1.1). However, the reporting here of the CMIP5 results is interesting, because the likelihood statement used is "likely", which implies 66% probability of being correct, whereas the uncertainty range used from the model runs is the 90% range (5-95%), which is associated with "very likely" in the uncertainty guidance. I find this apparent mixture of expert judgement and quantitative reporting of model outcomes to be confusing. Moreover, is it only "very likely" that global mean annual surface temperature would be greater than the present-day under the RCPs? What is the basis for that conclusion? Is this related to the MOC? It also seems much less convincing than the arguably more debatable statement about near-term warming in the SPM (P12, L50-51) from chapter 11, that "It is virtually certain that globally-averaged surface and upper ocean (top 700 m) temperatures averaged over 2016–2035 will be warmer than those averaged over 1986–2005." [Timothy Carter, Finland]
Accepted. The opening statement about warming is now stated as a fact. The interpretation of the 5-95% CMIP5 range as likely takes into account the fact that the ensemble is not designed to sample the range of uncertainties consistent with the overall assessment as discussed in 12.4.1 and Box 12.2.
12-67 12 3 12 3 16 The statement that "for the CO2 concentration driven RCPs will 'likely' be in the 5-95% range of the CMIP5 models" appears to be much more positive than the skill shown by the previous IPCC models. e.g., The IPCC's 0.2C/decade mean model prediction is now outside the 2 sigma boundary of historic red corrected or ARIMA (1,0,1) trends in temperature for longer than 30 years or from 1981 and before. i.e. the previous IPCC mean models prediction is ~ hotter than 97% of all the evidence over the 32 year "climate" significant period. See Lucia Liljegren at the Blackboard "Using ARMA(1,1): Reject AR4 projections of 0.2 C/decade." 25 September, 2012 (12:22) (and similar posts under Data Comparisons. http://rankexploits.com/musings/2012/using-arma11-reject-ar4-projections-of-0-2-cdecade/ This strongly indicates that those previous IPCC models giving the 0.2 C/decade are missing major physics, and/or have serious biases in climate feedbacks. These biases need to be identified and corrected and the software verified and validated. Only then can the statement noted be made. Until then, that statement that RCPs will "likely" be in the 5-95% range" is an embarassing argument from ignorance made in the face of scientific evidence to the contrary. I strongly recommend placing strong caveats on this statement. e.g., Recommend revising this to add: "presuming the CMIP5 models are constrained down to actual climate sensitivity as evidenced by long term historic temperature trends." [David L. Hagen, United States of America]
Rejected. The statement is arrived at by considering multiple lines of evidence. We do not take information from blogs.
12-68 12 3 12 3 19 Comparability of the information in these two paragraphs would be improved if the temperature in 1986-2005 relative to preindustrial were quoted explicitly. [J. Graham Cogley, Canada]
Accepted. We now have a number of statements about warming since preindustrial.
12-69 12 3 12 16 Not giving the model median or mean here is a cop out. Please give it. Otherwise people will just average the Rejected. An assessment of a best estimate was not
Expert and Government Review Comments on the IPCC WGI AR5 Second Order Draft – Chapter 12
Do not Cite, Quote or Distribute Page 7 of 120
Comment No
Chapter
FromPage
FromLine
To Page
To Line Comment Response
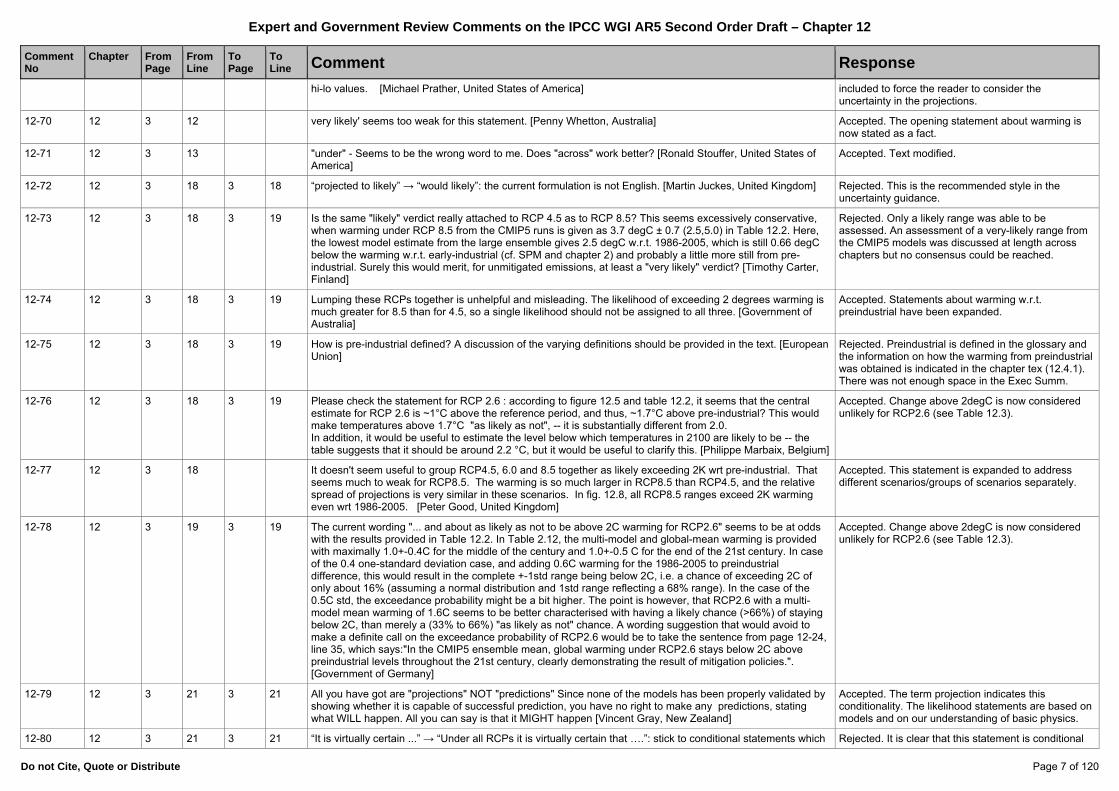
hi-lo values. [Michael Prather, United States of America] included to force the reader to consider the uncertainty in the projections.
12-70 12 3 12 very likely' seems too weak for this statement. [Penny Whetton, Australia] Accepted. The opening statement about warming is now stated as a fact.
12-71 12 3 13 "under" - Seems to be the wrong word to me. Does "across" work better? [Ronald Stouffer, United States of America]
Accepted. Text modified.
12-72 12 3 18 3 18 “projected to likely” → “would likely”: the current formulation is not English. [Martin Juckes, United Kingdom] Rejected. This is the recommended style in the uncertainty guidance.
12-73 12 3 18 3 19 Is the same "likely" verdict really attached to RCP 4.5 as to RCP 8.5? This seems excessively conservative, when warming under RCP 8.5 from the CMIP5 runs is given as 3.7 degC ± 0.7 (2.5,5.0) in Table 12.2. Here, the lowest model estimate from the large ensemble gives 2.5 degC w.r.t. 1986-2005, which is still 0.66 degC below the warming w.r.t. early-industrial (cf. SPM and chapter 2) and probably a little more still from pre-industrial. Surely this would merit, for unmitigated emissions, at least a "very likely" verdict? [Timothy Carter, Finland]
Rejected. Only a likely range was able to be assessed. An assessment of a very-likely range from the CMIP5 models was discussed at length across chapters but no consensus could be reached.
12-74 12 3 18 3 19 Lumping these RCPs together is unhelpful and misleading. The likelihood of exceeding 2 degrees warming is much greater for 8.5 than for 4.5, so a single likelihood should not be assigned to all three. [Government of Australia]
Accepted. Statements about warming w.r.t. preindustrial have been expanded.
12-75 12 3 18 3 19 How is pre-industrial defined? A discussion of the varying definitions should be provided in the text. [European Union]
Rejected. Preindustrial is defined in the glossary and the information on how the warming from preindustrial was obtained is indicated in the chapter tex (12.4.1). There was not enough space in the Exec Summ.
12-76 12 3 18 3 19 Please check the statement for RCP 2.6 : according to figure 12.5 and table 12.2, it seems that the central estimate for RCP 2.6 is ~1°C above the reference period, and thus, ~1.7°C above pre-industrial? This would make temperatures above 1.7°C "as likely as not", -- it is substantially different from 2.0. In addition, it would be useful to estimate the level below which temperatures in 2100 are likely to be -- the table suggests that it should be around 2.2 °C, but it would be useful to clarify this. [Philippe Marbaix, Belgium]
Accepted. Change above 2degC is now considered unlikely for RCP2.6 (see Table 12.3).
12-77 12 3 18 It doesn't seem useful to group RCP4.5, 6.0 and 8.5 together as likely exceeding 2K wrt pre-industrial. That seems much to weak for RCP8.5. The warming is so much larger in RCP8.5 than RCP4.5, and the relative spread of projections is very similar in these scenarios. In fig. 12.8, all RCP8.5 ranges exceed 2K warming even wrt 1986-2005. [Peter Good, United Kingdom]
Accepted. This statement is expanded to address different scenarios/groups of scenarios separately.
12-78 12 3 19 3 19 The current wording "... and about as likely as not to be above 2C warming for RCP2.6" seems to be at odds with the results provided in Table 12.2. In Table 2.12, the multi-model and global-mean warming is provided with maximally 1.0+-0.4C for the middle of the century and 1.0+-0.5 C for the end of the 21st century. In case of the 0.4 one-standard deviation case, and adding 0.6C warming for the 1986-2005 to preindustrial difference, this would result in the complete +-1std range being below 2C, i.e. a chance of exceeding 2C of only about 16% (assuming a normal distribution and 1std range reflecting a 68% range). In the case of the 0.5C std, the exceedance probability might be a bit higher. The point is however, that RCP2.6 with a multi-model mean warming of 1.6C seems to be better characterised with having a likely chance (>66%) of staying below 2C, than merely a (33% to 66%) "as likely as not" chance. A wording suggestion that would avoid to make a definite call on the exceedance probability of RCP2.6 would be to take the sentence from page 12-24, line 35, which says:"In the CMIP5 ensemble mean, global warming under RCP2.6 stays below 2C above preindustrial levels throughout the 21st century, clearly demonstrating the result of mitigation policies.". [Government of Germany]
Accepted. Change above 2degC is now considered unlikely for RCP2.6 (see Table 12.3).
12-79 12 3 21 3 21 All you have got are "projections" NOT "predictions" Since none of the models has been properly validated by showing whether it is capable of successful prediction, you have no right to make any predictions, stating what WILL happen. All you can say is that it MIGHT happen [Vincent Gray, New Zealand]
Accepted. The term projection indicates this conditionality. The likelihood statements are based on models and on our understanding of basic physics.
12-80 12 3 21 3 21 “It is virtually certain ...” → “Under all RCPs it is virtually certain that ….”: stick to conditional statements which Rejected. It is clear that this statement is conditional

Expert and Government Review Comments on the IPCC WGI AR5 Second Order Draft – Chapter 12
Do not Cite, Quote or Distribute Page 8 of 120
Comment No
Chapter
FromPage
FromLine
To Page
To Line Comment Response
are scientifically based, avoid absolute statements. [Martin Juckes, United Kingdom] on long term global mean temperature change.
12-81 12 3 21 3 22 Does the "virtually certain" label apply both to the increase in precipitation and also to the smaller increase per degC than for water vapour? [Timothy Carter, Finland]
Accepted. Sentence now split.
12-82 12 3 21 3 25 Even in this section on global means, would it not be appropriate also to give figures and confidence values for global land precipitation changes? Or at least a reference to Fgi. 12.7 and Sec tion 12.4.1.1. [Robert Kandel, France]
Rejected. For reasons of space. Global land numbers are given in the chapter text/figure.
12-83 12 3 21 Virtually certain is very strong particularly for the second part of the sentence… [Gabriele Hegerl, United Kingdom]
Accepted. Text revised to indicate long-term changes.
12-84 12 3 22 3 22 You mean "a relative increase per °C", otherwise you're comparing apples with oranges. [Olivier Boucher, France]
Rejected. The use of %/degC in the next sentence makes this clear.
12-85 12 3 22 3 22 Please be more explicit about the time period meant by "the next century". This could be read as the 22nd century. [Government of Australia]
Accepted. Text modified.
12-86 12 3 22 This should be explained in detail in the main text. [David Erickson, United States of America] Accepted. The appropriate section is cross-referenced.
12-87 12 3 24 3 24 "sensitivities for global-mean precipitation". [J. Graham Cogley, Canada] Rejected. It is clear here that precip change /degC is being referred to.
12-88 12 3 24 3 25 I assume the wider range for RCP2.6 is due to signal to noise issues. If so, should that be noted here? [Ronald Stouffer, United States of America]
Rejected. For reasons of space this is discussed in the main text rather than the ES.
12-89 12 3 35 3 35 Delete "to". [J. Graham Cogley, Canada] Rejected. It is required.
12-90 12 3 35 3 35 We suggest removing the statement about the cause for the Antarctic region. No other statement in the executive summary includes a similar format. [Government of United States of America]
Rejected. This statement was retained to clarify the statement.
12-91 12 3 37 3 39 Provide an explanation as to why the cooling occurs under RCP4.5 only. [Government of Australia] Rejected. It was discovered that the cooling was found in other scenario experiments with that model. The cause is unknown.
12-92 12 3 37 3 39 It is recommended to provide the specific range for modeling results and use pinpoint numbers such as “five out of 10”expressions to replace expressions such as “some models.” [Government of China]
Rejected. The percentage of models is not an indicator of likelihood and no special significance should be attached to it.
12-93 12 3 37 3 39 Here, and at many other points in the executive summary, there is no statement of confidence attached, just some scientific finding. Do we want a standardized way of reporting in the exec summary, with confidence attached to all statements? [Government of United States of America]
Rejected. For some statements it was not possible to assess a level of likelihood or confidence. In addition, the guidance states that ‘finding that includes a probabilistic measure of uncertainty does not require explicit mention of the level of confidence associated with that finding if the level of confidence is “high” or “very high.”’
12-94 12 3 37 3 39 Both sentences seem the same to me. Reword if there are two points… [Ronald Stouffer, United States of America]
Accepted. Statement now refers to a ‘marked cooling’
12-95 12 3 38 3 38 "Some models", it should give how many of total models [Zong-Ci Zhao, China] Rejected. The percentage of models is not an indicator of likelihood and no special significance should be attached to it.
12-96 12 3 38 3 39 “Some models exhibit …..”: the executive summary should offer an interpretation. E.g. “Regional cooling in the 21st century cannot be ruled out (for example, some models …..)” [Martin Juckes, United Kingdom]
Rejected. There was not enough information about the cooling models to assess a likelihood of this outcome.
12-97 12 3 38 3 39 Here only gives the RCP4.5 of cooling effect, should give some other context information [Ying Xu, China] Rejected. It was discovered that the cooling was
Expert and Government Review Comments on the IPCC WGI AR5 Second Order Draft – Chapter 12
Do not Cite, Quote or Distribute Page 9 of 120
Comment No
Chapter
FromPage
FromLine
To Page
To Line Comment Response
found in other scenario experiments with that model. The cause is unknown.
12-98 12 3 41 3 45 "Consistency" is defined with the previous report of consistency is a model of consistency between?The main report of P32, Line47-50 refers to the consistency between the model.Suggest clear.In addition to the "assessment" is the assessment report or some other reports, suggest clear. [Ying Xu, China]
Accepted. The clause about consistency has been deleted.
12-99 12 3 42 3 42 "shows". [J. Graham Cogley, Canada] Rejected. The text was modified so this error is no longer relevant.
12-100 12 3 42 3 42 "shows" → "show" [Richard Wood, United Kingdom] Rejected. The text was modified so this error is no longer relevant.
12-101 12 3 42 Please point to the section elsewhere in the document that covers why the stratosphere cools in a warming climate. Some non-experts might not understand this point, and it would be worth a brief elucidation either here or elsewhere, if it is covered elsewhere. [Government of United States of America]
Rejected. Too elementary for the executive summary.
12-102 12 3 43 3 45 Chapter 9 page 27 lines 31-33 conclude that there is high confidence that models overestimate the warming trend in the tropical troposphere. So this statement here in chapter 12 about the greatest atmosphere warming very likely to occur in the tropical upper troposhere could be inconsistent with chapter 9 assessment ? [Peter Stott, United Kingdom of Great Britain & Northern Ireland]
Accepted. This statement was deleted.
12-103 12 3 44 3 45 I think it should read "northern near-surface high latitudes" [Richard Wood, United Kingdom] Rejected. The warming is through the troposphere.
12-104 12 3 44 Should "near surface" be added after "high latitudes"? [Ronald Stouffer, United States of America] Rejected. The warming is through the troposphere.
12-105 12 3 47 3 48 I find it difficult to reconcile a "virtually certain" prospect of more hot and fewer cold extremes as global temperature increases, but it being only "very likely" that global temperatures will be greater at the end of the century than at present (L12-13). I realise that the extremes statement is conditional on warming and also refers vaguely to "most places", but it could still be interpreted by some as implying that it is virtually certain that hot extremes increase and cold extremes decrease, while at the same time not being virtually certain (merely "very likely") that it is even going to be warmer than now by the end of the century. Indeed, this latter statement also flies in the face of the commitment runs from AR4, which indicated warming even with stabilisation of forcing in 2000 (a much more drastic scenario than RCP2.6). The models haven't changed that much since AR4, so what reservations lie behind such a cautious statement? [Timothy Carter, Finland]
The statement about extremes is clearly a conditional confidence statement. Any other interpretation would be mistaken. We will leave this particular likelihood statement as is.
12-106 12 3 47 3 48 You need to define the reference for extremes here, perhaps as a footnote: e.g. “extremes are define relative to 1980-1999 reference climatology”. [Martin Juckes, United Kingdom]
We have included a general statement about reference periods at the top of the chapter ES.
12-107 12 3 52 3 52 Is the particular reference to 'cold winter extremes' necessary? Won't cold extremes continue to occur in all seasons? [Government of Australia]
Taken into account, text clarified.
12-108 12 3 52 Add "but become less frequent over time" at the end of the sentence. [Ronald Stouffer, United States of America]
Taken into account, text clarified.
12-109 12 3 54 3 54 Make it clear that you're talking about "20-year return values for the present-day or pre-industrial climate". [Olivier Boucher, France]
Taken into account, text clarified.
12-110 12 3 54 3 54 We recommend that the definition of return values and return periods in the glossary in annex III is improved and made easier to understand e.g. use language from SREX glossary. [Government of NORWAY]
We disagree. The SREX definition is not appropriate for time dependent statistics.
12-111 12 3 54 3 54 "experience" doesn't sound right; I suggest "show", and omit "Projected changes in". [Jonathan Gregory, United Kingdom]
This section was rewritten
12-112 12 3 54 3 55 Consider rewording for clarity/brevity: e.g., "20-year return values of high and low temperature events are projected to increase more than mean temperatures in many regions,…" [Government of Canada]
This section was rewritten
12-113 12 3 54 3 55 The current wording says "Projected changes ... of high and LOW temperature events experience greater INCREASES than mean temepratures....". For this sentence to be correct, it seems that the segment "and LOW" needs to be deleted (cf. Page 12-4 lines 1-2. . [Government of Germany]
Rejected. This refers to cold temperature extremes which are projected to increase at a much greater rate than mean temperature. I.e. cold extremes will be less
Expert and Government Review Comments on the IPCC WGI AR5 Second Order Draft – Chapter 12
Do not Cite, Quote or Distribute Page 10 of 120
Comment No
Chapter
FromPage
FromLine
To Page
To Line Comment Response
extreme.
12-114 12 3 54 4 2 You need to define terms here. Changes in a 20-year return value could mean the change in the value of, for instance, temperature which is expected to occur once every 20 years. This would be a valid reading of the first sentence, but later sentences suggest that you are talking about changes in frequency of occurrence of, for example, a temperature which has a 20-year return period in a reference climatology. Perhaps the two parts of the paragraph are intended to refer to these two different views of the changes? If this is the case, change the sentence starting in line 56 to “Under RCP8.5 it is likely that the 20 year maximum temperature of the reference climatology will … and that the equivalent 20 year minimum temperature will ….”. If you adopt this formulation, “reference climatology” would have to be defined earlier in the executive summary. [Martin Juckes, United Kingdom]
The glossary definition of return value describes both of these meanings.
12-115 12 3 54 4 2 Does this bullet apply to both daily and seasonal extremes? I assume just daily but given the previous bullet it's not clear. Suggest make this explicit. [Richard Wood, United Kingdom]
The analysis is confined to daily extremes. We added that word to line 54 for clarity.
12-116 12 3 56 3 56 Insert "what is currently" [a 20-year extreme] [Jonathan Gregory, United Kingdom] used "present day" instead see response to comment 12-9.
12-117 12 3 56 3 56 Suggest "a currently 20 year maximum temperature event" for clarity. [Richard Wood, United Kingdom] used "present day" instead see response to comment 12-9.
12-118 12 3 56 3 57 Make clear that a 20 yrs max temp event in the present climate is meant! [Andreas Sterl, Netherlands] used "present day" instead see response to comment 12-9.
12-119 12 3 56 4 1 Change "20 year" to "present-day 20-year" in two places. [J. Graham Cogley, Canada] used "present day" see response to comment 12-9.
12-120 12 3 56 4 2 It is confusing to talk about a 20-year maximum temperature event occurring more frequently. It seems the point is that a given temperature extreme (in deg C) that used to occur once in 20 years is expected to occur with greater frequency. Similarly, a "20-year minimum temperature event" will still occur approximately once in 20 years, but the minimum temperature reached at a given location will generally be higher in the future than it is today. Is it possible to clarify these sentences further? [Government of Canada]
Taken into account, text clarified.
12-121 12 3 Executive Summary: Some items contain confidence statements, while some (which could) don't. There should be consistency between the items in the executive summary with respect to expressions of confidence. [Government of United States of America]
Taken into account. The ES summary has been largely rewritten to better use the uncertainty language.
12-122 12 4 2 4 2 It would be good if a frequency (e.g. X year event) could be provided in relation to the 'exceedingly rare' description for minimum temperature, as for the maximum temperature. [Government of Australia]
The uncertainty in future return period estimates is very large for present day 20 year cold extremes. Most likely estimates are greater than 500 years but we are not comfortable being quantitative due to this uncertainty. We are confident that by any individual human's time scale, such events are "exceedingly rare".
12-123 12 4 4 4 7 There is no mention here of one of the most (if not the most) important cloud change: the ubiquitous upward shift of cloud tops, which gives a strong positive feedback. [Government of United States of America]
Rejected. It was not felt to be a policy-relevant variable to discuss here.
12-124 12 4 9 4 9 This could be clarified. It is the TOA net radiative flux? In the main text, section 12.4.3.4, the term used is "energy budget" but presumably this is entirely radiative at TOA? [Government of Canada]
Rejected. This statement was removed from the final draft.
12-125 12 4 9 4 10 "net radiative flux". "in the 21st century". "trajectory" needs to be replaced by something like "evolution over the century". [J. Graham Cogley, Canada]
Rejected. This statement was removed from the final draft.
12-126 12 4 10 4 12 The sentence and/or terms are not reader-friendly. The sentence starting with "but the trajectory" needs to be improved. Additional explanations are necessary for the terms "trajectory" and "stabilization". [Government of Japan]
Rejected. This statement was removed from the final draft.
12-127 12 4 11 4 11 I suggest "..., and increases followed by stabilization or even ..." [Jonathan Gregory, United Kingdom] Rejected. This statement was removed from the final draft.

Expert and Government Review Comments on the IPCC WGI AR5 Second Order Draft – Chapter 12
Do not Cite, Quote or Distribute Page 11 of 120
Comment No
Chapter
FromPage
FromLine
To Page
To Line Comment Response
12-128 12 4 14 Executive Summary, Subsection Atmospheric Circulation: the first two bullets present likelihood statement based on the RCP8.5 for changes in storm tracks by the end of the 21st century. The next three statements don't refer to to any specific RCP or time frame. How is this to interpreted? Does referring to RCP8.5 with likelihood statements in the first two bullets imply that the changes (if there are changes at all?) in other RCPs are not likely for these cases? Does it mean that for bullets 3-5 the changes are likely in all 4 RCPs? Do bullets 3-5 also refer to the end of the 21st century? Please clarify and try to be as specific as possible to avoid ambiguities. [Thomas Stocker/ WGI TSU, Switzerland]
Accepted. Text modified. Hopefully it is now clear that this statement refers to RCP8.5.
12-129 12 4 15 4 37 This discusion is very tentative. [David Erickson, United States of America] Rejected. Without specific critical comments it is hard to know what to change.
12-130 12 4 16 4 17 In the SH as well ? Is this consistent with ES 11.5 line 40 ? [Peter Stott, United Kingdom of Great Britain & Northern Ireland]
Rejected. Yes in the SH hemisphere too. May not be consistent with Ch 11 due to smaller signal in near term.
12-131 12 4 16 4 29 The statement that shifts in the mid-latitude jet are likely (L 18) is somewhat contradicted by (L28) assertion that there is low confidence in NH storm tracks. Are these two indeed contradictory, for one expects the storm tracks to generally shift with the jet. [Government of United States of America]
Rejected. This might be expected but the signal to noise in the storm track diagnostics is low so we cannot be certain.
12-132 12 4 17 4 18 These shifts are expressed in terms of latitude degrees, but might be more effectively described in kilometres. Shouldn't this read ".... by the end of the 21st Century ...."? The implications of this shift for surface weather might usefully be described somewhere. It doesn't seem to be related to poleward shifts in storm tracks in the northern hemisphere as it is in the southern hemisphere (cf. L28-29). [Timothy Carter, Finland]
Rejected. Expressing changes in degrees latitude seems appropriate to us in the context of the model resolution. Regarding the consistency between the storm tracks and jet changes, the signal to noise in the storm track diagnostics is low so we cannot be certain.
12-133 12 4 17 4 18 "poleward shifts in the mid-latitude jets of 1-2 degrees are likely" -- how significant is such a shift? How robust is this shift if it has to be reported as "1-2 degrees"? Suggest to clarify that the shifts are robust and significant (see page 38, lines 38ff) [Thomas Stocker/ WGI TSU, Switzerland]
Accepted. These shifts are robust and significant.
12-134 12 4 18 4 22 Rather than degrees, kilometres would probably convey the facts more clearly to the average reader. [J. Graham Cogley, Canada]
Rejected. Expressing changes in degrees latitude seems appropriate to us in the context of the model resolution.
12-135 12 4 18 To increase clarity it is suggested to transform the distance in terms of degrees into a distance in terms of kilometers. [Klaus Radunsky, Austria]
Rejected. Expressing changes in degrees latitude seems appropriate to us in the context of the model resolution.
12-136 12 4 22 4 26 Suggest insert in line 23 In particular, the negative trends in baroclinicity in a zonal band near 30S, observed during the twentieth century in winter, is likely to continue at the same rate, resulting in further decreases in the growth rates of storms at these latitudes; projected increases in baroclinicity, further poleward, will results in increased development of storms at higher latitudes. [Jorgen Frederiksen, Australia]
Rejected. It was felt that baroclinicity was too complex a term for the Executive Summary.
12-137 12 4 22 4 26 The first sentence given a specific path, other scenarios may not have such a conclusion.Should be extracted more important conclusion. [Ying Xu, China]
Accepted. Text modified. Hopefully it is now clear that this statement refers to RCP8.5.
12-138 12 4 22 26 Suggest insert in line 23: "In particular, the negative trends in baroclinicity in a zonal band near 30S, observed during the twentieth century in winter, is likely to continue at the same rate, resulting in further decreases in the growth rates of storms at these latitudes; projected increases in baroclinicity, further poleward, will results in increased development of storms at higher latitudes." [Carsten Frederiksen, Australia]
Rejected. It was felt that baroclinicity was too complex a term for the Executive Summary.
12-139 12 4 22 To increase clarity it is suggested to transform the distance in terms of degrees into a distance in terms of kilometers. [Klaus Radunsky, Austria]
Rejected. Expressing changes in degrees latitude seems appropriate to us in the context of the model resolution.
Expert and Government Review Comments on the IPCC WGI AR5 Second Order Draft – Chapter 12
Do not Cite, Quote or Distribute Page 12 of 120
Comment No
Chapter
FromPage
FromLine
To Page
To Line Comment Response
12-140 12 4 28 4 28 "remain in projected". [J. Graham Cogley, Canada] Rejected. Ungrammatical suggestion.
12-141 12 4 28 4 29 The analysis underlying these conclusions seems to be focused on DJF and JJA. Storm events in the transition seasons are also of significance for their potential impacts - do the results for MAM and SON support this statement? [Timothy Carter, Finland]
Rejected. For reasons of space, the main focus was on winter storm changes.
12-142 12 4 31 4 34 ES : A weakening of the tropical overturning (Hadley-Walker) circulation is also expected in response to the CO2 radiative effect, even in the absence of surface warming (Bony et al., 2012, in revision, see also Figure 7.21 of Chapter 7). Over ocean, the weakening of the circulation due to the CO2 direct effect amounts for about half the circulation weakening predicted by CMIP5 models at the end of the 21st century. The effect has a significant impact on regional precipitation changes, both over land and ocean. [Sandrine BONY, France]
Rejected. Too much detail for the ES.
12-143 12 4 33 4 33 "The Hadley cells are likely". [J. Graham Cogley, Canada] Rejected. The circulation is dominated by one cell.
12-144 12 4 34 4 34 "broader tropical regions" is meteorologist-speak and will be confusing to anyone else. The tropics don't change unless the orbit or geometry of the Earth changes. Suggest rephrase this. [Richard Wood, United Kingdom]
Rejected. It was felt that this was a succinct way to express this concept.
12-145 12 4 36 4 36 Please explain Brewer Dobson circulation in the Glossary. [Government of Germany] Rejected.
12-146 12 4 39 Executive Summary, Subsection Water Cycle: no time frame, no scenario indicated in any of the bullets. Could more specific information be added regarding scenarios and time frames, e.g., in the first bullet with a remark that this applies to all the subsequent bullets as well? [Thomas Stocker/ WGI TSU, Switzerland]
Accepted. Now multiple references to time frames and RCP8.5.
12-147 12 4 41 4 42 A degree of confidence should be assigned to this sentence. The chapter 11 SOD (P5 L28) rates it as very likely for the next few decades. [J. Graham Cogley, Canada]
Rejected. Humidity no longer addressed in the ES.
12-148 12 4 43 4 43 Remove "promotes changes in …lead to" so that it reads "differential warming of land and ocean exists in associated with decreases…" [Manoj Joshi, United Kingdom of Great Britain & Northern Ireland]
Rejected. Humidity no longer addressed in the ES.
12-149 12 4 44 4 45 Can "notable exceptions of tropical Africa and polar regions" be clarified? Are these projected to see increases in near-surface RH, or will they stay roughly constant? What makes them "notable"? [Government of Canada]
Rejected. Humidity no longer addressed in the ES.
12-150 12 4 48 4 48 finish the sentence after the word "uniform". The text that follows "uniform" is redundant and unecessary. [Guillermo Auad, United States of America]
Rejected. It was felt that this clause was needed to clarify the sentence, which is slightly reworded in the final draft.
12-151 12 4 50 4 50 It would be good if we could stop talking about "the carrying capacity of water in the air"…. [Olivier Boucher, France]
Accepted. Text modified.
12-152 12 4 52 4 53 This regional statement seems to be too specific for this chapter. Why mention these regions and not others? [Timothy Carter, Finland]
Accepted. Regions now indicated in a more generic way.
12-153 12 4 53 4 53 "are projected to occur during the winter". Given the careful and calibrated language of the rest of the ES it'sunclear what this means. Needs to be more precise. [Richard Wood, United Kingdom]
Accepted. Text modified.
12-154 12 4 53 Confidence in largest changes over N. Eurasia and N. America during winter? Please add a confidence/likliehood statement. [Government of United States of America]
Rejected. Regions now indicated in a more generic way.
12-155 12 4 57 "is consistent with projected changes in Hadley circulation" rewrite to be "is projected with changes in the Hadley circulatoin" [Robert Webb, United States of America]
Rejected. ‘Consistent’ is preferred as cause-and-effect cannot be separated.
12-156 12 5 1 5 2 What about projected changes in dryness for all other regions not specified here?, i.e., a global-scale statement. The reader might presume low confidence applies in all other regions (i.e., consistent with the SREX 'elsewhere there is overall low confidence....' statement) but this is not explicitly stated here. Furthermore, what about regions such as Northeast Brazil, Central America and Mexico etc., that were singled out in the SREX, but not here in chapter 12. In general, it is very difficult for a reader to reconcile the recent SREX assessment on droughts, with the statements on Soil moisture and dryness coming out of the Chapter 12 assessment. Some effort is needed in the text to clarify how the two assessments differ, and how the findings coming out of Chapter 12 should be (or should not be) compared with the SREX projections for
The request is for detail that is too much for an ES statement, but efforts were made to clarify what is consistent and what is new compared to SREX.

Expert and Government Review Comments on the IPCC WGI AR5 Second Order Draft – Chapter 12
Do not Cite, Quote or Distribute Page 13 of 120
Comment No
Chapter
FromPage
FromLine
To Page
To Line Comment Response
drought. [Thomas Stocker/ WGI TSU, Switzerland]
12-157 12 5 2 How can soil moisture not be correlated/influenced by high confidence in precipitation increases. [David Erickson, United States of America]
Soil moisture is the end product of precipitation, evapotranspiration and runoff. It does not have to follow precipitation changes only.
12-158 12 5 2 delete "Despite high confidence of projected precipitation increases in certain regions," since this is covered in a previous bullet. [Robert Webb, United States of America]
Rejected. The contrast is part of the point of this statement.
12-159 12 5 3 5 3 "confidently projected". [J. Graham Cogley, Canada] Language reviewed.
12-160 12 5 3 5 3 "Regions of confident projected increases" is unclear. Suggest rewording. [Government of Canada] Accepted, reworded to clarify.
12-161 12 5 5 5 8 These estimates are presumably from CMIP5 AOGCMs. Impacts on runoff are also considered in WG II using offline models (some of which may have used CMIP5-based projections). Regional statements such as these will need to be consistent with messages coming out of WG II. [Timothy Carter, Finland]
The assessment is based on CMIP5 GCMs. We cannot ensure consistency with WGII as their report comes after WGI.
12-162 12 5 5 8 Is this statement true for more arid regions? Please offer clarfication. [Government of United States of America]
Not clear what is meant by "more arid regions" - deserts? We are highlighting the most confident results.
12-163 12 5 6 5 7 Do the models project consistent increases or consistently project increases? The difference of meaning is significant, illustrating the importance of attaching qualifiers to the right noun or verb. See also P45 L56 and comment at P43 L54. [J. Graham Cogley, Canada]
Accepted, reworded to clarify.
12-164 12 5 10 5 21 It is important that concepts such as evaporation and evapotranspiration are being used correctly and consistently here - are they? [Timothy Carter, Finland]
Strictly speaking, transpiration is simply evaporation of water through stomata (it is not respiration). Reworded for clarity.
12-165 12 5 12 5 12 "decreases in evaporation, coincident with decreases in soil moisture, …". [J. Graham Cogley, Canada] Rejected. This is a bullet on evaporation only.
12-166 12 5 18 5 21 It's hard to determine whether the "very likely" attributed here to increases in intensity and frequency of extreme precipitation is justified in the text (thus justifying the "very likely" on global average in TFE9, Table 1). On inspection of Fig. 12.26 and 12.27 and from reading 12.4.5.5 it would appear to be the case but perhaps some better representation of the significance of these changes in the figures would be warranted (e.g. should there be stippling in Fig. 12.26?). [Lisa Alexander, Australia]
Accepted, reworded to clarify.
12-167 12 5 18 5 24 Consider to separate out the sentence about storms in a separate bullet point, and replace "arid and semi-arid" with "dry and semi-dry". Furthermore, it would be helpful if you could include examples of such regions like you do on page 47 line 56 and 57 for another finding. [Government of NORWAY]
Agree that two bullets seem better. Disagree with "dry" for "arid", as the latter is more commonly used in written English.
12-168 12 5 18 24 The bullet here is about the frequency distribution of precipitation changes. The last part is about soil moisture changes, however, which may merit its own bullet. [Government of United States of America]
Taken into account.
12-169 12 5 21 5 21 On page 48 line 28 it is also referred to large land masses of North America and wet tropical regions. This finding might also be important to include in the executive summary. [Government of NORWAY]
Summary has been rewritten to a large extent.
12-170 12 5 21 5 22 It's confusing to read "over land areas" twice in this sentence. [Jonathan Gregory, United Kingdom] Taken into account.
12-171 12 5 21 5 24 This sentence appears inconsistent with the previous paragraph in its assessment of decreases in soil moisture. In any case, "over many land areas" is repetitive and should be deleted. [J. Graham Cogley, Canada]
Checked for consistency and reworded.
12-172 12 5 22 5 22 Change "over many land areas" to "in many land areas" [Government of Canada] Reworded
12-173 12 5 23 5 23 Is it possible to provide a brief explanation to support why soil moisture that is anticipated to decrease will do so, despite storms with higher amounts of precipitation? [Government of Canada]
Soil moisture is the outcome of precip, evap, runoff. Explained in more detail in the chapter
12-174 12 5 25 5 25 Is possible to summarize here increased variability in soil freeze-thaw cycling due to changes in snow cover and warming air/ambient temperature, and soil moisture-temperature feedback that amplifies extreme
Rejected. Too detailed for an ES statement.
Expert and Government Review Comments on the IPCC WGI AR5 Second Order Draft – Chapter 12
Do not Cite, Quote or Distribute Page 14 of 120
Comment No
Chapter
FromPage
FromLine
To Page
To Line Comment Response
temperatures? [Government of Canada]
12-175 12 5 28 5 28 Likelihood level stated here for reduction in Artic sea ice is far too weak (at 'very likely', >90%). Models are unanimous in their projections and our theoretical understanding from albedo feedback and from changes in poleward transports all indicate this area will warm rapidly (indeed the most rapid on the planet), with reduced ice. The appropriate likelihood level would appear 'virtually certain'. [Government of Australia]
Rejected. "Virtually certain" is too high of a likelihood level because one cannot rule out the possibility of a collapse of the North Atlantic thermohaline circulation, which would cause the Arctic sea ice extent to increase.
12-176 12 5 28 5 31 The discussion of average reductions in sea ice extent needs to clearly describe the baseline period to which the reductions are being compared. [Government of United States of America]
Accepted. The baseline period is now mentioned.
12-177 12 5 28 5 36 NH sea ice extent has declined in recent decades at a faster rate than in simulations. Should there be some recognition of that in this para? The next para but one implies that the explanation could be internal variability alone, but I would not say that this is certain. Section 12.4.6.1 discusses these issues and the possibility of observational constraint or calibration in some detail; it would be useful to pick up more of its points in the Exec Summ. [Jonathan Gregory, United Kingdom]
Taken into account. Some simulations in the peer-reviewed literature show rates of September Arctic sea ice decline as fast as observed over the past few decades. We now present the results from a subset of models that most closely reproduce the climatological mean state and 1979-2012 trend of the Arctic sea ice cover. The criteria used to select these models are outlined in Section 12.4.6.1.
12-178 12 5 31 5 31 Use more specific wording in relation to 'by the end of the century'. [Government of Australia] Accepted. "By the end of the 21st century" has been replaced by "2081-2100".
12-179 12 5 33 5 34 I'm not sure the evidence justifies this statement - see comment on this in main text p 50 l 52-53. [Richard Wood, United Kingdom]
Accepted. This sentence has been deleted.
12-180 12 5 34 This bit seems to overlap with ch11 maybe intentional? [Gabriele Hegerl, United Kingdom] Noted. The timing of disappearance of the September Arctic sea ice is deliberately addressed in both Chapter 11 and Chapter 12 since it occurs at the boundary between the two relevant time scales.
12-181 12 5 35 5 35 "very distinct possibility". Would it be better to change this to "somewhat likely", "unlikely"- or a similar phrase? [Manoj Joshi, United Kingdom of Great Britain & Northern Ireland]
Accepted. This sentence has been rephrased and now reads: "A nearly ice-free Arctic Ocean (sea ice extent less than 1×10⁶ km2) in September before mid-century is likely under RCP8.5 (medium confidence), based on a subset of models that most closely reproduce the climatological mean state and 1979-2012 trend of the Arctic sea ice cover".
12-182 12 5 35 5 35 “a very distinct possibility”: if you cannot give a calibrated likelihood (e.g. “about as likely as not”) avoid talking about “possibility”. E.g. “As seasonally …. cannot be ruled out” [Martin Juckes, United Kingdom]
Accepted. This sentence has been rephrased and now reads: "A nearly ice-free Arctic Ocean (sea ice extent less than 1×10⁶ km2) in September before mid-century is likely under RCP8.5 (medium confidence), based on a subset of models that most closely reproduce the climatological mean state and 1979-2012 trend of the Arctic sea ice cover".
12-183 12 5 35 5 35 “within the next 50 years”: it is clearer to give a date – e.g. “by 2050” (or do you mean 2062, or perhaps 2063?). [Martin Juckes, United Kingdom]
Taken into account. This sentence has been rephrased and now reads: "A nearly ice-free Arctic Ocean (sea ice extent less than 1×10⁶ km2) in September before mid-century is likely under RCP8.5 (medium confidence), based on a subset of models that most closely reproduce the climatological mean state and 1979-2012 trend of the Arctic sea ice cover".
12-184 12 5 35 5 36 note a slightly different wording in Chapter 11 executive summary. [Olivier Boucher, France] Taken into account. This sentence has been rephrased in coordination with Chapter 11.
Expert and Government Review Comments on the IPCC WGI AR5 Second Order Draft – Chapter 12
Do not Cite, Quote or Distribute Page 15 of 120
Comment No
Chapter
FromPage
FromLine
To Page
To Line Comment Response
12-185 12 5 35 5 36 Can a likelihood statement be attached here, rather than the potentially ambiguous reference to a "very distinct possibility"? [Timothy Carter, Finland]
Accepted. This sentence has been rephrased and now reads: "A nearly ice-free Arctic Ocean (sea ice extent less than 1×10⁶ km2) in September before mid-century is likely under RCP8.5 (medium confidence), based on a subset of models that most closely reproduce the climatological mean state and 1979-2012 trend of the Arctic sea ice cover".
12-186 12 5 35 5 36 “A seasonally ice-free …., even though later dates cannot be ruled out.” Insert “onset” before “dates” (to clean up the grammatical structure). [Martin Juckes, United Kingdom]
Taken into account. This sentence has been rephrased and now reads: "A nearly ice-free Arctic Ocean (sea ice extent less than 1×10⁶ km2) in September before mid-century is likely under RCP8.5 (medium confidence), based on a subset of models that most closely reproduce the climatological mean state and 1979-2012 trend of the Arctic sea ice cover".
12-187 12 5 35 5 36 What is meany by a very distinct possibility ? Admitedly chapter 11 ES use the exact same formulation but I'd prefer calibrated uncertainty language. [Peter Stott, United Kingdom of Great Britain & Northern Ireland]
Accepted. This sentence has been rephrased in coordination with Chapter 11 and now reads: "A nearly ice-free Arctic Ocean (sea ice extent less than 1×10⁶ km2) in September before mid-century is likely under RCP8.5 (medium confidence), based on a subset of models that most closely reproduce the climatological mean state and 1979-2012 trend of the Arctic sea ice cover".
12-188 12 5 35 5 36 statement on Arctic Sea Ice on next fifty years needs to be coordinated with Ch11. Ch11 has a very similar statement in their ES (page 6, lines 16-18: "Based on an assessment of a subset of models that more closely reproduce recent observed trends, a nearly ice-free Arctic in late summer before 2050 is a very distinct possibility, even though later dates cannot be excluded"). We suggest to keep the near term statement in Ch11, but to focus here on the long term changes. [Thomas Stocker/ WGI TSU, Switzerland]
Taken into account. The timing of disappearance of the September Arctic sea ice is deliberately addressed in both Chapter 11 and Chapter 12 since it occurs at the boundary between the two relevant time scales. This sentence has been rephrased in coordination with Chapter 11 and now reads: "A nearly ice-free Arctic Ocean (sea ice extent less than 1×10⁶ km2) in September before mid-century is likely under RCP8.5 (medium confidence), based on a subset of models that most closely reproduce the climatological mean state and 1979-2012 trend of the Arctic sea ice cover".
12-189 12 5 35 Recast. [David Erickson, United States of America] Accepted. This sentence has been rephrased and now reads: "A nearly ice-free Arctic Ocean (sea ice extent less than 1×10⁶ km2) in September before mid-century is likely under RCP8.5 (medium confidence), based on a subset of models that most closely reproduce the climatological mean state and 1979-2012 trend of the Arctic sea ice cover".
12-190 12 5 36 5 36 "very distinct possibility" sounds as if you are chickening out of making an assessment, despite plenty of evidence in the chapter body. I think you could be more explicit here. [Richard Wood, United Kingdom]
Accepted. This sentence has been rephrased and now reads: "A nearly ice-free Arctic Ocean (sea ice extent less than 1×10⁶ km2) in September before mid-century is likely under RCP8.5 (medium confidence), based on a subset of models that most closely reproduce the climatological mean state and 1979-2012 trend of the Arctic sea ice cover".
12-191 12 5 38 5 40 Please indicate the level of confidence in these projected changes. [Thomas Stocker/ WGI TSU, Switzerland] Accepted. The level of confidence has been added (low).

Expert and Government Review Comments on the IPCC WGI AR5 Second Order Draft – Chapter 12
Do not Cite, Quote or Distribute Page 16 of 120
Comment No
Chapter
FromPage
FromLine
To Page
To Line Comment Response
12-192 12 5 40 Some statement of confidence would be useful. [Government of United States of America] Accepted. The level of confidence has been added (low).
12-193 12 5 42 5 43 To further clarify which scenario, many models, which time slot changes. [Ying Xu, China] Rejected. This is a general summary statement based on results from a variety of studies using several types of models and forcing scenarios. See Section 12.5.5.7 and references therein for details.
12-194 12 5 43 5 47 The evidence regarding critical thresholds seems to be based entirely on models. Are there fundamental structural factors in the models that would lead them to be unsuitable for evaluating thresholds and critical behavior? Has this been addressed at all? [Government of United States of America]
Rejected. This result is found to be consistent across a hierarchy of models in the peer-reviewed literature. Though there is some conjecture for the existence of a critical threshold beyond which summer Arctic sea ice loss is unstoppable or irreversible, this has not been found to be true in AOGCMs/ESMs even when pushed into extreme radiative forcing scenarios. It is felt that there are no missing fundamental processes regarding the sea ice system in these models. This is discussed further in Section 12.5.5.7.
12-195 12 5 43 5 47 So, is the phenomenon of positive feedback wrong, or discounted then? This seems to defy physics. [Jeffrey Obbard, Singapore]
Rejected. A positive feedback is a necessary but not sufficient condition for a tipping point. While positive feedbacks are indeed crucial for the Arctic sea ice, negative feedbacks also play an important role, e.g., the negative Planck feedback and the negative feedback of ice thickness on ice growth. This is discussed further in Section 12.5.5.7 and the references cited therein.
12-196 12 5 46 5 47 the statements in line 13 above are relevant also here (page 5, lines 46-47) [Guillermo Auad, United States of America]
Rejected. The comment is unclear. Line 13 refers to precipitation.
12-197 12 5 46 5 47 The phrase: "it appears unlikely that these results from a tipping point in the system" does not make much sense, at least for non-scientists in the field. It seems that the whole last sentence could be deleted as it does not convey any additional information compared to the sentence before. [Klaus Radunsky, Austria]
Taken into account. This phrase has been deleted.
12-198 12 5 49 5 49 Please indicate the level of confidence in these projected changes. [Thomas Stocker/ WGI TSU, Switzerland] Accepted. Very likely that SPRING snow cover extent will decrease as global temperatures rise (high confidence)
12-199 12 5 49 5 52 These sentences are unclear. The first part of this bullet point indicates that snow cover will decrease with warming and of course warming is greater with higher forcing. So, presumably "7% (RCP2.6) and 25% (RCP8.5)" are % reductions in northern hemisphere snow cover relative to present day? Otherwise, why is the % area reported to be greater with the stronger GHG forcing? [Government of Canada]
The word "reduction" was missing in this sentence and this was corrected.
12-200 12 5 49 5 53 If snow cover is reduced in the NH, why is the snow covered area greater (25%) for RCP8.5 compared to 7% for RCP2.6? [David Erickson, United States of America]
The word "reduction" was missing in this sentence. This was corrected.
12-201 12 5 49 As with many technical terms, a brief parenthetical definition of "ablation" might be helpful for the non-expert. [Government of United States of America]
We define ablation as the sum of melt and sublimation.
12-202 12 5 49 "which are opposite" - hangs. Changes are opposite in sign? [Ronald Stouffer, United States of America] Thank you. "opposite in sign".
12-203 12 5 51 5 51 "the decrease in Northern Hemisphere …". [J. Graham Cogley, Canada] Taken into account.The word "reduction" was missing and this was corrected.
12-204 12 5 51 5 51 Should be: "Projections of the decrease in the Northern Hemisphere spring snow covered area" [Jouni Räisänen, Finland]
Taken into account.The word "reduction" was missing and this was corrected.
12-205 12 5 51 5 51 Should read "Projections of the reduction in Northern Hemisphere snow area..." [Richard Wood, United Taken into account.The word "reduction" was missing

Expert and Government Review Comments on the IPCC WGI AR5 Second Order Draft – Chapter 12
Do not Cite, Quote or Distribute Page 17 of 120
Comment No
Chapter
FromPage
FromLine
To Page
To Line Comment Response
Kingdom] and this was corrected.
12-206 12 5 51 5 53 There's something odd here. It seems unlikely that RCP2.6 leads to less snow cover than RCP 8.5. Are these in fact snow cover decreases? [David Stainforth, United Kingdom]
Taken into account.The word "reduction" was missing and this was corrected.
12-207 12 5 51 5 53 I assume the changes are reductions in area covered by snow. Add word "reduction" after "snow covered area". [Ronald Stouffer, United States of America]
Taken into account.The word "reduction" was missing and this was corrected.
12-208 12 5 52 5 52 7% and 81%" -> presume these are decreases in snow covered area. Need to state this. [Thomas Stocker/ WGI TSU, Switzerland]
Taken into account.The word "reduction" was missing and this was corrected.
12-209 12 5 56 5 56 "exerts a control"- vague. Perhaps change to "inhibits permafrost loss"? [Manoj Joshi, United Kingdom of Great Britain & Northern Ireland]
Indeed, "exerts a control" is vague, but "inhibits permafrost loss" is wrong. "thermally isolates the underlying soil" is clearer.
12-210 12 5 56 5 56 "Reduction in permafrost extent" is better than "Retreat of permafrost extent" (when we use the word retreat we are usually referring to the southern boundary of permafrost) [Sharon Smith, Canada]
Taken into account.
12-211 12 6 1 6 2 Another "virtually certain" outcome of warming, which is supposed to sit alongside an only "very likely" prospect of any net warming at all by the end of the century (as mentioned in some of my other comments). [Timothy Carter, Finland]
Rejected, this is a conditional likelihood.
12-212 12 6 1 6 2 Perhaps worth mentioning linkage to carbon cycle, and anticipated contribution of disturbed carbon cycle as mentioned below? [Jeffrey Obbard, Singapore]
Rejected due to space constraints in the summary.
12-213 12 6 1 6 2 "Near surface permafrost area" is confusing terminology and what the authors are actually referring to is an increase in thaw depth. This terminology should be avoided and to some extent is meaningless. Additional comments related to this are provided below (and in Ch 11 comments). [Sharon Smith, Canada]
The term is now properly defined in the glossary to avoid misunderstandings.
12-214 12 6 3 6 3 I'm surprised that there is nothing here on changes in the Greenland and West Antarctic ice sheets. Readers of the ES will want your headline assessment. [Richard Wood, United Kingdom]
Material is assessed in Chapter 13.
12-215 12 6 6 6 6 One hopes that the chapter will have a list of acronyms near the beginning, because "AMOC" is not defined until P52. [J. Graham Cogley, Canada]
Accepted. Text modified
12-216 12 6 6 6 9 I suggest "is" instead of "remains", twice. I guess that "remains" is implying a comparison with the AR4, but the AR4 is not mentioned so the comparison is not apparent to the reader. [Jonathan Gregory, United Kingdom]
Statement reworded.
12-217 12 6 6 6 10 "Based on the available models and the literature, it remains very likely that the AMOC will weaken over the 21st century with a best estimate decrease in 2100 of about 20–30% for the RCP4.5 scenario and 36–44% for the RCP8.5 scenario. Based on the range of models and scenarios considered, it also remains very unlikely that the AMOC will undergo an abrupt transition or collapse in the 21st century and it is unlikely that the AMOC will collapse beyond the end of the 21st century.". Attempts at projecting an AMOC collapse are of critical importance. Reference needs to be made to models discussed in item 12.4.7.2 and 12.5.5.2. [Andrew Glikson, Australia]
Accepted. Statement is based on those sections and cross references are given.
12-218 12 6 6 6 10 As in 12.4.7, it is somewhat surprising that the upper ocean heat content is not mentioned here (as it is prominently in chapters 3 and 10). [European Union]
Acception. Ocean warming added in the chapter and summary.
12-219 12 6 6 6 10 Please write out the word AMOC, it is not clear what is meant. This counts also vor CMIP5 (it is mentioned already in the beginning of the executive summary but explained not until page 7) [Government of Germany]
Taken into account.
12-220 12 6 6 6 10 See comments below on section 12.4.7.2. I think the whole section (and hence this bullet) need reworking. [Richard Wood, United Kingdom]
No change requested.
12-221 12 6 6 6 10 ”AMOC” first appeared in ES should be given the full name. [Ying Xu, China] Taken into account.
12-222 12 6 8 6 10 Dismissing abrupt transitions seems a bit strong. [David Erickson, United States of America] Text reworded to clarify.
12-223 12 6 9 6 10 given that some models get the mean AMOC wrong and that Weaver et al. (2012) showed that half the Rejected. Unlikely still allows for some significant

Expert and Government Review Comments on the IPCC WGI AR5 Second Order Draft – Chapter 12
Do not Cite, Quote or Distribute Page 18 of 120
Comment No
Chapter
FromPage
FromLine
To Page
To Line Comment Response
models get the freshwater flux in the S. Atlantic wrong (probably making them more stable than reality), plus that fact that the models do not include interactive Greenland melting, this degree of confidence that AMOC will not collapse seems misplaced... [Meric Srokosz, United Kingdom of Great Britain & Northern Ireland]
chance. The next level of likelihood would be ‘about as likely as not’.
12-224 12 6 14 6 17 We found this statement to be unclear. We don't think many readers will understand the distinction between emissions and concentrations as written . [Government of United States of America]
Rejected. The explanation is included in the main text. There is not enough space in the ES.
12-225 12 6 14 6 17 60ppm with a range of +/- 70ppm in a small number of models. In this context presenting the average figure doesn't seem like an informative way of presenting the information. Presenting the range in concentrations and in temperature might be better. [David Stainforth, United Kingdom]
Accepted. It is now made clear this is the min/max range.
12-226 12 6 16 6 17 Do some models produce a smaller CO2 concentration with interactive carbon cycle? [Gunnar Myhre, Norway] Noted. Yes.
12-227 12 6 16 6 17 In sentence “The value of 60 ppm is uncertain with a range of ±70 ppm in the small number of models available.", “small number should be mentioned model number in detail. [Ying Xu, China]
Accepted. Number of models now quoted.
12-228 12 6 17 6 17 Provide number of models (out of all) which can be run in coupled mode (carbon-climate). Also note that N cycling is obviously not considered [European Union]
Accepted. Number of models now quoted. Model processes discussed in main chapter text and in Chapter 6.
12-229 12 6 17 Does this range mean that some models have LESS CO2 in the atmosphere with interactive carbon cycle? [David Erickson, United States of America]
Noted. Yes.
12-230 12 6 21 6 25 Under the long term climate change projections beyond 2100, the projections of Radiative Forcing for 2300 has been given. It would be appropriate if the projection for 2200 could be attempted, if feasible. [Government of India]
Rejected. Doesn’t add any additional important information
12-231 12 6 22 6 22 Please clarify "a warming of 8.7 C". Is this global mean surface temperature? [Government of Canada] Accepted. Text modified.
12-232 12 6 22 range in parentheses: is it likely, very likely, ... ? [Richard Wood, United Kingdom] Accepted. 5-95% CMIP5 consistent with rest of report (unless otherwise stated)
12-233 12 6 23 6 23 The current wording says "Continuosly reducing emissions beyond 2100... as in the RCP2.6"... This is incorrect, as emissions are NOT continuosly reduced after 2100 (but kept constant at various levels, for CO2 at negative levels). Replace "emissions" by "concentrations" for this sentence to be correct. [Government of Germany]
Accepted. Text modified.
12-234 12 6 24 6 25 Does "would reduce the warming to 0.6 C" mean 0.6 C above 1986-2005? Or does it mean relative to pre-industrial? This should be stated explicitly. [Government of Canada]
Accepted. Relative to 1986-2005 clarified now
12-235 12 6 27 6 29 The current wording says "If radiative forcing werre stabilized, ... ". The wording gives no indication about the time or period at which this thought experiment is taking place. If radiative forcing were stabilized after equilibrium with temperatures has been reached, by definition 100% of the equlibrium warming will have been realized. Thus, provide an indication of the timeframe, e.g. TODAY, or "CURRENT DECADE"... [Government of Germany]
Accepted. Text modified.
12-236 12 6 27 6 29 “If radiative forcing were stabilized” change to “If radiative forcing were stabilized at 2100”。 [Ying Xu, China] Accepted. Text modified.
12-237 12 6 31 34 We think that this statement is important and should be highlighted before this point in the text. [Government of United States of America]
Accepted. A shortened version appears in bold the 2nd ES statement in this section.
12-238 12 6 31 "substantially" is not really correct here for the very-long lived GHG, why not just "is longer" - besides, substantially is not a very quantitative term. [Michael Prather, United States of America]
Accepted. Text modified ‘on human time scales’
12-239 12 6 32 6 32 "non linear absorption effects". What has this to do with warming timescales? [Manoj Joshi, United Kingdom of Great Britain & Northern Ireland]
Accepted. Phrase deleted.
12-240 12 6 32 6 32 "non-linear absorption effects" It may be better to say "non-linearity of absorption effects as functions of concentration" [Taroh Matsuno, Japan]
Accepted. Phrase deleted.
Expert and Government Review Comments on the IPCC WGI AR5 Second Order Draft – Chapter 12
Do not Cite, Quote or Distribute Page 19 of 120
Comment No
Chapter
FromPage
FromLine
To Page
To Line Comment Response
12-241 12 6 33 6 33 What is the basis for the current wording saying "in much the same way as the warming"? Can IPCC conclude that the heat uptake into the oceans and out of the oceans happens symmetrically under a warming and cooling scenario (the intiution would say that there are assymmetries as their are assymmetries in response of the ocean to a volcanic eruption event). [Government of Germany]
Accepted. Statement has been rephrased.
12-242 12 6 34 Useful if you could say whether the timescales are the same for warming and cooling. I think there is literature on this. [Richard Wood, United Kingdom]
Rejected. The situation is too complex to summarise in the ES.
12-243 12 6 36 6 39 Perhaps put a time scales on fast and slow (weeks/months/years) to decades centures. [David Erickson, United States of America]
Rejected. The situation is too complex to summarise in the ES.
12-244 12 6 36 6 39 What is the major point of this para to be placed in Executive Summary? Are there any specific situation corresponding to this? If so, please be specific. [Taroh Matsuno, Japan]
Text is modified in the final draft. The point is to note that aerosol reduction will lead to quite rapid warming.
12-245 12 6 36 38 Present language: For high climate sensitivities, and in particular if sulfate aerosol emissions are eliminated at the same time as greenhouse gas emissions, the commitment from past emission can be strongly positive, and is a superposition of a fast response to reduced aerosols emissions and a slow response to reduced CO2. It is clear that the commitment referred to here is the zero emission commitment (see glossary). That stated, the sentence can be edited to read much more clearly: The zero emission commitment (commitment from prior emissions), a superposition of commitments by ghgs and tropospheric aerosols, is undoubtedly strongly positive, a consequence of the long atmospheric lifetime of ghgs (century scale) vs that of aerosols (about a week). [Stephen E Schwartz, United States of America]
Rejected. This was deemed to complex a statement for the ES.
12-246 12 6 37 We don't think the lay reader will understand "commitment". This is an important concept and we recommend that the authors consider clarifying its meaning in some way. [Government of United States of America]
Rejected. The term is clarified in the main text.
12-247 12 6 37 "can be strongly positive" isn't helpful or informative. I think this needs an order of magnitude and some indication of likely range. [Richard Wood, United Kingdom]
Accepted. Text modified.
12-248 12 6 38 "...is a superposition of a fast response to reduced aerosols emissions and a slow response to reduced CO2." Does "reduced" refer to CO2 emissions or CO2 concentrations? We recommend that this needs clarification. [Government of United States of America]
Accepted. Text modified.
12-249 12 6 41 6 41 Unclear for me if biosphere feedbacks were considered for long-time climate predictions or not. Be clear here. [European Union]
Biosphere feedbacks are now routinely included in climate models. This is implicit in the use of Earth Systems Models.
12-250 12 6 43 There is a statement here that is not clear. Should this read 'these may result in significant changes FOR hundreds of thousands of years after global temperature is stabilised? Without the word 'for' it reads that the changes don't happen until hundreds and thousands of years which is not what I think is meant? [Judy Lawrence, New Zealand]
Rejected. It seems clear to us.
12-251 12 6 46 6 51 This type of information on emission paths could also be given for the 4 RCPs (as in TS figure TFE.8, Figure 1 c). [Jan Fuglestvedt, Norway]
Rejected. This information was removed to save space in the ES.
12-252 12 6 46 6 51 As we note, it is not an integral quotation. In Chapter 12, this issue is stated in the section of “limitation and conclusion” to indicate that there are still uncertainties with the estimation of global cumulative emissions, as found between lines 55-57 of page 66, Chapter 12: “It is important to note that the cumulative budget constraint does not consider non-CO2 forcings. Also, since those ranges are based on a set of scenarios available in the literature the interpretation in terms of likelihood is difficult.” It is inappropriate for such an argument with much uncertainty to be cited as a key conclusion in the Executive Summary. Therefore, it is proposed to take out relevant words from the Executive Summary. If there is an insistence to have such elements reflected in the Executive Summary, the representation must be integral, with an emphasis placed on the fact that it is an estimate with limitations and uncertainties, coupled with a quotation of lines 55-57, page 66, Chapter 12. The same problem has been also found in Line 27-31 of Page 17, SPM, Line 9-12 of
The discussion on cumulative carbon has bee substantially revised and improved, and caveats on non CO2 are explicitly discussed. The evidence fo the linearity between global temperature change and cumulative carbon is very clear and robust across models. It is a key conclusion from the chapter, and therefore is mentioned in the summary.

Expert and Government Review Comments on the IPCC WGI AR5 Second Order Draft – Chapter 12
Do not Cite, Quote or Distribute Page 20 of 120
Comment No
Chapter
FromPage
FromLine
To Page
To Line Comment Response
Page 53, TS [Government of China]
12-253 12 6 46 6 51 Summary of AMOC change is weakly drawn and needs to be clearer. [Government of United Kingdom of Great Britain & Northern Ireland]
Rejected. It is not clear how it is weakly drawn.
12-254 12 6 46 6 51 The amount of 1000-1300 GtC seems to be a limit for the 2 degC target when CO2 only is considered, which may lead to confusion because the previous sentence mentions CO2-equivalent GHG emissions. Also, GtC and GtCO2 should be unified. [Junichi Tsutsui, Japan]
Accepted. The statement about the 2degC target now sits withing a wider stabilisation statement.
12-255 12 6 48 6 48 provide emission estimate numbers for the period 2005-2010 for comparison [European Union] Rejected. Considered to be too much information for the ES.
12-256 12 6 49 3 51 CONTINUED COMMENT FROM PREVIOUS BOX: (3) The previous sentences (as does the preambular text in the international communities agreements in Durban, 2011) refer to a "likely chance" of staying below 2C. This latter carbon budget however is derived from a BEST-ESTIMATE, hence implying only a 50:50% chance of staying below 2C. And lastly, (4) the provided timeframe "by 2100" is misguiding given that the 2C temperature target is not defined only to apply over the 21st century, but as a limit not to exceed at any moment in time. Given the definition of the TCRE, the sentence would be more correct without specifying the timeframe "by 2100". Summa summarum, these four issues could be addressed by re-phrasing this sentence into something like: "In cumulative terms, 1000-1300GtC of carbon emissions would imply a best-estimate warming of 2C only due to the effect of CO2 emissions. For having a likely chance of staying below 2C and accounting for non-CO2 forcings, the cumulative carbon emission budget would be substantially lower than 1000-1300GtC, of which about 520 GtC were emitted by 2011." [Government of Germany]
Accepted. This whole part has been extended and clarified. Non CO2 and the dependence of the budget and the likelihood are both explicitly mentioned. A budget for likely 2°C is given.
12-257 12 6 49 3 51 The current wording "In cumulative terms, the 2C temperature target implies cumulative carbon emissions by 2100 of about 1000-1300 GtC in the set of scenarios considered, of which about 520 GtC were emitted by 2011" seems to be wrong or misguiding for four reasons. (1) This budget calculation is NOT based on any "set of scenarios". The underlying language on page 12-66 explains how the 1000-1300 GtC number is derived, namely from the best-estimate range of TCRE of 1.5C to 2C warming. Thus, the number 1000-1300 GtC is hence NOT tied to a specific set of scenarios. (2) The 2C temperature target is NOT a target that concerns only the CO2-induced warming, but the total anthropogenically induced global warming. The TCRE however only refers to the CO2-induced warming, ignoring any additional warming by non-CO2 forcing agents. Thus, the real carbon budget in line with a 2C target will be lower than 1000-1300GtC, because of non-CO2 forcings (which will be positive in the future). This confusion between CO2-only induced warming and total warming is enforced by the placement of the sentence in the paragraph that starts with "Analysis of a range of multi-gas emission pathways....". COMMENT CONTINUED IN NEXT BOX. [Government of Germany]
Accepted. This whole part has been extended and clarified. Non CO2 and the dependence of the budget and the likelihood are both explicitly mentioned. A budget for likely 2°C is given.
12-258 12 6 49 6 51 The content of the last sentence in this para is entirely different from those of the previous sentences. Split the para into two. And it must be reminded that the amount of cumulative emissions is derived from CO2 only experiments. [Taroh Matsuno, Japan]
Accepted. Text modified.
12-259 12 6 49 The term "2 C temperature target" should be avoided in this report since this may be misunderstood as an indication that the IPCC reinforces/supports this particular political goal. Considering the role of IPCC to provide rigorous and balanced scientific information to policy makers, it is essential for the IPCC to keep its neutrality; therefore, the sentence is better being rephrased to address the above concern. [Government of Japan]
Rejected. It is not stated that the IPCC supports this goal. The information is included as it is a commonly discussed target. We believe this to be policy relevant not prescriptive.
12-260 12 6 50 6 50 Why to change from CO2eq to GtC. How to compare this to values mentioned one line above [European Union]
This statement now deleted.
12-261 12 6 51 It is noted that the SPM (page 17, line 30) gives a value of 545 PgC for the emissions in 2011 compared to 520 in page 12-6, line 51. It is suggested to improve coherence with respect to that figure. [Klaus Radunsky, Austria]
Accepted. Range now given.
12-262 12 6 57 7 1 The current wording "except if net anthropogenic GHG emissions were strongly negative over a sustained period". This wording might be misleading, as ideas in terms of negative GHG emissions (other than for CO2) are basically non-existent to date. Thus, replace "GHG" by "CO2". [Government of Germany]
Accepted. Text modified.
Expert and Government Review Comments on the IPCC WGI AR5 Second Order Draft – Chapter 12
Do not Cite, Quote or Distribute Page 21 of 120
Comment No
Chapter
FromPage
FromLine
To Page
To Line Comment Response
12-263 12 6 57 7 1 Delete "except if net anthropogenic GHGs emissions were strongly negative over a sustained period" There may be no readers to thik of negative emissions in the context. It is better to replace "positive commitment from " by "persistent temperture rise (or warming) due to". It is for avoiding the use of "commitment", which is a misleading word particular to climate change science community. [Taroh Matsuno, Japan]
Accepted. Now clarified to refer to CO2. Statement about cessation of aerosol emissions reworded.
12-264 12 6 Define collapse - It has been used as a large rate of change or the absence of the AMOC. Which is in view here? Absence I think. [Ronald Stouffer, United States of America]
Accepted. Discussed in detail in the chapter text.
12-265 12 6 I assume the sea level changes are discussed in other chapters. I would have thought it be mentioned here. [Ronald Stouffer, United States of America]
Sea level is discussed in Ch 13.
12-266 12 7 1 3 "The positive commitment from CO2 may be enhanced by the effect of an abrupt cessation of aerosol emissions, which will cause warming." Better to replace "enhanced" by "revealed". The warming commitmen tby the ghg's is a commitment irrespective of whether the aerosol offset is present, given the short residence time of the aerosols. [Stephen E Schwartz, United States of America]
Accepted. Text reworded.
12-267 12 7 1 4 The existing language suggests a certain symmetry in the consequences of abrupt cessation of emission of CO2 vs aerosol (precursors). In reality the consequences are very different. If aerosols are offsetting a substantial portion of ghg forcing, then a simultaneous cessation of both would result in rapid (several years) jump in global temperature to the transient sensitivity of the planet times the ghg forcing, because of the long residence times of the ghgs vs the short residence times of the aerosols. The result would be essentially the same if only aerosol (precursor) emissions were halted. But if ghg emissions were halted and aerosol (precursor) emissions maintained, there would be essentially no change in temperature, not a cooling, as indicated in the text, at least for quite some time, governed by the residence time of the ghgs. So the situation is very non symmetrical. [Stephen E Schwartz, United States of America]
Rejected. Discussion of time scales was deemed too complex for the ES.
12-268 12 7 2 7 2 Insert "cooling" before aerosols in order for the sentence to be correct (as the cessation of some "warming aerosols", i.e. Black carbon, would have the opposite effect, i.e. Not cause warming after a phase-out). [Government of Germany]
Rejected. The overall effect of aerosols is cooling so this is obvious.
12-269 12 7 2 7 3 Suggest "additional or further" warming. [David Erickson, United States of America] Rejected. Seems obvious to us.
12-270 12 7 6 7 11 “could potentially exhibit” is loose language. When first reading para it sounds like these are real risks in the vein of the movie “the day after tomorrow”, then at end of para it is unclear. SPM-15 reads “It is very unlikely that the AMOC will undergo an abrupt transition or collapse in the 21st century for the scenarios considered.” This is a far clearer statement. Perhaps page 12-7 could read in a similar way. [Government of New Zealand]
Rejected. The AMOC is included as it is discuss in the literature. Table 12.4 gives more detail.
12-271 12 7 6 7 11 The summary expresses the potential for abrupt or nonlinear changes as having "low confidence" that such events would occur during the 21st century. Table 12.3 expresses "high confidence" that several of these potential events are "unlikely" to occur. Although the two sections say essentialy the same thing, they should be consistent in how the issue is presented, or should explicitly note why there is a difference in how the confidence/likelihood is presented. [Government of United States of America]
Accepted. Table 12.3 (now 12.4) was modified accordingly.
12-272 12 7 6 7 11 West Antarctic Ice Sheet is a key component that should be added here (possibly more vulnerable than Greenland). The last sentence of this bullet is currently inconsistent with the bullet on MOC under "Changes in the Ocean" [Richard Wood, United Kingdom]
Rejected. Discussed in sea level chapter
12-273 12 7 8 7 8 Here you say sea ice loss could be abrupt or non-linear, but on p5 you say that there is no evidence for sea ice tipping-points or unstoppable changes. These statements appear to be inconsistent. [Jonathan Gregory, United Kingdom]
Sea-ice is included as it is discussed in the literature. Table 12.4 gives more detail.
12-274 12 7 9 7 9 What is implied here by "information on potential consequences"? Does this mean information characterising the events themselves or information about the impacts of such events? [Timothy Carter, Finland]
Information about the impacts of such events. We felt this was already clear.
12-275 12 7 9 7 11 This final sentence on abrupt or nonlinear changes seems too generalised and underplays the assessment given in the chapter. From Table 2.3, there are 5 instances in which you list 'high confidence' and 5 in which you list 'low confidence' regarding likelihood of events in the 21st century. We would encourage a stronger statement is made here, perhaps being explicit about those components or phenomena where you have 'high
Table 12.4 has been significantly modified in the main text.

Expert and Government Review Comments on the IPCC WGI AR5 Second Order Draft – Chapter 12
Do not Cite, Quote or Distribute Page 22 of 120
Comment No
Chapter
FromPage
FromLine
To Page
To Line Comment Response
confidence' and those where you do not. [Thomas Stocker/ WGI TSU, Switzerland]
12-276 12 7 10 7 11 "Several components or phenomena in the climate system could potentially exhibit abrupt or nonlinear changes, and some are known to have done so in the past. Examples include the Atlantic Meridional Overturning Circulation, sea ice, the Greenland ice sheet, the Amazon forest and monsoonal circulations. For some events, there is information on potential consequences, but in general there is low confidence and little consensus on the likelihood of such events over the 21st century". Unless the 5AR is strictly confined to 21st century projections (which I understand is not the case), projections into the 22nd Century are important (our grandchildren are supposed to still live at that stage). The trends indicated above (cf. collapse of the AMOC) are relevant. [Andrew Glikson, Australia]
Rejected. There is not enough information to provide an assessment on such time scales.
12-277 12 7 10 7 11 Please refer to the comments on Section 12.5.5 and Table 12.3. To focus only on the changes actually occurring in the 21st Century is limiting. Consideration should be given to the likelihood of a tipping point being crossed in the 21st century that would lead to these events occurring in the 22nd century or beyond. [Government of Australia]
Rejected. There is not enough information to provide an assessment on such time scales.
12-278 12 7 16 7 19 ECS does not merit this prominence: it was important in the 1st and 2nd reports, but here it does not have a significant role. Move to later in the sub-section. [Martin Juckes, United Kingdom]
Rejected. ECS remains important and a topic of interest.
12-279 12 7 16 7 19 "ECS" should be given the full name of ECS, given in the brackets, and the lower section of TCR treatment of the same. [Ying Xu, China]
Accepted.
12-280 12 7 16 7 24 Please see comment 301 concerning the discussion of ECS in chapters 9 and 10. Now we have ECS discussed in chapter 12 also. TCR is dicussed in chapter 10 also. Is this duplication really necessary? Can there not be better use of cross-referencing? Are the basic conclusions quantitatively the same in the three chapters? [Adrian Simmons, United Kingdom]
Noted. Constraints from the observed warming are in chapter 10, constraints from models in 9, constraints form paleo in chapter 6, the synthesis in Box 12.2. Cross references were added.
12-281 12 7 16 (a) I would probably not characterize model advances relevant to Charney climate sensitivity as “considerable”, that seems an overstatement; (b) this statement implies that models are the only constraints, what about past climate changes which I thought were at least as important? [Steven Sherwood, Australia]
Accepted. Statement reworded.
12-282 12 7 17 7 17 I'd add the word "global" before the word "climate" unless the sentence does not refer to a global climate which is unclear to this reviewer [Guillermo Auad, United States of America]
Accepted. Statement reworded.
12-283 12 7 17 7 17 "climate sensitivity" It may be better to change to "equilibrium climate sensitiveity(ECS)" [Taroh Matsuno, Japan]
Accepted
12-284 12 7 17 define “climate sensitivity” [Andreas Sterl, Netherlands] Rejected. These are defined in the glossary, and in Box 12.2
12-285 12 7 17 I think it should read "...equilibrium climate sensitivity..." [Richard Wood, United Kingdom] Accepted
12-286 12 7 18 7 21 Given that this is the summary for the chapter, suggest explaining ECS and TCR a little more so that the concepts are understood. [Government of Canada]
Rejected due to space constraints. These are defined in the glossary, and in Box 12.2
12-287 12 7 19 7 19 It is the first time that "ECS" is mentioned, please write the full meaning "Equilibrium Climate Sensitivity" and put the acronym in brackets "(ECS)". In that context please take note that in the glossary not all of these parameters can be found completely. It should be supplemented. [Government of Germany]
Rejected due to space constraints. These are defined in the glossary, and in Box 12.2
12-288 12 7 19 7 19 I have gazed at Box 12.2, Fig. 1 for ages and apart from Libadoni and Forest I am really struggling to see why ECS greater than 5 is not very unlikely when “very unlikely” is 0-10%. I really cannot see 10% of evidence or anything close to 10% being above 5K let alone 6-7K. Who were the experts who expertly judged this on p.65 line 26? I think this process needs to be “owned” - was it all CAs of IPCC WG1, CAs of this chapter? [David Sexton, United Kingdom]
Noted. Very unlikely changed to 6K. Some PPE models go higher, and there is the possibility that all models are missing something.
12-289 12 7 19 define ECS [Andreas Sterl, Netherlands] Rejected due to space constraints. These are defined in the glossary, and in Box 12.2
12-290 12 7 21 7 21 The AR4 conclusion for TCR was that there was a 10% likelihood of it being below 1C and 10% likelihood of Rejected due to space constraints. Box 12.2 and
Expert and Government Review Comments on the IPCC WGI AR5 Second Order Draft – Chapter 12
Do not Cite, Quote or Distribute Page 23 of 120
Comment No
Chapter
FromPage
FromLine
To Page
To Line Comment Response
being above 3C – here there is a 10% chance of being outside 1-3C: is this change intended? [Martin Juckes, United Kingdom]
chapter summary provide more details.
12-291 12 7 21 7 24 It may be better to mention the superiority of TCR to ECS first. Something like " Transient climate sensitivity (TCR) is a better determined (or less spread) indicator than ECS, and is very likely in the range---" [Taroh Matsuno, Japan]
Accepted. Statement reworded.
12-292 12 7 21 7 24 The ESS higher than ECS. The reasons why (changes in CO2, and GHG) need mentioned here. [Ronald Stouffer, United States of America]
Rejected due to space constraints. This is discussed in Box 12.2 and section 12.5
12-293 12 7 22 7 24 Comments on ESS belong in the ECS paragraph. [Martin Juckes, United Kingdom] Accepted. Statements rewritten.
12-294 12 7 22 7 24 This sentence seems out of place. I think it belongs with the previous bullet, or as a separate bullet straijght after the previous one. [Richard Wood, United Kingdom]
Accepted. Statements rewritten.
12-295 12 7 22 7 34 The inclusion of two new metrics (ESS and TCRE) is an advance but they will be unfamiliar to most readers. I think it's worth introducing them in a separate bullet (however see comment on TCRE bullet below) [Richard Wood, United Kingdom]
Accepted. Statements rewritten.
12-296 12 7 26 7 34 Summary of TCR is weakly drawn - an explanation of how it is defined needs to be included in the summary. [Government of United Kingdom of Great Britain & Northern Ireland]
Rejected due to space constraints in the summary. Information is given in Box 12.2.
12-297 12 7 26 7 34 This bullet seems too complicated for the ES. There are so many qualifiers that it's hard to discern the message. I think it needs drastic simplification for the ES. [Richard Wood, United Kingdom]
Accepted. Statement partly rewritten, but some caveats are important.
12-298 12 7 27 7 29 It is better to stop the first sentence at "----independent of the scenario." Then bring the second sentence to follow it, because it explains the reason why scenario independent. And after that mention about model dependency. Here and in many other places Pg must be replaced by Eg(Exa gram). [Taroh Matsuno, Japan]
Accepted. Statements rewritten. Unit typo fixed.
12-299 12 7 28 7 28 What is "model airborne fraction"? [Government of Canada] Rejected. Airborne fraction is a well defined quantity.
12-300 12 7 30 7 30 Is the unit correct here? I.e. emission of 1 GtC (or 1 PgC) leads to a temperature increase of 0.8-3°C? Anthropogenic C emissions per year are already 6-8 GtC. Why the switch from GtC (used before) to PgC? Stay consistent [European Union]
Accepted. Fixed unit typo.
12-301 12 7 30 7 31 Correction: 1 Pg = 109 metric tons [Government of New Zealand] Accepted. Fixed.
12-302 12 7 30 7 31 PgC is not 10^12 (tera) metric tons of carbon. [Junichi Tsutsui, Japan] Accepted. Fixed.
12-303 12 7 30 7 32 Should be EgC (10^18 gC). PgC is only 10^15 gC 10^9 tC. This error in units is repeated several times later in the text. [Jouni Räisänen, Finland]
Accepted. Fixed.
12-304 12 7 30 7 32 change Pg to --> 1000 Pg (in PgC-1 and for PgC) [Thomas Stocker/ WGI TSU, Switzerland] Accepted. Fixed.
12-305 12 7 30 35 We find this passage unclear. Please consider revising it. [Government of United States of America] Rejected. Comment unclear.
12-306 12 7 30 ! Here and througout the chapter: please check units, it seems that PgC is used where it should be 1000 PgC or EgC? [Government of Germany]
Accepted. PgC is used.
12-307 12 7 36 8 16 Please consider including additional dot points in this section that reflect the wording from both 12-17 (39-42) re the need for coherent multivariate input (coherent rainfall, temperature and evaporation projections are very important for water resources impacts) and also 12-74 (36-39) re the need for multiple scenarios and models as a standard choice. [Government of Australia]
Rejected. We consider this more WGII territory.
12-308 12 7 36 8 16 I think this last section of the executive summary could be better as the first one as it describes the evidence on which the rest of the summary is based, plus qualifies the types of uncertainty that have been considered, and finally, covers what most people want to know – is there any difference in general between AR4 and CMIP5 runs. Just a thought! [David Sexton, United Kingdom]
Accepted. Text moved to top of ES.
12-309 12 7 36 We suggest to remove this qualitative, descriptive section of "Scenarios, Ensembles and Uncertainties" from the Executive Summary. We suggest to integrate the one "likely" statement from the ES subsection from page
Accepted. A more concise statement is now at the top of the ES

Expert and Government Review Comments on the IPCC WGI AR5 Second Order Draft – Chapter 12
Do not Cite, Quote or Distribute Page 24 of 120
Comment No
Chapter
FromPage
FromLine
To Page
To Line Comment Response
8, line 7/8 elsewhere in the ES. Cutting this section would also help to focus the ES on the key findings. In our opinion, the Chapter 12 ES could be substantially shortened, and we therefore encourage the authors to focus and condense to the extent possible. [Thomas Stocker/ WGI TSU, Switzerland]
12-310 12 7 38 7 54 These paras are out of place, since they describe ideas and concepts that have already been used in the Exec Summ without being explained. I suggest that they should either appear earlier or be omitted. [Jonathan Gregory, United Kingdom]
Accepted. Text moved to top of ES.
12-311 12 7 38 8 16 Given the ES is already long should this information be included in the ES in this detail ? [Peter Stott, United Kingdom of Great Britain & Northern Ireland]
Accepted. A more concise statement is now at the top of the ES
12-312 12 7 44 Suggest "with respect to aerosols and land use particularly" → "especially aerosols and land use" [Richard Wood, United Kingdom]
Rejected. This section now shortened considerably.
12-313 12 7 48 7 48 Replace "oft" with "of" [Government of Germany] Accepted. Text modified
12-314 12 7 48 7 48 "... quantification oft the physical response ..." "oft" appears to be a typo. [Gan Zhang, United States] Accepted. Text modified
12-315 12 7 48 Typo (oft) [David Erickson, United States of America] Accepted. Text modified
12-316 12 7 56 8 5 It took me a while to work out that this bullet was talking about pattern scaling. Can you make that more explicit? [Richard Wood, United Kingdom]
The bullet has been incororated into a larger one that addresses uncertainties and consistencies in projections and pattern scaling is explicitly mentioned as a technique that exploits the stability of the robust geographical patterns emerging through the transient simulations.
12-317 12 7 56 8 5 The sentence might be clearer if you state the conditions under which pattern scaling is valid! Overall I think this bullet would benefit from a rewrite. [Richard Wood, United Kingdom]
It has been indeed rewritten and incorporated into a larger discussion (see previous answer).
12-318 12 7 56 Suggest "geographical patterns" → "some geographical patterns" [Richard Wood, United Kingdom] We have added the qualifier "large-scale" before geographic patterns, since they are in fact those that shows robustness across time and scenarios. We believe that "some" would have been too generic and risked providing the impression that the pattern could be isolated in space, while it is in the stability of "global" patterns that the value of the pattern scaling technique resides.
12-319 12 7 57 8 2 The current wording "There remain limitations to the validity of the technique ... Other than average temperature and precipitation" has two issues: Firstly, the reader might not know that you refer to the "technique" of pattern scaling. Secondly, "precipitation" pattern scaling has various challenges, although not insurmountable, namely due to the local/regional influences of aerosols as well as the tropospheric radiationn budget and hence the dependency on GHG forcing itself. Maybe revise the sentence to something like "There remain limitations to the validity of scaling these patterns with global mean temperature only, particularly when it is applied to strong mitigation scenarios, to scenarios where localised forcing (e.g. aerosols) are significant and vary in time and for variables other than avarage temperature." [Government of Germany]
We have adopted the suggested language verbatim in the rewritten version of this bullet.
12-320 12 8 7 8 16 This comparison between CMIP3 and CMIP5 is very important background information for the reader. I'm not sure that this is the best location for such a conclusion, but I can understand the authors' positioning of it here. It allows for nuances in the CMIP5-based results to be communicated in full, without the messages being undermined by a statement declaring that the overall conclusions depart little from the AR4. [Timothy Carter, Finland]
Noted.Thank you.
12-321 12 8 7 8 16 This somewhat makes this huge effort seem a abit redundant. [David Erickson, United States of America] Noted. However, we believe that in fact the consistency between successive modeling efforts and assessments should be a source of confidence and should strengthen the findings of this new
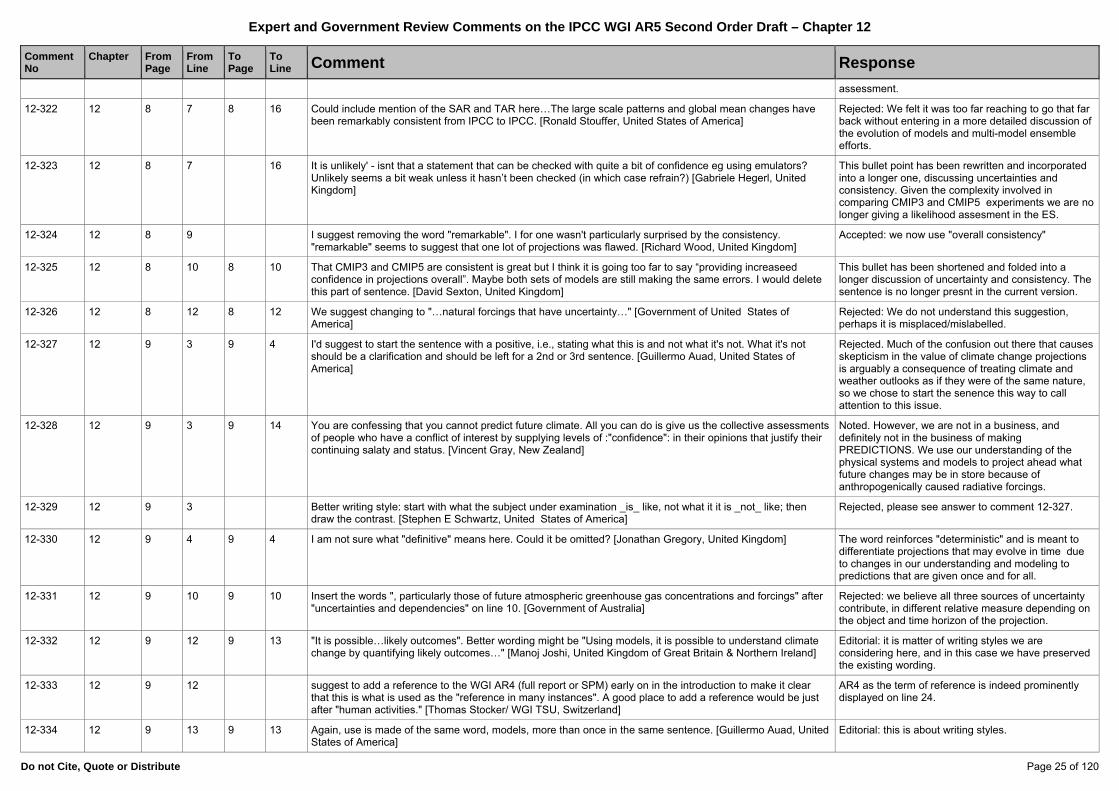
Expert and Government Review Comments on the IPCC WGI AR5 Second Order Draft – Chapter 12
Do not Cite, Quote or Distribute Page 25 of 120
Comment No
Chapter
FromPage
FromLine
To Page
To Line Comment Response
assessment.
12-322 12 8 7 8 16 Could include mention of the SAR and TAR here…The large scale patterns and global mean changes have been remarkably consistent from IPCC to IPCC. [Ronald Stouffer, United States of America]
Rejected: We felt it was too far reaching to go that far back without entering in a more detailed discussion of the evolution of models and multi-model ensemble efforts.
12-323 12 8 7 16 It is unlikely' - isnt that a statement that can be checked with quite a bit of confidence eg using emulators? Unlikely seems a bit weak unless it hasn’t been checked (in which case refrain?) [Gabriele Hegerl, United Kingdom]
This bullet point has been rewritten and incorporated into a longer one, discussing uncertainties and consistency. Given the complexity involved in comparing CMIP3 and CMIP5 experiments we are no longer giving a likelihood assesment in the ES.
12-324 12 8 9 I suggest removing the word "remarkable". I for one wasn't particularly surprised by the consistency. "remarkable" seems to suggest that one lot of projections was flawed. [Richard Wood, United Kingdom]
Accepted: we now use "overall consistency"
12-325 12 8 10 8 10 That CMIP3 and CMIP5 are consistent is great but I think it is going too far to say “providing increaseed confidence in projections overall”. Maybe both sets of models are still making the same errors. I would delete this part of sentence. [David Sexton, United Kingdom]
This bullet has been shortened and folded into a longer discussion of uncertainty and consistency. The sentence is no longer presnt in the current version.
12-326 12 8 12 8 12 We suggest changing to "…natural forcings that have uncertainty…" [Government of United States of America]
Rejected: We do not understand this suggestion, perhaps it is misplaced/mislabelled.
12-327 12 9 3 9 4 I'd suggest to start the sentence with a positive, i.e., stating what this is and not what it's not. What it's not should be a clarification and should be left for a 2nd or 3rd sentence. [Guillermo Auad, United States of America]
Rejected. Much of the confusion out there that causes skepticism in the value of climate change projections is arguably a consequence of treating climate and weather outlooks as if they were of the same nature, so we chose to start the senence this way to call attention to this issue.
12-328 12 9 3 9 14 You are confessing that you cannot predict future climate. All you can do is give us the collective assessments of people who have a conflict of interest by supplying levels of :"confidence": in their opinions that justify their continuing salaty and status. [Vincent Gray, New Zealand]
Noted. However, we are not in a business, and definitely not in the business of making PREDICTIONS. We use our understanding of the physical systems and models to project ahead what future changes may be in store because of anthropogenically caused radiative forcings.
12-329 12 9 3 Better writing style: start with what the subject under examination _is_ like, not what it it is _not_ like; then draw the contrast. [Stephen E Schwartz, United States of America]
Rejected, please see answer to comment 12-327.
12-330 12 9 4 9 4 I am not sure what "definitive" means here. Could it be omitted? [Jonathan Gregory, United Kingdom] The word reinforces "deterministic" and is meant to differentiate projections that may evolve in time due to changes in our understanding and modeling to predictions that are given once and for all.
12-331 12 9 10 9 10 Insert the words ", particularly those of future atmospheric greenhouse gas concentrations and forcings" after "uncertainties and dependencies" on line 10. [Government of Australia]
Rejected: we believe all three sources of uncertainty contribute, in different relative measure depending on the object and time horizon of the projection.
12-332 12 9 12 9 13 "It is possible…likely outcomes". Better wording might be "Using models, it is possible to understand climate change by quantifying likely outcomes…" [Manoj Joshi, United Kingdom of Great Britain & Northern Ireland]
Editorial: it is matter of writing styles we are considering here, and in this case we have preserved the existing wording.
12-333 12 9 12 suggest to add a reference to the WGI AR4 (full report or SPM) early on in the introduction to make it clear that this is what is used as the "reference in many instances". A good place to add a reference would be just after "human activities." [Thomas Stocker/ WGI TSU, Switzerland]
AR4 as the term of reference is indeed prominently displayed on line 24.
12-334 12 9 13 9 13 Again, use is made of the same word, models, more than once in the same sentence. [Guillermo Auad, United States of America]
Editorial: this is about writing styles.

Expert and Government Review Comments on the IPCC WGI AR5 Second Order Draft – Chapter 12
Do not Cite, Quote or Distribute Page 26 of 120
Comment No
Chapter
FromPage
FromLine
To Page
To Line Comment Response
12-335 12 9 26 9 26 SRES could be defined here? [John Caesar, United Kingdom of Great Britain & Northern Ireland] It is now written out
12-336 12 9 26 9 26 I can not find the definition of SRES in this Chapter. Although I don´t know if this was given before. RCPs are defined here though. [Natalia Calvo, Spain]
It is now written out
12-337 12 9 26 9 26 SRES should be defined here along with reference. [European Union] It is now written out
12-338 12 9 34 9 34 “leading order measures ...”: it is not clear what ECS is measuring. [Martin Juckes, United Kingdom] Accepted. Rewritten.
12-339 12 9 37 9 49 could be merged into one bullet. [David Erickson, United States of America] Noted, but we have chosen to separate model development from the design of new sets of experiments within CMIP5.
12-340 12 9 38 9 42 Is this consistent with the summary of chapter 9? (It is not entirely obvious when reading the introduction to chapter 9.1.3) [European Union]
Consistency across chapters has been checked.
12-341 12 9 46 9 47 The diff between concentration-driven and emission-driven models and the implications on the results are not clear enough. Please improve explanations. [Government of Germany]
We have a later section of the chapter that deals in details with this issue. This is just an introduction.
12-342 12 9 51 14 49 “Techniques to assess and quantify uncertainties ….. probability density functions (PDFs) ...”: given that it is possible to derive PDFs, why are such a confusing range of ad hoc approaches discussed in Box 1? Is there some technical limitation which prevents PDFs being derived on a grid point basis? [Martin Juckes, United Kingdom]
Yes, we can use many different methodologies and models to explore uncertainty at global scale, thus better characterizing it and quantifying it. At regional scales we can only use a very limited set of models, which, as an ensemble, are difficult to interpret statistically, as we explain in the uncertainty section of this chapter.
12-343 12 9 53 9 53 "multi-model," should be "multi-model ensembles," [Manoj Joshi, United Kingdom of Great Britain & Northern Ireland]
Accepted and reworded accordingly
12-344 12 9 53 9 54 Suggest insert "ensemble" after "multi-model", and put the text "an ad hoc measure of the possible range of projections" in parentheses, for clarity. [Richard Wood, United Kingdom]
Accepted and reworded accordingly
12-345 12 10 1 10 1 The text in the legend box is almost completely illegible because it's too small.Furthermore, the numbers on the Y axis are too close to the axis for easy reading. [Peter Clift, United States of America]
Not sure what Figure this comment is referring to.
12-346 12 10 1 10 4 Suggestion to move this information to the TS and the SPM. It is very interesting to the reader to understand why IPCC changes the ref periods. [Government of Germany]
Noted
12-347 12 10 2 10 2 Suggest removing "While not an advance, as time has moved on" and starting the sentence with "The reference baseline…" [Government of Canada]
Editorial: Stylistic suggestion that we took the liberty of not following.
12-348 12 10 2 10 2 Remove "While not an advance" [Manoj Joshi, United Kingdom of Great Britain & Northern Ireland] Editorial: Stylistic suggestion that we took the liberty of not following.
12-349 12 10 2 10 3 We suggest deletion of "While not an advance" in this sentence. [Government of United States of America] Editorial: Stylistic suggestion that we took the liberty of not following.
12-350 12 10 2 10 6 This needs to be explained very carefully. [David Erickson, United States of America] Noted.
12-351 12 10 2 10 6 As discussed in the general comment above, many methods for applying projections involve the application of 'change factors' to the climate of the 'baseline' period (defined as 1986-2005). However, there is no acknowledgement here of the difficulties of characterising an appropriate baseline 'climate' using a 20 year period for areas that have high interannual/decadal variability in rainfall and streamflow (e.g. SE Australia where 20 yr moving averages in streamflows can deviate more than +/- 20% from the long term average). Prudhomme et al (2010) J Hydrology 390, 198-209 (Section 4) discuss the fact that this baseline issue is a non-trivial one. The discussion about internal variability 12-12 (12-29) is relevant to the baseline issue, which is also further complicated by the fact that there is already a climate change "signal' in the specified baseline period. An explicit recognition of these difficulties (i.e. the fact that 'baseline uncertainty' may be significant) in this part of Chapter 12 would be desirable. [Also in SPM, TS, Ch 9] [Government of Australia]
We address the issue of internal variability in the uncertainty section of the chapter, explicitly recognizing that no amount of averaging can get rid of it entirely, and discussing the relative importance of the source of variability depending on the regional scale, the time scale and thevariable of interest. We also refer to the treatment of this theme in Chapter 11.

Expert and Government Review Comments on the IPCC WGI AR5 Second Order Draft – Chapter 12
Do not Cite, Quote or Distribute Page 27 of 120
Comment No
Chapter
FromPage
FromLine
To Page
To Line Comment Response
12-352 12 10 4 10 5 It could be noted that chapter 7 and 8 give values relative to pre-industrial times [Jan Fuglestvedt, Norway] We will cross reference these chapters if/when treating a topic that involves them directly.
12-353 12 10 5 "born" → "borne" (I think!) [Richard Wood, United Kingdom] Editorial
12-354 12 10 6 10 6 Insert the word "anthropogenic" before "climate change has also occurred. The sentence doesn't make much sense if the climate change is natural. [Government of Australia]
Accepted and "anthropogenically forced" has been inserted.
12-355 12 10 6 Occasionally in the chapter you discuss the policy-relevant temperature change of 2 deg C above preindustrial. To avoid confusion I suggest you mention this explicitly here and say what 2 deg C above preindustrial is relative to the 1986-2005 baseline. [Richard Wood, United Kingdom]
We address targets in Table 12.3 which explains that an offset of 0.61C should be considered when translating from pre-industrial to the 1986-2005 baseline.
12-356 12 10 10 10 10 Is "unique" the appropriate word to use in this situation? Consider whether "significant" would be more appropriate. [Government of Australia]
Editorial
12-357 12 10 10 10 10 Changes being "interesting" or "unique" makes them attractive to scientific curiosity, but that alone is not a reason to include them in a policy-relevant assessment of science. [Jonathan Gregory, United Kingdom]
Editorial
12-358 12 10 17 10 19 Two recent references could be provided as an exampe (e.g.) of such regional models. I'd suggest for western boundary currents: Sun, Chaojiao, Ming Feng, Richard J. Matear, Matthew A. Chamberlain, Peter Craig, Ken R. Ridgway, Andreas Schiller, 2012: Marine Downscaling of a Future Climate Scenario for Australian Boundary Currents. J. Climate, 25, 2947–2962. doi: http://dx.doi.org/10.1175/JCLI-D-11-00159.1 and for eastern boundary currents Auad, G., A. Miller, and E. Di Lorenzo (2006), Long-term forecast of oceanic conditions off California and their biological implications, J. Geophys. Res., 111, C09008, doi:10.1029/2005JC003219. [Guillermo Auad, United States of America]
Rejected: This is an introduction and the statement is meant to remain general, so we do not consider appropriate to cite specific literature on the matter.
12-359 12 10 18 10 18 "may be" is surprising. It seems to mean that you are not sure whether you mention RCMs in the chapter! :-) [Jonathan Gregory, United Kingdom]
Editorial
12-360 12 10 30 10 30 Regarding the use of "summer of 2011", please use an alternative descriptor i.e. "mid 2011". This report will be read by people from both the northern and southern hemispheres. [Government of Australia]
Accepted: this has been corrected using mid-2011.
12-361 12 10 36 Why just one ensemble member? [David Erickson, United States of America] in order to treat all models the same -- models with more ensemble members would end up getting more weight than models with fewer ensemble members. Added explanation.
12-362 12 10 41 Figure 12.1: columns/rows shown in the figure table need to be explained, in particular the variables given that the models contributing are listed in Table 12.1. A list of variables and abbreviations used needs to be provided, perhaps as Suppl.Material if you prefer not to have it in the Chapter. In addition, a reference to the PCMDI CMIP5 website would seem appropriate. [Thomas Stocker/ WGI TSU, Switzerland]
We decided against a look up table for the variables but we refer to the official list on the CMIP5 official publication describing the protocol and the online references associated with it.
12-363 12 10 47 10 51 Please give information on the different model types (IAM, EMICS, ESM, GCM) in chapter 12 or chapter 9. [Government of Germany]
Accepted: we refer to Chapter 9 where the different types of models are considered.
12-364 12 10 55 10 57 The phrasing of the text impliest that there has been no progress in understanding future climate change since AR4. We don't believe that the text here is expressing the point that the authors are trying to make, presumably that the sources of uncertainty identified in AR4 remain sources of uncertainty in AR5. The phrasing here needs to be clarified to distinguish between the current state of understanding (which has progressed considerably) and the fact that the major areas of uncertainty are not easily overcome (if that is at all possible). [Government of United States of America]
Accepted: We rephrased to distinguish between sources of uncertainties (which are still the same) and uncertainties themselves (for which we may have improved our understanding/characterization/quantification).
12-365 12 10 55 suggest to add a reference to Chapter 11, Section 11.3.1.1 "Uncertainty in Near-Term Climate Projections" and their Figure 11.11 when discussing source of uncertainty in climate projections. This complements nicely your discussion of the uncertainties in mid- to long-term climate projections in Section 12.2.2 [Thomas Stocker/ WGI TSU, Switzerland]
Accepted: we have made reference to the section and Figure in Chapter 11.

Expert and Government Review Comments on the IPCC WGI AR5 Second Order Draft – Chapter 12
Do not Cite, Quote or Distribute Page 28 of 120
Comment No
Chapter
FromPage
FromLine
To Page
To Line Comment Response
12-366 12 11 1 11 1 these maps are so small as to be effectively illegible. They really should be increased in size and spread over several pages if necessary [Peter Clift, United States of America]
Rejected: the point of the figure is not to focus on the maps details but to provide in a snapshot the possibility of comparing large scale differences across models.If the differences do not pop out of this representation they are non-significant with respect to the point that we are making here, talking about model differences in very general terms.
12-367 12 11 1 11 1 As well as obs constraints, how about adding “expert judgement such as choice of method, choice of observations, parameter ranges”. This would make this sentence more consistent with p.16 lines 29-36 and 38-43. [David Sexton, United Kingdom]
Accepted: We have rephrased the sentence and added in particular a mention of the role of "expert judgment", which seemed the key missing point in the discussion.
12-368 12 11 3 11 4 "the notion that models have intrinsic shortcoming in fully and accurately representing the real syste" rewrite as "the understanding that models have intrinsic shortcomings in fully and accurately representing the real syste" [Robert Webb, United States of America]
Accepted and rephrased according to suggestion.
12-369 12 11 5 11 5 Suggest changing "quantification of model spread and ranges" to "quantification of a best estimate for prediction uncertainty arising from variation across a collection or ensemble of models". (Note that 'model range and model spread' is first defined later i.e. page 12, line 51). Could also add here "The uncertainty for an ensemble is highly dependent on how well the models have been selected to sample the full probability distribution on plausible climate system outcomes." This is further discussed in section 12.2.3. [Government of Canada]
Rejected: The suggested text implies further reasoning and processing, while here we are using model spread and ranges as simple descriptive statistics *in contrast* with more reasoned assessments.
12-370 12 11 17 11 17 Only "subtly"? I think this word could be omitted. [Jonathan Gregory, United Kingdom] Accepted: we dropped the word subtly.
12-371 12 11 20 11 21 If I understand that correctly emission fields can be modified by ESM internally. Nevertheless, a feedback of the biosphere to climate change, i.e. changes e.g. in CO2/N2O/CH4 biosphere-atmosphere exchange, is not foreseen. If so, this should be stated clearly [European Union]
Noted, except, the point we are trying to make is different, we mean to say that IAMs did not compute emissions in a way that perfectly achieved the final radiative forcings of the specified RCPs. We have rephrased the sentence which is now hopefully clearer.
12-372 12 11 32 11 32 The references to the SRES report in this chapter appear to vary between IPCC, 2000 and Nakicenovic. Are these referring to the same document? [John Caesar, United Kingdom of Great Britain & Northern Ireland]
Editorial, but we made it consistent now across the chapter.
12-373 12 11 32 11 32 Reference for SRES here is Nakicenovic, but inconsistent with elsewhere e.g. p18, line 13 where IPCC, 2000 is used. These are also both cited in the references. [European Union]
Editorial, but we made it consistent now across the chapter.
12-374 12 11 34 11 38 suggest to refer to section 12.3 here [Thomas Stocker/ WGI TSU, Switzerland] Accepted: reference made.
12-375 12 11 39 Perhaps add a variety of combinations of greenhouse gases and aerosols can result in the same RCP. [David Erickson, United States of America]
Accepted and added this point to the text.
12-376 12 11 40 11 40 "need to produce scenarios more efficiently". This seems vague [Manoj Joshi, United Kingdom of Great Britain & Northern Ireland]
Noted: we rewrote the sentence describing the parallel process (RCPs/SSPs) better.
12-377 12 11 46 11 47 are the RCPs all "considered equally plausible" or just "considered plausible"? The former was used in AR4 with the SRES scenarios. [Thomas Stocker/ WGI TSU, Switzerland]
We use "plausible" only as we don't think we can put any probability on the scenarios, thus neither "equal" probability. RCPs include 3 mitigation scenarios, so we would get into dangerous policy making territory if we assigned equal probability to different mitigation assumptions. We added that no study has questioned their technical feasibility, which is what is meant by plausible.
12-378 12 11 53 Add "climate" before "models". [Ronald Stouffer, United States of America] Accepted, it is now climate models.
12-379 12 11 55 12 6 This is very interesting information, but difficult to understand for readers who are not familiar with the Noted, and we explained that different models would
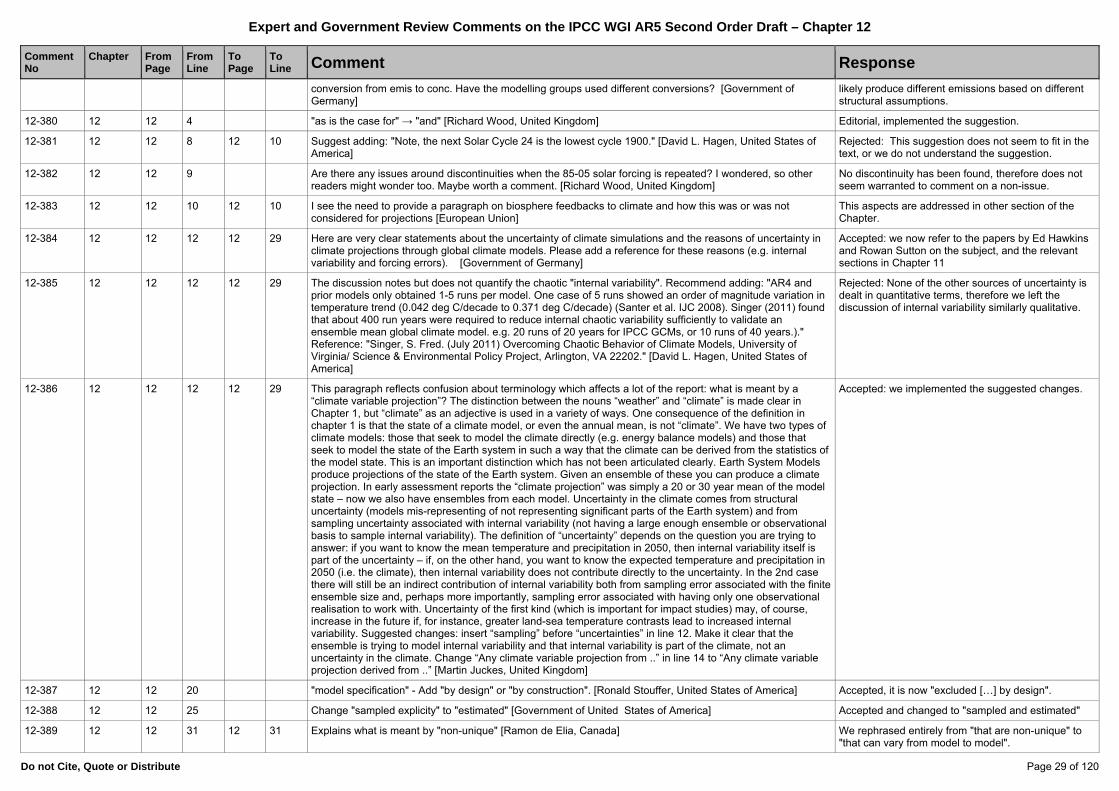
Expert and Government Review Comments on the IPCC WGI AR5 Second Order Draft – Chapter 12
Do not Cite, Quote or Distribute Page 29 of 120
Comment No
Chapter
FromPage
FromLine
To Page
To Line Comment Response
conversion from emis to conc. Have the modelling groups used different conversions? [Government of Germany]
likely produce different emissions based on different structural assumptions.
12-380 12 12 4 "as is the case for" → "and" [Richard Wood, United Kingdom] Editorial, implemented the suggestion.
12-381 12 12 8 12 10 Suggest adding: "Note, the next Solar Cycle 24 is the lowest cycle 1900." [David L. Hagen, United States of America]
Rejected: This suggestion does not seem to fit in the text, or we do not understand the suggestion.
12-382 12 12 9 Are there any issues around discontinuities when the 85-05 solar forcing is repeated? I wondered, so other readers might wonder too. Maybe worth a comment. [Richard Wood, United Kingdom]
No discontinuity has been found, therefore does not seem warranted to comment on a non-issue.
12-383 12 12 10 12 10 I see the need to provide a paragraph on biosphere feedbacks to climate and how this was or was not considered for projections [European Union]
This aspects are addressed in other section of the Chapter.
12-384 12 12 12 12 29 Here are very clear statements about the uncertainty of climate simulations and the reasons of uncertainty in climate projections through global climate models. Please add a reference for these reasons (e.g. internal variability and forcing errors). [Government of Germany]
Accepted: we now refer to the papers by Ed Hawkins and Rowan Sutton on the subject, and the relevant sections in Chapter 11
12-385 12 12 12 12 29 The discussion notes but does not quantify the chaotic "internal variability". Recommend adding: "AR4 and prior models only obtained 1-5 runs per model. One case of 5 runs showed an order of magnitude variation in temperature trend (0.042 deg C/decade to 0.371 deg C/decade) (Santer et al. IJC 2008). Singer (2011) found that about 400 run years were required to reduce internal chaotic variability sufficiently to validate an ensemble mean global climate model. e.g. 20 runs of 20 years for IPCC GCMs, or 10 runs of 40 years.)." Reference: "Singer, S. Fred. (July 2011) Overcoming Chaotic Behavior of Climate Models, University of Virginia/ Science & Environmental Policy Project, Arlington, VA 22202." [David L. Hagen, United States of America]
Rejected: None of the other sources of uncertainty is dealt in quantitative terms, therefore we left the discussion of internal variability similarly qualitative.
12-386 12 12 12 12 29 This paragraph reflects confusion about terminology which affects a lot of the report: what is meant by a “climate variable projection”? The distinction between the nouns “weather” and “climate” is made clear in Chapter 1, but “climate” as an adjective is used in a variety of ways. One consequence of the definition in chapter 1 is that the state of a climate model, or even the annual mean, is not “climate”. We have two types of climate models: those that seek to model the climate directly (e.g. energy balance models) and those that seek to model the state of the Earth system in such a way that the climate can be derived from the statistics of the model state. This is an important distinction which has not been articulated clearly. Earth System Models produce projections of the state of the Earth system. Given an ensemble of these you can produce a climate projection. In early assessment reports the “climate projection” was simply a 20 or 30 year mean of the model state – now we also have ensembles from each model. Uncertainty in the climate comes from structural uncertainty (models mis-representing of not representing significant parts of the Earth system) and from sampling uncertainty associated with internal variability (not having a large enough ensemble or observational basis to sample internal variability). The definition of “uncertainty” depends on the question you are trying to answer: if you want to know the mean temperature and precipitation in 2050, then internal variability itself is part of the uncertainty – if, on the other hand, you want to know the expected temperature and precipitation in 2050 (i.e. the climate), then internal variability does not contribute directly to the uncertainty. In the 2nd case there will still be an indirect contribution of internal variability both from sampling error associated with the finite ensemble size and, perhaps more importantly, sampling error associated with having only one observational realisation to work with. Uncertainty of the first kind (which is important for impact studies) may, of course, increase in the future if, for instance, greater land-sea temperature contrasts lead to increased internal variability. Suggested changes: insert “sampling” before “uncertainties” in line 12. Make it clear that the ensemble is trying to model internal variability and that internal variability is part of the climate, not an uncertainty in the climate. Change “Any climate variable projection from ..” in line 14 to “Any climate variable projection derived from ..” [Martin Juckes, United Kingdom]
Accepted: we implemented the suggested changes.
12-387 12 12 20 "model specification" - Add "by design" or "by construction". [Ronald Stouffer, United States of America] Accepted, it is now "excluded […] by design".
12-388 12 12 25 Change "sampled explicity" to "estimated" [Government of United States of America] Accepted and changed to "sampled and estimated"
12-389 12 12 31 12 31 Explains what is meant by "non-unique" [Ramon de Elia, Canada] We rephrased entirely from "that are non-unique" to "that can vary from model to model".
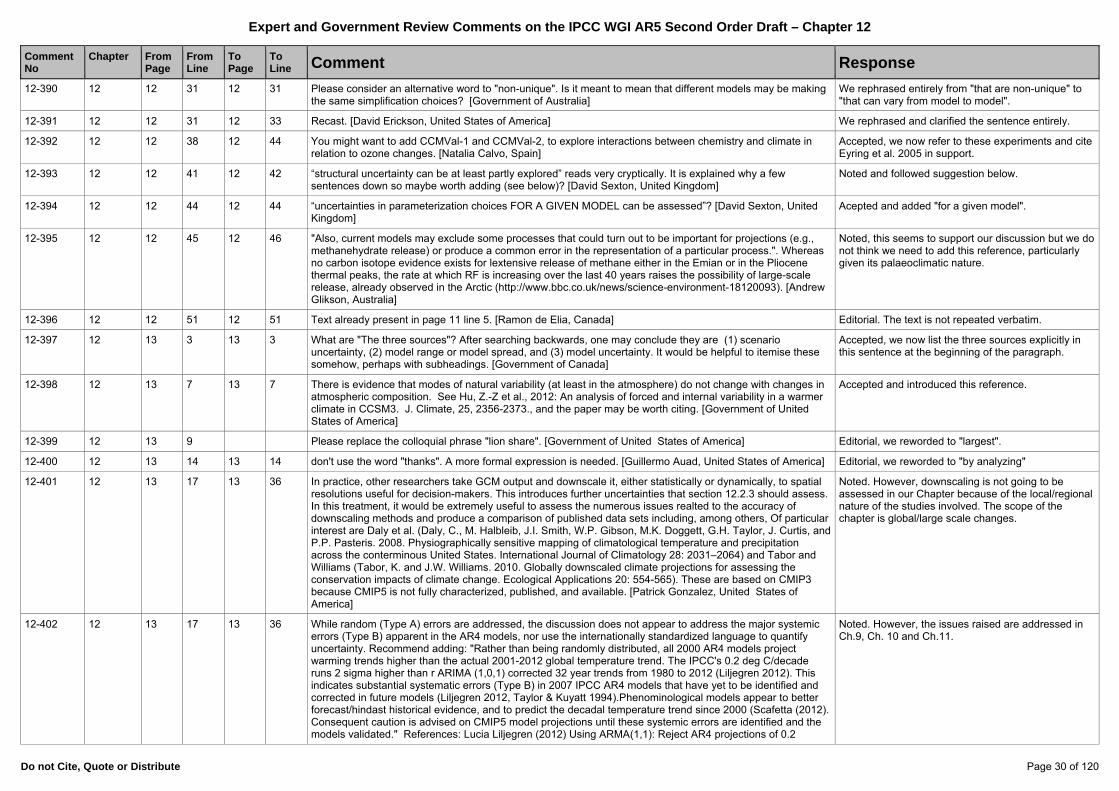
Expert and Government Review Comments on the IPCC WGI AR5 Second Order Draft – Chapter 12
Do not Cite, Quote or Distribute Page 30 of 120
Comment No
Chapter
FromPage
FromLine
To Page
To Line Comment Response
12-390 12 12 31 12 31 Please consider an alternative word to "non-unique". Is it meant to mean that different models may be making the same simplification choices? [Government of Australia]
We rephrased entirely from "that are non-unique" to "that can vary from model to model".
12-391 12 12 31 12 33 Recast. [David Erickson, United States of America] We rephrased and clarified the sentence entirely.
12-392 12 12 38 12 44 You might want to add CCMVal-1 and CCMVal-2, to explore interactions between chemistry and climate in relation to ozone changes. [Natalia Calvo, Spain]
Accepted, we now refer to these experiments and cite Eyring et al. 2005 in support.
12-393 12 12 41 12 42 “structural uncertainty can be at least partly explored” reads very cryptically. It is explained why a few sentences down so maybe worth adding (see below)? [David Sexton, United Kingdom]
Noted and followed suggestion below.
12-394 12 12 44 12 44 “uncertainties in parameterization choices FOR A GIVEN MODEL can be assessed”? [David Sexton, United Kingdom]
Acepted and added "for a given model".
12-395 12 12 45 12 46 "Also, current models may exclude some processes that could turn out to be important for projections (e.g., methanehydrate release) or produce a common error in the representation of a particular process.". Whereas no carbon isotope evidence exists for lextensive release of methane either in the Emian or in the Pliocene thermal peaks, the rate at which RF is increasing over the last 40 years raises the possibility of large-scale release, already observed in the Arctic (http://www.bbc.co.uk/news/science-environment-18120093). [Andrew Glikson, Australia]
Noted, this seems to support our discussion but we do not think we need to add this reference, particularly given its palaeoclimatic nature.
12-396 12 12 51 12 51 Text already present in page 11 line 5. [Ramon de Elia, Canada] Editorial. The text is not repeated verbatim.
12-397 12 13 3 13 3 What are "The three sources"? After searching backwards, one may conclude they are (1) scenario uncertainty, (2) model range or model spread, and (3) model uncertainty. It would be helpful to itemise these somehow, perhaps with subheadings. [Government of Canada]
Accepted, we now list the three sources explicitly in this sentence at the beginning of the paragraph.
12-398 12 13 7 13 7 There is evidence that modes of natural variability (at least in the atmosphere) do not change with changes in atmospheric composition. See Hu, Z.-Z et al., 2012: An analysis of forced and internal variability in a warmer climate in CCSM3. J. Climate, 25, 2356-2373., and the paper may be worth citing. [Government of United States of America]
Accepted and introduced this reference.
12-399 12 13 9 Please replace the colloquial phrase "lion share". [Government of United States of America] Editorial, we reworded to "largest".
12-400 12 13 14 13 14 don't use the word "thanks". A more formal expression is needed. [Guillermo Auad, United States of America] Editorial, we reworded to "by analyzing"
12-401 12 13 17 13 36 In practice, other researchers take GCM output and downscale it, either statistically or dynamically, to spatial resolutions useful for decision-makers. This introduces further uncertainties that section 12.2.3 should assess. In this treatment, it would be extremely useful to assess the numerous issues realted to the accuracy of downscaling methods and produce a comparison of published data sets including, among others, Of particular interest are Daly et al. (Daly, C., M. Halbleib, J.I. Smith, W.P. Gibson, M.K. Doggett, G.H. Taylor, J. Curtis, and P.P. Pasteris. 2008. Physiographically sensitive mapping of climatological temperature and precipitation across the conterminous United States. International Journal of Climatology 28: 2031–2064) and Tabor and Williams (Tabor, K. and J.W. Williams. 2010. Globally downscaled climate projections for assessing the conservation impacts of climate change. Ecological Applications 20: 554-565). These are based on CMIP3 because CMIP5 is not fully characterized, published, and available. [Patrick Gonzalez, United States of America]
Noted. However, downscaling is not going to be assessed in our Chapter because of the local/regional nature of the studies involved. The scope of the chapter is global/large scale changes.
12-402 12 13 17 13 36 While random (Type A) errors are addressed, the discussion does not appear to address the major systemic errors (Type B) apparent in the AR4 models, nor use the internationally standardized language to quantify uncertainty. Recommend adding: "Rather than being randomly distributed, all 2000 AR4 models project warming trends higher than the actual 2001-2012 global temperature trend. The IPCC's 0.2 deg C/decade runs 2 sigma higher than r ARIMA (1,0,1) corrected 32 year trends from 1980 to 2012 (Liljegren 2012). This indicates substantial systematic errors (Type B) in 2007 IPCC AR4 models that have yet to be identified and corrected in future models (Liljegren 2012, Taylor & Kuyatt 1994).Phenominological models appear to better forecast/hindast historical evidence, and to predict the decadal temperature trend since 2000 (Scafetta (2012). Consequent caution is advised on CMIP5 model projections until these systemic errors are identified and the models validated." References: Lucia Liljegren (2012) Using ARMA(1,1): Reject AR4 projections of 0.2
Noted. However, the issues raised are addressed in Ch.9, Ch. 10 and Ch.11.
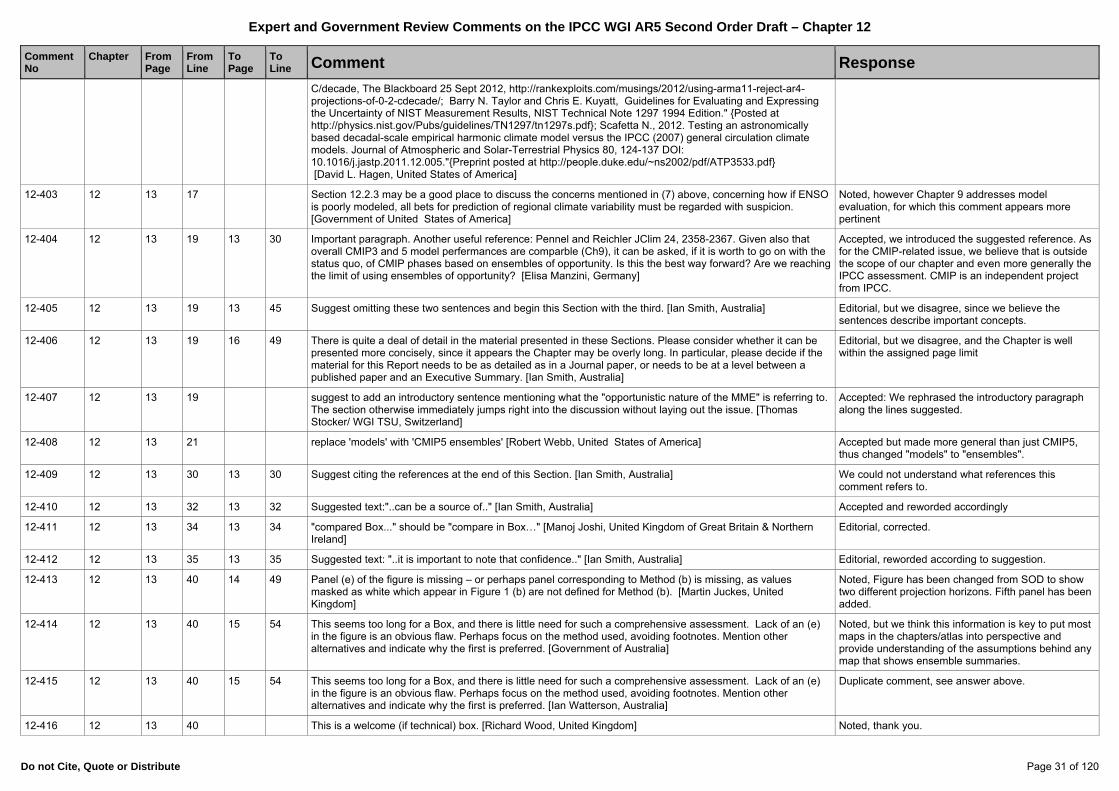
Expert and Government Review Comments on the IPCC WGI AR5 Second Order Draft – Chapter 12
Do not Cite, Quote or Distribute Page 31 of 120
Comment No
Chapter
FromPage
FromLine
To Page
To Line Comment Response
C/decade, The Blackboard 25 Sept 2012, http://rankexploits.com/musings/2012/using-arma11-reject-ar4-projections-of-0-2-cdecade/; Barry N. Taylor and Chris E. Kuyatt, Guidelines for Evaluating and Expressing the Uncertainty of NIST Measurement Results, NIST Technical Note 1297 1994 Edition." {Posted at http://physics.nist.gov/Pubs/guidelines/TN1297/tn1297s.pdf}; Scafetta N., 2012. Testing an astronomically based decadal-scale empirical harmonic climate model versus the IPCC (2007) general circulation climate models. Journal of Atmospheric and Solar-Terrestrial Physics 80, 124-137 DOI: 10.1016/j.jastp.2011.12.005."{Preprint posted at http://people.duke.edu/~ns2002/pdf/ATP3533.pdf} [David L. Hagen, United States of America]
12-403 12 13 17 Section 12.2.3 may be a good place to discuss the concerns mentioned in (7) above, concerning how if ENSO is poorly modeled, all bets for prediction of regional climate variability must be regarded with suspicion. [Government of United States of America]
Noted, however Chapter 9 addresses model evaluation, for which this comment appears more pertinent
12-404 12 13 19 13 30 Important paragraph. Another useful reference: Pennel and Reichler JClim 24, 2358-2367. Given also that overall CMIP3 and 5 model perfermances are comparble (Ch9), it can be asked, if it is worth to go on with the status quo, of CMIP phases based on ensembles of opportunity. Is this the best way forward? Are we reaching the limit of using ensembles of opportunity? [Elisa Manzini, Germany]
Accepted, we introduced the suggested reference. As for the CMIP-related issue, we believe that is outside the scope of our chapter and even more generally the IPCC assessment. CMIP is an independent project from IPCC.
12-405 12 13 19 13 45 Suggest omitting these two sentences and begin this Section with the third. [Ian Smith, Australia] Editorial, but we disagree, since we believe the sentences describe important concepts.
12-406 12 13 19 16 49 There is quite a deal of detail in the material presented in these Sections. Please consider whether it can be presented more concisely, since it appears the Chapter may be overly long. In particular, please decide if the material for this Report needs to be as detailed as in a Journal paper, or needs to be at a level between a published paper and an Executive Summary. [Ian Smith, Australia]
Editorial, but we disagree, and the Chapter is well within the assigned page limit
12-407 12 13 19 suggest to add an introductory sentence mentioning what the "opportunistic nature of the MME" is referring to. The section otherwise immediately jumps right into the discussion without laying out the issue. [Thomas Stocker/ WGI TSU, Switzerland]
Accepted: We rephrased the introductory paragraph along the lines suggested.
12-408 12 13 21 replace 'models' with 'CMIP5 ensembles' [Robert Webb, United States of America] Accepted but made more general than just CMIP5, thus changed "models" to "ensembles".
12-409 12 13 30 13 30 Suggest citing the references at the end of this Section. [Ian Smith, Australia] We could not understand what references this comment refers to.
12-410 12 13 32 13 32 Suggested text:"..can be a source of.." [Ian Smith, Australia] Accepted and reworded accordingly
12-411 12 13 34 13 34 "compared Box..." should be "compare in Box…" [Manoj Joshi, United Kingdom of Great Britain & Northern Ireland]
Editorial, corrected.
12-412 12 13 35 13 35 Suggested text: "..it is important to note that confidence.." [Ian Smith, Australia] Editorial, reworded according to suggestion.
12-413 12 13 40 14 49 Panel (e) of the figure is missing – or perhaps panel corresponding to Method (b) is missing, as values masked as white which appear in Figure 1 (b) are not defined for Method (b). [Martin Juckes, United Kingdom]
Noted, Figure has been changed from SOD to show two different projection horizons. Fifth panel has been added.
12-414 12 13 40 15 54 This seems too long for a Box, and there is little need for such a comprehensive assessment. Lack of an (e) in the figure is an obvious flaw. Perhaps focus on the method used, avoiding footnotes. Mention other alternatives and indicate why the first is preferred. [Government of Australia]
Noted, but we think this information is key to put most maps in the chapters/atlas into perspective and provide understanding of the assumptions behind any map that shows ensemble summaries.
12-415 12 13 40 15 54 This seems too long for a Box, and there is little need for such a comprehensive assessment. Lack of an (e) in the figure is an obvious flaw. Perhaps focus on the method used, avoiding footnotes. Mention other alternatives and indicate why the first is preferred. [Ian Watterson, Australia]
Duplicate comment, see answer above.
12-416 12 13 40 This is a welcome (if technical) box. [Richard Wood, United Kingdom] Noted, thank you.
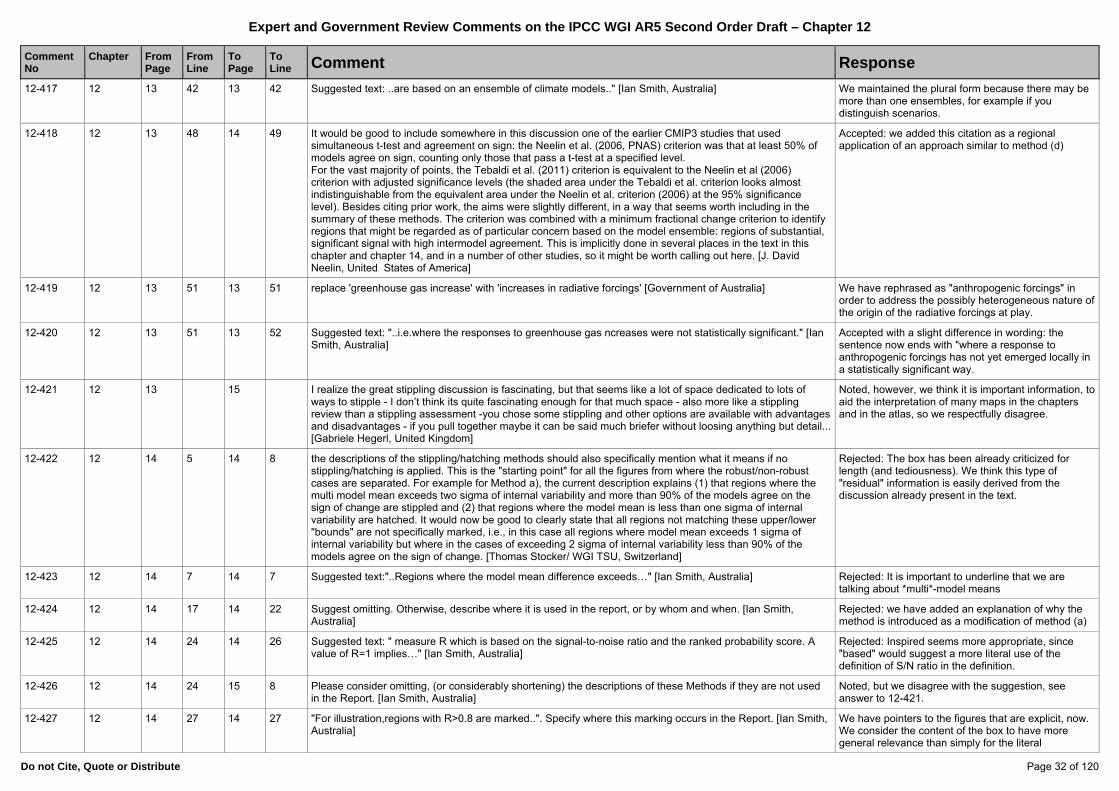
Expert and Government Review Comments on the IPCC WGI AR5 Second Order Draft – Chapter 12
Do not Cite, Quote or Distribute Page 32 of 120
Comment No
Chapter
FromPage
FromLine
To Page
To Line Comment Response
12-417 12 13 42 13 42 Suggested text: ..are based on an ensemble of climate models.." [Ian Smith, Australia] We maintained the plural form because there may be more than one ensembles, for example if you distinguish scenarios.
12-418 12 13 48 14 49 It would be good to include somewhere in this discussion one of the earlier CMIP3 studies that used simultaneous t-test and agreement on sign: the Neelin et al. (2006, PNAS) criterion was that at least 50% of models agree on sign, counting only those that pass a t-test at a specified level. For the vast majority of points, the Tebaldi et al. (2011) criterion is equivalent to the Neelin et al (2006) criterion with adjusted significance levels (the shaded area under the Tebaldi et al. criterion looks almost indistinguishable from the equivalent area under the Neelin et al. criterion (2006) at the 95% significance level). Besides citing prior work, the aims were slightly different, in a way that seems worth including in the summary of these methods. The criterion was combined with a minimum fractional change criterion to identify regions that might be regarded as of particular concern based on the model ensemble: regions of substantial, significant signal with high intermodel agreement. This is implicitly done in several places in the text in this chapter and chapter 14, and in a number of other studies, so it might be worth calling out here. [J. David Neelin, United States of America]
Accepted: we added this citation as a regional application of an approach similar to method (d)
12-419 12 13 51 13 51 replace 'greenhouse gas increase' with 'increases in radiative forcings' [Government of Australia] We have rephrased as "anthropogenic forcings" in order to address the possibly heterogeneous nature of the origin of the radiative forcings at play.
12-420 12 13 51 13 52 Suggested text: "..i.e.where the responses to greenhouse gas ncreases were not statistically significant." [Ian Smith, Australia]
Accepted with a slight difference in wording: the sentence now ends with "where a response to anthropogenic forcings has not yet emerged locally in a statistically significant way.
12-421 12 13 15 I realize the great stippling discussion is fascinating, but that seems like a lot of space dedicated to lots of ways to stipple - I don’t think its quite fascinating enough for that much space - also more like a stippling review than a stippling assessment -you chose some stippling and other options are available with advantages and disadvantages - if you pull together maybe it can be said much briefer without loosing anything but detail... [Gabriele Hegerl, United Kingdom]
Noted, however, we think it is important information, to aid the interpretation of many maps in the chapters and in the atlas, so we respectfully disagree.
12-422 12 14 5 14 8 the descriptions of the stippling/hatching methods should also specifically mention what it means if no stippling/hatching is applied. This is the "starting point" for all the figures from where the robust/non-robust cases are separated. For example for Method a), the current description explains (1) that regions where the multi model mean exceeds two sigma of internal variability and more than 90% of the models agree on the sign of change are stippled and (2) that regions where the model mean is less than one sigma of internal variability are hatched. It would now be good to clearly state that all regions not matching these upper/lower "bounds" are not specifically marked, i.e., in this case all regions where model mean exceeds 1 sigma of internal variability but where in the cases of exceeding 2 sigma of internal variability less than 90% of the models agree on the sign of change. [Thomas Stocker/ WGI TSU, Switzerland]
Rejected: The box has been already criticized for length (and tediousness). We think this type of "residual" information is easily derived from the discussion already present in the text.
12-423 12 14 7 14 7 Suggested text:"..Regions where the model mean difference exceeds…" [Ian Smith, Australia] Rejected: It is important to underline that we are talking about *multi*-model means
12-424 12 14 17 14 22 Suggest omitting. Otherwise, describe where it is used in the report, or by whom and when. [Ian Smith, Australia]
Rejected: we have added an explanation of why the method is introduced as a modification of method (a)
12-425 12 14 24 14 26 Suggested text: " measure R which is based on the signal-to-noise ratio and the ranked probability score. A value of R=1 implies…" [Ian Smith, Australia]
Rejected: Inspired seems more appropriate, since "based" would suggest a more literal use of the definition of S/N ratio in the definition.
12-426 12 14 24 15 8 Please consider omitting, (or considerably shortening) the descriptions of these Methods if they are not used in the Report. [Ian Smith, Australia]
Noted, but we disagree with the suggestion, see answer to 12-421.
12-427 12 14 27 14 27 "For illustration,regions with R>0.8 are marked..". Specify where this marking occurs in the Report. [Ian Smith, Australia]
We have pointers to the figures that are explicit, now. We consider the content of the box to have more general relevance than simply for the literal
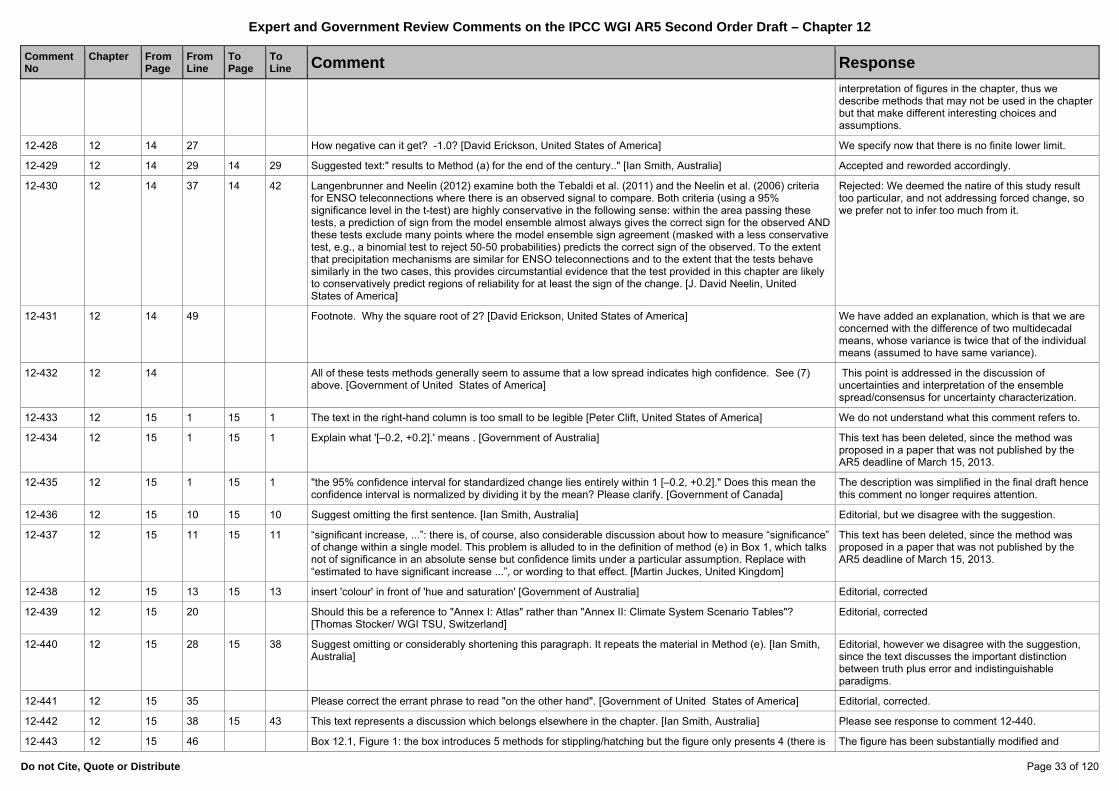
Expert and Government Review Comments on the IPCC WGI AR5 Second Order Draft – Chapter 12
Do not Cite, Quote or Distribute Page 33 of 120
Comment No
Chapter
FromPage
FromLine
To Page
To Line Comment Response
interpretation of figures in the chapter, thus we describe methods that may not be used in the chapter but that make different interesting choices and assumptions.
12-428 12 14 27 How negative can it get? -1.0? [David Erickson, United States of America] We specify now that there is no finite lower limit.
12-429 12 14 29 14 29 Suggested text:" results to Method (a) for the end of the century.." [Ian Smith, Australia] Accepted and reworded accordingly.
12-430 12 14 37 14 42 Langenbrunner and Neelin (2012) examine both the Tebaldi et al. (2011) and the Neelin et al. (2006) criteria for ENSO teleconnections where there is an observed signal to compare. Both criteria (using a 95% significance level in the t-test) are highly conservative in the following sense: within the area passing these tests, a prediction of sign from the model ensemble almost always gives the correct sign for the observed AND these tests exclude many points where the model ensemble sign agreement (masked with a less conservative test, e.g., a binomial test to reject 50-50 probabilities) predicts the correct sign of the observed. To the extent that precipitation mechanisms are similar for ENSO teleconnections and to the extent that the tests behave similarly in the two cases, this provides circumstantial evidence that the test provided in this chapter are likely to conservatively predict regions of reliability for at least the sign of the change. [J. David Neelin, United States of America]
Rejected: We deemed the natire of this study result too particular, and not addressing forced change, so we prefer not to infer too much from it.
12-431 12 14 49 Footnote. Why the square root of 2? [David Erickson, United States of America] We have added an explanation, which is that we are concerned with the difference of two multidecadal means, whose variance is twice that of the individual means (assumed to have same variance).
12-432 12 14 All of these tests methods generally seem to assume that a low spread indicates high confidence. See (7) above. [Government of United States of America]
This point is addressed in the discussion of uncertainties and interpretation of the ensemble spread/consensus for uncertainty characterization.
12-433 12 15 1 15 1 The text in the right-hand column is too small to be legible [Peter Clift, United States of America] We do not understand what this comment refers to.
12-434 12 15 1 15 1 Explain what '[–0.2, +0.2].' means . [Government of Australia] This text has been deleted, since the method was proposed in a paper that was not published by the AR5 deadline of March 15, 2013.
12-435 12 15 1 15 1 "the 95% confidence interval for standardized change lies entirely within 1 [–0.2, +0.2]." Does this mean the confidence interval is normalized by dividing it by the mean? Please clarify. [Government of Canada]
The description was simplified in the final draft hence this comment no longer requires attention.
12-436 12 15 10 15 10 Suggest omitting the first sentence. [Ian Smith, Australia] Editorial, but we disagree with the suggestion.
12-437 12 15 11 15 11 “significant increase, ...”: there is, of course, also considerable discussion about how to measure “significance” of change within a single model. This problem is alluded to in the definition of method (e) in Box 1, which talks not of significance in an absolute sense but confidence limits under a particular assumption. Replace with “estimated to have significant increase ...”, or wording to that effect. [Martin Juckes, United Kingdom]
This text has been deleted, since the method was proposed in a paper that was not published by the AR5 deadline of March 15, 2013.
12-438 12 15 13 15 13 insert 'colour' in front of 'hue and saturation' [Government of Australia] Editorial, corrected
12-439 12 15 20 Should this be a reference to "Annex I: Atlas" rather than "Annex II: Climate System Scenario Tables"? [Thomas Stocker/ WGI TSU, Switzerland]
Editorial, corrected
12-440 12 15 28 15 38 Suggest omitting or considerably shortening this paragraph. It repeats the material in Method (e). [Ian Smith, Australia]
Editorial, however we disagree with the suggestion, since the text discusses the important distinction between truth plus error and indistinguishable paradigms.
12-441 12 15 35 Please correct the errant phrase to read "on the other hand". [Government of United States of America] Editorial, corrected.
12-442 12 15 38 15 43 This text represents a discussion which belongs elsewhere in the chapter. [Ian Smith, Australia] Please see response to comment 12-440.
12-443 12 15 46 Box 12.1, Figure 1: the box introduces 5 methods for stippling/hatching but the figure only presents 4 (there is The figure has been substantially modified and

Expert and Government Review Comments on the IPCC WGI AR5 Second Order Draft – Chapter 12
Do not Cite, Quote or Distribute Page 34 of 120
Comment No
Chapter
FromPage
FromLine
To Page
To Line Comment Response
no panel e) despite that it's being referred to in the caption). It's unclear how the panels in the Figure relate to the methods discussed in the text. We assume Figure Panel (a) describes Method (a), F(b) -- M(c), F(c) -- M(d), F(d) -- M(e). This would imply that Method (b) is not being shown in the Figure, correct? Please make sure this is properly explained in both the text part of the Box as well as in the Figure/Figure caption. [Thomas Stocker/ WGI TSU, Switzerland]
corrected. In particular the panel(s) representing the fifth method are now included.
12-444 12 15 47 Make sure that it is clear that the "base" period is 1986-2005. [David Erickson, United States of America] Noted, the baseline period is clearly stated in the caption.
12-445 12 15 51 there is no panel e) in the figure [Andreas Sterl, Netherlands] The figure has been modified and corrected.
12-446 12 16 1 16 36 Suggest omitting or considerably shortening this material. While citing all these studies is useful in one respect, it does burden the Chapter since it appears none of the results are used in the Report. [Ian Smith, Australia]
Rejected: We think it is an important piece of the uncertainty picture for people to be aware of, and PPEs results are used for example for climate sensitivity studies, relevant to our chapter.
12-447 12 16 5 16 5 change "to be varied" to "that are varied" [Manoj Joshi, United Kingdom of Great Britain & Northern Ireland] Accepted and reworded accordingly.
12-448 12 16 6 16 6 change "those have in fact" to "have in fact" [Manoj Joshi, United Kingdom of Great Britain & Northern Ireland] Accepted and reworded accordingly.
12-449 12 16 7 16 7 is "more expensively" referring to computational time- seems an odd choice of phrase in this sentence [Manoj Joshi, United Kingdom of Great Britain & Northern Ireland]
We now make a more direct reference to computational costs.
12-450 12 16 9 16 12 Emulators are being defined here by “Emulation” or “Emulators” are not mentioned. That's ok if the aim is to avoid jargon but this sentence could do with a reference like Rougier et al (2009). [David Sexton, United Kingdom]
We have added the reference.
12-451 12 16 15 16 15 The word "demonstrating" is not appropiate in this context as the message that the author wishes to convey to the reader was learned through a statistical approach (not a mathematical one). Thus, I'd suggest to replace demonstrating by "suggesting" (or even strongly suggesting), or similar. [Guillermo Auad, United States of America]
Accepted and reworded accordingly.
12-452 12 16 24 16 24 Add Murphy et al (2004) to list of references. [David Sexton, United Kingdom] We have added this reference.
12-453 12 16 27 repalce 'fundimental notion' with 'approach' [Robert Webb, United States of America] We have slightly rephrased the paragraph and we now refer to these two alternatives as "choices".
12-454 12 16 32 16 32 You may consider adding the following publication which exactly dealt with the problem of constructing a PDF out of a limited sample of model projections. You could add a citation after "Bayesian perspective" or also at the end of the paragraph. Fischer, A.M., Weigel, A.P., Buser, C.M., Knutti, R., Künsch, H.R., Liniger, M.A., Schär, C., and C. Appenzeller. 2011. Climate change projections for Switzerland based on a Bayesian multi-model approach. Int. J. Clim. DOI: 10.1002/joc.3396 [Andreas Fischer, Switzerland]
Rejected: The study seemed too regional in nature and therefore not consistent with the rest of the literature cited, that addresses more general estimations at a global level.
12-455 12 16 35 16 35 change "in the lack" to "given the lack" [Manoj Joshi, United Kingdom of Great Britain & Northern Ireland] Editorial, corrected.
12-456 12 16 38 16 38 Suggested text: "There does not exist…" [Ian Smith, Australia] Text is as suggested already.
12-457 12 16 38 16 39 Statement that there is currently no single agreed upon framework to deliver uncertainty estimates of future changes is relevant to policy makers, and perhaps could be placed in the SPM. [European Union]
Noted.
12-458 12 16 38 16 39 This statement could be supported and made more informative by cross-referencing to the more complete discussion in 9.8.3.1 and by citing this recent article which explains why uncertainty frameworks are difficult to construct for ensembles: Stephenson, D.B., Collins, M., Rougier, J. C. and Chandler, R.E. (2012), Statistical problems in the probabilistic prediction of climate change. Environmetrics, 23: 364–372. doi: 10.1002/env.2153 [David Stephenson, United Kingdom of Great Britain & Northern Ireland]
Accepted: References are now made to 9.8.3.1 and to the paper.
12-459 12 16 38 16 49 Thius strengthened discussion on methods of inference is very welcome. I do still think some comment on the way the authors have used the CMIP3 models in their assessment would be helpful. [Richard Wood, United
We mention in the introduction that many studies since AR4 have continued to analyze CMIP3 output,
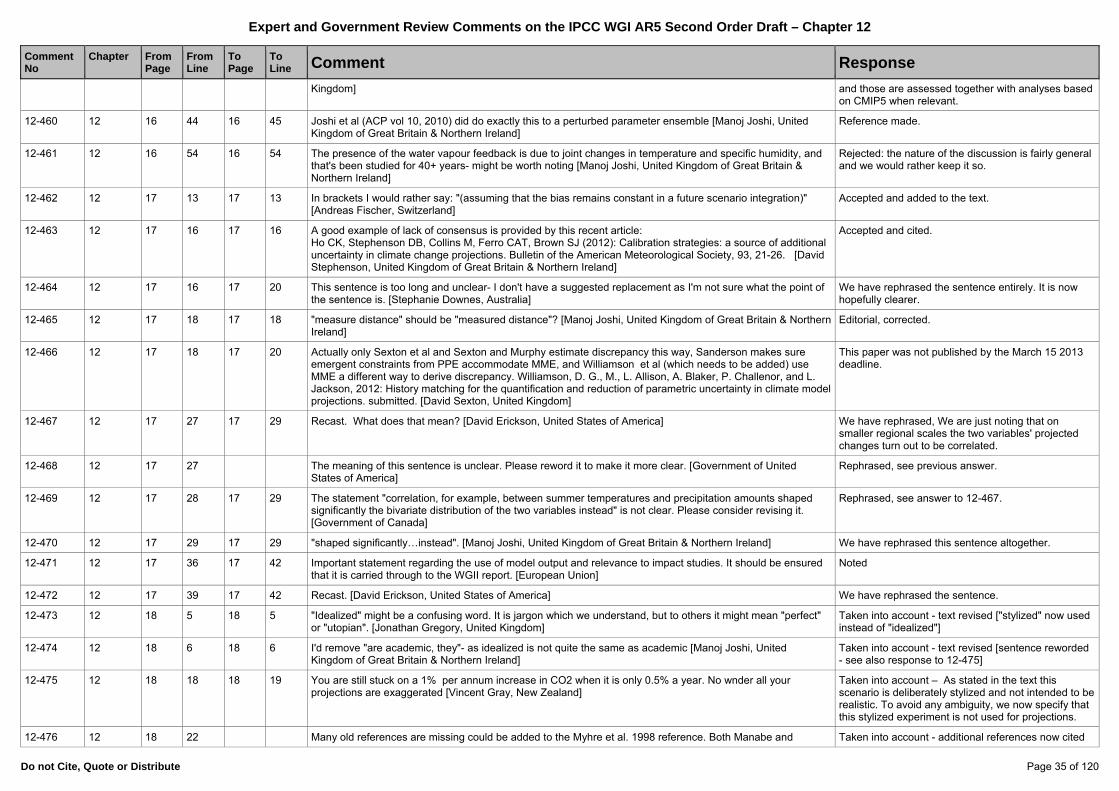
Expert and Government Review Comments on the IPCC WGI AR5 Second Order Draft – Chapter 12
Do not Cite, Quote or Distribute Page 35 of 120
Comment No
Chapter
FromPage
FromLine
To Page
To Line Comment Response
Kingdom] and those are assessed together with analyses based on CMIP5 when relevant.
12-460 12 16 44 16 45 Joshi et al (ACP vol 10, 2010) did do exactly this to a perturbed parameter ensemble [Manoj Joshi, United Kingdom of Great Britain & Northern Ireland]
Reference made.
12-461 12 16 54 16 54 The presence of the water vapour feedback is due to joint changes in temperature and specific humidity, and that's been studied for 40+ years- might be worth noting [Manoj Joshi, United Kingdom of Great Britain & Northern Ireland]
Rejected: the nature of the discussion is fairly general and we would rather keep it so.
12-462 12 17 13 17 13 In brackets I would rather say: "(assuming that the bias remains constant in a future scenario integration)" [Andreas Fischer, Switzerland]
Accepted and added to the text.
12-463 12 17 16 17 16 A good example of lack of consensus is provided by this recent article: Ho CK, Stephenson DB, Collins M, Ferro CAT, Brown SJ (2012): Calibration strategies: a source of additional uncertainty in climate change projections. Bulletin of the American Meteorological Society, 93, 21-26. [David Stephenson, United Kingdom of Great Britain & Northern Ireland]
Accepted and cited.
12-464 12 17 16 17 20 This sentence is too long and unclear- I don't have a suggested replacement as I'm not sure what the point of the sentence is. [Stephanie Downes, Australia]
We have rephrased the sentence entirely. It is now hopefully clearer.
12-465 12 17 18 17 18 "measure distance" should be "measured distance"? [Manoj Joshi, United Kingdom of Great Britain & Northern Ireland]
Editorial, corrected.
12-466 12 17 18 17 20 Actually only Sexton et al and Sexton and Murphy estimate discrepancy this way, Sanderson makes sure emergent constraints from PPE accommodate MME, and Williamson et al (which needs to be added) use MME a different way to derive discrepancy. Williamson, D. G., M., L. Allison, A. Blaker, P. Challenor, and L. Jackson, 2012: History matching for the quantification and reduction of parametric uncertainty in climate model projections. submitted. [David Sexton, United Kingdom]
This paper was not published by the March 15 2013 deadline.
12-467 12 17 27 17 29 Recast. What does that mean? [David Erickson, United States of America] We have rephrased, We are just noting that on smaller regional scales the two variables' projected changes turn out to be correlated.
12-468 12 17 27 The meaning of this sentence is unclear. Please reword it to make it more clear. [Government of United States of America]
Rephrased, see previous answer.
12-469 12 17 28 17 29 The statement "correlation, for example, between summer temperatures and precipitation amounts shaped significantly the bivariate distribution of the two variables instead" is not clear. Please consider revising it. [Government of Canada]
Rephrased, see answer to 12-467.
12-470 12 17 29 17 29 "shaped significantly…instead". [Manoj Joshi, United Kingdom of Great Britain & Northern Ireland] We have rephrased this sentence altogether.
12-471 12 17 36 17 42 Important statement regarding the use of model output and relevance to impact studies. It should be ensured that it is carried through to the WGII report. [European Union]
Noted
12-472 12 17 39 17 42 Recast. [David Erickson, United States of America] We have rephrased the sentence.
12-473 12 18 5 18 5 "Idealized" might be a confusing word. It is jargon which we understand, but to others it might mean "perfect" or "utopian". [Jonathan Gregory, United Kingdom]
Taken into account - text revised ["stylized" now used instead of "idealized"]
12-474 12 18 6 18 6 I'd remove "are academic, they"- as idealized is not quite the same as academic [Manoj Joshi, United Kingdom of Great Britain & Northern Ireland]
Taken into account - text revised [sentence reworded - see also response to 12-475]
12-475 12 18 18 18 19 You are still stuck on a 1% per annum increase in CO2 when it is only 0.5% a year. No wnder all your projections are exaggerated [Vincent Gray, New Zealand]
Taken into account – As stated in the text this scenario is deliberately stylized and not intended to be realistic. To avoid any ambiguity, we now specify that this stylized experiment is not used for projections.
12-476 12 18 22 Many old references are missing could be added to the Myhre et al. 1998 reference. Both Manabe and Taken into account - additional references now cited

Expert and Government Review Comments on the IPCC WGI AR5 Second Order Draft – Chapter 12
Do not Cite, Quote or Distribute Page 36 of 120
Comment No
Chapter
FromPage
FromLine
To Page
To Line Comment Response
Hansen published on this issue.See their solar constant versus CO2 change papers. [Ronald Stouffer, United States of America]
12-477 12 18 26 18 27 It would be clearer to write "reaching twice the initial concentration after 70 years and four times after 140 years", to avoid the impression that it changes instantaneously at 70 and 140 years. [Jonathan Gregory, United Kingdom]
Accepted - text revised
12-478 12 18 27 18 27 Should uncertainties be given for the radiative forcing, in particular because of rapid adjustments? A specific section in ch 8 would be helpful for reference. [Jonathan Gregory, United Kingdom]
Taken into account - text revised [uncertainties quantified with cross-reference to section 8.3.2.1]
12-479 12 18 27 18 28 Regarding "The corresponding radiative forcings are about 3.9 W m-2 and 7.8 W m-2 respectively (see Chapter 8)", a more specific location of the reference to Chapter 8 would be helpful. A different number of 2xCO2 radiative forcing, 3.7 W m-2 is found in line 45 on page 64. [Junichi Tsutsui, Japan]
Accepted - text revised [The central values have been changed to 3.7/7.4 with +/- 20% uncertainty, cross-referencing a specific section of chapter 8]
12-480 12 18 30 Please remove the incorrect placement of the word "pathway". [Government of United States of America] Accepted - text revised
12-481 12 18 31 18 31 Adjusted forcings (in a general sense, apart from stratospheric adjustment) are a new idea and a reference to a relevant section in ch 8 for explanation would be helpful. [Jonathan Gregory, United Kingdom]
Accepted - A reference has been added.
12-482 12 18 42 18 43 the sentence is not clear to this reviewer. Rewriting it might help. [Guillermo Auad, United States of America] Accepted - text revised
12-483 12 18 45 18 45 "RCP" instead of "RCPs" [Andreas Fischer, Switzerland] Accepted - text revised
12-484 12 18 45 18 45 "The New Concentration Driven RCPs Scenarios" seems clumsy. If you prefer not to drop the word "Scenarios", I suggest to write "RCP" instead of "RCPs". [Leon Rotstayn, Australia]
Taken into account - combined with comment 12-483
12-485 12 18 45 It may be helpful to move this whole subsection on RCPs to earlier in the chapter, where the term is first introduced. [Government of United States of America]
Rejected - RCP scenarios are actually first introduced in Chapter 1 and also discussed in some previous chapters (e.g. 6, 8, 11). We focus in this section on their construction in radiative forcing terms and do not consider it desirable to make a structural change to this chapter as suggested.
12-486 12 18 47 please add "and in Section 12.1" after "Chapter 1" [Thomas Stocker/ WGI TSU, Switzerland] Accepted - text revised
12-487 12 18 51 18 52 "their primary purpose is to provide time-dependent projections of atmospheric greenhouse gas (GHG) concentrations". The RCPs also provide time-dependent projections of other forcing agents, and in some cases GHGs are provided as emissions, not concentrations. Would it not be more accurate to write "...projections of radiative forcing"? [Leon Rotstayn, Australia]
Taken into account - text revised [it is correct that the forcing projections are the primary characteristic]
12-488 12 18 53 18 53 "the stabilization value". This is incorrect. The number in each RCP refers to the approximate radiative forcing at 2100. In particular, RCP8.5 doesn't stablilize until much later than 2100, at a radiative forcing much larger than 8.5 W/m2. [Leon Rotstayn, Australia]
Accepted - text revised
12-489 12 18 53 19 1 Stabilization is referred to here, but RCP8.5 does not appear to stabilize by 2100. [John Caesar, United Kingdom of Great Britain & Northern Ireland]
Accepted - text revised - combined with comment 12-488
12-490 12 18 53 19 1 The reference to stabilization appears to be inappropriate here. RCP8.5 does not stabilize by 2100, and RCP6.0 stabilizes post-2100. The RCP values are supposed to be an indication of the level of radiative forcing reached by 2100, whether stabilized or not. [European Union]
Accepted - text revised - combined with comment 12-488
12-491 12 19 1 19 1 It might be relevant to note that RCP8.5 does not stabilise at 2100, since you say what the others do. On the other hand, you return to this point when discussing ECPs, so there is some redundancy. [Jonathan Gregory, United Kingdom]
Accepted - text revised - combined with comment 12-488
12-492 12 19 12 19 24 I wonder that N2O is not presented in the graph. In other chapters it is outlined that N2O is now the third most important GHG. Why not adding this to the graph? [European Union]
Accepted - The N2O radiative forcing has been added to Fig 12.3
12-493 12 19 12 Figure 12.3: suggest to briefly explain in the caption the offset in 2000 between SRES and RCP scenarios. [Thomas Stocker/ WGI TSU, Switzerland]
Taken into account - text revised [a sentence explaining this was wrongly situated at the end of the
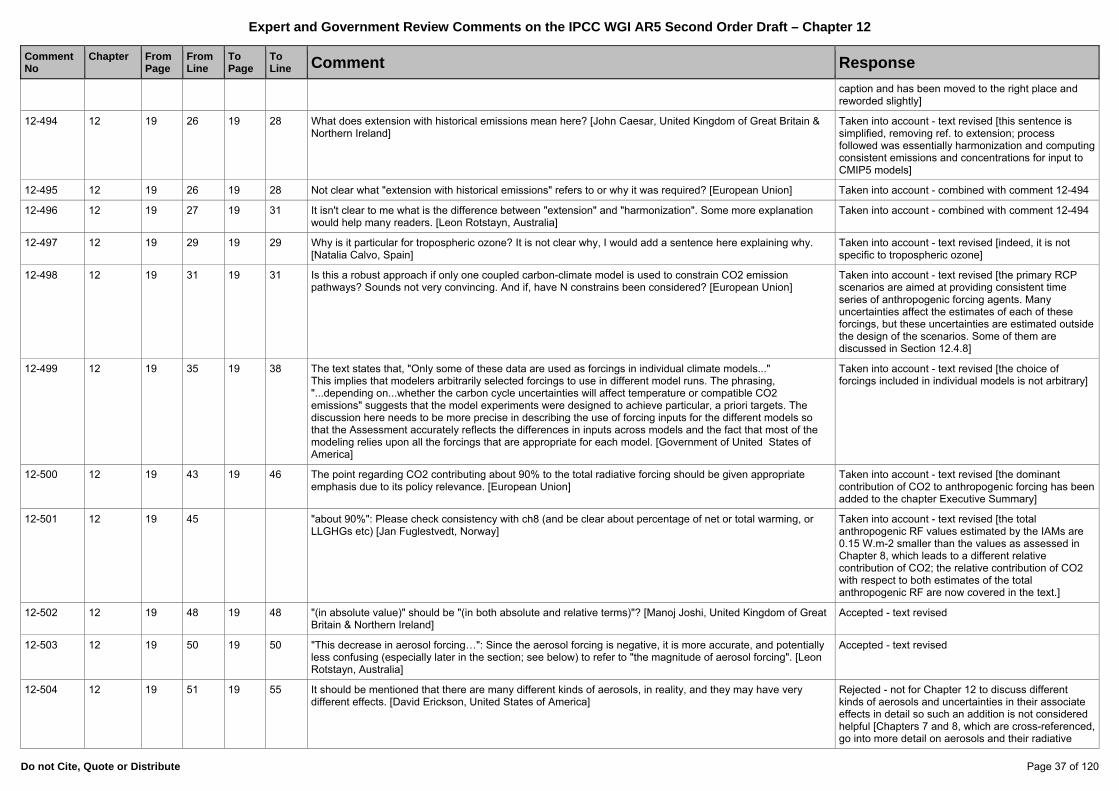
Expert and Government Review Comments on the IPCC WGI AR5 Second Order Draft – Chapter 12
Do not Cite, Quote or Distribute Page 37 of 120
Comment No
Chapter
FromPage
FromLine
To Page
To Line Comment Response
caption and has been moved to the right place and reworded slightly]
12-494 12 19 26 19 28 What does extension with historical emissions mean here? [John Caesar, United Kingdom of Great Britain & Northern Ireland]
Taken into account - text revised [this sentence is simplified, removing ref. to extension; process followed was essentially harmonization and computing consistent emissions and concentrations for input to CMIP5 models]
12-495 12 19 26 19 28 Not clear what "extension with historical emissions" refers to or why it was required? [European Union] Taken into account - combined with comment 12-494
12-496 12 19 27 19 31 It isn't clear to me what is the difference between "extension" and "harmonization". Some more explanation would help many readers. [Leon Rotstayn, Australia]
Taken into account - combined with comment 12-494
12-497 12 19 29 19 29 Why is it particular for tropospheric ozone? It is not clear why, I would add a sentence here explaining why. [Natalia Calvo, Spain]
Taken into account - text revised [indeed, it is not specific to tropospheric ozone]
12-498 12 19 31 19 31 Is this a robust approach if only one coupled carbon-climate model is used to constrain CO2 emission pathways? Sounds not very convincing. And if, have N constrains been considered? [European Union]
Taken into account - text revised [the primary RCP scenarios are aimed at providing consistent time series of anthropogenic forcing agents. Many uncertainties affect the estimates of each of these forcings, but these uncertainties are estimated outside the design of the scenarios. Some of them are discussed in Section 12.4.8]
12-499 12 19 35 19 38 The text states that, "Only some of these data are used as forcings in individual climate models..." This implies that modelers arbitrarily selected forcings to use in different model runs. The phrasing, "...depending on...whether the carbon cycle uncertainties will affect temperature or compatible CO2 emissions" suggests that the model experiments were designed to achieve particular, a priori targets. The discussion here needs to be more precise in describing the use of forcing inputs for the different models so that the Assessment accurately reflects the differences in inputs across models and the fact that most of the modeling relies upon all the forcings that are appropriate for each model. [Government of United States of America]
Taken into account - text revised [the choice of forcings included in individual models is not arbitrary]
12-500 12 19 43 19 46 The point regarding CO2 contributing about 90% to the total radiative forcing should be given appropriate emphasis due to its policy relevance. [European Union]
Taken into account - text revised [the dominant contribution of CO2 to anthropogenic forcing has been added to the chapter Executive Summary]
12-501 12 19 45 "about 90%": Please check consistency with ch8 (and be clear about percentage of net or total warming, or LLGHGs etc) [Jan Fuglestvedt, Norway]
Taken into account - text revised [the total anthropogenic RF values estimated by the IAMs are 0.15 W.m-2 smaller than the values as assessed in Chapter 8, which leads to a different relative contribution of CO2; the relative contribution of CO2 with respect to both estimates of the total anthropogenic RF are now covered in the text.]
12-502 12 19 48 19 48 "(in absolute value)" should be "(in both absolute and relative terms)"? [Manoj Joshi, United Kingdom of Great Britain & Northern Ireland]
Accepted - text revised
12-503 12 19 50 19 50 "This decrease in aerosol forcing…": Since the aerosol forcing is negative, it is more accurate, and potentially less confusing (especially later in the section; see below) to refer to "the magnitude of aerosol forcing". [Leon Rotstayn, Australia]
Accepted - text revised
12-504 12 19 51 19 55 It should be mentioned that there are many different kinds of aerosols, in reality, and they may have very different effects. [David Erickson, United States of America]
Rejected - not for Chapter 12 to discuss different kinds of aerosols and uncertainties in their associate effects in detail so such an addition is not considered helpful [Chapters 7 and 8, which are cross-referenced, go into more detail on aerosols and their radiative
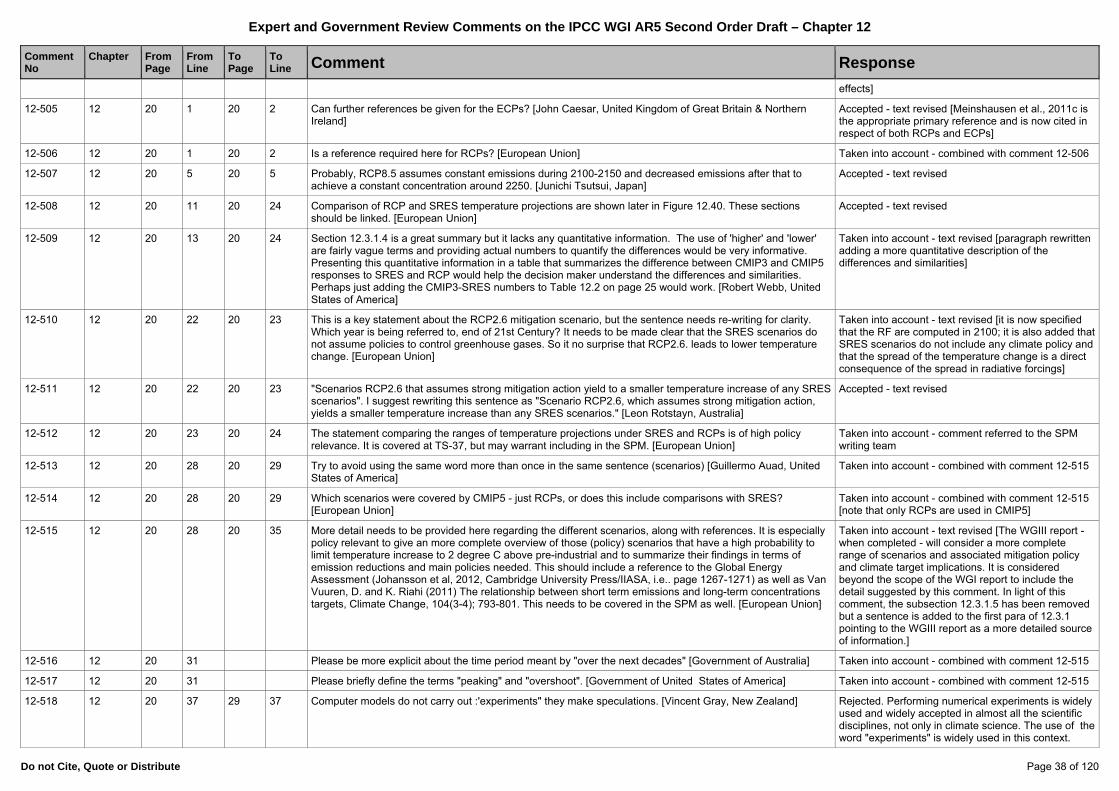
Expert and Government Review Comments on the IPCC WGI AR5 Second Order Draft – Chapter 12
Do not Cite, Quote or Distribute Page 38 of 120
Comment No
Chapter
FromPage
FromLine
To Page
To Line Comment Response
effects]
12-505 12 20 1 20 2 Can further references be given for the ECPs? [John Caesar, United Kingdom of Great Britain & Northern Ireland]
Accepted - text revised [Meinshausen et al., 2011c is the appropriate primary reference and is now cited in respect of both RCPs and ECPs]
12-506 12 20 1 20 2 Is a reference required here for RCPs? [European Union] Taken into account - combined with comment 12-506
12-507 12 20 5 20 5 Probably, RCP8.5 assumes constant emissions during 2100-2150 and decreased emissions after that to achieve a constant concentration around 2250. [Junichi Tsutsui, Japan]
Accepted - text revised
12-508 12 20 11 20 24 Comparison of RCP and SRES temperature projections are shown later in Figure 12.40. These sections should be linked. [European Union]
Accepted - text revised
12-509 12 20 13 20 24 Section 12.3.1.4 is a great summary but it lacks any quantitative information. The use of 'higher' and 'lower' are fairly vague terms and providing actual numbers to quantify the differences would be very informative. Presenting this quantitative information in a table that summarizes the difference between CMIP3 and CMIP5 responses to SRES and RCP would help the decision maker understand the differences and similarities. Perhaps just adding the CMIP3-SRES numbers to Table 12.2 on page 25 would work. [Robert Webb, United States of America]
Taken into account - text revised [paragraph rewritten adding a more quantitative description of the differences and similarities]
12-510 12 20 22 20 23 This is a key statement about the RCP2.6 mitigation scenario, but the sentence needs re-writing for clarity. Which year is being referred to, end of 21st Century? It needs to be made clear that the SRES scenarios do not assume policies to control greenhouse gases. So it no surprise that RCP2.6. leads to lower temperature change. [European Union]
Taken into account - text revised [it is now specified that the RF are computed in 2100; it is also added that SRES scenarios do not include any climate policy and that the spread of the temperature change is a direct consequence of the spread in radiative forcings]
12-511 12 20 22 20 23 "Scenarios RCP2.6 that assumes strong mitigation action yield to a smaller temperature increase of any SRESscenarios". I suggest rewriting this sentence as "Scenario RCP2.6, which assumes strong mitigation action, yields a smaller temperature increase than any SRES scenarios." [Leon Rotstayn, Australia]
Accepted - text revised
12-512 12 20 23 20 24 The statement comparing the ranges of temperature projections under SRES and RCPs is of high policy relevance. It is covered at TS-37, but may warrant including in the SPM. [European Union]
Taken into account - comment referred to the SPM writing team
12-513 12 20 28 20 29 Try to avoid using the same word more than once in the same sentence (scenarios) [Guillermo Auad, United States of America]
Taken into account - combined with comment 12-515
12-514 12 20 28 20 29 Which scenarios were covered by CMIP5 - just RCPs, or does this include comparisons with SRES? [European Union]
Taken into account - combined with comment 12-515 [note that only RCPs are used in CMIP5]
12-515 12 20 28 20 35 More detail needs to be provided here regarding the different scenarios, along with references. It is especially policy relevant to give an more complete overview of those (policy) scenarios that have a high probability to limit temperature increase to 2 degree C above pre-industrial and to summarize their findings in terms of emission reductions and main policies needed. This should include a reference to the Global Energy Assessment (Johansson et al, 2012, Cambridge University Press/IIASA, i.e.. page 1267-1271) as well as Van Vuuren, D. and K. Riahi (2011) The relationship between short term emissions and long-term concentrations targets, Climate Change, 104(3-4); 793-801. This needs to be covered in the SPM as well. [European Union]
Taken into account - text revised [The WGIII report - when completed - will consider a more complete range of scenarios and associated mitigation policy and climate target implications. It is considered beyond the scope of the WGI report to include the detail suggested by this comment. In light of this comment, the subsection 12.3.1.5 has been removed but a sentence is added to the first para of 12.3.1 pointing to the WGIII report as a more detailed source of information.]
12-516 12 20 31 Please be more explicit about the time period meant by "over the next decades" [Government of Australia] Taken into account - combined with comment 12-515
12-517 12 20 31 Please briefly define the terms "peaking" and "overshoot". [Government of United States of America] Taken into account - combined with comment 12-515
12-518 12 20 37 29 37 Computer models do not carry out :'experiments" they make speculations. [Vincent Gray, New Zealand] Rejected. Performing numerical experiments is widely used and widely accepted in almost all the scientific disciplines, not only in climate science. The use of the word "experiments" is widely used in this context.
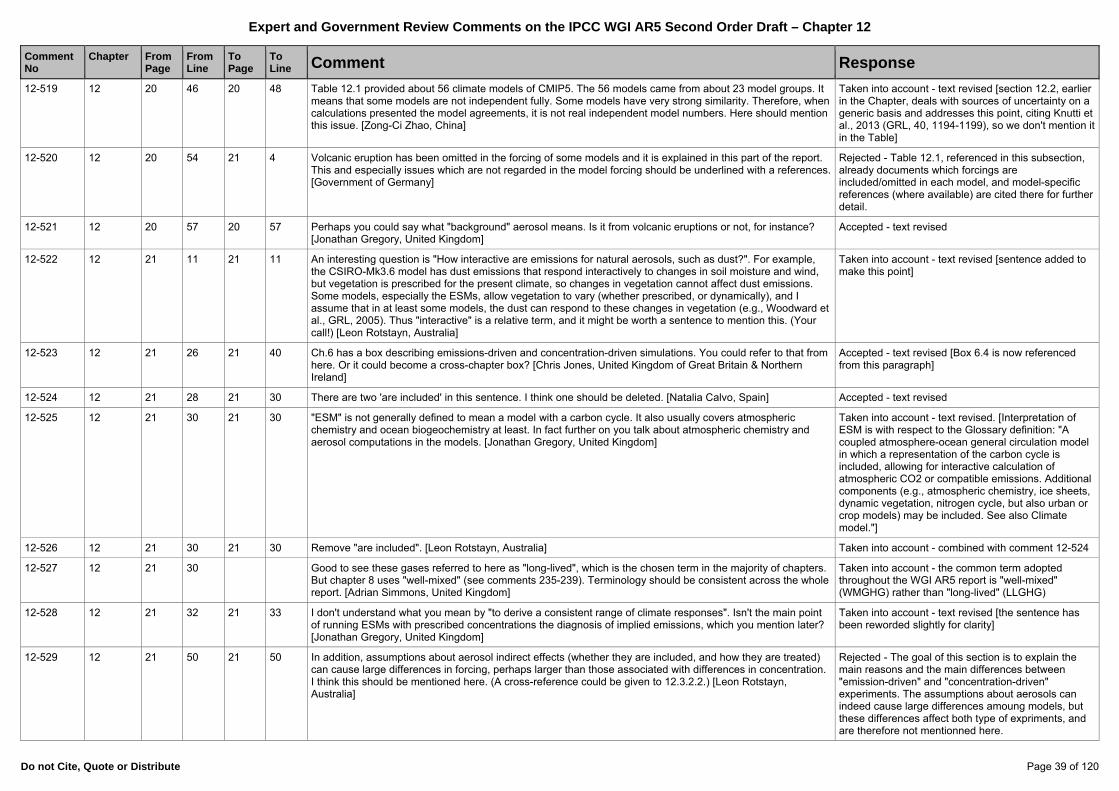
Expert and Government Review Comments on the IPCC WGI AR5 Second Order Draft – Chapter 12
Do not Cite, Quote or Distribute Page 39 of 120
Comment No
Chapter
FromPage
FromLine
To Page
To Line Comment Response
12-519 12 20 46 20 48 Table 12.1 provided about 56 climate models of CMIP5. The 56 models came from about 23 model groups. It means that some models are not independent fully. Some models have very strong similarity. Therefore, when calculations presented the model agreements, it is not real independent model numbers. Here should mention this issue. [Zong-Ci Zhao, China]
Taken into account - text revised [section 12.2, earlier in the Chapter, deals with sources of uncertainty on a generic basis and addresses this point, citing Knutti et al., 2013 (GRL, 40, 1194-1199), so we don't mention it in the Table]
12-520 12 20 54 21 4 Volcanic eruption has been omitted in the forcing of some models and it is explained in this part of the report. This and especially issues which are not regarded in the model forcing should be underlined with a references. [Government of Germany]
Rejected - Table 12.1, referenced in this subsection, already documents which forcings are included/omitted in each model, and model-specific references (where available) are cited there for further detail.
12-521 12 20 57 20 57 Perhaps you could say what "background" aerosol means. Is it from volcanic eruptions or not, for instance? [Jonathan Gregory, United Kingdom]
Accepted - text revised
12-522 12 21 11 21 11 An interesting question is "How interactive are emissions for natural aerosols, such as dust?". For example, the CSIRO-Mk3.6 model has dust emissions that respond interactively to changes in soil moisture and wind, but vegetation is prescribed for the present climate, so changes in vegetation cannot affect dust emissions. Some models, especially the ESMs, allow vegetation to vary (whether prescribed, or dynamically), and I assume that in at least some models, the dust can respond to these changes in vegetation (e.g., Woodward et al., GRL, 2005). Thus "interactive" is a relative term, and it might be worth a sentence to mention this. (Your call!) [Leon Rotstayn, Australia]
Taken into account - text revised [sentence added to make this point]
12-523 12 21 26 21 40 Ch.6 has a box describing emissions-driven and concentration-driven simulations. You could refer to that from here. Or it could become a cross-chapter box? [Chris Jones, United Kingdom of Great Britain & Northern Ireland]
Accepted - text revised [Box 6.4 is now referenced from this paragraph]
12-524 12 21 28 21 30 There are two 'are included' in this sentence. I think one should be deleted. [Natalia Calvo, Spain] Accepted - text revised
12-525 12 21 30 21 30 "ESM" is not generally defined to mean a model with a carbon cycle. It also usually covers atmospheric chemistry and ocean biogeochemistry at least. In fact further on you talk about atmospheric chemistry and aerosol computations in the models. [Jonathan Gregory, United Kingdom]
Taken into account - text revised. [Interpretation of ESM is with respect to the Glossary definition: "A coupled atmosphere-ocean general circulation model in which a representation of the carbon cycle is included, allowing for interactive calculation of atmospheric CO2 or compatible emissions. Additional components (e.g., atmospheric chemistry, ice sheets, dynamic vegetation, nitrogen cycle, but also urban or crop models) may be included. See also Climate model."]
12-526 12 21 30 21 30 Remove "are included". [Leon Rotstayn, Australia] Taken into account - combined with comment 12-524
12-527 12 21 30 Good to see these gases referred to here as "long-lived", which is the chosen term in the majority of chapters. But chapter 8 uses "well-mixed" (see comments 235-239). Terminology should be consistent across the whole report. [Adrian Simmons, United Kingdom]
Taken into account - the common term adopted throughout the WGI AR5 report is "well-mixed" (WMGHG) rather than "long-lived" (LLGHG)
12-528 12 21 32 21 33 I don't understand what you mean by "to derive a consistent range of climate responses". Isn't the main point of running ESMs with prescribed concentrations the diagnosis of implied emissions, which you mention later? [Jonathan Gregory, United Kingdom]
Taken into account - text revised [the sentence has been reworded slightly for clarity]
12-529 12 21 50 21 50 In addition, assumptions about aerosol indirect effects (whether they are included, and how they are treated) can cause large differences in forcing, perhaps larger than those associated with differences in concentration. I think this should be mentioned here. (A cross-reference could be given to 12.3.2.2.) [Leon Rotstayn, Australia]
Rejected - The goal of this section is to explain the main reasons and the main differences between "emission-driven" and "concentration-driven" experiments. The assumptions about aerosols can indeed cause large differences amoung models, but these differences affect both type of expriments, and are therefore not mentionned here.
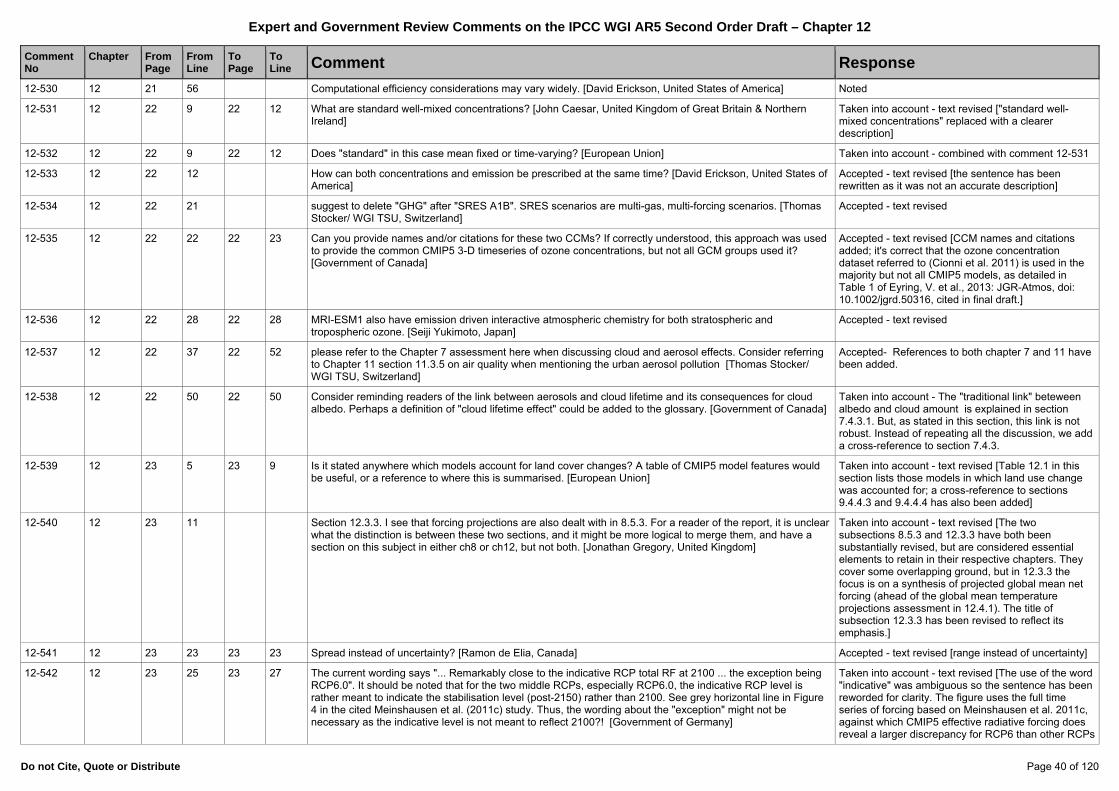
Expert and Government Review Comments on the IPCC WGI AR5 Second Order Draft – Chapter 12
Do not Cite, Quote or Distribute Page 40 of 120
Comment No
Chapter
FromPage
FromLine
To Page
To Line Comment Response
12-530 12 21 56 Computational efficiency considerations may vary widely. [David Erickson, United States of America] Noted
12-531 12 22 9 22 12 What are standard well-mixed concentrations? [John Caesar, United Kingdom of Great Britain & Northern Ireland]
Taken into account - text revised ["standard well-mixed concentrations" replaced with a clearer description]
12-532 12 22 9 22 12 Does "standard" in this case mean fixed or time-varying? [European Union] Taken into account - combined with comment 12-531
12-533 12 22 12 How can both concentrations and emission be prescribed at the same time? [David Erickson, United States of America]
Accepted - text revised [the sentence has been rewritten as it was not an accurate description]
12-534 12 22 21 suggest to delete "GHG" after "SRES A1B". SRES scenarios are multi-gas, multi-forcing scenarios. [Thomas Stocker/ WGI TSU, Switzerland]
Accepted - text revised
12-535 12 22 22 22 23 Can you provide names and/or citations for these two CCMs? If correctly understood, this approach was used to provide the common CMIP5 3-D timeseries of ozone concentrations, but not all GCM groups used it? [Government of Canada]
Accepted - text revised [CCM names and citations added; it's correct that the ozone concentration dataset referred to (Cionni et al. 2011) is used in the majority but not all CMIP5 models, as detailed in Table 1 of Eyring, V. et al., 2013: JGR-Atmos, doi: 10.1002/jgrd.50316, cited in final draft.]
12-536 12 22 28 22 28 MRI-ESM1 also have emission driven interactive atmospheric chemistry for both stratospheric and tropospheric ozone. [Seiji Yukimoto, Japan]
Accepted - text revised
12-537 12 22 37 22 52 please refer to the Chapter 7 assessment here when discussing cloud and aerosol effects. Consider referring to Chapter 11 section 11.3.5 on air quality when mentioning the urban aerosol pollution [Thomas Stocker/ WGI TSU, Switzerland]
Accepted- References to both chapter 7 and 11 have been added.
12-538 12 22 50 22 50 Consider reminding readers of the link between aerosols and cloud lifetime and its consequences for cloud albedo. Perhaps a definition of "cloud lifetime effect" could be added to the glossary. [Government of Canada]
Taken into account - The "traditional link" beteween albedo and cloud amount is explained in section 7.4.3.1. But, as stated in this section, this link is not robust. Instead of repeating all the discussion, we add a cross-reference to section 7.4.3.
12-539 12 23 5 23 9 Is it stated anywhere which models account for land cover changes? A table of CMIP5 model features would be useful, or a reference to where this is summarised. [European Union]
Taken into account - text revised [Table 12.1 in this section lists those models in which land use change was accounted for; a cross-reference to sections 9.4.4.3 and 9.4.4.4 has also been added]
12-540 12 23 11 Section 12.3.3. I see that forcing projections are also dealt with in 8.5.3. For a reader of the report, it is unclear what the distinction is between these two sections, and it might be more logical to merge them, and have a section on this subject in either ch8 or ch12, but not both. [Jonathan Gregory, United Kingdom]
Taken into account - text revised [The two subsections 8.5.3 and 12.3.3 have both been substantially revised, but are considered essential elements to retain in their respective chapters. They cover some overlapping ground, but in 12.3.3 the focus is on a synthesis of projected global mean net forcing (ahead of the global mean temperature projections assessment in 12.4.1). The title of subsection 12.3.3 has been revised to reflect its emphasis.]
12-541 12 23 23 23 23 Spread instead of uncertainty? [Ramon de Elia, Canada] Accepted - text revised [range instead of uncertainty]
12-542 12 23 25 23 27 The current wording says "... Remarkably close to the indicative RCP total RF at 2100 ... the exception being RCP6.0". It should be noted that for the two middle RCPs, especially RCP6.0, the indicative RCP level is rather meant to indicate the stabilisation level (post-2150) rather than 2100. See grey horizontal line in Figure 4 in the cited Meinshausen et al. (2011c) study. Thus, the wording about the "exception" might not be necessary as the indicative level is not meant to reflect 2100?! [Government of Germany]
Taken into account - text revised [The use of the word "indicative" was ambiguous so the sentence has been reworded for clarity. The figure uses the full time series of forcing based on Meinshausen et al. 2011c, against which CMIP5 effective radiative forcing does reveal a larger discrepancy for RCP6 than other RCPs

Expert and Government Review Comments on the IPCC WGI AR5 Second Order Draft – Chapter 12
Do not Cite, Quote or Distribute Page 41 of 120
Comment No
Chapter
FromPage
FromLine
To Page
To Line Comment Response
at 2100.]
12-543 12 23 27 23 27 Should the number 0.6 Wm-2 be 0.8 Wm-2 or is it taken into account differences between 1750 and 1850? [Gunnar Myhre, Norway]
Taken into account - text revised [previously RF values computed by the IAMs were given relative to 1750 - this has been modified to 1850 instead; the difference for the RCP6.0 scenario is now 0.4 Wm-2]
12-544 12 23 40 23 40 What is ACCMIP? [Government of Canada] Taken into account - combined with comment 12-545
12-545 12 23 40 23 40 The ACCMIP models have not been introduced so far. Please provide a brief introduction to these models and the acronym here. [Thomas Stocker/ WGI TSU, Switzerland]
Taken into account - text revised [ACCMIP acronym is expanded, a primary reference for ACCMIP - Lamarque et al. 2013 - is cited, and subsection 8.2.2 which first discusses ACCMIP results and identifies the relationship between ACCMIP and CMIP5 models is cross-referenced]
12-546 12 23 47 23 52 An important point regarding nitrate aerosols - has this been investigated in other models, or can anything be said regarding the reliability of these findings from the two models stated and on the impact on global temperature change? [European Union]
Taken into account - text revised [it now refers to the robust physical understanding and modelling evidence about expected future trends in nitrate aerosol with ref to section 8.5.3; there is insufficient evidence to comment about the impact on global temperature, although this could be inferred approximately from the projected change in nitrate RF relative to total RF (Figure 8.20)]
12-547 12 23 49 23 52 I suggest adding "the magnitude of" before "aerosol forcing" or "aerosol-related RF" each time it is used in this paragraph. It might also be helpful to add "(negative)" before "aerosol forcing" at line 49. Otherwise, perhaps it is possible to rewrite the paragraph using terms like "more negative" and "less negative" (e.g., Section 8.5.3). [Leon Rotstayn, Australia]
Accepted - text revised [the paragraph has been rewritten]
12-548 12 24 1 24 1 "solar" should be "changes in solar" [Manoj Joshi, United Kingdom of Great Britain & Northern Ireland] Accepted - text revised
12-549 12 24 26 24 51 Figure 12.5 indicated the numbers of CMIP5 models. But some of total numbers provided the different simulations based on the same model groups. Therefore, the model similarities are included in the total model numbers. [Zong-Ci Zhao, China]
Taken into account - the figure caption now clarifies that only one ensemble member is used for each model
12-550 12 24 26 26 37 Section 12.4.1.1 Projected Changes in Global Mean Temperature and Precipitation: Text was checked for inconsistencies with own professional experience and competency. No relevant disagreements were detected with considered text. [Dirk Thielen, Venezuela]
Noted!
12-551 12 24 30 suggest to refer to Ch11, Figure 11.33, when discussing the near-term decades 2005-2025. [Thomas Stocker/ WGI TSU, Switzerland]
Accepted - reference is now made to Figure 11.33
12-552 12 24 35 24 38 This is a key policy related statement, but it is not clear precisely when pre-industrial is defined. Whilst it may be the case that small variations in the base-period definition may only make small differences relative to the magnitude of later warming this is still essential. [European Union]
Text revised - pre-industrial is now clearly defined as the average over the 1850-1900 period
12-553 12 24 36 I suggest changing "result" to "potential". [Adrian Simmons, United Kingdom] Accepted!
12-554 12 24 46 24 51 Fig 12.5. It is very confusing indeed, that uncertainty ranges are given in terms of the standard deviation, whereas in other places (SPM, TS) the 5-95 % percentile is used to describe the likely range. [Government of Germany]
Accepted - the 5-95% range across the CMIP5 ensemble is now used in place of the minimum and maximum values
12-555 12 25 1 25 8 The text relevant to table 12.2 might want to point out that the RCP2.6 global changes in saurface air temperature is the only CIMP5 experiment where we see a DECREASING trend post 2100. [Stephanie Downes, Australia]
Accepted - the text has been edited
12-556 12 25 11 25 11 Table 12.2. In the corresponding table (13.5) of sea level projections, we give the mean and the 5-95% range, not the standard deviation or the extrema. Should we be consistent? The 5-95% is what we give in the SPM,
Accepted - the 5-95% range across the CMIP5 ensemble is now used in place of the minimum and

Expert and Government Review Comments on the IPCC WGI AR5 Second Order Draft – Chapter 12
Do not Cite, Quote or Distribute Page 42 of 120
Comment No
Chapter
FromPage
FromLine
To Page
To Line Comment Response
and thus has the advantage of traceability. The extrema depend more strongly on selection of models. [Jonathan Gregory, United Kingdom]
maximum values
12-557 12 25 11 25 14 I'm very happy to see the intermediate time slices represented in this table, along with their estimated uncertainties. I'm even happier to see these reproduced in Table SPM.2 of the SPM! [Timothy Carter, Finland]
Noted!
12-558 12 25 11 25 14 Table 12.2: This is an important table that may be read in isolation from other parts of the assessment. Please include some text in the table description that indicates that 0.6 degrees Celsius needs to be added to these figures to make them relative to pre-industrial. [Government of Australia]
Accepted - the observed differences from 1986-2005 of various other periods are now included in the table caption
12-559 12 25 11 25 14 Table 12.2 and other references in this chapter and elsewhere to 1986-2005 - without an additional note on how these numbers relate to pre-industrial and 1961-90, it just adds an unnecessary layer of complexity to add a new 20 year baseline. This is a significant weakness of the whole SOD. [Government of United Kingdom of Great Britain & Northern Ireland]
Accepted - the observed differences from 1986-2005 of various other periods are now included in the table caption
12-560 12 25 11 25 15 Tab 12.2. It is very confusing indeed, that the temperature intervals indicating the possible range (likelihood not given) in this table are not consistent with those given in the TS and SPM. In addition, uncertainty ranges are given in terms of the standard deviation. [Government of Germany]
Accepted - the 5-95% range across the CMIP5 ensemble is now used in place of the minimum and maximum values
12-561 12 25 11 25 15 Tab 12.2. Warming should be given wrt to pre-industrial levels as this is the information needed by policy makers. If this is not possible, the Information of the warming from pre-industrial to 1986-2005 should be provided, so that users can calculate the numbers they need from the table IPCC provides (they will do anyway, so please help). [Government of Germany]
Accepted - the observed differences from 1986-2005 of various other periods are now included in the table caption
12-562 12 25 11 Table 12.2: Table was checked for inconsistencies with own professional experience and competency. No relevant disagreements were detected. [Dirk Thielen, Venezuela]
Noted!
12-563 12 25 11 Table 12.2: Global mean surface air temperature: we suggest to refer here to Chapter 11, 11.3.2.1.1, which includes ASK-scaled 2016-2035 period. It seems important to discuss and explain the differences between the purely CMIP5 based and the ASK-scaled projections for the near-term. A reader will need to be explained why Chapters 11 and 12 provide differing numbers for the projected changes in global mean surface air temperature for the 2016-2035 period and which numbers to use/quote/cite. The same comment will be made to Chapter 11. [Thomas Stocker/ WGI TSU, Switzerland]
Taken into account - the 2016-2035 row of Table 12.2 has been removed and an additional table giving the assessed likelihoods for the 2081-2100 period, following Table 11.3
12-564 12 25 13 25 13 Please add a unit (e.g. °C) to the values or in the table caption. [Government of Germany] Accepted - the caption has been edited
12-565 12 25 22 25 22 "discussed in section". [J. Graham Cogley, Canada] Accepted - "in" has been inserted in the text
12-566 12 25 32 25 34 The same is discussed in Chapter 7,9,11. This seems as a cross-chapter issue and should be describe more comprehensive in one chapter and the other chapters refer to that. [Gunnar Myhre, Norway]
Accepted - Most of the discussion is now in chapter 7, an only a summary is included in chapter 12
12-567 12 25 35 25 35 Clapeyron spelt wrongly [Manoj Joshi, United Kingdom of Great Britain & Northern Ireland] Accepted! The spelling has been checked
12-568 12 25 35 Discuss/explain the Clausius-Claperon implications. [David Erickson, United States of America] Accepted! The implications of Clausius Claperon has been discussed
12-569 12 25 37 I think Mitchell et al 1987 may be a better reference than Mitchell 1983 on this point. Ref: Mitchell, J. F. B., Wilson, C. A. and Cunnington, W. M., 1987: On CO2 climate sensitivity and model dependence of results. Quarterly Journal of the Royal Meteorological Society, 113, 293-322. [Mark Webb, United Kingdom of Great Britain & Northern Ireland]
Accepted! The reference has been included
12-570 12 25 37 I think that a citation of Previdi 2010 would be appropriate here also. Ref: Previdi, M. (2010) Radiative feedbacks on global precipitation, Environ. Res. Lett., 5, 025211 [Mark Webb, United Kingdom of Great Britain & Northern Ireland]
Accepted! The reference has been included
12-571 12 26 1 26 1 Typo: Change "precipitations" to "precipitation". [Government of Canada] Accepted! Typo has been changed
12-572 12 26 1 26 1 precipitations should be precipitation [Manoj Joshi, United Kingdom of Great Britain & Northern Ireland] Accepted! Typo has been changed
12-573 12 26 1 26 6 In line 6 recommend inserting: "A quantitative comprehensive Line By Line Planck weighted global optical Rejected - The change in average global optical

Expert and Government Review Comments on the IPCC WGI AR5 Second Order Draft – Chapter 12
Do not Cite, Quote or Distribute Page 43 of 120
Comment No
Chapter
FromPage
FromLine
To Page
To Line Comment Response
depth for all the significant green house gases (except oxygen and nitrogen) shows an average global optical depth of 1.87 (Miskolczi 2010). The 61 year trend in atmospheric absorption A is 5.4×10⁻³ % per decade, primarily from water vapor variation." Source: "Ferenc M. Miksolczi (2011) The Stable Stationary Value of the Earth's Global Average Atmospheric Planck-Weighted Greenhouse-Gas Optical Thickness. Energy and Environment Vol. 21 No. 4 pp 243-262." [David L. Hagen, United States of America]
depth is primarily driven by the change in water vapour. In the referenced paper, the authors use an ensemble of radiosonde atmospheric profiles to perform their radiative computation but they provide no information on the number of profiles, their locations, how they control the quality of their data. They do not provide any uncertainty estimate. On their figure 9, they show that the total amount of water vapour decreases in the data they use. This is not consistent with current estimates of water vapour trend (see references in section 2.5.6. This suggests that the data the authors use are not adequate to estimate global average trends.
12-574 12 26 3 26 3 0.08 not -0.008? [Jouni Räisänen, Finland] Taken into account - You are right, however this text has been removed from the final version as it dis not provide useful information
12-575 12 26 4 26 4 Typo: Remove brackets around Andrew et al., 2009. (i.e., replace with: Andrew et al., (2009)). [Government of Canada]
Accepted
12-576 12 26 6 26 6 We suggest adding the citation: Yang, F., et al., 2003: Intensity of Hydrological Cycles in Warmer Climates, J. Climate, 16, 2419-2423. [Government of United States of America]
Accepted - The reference has been included
12-577 12 26 6 26 7 This sentence could be clearer. Consider changing it, for example, to: "Even after the CO2 forcing stabilises or begins to decrease, the ocean continues to warm, which then drives up global temperature, evaporation and precipitation." [Government of Canada]
Accepted - The text has been edited
12-578 12 26 7 26 7 remove "effect of" [Manoj Joshi, United Kingdom of Great Britain & Northern Ireland] Accepted - The text has been edited
12-579 12 26 7 11 An additional, non-linear, precipitation response may amplify both effects (both the steepening of dP v dT and Wu's precipitation overshoot). The rate of precipitation increase with temperature at constant CO2 was shown to decrease with increasing co2 in HadCM3 (Good et al, citation at end) (this also happens in HadGEM2-ES - unpublished work, available on request). Good et al. showed this substantially increased Wu et al's overshoot in HadCM3. It could have a comparable effect on Figure 12.6 (unpublished work, available on request). Good et al. (2012) A step-response approach for predicting and understanding non-linear precipitation changes. Climate Dynamics: Volume 39, Issue 12 (2012), Page 2789-2803 [Peter Good, United Kingdom]
Accepted - The reference has been added and text has been updated.
12-580 12 26 7 Do you mean to use the word "of" or "on"? [Government of United States of America] Noted! We meant to use "of"
12-581 12 26 8 26 9 change "RCP2.6 and RCP4.5 scenario" to "the RCP 2.6 and RCP4.5 scenarios" [Manoj Joshi, United Kingdom of Great Britain & Northern Ireland]
Accepted! The text has been edited
12-582 12 26 12 26 12 change "me" to "be" [Manoj Joshi, United Kingdom of Great Britain & Northern Ireland] Accepted! The text has been edited
12-583 12 26 12 should read 'response may BE too small' [Peter Good, United Kingdom] Accepted! The text has been edited
12-584 12 26 12 Fix typo: "may me too small" to "may be too small" [David L. Hagen, United States of America] Accepted! The text has been edited
12-585 12 26 14 26 14 change "modify" to "modifies" [Manoj Joshi, United Kingdom of Great Britain & Northern Ireland] Accepted! The text has been edited
12-586 12 26 18 26 18 "spread in the changes" should be "differences"? [Manoj Joshi, United Kingdom of Great Britain & Northern Ireland]
Considered - We do not think that the suggestion is approproate. Indeed, it is nof the diffrences of cloud radiative effect but the differences in their changes that have an impact on precipitation changes.
12-587 12 26 19 26 19 change dominant to important? [Manoj Joshi, United Kingdom of Great Britain & Northern Ireland] Accepted - text revised
12-588 12 26 33 26 33 "global mean temperature in the denominator": is this for convenience? It sounds like an odd way to do the Considered - This way of doing the calculation partly

Expert and Government Review Comments on the IPCC WGI AR5 Second Order Draft – Chapter 12
Do not Cite, Quote or Distribute Page 44 of 120
Comment No
Chapter
FromPage
FromLine
To Page
To Line Comment Response
calculation, probably tending to damp the contrast between land and ocean results. [J. Graham Cogley, Canada]
attenuates the contrast between the changes over land and ocean. Using diffrenet average temperature values over continent and ocean accentuates the contrast of precipitation sensitivty between continent and ocean. But the advantage of having the same surface temperature change is that the denominator is the same for all the values, so they can be added. So we use the same average temperature in the denomiator, although other choices are possible.
12-589 12 26 37 26 37 "changes". [J. Graham Cogley, Canada] Accepted - text revised
12-590 12 26 39 27 57 This section explains the reasoning behind the choices for characterizing the uncertainty of model results in AR5. We have some questions on this section: 1) It is assumed that the data are normally distributed, because 1.64 times the standard deviation is used as the 5-95% percentiles. Please explain, why this assumption of symmetry is justified for model results across all parameters analyzed and across all RCPs. 2) Please explain why the 5-95% percentiles have been chosen to characterize uncertainty. This seems quite an arbitrary choice that is rather based on an expert judgement than on mathematical/logcial reasoning. [Government of Germany]
We have extended the discussion at the end of paragraph 2 to explain this. "For the RCPs, the carbon cycle climate feedback uncertainty is not included because the simulations are driven by concentrations, and there is no clear evidence for the distribution of CMIP5 global temperature changes to deviate from a normal distribution. For most other variables the shape of the distribution is unclear, and standard deviations are simply used as an indication of model spread, not representing a formal uncertainty assessment". Regarding 2), any choice of percentiles is a choice of presentation. 5-95% is defined as the default in AR5.
12-591 12 26 39 27 57 This section explains the reasoning behind the choices for characterizing the uncertainty of model results in AR5. We have some questions on this section: CONTINUED 3) Please explain why the the 5-95% percentile, which by definition contains 90% of the data is called the likely range, which according the to IPCC-definition contains only 66-100% of the data. If the scaling down of likelihood is due to the fact that the model diversity is assumed to be lower than the real uncertainty, this choice is reflecting an expert judgement, and is not a probabilistic statement. According to the IPCC uncertainty language such statements cannot be qualified by a probabilistic term, but a confidence interval must be given. This is very important as the intervals for temperature increase and SLR are highly politically relevant. IPCC should not pretent more certainty to statement than there actually exists. 4) The first para on page 27 gives an explanation for attributing a likely. [Government of Germany]
There was no claim the these ranges are probabilistic, nor were they intended to be. That is stated at the very beginning of 12.4.1.2. As the reviewer notes, the 5-95% is simply used for an expert assessment. So the interpretation of the "likely" is as in AR4. To make this explicit, we added the following sentence: "The likely ranges are an expert assessment, taking into account many lines of evidence, and are not probabilistic."
12-592 12 26 39 27 57 This section explains the reasoning behind the choices for characterizing the uncertainty of model results in AR5. We have some questions on this section: CONTINUED 4) The first para on page 27 gives an explanation for attributing a likely probability to the 5-95% percentile, based on TCR and ECR analysis, this is however not comprehensible, even after several readings, please improve as it is a very important to understand the choices for uncretainty ranges. [Government of Germany]
We agree that the argument here is somewhat technical, but clearly explained and documented in the literature. The same scaling argument was already used in AR4, see Appendix. 10.A.1, and the basis for the uncertainty ranges in AR4, see Fig. 10.29. We have slightly changed the wording and now also refer to AR4 Appendix 10.A.1 for further details.
12-593 12 26 39 27 57 This section explains the reasoning behind the choices for characterizing the uncertainty of model results in AR5. We have some questions on this section: CONTINUED 5) The para from lines 23-27 explains why a different interval than in AR4 has been chosen. In AR4 the interval was assymetric, wy not in AR5? You mention only RCP2.6, but what about higher RCPs, is the C-cylce included? Fig. 12.5 suggests that the uncertainty of RCP8.5 is higher, but it seems still symmetric. Uncertainty statements and ranges of T-increase and SLR from AR4 should be comparable with those of AR5. [Government of Germany]
An explanation was added that the concentration driven results to not indicate asymmetric ranges. In contrast in AR4 the uncertainties were estimate for emission driven simulations.
12-594 12 26 39 The title should be changed to something more like "Uncertainty in global temperature" considering this is the only field discussed in this subsection. The current title implies multiple fields are discussed. [Stephanie Downes, Australia]
Rejected. Section refers to a table with precipitation changes as well.
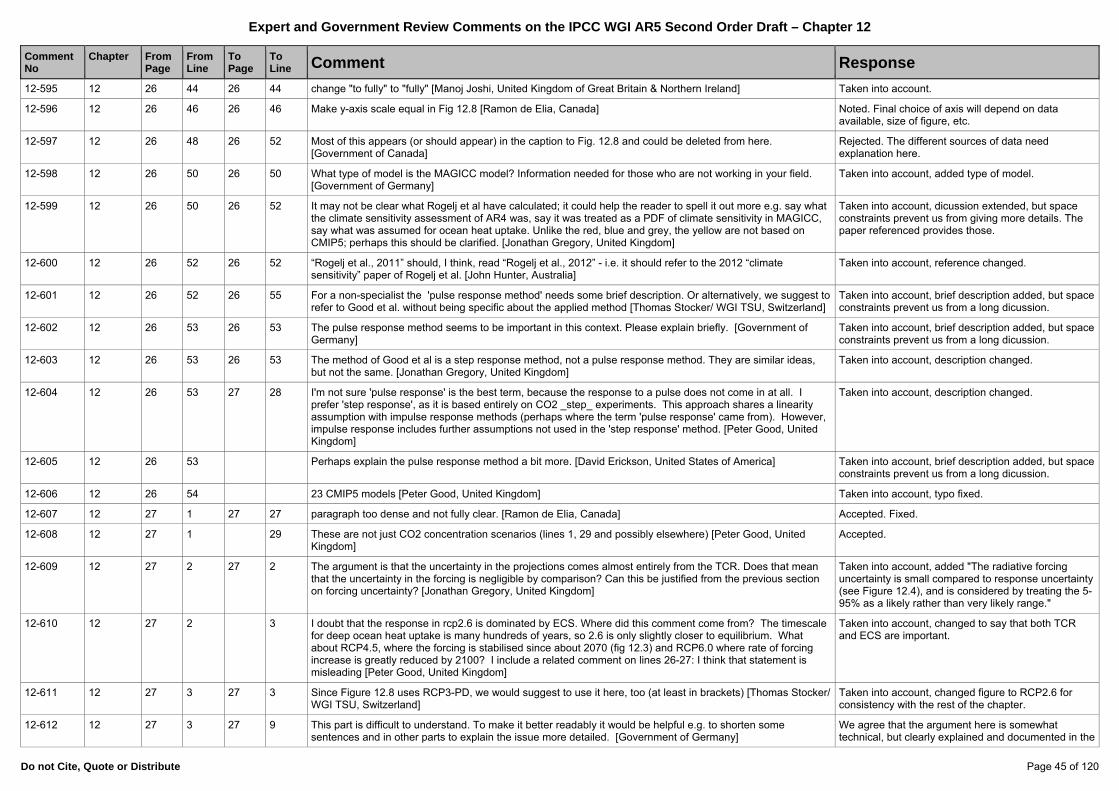
Expert and Government Review Comments on the IPCC WGI AR5 Second Order Draft – Chapter 12
Do not Cite, Quote or Distribute Page 45 of 120
Comment No
Chapter
FromPage
FromLine
To Page
To Line Comment Response
12-595 12 26 44 26 44 change "to fully" to "fully" [Manoj Joshi, United Kingdom of Great Britain & Northern Ireland] Taken into account.
12-596 12 26 46 26 46 Make y-axis scale equal in Fig 12.8 [Ramon de Elia, Canada] Noted. Final choice of axis will depend on data available, size of figure, etc.
12-597 12 26 48 26 52 Most of this appears (or should appear) in the caption to Fig. 12.8 and could be deleted from here. [Government of Canada]
Rejected. The different sources of data need explanation here.
12-598 12 26 50 26 50 What type of model is the MAGICC model? Information needed for those who are not working in your field. [Government of Germany]
Taken into account, added type of model.
12-599 12 26 50 26 52 It may not be clear what Rogelj et al have calculated; it could help the reader to spell it out more e.g. say what the climate sensitivity assessment of AR4 was, say it was treated as a PDF of climate sensitivity in MAGICC, say what was assumed for ocean heat uptake. Unlike the red, blue and grey, the yellow are not based on CMIP5; perhaps this should be clarified. [Jonathan Gregory, United Kingdom]
Taken into account, dicussion extended, but space constraints prevent us from giving more details. The paper referenced provides those.
12-600 12 26 52 26 52 “Rogelj et al., 2011” should, I think, read “Rogelj et al., 2012” - i.e. it should refer to the 2012 “climate sensitivity” paper of Rogelj et al. [John Hunter, Australia]
Taken into account, reference changed.
12-601 12 26 52 26 55 For a non-specialist the 'pulse response method' needs some brief description. Or alternatively, we suggest to refer to Good et al. without being specific about the applied method [Thomas Stocker/ WGI TSU, Switzerland]
Taken into account, brief description added, but space constraints prevent us from a long dicussion.
12-602 12 26 53 26 53 The pulse response method seems to be important in this context. Please explain briefly. [Government of Germany]
Taken into account, brief description added, but space constraints prevent us from a long dicussion.
12-603 12 26 53 26 53 The method of Good et al is a step response method, not a pulse response method. They are similar ideas, but not the same. [Jonathan Gregory, United Kingdom]
Taken into account, description changed.
12-604 12 26 53 27 28 I'm not sure 'pulse response' is the best term, because the response to a pulse does not come in at all. I prefer 'step response', as it is based entirely on CO2 _step_ experiments. This approach shares a linearity assumption with impulse response methods (perhaps where the term 'pulse response' came from). However, impulse response includes further assumptions not used in the 'step response' method. [Peter Good, United Kingdom]
Taken into account, description changed.
12-605 12 26 53 Perhaps explain the pulse response method a bit more. [David Erickson, United States of America] Taken into account, brief description added, but space constraints prevent us from a long dicussion.
12-606 12 26 54 23 CMIP5 models [Peter Good, United Kingdom] Taken into account, typo fixed.
12-607 12 27 1 27 27 paragraph too dense and not fully clear. [Ramon de Elia, Canada] Accepted. Fixed.
12-608 12 27 1 29 These are not just CO2 concentration scenarios (lines 1, 29 and possibly elsewhere) [Peter Good, United Kingdom]
Accepted.
12-609 12 27 2 27 2 The argument is that the uncertainty in the projections comes almost entirely from the TCR. Does that mean that the uncertainty in the forcing is negligible by comparison? Can this be justified from the previous section on forcing uncertainty? [Jonathan Gregory, United Kingdom]
Taken into account, added "The radiative forcing uncertainty is small compared to response uncertainty (see Figure 12.4), and is considered by treating the 5-95% as a likely rather than very likely range."
12-610 12 27 2 3 I doubt that the response in rcp2.6 is dominated by ECS. Where did this comment come from? The timescale for deep ocean heat uptake is many hundreds of years, so 2.6 is only slightly closer to equilibrium. What about RCP4.5, where the forcing is stabilised since about 2070 (fig 12.3) and RCP6.0 where rate of forcing increase is greatly reduced by 2100? I include a related comment on lines 26-27: I think that statement is misleading [Peter Good, United Kingdom]
Taken into account, changed to say that both TCR and ECS are important.
12-611 12 27 3 27 3 Since Figure 12.8 uses RCP3-PD, we would suggest to use it here, too (at least in brackets) [Thomas Stocker/ WGI TSU, Switzerland]
Taken into account, changed figure to RCP2.6 for consistency with the rest of the chapter.
12-612 12 27 3 27 9 This part is difficult to understand. To make it better readably it would be helpful e.g. to shorten some sentences and in other parts to explain the issue more detailed. [Government of Germany]
We agree that the argument here is somewhat technical, but clearly explained and documented in the
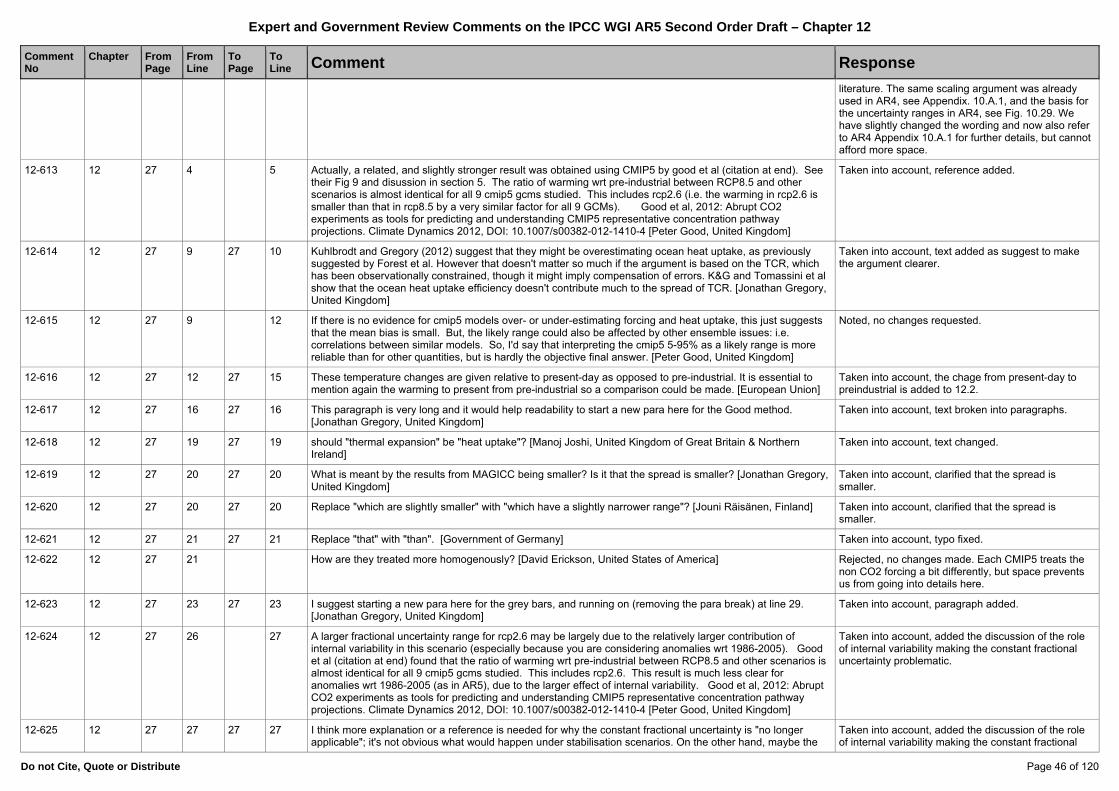
Expert and Government Review Comments on the IPCC WGI AR5 Second Order Draft – Chapter 12
Do not Cite, Quote or Distribute Page 46 of 120
Comment No
Chapter
FromPage
FromLine
To Page
To Line Comment Response
literature. The same scaling argument was already used in AR4, see Appendix. 10.A.1, and the basis for the uncertainty ranges in AR4, see Fig. 10.29. We have slightly changed the wording and now also refer to AR4 Appendix 10.A.1 for further details, but cannot afford more space.
12-613 12 27 4 5 Actually, a related, and slightly stronger result was obtained using CMIP5 by good et al (citation at end). See their Fig 9 and disussion in section 5. The ratio of warming wrt pre-industrial between RCP8.5 and other scenarios is almost identical for all 9 cmip5 gcms studied. This includes rcp2.6 (i.e. the warming in rcp2.6 is smaller than that in rcp8.5 by a very similar factor for all 9 GCMs). Good et al, 2012: Abrupt CO2 experiments as tools for predicting and understanding CMIP5 representative concentration pathway projections. Climate Dynamics 2012, DOI: 10.1007/s00382-012-1410-4 [Peter Good, United Kingdom]
Taken into account, reference added.
12-614 12 27 9 27 10 Kuhlbrodt and Gregory (2012) suggest that they might be overestimating ocean heat uptake, as previously suggested by Forest et al. However that doesn't matter so much if the argument is based on the TCR, which has been observationally constrained, though it might imply compensation of errors. K&G and Tomassini et al show that the ocean heat uptake efficiency doesn't contribute much to the spread of TCR. [Jonathan Gregory, United Kingdom]
Taken into account, text added as suggest to make the argument clearer.
12-615 12 27 9 12 If there is no evidence for cmip5 models over- or under-estimating forcing and heat uptake, this just suggests that the mean bias is small. But, the likely range could also be affected by other ensemble issues: i.e. correlations between similar models. So, I'd say that interpreting the cmip5 5-95% as a likely range is more reliable than for other quantities, but is hardly the objective final answer. [Peter Good, United Kingdom]
Noted, no changes requested.
12-616 12 27 12 27 15 These temperature changes are given relative to present-day as opposed to pre-industrial. It is essential to mention again the warming to present from pre-industrial so a comparison could be made. [European Union]
Taken into account, the chage from present-day to preindustrial is added to 12.2.
12-617 12 27 16 27 16 This paragraph is very long and it would help readability to start a new para here for the Good method. [Jonathan Gregory, United Kingdom]
Taken into account, text broken into paragraphs.
12-618 12 27 19 27 19 should "thermal expansion" be "heat uptake"? [Manoj Joshi, United Kingdom of Great Britain & Northern Ireland]
Taken into account, text changed.
12-619 12 27 20 27 20 What is meant by the results from MAGICC being smaller? Is it that the spread is smaller? [Jonathan Gregory, United Kingdom]
Taken into account, clarified that the spread is smaller.
12-620 12 27 20 27 20 Replace "which are slightly smaller" with "which have a slightly narrower range"? [Jouni Räisänen, Finland] Taken into account, clarified that the spread is smaller.
12-621 12 27 21 27 21 Replace "that" with "than". [Government of Germany] Taken into account, typo fixed.
12-622 12 27 21 How are they treated more homogenously? [David Erickson, United States of America] Rejected, no changes made. Each CMIP5 treats the non CO2 forcing a bit differently, but space prevents us from going into details here.
12-623 12 27 23 27 23 I suggest starting a new para here for the grey bars, and running on (removing the para break) at line 29. [Jonathan Gregory, United Kingdom]
Taken into account, paragraph added.
12-624 12 27 26 27 A larger fractional uncertainty range for rcp2.6 may be largely due to the relatively larger contribution of internal variability in this scenario (especially because you are considering anomalies wrt 1986-2005). Good et al (citation at end) found that the ratio of warming wrt pre-industrial between RCP8.5 and other scenarios is almost identical for all 9 cmip5 gcms studied. This includes rcp2.6. This result is much less clear for anomalies wrt 1986-2005 (as in AR5), due to the larger effect of internal variability. Good et al, 2012: Abrupt CO2 experiments as tools for predicting and understanding CMIP5 representative concentration pathway projections. Climate Dynamics 2012, DOI: 10.1007/s00382-012-1410-4 [Peter Good, United Kingdom]
Taken into account, added the discussion of the role of internal variability making the constant fractional uncertainty problematic.
12-625 12 27 27 27 27 I think more explanation or a reference is needed for why the constant fractional uncertainty is "no longer applicable"; it's not obvious what would happen under stabilisation scenarios. On the other hand, maybe the
Taken into account, added the discussion of the role of internal variability making the constant fractional

Expert and Government Review Comments on the IPCC WGI AR5 Second Order Draft – Chapter 12
Do not Cite, Quote or Distribute Page 47 of 120
Comment No
Chapter
FromPage
FromLine
To Page
To Line Comment Response
main point is that the -40+60% was largely to take into account C-cycle uncertainties, as the previous sentence says, and this is not needed if the projections are for prescribed concentrations (whereas the AR4 projections were for prescribed emissions). [Jonathan Gregory, United Kingdom]
uncertainty problematic.
12-626 12 27 35 27 36 I don't think this section has established a correspondence with SRES, so the first point ("very consistent") is not justified. [Jonathan Gregory, United Kingdom]
Taken into account, reference to 12.4.9 where that comparison is made.
12-627 12 27 35 27 36 change "very consistent with" to "similar to" [Manoj Joshi, United Kingdom of Great Britain & Northern Ireland] Rejected. They are not similar in absolute in terms, just consistent if the differences in scenarios are considered. Reworded to clarify.
12-628 12 27 35 37 In sentence starting line 35: Reword this, as cannot conclude from this analysis that the projected changes (i.e. the mean values) are similar (as seems implied by the language), as this discussion relates to the ranges. Clarify in sentence starting line 37 that the comparison is being done with uncertainties from the AR4, not between the different RCPs. [Government of Australia]
Taken into account, reference to 12.4.9 where that comparison is made in detail.
12-629 12 27 35 43 In this discussion need to state clearly somewhere that uncertainties are not reduced here with respect to the AR4 for a given emission pathway. They are reduced with respect to the scenarios examined because some of the uncertainty in the projections has been transferred to the uncertainty in the emissions required to achieve the concentration pathway. [Government of Australia]
Taken into account, added a sentence to highlight that.
12-630 12 27 37 27 37 Should "smaller" be "narrower"? "Smaller" might mean that the values are generally lower. [Jonathan Gregory, United Kingdom]
Taken into account, clarified as suggested.
12-631 12 27 37 27 37 I would remove the remark about RCP2.6. There's no reason why RCP and SRES should "correspond". [Jonathan Gregory, United Kingdom]
Taken into account, changed to saying that there was no scenario as low as RCP2.6 in AR4.
12-632 12 27 38 27 38 The main reason for what? I guess, that the ranges are narrower. [Jonathan Gregory, United Kingdom] Taken into account, wording changed.
12-633 12 27 38 27 38 After "The main reason", add "for the narrower ranges" [Jouni Räisänen, Finland] Taken into account, wording changed.
12-634 12 27 38 The main reason for what? [Peter Good, United Kingdom] Taken into account, wording changed.
12-635 12 27 40 27 40 Again, should "smaller" be "narrower"? [Jonathan Gregory, United Kingdom] Taken into account, clarified as suggested.
12-636 12 27 45 27 47 This para is out of place; it introduces the new material following the summary, and it doesn't belong in a section about global quantities. [Jonathan Gregory, United Kingdom]
Taken into account, moved to pattern scaling section.
12-637 12 27 55 27 55 Maybe you could compute 5-95% from Rogelj et al (instead of 10-90%) to make it comparable to the others. [Jonathan Gregory, United Kingdom]
Taken into account, indeed these were 5-95% as in the original paper. Caption fixed.
12-638 12 28 4 30 15 This discussion of pattern scaling could be tightened up. The explanation alerts us to its limitations as a technique for interpreting (generalizing?) the outputs of multiple models and scenarios (particularly at high northern latitudes). Then the last sentence tells us that pattern scaling is not explicitly used in the following sections. Perhaps this section could be shortened significantly? However, it leads to Fig 12.10 which is quite instructive. Perhaps a better approach would be to rework this section into a Box on "Pattern Scaling" including Fig 12.10? [Government of Canada]
We have stated in the first paragraph that even though the chapter does not use pattern scaling explicitly, it is implied in many statements and it is advocated as a methodology and used in other Working Groups
12-639 12 28 8 28 8 Delete "new". They are new, but they've already been introduced thoroughly. [Jonathan Gregory, United Kingdom]
Accepted, word deleted.
12-640 12 28 8 28 19 This is a key point regarding the use of pattern scaling and it's applicability to temperature and precipitation projections. This point should also be linked to by the appropriate sections in the WGII report. [European Union]
Noted.
12-641 12 28 8 29 45 This section (12.4.2.1) seems unbalanced in its content, given its title; it has two long paras about problems with precipitation, much less about temperature, for which pattern scaling does work well, and the final two brief paras cover all other variables with general statements but only two references (for a particular example). [Jonathan Gregory, United Kingdom]
Good point -- but pattern scaling has been indeed applied mainly to T & P. We have reworked the section adding new references and discussion. We believe that in the final draft a better balanced was achieved.

Expert and Government Review Comments on the IPCC WGI AR5 Second Order Draft – Chapter 12
Do not Cite, Quote or Distribute Page 48 of 120
Comment No
Chapter
FromPage
FromLine
To Page
To Line Comment Response
12-642 12 28 12 19 The reliability of pattern scaling for the hydrological cycle is greatly overstated in this introductory paragraph. New evidence (Good et al. 2012, citation at end) shows that while pattern scaling can be a useful approximation in many cases, local non-linear precipitation responses to CO2 can be large over sub-continental regions, and the patterns are different from the mean change - these effects do not show up in large-scale analyses, or in analyses based on a-priori regional means (e.g. Giorgi regions). The two papers cited as supporting the technique for precipitation are both based on large spatial scales. Neelin et al 06 are not really interested in validating pattern scaling per se: they focus on fixed global-scale patterns, showing that their amplitude scales linearly with global temperature. Shiogama et al., 2010b largely focus on global-mean precipitation. Their only regional results show substantial pattern-scale biases. A more balanced introduction is needed, with cautionary notes including reference to the paragraphs on issues later in this section. Good et al. (2012) A step-response approach for predicting and understanding non-linear precipitation changes. Climate Dynamics: Volume 39, Issue 12 (2012), Page 2789-2803 [Peter Good, United Kingdom]
We have reworked the section, trying to stress further the limitations of the technique and citing the Good et al. 2012 paper among others suggested, in order to better represent the strength and weaknesses of the technique when applied to precipitation patterns.
12-643 12 28 15 28 17 The suggestion that the patterns are nearly the same for all models seems too optimistic (e.g. in light of Fig. 12.9) [Jouni Räisänen, Finland]
Noted, but we believe the text does not overstate the validity of the approach. We mention explicitly the need to characterize inter-model variation as a source of uncertainty and cite literature that does that.
12-644 12 28 30 0 A lot of space is allocated to discussing pattern scaling however it is not then used in the report. Is such an in depth discussion warranted? [Jaclyn Brown, Australia]
See response to 12-638
12-645 12 28 32 28 36 Confusing. Recast. [David Erickson, United States of America] Accepted, we have reworded these sentences.
12-646 12 28 52 28 52 Delete "new" (as on page 28 line 8). [Jonathan Gregory, United Kingdom] Accepted and deleted
12-647 12 28 52 The following articles also attempted estimating the scaling pattern under the RCP: Dependency of precipitaiton scaling pattern on emission scenarios for representative concentration pathway, Yasuhiro Ishizaki, Hideo Shiogama, Seita Emori, Tokuta Yokohata, Toru Nozawa, Kiyoshi Takahashi, Tomoo Ogura, Masakazu Yoshimori and Tatsuya Nagashima, Journal of Climate (major revision) [Tosiyuki Nakaegawa, Japan]
Paper did not meat the AR5 deadline of March 15.
12-648 12 28 52 The following articles also attempted estimating the scaling pattern under the RCP: Yasuhiro Ishizaki, Tokuta Yokohata, Seita Emori, Hideo Shiogama, Kiyoshi Takahashi, Toshiyuki Nakaegawa, Naota Hanasaki, Toru Nozawa, Tomoo Ogura, Masakazu Yoshimori and Ai Yoshida. Verification of a pattern scaling approach for determining the maximum available renewable freshwater resource. Journal of hydrometeorology (major revision) [Tosiyuki Nakaegawa, Japan]
Paper did not meat the AR5 deadline of March 15.
12-649 12 28 55 28 57 The existence of different patterns in different GCMs is not really a limitation of the approach; in fact, you discuss how this can be dealt with i.e. by quantifying the uncertainty it introduces to projections. [Jonathan Gregory, United Kingdom]
Accepted, and we rewrote the paragraph following the suggestion.
12-650 12 28 55 29 3 This paragraph needs to be separated into two: it starts off talking about GCM differences (which is not really a pattern-scaling issue at all), then goes onto the key issue of aerosol effects. I suggest putting the GCM-difference part with the paragraph p.28 lines 38-44 (we're not really advocating that people restrict themselves to the ensemble mean are we?) [Peter Good, United Kingdom]
We have reworked the entire section in terms of the narrative (not the concepts) and we believe this concern is addressed in the new outline.
12-651 12 28 57 28 57 A reference that presents this inter-model spread in CMIP3 is I. G. Watterson and P. H. Whetton (2011) Distributions of decadal means of temperature and precipitation change under global warming. JGR, 116, D07101, doi:10.1029/2010JD014502. The standard deviation for temperature, over the globe, is shown as Fig. 4a and precipitation Fig. 8a. [Ian Watterson, Australia]
Reference cited.
12-652 12 28 12.4.2 Pattern Scaling. Method is also limited at local scales. For example the movement of the mean position of the SPCZ could lead to an island having a significant increase in rainfall where it was once relatively dry. This increase would appear as a step change and not a linear increase as assumed by the method. Similarly an eastward extension of monsoon would increase rainfall for some islands, but this increase would be linear over the next 100 years. [Jaclyn Brown, Australia]
We now explicitly mentioned limitation as the regional scale becomes finer in a couple of places in the final paragraph.
12-653 12 29 2 29 2 What approximation? [Jonathan Gregory, United Kingdom] We made clear that we refer to the approximation
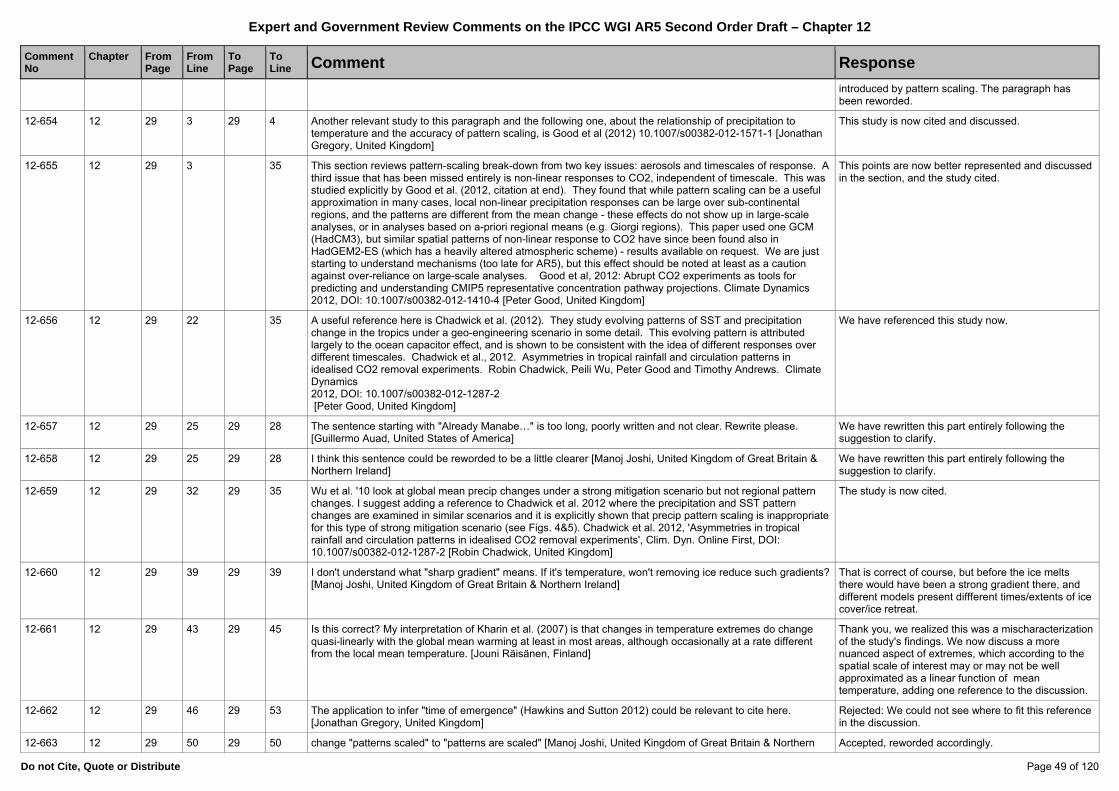
Expert and Government Review Comments on the IPCC WGI AR5 Second Order Draft – Chapter 12
Do not Cite, Quote or Distribute Page 49 of 120
Comment No
Chapter
FromPage
FromLine
To Page
To Line Comment Response
introduced by pattern scaling. The paragraph has been reworded.
12-654 12 29 3 29 4 Another relevant study to this paragraph and the following one, about the relationship of precipitation to temperature and the accuracy of pattern scaling, is Good et al (2012) 10.1007/s00382-012-1571-1 [Jonathan Gregory, United Kingdom]
This study is now cited and discussed.
12-655 12 29 3 35 This section reviews pattern-scaling break-down from two key issues: aerosols and timescales of response. A third issue that has been missed entirely is non-linear responses to CO2, independent of timescale. This was studied explicitly by Good et al. (2012, citation at end). They found that while pattern scaling can be a useful approximation in many cases, local non-linear precipitation responses can be large over sub-continental regions, and the patterns are different from the mean change - these effects do not show up in large-scale analyses, or in analyses based on a-priori regional means (e.g. Giorgi regions). This paper used one GCM (HadCM3), but similar spatial patterns of non-linear response to CO2 have since been found also in HadGEM2-ES (which has a heavily altered atmospheric scheme) - results available on request. We are just starting to understand mechanisms (too late for AR5), but this effect should be noted at least as a caution against over-reliance on large-scale analyses. Good et al, 2012: Abrupt CO2 experiments as tools for predicting and understanding CMIP5 representative concentration pathway projections. Climate Dynamics 2012, DOI: 10.1007/s00382-012-1410-4 [Peter Good, United Kingdom]
This points are now better represented and discussed in the section, and the study cited.
12-656 12 29 22 35 A useful reference here is Chadwick et al. (2012). They study evolving patterns of SST and precipitation change in the tropics under a geo-engineering scenario in some detail. This evolving pattern is attributed largely to the ocean capacitor effect, and is shown to be consistent with the idea of different responses over different timescales. Chadwick et al., 2012. Asymmetries in tropical rainfall and circulation patterns in idealised CO2 removal experiments. Robin Chadwick, Peili Wu, Peter Good and Timothy Andrews. Climate Dynamics 2012, DOI: 10.1007/s00382-012-1287-2 [Peter Good, United Kingdom]
We have referenced this study now.
12-657 12 29 25 29 28 The sentence starting with "Already Manabe…" is too long, poorly written and not clear. Rewrite please. [Guillermo Auad, United States of America]
We have rewritten this part entirely following the suggestion to clarify.
12-658 12 29 25 29 28 I think this sentence could be reworded to be a little clearer [Manoj Joshi, United Kingdom of Great Britain & Northern Ireland]
We have rewritten this part entirely following the suggestion to clarify.
12-659 12 29 32 29 35 Wu et al. '10 look at global mean precip changes under a strong mitigation scenario but not regional pattern changes. I suggest adding a reference to Chadwick et al. 2012 where the precipitation and SST pattern changes are examined in similar scenarios and it is explicitly shown that precip pattern scaling is inappropriate for this type of strong mitigation scenario (see Figs. 4&5). Chadwick et al. 2012, 'Asymmetries in tropical rainfall and circulation patterns in idealised CO2 removal experiments', Clim. Dyn. Online First, DOI: 10.1007/s00382-012-1287-2 [Robin Chadwick, United Kingdom]
The study is now cited.
12-660 12 29 39 29 39 I don't understand what "sharp gradient" means. If it's temperature, won't removing ice reduce such gradients? [Manoj Joshi, United Kingdom of Great Britain & Northern Ireland]
That is correct of course, but before the ice melts there would have been a strong gradient there, and different models present diffferent times/extents of ice cover/ice retreat.
12-661 12 29 43 29 45 Is this correct? My interpretation of Kharin et al. (2007) is that changes in temperature extremes do change quasi-linearly with the global mean warming at least in most areas, although occasionally at a rate different from the local mean temperature. [Jouni Räisänen, Finland]
Thank you, we realized this was a mischaracterization of the study's findings. We now discuss a more nuanced aspect of extremes, which according to the spatial scale of interest may or may not be well approximated as a linear function of mean temperature, adding one reference to the discussion.
12-662 12 29 46 29 53 The application to infer "time of emergence" (Hawkins and Sutton 2012) could be relevant to cite here. [Jonathan Gregory, United Kingdom]
Rejected: We could not see where to fit this reference in the discussion.
12-663 12 29 50 29 50 change "patterns scaled" to "patterns are scaled" [Manoj Joshi, United Kingdom of Great Britain & Northern Accepted, reworded accordingly.
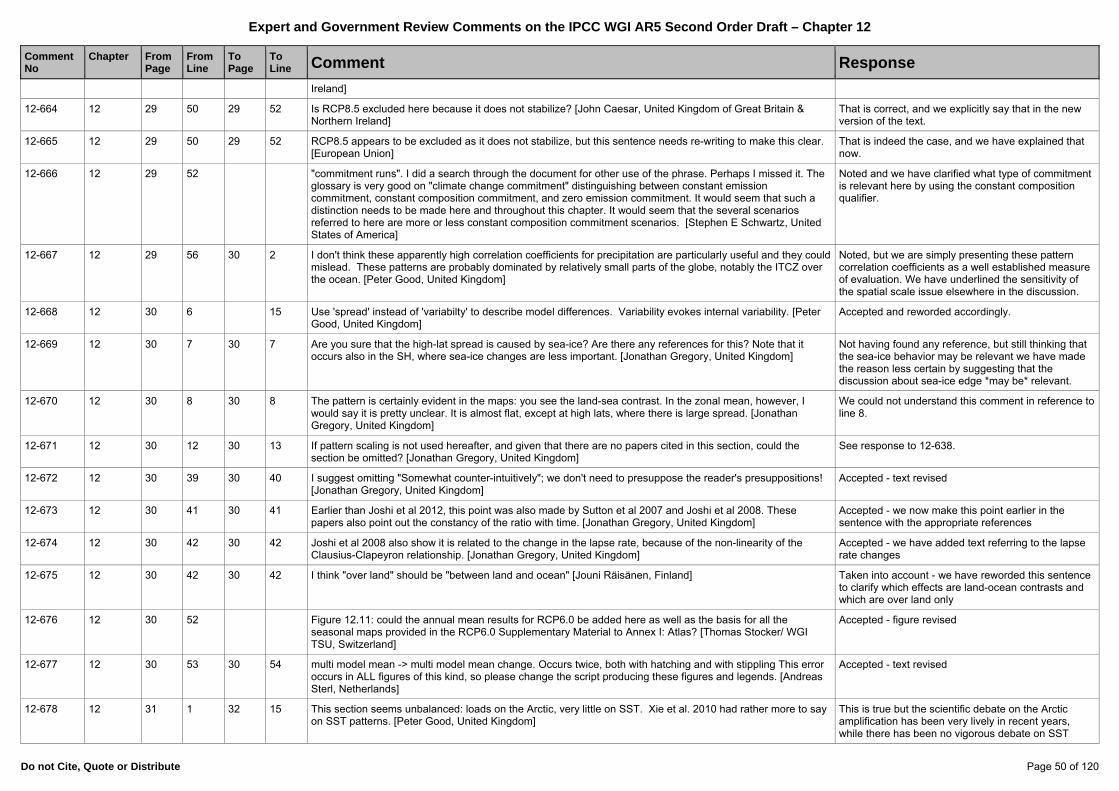
Expert and Government Review Comments on the IPCC WGI AR5 Second Order Draft – Chapter 12
Do not Cite, Quote or Distribute Page 50 of 120
Comment No
Chapter
FromPage
FromLine
To Page
To Line Comment Response
Ireland]
12-664 12 29 50 29 52 Is RCP8.5 excluded here because it does not stabilize? [John Caesar, United Kingdom of Great Britain & Northern Ireland]
That is correct, and we explicitly say that in the new version of the text.
12-665 12 29 50 29 52 RCP8.5 appears to be excluded as it does not stabilize, but this sentence needs re-writing to make this clear. [European Union]
That is indeed the case, and we have explained that now.
12-666 12 29 52 "commitment runs". I did a search through the document for other use of the phrase. Perhaps I missed it. The glossary is very good on "climate change commitment" distinguishing between constant emission commitment, constant composition commitment, and zero emission commitment. It would seem that such a distinction needs to be made here and throughout this chapter. It would seem that the several scenarios referred to here are more or less constant composition commitment scenarios. [Stephen E Schwartz, United States of America]
Noted and we have clarified what type of commitment is relevant here by using the constant composition qualifier.
12-667 12 29 56 30 2 I don't think these apparently high correlation coefficients for precipitation are particularly useful and they could mislead. These patterns are probably dominated by relatively small parts of the globe, notably the ITCZ over the ocean. [Peter Good, United Kingdom]
Noted, but we are simply presenting these pattern correlation coefficients as a well established measure of evaluation. We have underlined the sensitivity of the spatial scale issue elsewhere in the discussion.
12-668 12 30 6 15 Use 'spread' instead of 'variabilty' to describe model differences. Variability evokes internal variability. [Peter Good, United Kingdom]
Accepted and reworded accordingly.
12-669 12 30 7 30 7 Are you sure that the high-lat spread is caused by sea-ice? Are there any references for this? Note that it occurs also in the SH, where sea-ice changes are less important. [Jonathan Gregory, United Kingdom]
Not having found any reference, but still thinking that the sea-ice behavior may be relevant we have made the reason less certain by suggesting that the discussion about sea-ice edge *may be* relevant.
12-670 12 30 8 30 8 The pattern is certainly evident in the maps: you see the land-sea contrast. In the zonal mean, however, I would say it is pretty unclear. It is almost flat, except at high lats, where there is large spread. [Jonathan Gregory, United Kingdom]
We could not understand this comment in reference to line 8.
12-671 12 30 12 30 13 If pattern scaling is not used hereafter, and given that there are no papers cited in this section, could the section be omitted? [Jonathan Gregory, United Kingdom]
See response to 12-638.
12-672 12 30 39 30 40 I suggest omitting "Somewhat counter-intuitively"; we don't need to presuppose the reader's presuppositions! [Jonathan Gregory, United Kingdom]
Accepted - text revised
12-673 12 30 41 30 41 Earlier than Joshi et al 2012, this point was also made by Sutton et al 2007 and Joshi et al 2008. These papers also point out the constancy of the ratio with time. [Jonathan Gregory, United Kingdom]
Accepted - we now make this point earlier in the sentence with the appropriate references
12-674 12 30 42 30 42 Joshi et al 2008 also show it is related to the change in the lapse rate, because of the non-linearity of the Clausius-Clapeyron relationship. [Jonathan Gregory, United Kingdom]
Accepted - we have added text referring to the lapse rate changes
12-675 12 30 42 30 42 I think "over land" should be "between land and ocean" [Jouni Räisänen, Finland] Taken into account - we have reworded this sentence to clarify which effects are land-ocean contrasts and which are over land only
12-676 12 30 52 Figure 12.11: could the annual mean results for RCP6.0 be added here as well as the basis for all the seasonal maps provided in the RCP6.0 Supplementary Material to Annex I: Atlas? [Thomas Stocker/ WGI TSU, Switzerland]
Accepted - figure revised
12-677 12 30 53 30 54 multi model mean -> multi model mean change. Occurs twice, both with hatching and with stippling This error occurs in ALL figures of this kind, so please change the script producing these figures and legends. [Andreas Sterl, Netherlands]
Accepted - text revised
12-678 12 31 1 32 15 This section seems unbalanced: loads on the Arctic, very little on SST. Xie et al. 2010 had rather more to say on SST patterns. [Peter Good, United Kingdom]
This is true but the scientific debate on the Arctic amplification has been very lively in recent years, while there has been no vigorous debate on SST

Expert and Government Review Comments on the IPCC WGI AR5 Second Order Draft – Chapter 12
Do not Cite, Quote or Distribute Page 51 of 120
Comment No
Chapter
FromPage
FromLine
To Page
To Line Comment Response
patterns. There were, however, some repetition on this page that allowed reducing the length of the Arctic amplification section, thereby reducing the preceived imbalance.
12-679 12 31 8 31 32 It would be useful to state the RCP2.6 to RCP8.5 range, as opposed to the RCP4.5 projections. [John Caesar, United Kingdom of Great Britain & Northern Ireland]
Accepted. Replaced this by the range of amplifications for the 4 scenarios from Table 12.2.
12-680 12 31 8 31 32 This section quotes projections using RCP4.5. It is more informative to quote the range between RCP2.6 and RCP8.5. [European Union]
Accepted. Replaced this by the range of amplifications for the 4 scenarios from table 12.2.
12-681 12 31 17 31 19 This summary surprises me; it did not seem clear from the foregoing. [Jonathan Gregory, United Kingdom] This comment refers to Page 32, lines 17-19. The large scale patterns are robust so the statement is ok.
12-682 12 31 18 31 19 This is quite a key point. Is the more general point regarding model performance in past and future simulations discussed elsewhere, in which case a link should be given? A reference here would be useful e.g. Knutti, 2008; Reifen and Toumi, 2009. Knutt [European Union]
This is in fact discussed in depth in Chapter 9, section 9.8: "Relating Model Performance to Credibility of Model Applications". We refer to this here.
12-683 12 31 18 31 20 What did the cited studies find in terms of relating historical to future trends? [European Union] The reference to the papers by Bracegirdle and Stephenson was not really correct in fact. Focusing on polar climate change, they relate present model climatology (not the present trends) to future climate change by a relatively simple regression model and show that this method reduces the weight of outliers and the projection uncertainty (dispersion). Thank you for putting your finger on this. We rephrased this sentence to make it clearer and refer to Chapter 9.8 for a more general discussion of such aspects (see also reviewer comment 12-682). We also shifted it to another place in order to reduce redundancies in the text.
12-684 12 31 18 31 20 The following papers applied other methoeds to evaluate the polar amplification. Yoshimori, M. and A. Abe-Ouchi (2012): Sources of spread in multi-model projections of the Greenland ice-sheet surface mass balance. J. Climate, 25(4), 1157-1175. Manabu Abe, Hideo Shiogama, Toru Nozawa, and Seita Emori (2011) Estimation of future surface temperature changes constrained using the future‐present correlated modes in inter‐model variability of CMIP3 multimodel simulations. JOURNAL OF GEOPHYSICAL RESEARCH, VOL. 116, D18104 [Hideo Shiogama, Japan]
The Abe et al. paper is sufficiently general to be of relevance here and will be cited along with the Bracegirdle papers. Similarly to those papers, it relates present-day climate (here, specifically interannual variability) to future climate change and similarly shows that projection dispersion (and mean) can be changed by eliminating outliers.
12-685 12 31 23 31 23 We suggest adding a citation of Kumar, A., and Co-authors, 2010: Contribution of sea ice loss to Arctic amplification. Geophys. Res. Lett., 37, L21701, doi:10.1029/2010GL045022. [Government of United States of America]
This is added although there was already a sufficient number of papers cited here.
12-686 12 31 27 31 27 Heat going into warming the surface ocean cannot be a reason for a lack of surface warming. [Jonathan Gregory, United Kingdom]
This is true. We now write "or is absorbed by the thermally more inert ocean", hoping that this makes the meaning clearer.
12-687 12 31 38 31 42 This issue considered in the final two sentences of this paragraph is discussed in Box 2.3, though I have made a comment on this (number 76 above). We can't be sure how Box 2.3 will eventually turn out, but a cross-reference might be appropriate. [Adrian Simmons, United Kingdom]
We now refer also to Box 2.3 on the end of the sentence mentioning discrepancies in the observed vertical structure (p.31, line 32 in the SOD).
12-688 12 31 48 31 52 This is partly a repetition of the previous para; shortening would be possible by combining them. [Jonathan Gregory, United Kingdom]
Thank you for this suggestion. We have cut obvious repetitions from this paragraph but kept it as a separate paragraph.

Expert and Government Review Comments on the IPCC WGI AR5 Second Order Draft – Chapter 12
Do not Cite, Quote or Distribute Page 52 of 120
Comment No
Chapter
FromPage
FromLine
To Page
To Line Comment Response
12-689 12 32 14 32 15 The discussion of SST pattern is a welcoming addition. This sentence can be clarified as follows: "the equatorial enhanced warming is due to a merdional minimum in evaporative damping on the equator (Liu et al. 2005). The SST warming pattern is important for precipitation change (Xie et al. 2010; Section 12.4.5.2)." The second sentence connects to the other part of the chapter. Ref: Liu, Z., S. Vavrus, F. He, N. Wen, and Y. Zhong, 2005: Rethinking tropical ocean response to global warming: The enhanced equatorial warming. J. Climate, 18, 4684–4700. [Shang-Ping Xie, United States of America]
Taken into account - text revised to add this additional detail
12-690 12 32 17 "much evidence, robust agreement" -- please change to the standard summary terms as provided in the AR5 guidance note for consistent treatment of uncertainty for both the "level of evidence" and the "degree of agreement": “limited,” “medium,” or “robust” for the level of evidence and “low,” “medium,” or “high” for the degree of agreement. [Thomas Stocker/ WGI TSU, Switzerland]
Accepted - text revised
12-691 12 32 21 33 3 Section 12.4.3.2: A discussion of Carvalho and Jones’ paper titled “CMIP5 Simulations of Low-Level Tropospheric Temperature and Moisture over tropical America”) could be added to this section to describe non-surface tropospheric warming projected in CMIP5 models forced by the RCP8.5 scenario. [Government of United States of America]
Rejected - the paper covers a relatively narrow range of longitudes (North and South America) and so does not give a broad enough perspective on the zonal average changes. The focus on monsoon systems makes it more appropriate for Chapter 14.
12-692 12 32 26 32 27 I am sure there must be earlier refs than Bony et al 2006, since this has been known for many years. [Jonathan Gregory, United Kingdom]
Rejected - this is an assessment and not a literature review . Bony et al. is a review article that covers this topic, making it an appropriate citation. The cited reference would provide relevant references to earlier work.
12-693 12 32 33 32 33 The vertical structure of tropospheric temperature change is "robust" in models but controversial in observations (see Chapter 2). Indirect evidence exists in support of the model vertical struture, from wind geostrophy (Sherwood et al. 2008) and SST threshold for convection (Johnson and Xie 2010). This caveat should be mentioned: Refs. Johnson, N.C., and S.-P. Xie, 2010: Changes in the sea surface temperature threshold for tropical convection. Nature Geosci., 3, 842-845. Sherwood, S. C., Meyer, C. L., Allen, R. J. & Titchner, H. A. Robust tropospheric warming revealed by iteratively homogenized radiosonde data. J. Clim. 21, 5336-5350 (2008). [Shang-Ping Xie, United States of America]
Accepted - iIncluded as factors suggesting robust physical behavior.
12-694 12 32 47 32 48 What is the basis of this statement? Are there references to support it? [Jonathan Gregory, United Kingdom] Taken into account - this statement stems from the sentence in lines 28-30. The text has been revised to make that connection clearer.
12-695 12 32 47 32 53 Given the uncertainty about model accuracy for the tropical upper troposphere, is it appropriate to assess that warming being greatest there is 'very likely'? [Government of Australia]
Taken into account - the assessment for the tropical upper troposphere has been downgraded in consideration of the uncertainties of model-observation consistency.
12-696 12 32 47 32 53 Given the uncertainty about model accuracy for the tropical upper troposphere (UTT), should it be assessed that warming being greatest there is 'very likely'? [Ian Watterson, Australia]
Taken into account - the assessment for the tropical upper troposphere has been downgraded in consideration of the uncertainties of model-observation consistency.
12-697 12 33 5 35 22 Section 12.4.3.3: Although this section is mostly concerned with surface temperature extremes, Carvalho and Jones’ paper titled “CMIP5 Simulations of Low-Level Tropospheric Temperature and Moisture over tropical America”) examines extreme temperature (>85th percentile) changes projected in CMIP5 models forced by the RCP8.5 scenario. [Government of United States of America]
Rejected - this paper does not fit well in this discussion which focuses on extremes at the 95% level or above and on the most policy-relevant temperature extremes at the surface.
12-698 12 33 5 35 22 adding the results of warm and cold months changes in the global area and 21 sub-regions by Yao et al., 2012. Reference: Yao Y., Y.Luo, J.B.Huang, Z.C.Zhao, Comparison of warm and cold months simulated by the CMIP3 and CMIP5 models, J. Climate, submitted [Zong-Ci Zhao, China]
Rejected - this paper did not meet the March 15 deadline for acceptance
12-699 12 33 7 33 7 please rephrase to “[...] changes in several types of temperature extremes [...]” [Jana Sillmann, Canada] Accepted - text revised
12-700 12 33 9 33 9 Is a heat spell different in timescale to a wave? The wording maybe implies that it is [Manoj Joshi, United Accepted - text revised to refer only to heat waves
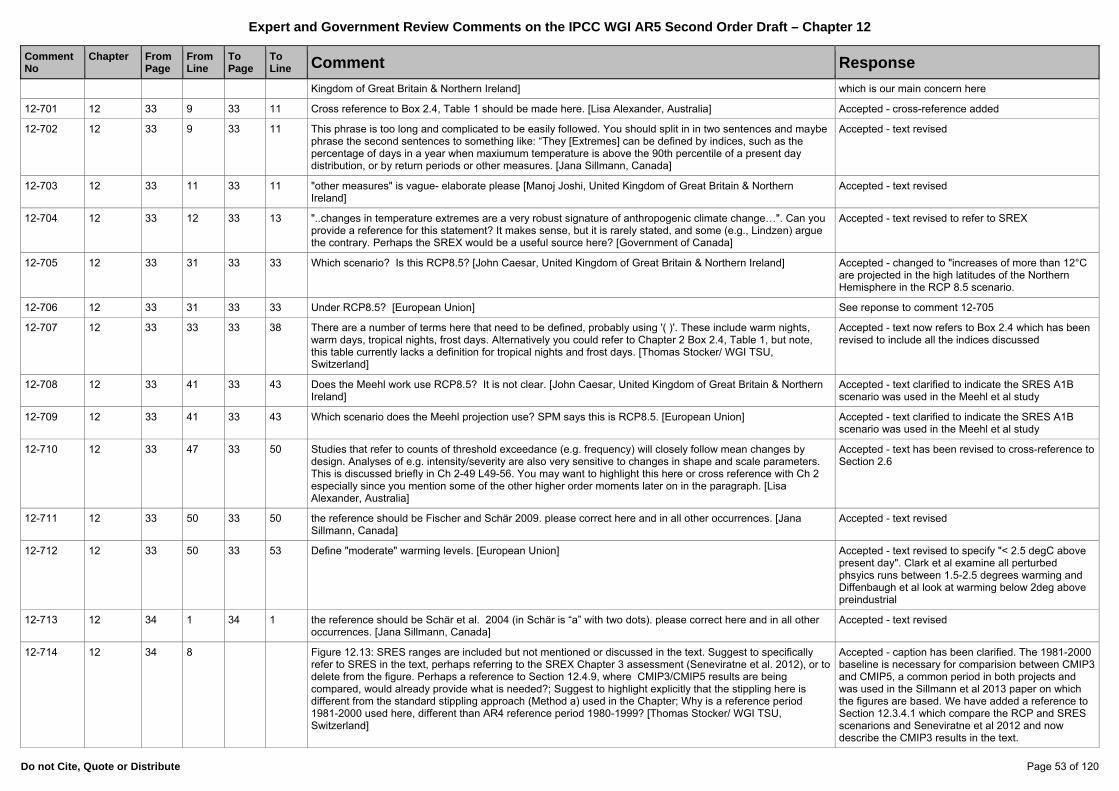
Expert and Government Review Comments on the IPCC WGI AR5 Second Order Draft – Chapter 12
Do not Cite, Quote or Distribute Page 53 of 120
Comment No
Chapter
FromPage
FromLine
To Page
To Line Comment Response
Kingdom of Great Britain & Northern Ireland] which is our main concern here
12-701 12 33 9 33 11 Cross reference to Box 2.4, Table 1 should be made here. [Lisa Alexander, Australia] Accepted - cross-reference added
12-702 12 33 9 33 11 This phrase is too long and complicated to be easily followed. You should split in in two sentences and maybe phrase the second sentences to something like: “They [Extremes] can be defined by indices, such as the percentage of days in a year when maxiumum temperature is above the 90th percentile of a present day distribution, or by return periods or other measures. [Jana Sillmann, Canada]
Accepted - text revised
12-703 12 33 11 33 11 "other measures" is vague- elaborate please [Manoj Joshi, United Kingdom of Great Britain & Northern Ireland]
Accepted - text revised
12-704 12 33 12 33 13 "..changes in temperature extremes are a very robust signature of anthropogenic climate change…". Can you provide a reference for this statement? It makes sense, but it is rarely stated, and some (e.g., Lindzen) argue the contrary. Perhaps the SREX would be a useful source here? [Government of Canada]
Accepted - text revised to refer to SREX
12-705 12 33 31 33 33 Which scenario? Is this RCP8.5? [John Caesar, United Kingdom of Great Britain & Northern Ireland] Accepted - changed to "increases of more than 12°C are projected in the high latitudes of the Northern Hemisphere in the RCP 8.5 scenario.
12-706 12 33 31 33 33 Under RCP8.5? [European Union] See reponse to comment 12-705
12-707 12 33 33 33 38 There are a number of terms here that need to be defined, probably using '( )'. These include warm nights, warm days, tropical nights, frost days. Alternatively you could refer to Chapter 2 Box 2.4, Table 1, but note, this table currently lacks a definition for tropical nights and frost days. [Thomas Stocker/ WGI TSU, Switzerland]
Accepted - text now refers to Box 2.4 which has been revised to include all the indices discussed
12-708 12 33 41 33 43 Does the Meehl work use RCP8.5? It is not clear. [John Caesar, United Kingdom of Great Britain & Northern Ireland]
Accepted - text clarified to indicate the SRES A1B scenario was used in the Meehl et al study
12-709 12 33 41 33 43 Which scenario does the Meehl projection use? SPM says this is RCP8.5. [European Union] Accepted - text clarified to indicate the SRES A1B scenario was used in the Meehl et al study
12-710 12 33 47 33 50 Studies that refer to counts of threshold exceedance (e.g. frequency) will closely follow mean changes by design. Analyses of e.g. intensity/severity are also very sensitive to changes in shape and scale parameters. This is discussed briefly in Ch 2-49 L49-56. You may want to highlight this here or cross reference with Ch 2 especially since you mention some of the other higher order moments later on in the paragraph. [Lisa Alexander, Australia]
Accepted - text has been revised to cross-reference to Section 2.6
12-711 12 33 50 33 50 the reference should be Fischer and Schär 2009. please correct here and in all other occurrences. [Jana Sillmann, Canada]
Accepted - text revised
12-712 12 33 50 33 53 Define "moderate" warming levels. [European Union] Accepted - text revised to specify "< 2.5 degC above present day". Clark et al examine all perturbed phsyics runs between 1.5-2.5 degrees warming and Diffenbaugh et al look at warming below 2deg above preindustrial
12-713 12 34 1 34 1 the reference should be Schär et al. 2004 (in Schär is “a” with two dots). please correct here and in all other occurrences. [Jana Sillmann, Canada]
Accepted - text revised
12-714 12 34 8 Figure 12.13: SRES ranges are included but not mentioned or discussed in the text. Suggest to specifically refer to SRES in the text, perhaps referring to the SREX Chapter 3 assessment (Seneviratne et al. 2012), or to delete from the figure. Perhaps a reference to Section 12.4.9, where CMIP3/CMIP5 results are being compared, would already provide what is needed?; Suggest to highlight explicitly that the stippling here is different from the standard stippling approach (Method a) used in the Chapter; Why is a reference period 1981-2000 used here, different than AR4 reference period 1980-1999? [Thomas Stocker/ WGI TSU, Switzerland]
Accepted - caption has been clarified. The 1981-2000 baseline is necessary for comparision between CMIP3 and CMIP5, a common period in both projects and was used in the Sillmann et al 2013 paper on which the figures are based. We have added a reference to Section 12.3.4.1 which compare the RCP and SRES scenarions and Seneviratne et al 2012 and now describe the CMIP3 results in the text.

Expert and Government Review Comments on the IPCC WGI AR5 Second Order Draft – Chapter 12
Do not Cite, Quote or Distribute Page 54 of 120
Comment No
Chapter
FromPage
FromLine
To Page
To Line Comment Response
12-715 12 34 17 34 27 Recommend inserting in lilne 21: "However afternoon evaporation over dry fields was found to form clouds providing negative cloud feedback contrary to models (Taylor et al. 2012)." Source: Recommend addressing negative cloud feedbacks that act contrary to current models. E.g. recommend adding: "Drier soils more likely form afternoon precipitative clouds, giving a negative cloud feedback, contrary to existing models." Christopher M. Taylor et al. (2012) Afternoon rain more likely over drier soils, Nature 489,423–426(20 September 2012)doi:10.1038/nature11377 [David L. Hagen, United States of America]
Rejected - this article does not discuss projections so is not an appropriate reference for this chapter. The paper is referred to in Chapter 9.
12-716 12 34 18 34 21 What are the regions? [John Caesar, United Kingdom of Great Britain & Northern Ireland] Taken into account - we have clarified that this is for Mediterranean regions
12-717 12 34 18 34 21 Can the "certain regions" be clarified here? [European Union] Taken into account - we have clarified that this is for Mediterranean regions
12-718 12 34 22 34 23 An increased land-sea temperature contrast should cause a monsoon-like circulation anomaly, which should ameliorate the temperature rise; this sentence implies that the mechanism works the other way round [Manoj Joshi, United Kingdom of Great Britain & Northern Ireland]
Taken into account - a discussion of the influence of the land-sea contrast on hot and cold temperature extremes is now included.For hot extremes, Watterson et al 2008 show that when the wind direction is from the interior the temperature extremes increase and attribute it to increased temperatures in the interior and rule out changes in the winds.
12-719 12 34 29 De Vries etal 2012, GRL show that a considerable part of the warming of European cold spells is explained by the changes in the winter temperature variability. Changes of the temperature variability are subsequently related to changes in zonal temperature gradient, westerly surface geostrophic winds, and reductions in blocking. It could be worthwhile to add this reference here. [Hylke de Vries, Netherlands]
Accepted - assessment now includes this reference
12-720 12 34 30 34 30 In this context, also Sillmann et al. 2012 should be cited as they show the change in winter temperature extremes for CMIP5 models. [Jana Sillmann, Canada]
Accepted - reference to Sillmann et al 2013 added
12-721 12 34 31 34 32 I don't see why decreases in the land-sea contrast in northern winter high latitudes would change extreme cold events. [Manoj Joshi, United Kingdom of Great Britain & Northern Ireland]
DeVries et al. GRL (2012) is now cited where the mechanism is explained
12-722 12 34 34 34 36 Blockings were not discussed in Räisänen and Ylhäisi (2011) [Jouni Räisänen, Finland] Accepted - text revised to separate the two points made in this statement
12-723 12 34 35 Emphasis this potentally counter intuitive point. [David Erickson, United States of America] Taken into account - this section has been revised
12-724 12 34 39 There are two references to "humidity" on this line. Is the major dependence on specific or relative humidity? Relative humidity is referred to twice in the rest of the paragraph. [Adrian Simmons, United Kingdom]
Accepted - text has been revised to clarify as 'specific humidity'
12-725 12 34 46 34 46 Is this warming and RH change over land? If so that's related to the land-sea warming contrast (Joshi et al Clim Dyn 2008 and others) [Manoj Joshi, United Kingdom of Great Britain & Northern Ireland]
Taken into account - yes, it is over land and indeed related but would be confusing to refer to this here
12-726 12 34 52 34 52 While both definitions are used for return values, the former is maybe harder to interpret in the presence of a trend in the data. Not sure whether this is worth mentioning here. [Lisa Alexander, Australia]
This definition is consistent with the appendix
12-727 12 34 55 34 57 I am unhappy with the formulation of the warm/cold extremes comparison. It is certainly true that cold extremes are projected to increase much faster than warm extremes. However, warm extremes are still rising faster than the means, especially in some heavily populated regions like Europe, parts of China, and North America. Although it is hard to compare Figs. 12.14 and 12.11 by eye (especially the high temperatures are hardly distinguishable), the patterns of delta(T_max)/(delta(T_mean) seem to resemble those of Fig. 3A in Sterl et al. (GRL 35, (2008), L14703, doi:10.1029/2008GL034071). It is important to note that extreme hot temperatures rise faster than mean temperatures because it is the hot extremes that have the potential to cause health problems. In short, I would like to have emphasized that hot extremes, although they rise less fast than cold extremes, still rise faster than the mean temperatures in most populated regions. [Andreas Sterl, Netherlands]
This is a very interesting comment and caused a more careful examination of these statements resulting in a substantial revision in tone. We find that a comparison of high temperature extremes changes to annual mean temperature changes is irrelevant. In the regions mentioned, summer and winter temperatures change a very different rates. This is especially true in southern Europe where summer mean temperatures are projected to change more than winter mean temperatures. Hence, in such regions the high temperature extremes changes more than the annual mean but not much more than the summer mean. We
Expert and Government Review Comments on the IPCC WGI AR5 Second Order Draft – Chapter 12
Do not Cite, Quote or Distribute Page 55 of 120
Comment No
Chapter
FromPage
FromLine
To Page
To Line Comment Response
find this true over most of the planet. However, we did find that in Northern Europe and a few other locations to a lesser degree that high temperature extremes are projected to change up to 2C more than summer mean temperatures. For this reason, we modified the discussion pointing these details out and referring to the appropriate season mean projection maps in the Annex.
12-728 12 35 5 35 5 It will probably be confusing for readers to introduce the new term of 'waiting times' here. We suggest it would be better to continue to consistently use 'return period'. [Thomas Stocker/ WGI TSU, Switzerland]
Accepted - text revised
12-729 12 35 7 9 There are now quite a bit of detection and attribution studies, assessed in chapter 10. Would be useful to crosslink to that section. The hot extremes tend to show small scaling factors (indicating less observed change than simulated in some cases) while the cold ones show rather large ones. [Gabriele Hegerl, United Kingdom]
Accepted. This sentence added: "Section 10.6.1.1 notes that a number of detection and attribution studies since SREX suggest that the model changes may tend to be too large for warm extremes and too small for cold extremes and thus these likelihood statements are somewhat less strongly stated than a direct interpretation of model output and its ranges.
12-730 12 35 27 36 7 Separating out the SW and LW components in this way makes the paragraph feel a bit to me. I think it may flow better if it's done as energy balance in SW and LW, then causes for energy imbalance in SW and LW, and then climate response in SW and LW. [Manoj Joshi, United Kingdom of Great Britain & Northern Ireland]
Accepted - text has been revised. First the total radiative budget is considered, then the SW and LW components
12-731 12 35 43 36 7 As there are few refs in this section, and it is partly concerned with the past rather than the future, I suggest it could be shortened. [Jonathan Gregory, United Kingdom]
Taken into account - text has been shortened
12-732 12 36 10 Figure 12.15: Anomalies are computed with respect to a 1900-1950 base period -- suggest to use the standard reference period 1986-2005 [Thomas Stocker/ WGI TSU, Switzerland]
Considered - For the net heat budget at the TOA, the distance from zero gives information on the distance from equilibrium. We do not choose the 1986-2005 period as the energy budget is known to be out of equilibrium for this period. Before 1900, there are a number of volcanic eruptions and the heat budget of Earth is also out of equilibrium. We choose 1900-1950 as there is almost no volcanic eruption during that period and the anthropogenic forcings are still low.
12-733 12 36 13 We recommend re-writing this text for clarity. [Government of United States of America] Considered - text has been modified
12-734 12 36 16 Figure 12.16: Anomalies are computed with respect to a 1900-1950 base period -- suggest to use the standard reference period 1986-2005 [Thomas Stocker/ WGI TSU, Switzerland]
Considered - same response as comment 12-732
12-735 12 36 21 36 22 What is meant by "energetics" here? Do you mean "energy budget"? If so there are probably more refs to be cited, such as Murphy et al 2009 and Church et al 2011. But that's mostly about the past, not projections, so perhaps the comment can be omitted altogether. [Jonathan Gregory, United Kingdom]
Taken into account - this paragraph was inappropriate here and has been removed.
12-736 12 36 22 36 24 This sentence doesn't seem to belong here. There is a separate section about radiative forcings. [Jonathan Gregory, United Kingdom]
Taken into account - this paragraph was inappropriate here and has been removed.
12-737 12 36 23 36 24 "An increased...varying concentrations of ozone..." I think implies that AR4 models didn't include O3 changes, which they did. [Manoj Joshi, United Kingdom of Great Britain & Northern Ireland]
Taken into account - this paragraph was inappropriate here and has been removed.
12-738 12 36 27 37 12 Can any relevant information on aviation induced clouds be included here? [European Union] Considered - the aviation induced clouds are assessed in section 7.2.7. At the begining of this section, more refences to chapter 7 are given.
12-739 12 36 27 37 12 12.4.3.5 Clouds: Please incorporate the major evidence of declining cloud cover of Eastman & Warren 2012. Recommend adding: “The global average cloud cover declined about 1.56% over 39 years (1979 to 2009) or
Considered - The reference given has been considered and is now referenced in chapter 7 and 2.

Expert and Government Review Comments on the IPCC WGI AR5 Second Order Draft – Chapter 12
Do not Cite, Quote or Distribute Page 56 of 120
Comment No
Chapter
FromPage
FromLine
To Page
To Line Comment Response
~0.4%/decade, primarily in middle latitudes at middle and high levels (Eastman & Waren, 2012). Declining clouds appear to be a major contributor to the observed global warming. A 1 percentage point decrease in albedo (30% to 29%) would increase the black-body radiative equilibrium temperature about 1°C, about equal to a doubling of atmospheric CO2 e.g. by a 1.5% reduction in clouds since they form up to 2/3rds of global albedo (IPCC report AR4 1.5.2 p.114). The challenge now is distinguish what portion of rising CO2 reduced clouds and what portion of natural reduction in clouds raised ocean temperatures increasing CO2." Source: “Ryan Eastman, Stephen G. Warren, Journal of Climate 2012 ; e-View doi: http://dx.doi.org/10.1175/JCLI-D-12-00280.1” [David L. Hagen, United States of America]
The main goal of this section is to provide some background information to help in understanding and interpreting the cloud changes simulated by the models. A detailed assessment of cloud process and cloud changes is provided by chapter 7. In addition, the authors of the cited paper analyse the cloud changes observed over land, not at the global scale. Therefore the link between the cloud fraction decline and the change of global albedo is not as straightforward as it is claimed in the comment.
12-740 12 36 27 I think that Section 12.4.3.5 should mention rapid adjustment of clouds, as well as cloud feedback. Although this is not the main cloud influence on climate sensitivity, it is not negligible e.g. Webb et al 2012. It is also not mentioned in 12.3.3 (apart from introducing the term "adjusted forcing"), which is another place it could belong. [Jonathan Gregory, United Kingdom]
Taken into account - Rapid adjustment of clouds is now mentioned, and a reference has been added.
12-741 12 36 27 Given that ch7 is all about clouds, and in particular has a long section about cloud feedback (7.2.4.3), maybe 12.4.3.5 could be reduced in size, with material being moved to ch7 if it is not already there, and a specific reference to that section. (Correspondingly, I have commented on ch7 that I don't think clear-sky feedback belong in a chapter about clouds, and are more logically dealt with by ch12.) [Jonathan Gregory, United Kingdom]
Considered - There is almost no new material in this section, but we believe that it is usefull to summarize the main features of the cloud response, in particular those that influence the figures shown in this section. Better references to chapter 7 have been included at the begining and in different places of this section.
12-742 12 36 31 36 32 It would be better here to give the observed global mean cloud radiative forcing as assessed in Chapter 7 (7.2.1) , and cross reference appropriately, i.e., -17 W m-2 . [Thomas Stocker/ WGI TSU, Switzerland]
Accepted - text has been modified
12-743 12 36 35 36 35 Which section in ch9? [Jonathan Gregory, United Kingdom] Accepted - full reference is now included
12-744 12 36 44 36 44 "confirmed" should be "reproduced" [Manoj Joshi, United Kingdom of Great Britain & Northern Ireland] Considered - We maintain "confirmed" as consistent results have been obtained with different methodologies and different set of models.
12-745 12 36 52 36 57 The whole issue of SW could feedbacks, cloud fraction, etc., should include a discussion of the cloud micro-physics as well. [David Erickson, United States of America]
Considered - It is behind the scope of this section to present all the aspects of cloud feedbacks. Discussion of cloud micro-physics is included in chapter 7.
12-746 12 36 53 36 55 There are other mechanisms which have been proposed to explain positive low cloud feedbacks, e.g. see Chapter 7 section 7.2.4.3.3. [Mark Webb, United Kingdom of Great Britain & Northern Ireland]
Accepted - references have been added
12-747 12 36 Section 12.4.3.5 Again, some reference to cloud adjustments here would I think be appropriate. [Mark Webb, United Kingdom of Great Britain & Northern Ireland]
Taken into account - Rapid adjustment of clouds is now mentioned.
12-748 12 37 1 37 1 labels on this fig are illegible.Too small [Peter Clift, United States of America] Rejected - This comment is probably an error
12-749 12 37 1 37 2 These lines state that because the models do not reproduce the nearly 100% observed cloud cover in the mean state, the negative feedback arising from increases in cloud amount may be an artifact. This logic makes sense, however a second opposing effect is not discussed here: The negative cloud feedback in these regions is dominated by the cloud optical depth feedback, not the cloud amount feedback (Soden and Vecchi 2011; Zelinka et al 2012b, Zelinka, et al. 2012c). Because models tend to simulate clouds that are too optically thick in the mean state compared with ISCCP (Zhang et al. 2005, Klein et al. 2012), this implies that the negative optical depth feedback magnitude is underestimated, per the argument of Stephens (2010). Thus there are reasons to believe that a large negative cloud feedback at high latitudes is plausible, and perhaps underestimated by models. The reader is left with a different impression from reading this section. Klein, S.A., Y. Zhang, M.D. Zelinka, R.N. Pincus, J.Boyle, and P.J. Gleckler, 2012: Are climate model simulations of clouds improving? An evaluation using the ISCCP simulator. Accepted pending minor revisions to J. Geophys. Res. Soden, B. J. and G. A. Vecchi, 2011: The vertical distribution of cloud feedback in coupled ocean-atmosphere models. Geophys. Res. Lett., 38, L12704, doi:10.1029/2011GL047632.
Accepted - The text has been modified and new references have been added

Expert and Government Review Comments on the IPCC WGI AR5 Second Order Draft – Chapter 12
Do not Cite, Quote or Distribute Page 57 of 120
Comment No
Chapter
FromPage
FromLine
To Page
To Line Comment Response
Stephens, G., 2010: Is there a missing low cloud feedback in current climate models? GEWEX News, 20 (1), p.5-7. Zelinka, M.D., S.A. Klein, and D.L. Hartmann, 2012b: Computing and Partitioning Cloud Feedbacks Using Cloud Property Histograms. Part II: Attribution to Changes in Cloud Amount, Altitude, and Optical Depth. J. Climate, 25, 3736–3754. doi:10.1175/JCLI-D-11-00249.1. Zelinka, M.D., S.A. Klein, K.E. Taylor, T. Andrews, M.J. Webb, J.M. Gregory, and P.M. Forster, 2012c: Contributions of Different Cloud Types to Feedbacks and Rapid Adjustments in CMIP5. Accepted pending minor revisions to J. Climate. Zhang, M. H., and Coauthors, 2005: Comparing clouds and their seasonal variations in 10 atmospheric general circulation models with satellite measurements. J. Geophys. Res., 110, D15S02, doi:10.1029/2004JD005021. [Government of United States of America]
12-750 12 37 8 37 10 A bad sentence. Better: "Although the decrease in cloudiness generally increases OLR and partly offsets the effect of cloud rising, the net effect is a consistent …" [Jouni Räisänen, Finland]
Accepted - text has been modified
12-751 12 37 12 Zelinka et al. (2012) show that the spread in SW high cloud feedback exceeds the spread in SW low cloud feedback. We suggest that the authors revise this statement to read "...inter-model spread in net cloud feedback being mainly attributable to low-level cloud changes." [Government of United States of America]
Accepted - text has been modified
12-752 12 37 13 37 13 Please consider including a summary paragraph for this section, similar to that for mean sea level pressure (12-38, lines 47 to 49). [Government of Australia]
Accepted - a short summary has been added
12-753 12 37 14 37 14 There are references in this section to non-existing section 11.4. See also our comments for chapter 11 (page 1, line 1). [Government of Netherlands]
Rejected - This comment is probably an error
12-754 12 37 19 37 46 This part of the text is not consistent with the conclusion in the SPM (SPM-12, lines 42-43). Global scale should be skipped in the SPM conclusion. AR4 applied the likelihood likely to the global scale, but SREX restricted this to the to the Northern Hemisphere, while at the same time emphasizing considerable uncertainties (lines 18-22). Lines 31-32 state that CMIP5 results confirm a clear tendency for increase of heavy precipitation on a global scale. But the text is not clear how this translates to likelyhood likely as is concluded in the SPM. We suggest to add justification for this likelihood. Otherwise “global scale’ should be skipped in the SPM conclusion. [Government of Netherlands]
Accpted. Text revised.
12-755 12 37 21 41 22 Section 12.4.4: Somewhere, either in this section or perhaps closer to the beginning of the chapter, it might be helpful to many readers to articulate the difference between "midlatitude jets" and "extratropical storm tracks." [Government of United States of America]
Not accepted. The title of section 12.4.4.3 makes clear that the tracks are properties of extratropical storms. This follows a discussion of jets in 12.4.4.1 that illustrates jet behavior using zonal averages (Fig. 12.19)
12-756 12 37 21 41 22 section 12.4.4: It is clear from the lead-in to section 12.4.4 that the authors would rather not include a discussion of projections of tropical cyclone activity in the 21st century in this chapter. The models do not perform exceptionally well in this area, especially, as the report notes, because TCs are not resolved well in the CMIP5 models and also because, as is noted widely throughout the literature, trends are hard to come by in the various ocean basins, even the Atlantic basin. Nevertheless, analysis of the CMIP5 models with respect to TCs has been performed, and could be included in this section. The paper by Maloney et al. (“North American Climate in CMIP5 Experiments: Part III: Assessment of 21st Century Projections”) contains a discussion on this topic in section 6.c. and the paper titled “Global and regional aspects of tropical cyclone activity in the CMIP5 models” authored by Suzana Camargo could also inform such a discussion. Moreover, there may be room to include discussion not of explicitly resolved tropical cyclone activity but of environmental conditions that are favorable/unfavorable to TC activity, which is something the current models can simulate, since environmental conditions are usually expressed on a large enough scale for GCMs/ESMs to resolve and because some of the shorter-term influencing variability (due to ENSO, AMO, etc.) is simulated by models with some degree of accuracy (chapter 9). Both papers listed above (and other references) contain relevant discussion on this matter (see section 6.d. of the Maloney et al. paper). A low confidence tag would likely be attached to explicitly simulated 21st century projected TC activity, but a more confident tag could possibly be assigned to the implications of projected environmental conditions. [again, this belongs to a research paper,
The suggested materiial is better suited for the box in Chapter 14, This and other relevant information has been communicated to Chapter 14.
Expert and Government Review Comments on the IPCC WGI AR5 Second Order Draft – Chapter 12
Do not Cite, Quote or Distribute Page 58 of 120
Comment No
Chapter
FromPage
FromLine
To Page
To Line Comment Response
not to a report, guiyo] [Government of United States of America]
12-757 12 37 25 37 25 Understanding changes in atmospheric circulation are also important to understand the regionalization (scale dependent as well) of climate change. [Government of United States of America]
Accept - text revised.
12-758 12 37 25 37 26 suggest to refer to Chapter 9 here when addressing the model evaluation of CMIP5 GCMs. [Thomas Stocker/ WGI TSU, Switzerland]
Accepted - text revised
12-759 12 37 25 Please briefly state what is meant by “Enhanced atmospheric stability” in the context of deepening convection. Saying the atmosphere is stable where convective overturning is occurring seems counterintuitive. [Government of United States of America]
This comment is for page 39. Text modified to state how a deepening of the troposphere yields weakened overturning cells.
12-760 12 38 1 38 1 you need to be careful to use a consistent font for all the text in this and all other figures. Get rid of the Times Roman here [Peter Clift, United States of America]
Accepted
12-761 12 38 42 Even though this section is on upper level winds, please identify the increase in meridional temperature gradient as an upper-level phenomenon. This would be helpful for non experts who have to reconcile this statement with the surface pattern, that the poles are warming faster than the lower latitudes. Additionally, you could refer the reader to Chapter 14, page 51, beginning around line 52 where this is discussed in some detail. [Government of United States of America]
Accepted - text revised to include "upper tropospheric" and a reference to Box 14.3 added
12-762 12 39 3 39 12 Held and Soden's (2006) argment only applies to mass flux change, and not every tropical circulation needs to slow down. In fact, the southern Hadley cell intensifies in most CMIP models because of the change in inter-hemispheric SST gradient (greater SST warming in the northern than southern tropics) (Fig. 14 of Ma and Xie 2013). In fact, more than 80% of inter-model variability in Hadley circulation change is due to that in merdional SST gradient (Ma and Xie 2013). I suggest treating Walker and Hadley circulation separately here and in Executive Summary. Ref: Ma, J., and S.-P. Xie, 2013: Regional patterns of sea surface temperature change: A source of uncertainty in future projections of precipitation and atmospheric circulation. J. Climate, in press, doi:10.1175/JCLI-D-12-00283.1. [Shang-Ping Xie, United States of America]
Noted! The reference has been consulted. There is still a large body of evidence suggesting that both the Hadley and Walker circulation patterns might weaken (including some experiments of Ma and Xie, 2013), although the latter circulation slowdown appears more robust. That the Southern Hemisphere Hadley cell may strengthen in response to meridional SST gradients has been mentioned in Section 12.4.4.2. However, in the Executive Summary which summarises findings from the majority of published literature, we still maintain that both the Walker and Hadley circulations are likely to weaken.
12-763 12 39 7 39 8 Evidence is inconclusive on recent trends in the strength of the Hadley and Walker circulations, though there is medium confidence of an anthropogenic influence on the observed widening of the Hadley circulation' this statement needs a reference [Robert Webb, United States of America]
Accepted! Stachnik and Schumacher (2011) has been cited. This paper shows that trends in the Hadley Cell intensity are dependent on the reanalyses data used, with some showing a stronger Hadley Cell (e.g. ERA40) and others showing a weakening cell (e.g. NCEP-NCAR). We have also cited four papers, two (Vecchi et al, 2006 & Tokinaga et al, 2012) show a weakening of the Pacific Walker Circulation while the other two (Sohn and Park, 2010 & Merrifield 2011) suggest a strengthening of the circulation in observations.
12-764 12 39 7 39 8 Please check consistency carefully with Chapter 10. SOD of Chapter 10 suggests medium confidence that stratospheric ozone depletion has contributed to poleward shift of the Southern Hadley cell during Austral summer. No direct statement of medium confidence in a more general anthropogenic influence on widening of the Hadley circulation. [Thomas Stocker/ WGI TSU, Switzerland]
Noted! Chapter 10, Subsection 10.3.3.1 mentions that "CMIP5 simulations suggest that changes in anthropogenic forcings could contribute to the observed widening of the Hadley circulation"
12-765 12 39 11 39 12 Chadwick et al. 2012 also show this robust agreement among CMIP5 models on the weakening of the tropical circulation under the RCP8.5 scenario (see Figs. 1&2). Chadwick et al. 2012, 'Spatial Patterns of Precipitation Change in CMIP5: Why the Rich don't get Richer in the Tropics', In Press at J. Clim. [Robin Chadwick, United Kingdom]
Noted! The reference has been consulted.
12-766 12 39 17 39 19 Knutson & Manabe '95 were the first to propose this mechanism of stability/radiative descent changes Noted! The reference has been consulted. However

Expert and Government Review Comments on the IPCC WGI AR5 Second Order Draft – Chapter 12
Do not Cite, Quote or Distribute Page 59 of 120
Comment No
Chapter
FromPage
FromLine
To Page
To Line Comment Response
weakening the descent branch of the tropical circulation, so this should be referenced here. Knutson & Manabe 1995, 'Time-Mean Response over the Tropical Pacific to Increased CO2 in a Coupled Ocean-Atmosphere Model', J. Clim. 8, 2181-2199 [Robin Chadwick, United Kingdom]
we attempt to cite recent publications particularly if there is consistency with earlier findings
12-767 12 39 21 32 A useful new paper on this is Ma and Xie (2012). They show that mean advection of the increased vertical stratification can act to slow the tropical circulation. Ma, Jian, Shang-Ping Xie, Yu Kosaka, 2012: Mechanisms for Tropical Tropospheric Circulation Change in Response to Global Warming*. J. Climate, 25, 2979–2994. [Peter Good, United Kingdom]
Noted! The reference has been consulted.
12-768 12 39 23 39 29 Ma et al. 2012 have recently suggested that the mean advection of stratification change under the relatively uniform SST warming that occurs under greenhouse gas forcing leads to a spatial pattern of total column temperature change that weakens the tropical circulation. I suggest altering this passage to begin: 'Several mechanisms have been proposed for the weakening of the tropical circulation...', and including the Ma et al. mechanism. Ma et al. 2012, 'Mechanisms for Tropical Tropospheric Circulation Change in Response to Global Warming', J. Clim. 25, 2979-2994 [Robin Chadwick, United Kingdom]
Noted! The reference has been consulted and text edited.
12-769 12 39 44 39 46 A more up-to-date reference to Hadley Cell expansion: Davis & Rosenlof 2012 (J. Climate, 25, 1061-1078) [Jouni Räisänen, Finland]
Noted! The reference has been consulted.
12-770 12 39 45 degrees latitude? [David Erickson, United States of America] Accepted! The text has been edited
12-771 12 39 48 39 57 A recent study showed that the Walker Circulation in the tropical Pacific under global warming would not be necessarily weakened (Luo, J.-J., W. Sasaki, and Y. Masumoto, 2012: Indian Ocean warming modulates Pacific climate change. PNAS, www.pnas.org/cgi/doi/10.1073/pnas.1210239109<http://www.pnas.org/cgi/doi/10.1073/pnas.1210239109>). The centennial linear trends of the tropical Pacific trade winds among different models and different emission scenarios show large spreads in both CMIP3 and CMIP5 projections. The Pacific Walker Circulation change is affected not only by global warming but also by Indian Ocean-Pacific warming contrast. The conclusion that the Walker Cell would weaken under global warming, given in this section, is not consistent with the conclusion given in Chapter 14 (section 14.4.1, page 37) which reads more neutral. [Government of Australia]
Noted! The reference has been consulted and cited as describing a mechanism that affects the strength of the Walker circulation. However, in this assessment we consider the majority of lines of evidence, which hitherto suggest that the Walker Cell is likely to weaken
12-772 12 39 48 39 57 Section: 12.4.4.2: A recent study showed that the Walker Circulation in the tropical Pacific under global warming would not be necessarily weakened (Luo, J.-J., W. Sasaki, and Y. Masumoto, 2012: Indian Ocean warming modulates Pacific climate change. PNAS, www.pnas.org/cgi/doi/10.1073/pnas.1210239109). The centennial linear trends of the tropical Pacific trade winds among different models and different emission scenarios show large spreads in both CMIP3 and CMIP5 projections. The Pacific Walker Circulation change is affected not only by global warming but also by Indian Ocean-Pacific warming contrast. The conclusion that the Walker Cell would weaken under global warming, given in this section, is not consistent with the conclusion given in Chapter 14 (section 14.4.1, page 37) which reads more neutral. [Jing-Jia Luo, Australia]
Noted! The reference has been consulted. However, in this assessment we consider the majority of lines of evidence, which hitherto suggest that the Walker Cell is likely to weaken
12-773 12 39 53 39 53 "strenthen": typo for "weaken"? "changes in zonal SST" are not consistent among models, increasing in some and decreasing in some others. [Shang-Ping Xie, United States of America]
Noted! This is actually not a typo, we meant strengthen according to Figure 7 of Vecchi and Soden, 2007
12-774 12 39 54 39 56 The statement that a trend to more El Nino-like conditions is already occurring is at odds with statements in other parts of the report. In section 2.7.5, p 2-65, l 20-36 (especially 33-36) reports that the weakening trend of the Walker circulation has reversed since about 1990. This observation is re-iterated and extended to the east-west SST gradient across the equatorial Pacific on p 2-70, l 2-13. In section 14.4.1, p 14-37, l 21-26 it is reported that conclusions about the zonal SST gradient in the equ. Pac. Depend strongly on the data set used. Furthermore, lines 43-46 on the same page confirm the statements from section 2 that are cited above. [Andreas Sterl, Netherlands]
Noted! El Nino-like has been avoided .
12-775 12 39 55 39 56 There is considerable debate in the literature as to whether the equatorial Pacific zonal SST gradient has weakened or strengthened over the last century (c.f. WG1 SOD Chapter 14 p37 lines 19-26 and references contained therein). Therefore the statement that projected changes toward a more El Nino-like state are already occurring should be changed to reflect this unresolved debate. [Robin Chadwick, United Kingdom]
Noted! El Nino-like has been avoided .
12-776 12 39 55 Avoid term 'El Nino -like'. It is misleading as it implies changes in the ocean are also El Nino-like, which they Noted! El Nino-like has been avoided .

Expert and Government Review Comments on the IPCC WGI AR5 Second Order Draft – Chapter 12
Do not Cite, Quote or Distribute Page 60 of 120
Comment No
Chapter
FromPage
FromLine
To Page
To Line Comment Response
are not. [Jaclyn Brown, Australia]
12-777 12 40 2 40 19 I think there are some key references missing here: as Garcia and Randel (2008) and Calvo and Garcia (2009). References: Garcia and Randel, 2008: Acceleration of the Brewer-Dobson circulation due to increases in Greenhouse Gases. J. Atm. Sci., 10.1175/2008JAS2712.1. Calvo and Garcia , 2009: Wave forcing of the tropical upwelling in the lower stratosphere under increasing concentrations of Greenhouse gases. J. Atm. Sci., 10.1175/2009JAS3085.1. Also, based on the literature, I believe some of the claims made here are not completely accurate. I explain this in my comments below. [Natalia Calvo, Spain]
Noted! The reference has been consulted and text edited.
12-778 12 40 4 40 4 Please include Garcia and Randel (2008) and Calvo and Garcia (2009) (full references are given in my previous comment). [Natalia Calvo, Spain]
Noted! The reference has been consulted and text edited.
12-779 12 40 4 40 6 This sentence is not clear. The reasons for the increased Brewer Dobson circulation in the lower stratosphere are the increased propagation and DISSIPATION of waves in the subtropics, which forces increased upwelling in response to changes in temperature and zonal wind structure. It is neccesary to have more dissipation in the subtropics in order to increase the tropical upwelling (Downward control principle), changes in propagation only cannot explain the observed and predicted changes. See the references I cited above and the ones referred in the paragraph. [Natalia Calvo, Spain]
Noted! The text has been edited according to the suggested citation.
12-780 12 40 4 40 6 The role of resolved and parameterized waves in the lower stratosphere discussed in this sentence is confusing. According to the literature, there is a very good agreement across models in the lowermost stratosphere where resolved waves are the main contributor to the increase in upwelling. This is not obvious from reading this sentence. In the deep branch, the role of gravity waves increases compared to the low stratosphere. Butchart et al. (2006) referred in line 3 says in their abstract that trends in the annual mean mass fluxes derived from the EP-flux divergence (and thus, resolved waves) explain about 60% of the trends of the trend...' In the last section of this paper, it is said '... the strength of the BDC in a changing climate results primarily from an increased in resolved wave driving'.Butchart et al. (2010) does say in the abstract that 60% of the trend is due to gravity waves (CCMVal1 models) but Butchart et al. (2011) again says that at 70hPa, the resolved waves accounted for 70.7%, 21% (orographic gravity waves) and 7% (non orographic gravity waves) (These are CCMVal2 models). In addition, particular models show that the role of resolved waves is the largest in the lowermost stratosphere (see Garcia and Randel 2008 and McLandress and Shepherd 2009). I agree this is mainly due to planetary waves (McLandress adn Shepherd 2009; Calvo and Garcia 2009). [Natalia Calvo, Spain]
Noted! The text has been edited to avoid possible confusions
12-781 12 40 6 7 The reference to chemistry-climate models is confusing here. Does chemistry really play a role here, or is it just the fact that these models resolve the stratosphere? [Peter Good, United Kingdom]
Noted! The text actually refers to CCMVal models which resolve the stratosphere. The text has been edited
12-782 12 40 7 40 10 I understand here , this refers to the deep branch of the Brewer Dobson circulation, that reaches the upper stratosphere and turns into the polar regions. I think there is still not a consensus on what are the drivers of the intensification of the deep branch of the BDC. In fact , the agreement across models in this region is not as good as in the lower stratosphere although it is true that the role of gravity waves increases with height. [Natalia Calvo, Spain]
Accepted! The text has been edited to avoid possible confusions
12-783 12 40 15 40 15 Do you mean 'simulated' instead of observed? I suggest to cite here Garcia and Randel (2008) as well. [Natalia Calvo, Spain]
Noted! We have used "has already been reported" instead
12-784 12 40 17 Perhaps include ozone exchange implications. [David Erickson, United States of America] Noted! Implications for ozone exchange have been mentioned
12-785 12 40 21 41 22 Section 12.4.4.3: The authors should consider results discussed in section 4.a. of Maloney et al. (“North American Climate in CMIP5 Experiments: Part III: Assessment of 21st Century Projections”) which describe projected changes in storm tracks in the 21st century, especially since section 12.4.4.3 is directed towards making a number of confidence statements; the arguments could be bolstered by reconciling the Maloney et al. results with the description in this section, and at the very least, including the reference. [Government of United States of America]
This paper was not accepted for publication before the WG1 deadline, and so cannot be cited in this report.
12-786 12 40 25 40 28 Insert somewhere after 'These analyses use a variety of methods for diagnosing storm tracks': "An Cited as indicating that diagnosed changes are

Expert and Government Review Comments on the IPCC WGI AR5 Second Order Draft – Chapter 12
Do not Cite, Quote or Distribute Page 61 of 120
Comment No
Chapter
FromPage
FromLine
To Page
To Line Comment Response
intercomparison study (Ulbrich et al. 2012) involving numerous methods applied on one AOGCM simulation (SRES A1B) showed that although considerable differences in the total numbers of identified cyclones exist, the climate change signal for all cyclones are largely similar between methods, showing decreasing numbers in the Mediterranean, the Barents and Greenland Seas, the mid-latitude Pacific and North America. Changing patterns are even more similar, if only the most severe systems are considered: the methods reveal a coherent statistical significant increase in frequency over the north-east Atlantic and north Pacific." - Reference: Ulbrich U. , G C. Leckebusch, J. Grieger, M. Schuster, M. Akperov, M.Yu. Bardin, Y. Feng, S. Gulev, M. Inatsu, K. Keay, S.F. Kew, M.L.R. Liberato, P. Lionello, I.I. Mokhov, U. Neu, J.G. Pinto, C.C. Raible, M. Reale, I. Rudeva, I. Simmonds, N.D. Tilinina, I.F. Trigo, S. Ulbrich, X.L. Wang, H. Wernli, and the IMILAST team, 2012: Are Greenhouse Gas signals of Northern Hemisphere winter extra-tropical cyclone activity dependent on the identification and tracking methodology? Met. Zeitschrift (submitted) [Urs Neu, Switzerland]
relatively insensitive to methods used.
12-787 12 40 32 How big is "small"? [David Erickson, United States of America] Reworded to note that the change is less than a few percent.
12-788 12 40 35 40 39 Suggest insert the following before “Although there is thus some..." Frederiksen et al. (2010, 2011a, b) have shown that changes in the winter time Southern Hemisphere storm tracks are related to large reductions in the baroclinicity of the atmosphere in a zonal band centred near 30S, which have reduced the growth rate of storms at this latitude by more than 30%; further poleward there has been an increase in baroclinicity with a tendency for storms to also form at higher latitudes. An analysis of CMIP3 models shows that this situation is likely to continue into the twenty first century with the rate of decrease in baroclinicity near 30S being similar to that during the twentieth century. References: Frederiksen, C.S., J.S. Frederiksen, J.M. Sisson and S.L. Osbrough, 2011a: Australian winter circulation and rainfall changes and projections. Int. J. Clim. Change Strat. Mang., 3, Issue 2, 170-188. Frederiksen, C.S., J.S. Frederiksen, J.M. Sisson and S.L. Osbrough, 2011b: Changes and Projections in the Annual Cycle of the Southern Hemisphere Circulation, Storm Tracks and Australian Rainfall. Int. J. Clim. Change Impacts Responses, 2, 143-162. Frederiksen, J.S., C.S. Frederiksen, S.L. Osbrough and J.M. Sisson, 2010: Causes of changing Southern Hemispheric weather systems. Chapter 8, Managing Climate Change, Eds. I. Jupp, P. Holper and W. Cai, CSIRO Publishing, pp85-98. [Government of Australia]
Included as part of the physical basis for understanding storm-track shifts.
12-789 12 40 35 Suggest insert the following before “Although there is thus some…..”: "Frederiksen et al. (2010, 2011a, b) have shown that changes in the winter time Southern Hemisphere storm tracks are related to large reductions in the baroclinicity of the atmosphere in a zonal band centred near 30S, which have reduced the growth rate of storms at this latitude by more than 30%; further poleward there has been an increase in baroclinicity with a tendency for storms to also form at higher latitudes. An analysis of CMIP3 models shows that this situation is likely to continue into the twenty first century with the rate of decrease in baroclinicity near 30S being similar to that during the twentieth century." References: Frederiksen, C.S., J.S. Frederiksen, J.M. Sisson and S.L. Osbrough, 2011a: Australian winter circulation and rainfall changes and projections. Int. J. Clim. Change Strat. Mang., 3, Issue 2, 170-188. Frederiksen, C.S., J.S. Frederiksen, J.M. Sisson and S.L. Osbrough, 2011b: Changes and Projections in the Annual Cycle of the Southern Hemisphere Circulation, Storm Tracks and Australian Rainfall. Int. J. Clim. Change Impacts Responses, 2, 143-162. Frederiksen, J.S., C.S. Frederiksen, S.L. Osbrough and J.M. Sisson, 2010: Causes of changing Southern Hemispheric weather systems. Chapter 8, Managing Climate Change, Eds. I. Jupp, P. Holper and W. Cai, CSIRO Publishing, pp85-98. [Carsten Frederiksen, Australia]
This is a duplicate of Comment No. 12-788; addressed there.

Expert and Government Review Comments on the IPCC WGI AR5 Second Order Draft – Chapter 12
Do not Cite, Quote or Distribute Page 62 of 120
Comment No
Chapter
FromPage
FromLine
To Page
To Line Comment Response
12-790 12 40 36 40 35 Suggest insert the following before “Although there is thus some…..” Frederiksen et al. (2010, 2011a, b) have shown that changes in the winter time Southern Hemisphere storm tracks are related to large reductions in the baroclinicity of the atmosphere in a zonal band centred near 30S, which have reduced the growth rate of storms at this latitude by more than 30%; further poleward there has been an increase in baroclinicity with a tendency for storms to also form at higher latitudes. An analysis of CMIP3 models shows that this situation is likely to continue into the twenty first century with the rate of decrease in baroclinicity near 30S being similar to that during the twentieth century. [Jorgen Frederiksen, Australia]
This is a partial duplicate of Comment No. 12-788; addressed there.
12-791 12 40 41 This paragraph begins by discussing winter only, but later it is not clear if we are still talking about winter storm track, or annual storm track. [Government of United States of America]
The focus is on winter. Clarification added throughout the paragraph.
12-792 12 40 43 40 44 Please check consistency carefully with Chapter 10. We can't locate any material in the SOD of Chapter 10 concerning 'medium confidence' regarding an anthropogenic influence on a poleward shift in storm tracks. [Thomas Stocker/ WGI TSU, Switzerland]
The statement in question was in the Ch. 10 FOD. Now removed as it was deleted from the Ch. 10 SOD.
12-793 12 41 10 41 11 The two references listed are both Northern Hemisphere examples (Favre and Gershunov 2009; Finnis et al. 2007). To include support for this statement from a Southern Hemisphere perspective, a third reference could be added as follows: Dowdy, A. J., Mills, G. A., Timball, B. and Wang, Y., 2012: Changes in the risk of extratropical cyclone occurrence in eastern Australia. Journal of Climate, doi:10.1175/JCLI-D-12-00192.1, in press. This study indicates a reduction in the number of extratropical cyclones that could be expected to occur for Eastern Australia and the western South Pacific Ocean. [Government of Australia]
Added.
12-794 12 41 11 41 11 The statement that the occurrence of storng storms may increase is too generic as this has been generally only found to occur in specific areas/seasons. I would instead say that "the occurrence of strong storms may regionally increase (Pinto et al 2007, Albrecht et al 2009 Bengtsson et al 2009, Ulbrich et al 2009), with such regional changes being described in detailed in box 14.3". Finally, the Ulbrich et al 2008 reference is inappropriate here as the diagnostic they consider does not give information on strong storms behaviour. Albrecth et al 2009, Bengtsson et 2009, Ulbrich et al 2009 are as in the bibliography. Pinto et al., 2007: Changes in storm track and cyclone activity in three SRES ensemble experiments with the ECHAM5/MPI-OM1 GCM. Climate Dynamics, 29(2-3): 195-210. [Giuseppe Zappa, United Kingdom]
Accepted.
12-795 12 41 12 41 12 It would be important to cite here the very relevant recent investigation of * Ulbrich, U., G. C. Leckebusch, J. Grieger, M. Schuster, M. Akperov, M. Y. Bardin, F. Yang, S. Gulev, M. Inatsu, K. Keay, S. F. Kew, M. L. R. Liberato, P. Lionello, I. I. Mokhov, U. Neu, J. G. Pinto, C. Raible, M. Reale, I. Rudeva, I. Simmonds, N. D. Tilinina, I. F. Trigo, S. Ulbrich, X. L. Wang, H. Wernli and the IMILAST team, 2012: Are Greenhouse gas signals of Northern Hemisphere winter extra-tropical cyclone activity dependent on the identification and tracking algorithm? Meteorologische Zeitschrift, (accepted). These authors present an investigation into cyclone charateritics under future climate scenarios. Their main aim is to determine the sensitivity to the spefic cyclone scheme used, making use of a wide variety of cyclone tracking schemes in common use internationally. [Ian Simmonds, Australia]
Cited as indicating that diagnosed changes are relatively insensitive to methods used.
12-796 12 41 19 Analogy to eddy mixing in ocean? [David Erickson, United States of America] Not accepted. Not directly relevant to the discussion at hand.
12-797 12 41 21 41 22 We suggest deleting the final sentence "Conclusive results......". What does this mean? This is very unspecific, and such a sentence could be added to many sections. [Thomas Stocker/ WGI TSU, Switzerland]
Agreed. Removed.
12-798 12 41 24 41 44 Section 12.4.5 Changes in the Water Cycle: Text was checked for inconsistencies with own professional experience and competency. No relevant disagreements were detected with considered text. [Dirk Thielen, Venezuela]
Thanks for checking.
12-799 12 41 24 48 37 Sect. 12.4.5. Very important, in many cases the impacts of "global warming" on the water cycle are of more direct import to the biosphere than the temperature changes themselves. [Robert Kandel, France]
Rejected. That point is relevant to the Working Group II assessment, which discusses impact, rather than the Working Group I assessment.
12-800 12 41 26 41 32 Is this very general introductory paragraph on the water cycle needed? Suggest to delete [Thomas Stocker/ WGI TSU, Switzerland]
This general paragraph provides the overarching link to the previous sections cited and for all the
Expert and Government Review Comments on the IPCC WGI AR5 Second Order Draft – Chapter 12
Do not Cite, Quote or Distribute Page 63 of 120
Comment No
Chapter
FromPage
FromLine
To Page
To Line Comment Response
subsections that follow. No changes made.
12-801 12 41 26 32 reads a bit like a textbook here [Gabriele Hegerl, United Kingdom] This general paragraph provides the overarching link to the previous sections cited and for all the subsections that follow. No changes made.
12-802 12 41 39 41 39 Suggest deleting "amongst each other", and inserting "the water cycles simulated by " before "the CMIP3/5 models...". [Government of Canada]
Changed as suggested.
12-803 12 41 40 6 42 "modes": the recognizable "modes" are not the only source of natural variability. A way needs to be defined to acknowledge "plain" natural variability in this sentence. The simplest course might be to drop the modes and just mention natural variability. "not the same". [J. Graham Cogley, Canada]
No change made. Because we are examining changes between contemporary and projected decades, the interannual and interdecadal variability becomes especially relevant, which is why we discuss known variability on these time scales here.
12-804 12 41 48 42 11 Apologies for promoting one of my own papers, but reference could be made to Simmons et al.(2010) in this paragraph, as cited for example in section 2.5.5. The paper is relevant to this paragraph in chapter 12 because aside from providing observational/reanalysis evidence for a recent decline in relative humidity over land, the paper pointed out that time series of specific humidity over land tended to mirror those over sea, but with a time lag. It was accordingly argued that this was consistent with specific humidity at low levels over land being controlled by the availability of of moisture from the sea, which is the mechanism discussed at the top of page 12-42, and that relative humidity had fallen in recent years because temperatures over land had risen faster than temperatures over sea. The link with climate projection was noted, referring to the AR4 conclusion of greater projected warming over land than sea. It thus seems appropriate that a reference to the work of my co-authors and myself be included here. [Adrian Simmons, United Kingdom]
Noted in the revised text as showing consistency between projections and recent observed behavior.
12-805 12 41 48 42 11 Simmons et al. (2010.) also noted that their findings were not consistent with statements in AR4 (chapter 8, page 633) that humidity in the planetary boundary layer is controlled by strong coupling with the surface and that a broad-scale quasi-unchanged relative humidity response to forcing by increased greenhouse gases is uncontroversial. What is written now in AR5 represents a distinct change from what was written in AR4. This also could be noted in this paragraph. [Adrian Simmons, United Kingdom]
This refinement of the AR4 statement is noted in the revised text.
12-806 12 41 49 41 50 Suggest changing "controlled by naturally occurring processes rather than directly through water vapour emissions from human activities" to "dominated by naturally occurring processes and not significantly affected by human activities." [Government of Canada]
Changed to "dominated by naturally occurring processes and not significantly affected directly by human activities." "directly" retained since anthropogenic warming indirectly affects water vapor amounts.
12-807 12 41 50 6 51 "past modelling studies": this sentence needs to mention observational support for the approximate constancy of relative humidity. [J. Graham Cogley, Canada]
The text now references Chapter 2 and additional observational analysis, which are consistent with the types of changes seen in the projections.
12-808 12 41 56 41 56 Tropical Africa' is too general a term here for a description of where RH increases occur. Central and West equatorial Africa have RH decreases, as does West Africa during the JJA monsoon (see Fig. 12.21 of this chapter). Suggest changing to 'parts of tropical Africa' (c.f. also p45 line 14 of the technical summary of WG1). [Robin Chadwick, United Kingdom]
Agreed Wording revised as suggested..
12-809 12 41 58 41 58 "a last-saturation-temperature constraint": this constraint should be explained first and then given a name, rather than the other way round as now (which will make readers stop and think, and will baffle many of them). [J. Graham Cogley, Canada]
The writing has been reordered to make clear the meaning of the term "last-saturation-temperature constraint" .
12-810 12 41 58 Define last-saturation-temperature constraint. [David Erickson, United States of America] The writing has been reordered to make clear the meaning of the term "last-saturation-temperature constraint" .
12-811 12 42 1 42 2 "The specific humidity of air originating … by saturation temperatures (". Delete "level". [J. Graham Cogley, Canada]
Sentence reworded to "The specific humidity of air originating over more slowly warming oceans will be governed by saturation temperatures of oceanic air."
Expert and Government Review Comments on the IPCC WGI AR5 Second Order Draft – Chapter 12
Do not Cite, Quote or Distribute Page 64 of 120
Comment No
Chapter
FromPage
FromLine
To Page
To Line Comment Response
12-812 12 42 5 42 7 It is unclear what is meant here by lower confidence relative to "other" figures. And, once clarified, what is the reason for this lower confidence (and its significance to the overall message here)? [Government of United States of America]
This sentence dropped as it is not consistent with the newer figures of other water-cyle components.
12-813 12 42 7 42 9 This difference might be due to possibly different definitions of relative humidity (with respect to ice / with respect to water) in sub-zero temperatures. [Jouni Räisänen, Finland]
This sentence has been rewritten to apply to land areas more broadly. It also apples to summer as well as winter changes, so the factor mentioned by the reviewer should be of minor importance to the overall discussion.
12-814 12 42 7 42 9 Why do CMIP5 models show these different RH results then? Further detail needed. [Thomas Stocker/ WGI TSU, Switzerland]
The sentence in question has been rewritten to consider land changes in RH more broadly and remove the more narrow polar focus.
12-815 12 42 11 42 11 "are likely". [J. Graham Cogley, Canada] Corrected.
12-816 12 42 21 43 29 Much of the generic/theoretical material on how water vapour and precipitation are expected to respond to warming and directly to CO2 are already laid out in Chapter 7 (7.2 and 7.6 respectively), which should be noted here, and may allow some shortening of this section here. On the other hand Chapter 7 says nothing about what will happen on land (where the wet-get-wetter argument doesn't necessarily apply as noted by Held and Soden but sometimes forgotten), so it would be good if this section could say more about what the models actually project on land and other situations where the theoretical/idealised arguments are less helpful. [Steven Sherwood, Australia]
We have interacted with Chapter 7 and Chapter 11 authors on this matter. We have also modified our text to clarify where wet-gets-wetter, etc., appears valid and where it does not apply, for reasons we give.
12-817 12 42 21 44 39 Section 12.4.5.2 Patterns of Projected Average Precipitation Changes: Text was checked for inconsistencies with own professional experience and competency. No relevant disagreements were detected with considered text. [Dirk Thielen, Venezuela]
Noted
12-818 12 42 24 42 25 suggest to elevate this statement about "hiding regions" to the general introduction as it is not specific to precipitation only [Thomas Stocker/ WGI TSU, Switzerland]
We have shown seasonal projection of precipitation changes but only annual changes for the other moisture related fields. This statement is to reinforce that decision.
12-819 12 42 25 42 25 I find Fig 12.22 a bit confusing. I agree that the new included info is necessary, but it does not convey the message that well. [Ramon de Elia, Canada]
Comment is not specific enough to act on.
12-820 12 42 29 42 29 The zoanl and annual change in precipitation does not correlated well with the climatological distribution in the merdional direction, as shown in Fig. 2 of Ma and Xie (2013) in the CMIP5 ensemble. This lack of correlation is also obvious in SOD Fig. 12.10 right panels: the percentage rainfall increase shows a sharp peak on the equator where the precipitation climatoloy features a local minimum. The lack of spatial correlation between precipitation change and climatology challenges the wet-get-wetter view discussed in this subsection. [Shang-Ping Xie, United States of America]
We have modified our text to clarify where wet-gets-wetter, etc., appears valid and where it does not apply, for reasons we give.
12-821 12 42 29 42 31 The apparent agreement of the pattern of zonal mean precip change with the 'rich get richer' hypothesis may be misleading. Scheff & Frierson '12 show that for the CMIP3 models subtropical drying is largely caused by a poleward shift of the equatorial edge of the mid-latitude storm-tracks rather than the 'dry get drier' mechanism. Within the tropics Chadwick et al. '12 show that the zonal mean increase in CMIP5 precip observed between 10S and 10N is mainly due to spatial shifts in convergence zones, due to e.g. SST gradient changes, rather than the 'wet get wetter' mechanism of increased moisture transport (see Fig. 10). Scheff & Frierson 2012, 'Twenty-First-century multi-model subtropical precipitation declines are mostly midlatitude shifts', J. Clim., 25, 4330-4347. Chadwick et al. 2012, 'Spatial Patterns of Precipitation Change in CMIP5: Why the Rich don't get Richer in the Tropics', In Press at J. Clim. [Robin Chadwick, United Kingdom]
We have modified our text to clarify where wet-gets-wetter, etc., appears valid and where it does not apply, for reasons we give.
12-822 12 42 30 42 31 Garbled sentence. [J. Graham Cogley, Canada] This section has been extensively re-written.
12-823 12 42 30 It would be better to include the Chou and Neelin 2004 reference in the list on this line rather than where it currently occurs on line 36 (see also comment on p42 line 36). Switching it to this line also places it near the relevant nomenclature (since rich-get-richer originated there). [J. David Neelin, United States of America]
Taken into account - text has been modified and reference to Chou and Neelin 2004 has been included when the rich-get-richer mecnism is presented
Expert and Government Review Comments on the IPCC WGI AR5 Second Order Draft – Chapter 12
Do not Cite, Quote or Distribute Page 65 of 120
Comment No
Chapter
FromPage
FromLine
To Page
To Line Comment Response
12-824 12 42 33 42 47 Discussion in this paragraph and throughout this subsection relies on the wet-get-wetter view. An alternative view emerged in the recent 4-5 years that the SST pattern is very important for changes in tropical cyclones (Vecchi and Soden 2007b) and atmospheric convection (Xie et al. 2010; Widlansky et al. 2012). In the equatorial Pacific, the greatest percentage increase in precipitation (Fig. 12.10) happens in the climatological dry zone, and is instead anchored by the enhanced SST warming on the equator (Fig. 12.14). I suggest incorporating the warmer-get-wetter view for a balanced and up-to-date discussion. Refs: Vecchi, G.A., and B.J. Soden (2007): Effect of remote sea surface temperature change on tropical cyclone potential intensity, Nature, 450, 1066-1070 doi:10.1038/nature06423. Matthew J. Widlansky, Axel Timmermann, Karl Stein, Shayne McGregor, Niklas Schneider, Matthew H. England, Matthieu Lengaigne, Wenju Cai. (2012) Changes in South Pacific rainfall bands in a warming climate. Nature Climate Change, doi:10.1038/nclimate1726. [Shang-Ping Xie, United States of America]
We have modified our text to clarify where wet-gets-wetter, etc., appears valid and where it does not apply, for reasons we give.
12-825 12 42 36 The Chou and Neelin 2004 and Held and Soden 2006 references in this line don't match well with the previous sentence since both deal with models rather than observations, and aren't very explicit about temperature vertical structure. Chou et al. 2006 & 2009 discuss changes in the tropospheric stability, perhaps those are more relevant although it is model not observations [J. David Neelin, United States of America]
Take into account - text has been modified
12-826 12 42 37 42 37 "(coming from condensation)". [J. Graham Cogley, Canada] See reply to comment 12-827
12-827 12 42 37 42 37 "condensation" rather than "precipitation" [Manoj Joshi, United Kingdom of Great Britain & Northern Ireland] Taken into account - text has been removed from this section and is now in section 12.4.1, but the sugested modification has been included
12-828 12 42 40 42 40 "the absense of atmospheric circulation change" is a flawed assumption of the wet-get-wetter view. Changes in SST gradient drive substantial circulation change, explaining why the annual-mean rainfall change follows closely the warmer-get-wetter pattern (Xie et al. 2010; Widlansky et al. 2012). The dynamic component of the moisture budget is as large, if not larger, than the thermodynamic one in the tropics (Seager et al. 2010; Ma and Xie 2013). Ref. Seager, R., N. Naik, and G. A. Vecchi, 2010: Thermodynamic and dynamic mechanisms for large-scale changes in the hydrological cycle in response to global warming. J. Climate, 23, 4651-4668. [Shang-Ping Xie, United States of America]
Taken into account - the text has been modified to better indentify the respective role of circulation changes, humidity changes and SST changes
12-829 12 42 42 42 42 "subsidence zones" rather than "descent zones". [J. Graham Cogley, Canada] Agreed
12-830 12 42 46 42 46 "decrease" or "reduction" rather than "suppression". [J. Graham Cogley, Canada] Agreed
12-831 12 42 49 42 51 Just two forcings? [David Erickson, United States of America] These are not forcing but mechanisms. No change required.
12-832 12 42 54 42 56 suggest to refer to Figure 12.6 and its discussion which shows the mm/day vs oC changes in the CMIP5 ensemble [Thomas Stocker/ WGI TSU, Switzerland]
Taken into account - text has been removed from this section
12-833 12 42 56 42 58 Wentz et al. (2007) and others have used the natural variations in global or tropical precipitation to infer the global dP/dT ratio and compared it with that under GHG-induced global warming. This is like comparing apples with oranges, because the recent (1979-2010) tropical and global precipitation changes are largely due to the Pacific Interdecadal Oscillation (see Gu and Adler 2012, Clim. Dyn.) that have very different SST and P patterns compared those under GHG-induced global warming and thus the dP/dT will be totally different (much larger due to smaller global dT changes due to cancellation of the SST anomalies). I hope this IPCC report won't make the same mistake as Wentz et al. (2007) did. [Aiguo Dai, United States of America]
Discussion of global dP/dT is no longer included in this section.
12-834 12 42 58 43 1 Should "but not" be "but not to"? With or without this change, I have trouble working out what point the sentence is trying to make. [J. Graham Cogley, Canada]
Agreed
12-835 12 43 2 43 2 "similar fast and slow responses" is obscure. It seems to refer to different reactions of precipitation to greenhouse-gas forcing, but they are not mentioned anywhere in the vicinity of this sentence. [J. Graham Cogley, Canada]
This discussion is not part of the revised text.
12-836 12 43 2 43 8 The following papers indicate that absorbing aerosols lead to significant effects on the global mean precipitation chnages (see also 12.4.2 Pattern Scaling).
This discussion is not part of the revised text.

Expert and Government Review Comments on the IPCC WGI AR5 Second Order Draft – Chapter 12
Do not Cite, Quote or Distribute Page 66 of 120
Comment No
Chapter
FromPage
FromLine
To Page
To Line Comment Response
Shiogama, H., S. Emori, K. Takahashi, T. Nagashima, T. Ogura, T. Nozawa, and T. Takemura, 2010a: Emission Scenario Dependency of Precipitation on Global Warming in the MIROC3.2 Model. Journal of Climate, 23, 2404-2417. Shiogama, H., et al., 2010b: Emission scenario dependencies in climate change assessments of the hydrological cycle. Climatic Change, 99, 321-329. [Hideo Shiogama, Japan]
12-837 12 43 6 What about the other 25+ types of aerosols? [David Erickson, United States of America] Inadequate literature to make an assessment upon. No change required.
12-838 12 43 7 Is this based on modelling only? The assumption has been challenged although not that successfully - but virtually certain is very strong for something that isnt that well constrained by changes already observed. I am not quite comfortable with that [Gabriele Hegerl, United Kingdom]
This discussion is not part of the revised text.
12-839 12 43 8 Please add “over shorter timescales,”… to the sentence beginning on this line, or explain what is meant by “direct” effect in the preceding sentence. [Government of United States of America]
No sentence begins on this line
12-840 12 43 10 43 10 Section 12.4.5.2 : A general slowing down of the global and tropical circulation of the atmosphere (see Section 12.4.4.2 and 7.6.3) and... are robust features across the CMIP3 and CMIP5 models in a warmer world (Held and Soden 2006, Bony et al 2012). [Sandrine BONY, France]
Taken into account - the text has been modified and this sentence is no more present
12-841 12 43 12 43 15 suggest to delete the second part of the sentence starting from "simply because..." -- this is a repetition from page 42, lines 41 ff and is again repeated on page 44, lines 22ff [Thomas Stocker/ WGI TSU, Switzerland]
Taken into account - the text has been modified and this sentence has been modified
12-842 12 43 12 44 27 The 'rich get richer' mechanism is very prominent in this section in the discussion of how spatial patterns of precipitation may change. However in the tropics recent studies (Xie et al. 2010, Sobel & Camargo 2011, Ma & Xie 2012, Chadwick et al 2012) have pointed more towards a 'warmer gets wetter' paradigm, where the dominant mechanism behind the pattern of tropical precipitation change are shifts in convergence zones associated with SST gradient changes. The 'wet get wetter' pattern of largest precipitation increases in climatological ascent regions appears to be largely cancelled by the weakening of the tropical circulation and proves a poor description of the pattern of tropical circulation change projected by the CMIP5 models (Chadwick et al. 2012). WG1 SOD Chapter 14 p27 lines 34-52 describe the projected changes in tropical convection and rainfall in terms of 'warmer get wetter' rather than 'rich get richer' and I suggest that this needs to be reconciled with the discussion of rainfall pattern changes in chapter 12. Related to this is the finding by Scheff & Frierson '12 that the projected drying of the sub-tropics is largely due to shifts in mid-latitude storm-track rather than a 'dry get drier pattern', and in general the extrapolation of the 'rich get richer' hypothesis from patterns of P-E to P alone appears tenuous. Xie et al. 2010, 'Global Warming Pattern Formation: Sea Surface Temperature and Rainfall', J. Clim. 23 (4), 966-986. Sobel & Camargo 2011, 'Projected Future Seasonal Changes in Tropical Summer Climate', J. Clim. 24(2), 473-487. Ma & Xie 2012, 'Regional Patterns of Sea Surface Temperature Change: A Source of Uncertainty in Future Projections of Precipitation and Atmospheric Circulation', J. Clim. Early online release, DOI: 10.1175/JCLI-D-12-00283.1. Chadwick et al. 2012, 'Spatial Patterns of Precipitation Change in CMIP5: Why the Rich don't get Richer in the Tropics', In Press at J. Clim. Scheff & Frierson 2012, 'Twenty-First-century multi-model subtropical precipitation declines are mostly midlatitude shifts', J. Clim., 25, 4330-4347. [Robin Chadwick, United Kingdom]
Taken into account - the text of this section has been considerably modified to take into account the recent litterature. The validity and the limit of the "rich-get-richer" mecanism is now better explain, as well as the respetive role of change in circulation and change in humidity
12-843 12 43 13 43 15 This tends to repeat material at P42 L40-43. [J. Graham Cogley, Canada] See reply to comment 12-841
12-844 12 43 16 43 18 In tropical variability the dynamical response to local convective heating increases is a convergence feedback, and Chou et al. 2006 propose that this is also true under global warming. However the dynamical response to the relatively uniform SST increase simulated by the CMIP3/5 models in response to greenhouse gas forcing appears to be quite different to that of tropical variability (Ma et al 2012). In general greater total column temperature increases are projected in descent regions than ascent regions (Ma et al. 2012) and this leads to a large-scale divergence feedback associated with the weakening of the tropical circulation (Chadwick et al. 2012). There are still likely to be local convergence feedbacks in response to shifts in convergence zones, but unlike in tropical variability this may not be the dominant response. Ma et al. 2012, 'Mechanisms for Tropical Tropospheric Circulation Change in Response to Global Warming', J. Clim. 25, 2979-2994. Chadwick et al.
taken into account - see reply to comment 12-842
Expert and Government Review Comments on the IPCC WGI AR5 Second Order Draft – Chapter 12
Do not Cite, Quote or Distribute Page 67 of 120
Comment No
Chapter
FromPage
FromLine
To Page
To Line Comment Response
2012, 'Spatial Patterns of Precipitation Change in CMIP5: Why the Rich don't get Richer in the Tropics', In Press at J. Clim. [Robin Chadwick, United Kingdom]
12-845 12 43 22 43 22 "is large". "data bases". [J. Graham Cogley, Canada] Agreed
12-846 12 43 23 43 23 "the lesser response of precipitation to warming than that of water vapour". [J. Graham Cogley, Canada] Considered - text is no more in this section
12-847 12 43 23 43 27 These sentences discuss the global-mean precipitation change, and it is best to be combined with the previous paragraph. Even better, why not move them together into section 12.4.1.1 "Global-Mean Precipitation". [Shang-Ping Xie, United States of America]
Taken into account - the text of this section has been modified and this sentence is no more present
12-848 12 43 24 43 24 "and seen in the relatively short …". [J. Graham Cogley, Canada] Agreed
12-849 12 43 27 43 27 Please indicate a time period, instead of using the vague term "recent past". A cross-reference to Ch11 should be made in relation to the near future. [Thomas Stocker/ WGI TSU, Switzerland]
Taken into account - the text of this section has been modified and this sentence is no more present
12-850 12 43 27 43 29 I am not sure if the IPCC needed to convene an esteemed panel of world class climate scientists to generate the sentence "Nonetheless, it is virtually certain that changes in average precipitation in a much warmer world will be mixed, with regions experiencing increases, or decreases or not much change at all." I suggest deleteing the sentence since a more informative discussion explaining the details of this statement is provided earlier in the section. [Robert Webb, United States of America]
Taken into account - the text has been modified
12-851 12 43 39 43 39 Indeed, regional patterns of precipitation have long suffered huge uncertainties among models.Major progress has been made in understanding the sources of the uncertainty: about one third of inter-model variability in precipitation change is due to that in projected SST pattern (Ma and Xie 2013). This is another illustration of the warmer-get-wetter effect. [Shang-Ping Xie, United States of America]
Taken into account - the text now include discussion on the effect of SST changes
12-852 12 43 44 Is the internal variability as strong as the anthropogenic forcing? [David Erickson, United States of America] This is reflected in the hatching/stippling scheme used in the maps of projected changes. Obviously a function of time and space.
12-853 12 43 45 43 46 Glad to see Deser et al. (2012) being cited. I think the IPCC report should emphasize that for regional precipitation and other related variables, unforced natural variations on decadal to multidecadal time scales can result in different change patterns among different models and among different model runs when 20yr-averaged precipitation difference maps are examined. Thus it is incorrect to attribute the inter-model spread in such difference maps entirely to uncertainties associated with model physics. Rather, these are largely unpredicatble natural variations one should expect to see. Only the use of large ensembles will reduce the spread associaed with natural variations. [Aiguo Dai, United States of America]
noted
12-854 12 43 47 43 49 Low confidence in little change would imply some risk of large changes (without being confident of the direction). Stating this in these terms as well would be helpful for readers taking a risk perspective. The risk perspective does not receive enough focus in this chapter [Government of Australia]
Considered - the focus of this section is more on the description and the explanation of the changes than a risk analysis of these changes. We do not find much litterature on this aspect.
12-855 12 43 47 43 49 Low confidence in little change would imply some risk of large changes (without being confident of the direction). Stating this in these terms as well would be helpful for readers taking a risk perspective. The risk perspective does not receive enough focus in this chapter [Penny Whetton, Australia]
See reply to comment 12-854
12-856 12 43 49 43 52 Please clarify last sentence. We could not make sense of the current wording. [Thomas Stocker/ WGI TSU, Switzerland]
Taken into account - text has been modified
12-857 12 43 54 43 54 "Confidence grows in the patterns … Figure 12.22 as temperature increases." In general, try to avoid such transpositions of qualifiers in technical writing aimed at non-specialist readers. (A pattern cannot be confident.) [J. Graham Cogley, Canada]
Taken into ccount - texte has been modified
12-858 12 44 3 44 3 "additional water carrying capacity" is loose wording I think: change to "increased specific humidity" [Manoj Joshi, United Kingdom of Great Britain & Northern Ireland]
Taken into ccount - texte has been modified
12-859 12 44 3 On the snowfall changes. It could be useful to add that in mid-latitude regions with winter mean temperatures Taken into account - all the discussion on snow fall

Expert and Government Review Comments on the IPCC WGI AR5 Second Order Draft – Chapter 12
Do not Cite, Quote or Distribute Page 68 of 120
Comment No
Chapter
FromPage
FromLine
To Page
To Line Comment Response
above freezing (eg western Europe), snowfall rates on days with mean t2m below freezing, are expected to decrease, despite the increase of temperature on those days. This reduction occurs because in these areas the cold temperatures are "slaved" to the circulation. This is a robust finding in CMIP3 models and observations (de Vries etal, 2012, Climate dynamics, in press) [Hylke de Vries, Netherlands]
changes has been now in Section 12.4.6.2. The point mentionned has been included in that section.
12-860 12 44 7 44 10 Section 12.4.5.2 : Over oceans, the positive radiative forcing from increased atmospheric CO2 reduces the radiative cooling of the troposphere and weakens the large-scale overturning circulation (Figure 7.21), and hence partly opposes the wet-get-wetter, dry-get-drier effect of surface warming (Bony et al. 2012). [Sandrine BONY, France]
Taken into acount - text has been modified
12-861 12 44 9 44 9 “CO2” – “2” to subscript. [Martin Juckes, United Kingdom] Agreed
12-862 12 44 11 44 11 Change "water vapour" to "evaporation", or perhaps to "specific humidity". [J. Graham Cogley, Canada] Taken into acount - text has been modified and this sentence is no more there
12-863 12 44 12 44 14 "Over large…" This sentence isn't clear to me. Does the low thermal inertia of land cause an initial reduction in precip after an increase in CO2 that's even more than over the oceans? [Manoj Joshi, United Kingdom of Great Britain & Northern Ireland]
Taken into acount - text has been modified
12-864 12 44 14 44 14 "than over the ocean alone." [J. Graham Cogley, Canada] Taken into acount - text has been modified
12-865 12 44 14 44 17 This discussion of Figure 12.7 is incomplete. Five models have estimates of dP/dT for RCP2.6 land that are outliers. They all seem to be earth-system models, and so perhaps they are doing a better job of representing the near-equilibrium response than the rest of the pack; if that is so, it should be mentioned, and in any case the collective plausibility of the outliers, and their impact on the corresponding mean, should be assessed in the text. One model of particular concern is GFDL-ESM2M; its estimates are about -5 % K-1 for RCP2.6 land and about +6 % K-1 for RCP2.6 ocean. [J. Graham Cogley, Canada]
Considered- This particular feature has not been well analysed in the available littérature and therefore can not be cited in the report.
12-866 12 44 14 44 19 Consider referring to the work of Dai here. E.g., Dai, A. 2011. Drought under global warming: a review. WIRES Clim. Change, 2: 45–65. doi: 10.1002/wcc.81; Dai, A. 2012. Increasing drought under global warming in observations and models. Nature Clim. Change. doi: 10.1038/nclimate1633. [Government of Canada]
Taken into account - this work is now considered in a new drought paragraph
12-867 12 44 19 44 19 Said earlier in page 42 line 29. [Ramon de Elia, Canada] Condidered - the whole text has been modified
12-868 12 44 19 44 27 The "wet-get-wtter, dry-get-drier" tendency is also found in the seasonal cycle, wet seasons get wetter and dry seasons get drier (Chou and Lan 2012; J. Climate, 25, 222-235). [Chia Chou, Taiwan, ROC]
Taken into acount - text has been modified
12-869 12 44 19 44 27 Does this statement apply to land areas, ocean, or both? Following on from my previous comment it would be very useful if this chapter could assess how well the “wet get wetter” paradigm applies specifically on continents, since a lot of time these ideas are tested over oceans only. [Steven Sherwood, Australia]
We have modified our text to clarify where wet-gets-wetter, etc., appears valid and where it does not apply, for reasons we give.
12-870 12 44 21 44 27 This tends to repeat material at P42 L40-47. [J. Graham Cogley, Canada] Taken into acount - text has been modified
12-871 12 44 36 Figure 12.22, caption: 1985 --> 1986?; 2045 --> 2046? [Thomas Stocker/ WGI TSU, Switzerland] Agreed
12-872 12 44 36 Figure 12.23, caption: 1985 --> 1986? [Thomas Stocker/ WGI TSU, Switzerland] Agreed
12-873 12 44 41 44 41 Dai (2012, Nature Climate Change, published online in Aug.) analyzed CMIP5 model simulated 21st century soil moisture changes, together with PDSI changes. This study is relevant to the predicted soil moisture and drought changes discussed in this chapter. [Aiguo Dai, United States of America]
We have cited this paper where appropriiate in sections 12.4.5.3 and 12.4.5.5.
12-874 12 44 41 45 43 Section 12.4.5.3: The paper titled “Evolving land-atmosphere interactions over North America from CMIP5,” prepared by Dirmeyer et al. could inform the discussion in this particular section, as it examines many of the same fields described in this section for the CMIP5 models. [Government of United States of America]
This paper has been cited as an example of projected seasonal changes in soil moisture and its modulation of land-atmosphere coupling,
12-875 12 44 41 No mention is made in this section to the SREX, and this is problematic as readers will want to know how the assessment given here compares to the SREX assessment of droughts/dryness, and why there are differences. At first glance, the chapter 12 assessment upgrades the projected changes in dryness for Mediterranean and other specified regions from 'medium confidence' in SREX, to 'high confidence - likely'.
Accepted. We have added discussion of drought, with reference to the SREX and studies beyond it.
Expert and Government Review Comments on the IPCC WGI AR5 Second Order Draft – Chapter 12
Do not Cite, Quote or Distribute Page 69 of 120
Comment No
Chapter
FromPage
FromLine
To Page
To Line Comment Response
However, it is clear that the two assessments are not really comparable, as SREX considered a much more comprehensive range of dryness indices and related literature in their assessment of projected changes in drought. We suggest to elaborate more on droughts here, referring to SREX Chapter 3 and comparing and explaining any differences between these two assessments. [Thomas Stocker/ WGI TSU, Switzerland]
12-876 12 45 3 45 3 Delete the second comma. [J. Graham Cogley, Canada] Agreed
12-877 12 45 6 45 9 I thought these drying patterns were a manifestation of the land-sea warming contrast which has been dealt with in 12-30, rather than Hadley cell changes. In any case this sentence says that the Hadley circulation increases in strength, which is at odds with ch12 pg 39 lines 12-19 which says that the Hadley cell decreases in strength. Perhaps the authors mean regional monsoonal circulations will increase in strength, amplified by the land-sea warming contrast, rather than the Hadley cell? [Manoj Joshi, United Kingdom of Great Britain & Northern Ireland]
The land-sea warming contrast contrast helps produce the widespread decrease in relative humidity over land,, However, the soil moisture changes are an outcome of changes in the terrestrial water balance and changes in relative humidity are only one factor. Reference to the Hadley circluation now cites its widening, which increases downwelling in the affected regions, without requiring overall strengthening of the circulation. This is consistent with revised discussion of seasonal precipitation changes.
12-878 12 45 23 45 25 Suggest rewording as: "For the Cline River watershed in western Canada, Kienzle et al. (2012) find decreases in summer soil moisture content, but annual increases averaging 2.6% by the 2080s." [Government of Canada]
Accepted, text modified
12-879 12 45 23 45 27 The scenario used does not appear to be clear. [John Caesar, United Kingdom of Great Britain & Northern Ireland]
Scenario information added.
12-880 12 45 23 45 27 Which emission scenario? [European Union] Scenario information added.
12-881 12 45 24 45 24 Space before "find". [J. Graham Cogley, Canada] Agreed
12-882 12 45 45 46 48 Section 12.4.5.4: Section 3.c. in the paper by Maloney et al. titled “North American Climate in CMIP5 Experiments: Part III: Assessment of 21st Century Projections” could inform the discussion of runoff and evaporation in this section. Their analysis is focused on North America, but the discussion in section 12.4.5.4 is regional in nature, and so the Maloney et al. results are relevant. [Government of United States of America]
This paper was not accepted for publication before the WG1 deadline, and so cannot be cited in this report.
12-883 12 45 45 48 37 The sections 12.4.5. Runoff and Evaporation and 12.4.5.5 Extreme Events in the Water Cycle does not take the discussion of changes out to the possible implications for flooding which is a significant impact challenging decision makers [Robert Webb, United States of America]
This is the responsibilty of WG2
12-884 12 45 52 45 52 "changes in the Hadley circulation"- see my comment #82 above [Manoj Joshi, United Kingdom of Great Britain & Northern Ireland]
Discussion under precipitation and soil moisture changes now focuses on the widening of the Hadley circulation, so the text here is consistent with the earlier discussion without any changes needed.
12-885 12 45 54 Repeatative. [David Erickson, United States of America] This text is not in the revised document.
12-886 12 45 56 45 57 See comment at P5 L6-7. [J. Graham Cogley, Canada] Text revised to "consistently project increases"
12-887 12 45 56 45 58 Annual total runoff is the difference between the annual precipitation and evaporation (P-E). Why should biases in snow cover be important for the changes in annual P-E? [Jouni Räisänen, Finland]
The relation to snow cover has been deleted.
12-888 12 45 56 Add references for for the runoff in Southern Europe, eg Sancher Gomez et al, 2009, Dubois et al. 2012 [Government of France]
The 2009 paper is cited. The 2012 paper covers up to 2050 and so is not appropriate for this chapter, but instead for Chapter 11's period of assessment.
12-889 12 46 1 46 7 Are changes in exrteme events important for driving runoff changes? I ask because the panels in Fig 12-24 bear a lot of similarity to Fig 12.26 [Manoj Joshi, United Kingdom of Great Britain & Northern Ireland]
The extremes assessed in this chapter are based on daily quantities as the literature is extensive. The seasonal runoff quantities projected here would not be overly influenced by daily extremes in our opinion. A connection to seasonal extremes might be made but

Expert and Government Review Comments on the IPCC WGI AR5 Second Order Draft – Chapter 12
Do not Cite, Quote or Distribute Page 70 of 120
Comment No
Chapter
FromPage
FromLine
To Page
To Line Comment Response
we are unaware of a literature to assess.
12-890 12 46 9 46 10 Where on Earth is the Cline River watershed? [Jouni Räisänen, Finland] Emphasis on this watershed has been reduced, though its country (Canada) has been noted.
12-891 12 46 15 Figure 12.24, caption: 1985 --> 1986? [Thomas Stocker/ WGI TSU, Switzerland] Agreed
12-892 12 46 26 45 27 Consider relating this to these regions being arid or semi-arid--where soil moisture and vegetation already impose limitations on evaporation. [Government of Canada]
The areas with significant decrease, by our measure (stippled), are limited to regions that are already arid. The broader areas with significant increase would not appear to be so limited.
12-893 12 46 36 45 38 Suggest considering whether increased runoff, if it occurred in response to stomatal feedback, would generally be limited to regions where present day soil and vegetation are not moisture-limited. Significant increases in runoff would be likely to occur only where there is little or no water deficit. If the ecosystems were already drought-stressed, then vegetation stomatal control would already be operating in response to this and further reductions due to increased CO2 would be (relatively) small or even non-existent. [Government of Canada]
The runoff increases occur over wide regions, and there is no clear evidence that the increase is occurring primarily as a response to stomatal feedback.
12-894 12 46 37 46 37 needs to read transpiration not evapotranspiration [European Union] Agreed
12-895 12 46 37 46 50 and because these feedbacks are only (if at all) roughly implemented in models. There is a wealth of observational data at site scale which is obviously not considered yet for global models [European Union]
Limits on modeling noted in the text, though detailed assessment of this issue would have to occur in Chapter 9.
12-896 12 46 40 46 40 Could consider recent work related to crop response and crop-climate feedback sensitivity. E.g., Newlands et al. (2012). Understanding Crop Response to Climate Variability with Complex Agroecosystem Models. International Journal of Ecology, Volume 2012 (2012), Article ID 756242, 13 pages, doi:10.1155/2012/756242, and references therein. [Government of Canada]
Referenced where appropriate in the text.
12-897 12 46 43 Figure 12.25, caption: 1985 --> 1986? [Thomas Stocker/ WGI TSU, Switzerland] Agreed. Text changed
12-898 12 46 50 48 37 section 12.4.5.5: The discussion of precipitation extremes in section 12.4.5.5 is quite thorough, and the authors provide a significant lead-in on the definition and contextualization of extremes. The analysis in section 3.h. of Maloney et al. (“North American Climate in CMIP5 Experiments: Part III: Assessment of 21st Century Projections”) may not, for that reason, be appropriate to integrate into this section (also, Maloney et al. is focused on North America, whereas much of section 12.4.5.5 is more global in focus). Nevertheless, the authors may wish to include some discussion of the Maloney et al. results. [Government of United States of America]
This paper was not accepted for publication before the WG1 deadline, and so cannot be cited in this report.
12-899 12 46 50 48 37 Section 12.4.5.5 Extreme Events in the Water Cycle: Text was checked for inconsistencies with own professional experience and competency. No relevant disagreements were detected with considered text. [Dirk Thielen, Venezuela]
Noted
12-900 12 46 52 45 53 Suggest modifying to "… the temporal distribution of precipitation events…" [Government of Canada] Agreed.
12-901 12 46 52 48 30 These are essentially the same comments I made on the FOD, but I'll put them with 12.4.5.5 this time (since Chapter 2 puts severe thunderstorms under the hydrologic cycle) and see if the material is added. I'm not sure where this comment should go (Chapter 11 or 12), but there appears to be no discussion at all about modelled changes in severe thunderstorm activity. Given the relatively large number of papers published since AR4, this seems inconceivable. There is disagreement in the two papers about Australia about the change, but all of the North American studies have found similar results-an increase in convective available potential energy east of the Rockies and a decrease in vertical wind shear, with the former outweighing the latter, leading to an increase in the number of environments supportive of severe thunderstorms. The references follow in the next lines of comments. [Harold Brooks, United States of America]
This reviewer has written text to cover this, at our request.
12-902 12 46 52 48 30 Del Genio, A. D., M.-S. Yao, and J. Jonas, 2007: Will moist convection be stronger in a warmer climate? Geophys. Res. Lett., 34, L16703, doi:10.1029/2007GL030525 [Harold Brooks, United States of America]
This reviewer has written text to cover this, at our request.
12-903 12 46 52 48 30 Leslie, L.M., M. Leplastrier, and B.W. Buckley, 2008: Estimating future trends in severe hailstorms over the This reviewer has written text to cover this, at our
Expert and Government Review Comments on the IPCC WGI AR5 Second Order Draft – Chapter 12
Do not Cite, Quote or Distribute Page 71 of 120
Comment No
Chapter
FromPage
FromLine
To Page
To Line Comment Response
Sydney Basin: A climate modelling study. Atmospheric Research, 87(1), 37-57. [Harold Brooks, United States of America]
request.
12-904 12 46 52 48 30 Niall, S., and K. Walsh, 2005: The impact of climate change on hailstorms in southeastern Australia. International Journal of Climatology, 25(14), 1933-1952. [Harold Brooks, United States of America]
This reviewer has written text to cover this, at our request.
12-905 12 46 52 48 30 Trapp, R. J., N. S. Diffenbaugh, and A. Gluhovsky, 2009: Transient response of severe thunderstorm forcing to elevated greenhouse gas concentrations. Geophysical Research Letters, 36, L01703, doi:10.1029/2008GL036203 [Harold Brooks, United States of America]
This reviewer has written text to cover this, at our request.
12-906 12 46 52 48 30 Trapp, R. J., N. S. Diffenbaugh, H. E. Brooks, M. E. Baldwin, E. D. Robinson, and J. S. Pal, 2007: Changes in severe thunderstorm frequency during the 21st century due to anthropogenically enhanced global radiative forcing. Proc. National Acad. Sci., 104, DOI: 10.1073/pnas.0705494104. [Harold Brooks, United States of America]
This reviewer has written text to cover this, at our request.
12-907 12 46 52 48 30 Van Klooster, S. L., and P. J. Roebber, 2009: Surface-Based Convective Potential in the Contiguous United States in a Business-as-Usual Future Climate, J. Clim., 22, 3317-3330. doi: : 10.1175/2009JCLI2697.1 [Harold Brooks, United States of America]
This reviewer has written text to cover this, at our request.
12-908 12 46 52 48 30 Brooks 2012 provides a review of the modelling papers described in the comments above. (http://dx.doi.org/10.1016/j.atmosres.2012.04.002) Brooks, H. E., 2012: Severe thunderstorms and climate change. Atmos. Res., 112, in press. [Harold Brooks, United States of America]
This reviewer has written text to cover this, at our request.
12-909 12 46 54 46 55 What type of storms does this refer to? [John Caesar, United Kingdom of Great Britain & Northern Ireland] Wording changed to refer to precipitation events rather than specifiic storms.
12-910 12 46 54 46 55 How are storms defined here? Large-scale systems, wind storms, rain events? [European Union] Wording changed to refer to precipitation events rather than specifiic storms.
12-911 12 47 1 47 1 much of the text in this figure is too small to be read [Peter Clift, United States of America] Unclear as to which figure is referred to. None is mentioned in this paragraph
12-912 12 47 1 47 37 This paragraph is overly long and overlaps somewhat with the more succinct Ch 7 (in particular 7.5.5). I think you could reduce the text here and refer to that chapter or at least have some discussions with Ch 7 authors (also Ch 11 who have a lot on this) to determine where the description of the C-C/temperature scaling etc belongs. Perhaps you can split up the paragraph into "mechanisms" and "projections". [Lisa Alexander, Australia]
We split the paragraph at line 52 and added references to sections 7.6.5 and 11.3.2.5.2
12-913 12 47 1 47 37 Again the review of past studies here is similar to that in 7.6.5. At least a pointer should be put in place, and perhaps the Chapter 12 material could focus slightly more on the details emerging from CMIP5. [Steven Sherwood, Australia]
See reply to comment 12-912
12-914 12 47 5 47 11 Suggest rewording the first part of this sentence. Consider "Following the Clausius-Clapeyron relationship, the maximum amount of water vapour in air (saturation) increases with air temperature ...". Could use the term "saturation" to replace "maximum water vapour" at one or two places in the subsequent text. [Government of Canada]
Text is revised to reflect most of this rewording suggestion
12-915 12 47 6 47 6 Delete "air control". Insert "then" before "as air". [J. Graham Cogley, Canada] See reply to comment 12-914
12-916 12 47 6 "control" typo. [David Erickson, United States of America] See reply to comment 12-914
12-917 12 47 10 47 10 What does "fundamental" mean? I agree that there are systematic differences in making a comparison, but maybe nonetheless some statistics could be given and significance tests reported? [Jonathan Gregory, United Kingdom]
The comment appears to refer to a different line as the word "fundamental" does not appear on this page.
12-918 12 47 11 47 11 "is less compelling". [J. Graham Cogley, Canada] Agreed. Text changed
12-919 12 47 13 47 13 What does "occurrence" mean? "frequency"? [J. Graham Cogley, Canada] Agreed. Text changed
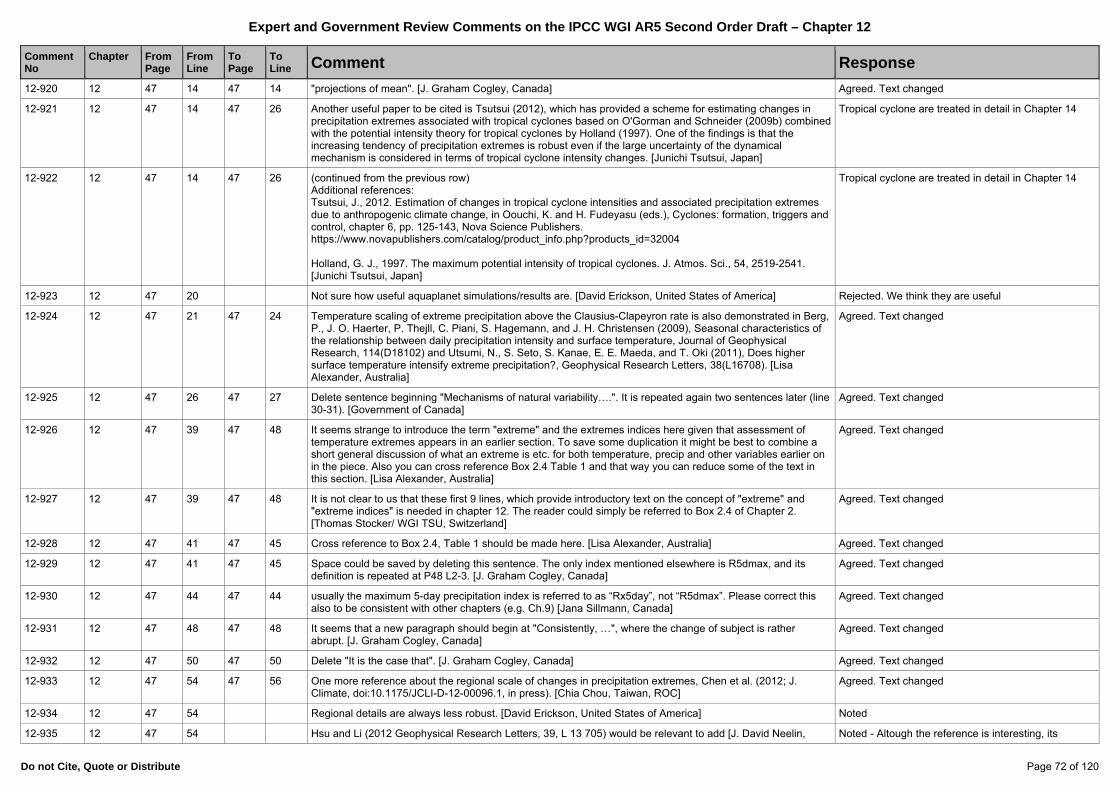
Expert and Government Review Comments on the IPCC WGI AR5 Second Order Draft – Chapter 12
Do not Cite, Quote or Distribute Page 72 of 120
Comment No
Chapter
FromPage
FromLine
To Page
To Line Comment Response
12-920 12 47 14 47 14 "projections of mean". [J. Graham Cogley, Canada] Agreed. Text changed
12-921 12 47 14 47 26 Another useful paper to be cited is Tsutsui (2012), which has provided a scheme for estimating changes in precipitation extremes associated with tropical cyclones based on O'Gorman and Schneider (2009b) combined with the potential intensity theory for tropical cyclones by Holland (1997). One of the findings is that the increasing tendency of precipitation extremes is robust even if the large uncertainty of the dynamical mechanism is considered in terms of tropical cyclone intensity changes. [Junichi Tsutsui, Japan]
Tropical cyclone are treated in detail in Chapter 14
12-922 12 47 14 47 26 (continued from the previous row) Additional references: Tsutsui, J., 2012. Estimation of changes in tropical cyclone intensities and associated precipitation extremes due to anthropogenic climate change, in Oouchi, K. and H. Fudeyasu (eds.), Cyclones: formation, triggers and control, chapter 6, pp. 125-143, Nova Science Publishers. https://www.novapublishers.com/catalog/product_info.php?products_id=32004 Holland, G. J., 1997. The maximum potential intensity of tropical cyclones. J. Atmos. Sci., 54, 2519-2541. [Junichi Tsutsui, Japan]
Tropical cyclone are treated in detail in Chapter 14
12-923 12 47 20 Not sure how useful aquaplanet simulations/results are. [David Erickson, United States of America] Rejected. We think they are useful
12-924 12 47 21 47 24 Temperature scaling of extreme precipitation above the Clausius-Clapeyron rate is also demonstrated in Berg, P., J. O. Haerter, P. Thejll, C. Piani, S. Hagemann, and J. H. Christensen (2009), Seasonal characteristics of the relationship between daily precipitation intensity and surface temperature, Journal of Geophysical Research, 114(D18102) and Utsumi, N., S. Seto, S. Kanae, E. E. Maeda, and T. Oki (2011), Does higher surface temperature intensify extreme precipitation?, Geophysical Research Letters, 38(L16708). [Lisa Alexander, Australia]
Agreed. Text changed
12-925 12 47 26 47 27 Delete sentence beginning "Mechanisms of natural variability….". It is repeated again two sentences later (line 30-31). [Government of Canada]
Agreed. Text changed
12-926 12 47 39 47 48 It seems strange to introduce the term "extreme" and the extremes indices here given that assessment of temperature extremes appears in an earlier section. To save some duplication it might be best to combine a short general discussion of what an extreme is etc. for both temperature, precip and other variables earlier on in the piece. Also you can cross reference Box 2.4 Table 1 and that way you can reduce some of the text in this section. [Lisa Alexander, Australia]
Agreed. Text changed
12-927 12 47 39 47 48 It is not clear to us that these first 9 lines, which provide introductory text on the concept of "extreme" and "extreme indices" is needed in chapter 12. The reader could simply be referred to Box 2.4 of Chapter 2. [Thomas Stocker/ WGI TSU, Switzerland]
Agreed. Text changed
12-928 12 47 41 47 45 Cross reference to Box 2.4, Table 1 should be made here. [Lisa Alexander, Australia] Agreed. Text changed
12-929 12 47 41 47 45 Space could be saved by deleting this sentence. The only index mentioned elsewhere is R5dmax, and its definition is repeated at P48 L2-3. [J. Graham Cogley, Canada]
Agreed. Text changed
12-930 12 47 44 47 44 usually the maximum 5-day precipitation index is referred to as “Rx5day”, not “R5dmax”. Please correct this also to be consistent with other chapters (e.g. Ch.9) [Jana Sillmann, Canada]
Agreed. Text changed
12-931 12 47 48 47 48 It seems that a new paragraph should begin at "Consistently, …", where the change of subject is rather abrupt. [J. Graham Cogley, Canada]
Agreed. Text changed
12-932 12 47 50 47 50 Delete "It is the case that". [J. Graham Cogley, Canada] Agreed. Text changed
12-933 12 47 54 47 56 One more reference about the regional scale of changes in precipitation extremes, Chen et al. (2012; J. Climate, doi:10.1175/JCLI-D-12-00096.1, in press). [Chia Chou, Taiwan, ROC]
Agreed. Text changed
12-934 12 47 54 Regional details are always less robust. [David Erickson, United States of America] Noted
12-935 12 47 54 Hsu and Li (2012 Geophysical Research Letters, 39, L 13 705) would be relevant to add [J. David Neelin, Noted - Altough the reference is interesting, its
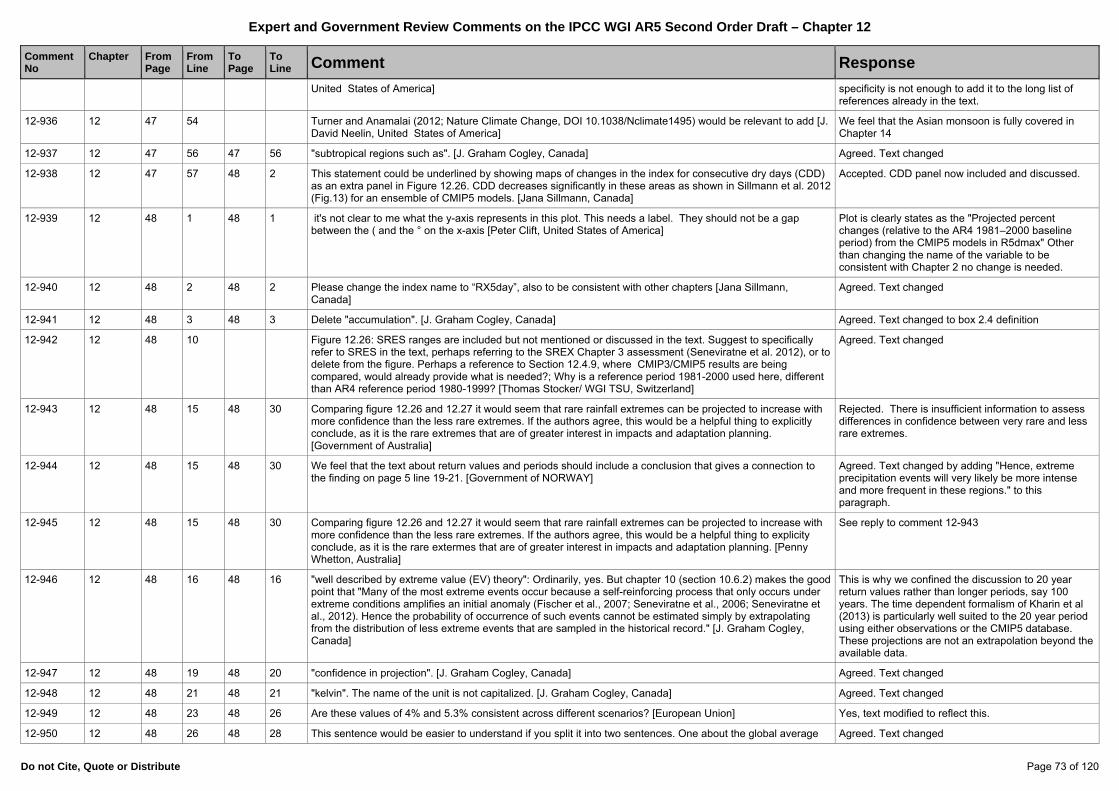
Expert and Government Review Comments on the IPCC WGI AR5 Second Order Draft – Chapter 12
Do not Cite, Quote or Distribute Page 73 of 120
Comment No
Chapter
FromPage
FromLine
To Page
To Line Comment Response
United States of America] specificity is not enough to add it to the long list of references already in the text.
12-936 12 47 54 Turner and Anamalai (2012; Nature Climate Change, DOI 10.1038/Nclimate1495) would be relevant to add [J. David Neelin, United States of America]
We feel that the Asian monsoon is fully covered in Chapter 14
12-937 12 47 56 47 56 "subtropical regions such as". [J. Graham Cogley, Canada] Agreed. Text changed
12-938 12 47 57 48 2 This statement could be underlined by showing maps of changes in the index for consecutive dry days (CDD) as an extra panel in Figure 12.26. CDD decreases significantly in these areas as shown in Sillmann et al. 2012 (Fig.13) for an ensemble of CMIP5 models. [Jana Sillmann, Canada]
Accepted. CDD panel now included and discussed.
12-939 12 48 1 48 1 it's not clear to me what the y-axis represents in this plot. This needs a label. They should not be a gap between the ( and the ° on the x-axis [Peter Clift, United States of America]
Plot is clearly states as the "Projected percent changes (relative to the AR4 1981–2000 baseline period) from the CMIP5 models in R5dmax" Other than changing the name of the variable to be consistent with Chapter 2 no change is needed.
12-940 12 48 2 48 2 Please change the index name to “RX5day”, also to be consistent with other chapters [Jana Sillmann, Canada]
Agreed. Text changed
12-941 12 48 3 48 3 Delete "accumulation". [J. Graham Cogley, Canada] Agreed. Text changed to box 2.4 definition
12-942 12 48 10 Figure 12.26: SRES ranges are included but not mentioned or discussed in the text. Suggest to specifically refer to SRES in the text, perhaps referring to the SREX Chapter 3 assessment (Seneviratne et al. 2012), or to delete from the figure. Perhaps a reference to Section 12.4.9, where CMIP3/CMIP5 results are being compared, would already provide what is needed?; Why is a reference period 1981-2000 used here, different than AR4 reference period 1980-1999? [Thomas Stocker/ WGI TSU, Switzerland]
Agreed. Text changed
12-943 12 48 15 48 30 Comparing figure 12.26 and 12.27 it would seem that rare rainfall extremes can be projected to increase with more confidence than the less rare extremes. If the authors agree, this would be a helpful thing to explicitly conclude, as it is the rare extremes that are of greater interest in impacts and adaptation planning. [Government of Australia]
Rejected. There is insufficient information to assess differences in confidence between very rare and less rare extremes.
12-944 12 48 15 48 30 We feel that the text about return values and periods should include a conclusion that gives a connection to the finding on page 5 line 19-21. [Government of NORWAY]
Agreed. Text changed by adding "Hence, extreme precipitation events will very likely be more intense and more frequent in these regions." to this paragraph.
12-945 12 48 15 48 30 Comparing figure 12.26 and 12.27 it would seem that rare rainfall extremes can be projected to increase with more confidence than the less rare extremes. If the authors agree, this would be a helpful thing to explicity conclude, as it is the rare extermes that are of greater interest in impacts and adaptation planning. [Penny Whetton, Australia]
See reply to comment 12-943
12-946 12 48 16 48 16 "well described by extreme value (EV) theory": Ordinarily, yes. But chapter 10 (section 10.6.2) makes the good point that "Many of the most extreme events occur because a self-reinforcing process that only occurs under extreme conditions amplifies an initial anomaly (Fischer et al., 2007; Seneviratne et al., 2006; Seneviratne et al., 2012). Hence the probability of occurrence of such events cannot be estimated simply by extrapolating from the distribution of less extreme events that are sampled in the historical record." [J. Graham Cogley, Canada]
This is why we confined the discussion to 20 year return values rather than longer periods, say 100 years. The time dependent formalism of Kharin et al (2013) is particularly well suited to the 20 year period using either observations or the CMIP5 database. These projections are not an extrapolation beyond the available data.
12-947 12 48 19 48 20 "confidence in projection". [J. Graham Cogley, Canada] Agreed. Text changed
12-948 12 48 21 48 21 "kelvin". The name of the unit is not capitalized. [J. Graham Cogley, Canada] Agreed. Text changed
12-949 12 48 23 48 26 Are these values of 4% and 5.3% consistent across different scenarios? [European Union] Yes, text modified to reflect this.
12-950 12 48 26 48 28 This sentence would be easier to understand if you split it into two sentences. One about the global average Agreed. Text changed

Expert and Government Review Comments on the IPCC WGI AR5 Second Order Draft – Chapter 12
Do not Cite, Quote or Distribute Page 74 of 120
Comment No
Chapter
FromPage
FromLine
To Page
To Line Comment Response
and one about the regional projected changes. The combination of years and percent makes it difficult to understand in the current form. Furthermore we recommend that you use Celsius instead of Kelvin. [Government of NORWAY]
12-951 12 48 27 48 27 Delete "are" before "projected". [J. Graham Cogley, Canada] Accepted, text modified
12-952 12 48 33 Figure 12.27: units need to be corrected in the right panel -- not %, but years [Thomas Stocker/ WGI TSU, Switzerland]
Accepted, units modified.
12-953 12 48 41 The section on sea ice changes is excellent and represents a significant advance over AR4. One thing that puzzled me: why is February rather than the more usual March shown in the figures? (maybe I am betraying my Northern Hemisphere origins?) [Richard Wood, United Kingdom]
Noted. February is the month of minimum sea ice extent in the Southern Hemisphere. The decision was made to use February and September as seasonal extrema consistently for both hemispheres. The March sea ice extent in the Northern Hemisphere is not significantly different from the February one.
12-954 12 48 45 48 49 Wang and Overland (2009) and Zhang (2010) also examined each model in CMIP3 using different approchaes and confirmed that a subset of models or model ensembles project an ice-free Arctic Ocean in the sesond half of the 21st century. [Xiangdong Zhang, United States of America]
Accepted. These references have been added.
12-955 12 49 29 49 31 The statement "The too slow retreat of the summer Arctic sea ice in most CMIP3 and CMIP5 simulations may partly result from an underestimation of the sea ice sensitivity to global surface temperature (Mahlstein and Knutti, 2012)." is to definitive. Both Winton (2011) and Mahlstein &Knutti (2012) show that natural variability is a clear component of the observed sea ice 'sensitivity' (ice has declined most strongly with only modest recent increase in global temperature. We should therefore provide a caveat that the observational ice-temperature sesnitivity is uncertain due to the short time-series. [Jeff Ridley, United Kingdom]
Accepted. We now stress that, due to the shortness of the observational record, it is difficult to ascertain the relative influence of natural variability on the recent trend in September Arctic sea ice extent, which hinders the comparison between modelled and observed trends, and hence the estimate of the sensitivity of the September Arctic sea ice extent to global surface temperature change.
12-956 12 49 29 49 31 Another major influence on summer Arctic sea ice extent are wind patterns which probably should be listed here. [Thomas Stocker/ WGI TSU, Switzerland]
Taken into account. To the best of our knowledge, there is no peer-reviewed literature available on the possible impact of errors in wind patterns on the accuracy of projections of summer Arctic sea ice. However, we now stress that, due to the shortness of the observational record, it is difficult to ascertain the relative influence of natural variability on the recent trend in September Arctic sea ice extent, which hinders the comparison between modelled and observed trends, and hence the estimate of the sensitivity of the September Arctic sea ice extent to global surface temperature change.
12-957 12 49 30 49 30 “may partly result from ….”: lack of sensitivity to global mean temperatures is surely another expression of the problem, not a cause. Try “is associated with ….” [Martin Juckes, United Kingdom]
Taken into account. This paragraph has been rewritten.
12-958 12 49 40 Figure 12.30: suggest to add uncertainty to observation-based estimates [Thomas Stocker/ WGI TSU, Switzerland]
Accepted. The figure now shows the mean and ±2 standard deviations about the mean of the observed September Arctic sea ice extent over 1986–2005.
12-959 12 49 47 49 49 What "arctic sea ice study" is being referenced here? A suite, one study in particular, it is not clear in the wording of this sentence. [Government of Canada]
Accepted. "The Arctic sea ice study" has been replaced by "the Arctic sea ice" to clarify the sentence.
12-960 12 49 49 49 49 Suggest also include reference to - Hodson, D.L.R., Keeley, S.P.E., West, A., Ridley, J., Hawkins, E., Hewitt, H.T. (2012) Identifying uncertainties in Arctic climate change projections, Climate Dynamics, doi: 10.1007/s00382-012-1512-z [Jeff Ridley, United Kingdom]
Accepted. This reference has been added.
12-961 12 49 49 49 54 Linear? [David Erickson, United States of America] Accepted. "Linear" has been removed.

Expert and Government Review Comments on the IPCC WGI AR5 Second Order Draft – Chapter 12
Do not Cite, Quote or Distribute Page 75 of 120
Comment No
Chapter
FromPage
FromLine
To Page
To Line Comment Response
12-962 12 49 52 49 52 append reference to Bitz at al 2008 to: (Bitz et al., 2008; Hodson et al, 2012) - see ref in comment #4 above. [Jeff Ridley, United Kingdom]
Accepted. This reference has been added.
12-963 12 50 5 Figure 12.31: the criteria applied to subsample the CMIP5 ensemble should be mentioned explicitly and discussed in the text rather than just being referred to as "defined in Massonnet et al…." [Thomas Stocker/ WGI TSU, Switzerland]
Accepted. A description of Massonnet et al.'s (2012) performance metrics has been added.
12-964 12 50 17 Today, the optimal approach for sea ice projections is not clear, although one notes that these 18 methods should have a credible underlying physical basis in order to increase their reliability (12.50, line 17). Add: because the models CMIP3 and CMIP5 and RCP models lacks sufficient data on changes in sea ice volume. (I suggest to put this idea at this chapter.) [CELSO COPSTEIN WALDEMAR, BRAZIL]
Rejected. The comment is unclear. The Arctic sea ice volume reanalysis data of Schweiger et al. (2011) can be used to constrain sea ice projections from coupled climate models. These data are part of Massonnet et al.'s (2012) perfomance metrics which are utilised in Section 12.4.6.1 to subset models.
12-965 12 50 46 Is criteria the correct word? [David Erickson, United States of America] Taken into account. This sentence has been rephrased and the term criterion is no more used.
12-966 12 50 49 50 55 The prognosis for seasonal Arctic sea-ice extent here is considered overly conservative (distinct possibility in next half century etc.), whereas many CMIP5 models and current observations strongly suggest dates as early as 2025, likely between 2035 to 2060 with increasing likelihood of early in that range. Overall the SOD is seemingly not adequately representative of most recent obs and thinking and thus needs updating. [Government of United Kingdom of Great Britain & Northern Ireland]
Taken into account. The sentence now reads: "It is also likely that the Arctic Ocean will become nearly ice-free in September before the middle of the century for high greenhouse gas emissions such as those corresponding to RCP8.5 (medium confidence)". This statement is mostly based on an assessment of a subset of models that most closely reproduce the climatological mean state and 1979‒2012 trend of the Arctic sea ice cover (see previous paras).
12-967 12 50 52 50 53 The phrase, "…September Arctic sea ice will not survive a global warming…" may be unclear to some. This could be perceived as implying that Arctic sea ice would disappear entirely, not just that the Arctic would experience ice-free conditions in a future September. Please clarify. [Government of United States of America]
Accepted. This sentence has been deleted.
12-968 12 50 52 50 53 I'm puzzled by the statement about Arctic sea ice not surviving 2 deg warming above present. Why is the confidence high when the filtered model range is 1.9-2.5 deg C? (also feeds up into the ES). [Richard Wood, United Kingdom]
Accepted. This sentence has been deleted.
12-969 12 51 11 suggest to change "weak observed increase" to "observed weak but significant increase"; suggest to refer to the relevant Sections in Chapter 4: Cryosphere Obs. which provides the basis of the "significant" attribute. [Thomas Stocker/ WGI TSU, Switzerland]
Taken into account. This paragraph has been significantly shortened to avoid redundancy with Chapter 9 and merged with the previous paragraph. It is now stated that nearly all of the models fail to reproduce the overall increase in Antarctic sea ice areal coverage observed during the satellite era.
12-970 12 51 16 51 18 A reference here to Sen Gupta et al. (2009) - reference already in this chapter - refers to uncertainty in wind forcing on southern ocean temperature and sea ice extent. This would permit an internal reference to the Southern Ocean section 12.4.7.3. [Jeff Ridley, United Kingdom]
Taken into account. This paragraph has been significantly shortened to avoid redundancy with Chapter 9 and merged with the previous paragraph. The Sen Gupta et al. (2009) paper is now cited in the first paragraph of the section.
12-971 12 51 17 51 18 Can the concluding statement be made more explicit through the use of a confidence statement, e.g., "in view of this, there is very low confidence in projections of future changes in ......". In the ES, the projected decreases of (14-57%, and 9-29%) are given, but with no indication of the confidence in these projections. [Thomas Stocker/ WGI TSU, Switzerland]
Accepted. We now explicitly mention that there is low confidence in Antarctic sea ice projections.
12-972 12 51 20 52 18 Section 12.4.6.2: There is a discussion of snow cover over North America in section 3.d. of the paper “North American Climate in CMIP5 Experiments: Part III: Assessment of 21st Century Projections” by Maloney et al. Although the paper contains a discussion of CMIP5 results exclusively over North America, while the section 12.4.6.2 is focused on global or hemispherical results, the authors may wish to integrate Maloney et al.’s
The paper was not accepted by the AR5 deadline.

Expert and Government Review Comments on the IPCC WGI AR5 Second Order Draft – Chapter 12
Do not Cite, Quote or Distribute Page 76 of 120
Comment No
Chapter
FromPage
FromLine
To Page
To Line Comment Response
findings into the discussion. [Government of United States of America]
12-973 12 51 24 The acronym SCE is defined twice on this line. [Adrian Simmons, United Kingdom] Taken into account. Only define it once now.
12-974 12 51 36 51 41 Move this sentence to L29, before "Projections". [J. Graham Cogley, Canada] Good suggestion, thank you. We shifted the sentence to the recommended place.
12-975 12 51 36 51 41 For both projected changes in snow cover, can confidence/likelihood language be used for the concluding statements that are elevated to the ES. [Thomas Stocker/ WGI TSU, Switzerland]
Yes, we now state that it is very likely (high confidence) that spring SCE will decrease if reality follws the stronger concentration scenarios, and that there is only medium confidence in the projected SWE changes because these are subject to competing influences and geographically variable.
12-976 12 51 37 51 37 I suggest dropping the undefined acronym "MMD", which presumably stands for "multi-model database". In the captions of Figures 12.32 and 12.33 it can be replaced by "models" or "multi-model". [J. Graham Cogley, Canada]
OK.
12-977 12 51 37 51 37 Please spell out MMD - this is the first time it appears in the text, and won't be clear to the reader. [Thomas Stocker/ WGI TSU, Switzerland]
We do not use the acronym MMD in the final version.
12-978 12 51 39 51 39 Define SCA in text (or is it the same as SCE?) If so, SCA should be changed to SCE in caption for Fig. 12.32. [Government of Canada]
Should have been SCE. Thank you
12-979 12 51 44 Figure 12.32: why do the projections stop already in year ~2092 in this particular figure? This is very different to, e.g., Figure 12.33 which seems to extend to 2099. Please clarify (and change, if possible) [Thomas Stocker/ WGI TSU, Switzerland]
Indeed, the figure curve should have ended in 2098 because there is a 5 year running average applied to the data. The figure redrawn from the frozen CMIP5 archive is based on files that end in 2098 (using the same 5yr running average filter).
12-980 12 51 51 51 54 Avoid using the term near-surface permafrost and refer only to increasing thaw depth which is really what is being calculated in these studies. Near-surface permafrost is not defined, i.e. what depth is being referred to? This is misleading terminology often interpreted as complete loss of permafrost. Normally the models on which these statements are based are considering thawing in the upper 2-3 m of the ground and are therefore considering an increase in thaw depth over time. [Sharon Smith, Canada]
The term is now clearly properly defined in the glossary to avoid misunderstandings. (see reply to comment 12-213)
12-981 12 51 53 51 54 Change "that a substantial amount of" to "substantial", and delete "will occur". [J. Graham Cogley, Canada] Thank you. We reworded the sentence accordingly.
12-982 12 51 56 51 56 It is a bit contradictory to state that thawing of deeper permafrost is less relevant as a component of the climate system and then in a later section (12.5.5.5) comment on the release of methane from gas hydrates due to ground warming (which links to permafrost warming and thawing) which in terrestrial environments are usually found at depths below 200m. The authors seem to be only considering impacts on soil carbon in making the statement in line 51. Changes in permafrost conditions at depth are important from a climate perspective as there can be important changes in subsurface hydrology which will influence surface hydrology including drainage of lakes due to talik formation, increasing winter base flow etc. Given that the hydrological cycle is an important component of the climate system then changes in permafrost conditions at depth need to be considered from a climate perspective. [Sharon Smith, Canada]
Section 12.5.5 explicitly states that at least over the 21st century the clathrate feedback is estimated to be small (albeit not necessarily completely insignificant). Here we refer to "very deep" permafrost, typically relict permafrost. The near-surface permafrost we talk about in the preceding paragraphs is the permafrost at depths that can be significantly affected by anthropogenic climate change over the 21st century and thus comprises what the reviewer considers as depths that still influence surface hydrology. We clarified this point by rewording the sentence.
12-983 12 51 57 52 1 It would be useful to qualify this sentence, to the effect that the CMIP5 models as an ensemble show wide disagreement in their calculation of current permafrost distributions due to differences in the land model physics (or cross reference to elsewhere in the report, like Chapter 9). [Government of United States of America]
OK, this is now stated and we refer to the Koven et al. paper (which had been cited before).
12-984 12 52 4 52 10 The frost index approach of Nelson and Outcault (1987) is an equilibrium rather than transient model. The permafrost distribution that is predicted will not occur during the period over which the simulation is run, i.e. it does not represent the conditions for 2080-2099. If this is the type of approach being utilized, the authors need
See reply to comments #980 and 213.
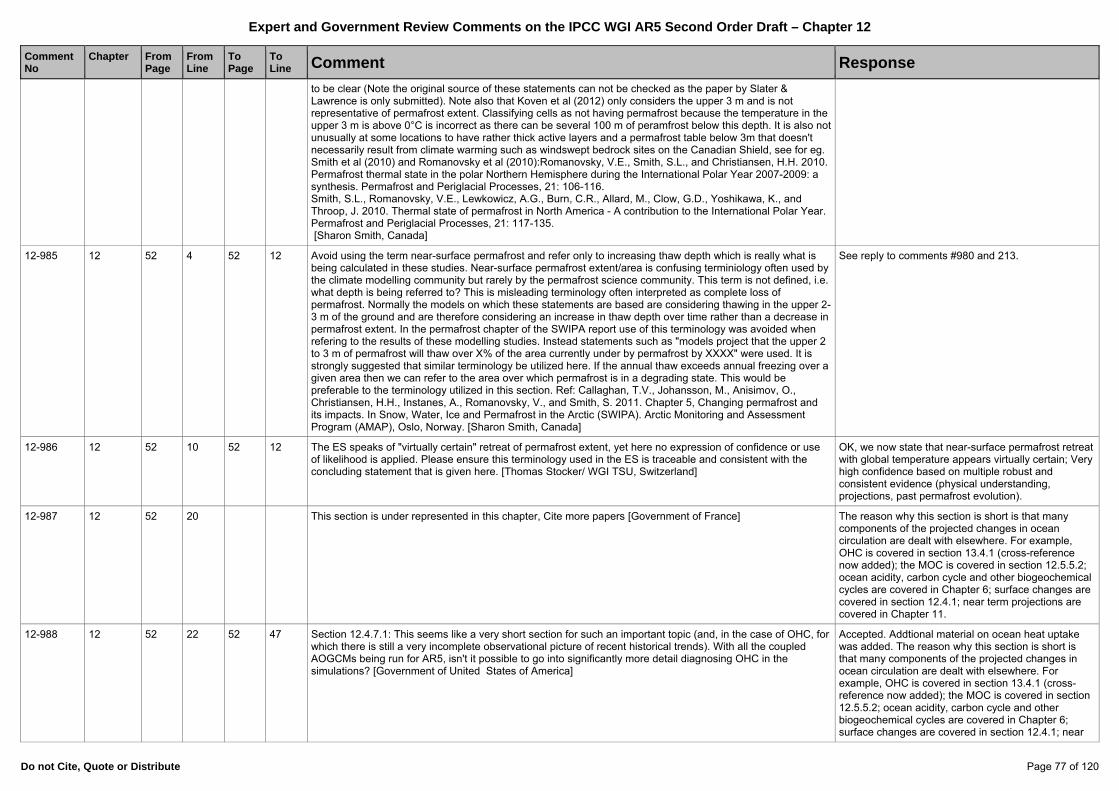
Expert and Government Review Comments on the IPCC WGI AR5 Second Order Draft – Chapter 12
Do not Cite, Quote or Distribute Page 77 of 120
Comment No
Chapter
FromPage
FromLine
To Page
To Line Comment Response
to be clear (Note the original source of these statements can not be checked as the paper by Slater & Lawrence is only submitted). Note also that Koven et al (2012) only considers the upper 3 m and is not representative of permafrost extent. Classifying cells as not having permafrost because the temperature in the upper 3 m is above 0°C is incorrect as there can be several 100 m of peramfrost below this depth. It is also not unusually at some locations to have rather thick active layers and a permafrost table below 3m that doesn't necessarily result from climate warming such as windswept bedrock sites on the Canadian Shield, see for eg. Smith et al (2010) and Romanovsky et al (2010):Romanovsky, V.E., Smith, S.L., and Christiansen, H.H. 2010. Permafrost thermal state in the polar Northern Hemisphere during the International Polar Year 2007-2009: a synthesis. Permafrost and Periglacial Processes, 21: 106-116. Smith, S.L., Romanovsky, V.E., Lewkowicz, A.G., Burn, C.R., Allard, M., Clow, G.D., Yoshikawa, K., and Throop, J. 2010. Thermal state of permafrost in North America - A contribution to the International Polar Year. Permafrost and Periglacial Processes, 21: 117-135. [Sharon Smith, Canada]
12-985 12 52 4 52 12 Avoid using the term near-surface permafrost and refer only to increasing thaw depth which is really what is being calculated in these studies. Near-surface permafrost extent/area is confusing terminiology often used by the climate modelling community but rarely by the permafrost science community. This term is not defined, i.e. what depth is being referred to? This is misleading terminology often interpreted as complete loss of permafrost. Normally the models on which these statements are based are considering thawing in the upper 2-3 m of the ground and are therefore considering an increase in thaw depth over time rather than a decrease in permafrost extent. In the permafrost chapter of the SWIPA report use of this terminology was avoided when refering to the results of these modelling studies. Instead statements such as "models project that the upper 2 to 3 m of permafrost will thaw over X% of the area currently under by permafrost by XXXX" were used. It is strongly suggested that similar terminology be utilized here. If the annual thaw exceeds annual freezing over a given area then we can refer to the area over which permafrost is in a degrading state. This would be preferable to the terminology utilized in this section. Ref: Callaghan, T.V., Johansson, M., Anisimov, O., Christiansen, H.H., Instanes, A., Romanovsky, V., and Smith, S. 2011. Chapter 5, Changing permafrost and its impacts. In Snow, Water, Ice and Permafrost in the Arctic (SWIPA). Arctic Monitoring and Assessment Program (AMAP), Oslo, Norway. [Sharon Smith, Canada]
See reply to comments #980 and 213.
12-986 12 52 10 52 12 The ES speaks of "virtually certain" retreat of permafrost extent, yet here no expression of confidence or use of likelihood is applied. Please ensure this terminology used in the ES is traceable and consistent with the concluding statement that is given here. [Thomas Stocker/ WGI TSU, Switzerland]
OK, we now state that near-surface permafrost retreat with global temperature appears virtually certain; Very high confidence based on multiple robust and consistent evidence (physical understanding, projections, past permafrost evolution).
12-987 12 52 20 This section is under represented in this chapter, Cite more papers [Government of France] The reason why this section is short is that many components of the projected changes in ocean circulation are dealt with elsewhere. For example, OHC is covered in section 13.4.1 (cross-reference now added); the MOC is covered in section 12.5.5.2; ocean acidity, carbon cycle and other biogeochemical cycles are covered in Chapter 6; surface changes are covered in section 12.4.1; near term projections are covered in Chapter 11.
12-988 12 52 22 52 47 Section 12.4.7.1: This seems like a very short section for such an important topic (and, in the case of OHC, for which there is still a very incomplete observational picture of recent historical trends). With all the coupled AOGCMs being run for AR5, isn't it possible to go into significantly more detail diagnosing OHC in the simulations? [Government of United States of America]
Accepted. Addtional material on ocean heat uptake was added. The reason why this section is short is that many components of the projected changes in ocean circulation are dealt with elsewhere. For example, OHC is covered in section 13.4.1 (cross-reference now added); the MOC is covered in section 12.5.5.2; ocean acidity, carbon cycle and other biogeochemical cycles are covered in Chapter 6; surface changes are covered in section 12.4.1; near

Expert and Government Review Comments on the IPCC WGI AR5 Second Order Draft – Chapter 12
Do not Cite, Quote or Distribute Page 78 of 120
Comment No
Chapter
FromPage
FromLine
To Page
To Line Comment Response
term projections are covered in Chapter 11.
12-989 12 52 24 52 32 Why is the upper ocean heat content discussed so sparsely here? [European Union] This is discussed more extensively in Section 13.4.1 (cross reference now added).
12-990 12 52 24 "relatively insensitive" -- what does this mean, could this be supported by quantitative results? [Thomas Stocker/ WGI TSU, Switzerland]
This is discussed more extensively in Section 12.4.1.1 (cross reference now added).
12-991 12 52 25 52 37 This whole part of Section 12.4.7.1 is all about observed changes, but these are thoroughly being assessed in Chapter 3. In contrast, this section should focus on the projected changes. Please refocus the section accordingly. [Thomas Stocker/ WGI TSU, Switzerland]
Secion 12.4.7.1 is now better cross-referenced to other sections where the projected results are discussed. We needed to include a brief framing in this section that touches upon the observed change.
12-992 12 52 25 "However, projected outcomes diverge as the 21st century progresses" -- suggest to elevate this to the general assessment of 21st century projections with the RCPs as this is not specific to ocean changes. [Thomas Stocker/ WGI TSU, Switzerland]
This result will be also be included in section 12.4.1.1
12-993 12 52 26 52 29 Is this ocean heat content change for the entire water comlumn or for e.g. the upper 700 m? Please specify. [Stephanie Downes, Australia]
It is the upper 700m (now specified)
12-994 12 52 29 52 29 Please refer also to the energy box in ch13. [Jonathan Gregory, United Kingdom] Accepted
12-995 12 52 31 52 32 The Mediterranean Sea is another area where subsurface warming is projected. Numerous papers should be cited [Government of France]
Rejected. Regional changes are covered in Chapter 14. In particuylar, Mediterranean changes are covered in Section 14.7.6
12-996 12 52 34 52 40 It would be fair to cite Durack et al., 2012 (Science) and Pierce et al., 2012 (Geophys Res Lett) here [Paul Durack, United States]
Durack et al. (2012) cited. Pierce et al (2012) is a detection and attribution study relevant to Chapter 13.
12-997 12 52 36 52 36 I suggest not putting "striking" in quotation marks. It is not clear what you mean by this punctuation. [Jonathan Gregory, United Kingdom]
Accepted
12-998 12 52 39 52 40 The salinity increase trend is also forseen for the Mediterranean (Somot et al. 2006, Duboois 2009 [Government of France]
Rejected. Regional changes are covered in Chapter 14. In particuylar, Mediterranean changes are covered in Section 14.7.6
12-999 12 52 39 Is the freshening due to increased river flow? [David Erickson, United States of America] No. It is associated with an intensification of the global water cycle (now mentioned)
12-1000 12 52 49 53 9 I think Section 12.4.7.2 needs reworking, and consistency checks needs to be made between this and section 12.5.5.2. Only a tiny number of models are shown in Fig 12.35, although there is far more data available (e.g. In the Weaver et al 2012 paper). There is other data now available that wasn't in Weaver et al 2012, which widens the envelope of MOC changes further. See some more detailed comments below. [Richard Wood, United Kingdom]
Accepted. All available model are shown, and the sections are consistent.
12-1001 12 52 51 52 58 Is GFDL CM2.1 going to be shown in figure 12.35? If not, this should be specifically mentioned here. And the statement possibly move towards the end of the paragraph, as the preceding and subsequent paragraphs describe figure 12.35. [European Union]
All available model results are shown.
12-1002 12 52 51 53 10 It seems that the description of the AMOC changes is too brief. The influence of the AMOC change to the climate is not discussed. A recent paper of Hu et al. (J. Climate, Influence of continental ice retreat on future global climate) could be a good reference. [Aixue Hu, United States of America]
Rejected: Hu et al and a more extensive discussion are inluded in section 12.5.5.2
12-1003 12 52 55 52 56 This seems like a technical detail that is not really policy-relevant. [Jouni Räisänen, Finland] Rejected. Its important to point out that changes depend on the coordinate system used
12-1004 12 52 56 52 57 There is at least one model in Weaver et al 2012 where the MOC doesn't recover by 2300. the same is true for HadGEM2-ES under RCP8.5 continuation, which wasn't discussed in Weaver et al. I should be able to provide that timeseries on request. I also heard (though I haven't seen the plot) that the FIO_ESM has an MOC collapse in its RCP runs, interestingly most marked at RCP2.6. This is only hearsay but as it's very different
Rejected. We only assess published results and those model results submitted to the CMIP5 data base. It is not appropriate to include results that represnet heresay. Also, the long term change in MOC

Expert and Government Review Comments on the IPCC WGI AR5 Second Order Draft – Chapter 12
Do not Cite, Quote or Distribute Page 79 of 120
Comment No
Chapter
FromPage
FromLine
To Page
To Line Comment Response
behaviour I think it would be worth checking. [Richard Wood, United Kingdom] behaviour is discussed in section 12.5.5.2
12-1005 12 53 3 53 3 Gregory et al (2005) also reported that models with a stronger AMOC in their control run exhibited a larger weakening. Gregory and Tailleux (2011) 10.1007/s00382-010-0847-6 found a similar relationship, with more models, in CMIP3, and tentatively offered an explanation for it. [Jonathan Gregory, United Kingdom]
Accepted. Citations added.
12-1006 12 53 5 53 9 this figure should include the 26N RAPID/MOCHA observations shown in Figure 3.11b as an indication of the confidence that can be placed in the models - note that many of them get the mean AMOC incorrect and this need to be clearly shown [Meric Srokosz, United Kingdom of Great Britain & Northern Ireland]
Rejected. This chapter does not do model evaluation, but the observations are included in the corresponding figure of the technical summary.
12-1007 12 53 6 Figure 12.35: suggest to add the numbers of models used in all 4 panels; please clarify what the "first member (r1i1p1)" is referring to -- it's unclear. [Thomas Stocker/ WGI TSU, Switzerland]
Accepted.
12-1008 12 53 13 54 16 While it is certainly important to also mention the (relation to the) CMIP3 results, the subsection should start with the CMIP5 results. [European Union]
Rejected. We consider that it is important to first set the status derived from the CMIP3 simulations as many analyses available up to now are based on those simulations.
12-1009 12 53 25 53 25 Replace "warm" by "cold". Upwelling events always bring saltier, warmer waters from the deep [Guillermo Auad, United States of America]
Taken into account. At those latitudes, surface waters are colder than deep waters. Thus, the upwelling transports relatively warm water from the ocean's intermediate depths towards the surface. The wording was correct (see, e.g., Sen Gupta et al., 2009), but we have replaced 'warm' by 'relatively warm' to be more precise.
12-1010 12 53 25 Colder not warmer? [David Erickson, United States of America] Taken into account. At those latitudes, surface waters are colder than deep waters. Thus, the upwelling transports relatively warm water from the ocean's intermediate depths towards the surface. The wording was correct (see, e.g., Sen Gupta et al., 2009), but we have replaced 'warm' by 'relatively warm' to be more precise.
12-1011 12 53 33 53 33 There would be much more to say about this very important aspect of the modeling approach (laminar, i.e., no eddy resolving). The impact of eddies, if there would be present, will not only affect the ACC response as noted in the report but a number of other key climatic components. This is relevant given the length of many of the simulations. For instance in a series of 5 or 6 paper Wolfe and Cessi address a number of issues impacted by the presence of eddies (they performed long term simulations using an eddy resolving model). The size (hence the mass and heat transports) of the NADW and the ABW are significantly affected by mesoscale activity resolved by their model. The vertical heat transport is another factor sensitive to the presence of eddies in their simulations. For instance, see Wolfe & Cessi (2009), JPO , DOI: 10.1175/2008JPO3991.1 [Guillermo Auad, United States of America]
Taken into account. The chapter addresses future changes, not the impact of eddies on the current mean state, but a brief discussion of this aspect has been added.
12-1012 12 53 46 53 47 "mid-range increase in GHGs" - can you be more precise? [Richard Wood, United Kingdom] Accepted. The scenario (SRES A1B) is now mentioned.
12-1013 12 53 47 53 51 Suggest check consistency with Ch 13 [Richard Wood, United Kingdom] Taken into account. The wording and focus are slightly different, but this para is consistent with Chapter 13, Section 13.4.4.2, page 13-38, lines 17-25 of the SOD. A reference to this section has been added and the para has been partly rephrased.
12-1014 12 53 49 53 49 Section 12.4.7.2. It might be helpful to begin this section with a sentence or two reminding the reader of the climatic significance of the AMOC. Woollings et al (2012) 10.1038/NGEO1438 illustrate its effect on surface temperature change from CMIP3 models, using regression against AMOC index, and comparison of AOGCMs and slab models. Smith and Gregory (2009) 10.1029/2009GL038607 show in one AOGCM forced by freshwater fluxes in various locations that the cooling in the N Atlantic is proportional to the AMOC weakening,
Noted but Rejected. Space limitation preclude further discussions. In addition, most of the AMOC discussion is in section (12.5.5.2)

Expert and Government Review Comments on the IPCC WGI AR5 Second Order Draft – Chapter 12
Do not Cite, Quote or Distribute Page 80 of 120
Comment No
Chapter
FromPage
FromLine
To Page
To Line Comment Response
with a relationship similar to that found by Stouffer et al (2006) in the models of the CMIP coordinated THC experiment. Please excuse my self-citation; I am sure there are plenty of other papers that could also be used! [Jonathan Gregory, United Kingdom]
12-1015 12 53 53 54 9 This paragraph misses a key advance in the CMIP5 output for the Southern Ocean meridonal overturning circulation: the circulation output is separated into the Eulerian mean and the eddy-induced overturning. This is very important given that the mesoscale circulation plays a key role in compensating for the changes in the mean overturning under wind/climate forcing. Granted, only a hadful of models have actually outputted these important variables, but the overturning in the Southern Ocean has been assessed by Downes and Hogg (2012; submitted). Perhaps add the following sentence to page 54 from the end of line 6: "Some of the CMIP5 models have outputted the Eulerian mean and eddy induced meridional overturning circulation, providing a quantitative estimate of the role of the mesoscale circulation under climate forcing. Downes and Hogg (2012) find that the Southern Ocean upper Eulerian and eddy overturning cells are currently driven by the position of the overlying westerlies and by surface heat and freshwater (buoyancy) fluxes in the CMIP5 models, and the lower cells by buoyancy fluxes. However, under RCP8.5 forcing, the upper and deep overturning regimes become primarily driven by warming and freshening, and not by wind stress changes." REFERENCE: S. M. Downes and A. McC. Hogg (2012). "Saturation and compensation: Southern Ocean circulation in CMIP5 models". In revision for Journal of Climate. Submitted July 2012. [Stephanie Downes, Australia]
Taken into account. A reference to the work of Downes and Hogg (2012) is now included.
12-1016 12 53 54 53 54 Ridley et al. (2012b) has been rejected and although will be resubmitted reference it it here must be deleted. [Jeff Ridley, United Kingdom]
Accepted. The sentence referring to the work of Ridley et al. (2012b) has been deleted.
12-1017 12 53 A more relevant citation for this method, testing it using cmip5 data is: Good et al, 2012: Abrupt CO2 experiments as tools for predicting and understanding CMIP5 representative concentration pathway projections. Climate Dynamics 2012, DOI: 10.1007/s00382-012-1410-4 [Peter Good, United Kingdom]
Rejected. The comment is unclear (lines to which it refers are missing)
12-1018 12 54 14 Moderates the surface warming? [David Erickson, United States of America] Accepted. Sentence rephrased.
12-1019 12 54 18 55 44 I found it a bit confusing to have direct feedbacks on CO2 discussed here, while feedbacks on CH4 (which ends up as CO2) are in Chapter 6. I was left with an incomplete picture of how big overall feedbacks on atmospheric CO2 are going to be. I understand that the CH4 processes are not included in most ESMs, but given that there are offline estimates of the numbers I strongly suggest that you include an assessment of their impact here, based on the information in Ch 6 [Richard Wood, United Kingdom]
Noted. This is the current state of the art of ESM modelling. No one of the CMIP5 ESM accounted for interactive methane emissions and estimate of their feedback on the climate system. Estimates of methane released from wetlands as given in chapter 6 are not directly transferable in additional warming. First these are for IS92a, SRES or idealised experiments, not for the RCPs. Second, there are several steps from CH4 emissions to climate response, requesting knowledge on the change in atmospheric physics and chemistry. We cannot provide robust and consistentclimate impact of future changes in CH4 emissions from wetlands.
12-1020 12 54 23 54 25 but not with other cycles such as N or P. This is still a serious short-come since an integrated view is needed, specifically of CN interactions (see e.g. Gruber and Galloway 2008 An earth system perspective of the global nitrogen cycle, Nature 451, 293-296) to understand biosphere feedbacks to climate change [European Union]
This isn't completely true anymore. Two Esms (CESM and NorESM) account for a terestrial nitrogen cycle, coupled to the terrestrial carbon cycle.The ranges given here hence account for models with and models without terrestrial nitrogen cycle. Also note that most of the ocean biogeochemistry models do take into account the nitrogen cycle.
12-1021 12 54 26 54 26 they start to respond, but if this respond is logical in view of neglecting other nutrient cycles still needs to be proven [European Union]
See response above
12-1022 12 54 28 54 30 It is stated at the start of Chp 11 that projections of atmospheric composition, chemistry, and air quality through to 2100 are given in that chapter. Since this is relevant to longer term projections described in Chp 12, is the link back to chapter 11 for these pollutants made? [European Union]
Accepted, text modified

Expert and Government Review Comments on the IPCC WGI AR5 Second Order Draft – Chapter 12
Do not Cite, Quote or Distribute Page 81 of 120
Comment No
Chapter
FromPage
FromLine
To Page
To Line Comment Response
12-1023 12 54 34 54 35 Ch.6 has a box describing emissions-driven and concentration-driven simulations. You could refer to that from here. Or it could become a cross-chapter box? [Chris Jones, United Kingdom of Great Britain & Northern Ireland]
Accepted, text modified
12-1024 12 54 35 54 36 If the abbrevations "C-driven" and "E-driven" are to be used, it would be better to introduce them earlier in the chapter, where the experimental design is described (sect 12.3.2.1 for example), and then use them consistently throughout the chapter. [Jonathan Gregory, United Kingdom]
Abbreviations removed
12-1025 12 54 41 54 42 Since the radiation sees the concentrations and not the emission, this should not be unexpected. [David Erickson, United States of America]
Accepted.
12-1026 12 54 45 54 48 Comparison of IAM's emission and compatible emission from MIROC-ESM is also shown in Hajima et al., (2012)*, showing systematic discrepancies between these two models likely due to the different strength of climate / carbon cycle feedbacks. You can add this reference as one example of comparing IAMs/ESMs emission, as needed. * Hajima et al., (2012), "Climate Change, Allowable Emission, and Earth System Response to Representative Concentration Pathway Scenarios", J. Meteor. Soc. Japan 90(3), 417–434. [Tomohiro Hajima, Japan]
MIROC-ESL is included now
12-1027 12 54 50 54 52 how important is it to list the model names as part of the main text? Could this be placed in a footnote or could simply be referred to Figure 12.1? Perhaps the ESMs could somehow be identified in Table 12.1? Or a reference could be added to the AOGCMs/ESMs overview table in Chapter 9, Table 9.1? [Thomas Stocker/ WGI TSU, Switzerland]
Done, list of models removed
12-1028 12 54 50 55 6 Seven models are not sufficient to conclude that CMIP5 E-driven simulations show larger CO2 concentration than the corresponding C-driven simulations. If the results from larger number of ESMs are included, the warming would scatter around C-driven RCP8.5 (941 ppm) as infered from the large scatter in CO2 response shown in Chapter 6 (Figure 6.20). It is recommended that the result from MRI-ESM1 (approx. 800 ppm in 2100) is included at least in Figure 12.36 with modification for associated description. Although MRI-ESM1 reported only for E-driven simulations, the results from MRI-CGCM3 is equivalent to C-driven simulation of MRI-ESM1, because MRI-CGCM3 is substantially an alias of MRI-ESM1, just distinguishing C-driven and E-driven simulations. (It is noted, however, MRI-CGCM3 did not report data concerning the carbon cycle that is switched off due to the limitation of computer resources.) [Seiji Yukimoto, Japan]
Eleven models are included now. Results from MRI reported now
12-1029 12 54 50 GFDL-ESM2 - M or G? [Ronald Stouffer, United States of America] GFDL-ESM2G
12-1030 12 54 54 54 54 typo: should read "than" not "that" [European Union] Accepted, text modified
12-1031 12 54 55 54 55 Is the +/- range the intermodel standard deviation or something else? [Jouni Räisänen, Finland] Both 1sigma and full range are given now
12-1032 12 55 8 55 12 State that the scenario is RCP8.5? [European Union] Accepted, text modified
12-1033 12 55 8 55 14 This is an important section regarding the differences between emissions and concentration driven RCP runs. Could it be made clearer that the higher upper temperature projections are linked to the higher CO2 concentrations in the E-driven runs, if this indeed so. [European Union]
Accepted, text modified
12-1034 12 55 8 55 14 Including the result from MRI-ESM1 will slightly change the warming values. The E-driven RCP8.5 simulation with MRI-ESM1 exhibits reduced warming of -0.4°C (-11%) compared to the corresponding C-driven RCP8.5. [Seiji Yukimoto, Japan]
Results from MRI reported now
12-1035 12 55 8 Add "concentration" after "CO2". [Ronald Stouffer, United States of America] Accepted, text modified
12-1036 12 55 17 Figure 12.36: it would be very useful to allow direct comparison of the ranges from CMIP5 and simple climate model results in panels a/b and c/d; suggest to consistently refer to MAGICC6 as a simple climate model to clearly separate it from the GCMs; Please clarify the default from the IAMs (?) RCP pathways. [Thomas Stocker/ WGI TSU, Switzerland]
Accepted, text modified
12-1037 12 55 23 55 24 Gregory et al (2009) 10.1175/2009JCLI2949.1 make such a comparison by expressing C-cycle feedbacks in the same units as physical feedbacks (W m-2 K-1). They conclude that the net C-cycle feedback is of similar
Accepted. Reference to Gregory et al. (2009) added

Expert and Government Review Comments on the IPCC WGI AR5 Second Order Draft – Chapter 12
Do not Cite, Quote or Distribute Page 82 of 120
Comment No
Chapter
FromPage
FromLine
To Page
To Line Comment Response
magnitude and uncertainty to the net physical feedback in CMIP3/C4MIP models. They also find that the concentration-carbon feedback is four times larger in magnitude than the climate-carbon feedback, and more uncertain. [Jonathan Gregory, United Kingdom]
12-1038 12 55 23 55 33 suggest to include results from EMICs in this discussion about the relative contribution from carbon cycle processes vs climate sensitivity, see e.g., Chapter 10 AR4 [Thomas Stocker/ WGI TSU, Switzerland]
EMICs have not performed CO2 emission driven simulations, or systematic uncertanty analysis arising from climate vs. carbon cycle.
12-1039 12 55 32 55 32 How do you define the "range of business as usual concentrations"? Which scenarios are included? [Jouni Räisänen, Finland]
Sentence has been rephrased
12-1040 12 55 37 55 42 Access to model projections and information about consequent impacts for a number of different emissions scenarios can also assist policymakers consider the risks associated with different emissions pathways as input for decisions about desirable emissions targets. You may like to consider adding this concept to this paragraph. [David Wratt, New Zealand]
Within CMIP5, simulations driven by CO2 emissions were only performed for the RCP85 scenarios. However, climate projections showed for the 4 RCP scenarios in this chapter are following4 prescribed CO2 concetration trajectories, implying 4 distinctive emissions pathwqays as developped by the IAMs. See also chapter 6 for a discussion on RCPs compatible emissions.
12-1041 12 55 46 56 25 Section 12.4.8.2: I would like to bring to your attention the paper by Port et al. in which the effect of vegetation dynamics, including the ecophysilogical effect of enhanced atmospheric CO2 concentration, on potential climate change in the RCP 8.5 scenario is discussed. Port, U., Brovkin, V., Claussen, M., 2012: The influence of vegetation dynamics on anthropogenic climate change. Earth System Dynamics, accepted. [Martin Claussen, Germany]
Refereence to this papers and other similar papers is made now
12-1042 12 55 46 56 33 Section 12.4.8.2: We feel that the issue of the impact of land surface changes seems to have. The authors should consider expanding the discussion of this topic. For example, more discussion of the results from the CMIP5 ESMs. [Government of United States of America]
Accepted, text modified
12-1043 12 55 48 55 48 remove "being" [Manoj Joshi, United Kingdom of Great Britain & Northern Ireland] Accepted, text modified
12-1044 12 55 51 55 52 How likely is the risk of a tropical forest decline under future climate conditions? Specifically in view that precipitation projections have a rather low confidence limit and in view of the fact that at present we see encroaching of tropical forests in savannah regions? In fact, there is worldwide increasing evidence that tropical forests are encroaching over savannahs as it has been demonstrated by botanical observations and analyses of both aerial and satellite imagery (Mitchard, et al., 2009) and cave sediments (Wurster et al., 2010). This phenomena, closely related to that of woody thickening, is proving to be regionally substantial and globally significant (Pacala et al., 2001; Barger et al, 2011), and has the potential to significantly affect biogeochemical cycles (McCulley et al., 2004). Instead of only relying model predictions a screening of existing literature may be helpful here. Mitchard, E. T. A., Saatchi, S. S., Gerard, F. F., Lewis, S. L., and Meir, P. (2009) Measuring Woody Encroachment along a Forest–Savannah Boundary in Central Africa, Earth Interact 13, 1–29.Wurster, C. M., Bird, M. I., Bull, I. D., Creed, F., Bryant, C., Dungait, J. A. J., and Paz, V. (2010) Forest contraction in north equatorial Southeast Asia during the Last Glacial Period, P Natl Acad Sci Usa 107, 15508–15511. Pacala, S. W. S., Hurtt, G. C. G., Baker, D. D., Peylin, P. P., Houghton, R. A. R., Birdsey, R. A. R., Heath, L. L., Sundquist, E. T. E., Stallard, R. F. R., Ciais, P. P., Moorcroft, P. P., Caspersen, J. P. J., Shevliakova, E. E., Moore, B. B., Kohlmaier, G. G., Holland, E. E., Gloor, M. M., Harmon, M. E. M., Fan, S. M. S., Sarmiento, J. L. J., Goodale, C. L. C., Schimel, D. D., and Field, C. B. C. (2001) Consistent land- and atmosphere-based U.S. carbon sink estimates., Science 292, 2316–2320. Barger, N. N., Archer, S. R., Campbell, J. L., Huang, C.-Y., Morton, J. A., and Knapp, A. K. (2011) Woody plant proliferation in North American drylands: A synthesis of impacts on ecosystem carbon balance, J Geophys Res-Biogeo 116 [European Union]
The discussion on tropical forest has been expanded. We also refer to section 12.5.5.6 we Amazon forest vulnerability is further discussed in the context of Abrupt changes and irreversibility.
12-1045 12 56 1 Changes. [David Erickson, United States of America] Accepted, text modified
12-1046 12 56 9 55 9 What does LUCID stand for? [John Caesar, United Kingdom of Great Britain & Northern Ireland] Clarified
12-1047 12 56 9 55 9 What is the LUCID acronym? [European Union] Clarified

Expert and Government Review Comments on the IPCC WGI AR5 Second Order Draft – Chapter 12
Do not Cite, Quote or Distribute Page 83 of 120
Comment No
Chapter
FromPage
FromLine
To Page
To Line Comment Response
12-1048 12 56 9 56 9 Is LUCID defined anywhere- (does it need to be here?) [Manoj Joshi, United Kingdom of Great Britain & Northern Ireland]
Clarified
12-1049 12 56 9 56 25 LUCID-CMIP5 didn't run the 4.5 or 6.0 scenarios, but you could mention here that their land-use changes are, globally, of opposite sign (reducing land-use area) and so their climatic impact could be expected to be very different. [Chris Jones, United Kingdom of Great Britain & Northern Ireland]
Accepted, text modified
12-1050 12 56 14 56 14 Why was this not harmonized. As a consequence results can hardly be compared [European Union] As for all CMIP5 simulations accounting for land use changes, the transition matrix between primary forest, secondary forest, crops or pasture was provided to modelling groups. The exact implementation of that information within the models was left to each group, leading to some differences in the actual land cover map between the models. In particular, no information was given, as not available, for natural vegetation.
12-1051 12 56 17 56 21 The changes in MIROC and HadGEM2-ES appear to be very different, and opposite in sign in some places. This places a question mark against the robustness of model responses to land-use changes, which should be mentioned in this paragraph [Manoj Joshi, United Kingdom of Great Britain & Northern Ireland]
Accepted.
12-1052 12 56 19 How can albedo, energy and heat fluxes be "small" when land use is occurring? [David Erickson, United States of America]
Simply because the land cover change is small, as explained in the following sentence
12-1053 12 56 23 56 24 More interesting would be to read something about the consequences for the C cycle, if N2O emissions are increased too (likely) and if this has consequences for regional BVOC source strength (also likely if short coppices are used). I do not see the benefit to include such incomplete studies in the report [European Union]
N2O emissions were not included in any CMIP5 ESMs but a short discussion has been added regarding to N2O emissions and biofuels.
12-1054 12 56 28 Figure 12.38: reference period is not indicated in the caption -- please add; the caption indicates a end of the 21st century 30-year period from 2071-2100 being used here, while in all (most) other instances in this Chapter the end of the 21st century is averaged from 2081-2100. It would be very good to have a uniform period being applied; Temperature Axis should say "Change in". [Thomas Stocker/ WGI TSU, Switzerland]
This is addressed within the extremes sections.
12-1055 12 56 35 58 7 Since this is all about global temperature change, maybe it could be moved to 12.4.1 (perhaps with a further level of subsection). At this point, it feels like we are returning to a subject already discussed. [Jonathan Gregory, United Kingdom]
We chose to isolate the comparison in a special section because of the complexities that affect it, stemming from the differences beteen the CMIP3 and CMIP5 ensembles and scenarios. Also, renumbering of the sections at this point would cause great challenge to intra- and inter-chapter cross-references.
12-1056 12 56 35 Section 12.4.9: It might not be relevant for the discussion and methodologies used in this section, but note that Sillmann et al. 2012 (model evaluation) found that the spread of CMIP5 models simulating extreme temperatures has decreased compared to the CMIP3 ensemble, even though there are more CMIP5 models considered in this study than CMIP3 models. Also the CMIP5 ensemble seems to simulate greater magnitudes of precipitation extremes and less consecutive wet days compared to the CMIP3 ensemble under present climate conditions. This could also be reflected in the future projections of the model ensembles where the B1 scenario shows a smaller increase in max. 5-day precipitation over the 21st century than the RCP4.5 with comparable forcing (see figure 12.26). [Jana Sillmann, Canada]
This is addressed within the extremes sections.
12-1057 12 56 35 Section 12.4.9: this comparison of the CMIP3/CMIP5 and SRES/RCP is very useful. However it does not refer back to those figures earlier in the Chapter (on T/P extremes, Figures 12.13 and 12.26) that did already include such a comparison, but which was not elaborated on in the Chapter. We suggest to take advantage of these figures and also consider assessing consistency in these indices of weather and climate extremes. [Thomas Stocker/ WGI TSU, Switzerland]
We have now referred explicitly to the extremes sections and figures at the end of this section.
12-1058 12 56 42 The reference period is given as 1980-1999 as this was the standard reference period used in the AR4. However, Figures 12.13 and 12.26 used the 1981-2000 reference period indicated to be the CMIP3 standard reference in the caption of Figure 12.13. Would it be possible to use the AR4 standard for all CMIP3 related results? [Thomas Stocker/ WGI TSU, Switzerland]
Referred to Extremes sections.
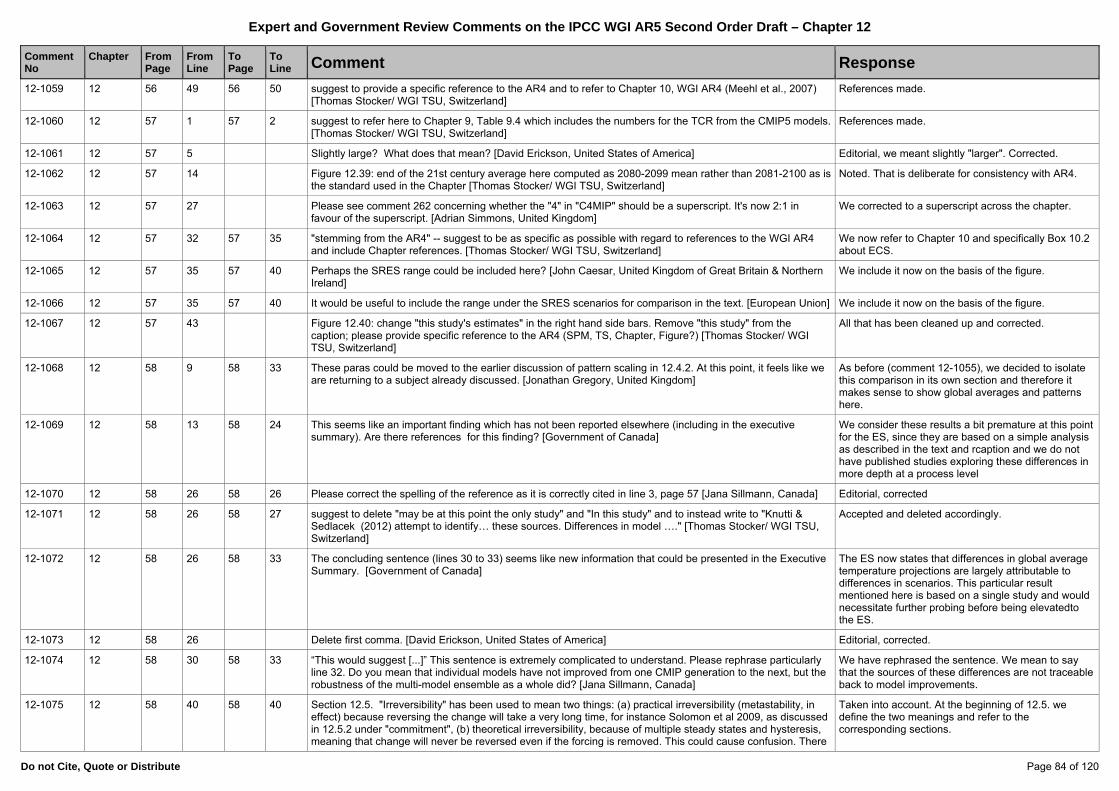
Expert and Government Review Comments on the IPCC WGI AR5 Second Order Draft – Chapter 12
Do not Cite, Quote or Distribute Page 84 of 120
Comment No
Chapter
FromPage
FromLine
To Page
To Line Comment Response
12-1059 12 56 49 56 50 suggest to provide a specific reference to the AR4 and to refer to Chapter 10, WGI AR4 (Meehl et al., 2007) [Thomas Stocker/ WGI TSU, Switzerland]
References made.
12-1060 12 57 1 57 2 suggest to refer here to Chapter 9, Table 9.4 which includes the numbers for the TCR from the CMIP5 models. [Thomas Stocker/ WGI TSU, Switzerland]
References made.
12-1061 12 57 5 Slightly large? What does that mean? [David Erickson, United States of America] Editorial, we meant slightly "larger". Corrected.
12-1062 12 57 14 Figure 12.39: end of the 21st century average here computed as 2080-2099 mean rather than 2081-2100 as is the standard used in the Chapter [Thomas Stocker/ WGI TSU, Switzerland]
Noted. That is deliberate for consistency with AR4.
12-1063 12 57 27 Please see comment 262 concerning whether the "4" in "C4MIP" should be a superscript. It's now 2:1 in favour of the superscript. [Adrian Simmons, United Kingdom]
We corrected to a superscript across the chapter.
12-1064 12 57 32 57 35 "stemming from the AR4" -- suggest to be as specific as possible with regard to references to the WGI AR4 and include Chapter references. [Thomas Stocker/ WGI TSU, Switzerland]
We now refer to Chapter 10 and specifically Box 10.2 about ECS.
12-1065 12 57 35 57 40 Perhaps the SRES range could be included here? [John Caesar, United Kingdom of Great Britain & Northern Ireland]
We include it now on the basis of the figure.
12-1066 12 57 35 57 40 It would be useful to include the range under the SRES scenarios for comparison in the text. [European Union] We include it now on the basis of the figure.
12-1067 12 57 43 Figure 12.40: change "this study's estimates" in the right hand side bars. Remove "this study" from the caption; please provide specific reference to the AR4 (SPM, TS, Chapter, Figure?) [Thomas Stocker/ WGI TSU, Switzerland]
All that has been cleaned up and corrected.
12-1068 12 58 9 58 33 These paras could be moved to the earlier discussion of pattern scaling in 12.4.2. At this point, it feels like we are returning to a subject already discussed. [Jonathan Gregory, United Kingdom]
As before (comment 12-1055), we decided to isolate this comparison in its own section and therefore it makes sense to show global averages and patterns here.
12-1069 12 58 13 58 24 This seems like an important finding which has not been reported elsewhere (including in the executive summary). Are there references for this finding? [Government of Canada]
We consider these results a bit premature at this point for the ES, since they are based on a simple analysis as described in the text and rcaption and we do not have published studies exploring these differences in more depth at a process level
12-1070 12 58 26 58 26 Please correct the spelling of the reference as it is correctly cited in line 3, page 57 [Jana Sillmann, Canada] Editorial, corrected
12-1071 12 58 26 58 27 suggest to delete "may be at this point the only study" and "In this study" and to instead write to "Knutti & Sedlacek (2012) attempt to identify… these sources. Differences in model …." [Thomas Stocker/ WGI TSU, Switzerland]
Accepted and deleted accordingly.
12-1072 12 58 26 58 33 The concluding sentence (lines 30 to 33) seems like new information that could be presented in the Executive Summary. [Government of Canada]
The ES now states that differences in global average temperature projections are largely attributable to differences in scenarios. This particular result mentioned here is based on a single study and would necessitate further probing before being elevatedto the ES.
12-1073 12 58 26 Delete first comma. [David Erickson, United States of America] Editorial, corrected.
12-1074 12 58 30 58 33 “This would suggest [...]” This sentence is extremely complicated to understand. Please rephrase particularly line 32. Do you mean that individual models have not improved from one CMIP generation to the next, but the robustness of the multi-model ensemble as a whole did? [Jana Sillmann, Canada]
We have rephrased the sentence. We mean to say that the sources of these differences are not traceable back to model improvements.
12-1075 12 58 40 58 40 Section 12.5. "Irreversibility" has been used to mean two things: (a) practical irreversibility (metastability, in effect) because reversing the change will take a very long time, for instance Solomon et al 2009, as discussed in 12.5.2 under "commitment", (b) theoretical irreversibility, because of multiple steady states and hysteresis, meaning that change will never be reversed even if the forcing is removed. This could cause confusion. There
Taken into account. At the beginning of 12.5. we define the two meanings and refer to the corresponding sections.
Expert and Government Review Comments on the IPCC WGI AR5 Second Order Draft – Chapter 12
Do not Cite, Quote or Distribute Page 85 of 120
Comment No
Chapter
FromPage
FromLine
To Page
To Line Comment Response
is a related discussion in 12.5.5, page 67 line 25-30, but I suggest that the distinction could be further clarified there or elsewhere. [Jonathan Gregory, United Kingdom]
12-1076 12 58 40 Regarding stabilisation pathways there are some new features in AR5 which were not found in AR4 and before in the WG1 reports. Negative emissions are first introduced, and overshoot (peak and decline) concentration pathways appear in stabilisation pathways. In some cases, peaking of temperature occurs associated with concentration peaking. These are new features which were not found before. And they are still limited to relatively small number of pathways. So, please be careful in making general statements. An example is in FAQ 12.3 on page 77 lines 37-41, where peaking of concentration is supposed to be a common feature. Another example is in the Long-Term Projection part of SPM, on page SPM-17 lines 40-42: "Thus a large fraction of climate change is largely irreversible ----, except if net anthropogenic---emissions were strongly negative". It may be better not to say "except if----", because most readers do not think of negative emmissions in the context. Actually in the definition of " irreversibility" on page 12-67, recovery is limited to those due to natural processes. [Taroh Matsuno, Japan]
Partly taken into account. Most of the results in that section, including FAQ 12.3 are based on idealized pathways simply to illustrate the timescales of the system. They do not judge whether negative emissions are plausible or likely. The caveat in the SPM statement is necessary because in principal most of these changes are not irreversible if the carbon were to be extracted from the system again. The definition of irrverisibility is now given at the beginning of 12.5.
12-1077 12 58 40 The use of the word "commitment" in this report and climate change science community, in a way as explained in 12.5.2, is not familiar and difficult for people outside the community (including policymakers) to grasp its correct meaning. It is often taken to mean something inevitable. So, it is desireable not to use the word, or at least to minimize using the word. In the case of AR4, the word was deleted from the draft SPM, for avoiding confusion because it is an official document where "commitment" is usually used something like "Nation A's commitment to reduce GHG emissions". In this AR5 draft "commitment " is used even more widely spread including constant emissions situation. It is recommended not to use this new commitment. There is no merit to use the word in such situation,but confusing. The use of the word "commitment" is criticized by Matsuno et al. (July 2012, Proceedings of Japan Academy Ser. B, 368-384,available from http:// www.jstage.jst.go.jp/browse/pjab). It is shown that committed warming in usual sense (stabilised state) is quite different from truely commited (inevitable) warming due to past emissions. [Taroh Matsuno, Japan]
Rejected. The commitment concept and terms are well established in the climate community, and clearly defined in the glossary. No alternative wording is proposed here. The difference between stabilization and commitment from past emissions is discussed in detail in this section.
12-1078 12 58 54 58 56 For RCP 8.5 the average warming is lower for the EMICS than CMIP5 (7.0C < 8.6C) [Jouni Räisänen, Finland] Noted, no changes made. Given the limited sample in an ensemble of opportunity, we would not expect identical results.
12-1079 12 59 3 59 5 how important is it to list the model names as part of the main text? Could this be placed in a footnote or could simply be referred to the EMIC table in the Chapter 9, Table 9.5? [Thomas Stocker/ WGI TSU, Switzerland]
Taken into account, model names deleted.
12-1080 12 59 7 59 37 The use of the word "commitment" in the way as explained here is particular to climate change science but it is not an approapriate wording. It is not easy for people outside of the community (including policymakers) to grasp what it meas correctly. The traditional and the oldest meaning is the same as "constant composition commitment", which refers to climate change when the concentration of CO2(GHG) is held constant. It is often taken to mean inevitable climate change, because people usually don't think of the limited residence time of CO2 in the atmosphere. And in some cases constant composition commitment is associated with past emissions, a misleading understanding. Even climate change scientists sometimes do so. It is only for the situation of "zero-emission commitment" where climate change is really inevitable. There is a large discrepancy between the two commitments in the case of temperature rise, as is shown by Matsuno et al.(2012, Proceedings of Japan Academy Ser. B.368-384, available free at http://www.jstage.jst.go.jp/browse/pjab). Thus it is desireble not to use such wording to avoid misunderstanding. It is recommended to minimize the use of "commitment". In this AR5 draft "commitment" is further extended to include "constant emissions commitment". There is no merit to use the word for such a situation. It could be expressed by other wording. It is strongly recommended not to extend the use of commitment. In the case of AR4, "commitment" was eliminated from the SPM, because in international policy sector, the wording in this particular way is confusing. "Commitment" usually used in cases something like "Nation A's commitment to reduce CO2 emissions" . In this sense the first sentence of this subsection saying "----has caught the attention of scientists and policymakers" is not correct. [Taroh Matsuno, Japan]
Rejected. The reviewer claims that this could be expressed by other wording, but does not propose any wording. The commitment concept and terms are well established in the climate community, and the different forms are clearly defined in the glossary. The difference between stabilization and commitment from past emissions is discussed in detail in this section.
12-1081 12 59 7 61 29 Section 12.5.2 Climate Change Commitment is a section full of important information and important concepts. I still wonder whether an overview table with explanation of the various concepts could be useful for the communication of these concepts, their meaning and applications. [Jan Fuglestvedt, Norway]
Rejected. We feel that the section discusses the different concepts quite clearly, and FAQ 12.3. does it again. Adding a table to repeat does not seem
Expert and Government Review Comments on the IPCC WGI AR5 Second Order Draft – Chapter 12
Do not Cite, Quote or Distribute Page 86 of 120
Comment No
Chapter
FromPage
FromLine
To Page
To Line Comment Response
essential given the limited space.
12-1082 12 59 9 59 11 I think the idea of commitment has actually been in people's minds continuously, rather than suddenly becoming more popular around the time of the AR4. I am not sure, of course - I can't speak for everyone! But maybe this comment is not really informative anyway. [Jonathan Gregory, United Kingdom]
Taken into account, reworded to clarify.
12-1083 12 59 10 Delete "has" [Adrian Simmons, United Kingdom] Taken into account, deleted word.
12-1084 12 59 13 59 22 Maybe the first paper to discuss the delay of temperture rise relative to radiative forsing is: Bryan, K., F.G.Komro, S.Manabe and M.J Spelman(1982),"Transient climate response to increasing atmospheric carbon dioxide". Science, 215,56-58. It is recommended to cite this on Line 13 and Line 22. [Taroh Matsuno, Japan]
Taken into account, reference added.
12-1085 12 59 26 59 26 The point that TCR<ECS can also be seen by regarding ocean heat uptake as a kind of negative feedback, as done by Dufresne and Bony (2008) and Gregory and Forster (2008). [Jonathan Gregory, United Kingdom]
Taken into account, added as suggested.
12-1086 12 59 32 59 33 ---- a most likely value of 0.6 deg C for 2100 (relative to 1980 -1999, AR4 Section 12.7.1)---: At least,12.7.1 must be replaced by 10.7.1. Mentioning of this number is not necessaary,because this is not "committed temperature rise" after the year 2000 stabilisation, by including a small rise until 2000. The correct number is 0.3 as written following it. [Taroh Matsuno, Japan]
Partly taken into account. Section number fixced. Text is not changed, both numbers are given for traceabilty to AR4.
12-1087 12 59 40 59 40 Insert the reference '' to read ' (e.g., Eby et al., 2009; Solomon et al., 2009;' The Eby et al paper was submitted in April, 2008 and accepted in September, 2008 but the climate community seems to skip over this contribution to cite a paper that was submitted in November, 2008. [Robert Webb, United States of America]
Taken into account, reference added. Reference order will be determined by the publisher.
12-1088 12 59 40 59 40 Insert the reference 'Eby et al., 2009"' to read ' (e.g., Eby et al., 2009; Solomon et al., 2009;' The Eby et al paper was submitted in April, 2008 and accepted in September, 2008 but the climate community seems to skip over this contribution to cite a paper that was submitted in November, 2008. [Robert Webb, United States of America]
Taken into account, reference added. Reference order will be determined by the publisher. The Solomon paper was submitted to a different journal earlier.
12-1089 12 59 43 warming is significantly below 1.' - what are the units, degrees C?............................... [Robert Webb, United States of America]
Taken into account. Replaced by "unity". There are no units, it is a fraction.
12-1090 12 59 43 warming is significantly below 1.' - what is the units, degrees C?............................... [Robert Webb, United States of America]
Taken into account. Replaced by "unity". There are no units, it is a fraction.
12-1091 12 59 44 59 46 The fraction of realized warming at the time of stabilisation is compared among RCP scenarios. The fraction value for RCP 8.5 and 2.6 is 85%, considerably larger than 75% for RCP 4.5 and 6.0, and this value, 85% is much larger than corresponding value so far considered, including the case mentioned in AR4, where the fraction was 65% for A1B and 70% for B1 (AR4 10.7.2,page 827). This large value might be attributed to special conditions in the two cases. The RCP 2.6 scenario is an overshoot scenario, where the concentration once overshoots the final target so that large fraction is quite understandable. It could be above 100% if oovershooting is large. In the case of RCP8.5 CO2 concentration goes up to a very high level, almost 2000ppm (Fig 12.43). In this situation, because of the non-linearity of radiative forcing, namely logarithmic dependence on the concentration, the increment of the forcing in the later period approaching the stabilisation must be very small so that near or effective stabilisation is reached fairly earlier than nominal one. In this way these large fraction can be understood as the result of rather exceptional situations. It may be better to explain this point to exclude these exceptional cases. And mention that the fraction value for moderate cases, 75% is consistent with the AR4 results, 65-70%. [Taroh Matsuno, Japan]
Rejected. This is a detail and space prevents us from discussing this further. The numbers are simply diagnosed from the simulations, but no anaylsis is available in the literature to interpret them further.
12-1092 12 59 45 59 46 Include reference to Fig. 12.43 [Kirsten Zickfeld, Canada] Taken into account, reference to figure added.
12-1093 12 59 47 48 "for an instantaneous forcing change, the fraction of realized warming is much smaller, about 40–70% at the time when the forcing is kept constant. " This is of course nonsense. If the forcing were instantaneous, the time when the forcing is kept constant is delta+, at which time the temperature change is epsilon+, not 40-70% of final. [Stephen E Schwartz, United States of America]
Taken into account, instantaneous forcing increase deleted.
12-1094 12 59 48 59 49 "It rises typically by 10% over the following century 49 with stable forcing." What is the misplace pronoun 'It' refer to -- global SST, global temperature, sea level. [Robert Webb, United States of America]
Taken into account, reworded to clarify.

Expert and Government Review Comments on the IPCC WGI AR5 Second Order Draft – Chapter 12
Do not Cite, Quote or Distribute Page 87 of 120
Comment No
Chapter
FromPage
FromLine
To Page
To Line Comment Response
12-1095 12 59 48 61 29 Given the expect long time scale of climate change commitment, it would be useful to provide an assessment of what the extended elevation of temperatures imply for sea level rise given the Chapter 5 statement that "There is high confidence that during the last interglacial period, global mean sea level was between 6 and 10 m higher than present." and implication that the equilibrium response to the persistance of a past (and future) 1-2 °C warming could be 6 to 10m of sea level rise. [Robert Webb, United States of America]
Rejected. Sea level changes are the corresponding timescales are discussed in chapter 13.
12-1096 12 59 54 59 57 Figure 12.43 is not referred to in the text where these issues are discussed. [Jan Fuglestvedt, Norway] Taken into account, reference added.
12-1097 12 59 55 59 57 In section 12.5.2, there is no discussion or reference to Figure 12.43. [Thomas Stocker/ WGI TSU, Switzerland]
Taken into account, reference added.
12-1098 12 59 Is commitment usng a baseline of 1850 or 1985-2000? [David Erickson, United States of America] Noted. The concept is general and makes no assumptions about years, usually it is relative to the time when the forcing stabilizes or stops. No changes requested.
12-1099 12 60 4 60 7 The results described here need to be discussed in more detail on several points. First, it is unclear which of the scenarios evaluated by Meinshausen et al is being discussed. It appears that the closest scenario to constant emissions evaluated by Meinshausen et al is the SRES B1 scenario, which does not hold emissions strictly constant, although that scenario is closer to constant than the others they evaluated. The text here should be consistent with the Meinshausen et al studies. Second, the discussion here needs to be consistent with the later discussion regarding the cumulative carbon budget discussed in 12.5.4.3. Constant 2010 anthropogenic CO2 emissions would be expected to add about 770 GtC to the atmosphere by 2100 (starting in 2012). This is either just below the "allowable" carbon budget (at the upper range of 1300 GtC) or 60% above that budget (at the lower range of 1000 GtC). These two evaluations are compared against two different end points (1-2.5 C in the constant emissions discussion vs. 2.0 C in the carbon budget), but should be addressed in a coordinated manner. Finally, the discussion needs to make clear that "constant emissions" is considerably different from "business as usual" (BAU). The chapter notes the importance of technological commitments at the end of this section (p 12-61, line 19) and (rightly) notes that such evaluations are outside the scope of this chapter. However, the immediate connotation drawn from this paragraph is that no change in emissions is (for 2/3 of the range) within the level of temperature increase that has been considered acceptable in terms of avoiding the most severe consequences of climate change. This paragraph needs to be expanded to ensure that the points are made clearly in the context of BAU vs. constant emissions. [Government of United States of America]
Taken into account. Added: "Such a scenario is different from non-intervention economic scenarios, and it does not stabilize global temperature, as any plausible emission path after 2100 would however cause further warming. " Indeed the scenarios is a "constant emissions" scenario, not an SRES scenario.
12-1100 12 60 4 60 7 Constant-composition and zero-emission commitment both seem fairly obvious ways to quantify what we can't avoid. By contrast, "constant emissions commitment" seems a bit odd to me. We are not committed to keeping emissions constant. This is a short para interrupting the link between closely related concepts. I wonder, is it really useful? [Jonathan Gregory, United Kingdom]
Rejected. Constant emissions was discussed in AR4 and is defined in the glossary. While not truly a commitment of course, it is a question that is often asked and we prefer to keep it.
12-1101 12 60 4 60 7 at what year/value were emissions kept constant? Can you put this scenario in the context of the RCPs? i.e. 21st Century cumulative emissions are XXX PgC and so it falls between RCP4.5 and 6.0 for example? [Chris Jones, United Kingdom of Great Britain & Northern Ireland]
Partly taken into account. The text notes that emissions are kept at 2010 levels. We prefer not to mix these idalized cases with the RCP scenarios.
12-1102 12 60 7 60 7 To strengthen this paragraph, results from the EMIC intercomparison described Zickfeld et al. (2012, J. Clim., submitted) could be included: e.g. the ensemble mean warming between years 2300 (the year of forcing stabilization) and 3000 is 0.8 C for RCP 4.5 in the ensemble mean (for constant year-2300 emissions). [Kirsten Zickfeld, Canada]
Rejected. This paragraph is about constant emissions, which is different from the RCPs. Results from Zickfeld et al. are discussed elsewhere and shown in several figures.
12-1103 12 60 9 60 38 In this long paragraph zero-emissions commitment is discussed. In the first part until line 27, general features of climate change to take place after emissions are eliminated are described based on numerical experiments where emissions are shut off at any time, while in the latter part from line 27 to 38 the discussion is focussed on what happens if emissions are shut off "today" by the past emissions. It is better to split the para into two to make the distinction of two different topics clearer. [Taroh Matsuno, Japan]
Rejected. The two cases are the same, past emissions do not refer to today, but past with regard to the point in time when emissions are stopped.
12-1104 12 60 9 38 In the beginning of the para that the zero emissions commitment for CO2 is holding the forcing of other Taken into account. The revised text notest that in the
Expert and Government Review Comments on the IPCC WGI AR5 Second Order Draft – Chapter 12
Do not Cite, Quote or Distribute Page 88 of 120
Comment No
Chapter
FromPage
FromLine
To Page
To Line Comment Response
constituents constant. But the para does not state the whole truth, as I think it should, that holding forcing by other constituents (especially aerosols) while zeroing CO2 emissions is quite unrealistic (requiring geoengineering). The sentence beginning line 35, "All of the above studies support the conclusion that temperatures would decrease only slowly even for strong reductions or complete elimination of CO2 emissions, and might even increase temporarily for an abrupt reduction of the short-lived aerosols" seems to forget the holding constant of the forcing of other constituents; the " temporarily" in the last clause seems inappropriate. Of course it is temporary, but it is likely immediate and large and would last as long as the forcing by the greenhouse gases lasts (and more, given the time constant for reversal of the temperature) which is not what one would infer from "temporary." [Stephen E Schwartz, United States of America]
real world, the emissions of CO2 and the non-CO2 forcing are of course coupled. Nevertheless, to undestand the concepts it it helpful to discuss each component separately.
12-1105 12 60 14 60 15 The sentence stating "Those results indicate that past emissions commit us for hundreds of years to approximately the amount of warming that has already been realized." is unclear. It could be interpreted to mean we would expect additional warming comparable to that which has already occurred, but that is not the message contained in following text. Suggest rewording as: "Those results indicate that past emissions commit us to persistent warming, continuing at about the level that has already occurred for hundreds of years." [Government of Canada]
Taken into account, reworded as suggested.
12-1106 12 60 17 60 19 The airborne fraction of cumulative emissions is dependent on the amount of emissions! It is 20-30% at year 1000 for cumulative emissions < 2000 GtC, but is 40-50% for cumulative emissions of 2500-4000 GtC and 60-70% for cumulative emissions > 5000 GtC (Eby et al., 2009). [Kirsten Zickfeld, Canada]
Taken into account, added the range of emissions. The timescale of 1000 was already mentioned.
12-1107 12 60 18 60 20 Regarding "20-30% remaining…": This should be coordinated with chapter 6 (and Box 6.2). See also the recent paper by Joos et al. in ACPD. [Jan Fuglestvedt, Norway]
Taken into account. The number is consistent with Joos et al. 2013 which is now referenced. Box 6.2 uses the same data.
12-1108 12 60 18 19 This view of the CO2 impulse profile is model-derived as opposed to observationally derived such as Moore and Braswell (1994) and Jacobson (2005), which yield a CO2 history that is essentially indistinguishable from observations. Jacobson, M. Z.: Correction to ‘‘Control of fossil-fuel particulate black carbon and organic matter, possibly the most effective method of slowing global warming’’, J. Geophys. Res., 110, D14105, 10.1029/2005JD005888, 2005. Moore III, B., and Braswell, B. H.: The lifetime of excess atmospheric carbon dioxide, Global Biogeochem. Cycles, 8, 23-38, 10.1029/93GB03392, 1994. [Stephen E Schwartz, United States of America]
Rejected. The idea idea of a single lifetime for carbon has long been rejected in the literature, and is at odds with basic physics/chemistry and observations. Support for the CO2 pulse model is not just from models but from various observations. See chapter 6, Box 6.2.
12-1109 12 60 20 60 23 See also the recent paper by Joos et al. in ACPD which also present temperature responses to the CO2 pulses. [Jan Fuglestvedt, Norway]
Taken into account, reference added.
12-1110 12 60 21 60 23 A recent paper by Zickfeld et al. (Zickfeld, K., V.K Arora, and N.P. Gillett, 2012, Is the climate response to carbon emissions path dependent? Geophysical Research Letters. 39, L05703, doi:10.1029/2011GL050205) also show near-constancy of global mean temperature and could be cited here. [Kirsten Zickfeld, Canada]
Taken into account, reference added.
12-1111 12 60 25 60 25 its not universally true that reduction in CO2 is “mainly from deep ocean carbon uptake” - Lowe et al (ERL, 2009, http://iopscience.iop.org/1748-9326/4/1/014012 ) look at CO2 recovery under zero emissions from different points in the 21st century and find that although the recovery rates are similar, the balance of uptake between land and ocean differs strongly. [Chris Jones, United Kingdom of Great Britain & Northern Ireland]
Taken into account, reworded to include land carbon uptake.
12-1112 12 60 30 Explain "Near zero or slightly negative". [David Erickson, United States of America] Taken into account, bracket added to explain.
12-1113 12 60 30 Presume that the 3 C refers to 3 C per doubling of CO2. Otherwise, this is not a sensitivity. [Government of United States of America]
Taken into account, reworded to clarify.
12-1114 12 60 33 60 33 Include a reference to Matthews, H.D., and K. Zickfeld, 2012, Climate response to zeroed emissions of greenhouse gases and aerosols, Nature Climate Change 2, 338-341. [Kirsten Zickfeld, Canada]
Taken into account, reference added.
12-1115 12 60 40 60 53 Strictly speaking, the "anthropogenic perturbation" was set to zero in the EMIC intercomparison simulations, Taken into account, changed as proposed.

Expert and Government Review Comments on the IPCC WGI AR5 Second Order Draft – Chapter 12
Do not Cite, Quote or Distribute Page 89 of 120
Comment No
Chapter
FromPage
FromLine
To Page
To Line Comment Response
which does not corespond to zero CO2 emissions exactly (see Zickfeld et al., 2012, J. Clim., submitted). Also, the radiative forcing, rather than the emissions of non-CO2 gases was set to zero in 2300 in the simulations shown in Fig. 12.44. Instead of describing the simulations having "zero anthropogenic emissions after 2300" you could say "pre-industrial CO2 emissions and zero non-CO2 forcings after 2300". [Kirsten Zickfeld, Canada]
12-1116 12 60 55 60 25 the key point to make here – maybe more explicitly - is that the airborne fraction applies equally to negative emissions as it does to positive ones, and it can vary markedly depending on the emissions history. [Chris Jones, United Kingdom of Great Britain & Northern Ireland]
Taken into account, changed as proposed.
12-1117 12 60 55 60 57 This feels like an awkward link. The question now being introduced is what happens if you remove all the anthropogenic CO2 from the atmos, either with a C-cycle response (Cao and Caldeira) or without (Held et al). This is not a quantification of commitment. It relates to reversibility. Maybe it would be helpful to put "reversibility" in the title of the section. [Jonathan Gregory, United Kingdom]
Rejected. This can be seen as a hypothetical discussion on how to reduce the commitment. Reversibility is discussed in the following sections.
12-1118 12 61 8 61 8 I would break the para before the last sentence, which belongs in the next para. [Jonathan Gregory, United Kingdom]
Rejected. Both sentences are about zero forcing.
12-1119 12 61 17 61 17 Bouttes et al (in press with J Climate) discuss the reversibility of thermal expansion in a framework similar to that of Held et al. [Jonathan Gregory, United Kingdom]
Taken into account, reference added.
12-1120 12 61 19 61 24 It is interesting that you mention commitments beyond the pure biogeophysical system and mention energy systems. Perhaps a reference to relevevant chapters in WG3 can be given here? It would also be useful to make the CLAs of those chapters aware of the potential link here. [Jan Fuglestvedt, Norway]
Noted, no changes made. Forward referencing to WG3 is not possible as that report is not published.
12-1121 12 61 19 61 24 I think this is not WG1 material, as indeed the next para implies, so I would omit it. [Jonathan Gregory, United Kingdom]
Rejected. We feel that the reader should be aware that while the commitment cases discussed in WG1 are idealized, there are commitment from technology and society that are real. We do not assess those, but simply point out that they exist.
12-1122 12 61 23 61 24 The current wording says "the lifetime of these devices would not be extended beyond normal". Given that there is no finite, fixed or "normal" lifetime of such installations, it would be better to state the implied assumption in the article, so that the sentence reads: ".. from existing energy CO2-emitting infrastructure installations under the specific assumptions regarding their lifetimes, with, for example, between 24 and 39 years for coal, gas and oil burning facilities. [Government of Germany]
Taken into account, changed as proposed.
12-1123 12 61 26 61 29 Also here I suggest a reference to WG3. It would also be useful to make the CLAs of those chapters aware of the potential link here. [Jan Fuglestvedt, Norway]
Noted, no changes made. Forward referencing to WG3 is not possible as that report is not published.
12-1124 12 61 31 62 27 Section 12.5.3 (= Section 12.5.3.1). The purpose of this section is unclear to me. It contains useful references and remarks but it is not well-focussed. I would suggest that this section could be removed, with its material being condensed into Box 12.2. That would also bring 12.5.4 next to 12.5.2, which would be good because they are related. Furthermore, there is overlap of 12.5.3 and 12.5.4 with 10.8. I don't think it makes sense to a reader for there to be sections on this in different chapters. I have a made a similar comment on ch8. [Jonathan Gregory, United Kingdom]
Partly taken into account. This section is rather technical with many references, and merging it into Box 12.2 would overload that. Yet it is critical to have some overview of the key concepts close to Box 12.2 which only provides results. There are a number of caveat to forcing and climate sensitivity that are often forgotten. The section was relabeled as "forcing and temperature response, timescales of of feedbacks".
12-1125 12 61 33 62 27 Section 12.5.3.1 and Box 12.2: I was looking for some additional discussion of the suite of PMIP paleoclimate intercomparissons in these sections. [Government of United States of America]
Noted, no changes made. PMIP results are discussed in the paleoclimate chapter.
12-1126 12 61 33 Section 12.5.3.1: Since no specific numbers on ECS are given here, please at least refer to Box 12.2; Coordination needed with Ch05 since they use different CS concepts, i.e., Charney Climate Sensitivity [Thomas Stocker/ WGI TSU, Switzerland]
Accepted, reference to Box 12.2. added. Charney Climate Sensitivity will not be used in the report.
12-1127 12 61 43 61 43 Also Williams et al 2008 10.1175/2008JCLI2371.1. [Jonathan Gregory, United Kingdom] Taken into account, reference added.
12-1128 12 62 9 16 This point is also discussed in chapters 5 and briefly in 10. crosslink and make sure its consistent [Gabriele Taken into account, reference added.
Expert and Government Review Comments on the IPCC WGI AR5 Second Order Draft – Chapter 12
Do not Cite, Quote or Distribute Page 90 of 120
Comment No
Chapter
FromPage
FromLine
To Page
To Line Comment Response
Hegerl, United Kingdom]
12-1129 12 62 12 See also Hargreaves et al (GRL 2012 in press) for a new (albeit tentative) estimate of climate sensitivity based on the PMIP2 models and the most recent proxy data. [James Annan, Japan]
Taken into account, reference added.
12-1130 12 62 21 would say volcanic eruptions rather than Pinatubo - concern relates to all of them [Gabriele Hegerl, United Kingdom]
Taken into account, wording changed.
12-1131 12 62 31 62 37 This short summary-like para contains important issues, suggesting that the traditional concentration stabilisation might not be ralistic as climate target, while newly emerged concept of cumulative total emissions connected with peak warming is more general and realistic. In 12.5.4.3, it is said that "The simplicity of the concept--- makes it attractive for policy." It is desireable to present more arguments regarding suitability of this new concept in comparison with stabilisation. There are many proposals to adopt cumulative emissions as a target : Zickfeld et al.(2009), Meinshausen et al.(2009), Matsuno et al.(2012). The relation between cumulative carbon emissions and peak temperature rise holds only for (practically) zero-emissions pathways. In this case, by natural recovery effects, final temperature rise could be lowered, to avoid long-term risk of sea level rise, a most serious concern in the traditional stabilisation. Refer to a recent paper by Matsuno et al.(2012, Proceedings of Japan Academy Ser. B, 368-395, http://www.jstage.jst.go.jp/browse/pjab) concerning zero-emission vs.stabilisation including the former's merits. [Taroh Matsuno, Japan]
Noted, not clear what changes are requested. As the report must not policy prescriptive, indicating preference of one versus another scenario is not appropriate.
12-1132 12 62 34 62 37 In this context, Matsuno et al. (2012) can be cited as a reference that has raised a problem of unrealistic long-lasting emissions under a stabilized atmospheric concentration. Matsuno, T., K. Maruyama, and J. Tsutsui, 2012: Stabilization of atmospheric carbon dioxide via zero emissions - an alternative way to a stable global environment. Part 1: Examination of the traditional stabilization concept, Proc. Jpn. Acad., Ser. B, 88, 368-384. https://www.jstage.jst.go.jp/article/pjab/88/7/88_PJA8807B-05/_article [Junichi Tsutsui, Japan]
Taken into account, reference added.
12-1133 12 62 45 62 46 The term "2 C temperature target" should be avoided in this report since this may be misunderstood as an indication that the IPCC reinforces/supports this particular political goal. Considering the role of IPCC to provide rigorous and balanced scientific information to policy makers, it is essential for the IPCC to keep its neutrality; therefore, the sentence is better being rephrased to address the above concern. [Government of Japan]
Rejected. The text simply states that 2°C is currently most widely supported, and in fact it has been agreed by the governments formally. A few sentences further down, the text mentions other targest and explicitly states that the chapter does not advocate or defend any threshold, nor does it judge the economic or political feasibility of such goals
12-1134 12 62 47 62 49 The paper by Joshi et al. 2011 in Nature Climate Change could be relevant here. [Jan Fuglestvedt, Norway] Taken into account, reference added.
12-1135 12 62 48 62 48 Acceptable is not the opposite of dangerous. Something can be dangerous but still acceptable, I suggest rephrasing in something like: "No objective threshold defines when dangerous interference is reached." [Joeri Rogelj, Switzerland]
Taken into account, changed as proposed.
12-1136 12 62 49 62 51 This sentence is unclearly written and appears a value judgement in itself, without referring to any literature on this issue. For example, what is meant by "comparing values today and in the future"? Maybe an alternative formulation could be: "A single critical climate threshold therefore inevitably aggregates views and expectations about the wider implications of exceeding that threshold." [Joeri Rogelj, Switzerland]
Taken into account, reworded to clarify.
12-1137 12 62 54 62 A reference to the chapter(s) in WG3 on these issues could be given here. [Jan Fuglestvedt, Norway] Noted, no changes made. Forward referencing to WG3 is not possible as that report is not published.
12-1138 12 63 1 63 15 The term of "cumulative carbon emissions" is not quite clear. Does it include also other Greenhouse gases than CO2? - In order to guard against misunderstanding, it should be explicitely explained. [Government of Germany]
Taken into account, added a sentence that this does not for non CO2 forcings. The definition says clearly CO2, so other forcings are not included.
12-1139 12 63 1 64 29 Chapter 12, specifically section 12.5.4.2, discusses the issue of constraints on cumulative carbon emissions. No account is given of studies by Earth system models which analyse the pathway of possible allowable, or implied, anthropogenic emissions consistent with prescribed pathways of atmospheric CO2 concentrations. I suggest adding a paragraph on this issue which is important for planning of mitigation measures.
Partly taken into account. Reference added as suggested. Compatible emissions are discussed in the carbon cycle chapter, cross-reference added. Results from CMIP5 are included in Fig. 12.46.

Expert and Government Review Comments on the IPCC WGI AR5 Second Order Draft – Chapter 12
Do not Cite, Quote or Distribute Page 91 of 120
Comment No
Chapter
FromPage
FromLine
To Page
To Line Comment Response
e.g. Roeckner, E., Giorgetta, M.A., Crüger, T., Esch, M., Pongratz, J., 2011: Historical and future anthropogenic emission pathways from coupled climate-carbon cycle simulations. Climatic Change, 105, 91 – 108. [Martin Claussen, Germany]
12-1140 12 63 3 63 3 It would be informative if the explicit radiative forcing value were added in brackets, so that misunderstandings are minimised in regard to what the term "the current radiative forcing from greenhouse gases..." exactly refers to (whether this refers to ALL anthropogenic forcings, only the Kyoto-GHGs, or in 2005 or 2010 or 2012... [Government of Germany]
Rejected. The text states that this refers to GHG only, not all forcings.The statement does not depend on a specific year, and the warming is only approximate, as the text states. Both the forcing and the required climate sensitivity are uncertain.
12-1141 12 63 3 63 4 It is not clear whether "forcing from greenhouse gases" refers to concentrations or emissions. This needs to be clarified. This also needs to be explained in the context of the discussion regarding constant emissions. If this is describing constant GHG concentrations, then that would imply that reducing emissions to the natural replacement rate (a significant reduction from current emission levels) would result in temperature increase of about 2 C. This, in turn, suggests that constant emissions at 2010 levels would only add about 0.5 C to warming. There is a clear difference between constant forcing and constant emissions, but these differences are not explained in the text and lead to the potential for misunderstanding both the differences and the implications. This section needs to be written keeping in mind the earlier discussion on the constant emissions commitment. [Government of United States of America]
Partly taken into account. The text specifies clearly "radiative forcing", so there is no ambiguity. We added a bracket (commitment from constant greenhouse gas concentrations) to make it more explicit.
12-1142 12 63 3 63 6 I wonder if the first para should be expanded to make it more clear (i.e. specify the types of emissions) [Jan Fuglestvedt, Norway]
Taken into account. We added a bracket (commitment from constant greenhouse gas concentrations) to make it more explicit.
12-1143 12 63 3 63 6 In this para "zero-emission commitment" due to past emission until today is explained. This is an important point and should be discussed somewhere in the report. But this place is not suited to this issue. It may be better to move this para to the place of zero-emission commitment, page 60, following line 38. It is emphasized that the effects of aerosol cooling, which is supposed to almost offset radiative forcing due to non-CO2 GHGs according to AR4 (-1.2W/m2). But now in the AR5, aerosol negative radiative forcing is estimated as -0.7W/m2, a considerably smaller in its magnitude. Perhaps some additional remark may be helpful for readers. [Taroh Matsuno, Japan]
Rejected. This paragraph discussed constant concentrations/forcing, not zero emissions. The statements are valid no matter what the aerosol forcing is, since it only depends on the GHG forcing.
12-1144 12 63 5 63 6 This sentence would be easier to understand if you say "Part of the positive radiative forcing from greenhouse gases is compensated...". [Kirsten Zickfeld, Canada]
Taken into account, text changed as suggested.
12-1145 12 63 6 63 6 "greenhouse gas forcing" should be "forcing from both greenhouse gases and aerosol"? [Manoj Joshi, United Kingdom of Great Britain & Northern Ireland]
Taken into account, text clarified.
12-1146 12 63 6 63 6 The current literature on emission scenarios heavily depends on so-called "negative emissions" (onyl carbon-dioxide) from biomass energy in combination with carbon capture and storage. These will increase the rate of decrease of greenhouse gas forcing further. Because of their prominence in the scenario literature, I suggest highlighting their impact, even if only qualitatively. For example: "Actively removing carbon-dioxide from the atmosphere, for example by the combined use of biomass energy and carbon capture and storage [Ref to IPCC special report on carbon capture and storage], would further accelerate the decrease in greenhouse gas forcing." [Joeri Rogelj, Switzerland]
Taken into account, text added as proposed.
12-1147 12 63 6 Should "decrease" really be "increase"? [Government of United States of America] Taken into account. Clarified that this refers to GHG only, so it is a decrease.
12-1148 12 63 8 63 15 The near one to one relationship between peak temperature and cumulative carbon emissions holds only for a class of scenarios with sharp decrease of emissions soon after peaking and approaching zero level relatively in a short period; they are essentially zero-emissions scenarios. Only in this case,clear peaking of CO2 concentration occurs and as a consequence temperature rise also has a peak. If ordinary stabilisation pathways, in which concentration increases gradually to approach a target stabilisation level are included, one to one relationship does no longer hold, as shown by Matsuno et al.(2012, Proceedings of Japan Academy Ser. B 368-384. http://www.jstage.jst.go.jp+G1119/browse/pjab). This point (condition) must be remarked referring to the cited paper. [Taroh Matsuno, Japan]
Taken into account, limitations explicitly mentioned.
Expert and Government Review Comments on the IPCC WGI AR5 Second Order Draft – Chapter 12
Do not Cite, Quote or Distribute Page 92 of 120
Comment No
Chapter
FromPage
FromLine
To Page
To Line Comment Response
12-1149 12 63 8 10 "The total amount of anthropogenic CO2 released in the atmosphere (often termed cumulative carbon emission) is a good indicator of the atmospheric CO2 concentration. " This assumes an atmospheric fraction [Stephen E Schwartz, United States of America]
Noted, no changes requested.
12-1150 12 63 10 63 14 Constancy of TCRE is also shown in Zickfeld, K., V.K Arora, and N.P. Gillett, 2012, Is the climate response to carbon emissions path dependent? Geophysical Research Letters. 39, L05703, doi:10.1029/2011GL050205. [Kirsten Zickfeld, Canada]
Taken into account. Added references to Zickfeld 2012 and 2013.
12-1151 12 63 11 63 11 Why does "and equilibrium" appear here? Deleting "and equilibrium", you have the first occurrence of "transient climate response to carbon emissions" so you could put "TCRE" at this point to define the acronym. Gregory et al 2009 define this phrase with the acronym TCRE, but a different - less convenient - quantitative definition. [Jonathan Gregory, United Kingdom]
Taken into account, added acronym definition and reference.
12-1152 12 63 14 63 15 The consistency between scenario independence of cumulative CO2 and GWP needs some more explanation. (And I think it will be clearer to mention AGWP_CO2, and not GWPs in general) [Jan Fuglestvedt, Norway]
Partly taken into account. Clarified that the GWP refers to CO2, but due to space constraints we can't give more details here.
12-1153 12 63 17 63 17 what does given carbon feedbacks mean? They cannot be set constant over these time periods since e.g. vegetation characteristics will change dynamically. What is about N, P cycle feedbacks? [European Union]
Rejected. The text is clear that if they were fixed, then that would be the consequence. In reality they will not be exactly fixed, but to first order the consequence remains that emissions have to decrease rapidly.
12-1154 12 63 17 63 19 What is meant to say here? Without having particular situations in mind, the content of this para is nothing but a fundamental knowledge in climate change arguments. [Taroh Matsuno, Japan]
Noted. The reviewer is correct, but even though that is fundamental knowledge, many readers to not know it, and it needs to be stated.
12-1155 12 63 17 63 22 References should include Matsuno et al. (2012). [Junichi Tsutsui, Japan] Taken into account, reference added.
12-1156 12 63 18 63 19 I think this sentence is misleading: since warming will continue for centuries to millennium due to ocean thermal inertia, stabilization of temperature on these timescales requires DECREASING CO2 concentrations. [Kirsten Zickfeld, Canada]
Taken into account. Strictly it requires stable CO2 concentrations, it would just take a long time. We added a bracket to highlight that to stabilize temperature more quickly would require decreasing concentrations.
12-1157 12 63 19 63 22 The current sentence "This requires decreasing emissions to the level of natural carbon sinks, and eventually to near-zero" is ok, but imprecise. Many readers will misunderstand that this first requires halving emissions (because CURRENT natural carbon sinks are about half the anthropogenic carbon emissions) and then GO BELOW natural carbon sinks to near-zero levels. In fact, the natural carbon sinks themselves will approach near-zero levels and this dynamic perspective would be good to explain to the readers. A suggestion for rephrasing: "This requires decreasing CARBON emissions to the level of natural carbon sinks, which themselves decrease over time to near-zero levels after stabilization of concentrations." [Government of Germany]
Taken into account. Delete this part to avoid confusion.
12-1158 12 63 24 63 29 A reference to 12.45b could also be inserted. [Jan Fuglestvedt, Norway] Rejected to keep the text short.
12-1159 12 63 24 63 55 change units from PgC to 1000 Pg C and from oC PgC-1 to oC 1000PgC-1. Note that the units change from oC to K on lines 38-39 [Thomas Stocker/ WGI TSU, Switzerland]
Taken into account, all units changed.
12-1160 12 63 24 67 13 The unit of cumulative carbon must be Eg(Exa gram)C instead of PgC. [Taroh Matsuno, Japan] Taken into account, all units changed.
12-1161 12 63 27 63 28 "Not all numbers are therefore comparable." -> Indeed, Hajima et al. (Journal of the Meteorological Society of Japan, Vol. 90, No. 3, pp. 417–434, 2012, DOI:10.2151/jmsj.2012-305) showed that the relationship between cumlative emissions and temperature under RCPs is significantly modified by including non-CO2 greenhouse gasses and the pace at which atmospheric CO2 concentration rises. [Michio Kawamiya, Japan]
Taken into account, reference added.
12-1162 12 63 31 63 31 The results in Fig. 12.45d are not shown by Rogelj et al, so some further explanation could be offered. In particular, the significance of the downturn for one of the scenarios here (around 1300 PgCe) is unclear. [Ian Watterson, Australia]
Partly taken into account. Due to space constraints we cannot discuss individual studies in more detail, but we refer to that panel when we say that the concept does not hold after temperatures peak.

Expert and Government Review Comments on the IPCC WGI AR5 Second Order Draft – Chapter 12
Do not Cite, Quote or Distribute Page 93 of 120
Comment No
Chapter
FromPage
FromLine
To Page
To Line Comment Response
12-1163 12 63 41 63 43 If the Cumulative carbon emissions only include CO2, then the unit of transient climate response to cumulative carbon emission (TCRE) is not quite correct, it schould be per CO2 instead of per C. [Government of Germany]
Rejected. It can be defined for CO2 or for C. The definition at the beginning of section 12.5.4.2 is unambiguous.
12-1164 12 63 41 63 45 This text is identical to that on p. 66, lines 1 through 5. [Government of United States of America] Noted. That is deliberate to make sure the summary is consistent with the underlying assessment.
12-1165 12 63 50 63 50 I support the comment submitted by Stephen Schwartz concerning the discussion of the Schwartz et al (2012) paper, and the wording change recommended in that comment. [John Ogren, United States of America]
Taken into account, wording changed and shortened.
12-1166 12 63 50 63 55 The way this is written now seems somewhat odd. I suggest that you consider rewording the last sentence so it can contain some information about what the paper is saying. And then give a concluding remark. [Jan Fuglestvedt, Norway]
Partly taken into account. Since the chapter authors and the authors of the original paper disagree, the discussion is shortened even further.
12-1167 12 63 50 63 55 This is a very inaccurate account of the key message of Schwartz et al 2010. C.f review comment submitted by Stephen Schwartz. [Henning Rodhe, Sweden]
Taken into account, wording changed and shortened.
12-1168 12 63 50 63 55 We suggest to shorten this last part of this passage to avoid a somewhat personal tone, to read as follows: "The results by Schwartz et al. (2010, 2012) imply a much larger warming for the carbon emitted over the historical period and have been questioned by Knutti and Plattner (2011) for neglecting the relevant response timescales and combining an transient airborne fraction with an equilibrium climate sensitivity" [Thomas Stocker/ WGI TSU, Switzerland]
Taken into account, reworded as suggested.
12-1169 12 63 50 55 The language here fails to adequately convey the initial point by Schwartz et al and the tenor of the exchange with Knutti and Plattner. The statement that the results of Schwartz et al are not based on a climate model, and hence, by implication, cannot possibly be correct, suggests a narrow perspective that would not seem appropriate for IPCC. The reasoning of Schwartz et al can be simply stated as follows: 1. For an "equilibrium" sensitivity of 3 K per 3.7 W m-2 CO2 doubling forcing, and for a forcing by LLGHGs of 2.6 W m-2 (in 2010), the expected increase in GMST would be 2.1 K, much greater than the observed 0.8 K. 2. The rate of increase in ocean heat content bounds the extent to which that "warming discrepancy" is due to lack of attainment of steady state following the GHG perturbation; the heating rate (ca 0.4 W m-2) is subtractive from the forcing, yielding an "effective" forcing of 2.2 W m-2 and an expected temperature increase (for that climate sensitivity) of 1.8 K, still much greater than the observed. 3. The discrepancy can be accounted for by lower climate sensitivity and/or offset by tropospheric aerosol forcing; Schwartz et al noted that an even higher equilibrium sensitivity offset by still greater (negative) aerosol forcing could not be ruled out. 4. Because of the great difference in residence times of aerosols (ca 1 week) vs LLGHGs (ca 100 years), the committed warming is due entirely to GHGs; if emissions of aerosol (precursors) and GHGs were both halted, GMST would rapidly increase to something near the "equilibrium" temperature calculated above. The above argument is in no way adequately conveyed in the existing text, In fact the comment by Knutti and Plattner showing rapid increase in GMST following cessation of emissions of both GHGs and aerosol precursors would seem to support the argument of Schwartz et al. I would hope that the language of the assessment document would be revised to give a more evenhanded account of the argument of Schwartz et al. and of the exchange between the two groups. [Stephen E Schwartz, United States of America]
Partly taken into account. The chapter authors disagree with the the reviewer. The sentence is reduced to a simple neutral statement that the positions of the two studies disagree, without discussing the studies in detail.
12-1170 12 63 50 55 Perhaps the text of the report might go something along the following lines:
Partly taken into account. The chapter authors disagree with the the reviewer. The sentence is
Expert and Government Review Comments on the IPCC WGI AR5 Second Order Draft – Chapter 12
Do not Cite, Quote or Distribute Page 94 of 120
Comment No
Chapter
FromPage
FromLine
To Page
To Line Comment Response
Schwartz et al. (2010) calculated a committed increase in global mean surface temperature from the incremental long-lived greenhouse gases,1.8 K, that is much greater than the observed temperature increase over the twentieth century, 0.8 K. This result was based on the best-estimate climate sensitivity (3 K for CO2 doubling), the estimated forcings of these gases (2.6 W m-2), their long atmospheric residence times (~100 yr), and the planetary heating rate (0.4 W m-2). Schwartz et al. reasoned that this "warming discrepancy" could be accounted for by climate sensitivity being lower than the best estimate and/or substantial offset of greenhouse gas forcing by tropospheric aerosols, but noted that a sensitivity greater than the best estimate, together with even greater aerosol offset, is not precluded. They suggested that if greenhouse gas and aerosol precursor emissions were both abruptly halted, because the aerosol forcing would decrease rapidly (weeks), global mean temperature would rise, approaching the committed temperature increase on a decadal time scale. Knutti and Plattner (2012) argued against any discrepancy between expected and observed warming, based on climate model calculations employing current assessments of climate sensitivity, radiative forcing, and thermal disequilibrium. Schwartz et al. (2012) argued that the uncertainties in these quantities belie the apparent agreement. or perhaps (its shorter): Schwartz et al. (2010) described a "warming discrepancy" between the observed increase in GMST and that expected from LLGHG forcing alone, and reasoned that this difference could be accounted for by climate sensitivity being lower than the best estimate and/or a substantial offset of greenhouse gas forcing by tropospheric aerosols. Knutti and Plattner (2012) argued against any discrepancy between expected and observed warming, based on climate model calculations employing current assessments of climate sensitivity, radiative forcing, and thermal disequilibrium. Schwartz et al. (2012) argued that the uncertainties in these quantities belie the apparent agreement. [Stephen E Schwartz, United States of America]
reduced to a simple neutral statement that the positions of the two studies disagree, without discussing the studies in detail.
12-1171 12 63 53 63 56 suggest to delete the first part of the sentence regarding advocating or defending any thresholds, choices. Similar explanatory remarks would need to be made throughout the report if this was really necessary to be repeated specifically. [Thomas Stocker/ WGI TSU, Switzerland]
Rejected. The comment appears to refer to page 62 rather than 63. Without stating this, the discussion about 2°C can be interpreted as policy prescriptive (see comment 1133). Similar statements are made for SRES/RCP that they are simply illustrative.
12-1172 12 63 53 a instead of an. [David Erickson, United States of America] Taken into account, typo fixed.
12-1173 12 64 1 64 13 change units from PgC to 1000 Pg C and from oC PgC-1 to oC 1000PgC-1. [Thomas Stocker/ WGI TSU, Switzerland]
Taken into account, units fixed.
12-1174 12 64 12 64 13 Does "climate sensitivity" here refers to ECS? This should be made clear. [Government of Canada] Taken into account, clarified that it does.
12-1175 12 64 15 64 16 Would it be correct to say that (most of) these uncertainties are longer-term (i.e., beyond 2100)? If so, then consider making this clear here. [Government of Canada]
Rejeced. These uncertainties are similar on all timescales.
12-1176 12 64 15 64 18 There are materials in Hajima et al. (2012)* to make this paragraph more convincing : additional warming caused by non-CO2 agents in each RCP is evaluated by an ESM with some assumptions / approximations, making inter-scenario uncertainty in TCR, airborne fraction, and "CCR" (:similar to TCRE but evaluated as time-varying variable). Certainly, the relationship between cumulative emission and global warming is ALMOST constant and independent of scenarios as explained in p63 L10-11, but non-CO2 agents (and other factors such as scenario speed) can modify the TCRE in each scenario. This can be confirmed in the different slopes between Fig.12.45(e) and (h). [Tomohiro Hajima, Japan]
Taken into account, text and reference added.
12-1177 12 64 16 64 16 Since the expression "carbon cycle climate feedback" is ambiguous, it should be changed to "carbon cycle feedbacks" or "total carbon cycle feedback". [Tomohiro Hajima, Japan]
Taken into account, text changed.
12-1178 12 64 17 64 18 Could you say something about how the non-CO2 gases can be treated separately? [Jan Fuglestvedt, Norway]
Noted. There is no general way to do that, and no literature. The relationship just happens to be reasonably linear for the four RCPs.
12-1179 12 64 21 Figure 12.45: Please clarify if the numbers in panel b) are CO2 equivalent concentrations in Pg CO2 or in Taken into account. Panel b states that these are

Expert and Government Review Comments on the IPCC WGI AR5 Second Order Draft – Chapter 12
Do not Cite, Quote or Distribute Page 95 of 120
Comment No
Chapter
FromPage
FromLine
To Page
To Line Comment Response
PgC; please use the same abbreviation for CO2 equivalents throughout. [Thomas Stocker/ WGI TSU, Switzerland]
PgCO2eq. Labels changed to be consistent.
12-1180 12 64 31 Box 12.2: Since you show studies claiming negative CS in Box 12.2, Figure 2, we would suggest to mention those in the text, as well. [Thomas Stocker/ WGI TSU, Switzerland]
Rejected. The box needs to be short and only makes the overall asessment. Chapter 10 assesses each study in detail.
12-1181 12 64 33 66 9 There is considerable overlap with Section 10.8 in Chapter 10 which needs to be clarified. There are places where the text blocks are common or very, very similar. This Box 12.2 and the Section 10.8 need to be streamlined to make sure they are not duplicating each other. [Chris Forest, United States of America]
Rejected. The box makes an overall assessment, and some sentences are deliberately identical to ensure traceability from each section to the box.
12-1182 12 64 33 66 9 Box 12.2: A recent paper by Skeie et al submitted to Journal of Climate (in review) could perhaps be included in the discussion of approaches and results. [Jan Fuglestvedt, Norway]
Rejeced, paper was not accepted in time.
12-1183 12 64 33 66 9 Chapter 5 uses the term Charney climate sensitivity (CCS). And on page 5-12, line 7, they give a reference to the discussion of CCS in chapter 12. But as far as I can see, the term Charney climate sensitivity is not used in Chapter 12. I suggest some coordination here. [Jan Fuglestvedt, Norway]
Noted. Charney sensitivity is not used, chapter 5 has been notified.
12-1184 12 64 33 66 9 For Box 12.2 on climate sensitivity I suggest that there be a discussion of the implications of less negative estimates of aerosol radiative forcing -- a major new conclusion in this draft -- on estimates of climate sensitivity alongside all the other evidence on climate sensitivity. This is an obvious question that might best be placed in this box rather than in a separate FAQ. [HAROON KHESHGI, United States of America]
Taken into account. A short discussion has been added, but the numbers of the SOD have changed because the inverse estimates are no longer used in the forcing chapter.
12-1185 12 64 33 66 9 Box 12.2. This discussion of transient climate response (more generally, transient climate sensitivity) and so-called equilibrium climate sensitivity misses the key relation between the two quantities, namely the heating rate of the planet. For this heating rate proportional to the excess temperature above prior steady state, i.e., N = kappa * Delta T, then S_eq^-1 = S_tr^-1 - kappa. Schwartz S. E. Determination of Earth's transient and equilibrium climate sensitivities from observations over the twentieth century: Strong dependence on assumed forcing. Surveys Geophys. 33, 745-777 (2012). DOI 10.1007/s10712-012-9180-4 [Stephen E Schwartz, United States of America]
Noted, text not changed, since that is a synthesis of results.
12-1186 12 64 35 64 43 Break up this extremely long sentence. [Government of Australia] Taken into account, changed as proposed.
12-1187 12 64 43 64 43 You could write TCR here instead of "transient climate response" (your quotation marks). [Jonathan Gregory, United Kingdom]
Taken into account, changed as proposed.
12-1188 12 64 45 The radiative forcing for a doubling of CO2 varies from 3.7 to 3.9 w/m**2 in this chapter. Find the correct value and use it consistently. [Ronald Stouffer, United States of America]
Taken into account, reference added.
12-1189 12 64 45 suggest to add reference for the "2x CO2 (3.7 W/m2)" scaling factor [Thomas Stocker/ WGI TSU, Switzerland] Taken into account, reference added.
12-1190 12 64 47 64 55 It might be important here to refer back to the caveats presented on page 12-62. [Government of United States of America]
Taken into account, text added as proposed.
12-1191 12 64 49 64 49 Should "climate sensitivity" here be "equilibrium climate sensitivity"? [Government of Canada] Taken into account, changed as proposed.
12-1192 12 64 49 It is very difficult to reconcile such high values of equilibrium sensitivity with the new, reduced estimate of aerosol/cloud interaction ("indirect forcing") and high net forcing over the industrial period given in the current AR5 draft! If the CMIP5 models had been run with aerosol input giving such a low aerosol forcing I doubt that the agreement between models and observations would have been as good as shown in Figure 9.8, page 9-174. [Henning Rodhe, Sweden]
Taken into account. The second order draft used indirect estimates to estimate the aerosol forcing, which is problematic because those make an assumption about climate sensitivity at the same time. The final draft will estimate the aersol forcing without indirect estimates, resulting in a larger range, and the consistency of forcing and climate sensitivity with the observed warming is discussed separately.
12-1193 12 64 53 Chapter 10.8 has a discussion of recent low estimates, - crosslink [Gabriele Hegerl, United Kingdom] Taken into account, reference added.
Expert and Government Review Comments on the IPCC WGI AR5 Second Order Draft – Chapter 12
Do not Cite, Quote or Distribute Page 96 of 120
Comment No
Chapter
FromPage
FromLine
To Page
To Line Comment Response
12-1194 12 65 1 Box 12.2, Figure 1, caption: should refer to IPCC AR5 rather than AR4. [Thomas Stocker/ WGI TSU, Switzerland]
Taking into account, reference fixed (AR4 Box. 10.2, not AR5 Box 12.2).
12-1195 12 65 19 65 21 The following recently published paper argues that scientists' knowledge about variables such as climate sensitivity can not be represented in terms of probabilities. Rather their understanding has an element of ambiguity. It would be worth referencing this point here. And also elsewhere in the IPCC WG1 report where expert elcitation is referred to. Reference: Millner, A., Calel, R., Stainforth, D. & MacKerron, G. Do probabilistic expert elicitations capture scientists’ uncertainty about climate change? Climatic Change, 1-10, doi:10.1007/s10584-012-0620-4 (2012). [David Stainforth, United Kingdom]
Accepted, reference added.
12-1196 12 65 25 65 25 "greater about" --> "greater than about" [David Stainforth, United Kingdom] Taken into account, fixed typo.
12-1197 12 65 29 "less convincing" might be better than "less compelling". Simpler still would be to change "less compelling" to "poorer" or "worse", though this might be considered a bit too blunt. [Adrian Simmons, United Kingdom]
Taken into account, changed as proposed.
12-1198 12 65 39 65 39 Including "at multi-century timescales" after "… meet a given temperature target" could clarify this statement and indicate the importance of these ESS timescales for staying below a given temperature limit during this century. [Joeri Rogelj, Switzerland]
Taken into account, changed as proposed.
12-1199 12 65 44 65 45 ---TCR is a more accurate and hence usuful indicator--- "more accurate" may not be appropriate in this case. Perhaps " better determined" may be suited. [Taroh Matsuno, Japan]
Rejected. We feel the wording is approriate.
12-1200 12 65 46 It appears if more recent studies are weighted more heavily, the TCR is likely <2.4C rather than 2.6C. [Stephen Gaalema, United States of America]
Noted. This appears to be the judgement of the reviewer, but no specific evidence is given to support the statement. Recent studies are indeed given more weight.
12-1201 12 65 46 TCR - Is this defined somewhere? Is the reference included? [Ronald Stouffer, United States of America] Rejected. A definition and reference to the glossary is given an the start of the box.
12-1202 12 65 49 65 49 Where in ch 9? please give more exact ref. [Government of Germany] Taken into accout, section given.
12-1203 12 66 1 66 7 change units from PgC to 1000 Pg C and from oC PgC-1 to 1000 oC PgC-1. [Thomas Stocker/ WGI TSU, Switzerland]
Taken into account, units fixed.
12-1204 12 66 2 66 2 Is the unit correct here? I.e. emission of 1 GtC (or 1 PgC) leads to a temperature increase of 0.8-3°C? Anthropogenic C emissions per year are already 6-8 GtC (or Pg) [European Union]
Taken into account, units fixed.
12-1205 12 66 2 TCRE - Is this defined somewhere? Is the reference included? Vegetation changes included? [Ronald Stouffer, United States of America]
Taken into account, definition and reference to glossary added.
12-1206 12 66 11 66 57 As mentioned in an earlier comment, it would be good if the text could be somewhat more clear on the issue of non-CO2 components. Given the strong focus on short-lived climate forcers internationally there are many readers that would find it useful to get some more information on the importance of this group of components. [Jan Fuglestvedt, Norway]
Partly taken into account. The text (SOD page 66 line 33ff) mentions the non-CO2 components clearly, but it's difficult to say anything quantitative withouth knowing the magnitude of these forcings.
12-1207 12 66 11 Section 12.5.4.2: I find this section very important and it could be improved by giving some more clear guidance to users on how the various concepts can be used and not used. I also think that the text could be clearer regarding the effect or "error" of leaving out the non-CO2 components. It would be good to get some clearer assessment of the applicability and limitations of the cumulative carbon approach. [Jan Fuglestvedt, Norway]
Partly taken into account. The text (SOD page 66 line 33ff) mentions the non-CO2 components clearly, but it's difficult to say anything quantitative withouth knowing the magnitude of these forcings.
12-1208 12 66 13 66 14 Re "One general limitation….": I sugges that you write limitation of what. In the following text, many concepts are discussed. [Jan Fuglestvedt, Norway]
Taken into account, tex clarified.
12-1209 12 66 17 66 18 Evidence for the long timescales of deep ocean warming and associated sea level rise is also provided in Zickfeld et al. (2012), J. Clim., submitted. [Kirsten Zickfeld, Canada]
Taken into account, reference to Zickfeld and Fig. 12.44d added.
12-1210 12 66 18 66 18 Bouttes et al (in press with J Climate), Zickfeld et al (2012) and Stouffer et al (1999) show that the amount of ocean heat uptake and hence thermal expansion depends on the pathway of CO2 emissions, not just on the
Partly taken into account. The first paragraph in 12.5.4.3. states much of that already upfront. An
Expert and Government Review Comments on the IPCC WGI AR5 Second Order Draft – Chapter 12
Do not Cite, Quote or Distribute Page 97 of 120
Comment No
Chapter
FromPage
FromLine
To Page
To Line Comment Response
cumulative CO2 emission. This no doubt applies to other aspects of the system which are not diagnostically related to global temperature. Hence the focus on TCRE and climate change per GtC emitted, while attractive, as the next para remarks, may be a misleading oversimplification. If policy objectives focus only on cumulative C emissions, they will not be paying sufficient attention to other climate changes, such as from sea level rise, which might also be policy-relevant. I would suggest that this is an important message which ought to be plainly stated, in order to counteract the strong impression given by the large amount of material (such as the next para) that cumulative C emission and global mean temperature are the only subjects of interest for targets. [Jonathan Gregory, United Kingdom]
additional sentence on sea level rise and the pathway dependency was added as proposed, including references.
12-1211 12 66 22 65 57 The discussion here follows the first sentence saying "The simplicity of the concept of a cumulative carbon budget makes it attractive for policy(WBGU, 2009)", so it is desired to make a comparison with another policy,i.e., setting stabilisation target, where stabilisation is the one in ordinary sense. However there is no argument to mention the comparison. Many points are made as limitation of the cumulative budget concept, but many of them appear to be common dificulties to setting ordinary stabilisation target. If this understanding on the purpose of the para is correct, please make the discussions clearer(or easier) for comparison of the two. [Taroh Matsuno, Japan]
Partly accepted. An additional statement was added to note that many of the limitations also apply to other policies. However, it is not the mandate to discuss policy options in WG1.
12-1212 12 66 26 66 26 Replace "reduce" with "reduced" [Government of Germany] Taken into account, typo fixed.
12-1213 12 66 29 66 30 Specifically, the time-constancy and scenario-independence of TCRE comes about from the cancellation of variations in the increase in radiative forcing per ppm of CO2 (because of the logarithmic dependence), the ocean heat uptake efficiency and the airborne fraction (Matthews et al 2009, Gregory et al 2009). [Jonathan Gregory, United Kingdom]
Accepted. Clarification added.
12-1214 12 66 31 66 32 The dependence of the allowed cumulative emissions on climate sensitivity and carbon cycle feedbacks is explored in depth in Zickfeld, K., M. Eby, H.D. Matthews, and A.J. Weaver, 2009, Setting cumulative emissions targets to reduce the risk of dangerous climate change, Proceedings of the National Academy of Science, 106(38): 16129-16134. [Kirsten Zickfeld, Canada]
Accepted. Reference added.
12-1215 12 66 32 66 32 Is reference to Fig. 12.43 correct? [Kirsten Zickfeld, Canada] Taken into account typo fixed.
12-1216 12 66 35 66 35 You write "separate emission budgets" but I guess you could add "and climate modelling" (or something like that) since one also needs to know the following RF and dT? [Jan Fuglestvedt, Norway]
Accepted. Changed as suggested.
12-1217 12 66 36 66 36 Is it possible to be more quantitative here (instead of just non-negligible) ? [Jan Fuglestvedt, Norway] Accepted. Added some numbers from the cited papers.
12-1218 12 66 36 66 38 Non-neglibile temperature effects after cessation of emissions of short-lived gases is also discussed in Zickfeld, K., M. Eby, H.D. Matthews, and A.J. Weaver, 2009, Setting cumulative emissions targets to reduce the risk of dangerous climate change, Proceedings of the National Academy of Science, 106(38): 16129-16134. [Kirsten Zickfeld, Canada]
Accepted. Reference added.
12-1219 12 66 47 66 47 This para is very long. Perhaps this would be a good point for a paragraph break. [Jonathan Gregory, United Kingdom]
Accepted. Changed as suggested.
12-1220 12 66 47 66 53 The reference for the ENSEMBLE EU project is Hwitt & Griggs 2004 (EOS85,556 [Government of France] Rejected. Comment uncler, text on this page does not refer to ENSEMBLES.
12-1221 12 66 48 66 57 change units to PgC_eq yr-1 instead of GtCO2_eq yr-1; change oC PgC-1 to oC 1000PgC-1; change GtC to PgC [Thomas Stocker/ WGI TSU, Switzerland]
Accepted
12-1222 12 66 48 According to the rules, we should only refer to peer reviewed appers; so I guess it not OK to refer to a UNEP report. [Jan Fuglestvedt, Norway]
Rejected. Non peer reviewed literature can be cited if it's quality is assessed to be adequate. In addition those reports are reviewed internally.
12-1223 12 66 50 66 50 here and in figure 12.46, when using GtCO2 as units can you also quote GtC (maybe as an axis on the RHS of the figure). [Chris Jones, United Kingdom of Great Britain & Northern Ireland]
Rejected.
12-1224 12 66 51 66 51 Please correct the right reference to the sentence starting with "Note that, as opposed…". [Government of Accepted, figure number changed.

Expert and Government Review Comments on the IPCC WGI AR5 Second Order Draft – Chapter 12
Do not Cite, Quote or Distribute Page 98 of 120
Comment No
Chapter
FromPage
FromLine
To Page
To Line Comment Response
Germany]
12-1225 12 66 51 66 52 It is not clear what is said here. In the Fig 12.46c/d, temperatures of the lowest emissions scenarios lie in a range centered at about 1.6deg C at 2100 and tends to decline very slightly. So, negative emissions may not be necessary beyond 2100. Perhps Fig 12.46a/b treat CO2 only, for that negative emissions are required to allow additional emissions of non-CO2 GHGs, while c/d include non-CO2 GHGs and total becomes positve. [Taroh Matsuno, Japan]
Accepted. Sentence clarified to say temperatures may exceed the threshold depending on emissions after 2100.
12-1226 12 66 51 66 52 This statement is not totally consistent with what is written higher above, in particular those in the first paragraph of section 12.5.4 "an exact climate stabilization which would require perpetual non-zero positive emissions to counteract the otherwise ineluctable long-term slow decrease in global temperature". [Joeri Rogelj, Switzerland]
Accepted. Sentence clarified to say temperatures may exceed the threshold depending on emissions after 2100.
12-1227 12 67 13 73 21 Section 12.5.5: This section appears to be based entirely upon modeling results. Given that abrupt and threshold processes may be best modeled as phase change or critical-point systems, it is appropriate to make comments regarding the suitability of climate modeling systems to effectively represent threshold or tipping point behavior. The study by Eisenman and Wettlaufer (2009) in particular is a good example of modeling developed specifically to address threshold behavior. It is unclear whether other threshold systems have been modeled in similar ways. If so, that should be explicitly noted (as was done for the sea ice discussion). [Government of United States of America]
Noted. We already have the following sentence included: "Abrupt changes that arise from nonlinearities within the climate system are inherently difficult to assess and their timing, if any, of future occurrence is very likely impossible to predict. "
12-1228 12 67 13 73 21 Section 12.5.5 Potentially Abrupt or Irreversible Changes: Text was checked for inconsistencies with own professional experience and competency. No relevant disagreements were detected with considered text. [Dirk Thielen, Venezuela]
Noted
12-1229 12 67 13 Sec 12.5.5 In general – is there a link from this section on abrupt changes to the section on committed changes? e.g. when discussing that ice sheets are unlikely to suffer abrupt change this century it could be the case though that they pass a climate threshold beyond which some abrupt change is committed. e.g. if 2 degrees is enough to eventually cause substantial Greenland ice-sheet loss, then we might pass this threshold this century even if the ice-sheet loss is not realised this century. It's not clear if this discussion should be under “abrupt” or “commitment” sections, but shouldn't be neglected [Chris Jones, United Kingdom of Great Britain & Northern Ireland]
Noted. In this section we assess the long term potential commitment to irreversible processes where possible. In the case of ice sheets, we note this: "an irreversible decrease of the Greenland Ice Sheet due to surface mass balance changes appears very unlikely in the 21st century and likely on multi-centennial to millennial time scales in the strongest forcing scenarios."
12-1230 12 67 17 67 21 "For the purposes of this section, we adopt..." -> The definition used in this section is the definition in the WGI AR5 Glossary, and thus, we suggest this to be written more generally as "This report adopts the definition of abrupt climate change used in the Synthesis and Assessment Product 3.4 of the US CCSP .......' and should include a reference to the glossary where this definition is provided. [Thomas Stocker/ WGI TSU, Switzerland]
Accepted. Glossary reference and text modified
12-1231 12 67 17 67 23 Section 12.5.5.1: The new AR5 definition of abrupt climate change as a “large-scale change in the climate system that takes place over a few decades or less, persists … for at least a few decades *and* causes substantial disruptions in human natural systems” is most appropriate for impact assessment of potential future climate change. It not only considers the dynamics of the natural system, but also the response of human and natural systems to this type of climate change. Interestingly enough, the discussion in 12.5.5 focusses on the dynamics of the natural system only. Impact on human and natural systems is not assessed. I suppose, it is implicitly assumed that any large-scale climate change which happens within a few decades will have strong impact on human and natural systems. This assumption could be stated explicitly. [Martin Claussen, Germany]
Noted. The potential impacts of abrupt climate change on human and natural systems will be discussed in the WGIII report.
12-1232 12 67 18 67 21 The definition of “abrupt climate change” as currently written includes internal climate variability with multidecadal timescale and the global-mean surface temperature change of the end of the twentieth century. Both are large-scale, take place over a few decades, and persist for a few decades. Neither of these fit standard interpretations of the term “abrupt climate change”, but they satisfy the AR5 definition. This seems problematic. [Timothy Merlis, United States of America]
This text appeared in the AR4 Glossary under abrupt climate change. "The nonlinearity of the climate system may lead to abrupt climate change, sometimes called rapid climate change, abrupt events or even surprises. The term abrupt often refers to time scales faster than the typical time scale of the responsible forcing. However, not all abrupt climate changes need be externally forced. Some possible
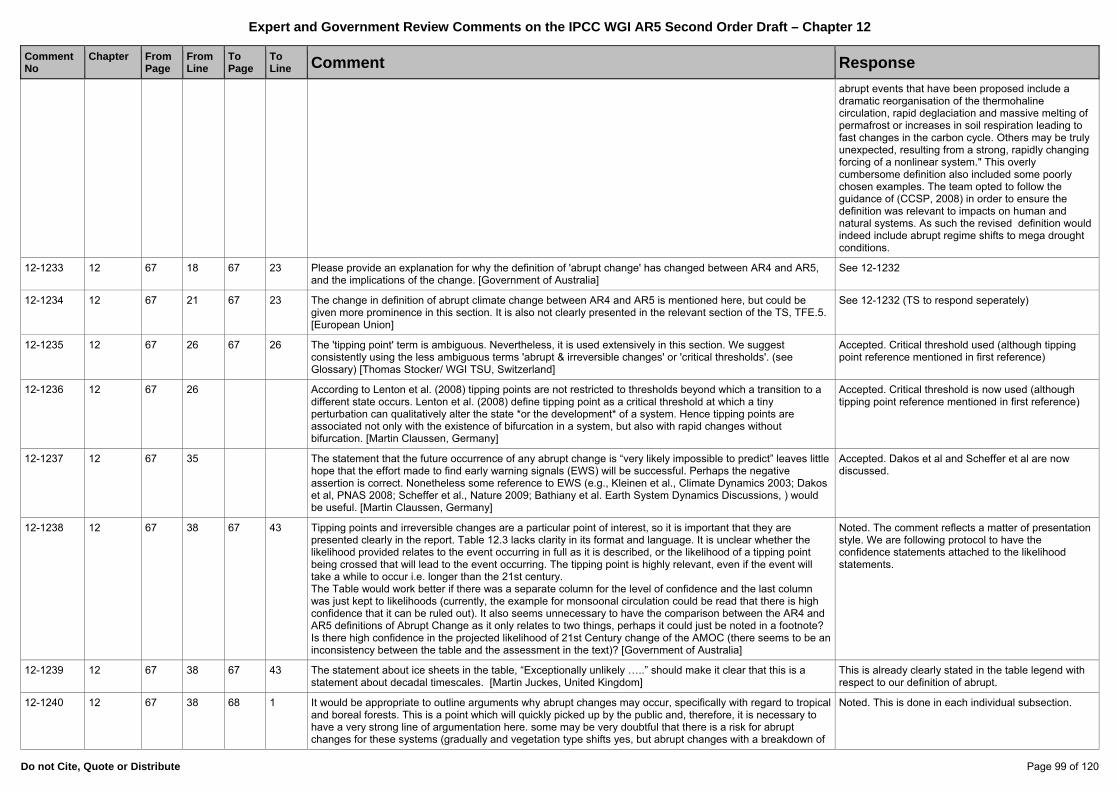
Expert and Government Review Comments on the IPCC WGI AR5 Second Order Draft – Chapter 12
Do not Cite, Quote or Distribute Page 99 of 120
Comment No
Chapter
FromPage
FromLine
To Page
To Line Comment Response
abrupt events that have been proposed include a dramatic reorganisation of the thermohaline circulation, rapid deglaciation and massive melting of permafrost or increases in soil respiration leading to fast changes in the carbon cycle. Others may be truly unexpected, resulting from a strong, rapidly changing forcing of a nonlinear system." This overly cumbersome definition also included some poorly chosen examples. The team opted to follow the guidance of (CCSP, 2008) in order to ensure the definition was relevant to impacts on human and natural systems. As such the revised definition would indeed include abrupt regime shifts to mega drought conditions.
12-1233 12 67 18 67 23 Please provide an explanation for why the definition of 'abrupt change' has changed between AR4 and AR5, and the implications of the change. [Government of Australia]
See 12-1232
12-1234 12 67 21 67 23 The change in definition of abrupt climate change between AR4 and AR5 is mentioned here, but could be given more prominence in this section. It is also not clearly presented in the relevant section of the TS, TFE.5. [European Union]
See 12-1232 (TS to respond seperately)
12-1235 12 67 26 67 26 The 'tipping point' term is ambiguous. Nevertheless, it is used extensively in this section. We suggest consistently using the less ambiguous terms 'abrupt & irreversible changes' or 'critical thresholds'. (see Glossary) [Thomas Stocker/ WGI TSU, Switzerland]
Accepted. Critical threshold used (although tipping point reference mentioned in first reference)
12-1236 12 67 26 According to Lenton et al. (2008) tipping points are not restricted to thresholds beyond which a transition to a different state occurs. Lenton et al. (2008) define tipping point as a critical threshold at which a tiny perturbation can qualitatively alter the state *or the development* of a system. Hence tipping points are associated not only with the existence of bifurcation in a system, but also with rapid changes without bifurcation. [Martin Claussen, Germany]
Accepted. Critical threshold is now used (although tipping point reference mentioned in first reference)
12-1237 12 67 35 The statement that the future occurrence of any abrupt change is “very likely impossible to predict” leaves little hope that the effort made to find early warning signals (EWS) will be successful. Perhaps the negative assertion is correct. Nonetheless some reference to EWS (e.g., Kleinen et al., Climate Dynamics 2003; Dakos et al, PNAS 2008; Scheffer et al., Nature 2009; Bathiany et al. Earth System Dynamics Discussions, ) would be useful. [Martin Claussen, Germany]
Accepted. Dakos et al and Scheffer et al are now discussed.
12-1238 12 67 38 67 43 Tipping points and irreversible changes are a particular point of interest, so it is important that they are presented clearly in the report. Table 12.3 lacks clarity in its format and language. It is unclear whether the likelihood provided relates to the event occurring in full as it is described, or the likelihood of a tipping point being crossed that will lead to the event occurring. The tipping point is highly relevant, even if the event will take a while to occur i.e. longer than the 21st century. The Table would work better if there was a separate column for the level of confidence and the last column was just kept to likelihoods (currently, the example for monsoonal circulation could be read that there is high confidence that it can be ruled out). It also seems unnecessary to have the comparison between the AR4 and AR5 definitions of Abrupt Change as it only relates to two things, perhaps it could just be noted in a footnote? Is there high confidence in the projected likelihood of 21st Century change of the AMOC (there seems to be an inconsistency between the table and the assessment in the text)? [Government of Australia]
Noted. The comment reflects a matter of presentation style. We are following protocol to have the confidence statements attached to the likelihood statements.
12-1239 12 67 38 67 43 The statement about ice sheets in the table, “Exceptionally unlikely …..” should make it clear that this is a statement about decadal timescales. [Martin Juckes, United Kingdom]
This is already clearly stated in the table legend with respect to our definition of abrupt.
12-1240 12 67 38 68 1 It would be appropriate to outline arguments why abrupt changes may occur, specifically with regard to tropical and boreal forests. This is a point which will quickly picked up by the public and, therefore, it is necessary to have a very strong line of argumentation here. some may be very doubtful that there is a risk for abrupt changes for these systems (gradually and vegetation type shifts yes, but abrupt changes with a breakdown of
Noted. This is done in each individual subsection.

Expert and Government Review Comments on the IPCC WGI AR5 Second Order Draft – Chapter 12
Do not Cite, Quote or Distribute Page 100 of 120
Comment No
Chapter
FromPage
FromLine
To Page
To Line Comment Response
forest functions, no) [European Union]
12-1241 12 67 38 Table 12.3, the “phenomenon” column is more a list of “things” than “phenomenon” - can this also include what fate of the thing you are talking about? e.g. don't say “tropical forest” but “dieback of tropical forest”, “large release of methane” etc [Chris Jones, United Kingdom of Great Britain & Northern Ireland]
Accepted. We have changed 'phenomenon' to 'component of the climate system' (as referenced in Table caption).
12-1242 12 67 38 Table 12.3: Table was checked for inconsistencies with own professional experience and competency. No relevant disagreements were detected. [Dirk Thielen, Venezuela]
Noted
12-1243 12 67 43 67 43 the statement in the table that it is "very unlikely that the MOC will undergo a rapid transition (high confidence)" seems overstated given that many of the models get the mean AMOC wrong and that about half get the S. Atlantic freshwater flux wrong (Weaver et al., 2012) which probably means that they are too stable. [Meric Srokosz, United Kingdom of Great Britain & Northern Ireland]
Rejected. Our assessment is consistent with the evidence and with the model analysis of Weaver et al (2012) and with the AR4 and CCSP assessments. New information since the AR4 has increased our confidence in this assessment.
12-1244 12 67 43 68 1 The evidence presented in the chapter for abrupt or irreversible changes in “Monsoonal Circulations” and “AMOC” seems comparable: in support, there are simplified (non-GCM) models that display such behavior, but comprehensive GCM simulations do not display abrupt behavior. In the table 12.3 of abrupt or irreversible climate changes “Monsoonal Circulations” has the likelihood of “Cannot be ruled out (low confidence)”, but “AMOC” is “Very unlikely to undergo a rapid transition”. If the comprehensive simulations of monsoons and AMOC are equally clear that abrupt changes are unlikely, it seems like they should both have the same likeliness in table 12.3. (The text in the chapter reads “...it is unlikely that an abrupt transition to the dry summer monsoon regime will be triggered in the 21st century”, which is different than the description in the table.) [Timothy Merlis, United States of America]
Rejected. Ths AMOC assessment has a higher confidence as it has been specifically assessed over many Assesment Reports going back to the SAR. Also, the wealth of literature on which to form the assessment is much broader.
12-1245 12 67 43 Table 12.3 the statement regarding the potential for abrupt change in W Antarctic and Greenland ice sheets "excepionally unlikely" in 21st century is odd given that elsewhere it is stated that the ice dynamics have not been modelled and our knowledge on them is incomplete.. [Judy Lawrence, New Zealand]
There had been such an assessment in Ch13, at least for Greenland, but the section number in the SOD was wrong. Chapter 13 will contain an assessment we can then refer to concerning this specific point. Note that the point concerns only the 21st century, for which we can be confident enough to state complete disintegration during the century is very very unlikey. One could imagine that disintegration processes could be initiated in the 21st century, though. This is now mentioned in the text (reference to Chapter 13).
12-1246 12 67 43 The new Table 12.3 is really helpful in categorising the types of vulnerability for each system. A couple of other elements you might want to consider for the table are global precipitation and Southern Ocean nutrient supply. Both are "No, No, No" in the table (i.e. irreversibility or at least long-delayed recovery is the issue). References are Wu et al 2010 and Boucher et al 2012, which you already have. [Richard Wood, United Kingdom]
Noted. We felt the others were not as prevalent in the liuterature
12-1247 12 68 3 The Mediterranean thermohaline circulation is also expected to be strongly affected by climate change (Somot et al. 2006; Planton et al, 2012) [Government of France]
Noted. Regional changes are covered in Chapter 14. In particuylar, Mediterranean changes are covered in Section 14.7.6
12-1248 12 68 7 The inventor of the acronym FAMOUS is doubtless proud of it, and it doubtless works well in some circumstances. But I would suggest changing "the FAMOUS" to "one" in the present instance. [Adrian Simmons, United Kingdom]
Accepted
12-1249 12 68 14 68 14 Sijp et al. (2012) 10.1175/2011JCLI4245.1 argue, with analysis of the UVic model, that this indicator is not reliable. [Jonathan Gregory, United Kingdom]
Rejected. Sijp et al do not discuss or refer to any of: Drijfhout et al., 2010; Hofmann and Rahmstorf, 2009; De Vries and Weber (2005), Dijkstra (2007), Weber et al. (2007), Huisman et al. (2010), Drijfhout et al. (2010) or Hawkins et al. (2011)
12-1250 12 68 19 68 19 in addition to Hawkins et al. (2011) reference should be made to the observations of the S. Atlantic freshwater flux by Bryden et al. (2011) J. Mar.Res. [Meric Srokosz, United Kingdom of Great Britain & Northern Ireland]
Accepted
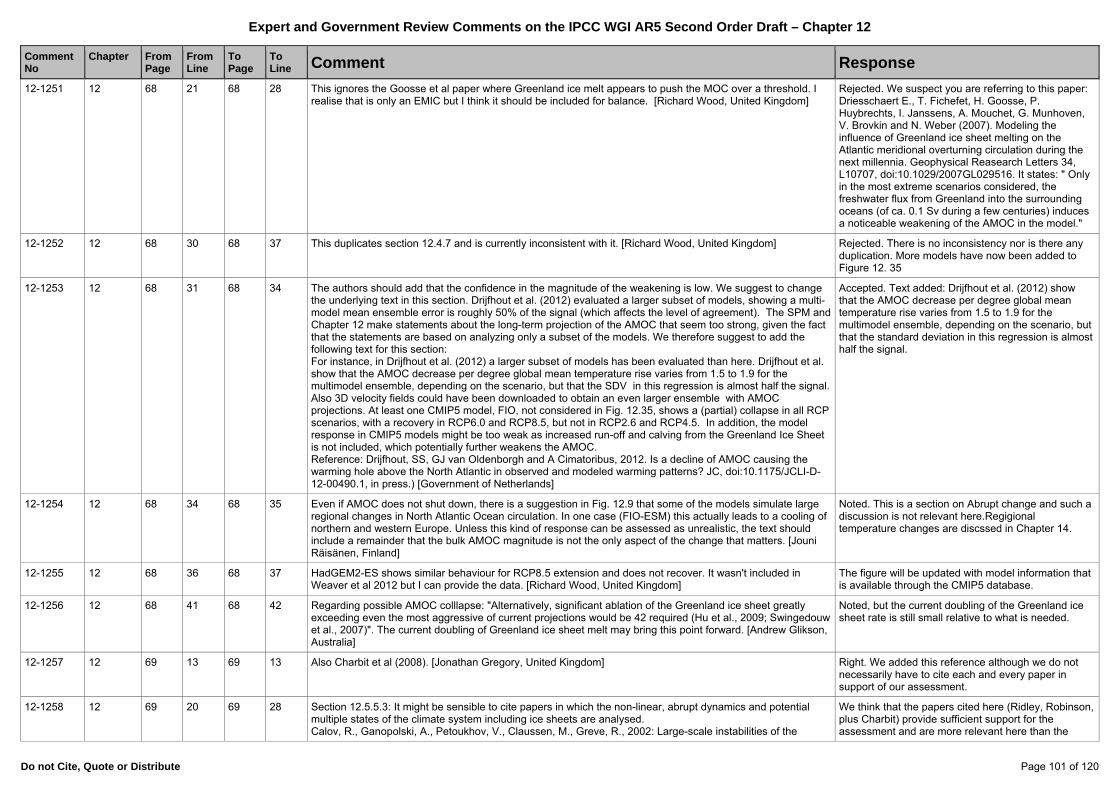
Expert and Government Review Comments on the IPCC WGI AR5 Second Order Draft – Chapter 12
Do not Cite, Quote or Distribute Page 101 of 120
Comment No
Chapter
FromPage
FromLine
To Page
To Line Comment Response
12-1251 12 68 21 68 28 This ignores the Goosse et al paper where Greenland ice melt appears to push the MOC over a threshold. I realise that is only an EMIC but I think it should be included for balance. [Richard Wood, United Kingdom]
Rejected. We suspect you are referring to this paper: Driesschaert E., T. Fichefet, H. Goosse, P. Huybrechts, I. Janssens, A. Mouchet, G. Munhoven, V. Brovkin and N. Weber (2007). Modeling the influence of Greenland ice sheet melting on the Atlantic meridional overturning circulation during the next millennia. Geophysical Reasearch Letters 34, L10707, doi:10.1029/2007GL029516. It states: " Only in the most extreme scenarios considered, the freshwater flux from Greenland into the surrounding oceans (of ca. 0.1 Sv during a few centuries) induces a noticeable weakening of the AMOC in the model."
12-1252 12 68 30 68 37 This duplicates section 12.4.7 and is currently inconsistent with it. [Richard Wood, United Kingdom] Rejected. There is no inconsistency nor is there any duplication. More models have now been added to Figure 12. 35
12-1253 12 68 31 68 34 The authors should add that the confidence in the magnitude of the weakening is low. We suggest to change the underlying text in this section. Drijfhout et al. (2012) evaluated a larger subset of models, showing a multi-model mean ensemble error is roughly 50% of the signal (which affects the level of agreement). The SPM and Chapter 12 make statements about the long-term projection of the AMOC that seem too strong, given the fact that the statements are based on analyzing only a subset of the models. We therefore suggest to add the following text for this section: For instance, in Drijfhout et al. (2012) a larger subset of models has been evaluated than here. Drijfhout et al. show that the AMOC decrease per degree global mean temperature rise varies from 1.5 to 1.9 for the multimodel ensemble, depending on the scenario, but that the SDV in this regression is almost half the signal. Also 3D velocity fields could have been downloaded to obtain an even larger ensemble with AMOC projections. At least one CMIP5 model, FIO, not considered in Fig. 12.35, shows a (partial) collapse in all RCP scenarios, with a recovery in RCP6.0 and RCP8.5, but not in RCP2.6 and RCP4.5. In addition, the model response in CMIP5 models might be too weak as increased run-off and calving from the Greenland Ice Sheet is not included, which potentially further weakens the AMOC. Reference: Drijfhout, SS, GJ van Oldenborgh and A Cimatoribus, 2012. Is a decline of AMOC causing the warming hole above the North Atlantic in observed and modeled warming patterns? JC, doi:10.1175/JCLI-D-12-00490.1, in press.) [Government of Netherlands]
Accepted. Text added: Drijfhout et al. (2012) show that the AMOC decrease per degree global mean temperature rise varies from 1.5 to 1.9 for the multimodel ensemble, depending on the scenario, but that the standard deviation in this regression is almost half the signal.
12-1254 12 68 34 68 35 Even if AMOC does not shut down, there is a suggestion in Fig. 12.9 that some of the models simulate large regional changes in North Atlantic Ocean circulation. In one case (FIO-ESM) this actually leads to a cooling of northern and western Europe. Unless this kind of response can be assessed as unrealistic, the text should include a remainder that the bulk AMOC magnitude is not the only aspect of the change that matters. [Jouni Räisänen, Finland]
Noted. This is a section on Abrupt change and such a discussion is not relevant here.Regigional temperature changes are discssed in Chapter 14.
12-1255 12 68 36 68 37 HadGEM2-ES shows similar behaviour for RCP8.5 extension and does not recover. It wasn't included in Weaver et al 2012 but I can provide the data. [Richard Wood, United Kingdom]
The figure will be updated with model information that is available through the CMIP5 database.
12-1256 12 68 41 68 42 Regarding possible AMOC colllapse: "Alternatively, significant ablation of the Greenland ice sheet greatly exceeding even the most aggressive of current projections would be 42 required (Hu et al., 2009; Swingedouw et al., 2007)". The current doubling of Greenland ice sheet melt may bring this point forward. [Andrew Glikson, Australia]
Noted, but the current doubling of the Greenland ice sheet rate is still small relative to what is needed.
12-1257 12 69 13 69 13 Also Charbit et al (2008). [Jonathan Gregory, United Kingdom] Right. We added this reference although we do not necessarily have to cite each and every paper in support of our assessment.
12-1258 12 69 20 69 28 Section 12.5.5.3: It might be sensible to cite papers in which the non-linear, abrupt dynamics and potential multiple states of the climate system including ice sheets are analysed. Calov, R., Ganopolski, A., Petoukhov, V., Claussen, M., Greve, R., 2002: Large-scale instabilities of the
We think that the papers cited here (Ridley, Robinson, plus Charbit) provide sufficient support for the assessment and are more relevant here than the
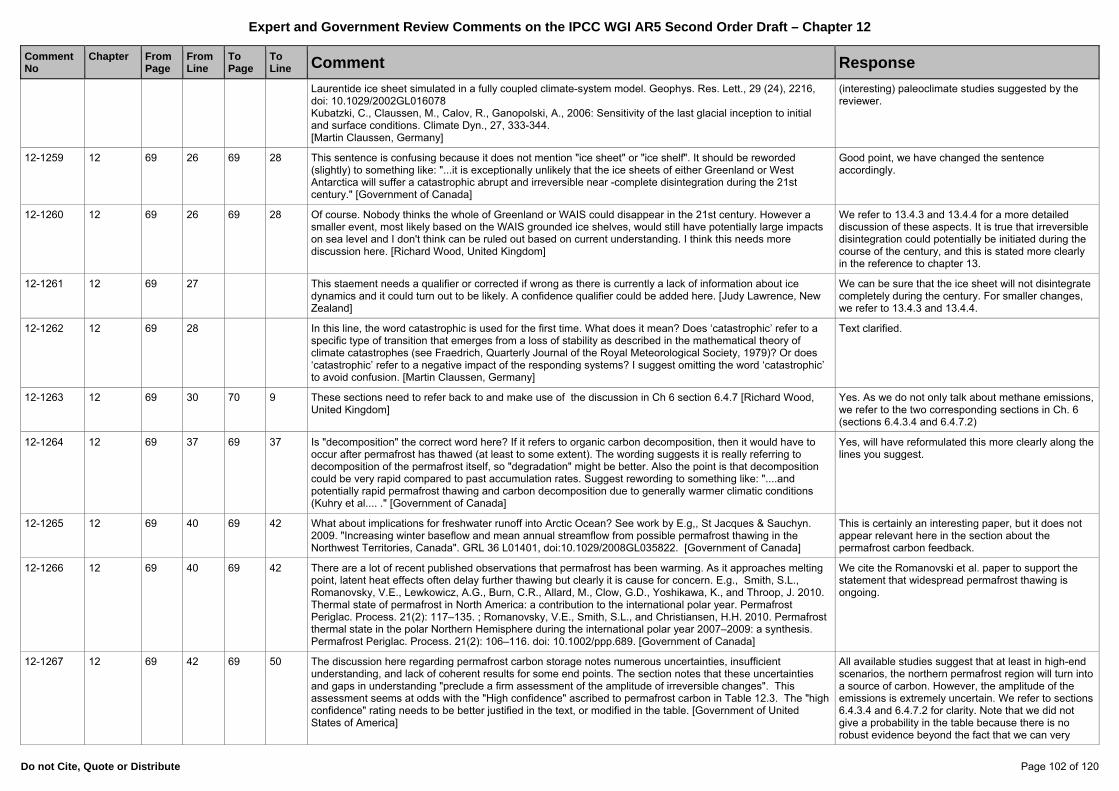
Expert and Government Review Comments on the IPCC WGI AR5 Second Order Draft – Chapter 12
Do not Cite, Quote or Distribute Page 102 of 120
Comment No
Chapter
FromPage
FromLine
To Page
To Line Comment Response
Laurentide ice sheet simulated in a fully coupled climate-system model. Geophys. Res. Lett., 29 (24), 2216, doi: 10.1029/2002GL016078 Kubatzki, C., Claussen, M., Calov, R., Ganopolski, A., 2006: Sensitivity of the last glacial inception to initial and surface conditions. Climate Dyn., 27, 333-344. [Martin Claussen, Germany]
(interesting) paleoclimate studies suggested by the reviewer.
12-1259 12 69 26 69 28 This sentence is confusing because it does not mention "ice sheet" or "ice shelf". It should be reworded (slightly) to something like: "...it is exceptionally unlikely that the ice sheets of either Greenland or West Antarctica will suffer a catastrophic abrupt and irreversible near -complete disintegration during the 21st century." [Government of Canada]
Good point, we have changed the sentence accordingly.
12-1260 12 69 26 69 28 Of course. Nobody thinks the whole of Greenland or WAIS could disappear in the 21st century. However a smaller event, most likely based on the WAIS grounded ice shelves, would still have potentially large impacts on sea level and I don't think can be ruled out based on current understanding. I think this needs more discussion here. [Richard Wood, United Kingdom]
We refer to 13.4.3 and 13.4.4 for a more detailed discussion of these aspects. It is true that irreversible disintegration could potentially be initiated during the course of the century, and this is stated more clearly in the reference to chapter 13.
12-1261 12 69 27 This staement needs a qualifier or corrected if wrong as there is currently a lack of information about ice dynamics and it could turn out to be likely. A confidence qualifier could be added here. [Judy Lawrence, New Zealand]
We can be sure that the ice sheet will not disintegrate completely during the century. For smaller changes, we refer to 13.4.3 and 13.4.4.
12-1262 12 69 28 In this line, the word catastrophic is used for the first time. What does it mean? Does ‘catastrophic’ refer to a specific type of transition that emerges from a loss of stability as described in the mathematical theory of climate catastrophes (see Fraedrich, Quarterly Journal of the Royal Meteorological Society, 1979)? Or does ‘catastrophic’ refer to a negative impact of the responding systems? I suggest omitting the word ‘catastrophic’ to avoid confusion. [Martin Claussen, Germany]
Text clarified.
12-1263 12 69 30 70 9 These sections need to refer back to and make use of the discussion in Ch 6 section 6.4.7 [Richard Wood, United Kingdom]
Yes. As we do not only talk about methane emissions, we refer to the two corresponding sections in Ch. 6 (sections 6.4.3.4 and 6.4.7.2)
12-1264 12 69 37 69 37 Is "decomposition" the correct word here? If it refers to organic carbon decomposition, then it would have to occur after permafrost has thawed (at least to some extent). The wording suggests it is really referring to decomposition of the permafrost itself, so "degradation" might be better. Also the point is that decomposition could be very rapid compared to past accumulation rates. Suggest rewording to something like: "....and potentially rapid permafrost thawing and carbon decomposition due to generally warmer climatic conditions (Kuhry et al.... ." [Government of Canada]
Yes, will have reformulated this more clearly along the lines you suggest.
12-1265 12 69 40 69 42 What about implications for freshwater runoff into Arctic Ocean? See work by E.g,, St Jacques & Sauchyn. 2009. "Increasing winter baseflow and mean annual streamflow from possible permafrost thawing in the Northwest Territories, Canada". GRL 36 L01401, doi:10.1029/2008GL035822. [Government of Canada]
This is certainly an interesting paper, but it does not appear relevant here in the section about the permafrost carbon feedback.
12-1266 12 69 40 69 42 There are a lot of recent published observations that permafrost has been warming. As it approaches melting point, latent heat effects often delay further thawing but clearly it is cause for concern. E.g., Smith, S.L., Romanovsky, V.E., Lewkowicz, A.G., Burn, C.R., Allard, M., Clow, G.D., Yoshikawa, K., and Throop, J. 2010. Thermal state of permafrost in North America: a contribution to the international polar year. Permafrost Periglac. Process. 21(2): 117–135. ; Romanovsky, V.E., Smith, S.L., and Christiansen, H.H. 2010. Permafrost thermal state in the polar Northern Hemisphere during the international polar year 2007–2009: a synthesis. Permafrost Periglac. Process. 21(2): 106–116. doi: 10.1002/ppp.689. [Government of Canada]
We cite the Romanovski et al. paper to support the statement that widespread permafrost thawing is ongoing.
12-1267 12 69 42 69 50 The discussion here regarding permafrost carbon storage notes numerous uncertainties, insufficient understanding, and lack of coherent results for some end points. The section notes that these uncertainties and gaps in understanding "preclude a firm assessment of the amplitude of irreversible changes". This assessment seems at odds with the "High confidence" ascribed to permafrost carbon in Table 12.3. The "high confidence" rating needs to be better justified in the text, or modified in the table. [Government of United States of America]
All available studies suggest that at least in high-end scenarios, the northern permafrost region will turn into a source of carbon. However, the amplitude of the emissions is extremely uncertain. We refer to sections 6.4.3.4 and 6.4.7.2 for clarity. Note that we did not give a probability in the table because there is no robust evidence beyond the fact that we can very

Expert and Government Review Comments on the IPCC WGI AR5 Second Order Draft – Chapter 12
Do not Cite, Quote or Distribute Page 103 of 120
Comment No
Chapter
FromPage
FromLine
To Page
To Line Comment Response
confident in stating that if changes occurred, these would be irreverible, but not abrupt. Because the relevant processes are not well represented in the models used for the cited projections, we now state that there is medium confidence in the statement that permafrost degassing during the 21st century is possible.
12-1268 12 69 56 69 57 "However...clathrate stability in the ocean." A citation is needed here as I think that this is a very significant statement. [Manoj Joshi, United Kingdom of Great Britain & Northern Ireland]
Accepted, citation added
12-1269 12 70 1 70 3 Again, the word 'catastrophic' appears (see previous comment). [Martin Claussen, Germany] Accepted. Word changed to abrupt
12-1270 12 70 2 70 7 “They concluded … this century. ….. On multi-millennial ….”. The feedback you refer to as happening on multi-millennial time scales also appears to be present on the centennial time scale – do you mean to say that the feedback gets stronger on longer time scales? What happens between decadal and millennial time scales? [Martin Juckes, United Kingdom]
Accepted. Sentence rewriten for clarity
12-1271 12 70 11 Section 12.5.5.6: consider adding references to Chapter 6 and to the relevant Chapters in WGII [Thomas Stocker/ WGI TSU, Switzerland]
Accepted. Reference to 6.4.8.1 + Box 6.3 added
12-1272 12 70 13 70 28 Section 12.5.5.6.1: It would be useful to mention that Oyama and Nobre (2003) found multiple states of the atmosphere - vegetation system in tropical South America, which point at the potential of abrupt changes of this system. Oyama, M.D., Nobre, C.A., 2003: A new climate-vegetation equilibrium state for Tropical South America. Geophys. Res. Letters, 30, 23, 2199, doi: 10.1029/2003GL018600. [Martin Claussen, Germany]
Accepted. Reference added.
12-1273 12 70 14 70 15 what does the term "insolation" means here? Provide literature evidence that strongest growth is indeed in the dry season. And why is this different for Congo Forest and tropical forests in SE Asia? Are these model predictions or field observations? [European Union]
These are observations. In the dry season strong insolation exists + ample water in aquifers = best growth. Huete et al reference now added
12-1274 12 70 14 70 39 Many of the references and much of the discussion in this section refer to the Amazon rainforest. If it is the case that most of the research is on the Amazon but it is assumed that the same will apply to other areas (or otherwise), please clarify this in the text. [Government of Australia]
Noted. However, we do not want to speculate. As such we focus only on the regions where research has been conducted.
12-1275 12 70 21 70 23 On the one hand it is stated that forest growth is strongest in the dry season and on the other hand it is stated that "The transition could be abrupt when the dry season becomes too long for the vegetation to survive, although the resilience of the vegetation to a longer dry period may be increased by the CO2 fertilization effect (Zelazowski et al., 2011)". Since all these models (to my knowledge) have no good soil module, disregard landscape effects and have a very rough vegetation parameterization I doubt this statement. Has this ever been observed in the past? Can experimental evidence be provided from forest growth records? This is too prominent to take it easy. [European Union]
A reference to Huete et al has been aded
12-1276 12 70 23 70 25 "Deforestation may also increase dry season length (Costa and Pires, 2010) and drier conditions increase the likelihood of wildfires that, combined with fire ignition associated with human activity, can undermine the forest’s resiliency to climate change. If climate change brings drier conditions closer to those supportive of seasonal forests rather than rainforest, fire can act as a trigger to abruptly and irreversibly change the ecosystem (Malhi et al., 2009)". It may be projected that above critical temprature the forests will largely disappear and replaced by grasslands. [Andrew Glikson, Australia]
Noted, but we would not want to speculate.
12-1277 12 70 33 70 33 Why is "carbon dioxide fertilization on tropical vegetation poorly known". What is meant here: the physiological feedback of tropical plant species to elevated CO2. Be precise [European Union]
Reference given to Box 6.3
12-1278 12 70 37 70 37 typo: Amazonian and other [European Union] Accepted
12-1279 12 70 37 70 39 This remains highly speculative [European Union] Accepted. The sentence has been reworded
12-1280 12 70 42 70 42 cite relevant literature here, specifically those dealing with field experiments [European Union] Rejected. Allen et al is a global assessment of observational studies
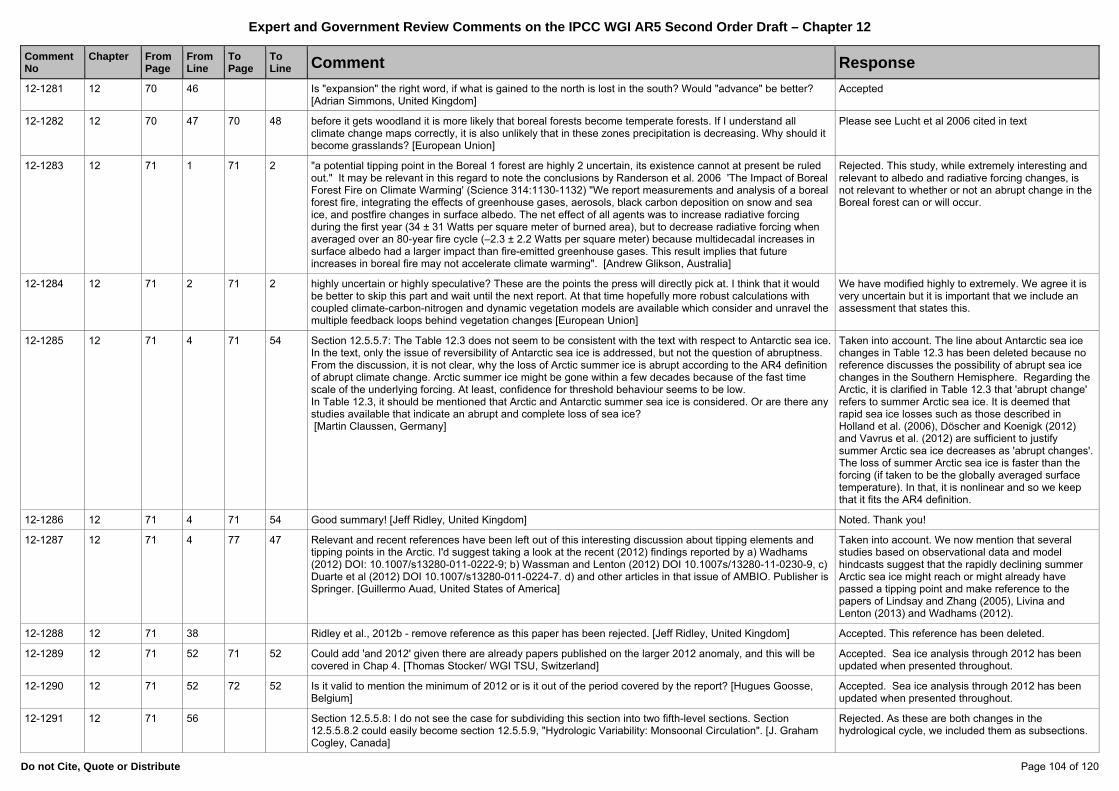
Expert and Government Review Comments on the IPCC WGI AR5 Second Order Draft – Chapter 12
Do not Cite, Quote or Distribute Page 104 of 120
Comment No
Chapter
FromPage
FromLine
To Page
To Line Comment Response
12-1281 12 70 46 Is "expansion" the right word, if what is gained to the north is lost in the south? Would "advance" be better? [Adrian Simmons, United Kingdom]
Accepted
12-1282 12 70 47 70 48 before it gets woodland it is more likely that boreal forests become temperate forests. If I understand all climate change maps correctly, it is also unlikely that in these zones precipitation is decreasing. Why should it become grasslands? [European Union]
Please see Lucht et al 2006 cited in text
12-1283 12 71 1 71 2 "a potential tipping point in the Boreal 1 forest are highly 2 uncertain, its existence cannot at present be ruled out." It may be relevant in this regard to note the conclusions by Randerson et al. 2006 'The Impact of Boreal Forest Fire on Climate Warming' (Science 314:1130-1132) "We report measurements and analysis of a boreal forest fire, integrating the effects of greenhouse gases, aerosols, black carbon deposition on snow and sea ice, and postfire changes in surface albedo. The net effect of all agents was to increase radiative forcing during the first year (34 ± 31 Watts per square meter of burned area), but to decrease radiative forcing when averaged over an 80-year fire cycle (–2.3 ± 2.2 Watts per square meter) because multidecadal increases in surface albedo had a larger impact than fire-emitted greenhouse gases. This result implies that future increases in boreal fire may not accelerate climate warming". [Andrew Glikson, Australia]
Rejected. This study, while extremely interesting and relevant to albedo and radiative forcing changes, is not relevant to whether or not an abrupt change in the Boreal forest can or will occur.
12-1284 12 71 2 71 2 highly uncertain or highly speculative? These are the points the press will directly pick at. I think that it would be better to skip this part and wait until the next report. At that time hopefully more robust calculations with coupled climate-carbon-nitrogen and dynamic vegetation models are available which consider and unravel the multiple feedback loops behind vegetation changes [European Union]
We have modified highly to extremely. We agree it is very uncertain but it is important that we include an assessment that states this.
12-1285 12 71 4 71 54 Section 12.5.5.7: The Table 12.3 does not seem to be consistent with the text with respect to Antarctic sea ice. In the text, only the issue of reversibility of Antarctic sea ice is addressed, but not the question of abruptness. From the discussion, it is not clear, why the loss of Arctic summer ice is abrupt according to the AR4 definition of abrupt climate change. Arctic summer ice might be gone within a few decades because of the fast time scale of the underlying forcing. At least, confidence for threshold behaviour seems to be low. In Table 12.3, it should be mentioned that Arctic and Antarctic summer sea ice is considered. Or are there any studies available that indicate an abrupt and complete loss of sea ice? [Martin Claussen, Germany]
Taken into account. The line about Antarctic sea ice changes in Table 12.3 has been deleted because no reference discusses the possibility of abrupt sea ice changes in the Southern Hemisphere. Regarding the Arctic, it is clarified in Table 12.3 that 'abrupt change' refers to summer Arctic sea ice. It is deemed that rapid sea ice losses such as those described in Holland et al. (2006), Döscher and Koenigk (2012) and Vavrus et al. (2012) are sufficient to justify summer Arctic sea ice decreases as 'abrupt changes'. The loss of summer Arctic sea ice is faster than the forcing (if taken to be the globally averaged surface temperature). In that, it is nonlinear and so we keep that it fits the AR4 definition.
12-1286 12 71 4 71 54 Good summary! [Jeff Ridley, United Kingdom] Noted. Thank you!
12-1287 12 71 4 77 47 Relevant and recent references have been left out of this interesting discussion about tipping elements and tipping points in the Arctic. I'd suggest taking a look at the recent (2012) findings reported by a) Wadhams (2012) DOI: 10.1007/s13280-011-0222-9; b) Wassman and Lenton (2012) DOI 10.1007s/13280-11-0230-9, c) Duarte et al (2012) DOI 10.1007/s13280-011-0224-7. d) and other articles in that issue of AMBIO. Publisher is Springer. [Guillermo Auad, United States of America]
Taken into account. We now mention that several studies based on observational data and model hindcasts suggest that the rapidly declining summer Arctic sea ice might reach or might already have passed a tipping point and make reference to the papers of Lindsay and Zhang (2005), Livina and Lenton (2013) and Wadhams (2012).
12-1288 12 71 38 Ridley et al., 2012b - remove reference as this paper has been rejected. [Jeff Ridley, United Kingdom] Accepted. This reference has been deleted.
12-1289 12 71 52 71 52 Could add 'and 2012' given there are already papers published on the larger 2012 anomaly, and this will be covered in Chap 4. [Thomas Stocker/ WGI TSU, Switzerland]
Accepted. Sea ice analysis through 2012 has been updated when presented throughout.
12-1290 12 71 52 72 52 Is it valid to mention the minimum of 2012 or is it out of the period covered by the report? [Hugues Goosse, Belgium]
Accepted. Sea ice analysis through 2012 has been updated when presented throughout.
12-1291 12 71 56 Section 12.5.5.8: I do not see the case for subdividing this section into two fifth-level sections. Section 12.5.5.8.2 could easily become section 12.5.5.9, "Hydrologic Variability: Monsoonal Circulation". [J. Graham Cogley, Canada]
Rejected. As these are both changes in the hydrological cycle, we included them as subsections.
Expert and Government Review Comments on the IPCC WGI AR5 Second Order Draft – Chapter 12
Do not Cite, Quote or Distribute Page 105 of 120
Comment No
Chapter
FromPage
FromLine
To Page
To Line Comment Response
12-1292 12 72 1 72 25 Section 12.5.5.8.1: Would the authors consider projections of drought over the 21st century? Perhaps an additional, complimentary, neighboring section could discuss this topic. If so, they may wish to consult the paper by Fu et al. titled “Assessing Future Changes of Climate and Drought over the South-Central United States Projected by the CMIP5 Models” as well as Long et al. (“Drought and Persistent Wet Events Projected in the CMIP5 Experiments”). [Government of United States of America]
Rejected. Projections of drought should be covered in Section 12.4.5: Changes in the Water Cycle. This section deals with abrupt climate change
12-1293 12 72 1 Section 12.5.5.8.2: It has been shown in a few recent studies where CO2 levels were doubled (or higher) and then restored back, that precipitation and temperature both change almost linearly with CO2 forcing in climate models (Boucher et al., 2012; Samanta et al., 2010). Moreover, a recent study has also reported no significant trends in dorughts over the past several decades (Sheffield et al., 2012, Nature Climate Change). [Arindam Samanta, United States of America]
Accepted. Papers by Boucher et al and Samanta et al already referenced and used to provide assement in Table 12.3 re: irreversibility
12-1294 12 72 1 Section 12.5.5.8.1: consider adding reference to Section 12.4.5; we note that drought are missing largely from the Chapter 12 assessment of projections in water cycle changes, so it's not entirely clear why droughts are now discussed here in the Abrupt Changes section. Please consider putting this in context by elaborating more on droughts in section 12.4.5. [Thomas Stocker/ WGI TSU, Switzerland]
Accepted, text elaborated
12-1295 12 72 2 72 2 Do not capitalize "long-term". Hyphenate it consistently (or not, but consistently at any rate; see L9). [J. Graham Cogley, Canada]
Accepted
12-1296 12 72 2 72 3 Although a link is provided to Chapter 5, can an approximate timescale for "megadroughts" be included here as guidance? [European Union]
This is defined in Annex III (Glossary) which is now referenced
12-1297 12 72 2 "megadroughts" is the term that is used (extensively) in chapter 5. [Adrian Simmons, United Kingdom] Noted. Change d'sometimes' to 'often'
12-1298 12 72 3 72 3 How is a megadrought defined? Over what sort of timescales approximately? [John Caesar, United Kingdom of Great Britain & Northern Ireland]
This is defined in Annex III (Glossary) which is now referenced
12-1299 12 72 4 A new definition of abrupt appears: “abrupt in the sense of indicating nonlinearity in the physical system”. This definition is neither consistent with the new AR5 definition nor with the previous AR4 definition in which temporal evolution or differences in time scales are the decisive criteria. It is also the weakest definition. Because the equations of atmospheric and oceanic motion and vegetation dynamics in climate system models are non-linear, non-linear climate changes are to be expected. Long-term drought could, perhaps, be interpreted as a random ‘flip-flop like’ climate fluctuation. It is then very likely that it emerges from some (non-linear) instability. Furthermore, if apparently no change in climate forcing, such as volcanic activity, has triggered a long-term drought, then the onset and the termination of a long-term drought has to be considered abrupt in the sense of the AR4 definition. [Martin Claussen, Germany]
Accepted. Offending part of sentence removed.
12-1300 12 72 6 72 6 "greater aridity" rather than "elevated aridity". [J. Graham Cogley, Canada] Accepted
12-1301 12 72 9 72 25 This section seem brief. Some additional points that might be covered include: (A) Some researchers suggesting that the 20th century (at least in NA) has been exceptionally moist, compared to previous eras in recent history. E.g., Sauchyn et al. 2003. "A paleoclimatic context for the drought of 1999–2001 in the northern Great Plains of North America", Geographic J. 169(2) 158-167. and (B). Evidence of megadrought events is seen in tree ring chronologies. E.g., recent paper by Williams et al. 2012. "Temperature as a potent driver of regional forest drought stress and tree mortality" in Nature CC 2012-09-30, DOI: 10.1038/NCLIMATE1693. [Government of Canada]
Noted. This is a section on abrupt change. Droughts are to be discussed in section 12.4.5
12-1302 12 72 9 72 25 It seems like there would be similar concerns for regions outside of North America. You mention Australia, but what about the Sahel, west Africa (and south Africa), southern Europe, east Asia, and regions in Eurasia, north of the Middle East? Work of Dai on global droughts might also be relevant. E.g. Dai, A. 2011. Drought under global warming: a review. WIRES Clim. Change, 2: 45–65. doi: 10.1002/wcc.81. Dai, A. 2012. Increasing drought under global warming in observations and models. Nature Clim. Change. doi: 10.1038/nclimate1633. [Government of Canada]
Noted. This is a section on abrupt change. Droughts are to be discussed in section 12.4.5. Regional changes are in Chapter 14. We are only able to assess literature on abrupt changes in the contect of drought as well.
12-1303 12 72 16 72 19 Here, the life time of CO2 in the atmosphere is addressed. It might be sensible to cite Archer and Brovkin (Climatic Change, 2008) who have simulated the multi-millennial decrease of atmospheric CO2 after a weak and a strong pulse of carbon emissions into the atmosphere, respectively. These simulations reveal that even
Accepted, citation added
Expert and Government Review Comments on the IPCC WGI AR5 Second Order Draft – Chapter 12
Do not Cite, Quote or Distribute Page 106 of 120
Comment No
Chapter
FromPage
FromLine
To Page
To Line Comment Response
after some 10,000 years after the emission pulse, the climate system has not reached any equilibrium because of the continuing reaction with igneous rocks. That seems to contradict the study by Solomon et al. (2009). Archer, D., and Brovkin, V., 2008: The millennial athmospheric lifetime of anthropogenic CO2. Climatic Change, DOI 10.1007/s10584-008-9413-1 [Martin Claussen, Germany]
12-1304 12 72 17 72 25 This assessment of Solomon et al. (2009) should be given a calibrated-language confidence rating. [J. Graham Cogley, Canada]
The assessment is provided in Table12.3
12-1305 12 72 17 72 25 These statements seem overconfident, given the complexities in interactions between global warming and shifts in circulation patterns and modes of variability (e.g., as discussed in Ch. 14). [Government of United States of America]
Accepted. Sentences have been reworded
12-1306 12 72 24 72 24 “changes ….. would be irreversible”: this appears to confuse the use of “irreversible”, which is earlier defined in terms of changes which persist when the forcing is removed – unless you are talking about hydrological irreversibility, in which case it requires more explanation than given in this sentence. e.g. why does it become irreversible at double pre-industrial CO2? [Martin Juckes, United Kingdom]
Accepted. Now states: If CO2 concentrations peak at around twice pre-industrial levels, the forcing is irreversible on millennial timescale in the absence of carbon capture from the atmosphere and hence the hydrological changes would be sustained.
12-1307 12 72 27 73 21 Section 12.5.5.8.2: This section could include a (at the very least brief) discussion of the North American monsoon. Section 4.d. of the paper titled “North American Climate in CMIP5 Experiments: Part III: Assessment of 21st Century Projections” by Maloney et al. contains a discussion of results from CMIP5 models regarding the North American monsoon’s projected 21st century behavior. [Government of United States of America]
This is the purpose of section 14.2.3 (which examines NAME). Here we are only assessing studies that have examined abrupts change.
12-1308 12 72 27 73 21 The East Asian monsoon change should be additionally discussed here. [Dabang Jiang, China] We can only assess available literature
12-1309 12 72 27 Section 12.5.5.8.2: consider adding references to Chapter 14, Section 14.2; please check consistency/overlap for the Monsoonal Circulation section with Chapter 14, Section 14.2 [Thomas Stocker/ WGI TSU, Switzerland]
Accepted. Cross reference give to 14.2
12-1310 12 72 30 Chapter 5.6.2 is cited, when mentioning the African Humid Period. I have not found anything explicitly related to the African Humid Period in chapter 5.6.2. The latter chapter seems to mainly deal with sea-level changes. [Martin Claussen, Germany]
Accepted. Reference removed
12-1311 12 72 33 72 33 "seasonally uniform longwave forcing": surely not? That CO2 is well-mixed is neither here nor there. Seasonal variation will be substantial by virtue of the varying temperature of the greenhouse emitters. [J. Graham Cogley, Canada]
Accepted. We were referring to atmospheric CO2.
12-1312 12 72 34 Which paleoclimate examples suggest that …. “rapid changes are reversible when the forcing is withdrawn”. There are some examples, indeed, but does this apply to the West African monsoon system? [Martin Claussen, Germany]
Noted. Is there evidence to suggest this is not the case?
12-1313 12 72 37 37 38 This is CO2 forcing alone. In any case, this should be updated using the AR5 numbers. [Jouni Räisänen, Finland]
Accepted
12-1314 12 72 37 It does not make any sense to compare regional, seasonal radiative forcing with global mean radiative forcing. As correctly mentioned in the same paragraph, mid-Holocene orbital forcing differs from current greenhouse-gas induced forcing. [Martin Claussen, Germany]
Accepted. We modified the sentence appropriately
12-1315 12 72 37 It would be sensible to cite the original, instead of the secondary, source in which the numerical computation of insolation changes at Milankovic time scales was presented, i.e., Berger, A., Journal of Atmospheric and Oceanic Science, 35, 1978. Peter deMenocal et al. cite Berger, A., Loutre, M.F.,. Quaternary Science Reviews 10, 297, 1991 [Martin Claussen, Germany]
Rejected.. The reference here is to the abrupt onset and termination not the changes in insolation.
12-1316 12 72 39 It is a bit misleading to conclude that Claussen et al. (2003) found a ‘rapid’ Saharan greening under very high levels …, but not under lower levels … of atmospheric CO2”. The rate of change of Saharan greening appears to simply follow the rate of change of atmospheric CO2. A slow (0.5% per year) increase to high levels of atmospheric CO2 yields for a slow increase towards relatively high fractional vegetation coverage, a
Accepted. The sentence has been rewritten to refer to rate of change of the CO2 forcing
Expert and Government Review Comments on the IPCC WGI AR5 Second Order Draft – Chapter 12
Do not Cite, Quote or Distribute Page 107 of 120
Comment No
Chapter
FromPage
FromLine
To Page
To Line Comment Response
moderately fast (1% per year) increase yields for a faster greening. After the increase in atmospheric CO2 is stopped and the atmospheric CO2 is kept constant at a certain value, the fractional vegetation coverage tends to approach a new equilibrium value which depends on the amplitude, not the rate, of forcing. [Martin Claussen, Germany]
12-1317 12 72 42 72 42 Delete "as a consequence of global warming". [J. Graham Cogley, Canada] Rejected. This emerges from section 12.5.5.2
12-1318 12 72 44 72 46 rewrite opening sentence in paragraph: "AR4 climate model projections (Milly et al., 2008) and CMIP5 GCM ensembles (Figure 12.24) both suggest widespread drying and drought across most of southwestern North America and many other subtropical regions by the mid to late 21st century." [Robert Webb, United States of America]
Accepted, text modified
12-1319 12 72 44 72 50 We think this paragraph may be better places in the previous sub-section on drought. [Government of United States of America]
Accepted, text modified
12-1320 12 72 50 72 50 End the sentence with "currently weak in comparison." [J. Graham Cogley, Canada] Accepted, text modified
12-1321 12 73 11 Add the following citation which has recently discussed and attributed the recent change of the South Asian monsoon to aerosol forcing: Bollasina, M., Y. Ming, and V. Ramaswamy, 2011: Anthropogenic aerosols and the weakening of the South Asian summer monsoon. Science, 334, 502-505. [Massimo Bollasina, Italy]
Accepted, citation added
12-1322 12 73 15 I would add: “More recently, Bollasina et al. (2011) showed that anthropogenic aerosols played a fundamental role in driving the recent observed weakening of the summer monsoon“. Bollasina, M., Y. Ming, and V. Ramaswamy, 2011: Anthropogenic aerosols and the weakening of the South Asian summer monsoon. Science, 334, 502-505. [Massimo Bollasina, Italy]
Accepted, text modified
12-1323 12 73 18 73 18 "conceivable in which aerosol". [J. Graham Cogley, Canada] This sentence has been deleted
12-1324 12 73 18 73 21 Has the effect of aerosol control policies on the monsoon system been tested, or inferred? [European Union] This sentence has been deleted
12-1325 12 73 19 73 20 "and ecosystems reduction in air pollution in Asia" is obscure, and should probably be deleted. [J. Graham Cogley, Canada]
This sentence has been deleted
12-1326 12 73 23 FAQ 12.1: This is a nicely written FAQ. In places the text becomes too technical and unnecessary details could be avoided. One example is the reference to equations for fluid motion etc, that come in the fifth paragraph. [Thomas Stocker/ WGI TSU, Switzerland]
Thank you -- we have tried to edit the text further with that in mind.
12-1327 12 73 25 73 25 I think the response to this FAQ is very nicely crafted. I've suggested a few minor changes. [Francis Zwiers, Canada]
Thank you
12-1328 12 73 25 in my opinion it would be better to separate FAQ12.1 into 2 questions: I) … Models... and II) ...Scenarios.... Using one question is mixing up two fundamental problems. [Frank Kreienkamp, Germany]
The questions have been decided and can't be changed, but we are trying to address the two sources of variability by keeping the answers clearly separated.
12-1329 12 73 25 FAQ 12.1: Please include key numbers on models and scenarios since this helps "answering" the posed question. How does AR5 compare to AR4 in this regard? [Thomas Stocker/ WGI TSU, Switzerland]
Being this an FAQ we prefer not to go too much in quantitative details.
12-1330 12 73 25 FAQ 12.1: It seems that more discussion of the policy-relevance of providing projections for a range of scenarios could be added, i.e., providing policy-makers with alternatives and a range of possible futures to consider. [Thomas Stocker/ WGI TSU, Switzerland]
We have mentioned the policy-relevant aspect of having multiple responses and scenarios at the end of both the first and second paragraphs.
12-1331 12 73 25 FAQ 12.1, Figure 1: We suggest adding the number of models to each scenario/historical period on the time series, given that the idea of 'many models' is central to this FAQ. Please also not that when printed at this scale, the Mediterranean region on the global panels appears black. [Thomas Stocker/ WGI TSU, Switzerland]
The number of models is added in the caption, and the level of detail in the figure is not supposed to resolve individual regions but just convey very large scale differences.
12-1332 12 73 27 73 30 At L28, delete "natural and". At L29-30, say "Future climate is also shaped by natural forcings and by natural variability inherent …". [J. Graham Cogley, Canada]
Editorial
Expert and Government Review Comments on the IPCC WGI AR5 Second Order Draft – Chapter 12
Do not Cite, Quote or Distribute Page 108 of 120
Comment No
Chapter
FromPage
FromLine
To Page
To Line Comment Response
12-1333 12 73 28 73 28 Delete "nevertheless" (I don't think it's needed). [Francis Zwiers, Canada] Accepted and deleted.
12-1334 12 73 33 This staement could usefully be elevated to teh SPM and the TS because scenarios are often mis understood by decision-makers in teh quest for certainty and they take mid ranges and think that is what teh future WILL be like. The fact they are plausible futures and can't have probailities assigned is exceeding important information for decision-makers. caveats get lost so giving this prominence is essential. [Judy Lawrence, New Zealand]
FAQ content is not considered material for ES and SPM.
12-1335 12 73 34 73 34 Replace "these futures'" with "their". [Francis Zwiers, Canada] Accepted and replaced
12-1336 12 73 39 73 39 Delete comma after 'future' [Urs Neu, Switzerland] Accepted and deleted.
12-1337 12 73 45 73 45 If you don't distinguish between internal and other natural fluctuations, then recognition of natural forcing agents should be added. Perhaps add ", and by natural external forcing agents" after "the ocean". [Francis Zwiers, Canada]
We are using natural here in a very generic sense and we are not sure that the terms "natural external forcing agents" would be understood by a lay audience, so we chose to keep it simple as it is.
12-1338 12 73 47 73 47 Is this an assessed "likely"? If not, perhaps another word could be used so that the interpretation of key language does not become muddled in the minds of lay readers. [Francis Zwiers, Canada]
Changed 'likely' to 'expected'
12-1339 12 73 48 73 48 Change "around" to "describing". [J. Graham Cogley, Canada] Editorial. We changed 'around' to 'of'
12-1340 12 73 48 73 48 "Around" seems to have been used in several FAQs, but it does not have a nice crisp feel to me, and perhaps is not a part of everyone's English vernacular. In fact, this entire sentence, spanning lines 47-50, seems awkward. I'm sure that there is a more direct way to say that the response to anthropogenic forcing dominates projected changes in global mean temperature beyond the first few decades of the 21st century. [Francis Zwiers, Canada]
Accepted: We changed 'around' to 'of' and reworded the sentence to clarify.
12-1341 12 73 49 73 49 Replace "main drivers of change" with "main sources of uncertainty"? [Jouni Räisänen, Finland] We have reworded the sentence.
12-1342 12 73 50 73 51 Delete this weak sentence, thus strengthening the previous sentence. [J. Graham Cogley, Canada] Editorial: we think this sentence underlines an important point and we prefer to keep it there. .
12-1343 12 73 53 73 53 The statement that climate models are built from physical and empirical understanding is true, but it doesn't indicate where the balance lies between the two types of understanding. I think this should be formulated a bit differently, so that is it clear that physical understanding and principles dominate (which I *think* is true). [Francis Zwiers, Canada]
Accepted: We reworded the sentence by stressing first the physical principles, and adding the empirical understanding part in queue.
12-1344 12 73 56 73 56 "will not". [J. Graham Cogley, Canada] Editorial, corrected.
12-1345 12 74 1 74 3 I think it would be useful to give some indication that the numerical algorithms are reliable. Perhaps an analogy can be made with aircraft engineering, which relies on numerical solutions to similar types of equations. [Francis Zwiers, Canada]
Accepted and analogy incorporated.
12-1346 12 74 1 74 39 There is no discussion of differences in quality among models here. Perhaps section 9.8.1 could be drawn on to make some statement about there being a range of quality among models in representeing aspects of present and past climate, but that no model scores either high or low for all performance metrics. It could be added that whilst good performance in simulating past and present is not necessarily a guide to good performance in projecting into the longer-term future, projections for a particular aspect of climate such as Arctic sea ice must be treated with extra caution if they come from a model that handles that aspect of past and present climate poorly. [Adrian Simmons, United Kingdom]
We added a sentence that discusses models' differential performances and the difficult relationship to draw between performance and reliability for future projections.
12-1347 12 74 2 74 2 Delete "directly". [J. Graham Cogley, Canada] Accepted and deleted
12-1348 12 74 5 74 5 Explain parameterizations, e.g. "(establishing a mathematical relation, which is derived from observations, of an unknown quantity to a known measure)" [Urs Neu, Switzerland]
Accepted and explained along the line suggested.
12-1349 12 74 5 Perhaps a sentence should be added to the effect that, even if we could write all the equations, we are far from having the computational ability to solve them at a sufficient grid resolution to capture all relevant process. Hence we also rely on subgrid parameterizations for processes that cannot be explicitly resolved.
The hurdle of computational ability is mentioned now explicitly.
Expert and Government Review Comments on the IPCC WGI AR5 Second Order Draft – Chapter 12
Do not Cite, Quote or Distribute Page 109 of 120
Comment No
Chapter
FromPage
FromLine
To Page
To Line Comment Response
[Government of United States of America]
12-1350 12 74 8 74 8 Replace "to the modelling" by "for the modelling". Otherwise I do not understand the sentence. [Urs Neu, Switzerland]
Editorial, replaced.
12-1351 12 74 9 74 9 Replace with "range of different plausible" with "range of plausible" (the fact that there is a range of results indicates that they are different). [Francis Zwiers, Canada]
Accepted and replaced
12-1352 12 74 13 74 13 Suggest replacing "across all models" with "that are common to all models". [Francis Zwiers, Canada] Accepted and replaced
12-1353 12 74 16 74 16 Suggest replacing "the processes" with "some climate processes" (some processes might not be simplified…). [Francis Zwiers, Canada]
Accepted and replaced
12-1354 12 74 21 74 22 I think the WCRP and the WGCM should be mentioned here. [Ronald Stouffer, United States of America] Accepted: they both are now.
12-1355 12 74 23 74 24 I think I would avoid alluding to an "industry" and all that readers might imagine that goes with that word. Suggest simplying saying "The 'multi-model' approach is now a standard technique used by the climate science community to assess….". [Francis Zwiers, Canada]
Accepted, term removed.
12-1356 12 74 23 Please take care against using too casual or imprecise a style of language. The "kind of industry standard technique" in this sentence could be reworded, egg, "a common technique" [Thomas Stocker/ WGI TSU, Switzerland]
Accepted, term removed.
12-1357 12 74 26 74 26 Should that be FAQ 12.1, Figure 1? [Francis Zwiers, Canada] Editorial, corrected.
12-1358 12 74 26 74 27 FAQ 12.1 need to be precise here to avoid inconsistencies: "highest and lowest scenario" needs to be changed to "highres and lowest RCP scenario" to be correct. [Thomas Stocker/ WGI TSU, Switzerland]
Accepted and changed as suggested.
12-1359 12 74 29 74 29 likely should be "very likely" which is also consistent with ch 12 pg 3 line 31 [Manoj Joshi, United Kingdom of Great Britain & Northern Ireland]
We eliminated the uncertainty language, not being suited for an FAQ.
12-1360 12 74 36 74 36 Change "around" to "about". "around" leaves the impression that uncertainty in future forcings is a fuzzy, ill-defined problem, which is quite misleading. [J. Graham Cogley, Canada]
We changed "around" to "in"
12-1361 12 74 36 74 37 Another instance of "around" - replace with "in". Insert "which are" at the beginning of line 37 [Francis Zwiers, Canada]
Accepted and replaced.
12-1362 12 74 37 74 39 The sentence that begins on line 37 seems to be rather awkwardly constructed. [Francis Zwiers, Canada] Accepted. The sentene has been reworded.
12-1363 12 74 51 76 35 FAQ 12.2 similarly important. Well done. [Robert Kandel, France] Thanks
12-1364 12 74 52 74 58 In my opinion it should start with the beginning: a warmer atmosphere will be able to store more water...; the dynamics of the atmosphere might transport the humidity …; due to the dynamics(transport) of the atmosphere some region will have more some region might get less rainfall … [Frank Kreienkamp, Germany]
The focus is on how the water changes and the "chapeau" needs to focus on that. The ordering follows the recommended structure for communicating to a general, non-technical audience.
12-1365 12 74 52 FAQ 12.2: Overall we felt this FAQ reads wells, but is currently more in the style of a text book response, and contains no 'new' findings coming out of the AR5. This FAQ could therefore benefit considerably from drawing upon the latest quantitative results coming from the Chapter 12 assessment relating to the water cycle. Quantitative evidence to support the text should be added where possible. [Thomas Stocker/ WGI TSU, Switzerland]
We have blended in quantitative results where possible while avoiding an overly technical FAQ. At least some of the AR5 conclusions on this are a reinformcement of AR4, which we also note.
12-1366 12 74 52 FAQ 12.2: Consider adding a quantitative Figure coming from the Chapter 12 assessment, illustrating the projected changes in the water cycle (for example, along the lines of the technical summary Figure TFE 1, Figure 1. [Thomas Stocker/ WGI TSU, Switzerland]
This is inconsistent with the guidance given for writing a FAQ. We have, however, added quantitative information to the text.
12-1367 12 74 54 74 58 "are highly variable". Delete "to occur" and "overall". [J. Graham Cogley, Canada] The first two changes made. Deleting "overall" would imply that the the increases are occurring everywhere, which is not true. "Overall" changed to "net" to recognize that decreases may occur in some places.
Expert and Government Review Comments on the IPCC WGI AR5 Second Order Draft – Chapter 12
Do not Cite, Quote or Distribute Page 110 of 120
Comment No
Chapter
FromPage
FromLine
To Page
To Line Comment Response
12-1368 12 75 7 75 7 Add seasonally frozen soil to the list of places where solid terrestrial water is found. [Francis Zwiers, Canada] Accepted, text modified
12-1369 12 75 9 75 29 The explanation about the change of water cycly "speed" is questionable. Yes,"accelerate" is misleading but because of other reason different from those stated here. Water cycle " intensifies " in a warmer climate, because both precipitation and evaporation increase on global mean state. But the residence time or turn-over time of water vapor in the atmosphere becomes longer by the increase of precipitable water coming from increased water (vapor) holding capacity of the atmosphere due to CC law, which is greater than the increase of precipitation and evaporation. It is not appropriate to say "accelerate" when residence time becomes longer. In the same way transport of water vapor from one location(place of evaporation) to another (place of precipitation) increases as bulk quantity but it does not mean the increase of speed (wind speed). But due to the incresed water carrying capacity of atmospheric motions, both of the evaporation in existing evaporating regions (e.g. subtropics) and the precipitation in existing precipitationg regions (mid/high latitudes and equatorial belt) increse to cause more frequent floods and droughts. [Taroh Matsuno, Japan]
This discussion is more relevant for Section 12.4, but too technical for a FAQ. It also puts too much focus on what is just one issue in addressing the FAQ's title.
12-1370 12 75 14 75 14 Change "reservoirs" to "stores of water". Some of the reservoirs are literally and some only metaphorically reservoirs. [J. Graham Cogley, Canada]
Aceepted, text modified
12-1371 12 75 17 75 21 The word "should" appears several times, and in each instance I think it can be replaced with "will" (they all appear to be certainties in a warmer world). I also suggest deleting "slight" in line 20 (the expansion is slight, but the sea level rise that results is real and important). [Francis Zwiers, Canada]
Accepted, text modified
12-1372 12 75 18 75 18 "should contain more water,". [J. Graham Cogley, Canada] Not accepted. "Contain"carries a sense of the atmosphere as an agent independent of water vapor that acts on the water vapor by containing it, whereas the water vapor is part of the atmosphere.
12-1373 12 75 23 75 23 Insert after "the complexity of the climate system": ", which continuously redistributes energy within the system," for explanation. [Urs Neu, Switzerland]
Not accepted. The rest of the paragraph discusses a variety of ways, including redistribution, that affects the changes expected.
12-1374 12 75 31 75 31 Should "processes" be "events"? If "processes" is really intended, the time and space scales are too restricted. [J. Graham Cogley, Canada]
Processes captures the meaning of physical behavior governing the flow of water. "Events" are outcomes of the processes. Language added to be inclusive of larger time and space scales.
12-1375 12 75 31 75 31 Insert after "can occur": "at relatively small scales, i.e. ...". Reason: better understandability of the sentence. [Urs Neu, Switzerland]
Disagree. For the FAQ reader, who may be unfamiliar with climate system processes, giving some explicit scales seems necessary.
12-1376 12 75 38 75 39 "in the inter-tropical convergence zone" might be more accurate than "in the tropics". [J. Graham Cogley, Canada]
Not accepted. "Inter-tropical convergence zone" is too technical for a FAQ. Many FAQ readers would need an explanation of the term, which would detract from the focus of the FAQ.
12-1377 12 75 38 75 43 You might like to change line 38 to : "Projected climate changes FROM MODEL RUNS ASSESSED FOR THIS FIFTH ASSESSMENT REPORT (FAQ 12.2 Figure 1) generally show …" This would usefully indicate to the reader the links form this FAQ to the AR5, and the fact that it is based on up-to-date modelling. [David Wratt, New Zealand]
Language similar to this added. There are several places in the revised FAQ that now give quantitative changes drawn from Chapter 12. These additions include language such as "model simulations assessed in this report show ".
12-1378 12 75 40 75 40 Maybe explain the changes in circulation that promote more tropical rainfall. [Francis Zwiers, Canada] Now note that the circulation changes concentrate more water vapor in the tropics.
12-1379 12 75 46 75 46 Is "and thus more water that can precipitate" really accurate? Could one say "and thus allows the atmosphere to move more vapour from lower latitudes dominated by evapouration to higher latitudes". [Francis Zwiers, Canada]
Not accepted. The circulation could not bring more water vapor into the high latitudes unless there were a warmer atmosphere to accept it. One would also have to address the issue of local water recycling between land and atmosphere.

Expert and Government Review Comments on the IPCC WGI AR5 Second Order Draft – Chapter 12
Do not Cite, Quote or Distribute Page 111 of 120
Comment No
Chapter
FromPage
FromLine
To Page
To Line Comment Response
12-1380 12 75 50 75 54 I think this paragraph could be tightened up a bit. The contrast between increased evapotranspiration from increased atmospheric demand, and opposing decreases due to increased stomatal resistance, does not come across as a contrast. [Francis Zwiers, Canada]
The wording has been altered, following suggestions in comments 12-1382 and 12-1383
12-1381 12 75 51 75 53 "Because…sufficient water." is loosely worded. Perhaps change this to "Greater evapotranspiration in a warmer atmosphere". Note also that RH is projected to change over some parts of the land, so I think "a warmer atmosphere can have more water vapour" doesn't describe the situation over the land surface well [Manoj Joshi, United Kingdom of Great Britain & Northern Ireland]
Not accepted. The suggested change is not clear, in part because the reviewer does not give a complete sentence that would indicate what the reviewer suggests deleting. The change in RH is relatively small compared to the canges in ET and water amount in the atmosphere. In addition, the language used is not saying that greater ET must occur, only that the warmer conditions would allow greater ET.
12-1382 12 75 53 75 53 Replace "In addition" with "However"? [Jouni Räisänen, Finland] Accepted, text modified
12-1383 12 75 53 75 54 "to transpire water into the atmosphere." [J. Graham Cogley, Canada] Aceepted, text modified
12-1384 12 75 56 75 56 I'm not sure what it means to "mute" the effects of increased precipitation - do you mean increased evapotranspiration balances precipitation increases, leading to little change in runoff? [Francis Zwiers, Canada]
Agree that the wording is unclear. Rewritten to discuss in terms of influences on soil moisture, thus complementing the statement about soil moisture in the subtropics.
12-1385 12 76 6 76 6 "show that". [J. Graham Cogley, Canada] Not accepted. This would require changing the sentence further if that change were to be made, making the sentence less succinct.
12-1386 12 76 19 76 19 Permafrost not included in current GCMs: This needs to be made consistent with the paragraph beginning at P51 L50. [J. Graham Cogley, Canada]
Text reworded to be consistent with disucssion there and in Chapter 9.
12-1387 12 76 19 76 19 Insert "most" before "current"? This statement would be dependent upon the depth of the deepest soil layer and what you regarded as being permafrost. Wouldn't some models be capable of simulating changes in the thickness of the active layer? [Francis Zwiers, Canada]
Text reworded to be consistent with disucssion within Chaper 12 and in Chapter 9.
12-1388 12 76 19 76 25 As far as the glacier loses mass, this tends to increase the total annual runoff. [Jouni Räisänen, Finland] Not once the glacier disappears. "Loss" means loss of the glacier, not simply an ongoing reduction of glacier ice. Wording changed to make this point clearer.
12-1389 12 76 23 76 23 "will also contribute eventually to". Delete "overall". [J. Graham Cogley, Canada] Accepted, text modified
12-1390 12 76 39 76 39 I think this FAQ still requires some additional editorial work to improve grammar and flow. I've pointed out a few places where changes should be made, but carefully proofreading and polishing is required throughout the response. [Francis Zwiers, Canada]
Aceepted, text modified
12-1391 12 76 41 This FAQ section has several typos/grammatical errors and needs to be proofread carefully. [Kirsten Zickfeld, Canada]
Noted. FAQ has been edited by a professional science writer and will be proofread by the copy editor. No specific points mentioned.
12-1392 12 76 49 FAQ 12.3: Figure 1: Caption speaks only of projections starting at 2010, so please clarify if historical period is also based on modelling, or includes observations. In an FAQ caption it also seems odd to use a specific climate model name 'MAGICC', and would be better to speak of a 'simple climate model' or something similar. [Thomas Stocker/ WGI TSU, Switzerland]
Accepted. Added as sugggested.
12-1393 12 76 53 76 54 To keep this FAQ text as accessible as possible, perhaps half-life values rather than e-folding values could be quoted. That would avoid a reference to "e(2.71)". [Adrian Simmons, United Kingdom]
Rejected. That option was discussed but rejected by the authors.
12-1394 12 76 54 I suggest deleting "naturally" here (since the definition is independent of this) [Jan Fuglestvedt, Norway] Accepted.
12-1395 12 76 56 Adjustment time (or response time) of methane is more relevant than lifetime. See chapter 8. [Jan Fuglestvedt, Rejected. Unclear how response time is different from
Expert and Government Review Comments on the IPCC WGI AR5 Second Order Draft – Chapter 12
Do not Cite, Quote or Distribute Page 112 of 120
Comment No
Chapter
FromPage
FromLine
To Page
To Line Comment Response
Norway] lifetime.
12-1396 12 76 57 77 3 This view of the CO2 impulse profile is model-derived as opposed to observationally derived profiles such as Moore and Braswell (1994) and Jacobson (2005), which, when convolved with emissions, yield CO2 histories that are wholly consistent with observations. At minimum the text should take cognizance of these other studies and state why they are not folded into consideration. Jacobson, M. Z.: Correction to ‘‘Control of fossil-fuel particulate black carbon and organic matter, possibly the most effective method of slowing global warming’’, J. Geophys. Res., 110, D14105, 10.1029/2005JD005888, 2005. Moore III, B., and Braswell, B. H.: The lifetime of excess atmospheric carbon dioxide, Global Biogeochem. Cycles, 8, 23-38, 10.1029/93GB03392, 1994. [Stephen E Schwartz, United States of America]
Rejected. The idea idea of a single lifetime for carbon has long been rejected in the literature, and is at odds with basic physics/chemistry and observations. Support for the CO2 pulse model is not just from models but from various observations. See chapter 6, Box 6.2.
12-1397 12 77 1 77 3 This should be coordinated with chapter 6 (see e.g. Box 6.2 where different numbers are used) [Jan Fuglestvedt, Norway]
Accepted. Clarified that this is based on a 1000 PgC pulse. Numbers consistent with the most recent intercomparison by Joos et al. performed for AR5
12-1398 12 77 1 77 3 FAQ12.3: The statement here does not seem entirely consistent with similar statements about the fate of anthropogenic CO2 in Ch. 6 and FAQ6.1 where it says that 15-40% of the emitted CO2 will remain in the atmosphere for up to 2000 years. The upper part of that range seems inconsistent with the statement here that about 20% will remain after 1000 years. [Government of Canada]
Accepted. Clarified that this is based on a 1000 PgC pulse. Numbers consistent with the most recent intercomparison by Joos et al. performed for AR5
12-1399 12 77 1 77 3 I repeat here a comment which I have also submitted on FAQ 6.1. It is relevant here too: I note that lines1-3 of page 77 of Chapter 12 (FAQ 12.3) state that "About half of the anthropogenic CO2 is removed within a few decades, …".At first sight this appears to be in contradiction with this figure (FAQ 6.1 Figure 2) in which it appears to take about 1000 years after the hypothetical "excess emision" of CO2 for the amount of it in the atmosphere to drop to 50%. I assume the difference is because FAQ 6.1 Fig 2 is illustrating the fate of a hypothetical huge (5,000 PgC) instantaneous emission of CO2, whereas FAQ 12.3 is considering the fate of a much smaller incremental emission. However I suggest the Chapter 6 LAs liaise with those from Chapter 12 to develop brief explanation text to go in either or both FAQs to explain the apparent contradiction. [David Wratt, New Zealand]
Accepted. Clarified that this is based on a 1000 PgC pulse. Numbers consistent with the most recent intercomparison by Joos et al. performed for AR5
12-1400 12 77 1 77 3 The time to absorb a given percent of eissions is strongly dependent on the total amount of emissions (Eby et al., 2009). For emissions up to 1000 PgC, 50% of the CO2 anomaly is taken up within 100 years. Above 1000 PgC the time to absorb 50% of the emissions increases significantly: more than 2000 years are needed to take up 50% of a 5000 PgC perturbation (Eby et al., 2009). [Kirsten Zickfeld, Canada]
Accepted. Clarified that this is based on a 1000 PgC pulse. Numbers consistent with the most recent intercomparison by Joos et al. performed for AR5
12-1401 12 77 9 77 10 How long would it take for CO2 to return to pre-industrial levels? Would it be useful to include an estimate here? [John Caesar, United Kingdom of Great Britain & Northern Ireland]
Recected. That involves long term processes (sedimenation) that are not included in models, and explaining this in the FAQ would take too much space. The carbon cycle chapter discusses this in more detail.
12-1402 12 77 9 77 10 What timescales would CO2 return to pre-industrial levels? [European Union] Recected. That involves long term processes (sedimenation) that are not included in models, and explaining this in the FAQ would take too much space. The carbon cycle chapter discusses this in more detail.
12-1403 12 77 10 77 11 The sentence "Changes in emission of….." needs rewording since troposheric ozone is not emitted. It is a secondary component formed by ozone precursors NOx, CO, VOC and under the influence of short wave radiation. See ch8. [Jan Fuglestvedt, Norway]
Accepted. Ozone removed.
12-1404 12 77 10 77 11 This sentece is unclear. [Kirsten Zickfeld, Canada] Rejected. Unspecific comment.
12-1405 12 77 11 77 11 This sentence is completed a bit awkwardly. A suggestion is to replace this line with "ozone on the other hand Accepted. Changed as suggested.
Expert and Government Review Comments on the IPCC WGI AR5 Second Order Draft – Chapter 12
Do not Cite, Quote or Distribute Page 113 of 120
Comment No
Chapter
FromPage
FromLine
To Page
To Line Comment Response
would result in nearly instantaneous changes in their concentrations." Is it necessary to say what is meant by "instanteous" (days to a month?). [Francis Zwiers, Canada]
12-1406 12 77 13 77 18 FAQ12.3: It would help the reader to set up the question of temperature commitment into two parts: 1. how long would it take for global surface temperature to rise to a new equilibrium level, and 2. how long would temperature then stay at that level (i.e. the persistence of the global temperature perturbation). The best place to insert this might be on line 18 after sentence that ends with "radiative forcing". This would help set up the discussion in the subsequent paragraphs as well. [Government of Canada]
Rejected. Part 1 is described. Part 2, how long temperatures stay on that level depend on the forcing, which itself is depending the emissions and lifetimes, discussed further up. We do not feel that adding text here would make things clearer and prefert to keep this short. More details are given in the relevant sections 12.5.2 and 12.5.4.
12-1407 12 77 16 77 16 Suggest replacing "so to reach" with "and reach". [Francis Zwiers, Canada] Accepted. Changed as suggested.
12-1408 12 77 19 77 19 Change "of" to "by", ie "… the Earth surface would still continue to warm BY about 0.3°C over the 21st Century …" [David Wratt, New Zealand]
Accepted. Changed as suggested.
12-1409 12 77 22 77 22 Replace "that" by "than" [Urs Neu, Switzerland] Accepted. Changed as suggested.
12-1410 12 77 25 77 26 Replace "greenhouse gases" by "greenhouse gas" (same as in line 28; or then change in line 28 to "gases" to be consistent) [Urs Neu, Switzerland]
Accepted. Changed as suggested.
12-1411 12 77 25 77 33 This paragraph fails to state clearly that elimination of emissions of CO2 will lead to stabilization of global mean temperature for several centuries, and elimination of all emissions (including non-CO2 greenhouse gases and aerosols) will lead to warming followed by a gradual cooling and subsequent temperatutre stabilization (Matthews, H.D., and K. Zickfeld, 2012, Climate response to zeroed emissions of greenhouse gases and aerosols, Nature Climate Change 2, 338-341). [Kirsten Zickfeld, Canada]
Accepted. Clarified as suggested.
12-1412 12 77 26 77 26 FAQ12.3: Suggest adding the words "at a rate determined by the lifetime of the gas (see above)". Linking explicitly back to the discussion in paragraph 2 would be helpful. [Government of Canada]
Accepted. Changed as suggested.
12-1413 12 77 29 77 29 Insert "reduction" after "pollution". [Francis Zwiers, Canada] Accepted. Changed as suggested.
12-1414 12 77 30 77 31 FAQ12.3: The text in this paragraph does not substantiate the statement that "setting all emissions to zero would therefore lead to a near stabilization of climate for multiple centuries". This finding has not been demonstrated or evidence for it presented. Suggest this sentence be reworded to say "setting all emissions to zero has been shown to lead to a global temperature perturbation that persists for multiple centuries, with global temperature remaining at or close to peak temperature levels". Figure 1, however, does not show the multiple century perturbation as it stops at 2150. Reference to, or use of an alternate Figure is required. [Government of Canada]
Accepted. The text has been clarified as suggested. The figure is illustrative and simple because this is an FAQ. The statements are strongly supported by several sections and figures in 12.5, but the style guide does not allow cross references in the FAQ.
12-1415 12 77 35 77 41 FAQ12.3: This paragraph is confusing, as written. It is not clear why peak CO2 concentration is important and the link from this to peak global temperature should be made more explicit. (Presume this is what is implied by the bracketed reference to climate sensitivity.) Referring to peak temperature would work, especially if the previous paragraph is modified as suggested to explain that global temperature remains near peak levels for multiple centuries even after emissions are halted. It might be simpler though just to focus on cumulative emissions and how different amounts of these match to different temperature targets, avoiding the reference to peak CO2 concentrations. [Government of Canada]
Accepted. Reworded to clarify.
12-1416 12 77 37 77 39 FAQ12.3: The CMIP5 projections done for the AR5 show that in many experiments, sustained negative emissions are required to meet the 2degrees C temperature target, so the reference here to requiring near zero emissions for this temperature target is misleading. [Government of Canada]
Accepted. Reference to zero emissions deleted.
12-1417 12 77 39 77 39 Insert "or even negative" after "requiring near zero". [Francis Zwiers, Canada] Noted. Text removed, no longer applies.
12-1418 12 77 40 77 40 Replace "delaying" with "permitting a delay in". [Francis Zwiers, Canada] Accepted. Changed as suggested.
12-1419 12 77 46 Suggest replacing "tipping point" with "threshold" for a less ambiguous term, e.g., 'abrupt & irreversible changes' or 'critical thresholds'. [Thomas Stocker/ WGI TSU, Switzerland]
Accepted. Changed as suggested.

Expert and Government Review Comments on the IPCC WGI AR5 Second Order Draft – Chapter 12
Do not Cite, Quote or Distribute Page 114 of 120
Comment No
Chapter
FromPage
FromLine
To Page
To Line Comment Response
12-1420 12 78 16 R. Allan --> R. P. Allan [Richard Allan, United Kingdom] Accepted, reference corrected
12-1421 12 79 27 79 28 The present correct reference is: Bentsen, M., I. Bethke, J. B. Debernard, T. Iversen, A. Kirkevåg, Ø. Seland, H. Drange, C. Roelandt, I. A. Seierstad, C. Hoose, and J. E. Kristjánsson: The Norwegian Earth System Model, NorESM1-M – Part 1: Description and basic evaluation. Geosci. Model Dev. Discuss., 5, 2843-2931, 2012. doi:10.5194/gmdd-5-2843-2012 [Trond Iversen, United Kingdom of Great Britain & Northern Ireland]
Accepted, reference corrected
12-1422 12 81 1 "Georgescu" misspelled in the Georgescu et al. (2011) reference (and also when the reference is cited earlier in the text). [Government of United States of America]
Accepted, reference corrected
12-1423 12 84 34 84 34 Add references: Frederiksen, C.S., J.S. Frederiksen, J.M. Sisson and S.L. Osbrough, 2011a: Australian winter circulation and rainfall changes and projections. Int. J. Clim. Change Strat. Mang., 3, Issue 2, 170-188. Frederiksen, C.S., J.S. Frederiksen, J.M. Sisson and S.L. Osbrough, 2011b: Changes and Projections in the Annual Cycle of the Southern Hemisphere Circulation, Storm Tracks and Australian Rainfall. Int. J. Clim. Change Impacts Responses, 2, 143-162. Frederiksen, J.S., C.S. Frederiksen, S.L. Osbrough and J.M. Sisson, 2010: Causes of changing Southern Hemispheric weather systems. Chapter 8, Managing Climate Change, Eds. I. Jupp, P. Holper and W. Cai, CSIRO publishing, pp85-98. [Jorgen Frederiksen, Australia]
Rejected. References are only added when mentioned in the text.
12-1424 12 87 44 87 45 The present correct reference is: Iversen, T., M. Bentsen, I. Bethke, J. B. Debernard, A. Kirkevåg, Ø. Seland, H. Drange, J. E. Kristjánsson, I. Medhaug, M. Sand, and I. A. Seierstad: The Norwegian Earth System Model, NorESM1-M – Part 2: Climate response and scenario projections. Geosci. Model Dev. Discuss., 5, 2933-2998, 2012. doi:10.5194/gmdd-5-2933-2012 [Trond Iversen, United Kingdom of Great Britain & Northern Ireland]
Accepted, reference corrected
12-1425 12 88 47 88 48 The present correct reference is: Kirkevåg, A., T. Iversen, Ø. Seland, C. Hoose, J. E. Kristjánsson, H. Struthers, A. M. L. Ekman, S. Ghan, J. Griesfeller, E. D. Nilsson, and M. Schulz: Aerosol-climate interactions in the Norwegian Earth System Model – NorESM. Geosci. Model Dev. Discuss., 5, 2599-2685, 2012.doi:10.5194/gmdd-5-2599-2012 [Trond Iversen, United Kingdom of Great Britain & Northern Ireland]
Accepted, reference corrected
12-1426 12 89 57 Langenbrunner, B. and J. D. Neelin, 2012: Analyzing ENSO teleconnections in CMIP models as a measure of model fidelity in simulating precipitation. J. Climate, accepted subject to minor revisions [if added p.14] [J. David Neelin, United States of America]
Noted. References are added automatically if cited in the text.
12-1427 12 98 18 98 19 This paper was published in 2009 not 2010. Also change 2010a on line 18 to 2010. [Ronald Prinn, United States of America]
Accepted.
12-1428 12 99 21 99 22 The present correct reference is: Tjiputra, J. F., C. Roelandt, M. Bentsen, D. M. Lawrence, T. Lorentzen, J. Schwinger, Ø. Seland, and C. Heinze: Evaluation of the carbon cycle components in the Norwegian Earth System Model (NorESM). Geosci. Model Dev. Discuss., 5, 3035-3087, 2012. doi:10.5194/gmdd-5-3035-2012. [Trond Iversen, United Kingdom of Great Britain & Northern Ireland]
Accepted.
12-1429 12 100 8 100 8 In the reference title, 'matching Australian' should be 'matching recent Australian'. Thank you for including this. [Ian Watterson, Australia]
Accepted.
12-1430 12 103 Table 12.1: Add a reference Adachi et al. (2012) for MRI-ESM1. Adachi, Y., et al., 2012: Simulations of climate and atmospheric chemistry and carbon cycle for the mid-19th century through the end of the 21st century by a new earth system model: MRI-ESM1. Papers in Meteorology and Geophysics, submitted. [Seiji Yukimoto, Japan]
Accepted - text revised [added citation to Adachi, Y., et al., 2013, Papers in Meteorology and Geophysics, in press]
12-1431 12 105 24 105 24 For the ACCESS1.0 and ACCESS1.3 models, it would be more accurate to simply say: "v5 Explosive volcanic aerosol set to zero in the pre-industrial control experiment, but returns slowly in future (over several decades) to a constant (average volcano) background value." [Anthony Hirst, Australia]
Accepted - text revised [footnote v5 reworded along the lines suggested]
Expert and Government Review Comments on the IPCC WGI AR5 Second Order Draft – Chapter 12
Do not Cite, Quote or Distribute Page 115 of 120
Comment No
Chapter
FromPage
FromLine
To Page
To Line Comment Response
12-1432 12 107 2 107 2 The legend for Fig 12.1 is confusing. It refers to the number of "ensembles", however, the caption refers to the number of "ensemble members". [Government of Canada]
Accepted. Fixed legend.
12-1433 12 107 Fig.12.1 is not readable [European Union] Noted. Final version with be at higher resolution.
12-1434 12 108 13 108 17 It is not clear that these last sentences, starting with "Different models…" are needed here. The diagram does not indicate how uncertainty arises and although the points made are important, they are made elsewhere in the text so could be deleted here. [Government of Canada]
Rejected. We choose to make the points also in the figure caption to emphasise them
12-1435 12 109 1 109 12 Box 12.1, Fig 1. Maps for method (e) are missing. Consider using legends for each pair of maps which explain the stippling and hatching. This information could be removed from the text in the box to reduce the length on pp. 12-14 and 12-15. [Government of Canada]
Accepted. Panel was missing, fixed in the new version.
12-1436 12 109 4 109 12 The caption should provide a general description of the meaning of stippling, hatching and masking – e.g. “hatching is used to indicate areas where projections are considered unreliable or in significant (relative to natural variability), stippling indicates reliable and significant projections” [Martin Juckes, United Kingdom]
Rejected. The discussion is provided in Box 12.1
12-1437 12 109 As for Figs. 11-16 and 11-18, it is desirable to improve contrast/legibility. [Robert Kandel, France] Rejected. Unspecific comment.
12-1438 12 109 There is no part (e) to the figure, but part (e) is referred to in the caption [Richard Wood, United Kingdom] Accepted. Panel was missing, fixed in the new version.
12-1439 12 110 10 110 10 I see now that "aerosol-radiative interactions" is consistent with the terminology used in Chapters 7 and 8, but for extra clarity it might be good to add "(i.e., direct effects only)". [Leon Rotstayn, Australia]
Accepted - text revised
12-1440 12 110 Figure 12.3 should be modified to include in (a) a horizontal bar showing the forcing at the end of the last ice age of 6.5 W/m2. That will provide a reference for how huge 8.5 is. Fig 12.3 also should be repeated in the SPM, with that modification. Fig 12.3 (b) needs a total for RCP 8.5 because that is the bau case and where the world is headed. That modification also should appear in the SPM. [Robert Charlson, United States of America]
Rejected - There is no dedicated section in this chapter on the comparison between paleo and future climate changes. We consider that showing only the radiative forcings without a dedicated discussion on the comparison between past and future climate changes is not relevant as the natures of the forcings are very different.
12-1441 12 110 Figure 12.3(a): Since only the aerosol direct forcing is shown in the lower panel, it is hard to distinguish between the curves. Can a different scale be used? [Leon Rotstayn, Australia]
Rejected - More detailed information on aerosol forcing is given in chapter 8 (Fig. 8.20 and 8.21). The goal of this figure is not to provide detailed information on individual forcings, but to allow direct comparison between the total forcing and the aerosol forcing. Therefore we choose to use the same scales.
12-1442 12 111 1 111 2 Fig 12.4. It would be nice if the CMIP3 A1B +/- 1 sigma range could be shown clearly (e.g., by dotted lines) so that it can be compared visually with those for the RCPs. [Government of Canada]
Accepted - figure revised [for improved clarity a different colour - green - is now used for CMIP3 A1B with thin lines rather than shading for the +/- 1 sigma range]
12-1443 12 112 Figure 12.5: Insert secondary y-axis on the right hand side with temperatures relative to pre-industrial levels (i.e. Shifted by 0.6C). This should also done in the SPM and TS, if such figures are shown. [Government of Germany]
Rejected. Difference to preindustrial is given in Table 12.2
12-1444 12 112 Figure 12.5: Figure was checked for inconsistencies with own professional experience and competency. No relevant disagreements were detected. [Dirk Thielen, Venezuela]
Noted.
12-1445 12 113 Fig. 12.6. Please add information on the difference between Fig a) and b). What is the difference between the ensemble mean and the mulit-model mean? [Government of Germany]
Taken into account - Figure caption and figure revised
12-1446 12 113 Figure 12.6: Figure was checked for inconsistencies with own professional experience and competency. No relevant disagreements were detected. [Dirk Thielen, Venezuela]
Noted.
12-1447 12 114 Figure 12.7: Figure was checked for inconsistencies with own professional experience and competency. No Noted.
Expert and Government Review Comments on the IPCC WGI AR5 Second Order Draft – Chapter 12
Do not Cite, Quote or Distribute Page 116 of 120
Comment No
Chapter
FromPage
FromLine
To Page
To Line Comment Response
relevant disagreements were detected. [Dirk Thielen, Venezuela]
12-1448 12 115 1 115 9 Please identify the SRES scenarios used. [Martin Juckes, United Kingdom] Rejected. Figure does not show SRES.
12-1449 12 115 FIg. 12.8.RCP3PD should be PCP2.6. This figure needs more explanations. See also our comments on section 124.1.2. and on this figure in the TS. [Government of Germany]
Accepted, text modified
12-1450 12 116 Figure 12.9 The figure would be much simpler to interpret if there were a common color bar. It seems that most other figures like this that in the document use one color bar. [Government of United States of America]
Accepted, figure modified
12-1451 12 120 1 120 2 Indicate the number of models in the maps that were used for the analysis similar to e.g. Fig. 12.11. [Stefan Fronzek, Finland]
Accepted, figure modified
12-1452 12 120 10 120 11 Fig. 12.13. The grey vertical stripes in the time series graphs highlight the 1981-2000, 2046-2065 and 2081-2100 time slices, but it is not clear why. [Government of Canada]
These are the reference periods for these figures as explained in the text.
12-1453 12 120 10 120 11 Figure 12.13 caption: There is no stippling in the figures. In the actual paper Sillmann et al. 2012, stippling indicates changes that are NOT significant at the 5% level. [Jana Sillmann, Canada]
Stippling has been added
12-1454 12 120 There is no stippling on these plots as suggested in the legend. Presumably there should be if you are adapting the Sillmann et al. 2012 analysis (if you are plotting 5% significance level). There also appears to be something strange with the masking of the plots e.g. many coastlines, Indonesia, New Zealand are missing and the masking appears somewhat different to that shown in e.g. Fig. 12.23 (not sure if this is an optical illusion though). [Lisa Alexander, Australia]
Stippling has been added
12-1455 12 120 Figure 12.13: In this figure it should be somewhere indicate how many CMIP5 models were included in this analysis. [Jana Sillmann, Canada]
Accepted, figure modified
12-1456 12 121 1 121 2 Indicate the number of models in the maps that were used for the analysis similar to e.g. Fig. 12.11. [Stefan Fronzek, Finland]
Accepted, figure modified
12-1457 12 121 1 121 6 Why is there no stippling etc here? The method used to calculate 20 year return values may be relevant. It could be estimated as the maximum value over 20 years in each ensemble member – and then stippling and hatching could be applied using the same approach as in mean temperature and precipitation plots. I suspect you are using a different approach – please specify. [Martin Juckes, United Kingdom]
Stippling by the method used for mean changes could not be done for these figures. We felt that other schemes did not provide much value.
12-1458 12 121 Figure 12.14: In the figure caption, there is no reference to the source of this figure (i.e. Kharin et al 2012) [Jana Sillmann, Canada]
Accepted, text modified
12-1459 12 122 5 122 5 Fig 12.15. Caption reads "for the historical period and three RCP scenarios….". That should be 'four' RCP scenarios. [Government of Canada]
Accepted, text modified
12-1460 12 125 1 125 8 Fig. 12.18 Caption reads "for RCP2.6, 4.5 and 8.5". However, JJA SLP in the lower centre panel is for RCP6.0. Either the map is correctly labelled and the caption is wrong, or the wrong map is being used. [Government of Canada]
This caption has been repaired.
12-1461 12 128 1 128 9 Fig. 12.21. Caption reads "…and annual mean (left)", however annual mean maps are on the right. [Government of Canada]
This caption has been repaired.
12-1462 12 129 4 132 4 Figs. 12.22, 12.23, 12.24, 12.25 and others. Many of these captions refer to "reference period 1985-2005". However, based on previous information, should this instead be "1986-2005"? [Government of Canada]
These captions have been repaired.
12-1463 12 129 Figure 12.22: Figure was checked for inconsistencies with own professional experience and competency. No relevant disagreements were detected. [Dirk Thielen, Venezuela]
Noted.
12-1464 12 133 Figure 12.26 - there is no stippling added? This would help to further justify the assessment of extreme precipitation changes presented in the executive summary and help clarify the assessment made in the Technical Summary TFE9 Table 1. [Lisa Alexander, Australia]
Stippling has been added
12-1465 12 133 Figure 12.26: The figure should include stippling/hatching of significant changes consistent with other figures Stippling has been added
Expert and Government Review Comments on the IPCC WGI AR5 Second Order Draft – Chapter 12
Do not Cite, Quote or Distribute Page 117 of 120
Comment No
Chapter
FromPage
FromLine
To Page
To Line Comment Response
in this chapter. Also it should be indicated how many CMIP5 models were considered in this analysis. [Jana Sillmann, Canada]
12-1466 12 133 Figure 12.26: Maybe it is worth showing another extreme precipitation index in this figure, .e.g. very wet days (R95p) or consecutive dry days (CDD) [Jana Sillmann, Canada]
CDD has been added.
12-1467 12 133 Figure 12.26: In the figure caption, there is no reference to the source of this figure (i.e. Sillmann et al 2012). [Jana Sillmann, Canada]
Citation has been added
12-1468 12 133 Figure 12.26: Figure was checked for inconsistencies with own professional experience and competency. No relevant disagreements were detected. [Dirk Thielen, Venezuela]
Noted.
12-1469 12 134 1 134 8 The caption states "Right: The average 2081–2100 CMIP5 multi-model ensemble median of the return periods (years) of 1986–2005 twenty year return values of annual maximum daily precipitation corresponding to 1 K of local warming. Regions of no change would have return periods of twenty years." However, the legend to the right hand map is in units of % and extends up to >30. So is it a percent change? There is no zero value indicated, so how does the legend relate to return periods of 20 years which should indicate no change? [Government of Canada]
This caption has been repaired.
12-1470 12 134 4 134 4 Caption reads Fig "10.27", but should be 12.27. [Government of Canada] This caption has been repaired.
12-1471 12 134 Figure 10.27, probably 12.27: This figure gives very important results and we recommend that it is included in the SPM. However it is difficult to understand and should be improved. The (%) linked to the right color bar is probably a typo; should it be return period or just years? If the right color bar were shifted, starting with 30 (in red to the left) ending with 10 (in blue to the right) it might be a better way to visualize and therefore easier to understand. Please write out RV20 and RP20 at the top, you should also consider to include a heading in the figure caption in bold something like "Projected changes in the return values and periods for heavy precipitation". In the caption we propose that you use Celsius instead of Kelvin, and that the explanation for especially the right panel should be made easier to understand. [Government of NORWAY]
A variation of this figure, using results for the RCP8.5 scenario has been put in the Technical Summary. Space does not permit longer figure headings.
12-1472 12 134 Figure 12.27: In the figure caption, there is no reference to the source of this figure (i.e. Kharin et al 2012) [Jana Sillmann, Canada]
Accepted, text modified
12-1473 12 134 Figure 10.27: Figure name should be 12.27 not 10.27. Otherwise, figure was checked for inconsistencies with own professional experience and competency. No relevant disagreements were detected. [Dirk Thielen, Venezuela]
This caption has been repaired.
12-1474 12 135 fig. 12.28 Should use a better reference for the 2011 data. [Government of United States of America] Accepted. The data from Comiso and Nishio (2008) have been updated through 2012.
12-1475 12 135 The observational curves are an important part of Fig 12.28 but they don't show up well. Could you find a clearer colour? [Richard Wood, United Kingdom]
Accepted. The curve showing the observational data in this figure is now coloured in green.
12-1476 12 136 Figure 12.29. Some of the colorbar labels were not displayed properly (to be more specific, at 30, 40 and 70 levels). [Gan Zhang, United States]
Accepted. This has been corrected.
12-1477 12 137 1 137 3 Fig. 12.30. Could you show the models identified in legends for each panel? It would be nice to know which models are the outliers. [Government of Canada]
Rejected. Identifying model names does not bring additional information to the figure message.
12-1478 12 137 Fig 12.30 has no notations on the mass of coloured lines to differentiate individual model results. [Government of United Kingdom of Great Britain & Northern Ireland]
Rejected. Identifying model names does not bring additional information to the figure message.
12-1479 12 138 Fig. 12.31. Given the methods of inference discussed in the txt (p 50 l 16-34), I suggest adding the observed values (with uncertainty ranges) to parts a,c and d of this figure, as done by Boe et al. I think it would be reasonable to put in the PIOMAS ice volumes to part b as well. [Richard Wood, United Kingdom]
Accepted. The observations and PIOMAS reanalysis data have been added to the figures.
12-1480 12 139 4 139 8 Please give the observed present-day snow cover area in the caption. [Jouni Räisänen, Finland] OK. For the reference period, Brown and Robinson (2011) give 32.6 mill sq km.
12-1481 12 139 7 139 7 No thin doted lines aparrent on Figure 12.32 [Richard Essery, United Kingdom of Great Britain & Northern Right. We have cut this reference to the thin dotted
Expert and Government Review Comments on the IPCC WGI AR5 Second Order Draft – Chapter 12
Do not Cite, Quote or Distribute Page 118 of 120
Comment No
Chapter
FromPage
FromLine
To Page
To Line Comment Response
Ireland] lines that is a left-over from previous versions of this chapter.
12-1482 12 140 fig. 33 Why are there no error bands for the historical period? Was this generated using observed or reanalysis data prior to 2005? Were the models bias-corrected to make them agree on an initial permafrost extent? Also, can you add independent, non-model derived estimates of permafrost extent over the observational period? [Government of United States of America]
Yes, this was produced using reanalysis data for the historical period and an anomaly method for the projections. We added estimates of current permafrost extent in the legend.
12-1483 12 140 Figure 12.33 - The figure is misleading as it implies that permafrost will completely thaw over this area although the caption refers to thawing of near-surface permafrost. The Y-axis label would seem to indicate that the figure shows the total area underlain by permafrost which is not the case. See previous comments regarding the use of terminology "near-surface permafrost area/extent" and the suggestion that it be avoided. [Sharon Smith, Canada]
See reply to comments #213, #980, #984 and #985. The axis title should indeed have read "Near-surface permafrost area", not "Permafrost area".
12-1484 12 142 1 142 7 Figure 12.35 each sub panel should show the RAPID/MOCHA 26N AMOC measurements shown in Figure 3.11b - this will show that some models get the mean AMOC wrong and also give an idication of the ability of the models to reproduce the observations - therefore an indication of the degree of confidence that can be placed in any conclusions drawn from the models regarding the future of the AMOC [Meric Srokosz, United Kingdom of Great Britain & Northern Ireland]
Rejected. Model evalution is done in chapter 9 but the corresponding fgiure in the technical summary does include the observations.
12-1485 12 143 1 143 2 Fig 12.36. Panels need to be labelled (a), (b), (c), (d). It would be better if (d) had the same vertical scale as (b). [Government of Canada]
Accepted, figure modified
12-1486 12 145 6 145 7 Fig. 12.38. "Left maps show the change in crop and pasture fractions due to the absence of future land-use as implemented in the four ESMs." This is not clear. Presumably the point is that land use was assumed to remain unchanged in the future in the "without LUC" experiments, but was projected to change in the simulations "with- LUC" (as the following sentence implies). [Government of Canada]
Taken into account, text clarified. First sentence explains that models were forced either with or without land-use change beyond 2005 under the RCP8.5 scenario
12-1487 12 146 1 146 11 Fig. 12.39. In the box and whisker plots, the circles are not explained. Are they the results obtained with individual models? [Government of Canada]
Accepted, figure improved.
12-1488 12 151 1 151 4 Fig. 12.44. Suggest that a bit more explanation is needed in the caption. What is meant by "compatible" in line 4? In panel (b), suggest having the y-axis extend from zero and show the pre-industrial CO2 concentration as a reference. [Government of Canada]
Accepted. Caption extended, axis changed.
12-1489 12 151 Figure needs to show aerosol forcing as well. Is aerosol forcing operating until 2300 and then aerosol (precursor) emissions turned off at the same time as CO2? If so, I would expect that temperature would show rapid increase as a consequence. I cannot imagine what rapidly decreasing positive forcings are turned off simultaneous with CO2 that would result in the drop in temperature indicated in the figure and referred to in the caption. [Stephen E Schwartz, United States of America]
Partly accepted. All non-CO2 forcings are set to zero in 2300, including positive ones (BC, CH4, N20), the negative forcing by aersols is small by then, therefore the cooling dominates. Text clarified accordingly, aersol forcing not shown. Details are provided in the paper.
12-1490 12 151 Figure 12.44: The caption should explicitly describe what the shading and the vertical bars indicate. [Junichi Tsutsui, Japan]
Accepted, description added.
12-1491 12 152 1 152 2 Box 12.2 Fig1: Lindzen and Choi methodology has been conclusively shown to be erroneous (as shown by Trenberth et al, 2010, Murphy, 2010 and Dessler 2010), so this result should not be included in this figure. [Government of Australia]
Rejected. The general rule is to show all results and discuss in the assessment which ones are more credible. Chapter 10 discusses these studies in much detail.
12-1492 12 152 4 152 12 There should be descriptions for the units used in Fig. 12.45, especially for the difference of [PgC]. [PgCe], and [PgCO2eq]. [Tomohiro Hajima, Japan]
Rejected. These are standard units used in climate reports.
12-1493 12 152 11 152 11 Change "Edy et al., 2012), and g)~" to "Edy et al., 2012), and h)~" [Tomohiro Hajima, Japan] Accepted. Fixed typo.
12-1494 12 152 11 152 12 It should be checked whether Fig. 12.45(h) is the result from "CMIP5 RCP8.5 simulation" or "CMIP5 historical plus RCP8.5 simulation" because both temperature change and cumulative emission seem to represent the result of 1850-2100 simulations. [Tomohiro Hajima, Japan]
Accepted. Clarified that historical and RCP data is used.
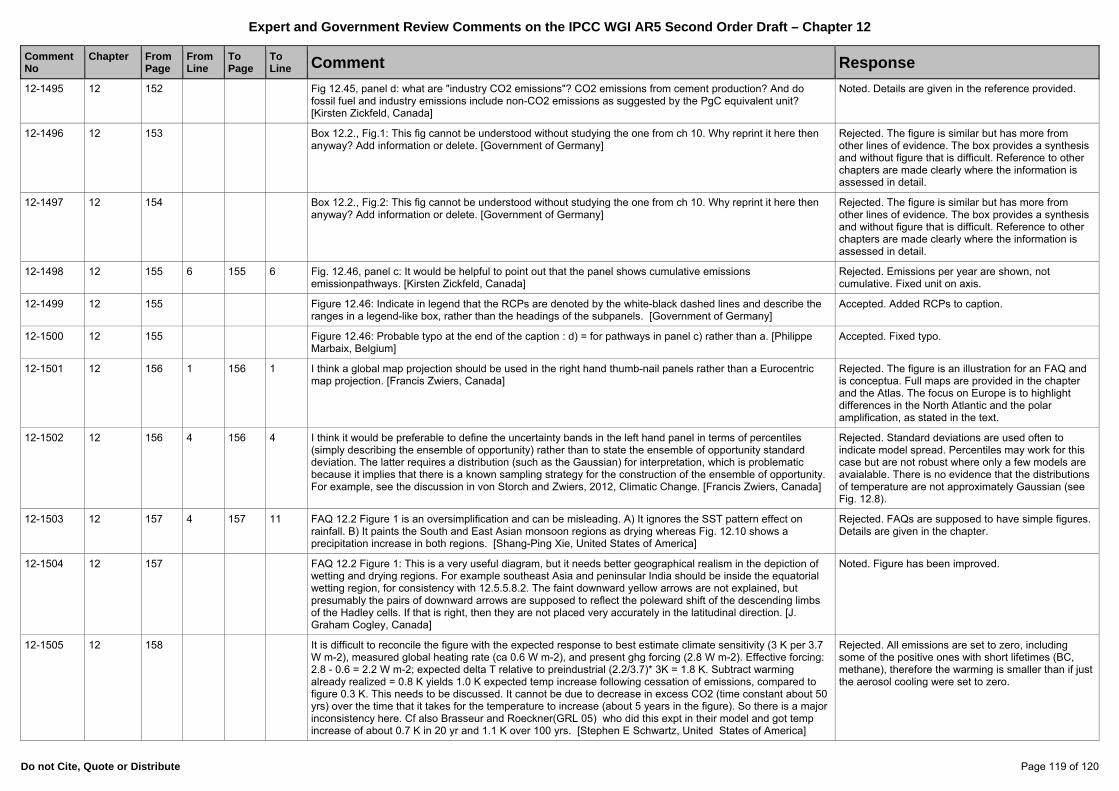
Expert and Government Review Comments on the IPCC WGI AR5 Second Order Draft – Chapter 12
Do not Cite, Quote or Distribute Page 119 of 120
Comment No
Chapter
FromPage
FromLine
To Page
To Line Comment Response
12-1495 12 152 Fig 12.45, panel d: what are "industry CO2 emissions"? CO2 emissions from cement production? And do fossil fuel and industry emissions include non-CO2 emissions as suggested by the PgC equivalent unit? [Kirsten Zickfeld, Canada]
Noted. Details are given in the reference provided.
12-1496 12 153 Box 12.2., Fig.1: This fig cannot be understood without studying the one from ch 10. Why reprint it here then anyway? Add information or delete. [Government of Germany]
Rejected. The figure is similar but has more from other lines of evidence. The box provides a synthesis and without figure that is difficult. Reference to other chapters are made clearly where the information is assessed in detail.
12-1497 12 154 Box 12.2., Fig.2: This fig cannot be understood without studying the one from ch 10. Why reprint it here then anyway? Add information or delete. [Government of Germany]
Rejected. The figure is similar but has more from other lines of evidence. The box provides a synthesis and without figure that is difficult. Reference to other chapters are made clearly where the information is assessed in detail.
12-1498 12 155 6 155 6 Fig. 12.46, panel c: It would be helpful to point out that the panel shows cumulative emissions emissionpathways. [Kirsten Zickfeld, Canada]
Rejected. Emissions per year are shown, not cumulative. Fixed unit on axis.
12-1499 12 155 Figure 12.46: Indicate in legend that the RCPs are denoted by the white-black dashed lines and describe the ranges in a legend-like box, rather than the headings of the subpanels. [Government of Germany]
Accepted. Added RCPs to caption.
12-1500 12 155 Figure 12.46: Probable typo at the end of the caption : d) = for pathways in panel c) rather than a. [Philippe Marbaix, Belgium]
Accepted. Fixed typo.
12-1501 12 156 1 156 1 I think a global map projection should be used in the right hand thumb-nail panels rather than a Eurocentric map projection. [Francis Zwiers, Canada]
Rejected. The figure is an illustration for an FAQ and is conceptua. Full maps are provided in the chapter and the Atlas. The focus on Europe is to highlight differences in the North Atlantic and the polar amplification, as stated in the text.
12-1502 12 156 4 156 4 I think it would be preferable to define the uncertainty bands in the left hand panel in terms of percentiles (simply describing the ensemble of opportunity) rather than to state the ensemble of opportunity standard deviation. The latter requires a distribution (such as the Gaussian) for interpretation, which is problematic because it implies that there is a known sampling strategy for the construction of the ensemble of opportunity. For example, see the discussion in von Storch and Zwiers, 2012, Climatic Change. [Francis Zwiers, Canada]
Rejected. Standard deviations are used often to indicate model spread. Percentiles may work for this case but are not robust where only a few models are avaialable. There is no evidence that the distributions of temperature are not approximately Gaussian (see Fig. 12.8).
12-1503 12 157 4 157 11 FAQ 12.2 Figure 1 is an oversimplification and can be misleading. A) It ignores the SST pattern effect on rainfall. B) It paints the South and East Asian monsoon regions as drying whereas Fig. 12.10 shows a precipitation increase in both regions. [Shang-Ping Xie, United States of America]
Rejected. FAQs are supposed to have simple figures. Details are given in the chapter.
12-1504 12 157 FAQ 12.2 Figure 1: This is a very useful diagram, but it needs better geographical realism in the depiction of wetting and drying regions. For example southeast Asia and peninsular India should be inside the equatorial wetting region, for consistency with 12.5.5.8.2. The faint downward yellow arrows are not explained, but presumably the pairs of downward arrows are supposed to reflect the poleward shift of the descending limbs of the Hadley cells. If that is right, then they are not placed very accurately in the latitudinal direction. [J. Graham Cogley, Canada]
Noted. Figure has been improved.
12-1505 12 158 It is difficult to reconcile the figure with the expected response to best estimate climate sensitivity (3 K per 3.7 W m-2), measured global heating rate (ca 0.6 W m-2), and present ghg forcing (2.8 W m-2). Effective forcing: 2.8 - 0.6 = 2.2 W m-2; expected delta T relative to preindustrial (2.2/3.7)* 3K = 1.8 K. Subtract warming already realized = 0.8 K yields 1.0 K expected temp increase following cessation of emissions, compared to figure 0.3 K. This needs to be discussed. It cannot be due to decrease in excess CO2 (time constant about 50 yrs) over the time that it takes for the temperature to increase (about 5 years in the figure). So there is a major inconsistency here. Cf also Brasseur and Roeckner(GRL 05) who did this expt in their model and got temp increase of about 0.7 K in 20 yr and 1.1 K over 100 yrs. [Stephen E Schwartz, United States of America]
Rejected. All emissions are set to zero, including some of the positive ones with short lifetimes (BC, methane), therefore the warming is smaller than if just the aerosol cooling were set to zero.
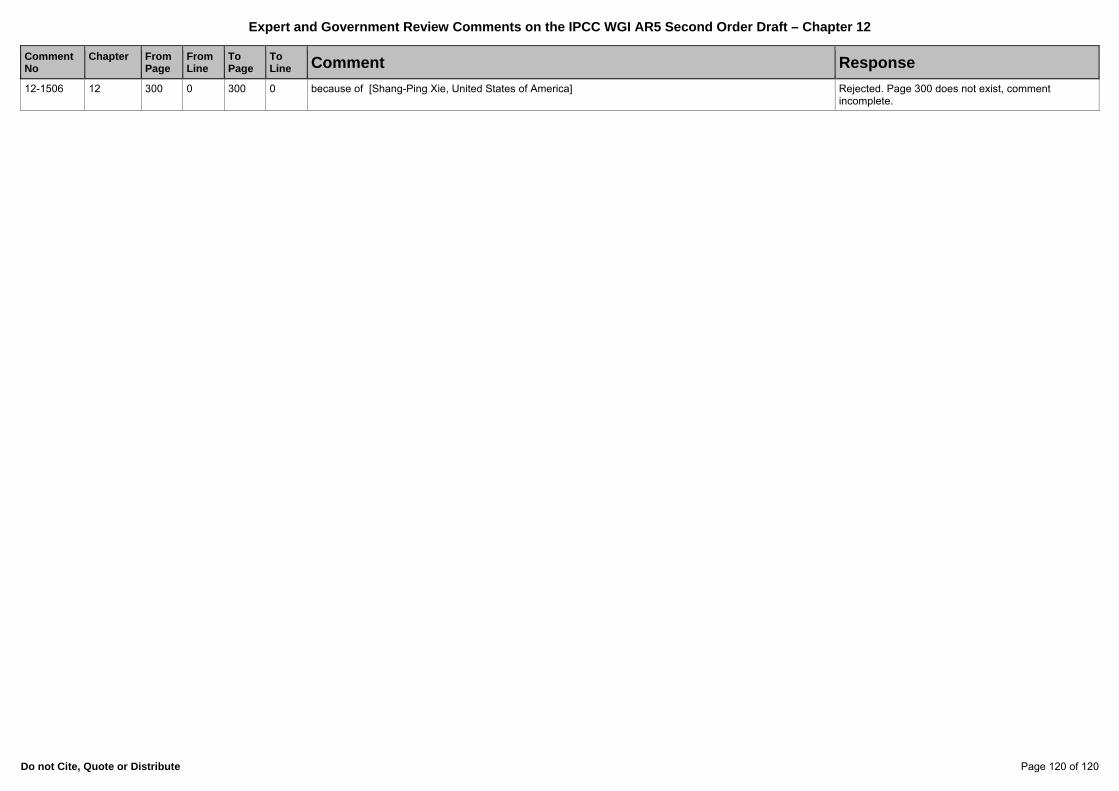
Expert and Government Review Comments on the IPCC WGI AR5 Second Order Draft – Chapter 12
Do not Cite, Quote or Distribute Page 120 of 120
Comment No
Chapter
FromPage
FromLine
To Page
To Line Comment Response
12-1506 12 300 0 300 0 because of [Shang-Ping Xie, United States of America] Rejected. Page 300 does not exist, comment incomplete.


![Technical Summary - World Agroforestry Centre · Box TS.1 Sourcing in the Technical Summary ... [WGI AR4 SPM] which refers to the ... the IPCC in July 2005. Description of confidence](https://static.fdocuments.us/doc/165x107/5b6b9b347f8b9a2b668da3c5/technical-summary-world-agroforestry-box-ts1-sourcing-in-the-technical-summary.jpg)