To be the - newcrest.com.au · newcrest’s vision is to be “ the miner of choice for all our...
156
2018 ANNUAL REPORT
Transcript of To be the - newcrest.com.au · newcrest’s vision is to be “ the miner of choice for all our...
2018ANNUAL REPORT
OUR VISION
To be the Miner of Choice.
To be the Miner of Choice for our people, shareholders, host communities, partners and suppliers.
OUR MISSION To safely deliver superior returns to our
stakeholders from finding, developing and operating gold/copper mines.
“NEWCREST’S VISION IS TO BE THE MINER OF CHOICE FOR ALL OUR STAKEHOLDERS.
SANDEEP BISWASMANAGING DIRECTOR AND CHIEF EXECUTIVE OFFICER
Forging A Stronger Newcrest 2
Key Achievements for FY18 4
Asset Overview 6
Newcrest Value Proposition 7
Chairman's Report 8
Managing Director's Review 8
The Board 10
Mineral Resources & Ore Reserves 26
Corporate Governance Statement 34
Directors’ Report 36
Financial Report 94
Corporate Directory 153
Introduction 15
Safety & Sustainability 16
People 18
Operating Performance 20
Technology & Innovation 22
Profitable Growth 24
FORGING A STRONGER NEWCREST
OUR COMPANY
OUR FIVE
PILLARS
1NEWCREST 2018 ANNUAL REPORT
2
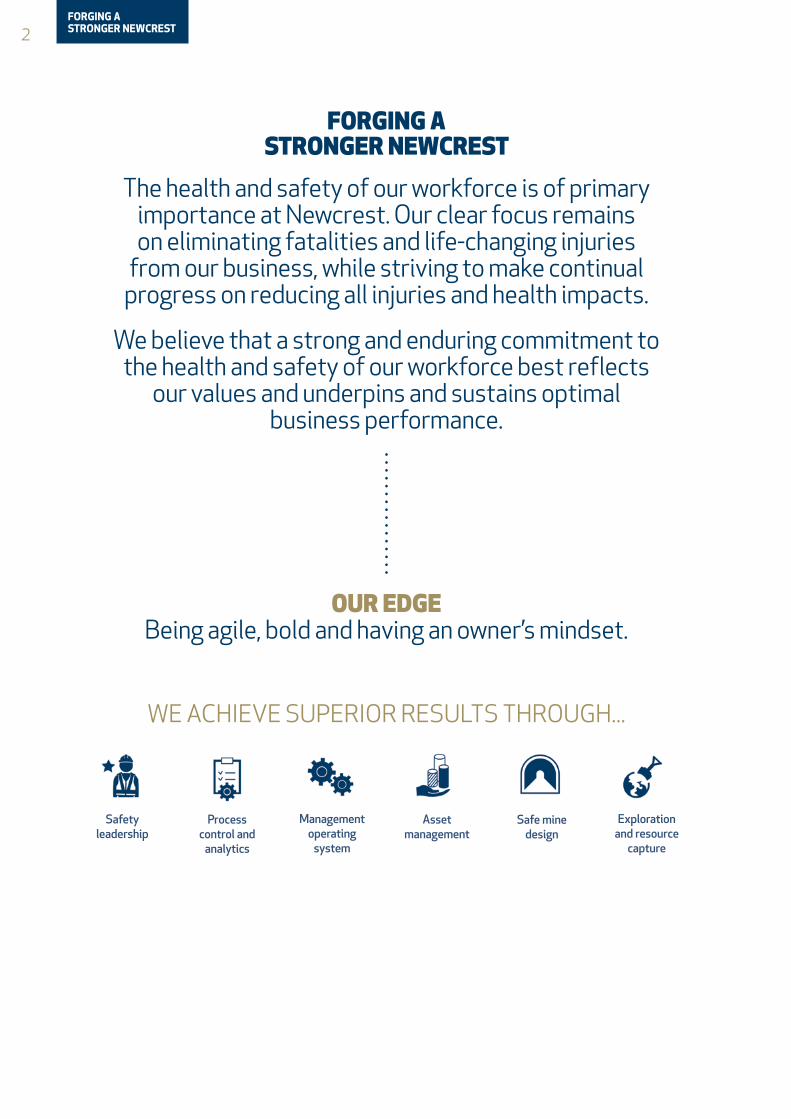
FORGING A STRONGER NEWCREST
The health and safety of our workforce is of primary importance at Newcrest. Our clear focus remains on eliminating fatalities and life-changing injuries
from our business, while striving to make continual progress on reducing all injuries and health impacts.
We believe that a strong and enduring commitment to the health and safety of our workforce best reflects
our values and underpins and sustains optimal business performance.
OUR EDGE Being agile, bold and having an owner’s mindset.
WE ACHIEVE SUPERIOR RESULTS THROUGH...
Exploration and resource
capture
Management operating
system
Safe mine design
Process control and
analytics
Safety leadership
Asset management
FORGING A STRONGER NEWCREST
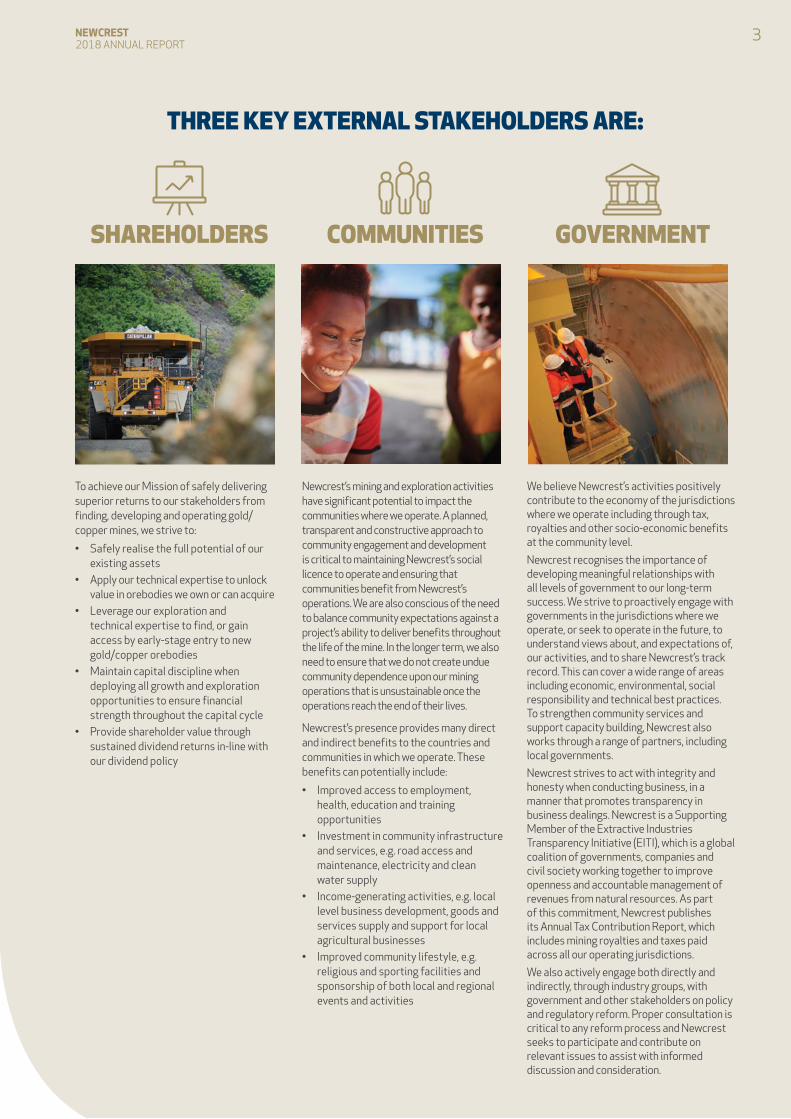
THREE KEY EXTERNAL STAKEHOLDERS ARE:
To achieve our Mission of safely delivering superior returns to our stakeholders from finding, developing and operating gold/copper mines, we strive to:
• Safely realise the full potential of our existing assets
• Apply our technical expertise to unlock value in orebodies we own or can acquire
• Leverage our exploration and technical expertise to find, or gain access by early-stage entry to new gold/copper orebodies
• Maintain capital discipline when deploying all growth and exploration opportunities to ensure financial strength throughout the capital cycle
• Provide shareholder value through sustained dividend returns in-line with our dividend policy
Newcrest’s mining and exploration activities have significant potential to impact the communities where we operate. A planned, transparent and constructive approach to community engagement and development is critical to maintaining Newcrest’s social licence to operate and ensuring that communities benefit from Newcrest’s operations. We are also conscious of the need to balance community expectations against a project’s ability to deliver benefits throughout the life of the mine. In the longer term, we also need to ensure that we do not create undue community dependence upon our mining operations that is unsustainable once the operations reach the end of their lives.
Newcrest’s presence provides many direct and indirect benefits to the countries and communities in which we operate. These benefits can potentially include:
• Improved access to employment, health, education and training opportunities
• Investment in community infrastructure and services, e.g. road access and maintenance, electricity and clean water supply
• Income-generating activities, e.g. local level business development, goods and services supply and support for local agricultural businesses
• Improved community lifestyle, e.g. religious and sporting facilities and sponsorship of both local and regional events and activities
We believe Newcrest’s activities positively contribute to the economy of the jurisdictions where we operate including through tax, royalties and other socio-economic benefits at the community level.
Newcrest recognises the importance of developing meaningful relationships with all levels of government to our long-term success. We strive to proactively engage with governments in the jurisdictions where we operate, or seek to operate in the future, to understand views about, and expectations of, our activities, and to share Newcrest’s track record. This can cover a wide range of areas including economic, environmental, social responsibility and technical best practices. To strengthen community services and support capacity building, Newcrest also works through a range of partners, including local governments.
Newcrest strives to act with integrity and honesty when conducting business, in a manner that promotes transparency in business dealings. Newcrest is a Supporting Member of the Extractive Industries Transparency Initiative (EITI), which is a global coalition of governments, companies and civil society working together to improve openness and accountable management of revenues from natural resources. As part of this commitment, Newcrest publishes its Annual Tax Contribution Report, which includes mining royalties and taxes paid across all our operating jurisdictions.
We also actively engage both directly and indirectly, through industry groups, with government and other stakeholders on policy and regulatory reform. Proper consultation is critical to any reform process and Newcrest seeks to participate and contribute on relevant issues to assist with informed discussion and consideration.
SHAREHOLDERS COMMUNITIES GOVERNMENT
3NEWCREST 2018 ANNUAL REPORT
4
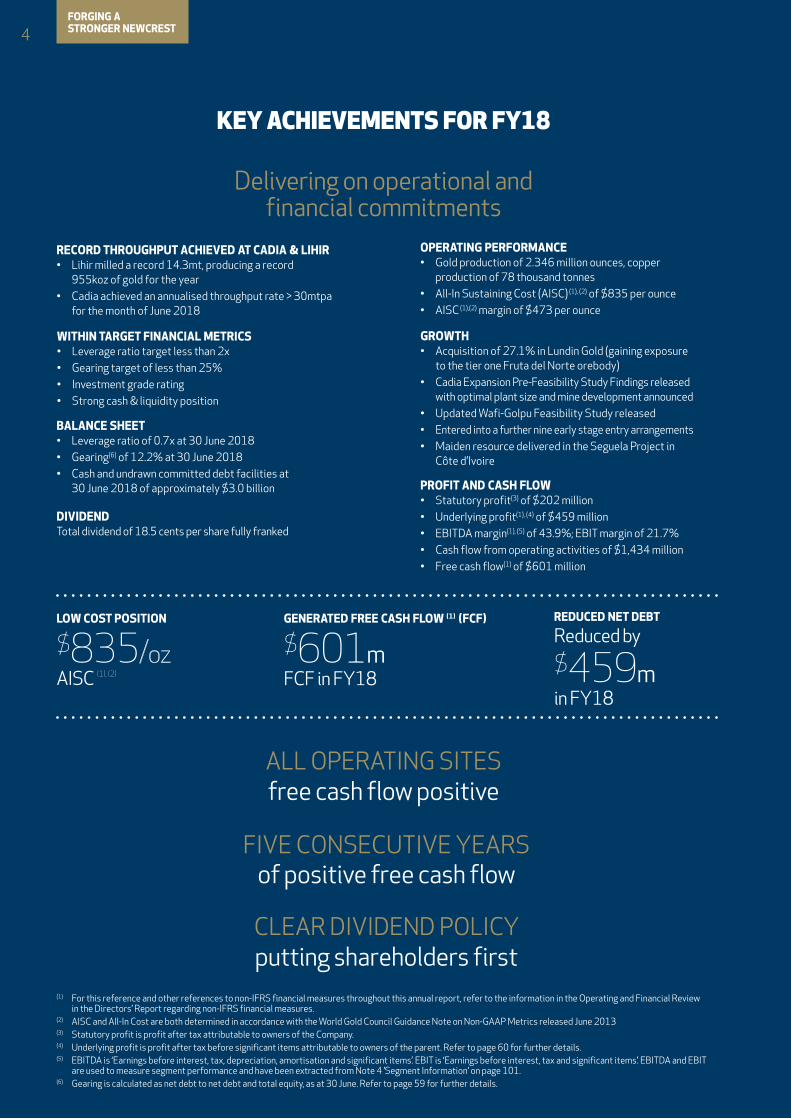
KEY ACHIEVEMENTS FOR FY18
Delivering on operational and financial commitments
OPERATING PERFORMANCE• Gold production of 2.346 million ounces, copper
production of 78 thousand tonnes• All-In Sustaining Cost (AISC) (1), (2) of $835 per ounce• AISC (1),(2) margin of $473 per ounce
BALANCE SHEET• Leverage ratio of 0.7x at 30 June 2018• Gearing(6) of 12.2% at 30 June 2018• Cash and undrawn committed debt facilities at
30 June 2018 of approximately $3.0 billion
GROWTH• Acquisition of 27.1% in Lundin Gold (gaining exposure
to the tier one Fruta del Norte orebody)• Cadia Expansion Pre-Feasibility Study Findings released
with optimal plant size and mine development announced• Updated Wafi-Golpu Feasibility Study released• Entered into a further nine early stage entry arrangements• Maiden resource delivered in the Seguela Project in
Côte d’Ivoire
PROFIT AND CASH FLOW• Statutory profit(3) of $202 million• Underlying profit(1), (4) of $459 million• EBITDA margin(1), (5) of 43.9%; EBIT margin of 21.7%• Cash flow from operating activities of $1,434 million• Free cash flow(1) of $601 million
WITHIN TARGET FINANCIAL METRICS• Leverage ratio target less than 2x• Gearing target of less than 25%• Investment grade rating• Strong cash & liquidity position
DIVIDENDTotal dividend of 18.5 cents per share fully franked
RECORD THROUGHPUT ACHIEVED AT CADIA & LIHIR• Lihir milled a record 14.3mt, producing a record
955koz of gold for the year• Cadia achieved an annualised throughput rate > 30mtpa
for the month of June 2018
of positive free cash flowFIVE CONSECUTIVE YEARS
putting shareholders firstCLEAR DIVIDEND POLICY
ALL OPERATING SITES free cash flow positive
LOW COST POSITION
$835/ozAISC (1), (2)
GENERATED FREE CASH FLOW (1) (FCF)
$601m FCF in FY18
REDUCED NET DEBT
Reduced by
$459m in FY18
(1) For this reference and other references to non-IFRS financial measures throughout this annual report, refer to the information in the Operating and Financial Review in the Directors’ Report regarding non-IFRS financial measures.
(2) AISC and All-In Cost are both determined in accordance with the World Gold Council Guidance Note on Non-GAAP Metrics released June 2013(3) Statutory profit is profit after tax attributable to owners of the Company.(4) Underlying profit is profit after tax before significant items attributable to owners of the parent. Refer to page 60 for further details.(5) EBITDA is ‘Earnings before interest, tax, depreciation, amortisation and significant items’. EBIT is ‘Earnings before interest, tax and significant items’. EBITDA and EBIT
are used to measure segment performance and have been extracted from Note 4 ’Segment Information’ on page 101.(6) Gearing is calculated as net debt to net debt and total equity, as at 30 June. Refer to page 59 for further details.
FORGING A STRONGER NEWCREST

GROUP GOLD PRODUCTION
THOUSAND OUNCES
FY14 2,396FY15 2,423FY16 2,439
FY17 2,381
FY18 2,346
GROUP COPPER PRODUCTION
THOUSAND TONNES
FY14 86FY15 97FY16 83
FY17 84
FY18 78
UNDERLYING PROFIT(1), (2) $ MILLION
FY14 393FY15 424FY16 323
FY17 394
FY18 459
EBIT(1), (2) $ MILLION
FY14 748FY15 811FY16 594
FY17 719
FY18 774
CASH FLOW FROM OPERATING ACTIVITIES(1), (2) $ MILLION
FY14 965FY15 1,280FY16 1,241
FY17 1,467
FY18 1,434
ALL-IN SUSTAINING COST(1) $/OUNCE
FY14 897FY15 780FY16 762
FY17 787
FY18 835
EBITDA(1), (2) $ MILLION
FY14 1,386FY15 1,385FY16 1,292FY17 1,408
FY18 1,565
LEVERAGE RATIO(1), (2), (3) TIMES
FY14 2.7FY15 2.1FY16 1.6
FY17 1.1
FY18 0.7
FREE CASH FLOW(1), (2) $ MILLION
FY14 136FY15 854FY16 814
FY17 739
FY18 601
FY18 RESULTS AT A GLANCE (1), (2)12 months to
30 June 201812 months to
30 June 2017%
Change
Gold produced (ounces) 2,346,354 2,380,630 (1%)Copper produced (tonnes) 77,975 83,941 (7%)Realised gold price ($ per ounce) 1,308 1,263 4%Realised copper price ($ per pound) 3.09 2.44 27%Average exchange rate (AUD:USD) 0.7754 0.7541 3%Sales revenue ($ millions) 3,562 3,477 2%EBITDA ($ millions) 1,565 1,408 11%EBIT ($ millions) 774 719 8%Statutory profit ($ millions) 202 308 (34%)Underlying profit ($ millions) 459 394 16%Cash flow from operating activities ($ millions) 1,434 1,467 (2%)Net cash outflow from investing activities ($ millions) 833 728 14%Free cash flow ($ millions) 601 739 (19%)Return on capital employed (ROCE) (percent) 8.8 7.9 11%Leverage ratio(3) (times) 0.7 1.1 (36%)Gearing (percent) 12.2 16.6 (27%)Total dividends (cents per share) 18.5 15.0 23%
(1) All financial data presented in the Annual Report is quoted in US dollars unless otherwise stated.(2) EBIT, EBITDA, Underlying profit, Free cash flow, ROCE and Gearing are non-IFRS financial information and have not been subject to audit by the Company’s external
auditor. Refer to the information in the Operating and Financial Review in the Directors' Report regarding non-IFRS financial measures.(3) Leverage ratio (Net debt to EBITDA) is calculated as net debt divided by EBITDA of the preceding 12 months. Calculated as at 30 June.
5NEWCREST 2018 ANNUAL REPORT
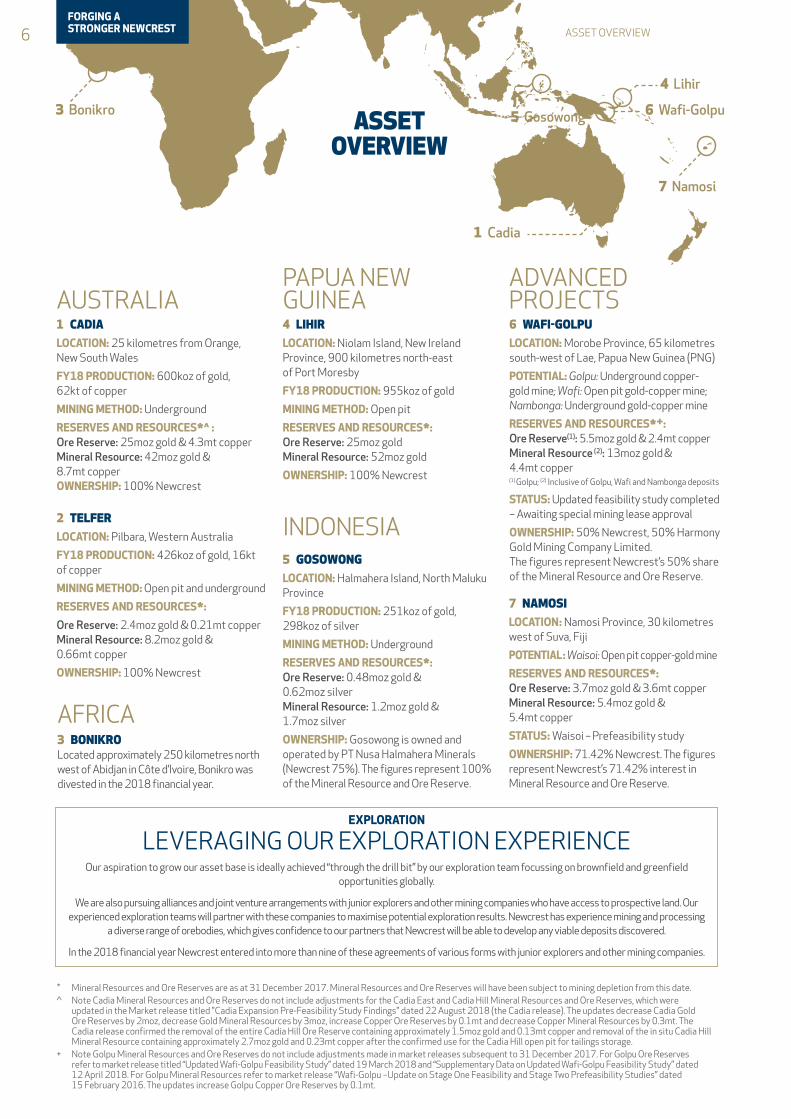
1 Cadia
2 Telfer
4 Lihir
6 Wafi-Golpu5 Gosowong
7 Namosi
3 Bonikro
6 ASSET OVERVIEW
* Mineral Resources and Ore Reserves are as at 31 December 2017. Mineral Resources and Ore Reserves will have been subject to mining depletion from this date.^ Note Cadia Mineral Resources and Ore Reserves do not include adjustments for the Cadia East and Cadia Hill Mineral Resources and Ore Reserves, which were
updated in the Market release titled "Cadia Expansion Pre-Feasibility Study Findings" dated 22 August 2018 (the Cadia release). The updates decrease Cadia Gold Ore Reserves by 2moz, decrease Gold Mineral Resources by 3moz, increase Copper Ore Reserves by 0.1mt and decrease Copper Mineral Resources by 0.3mt. The Cadia release confirmed the removal of the entire Cadia Hill Ore Reserve containing approximately 1.5moz gold and 0.13mt copper and removal of the in situ Cadia Hill Mineral Resource containing approximately 2.7moz gold and 0.23mt copper after the confirmed use for the Cadia Hill open pit for tailings storage.
+ Note Golpu Mineral Resources and Ore Reserves do not include adjustments made in market releases subsequent to 31 December 2017. For Golpu Ore Reserves refer to market release titled “Updated Wafi-Golpu Feasibility Study” dated 19 March 2018 and “Supplementary Data on Updated Wafi-Golpu Feasibility Study” dated 12 April 2018. For Golpu Mineral Resources refer to market release “Wafi-Golpu –Update on Stage One Feasibility and Stage Two Prefeasibility Studies” dated 15 February 2016. The updates increase Golpu Copper Ore Reserves by 0.1mt.
ASSET OVERVIEW
EXPLORATION
LEVERAGING OUR EXPLORATION EXPERIENCEOur aspiration to grow our asset base is ideally achieved “through the drill bit” by our exploration team focussing on brownfield and greenfield
opportunities globally.
We are also pursuing alliances and joint venture arrangements with junior explorers and other mining companies who have access to prospective land. Our experienced exploration teams will partner with these companies to maximise potential exploration results. Newcrest has experience mining and processing
a diverse range of orebodies, which gives confidence to our partners that Newcrest will be able to develop any viable deposits discovered.
In the 2018 financial year Newcrest entered into more than nine of these agreements of various forms with junior explorers and other mining companies.
AUSTRALIAADVANCED PROJECTS
FORGING A STRONGER NEWCREST
1 CADIA
LOCATION: 25 kilometres from Orange,New South Wales
FY18 PRODUCTION: 600koz of gold, 62kt of copper
MINING METHOD: Underground
RESERVES AND RESOURCES*^ :Ore Reserve: 25moz gold & 4.3mt copperMineral Resource: 42moz gold & 8.7mt copperOWNERSHIP: 100% Newcrest
2 TELFER
LOCATION: Pilbara, Western Australia
FY18 PRODUCTION: 426koz of gold, 16kt of copper
MINING METHOD: Open pit and underground
RESERVES AND RESOURCES*:
Ore Reserve: 2.4moz gold & 0.21mt copperMineral Resource: 8.2moz gold & 0.66mt copper
OWNERSHIP: 100% Newcrest
PAPUA NEW GUINEA4 LIHIR
LOCATION: Niolam Island, New Ireland Province, 900 kilometres north-east of Port Moresby
FY18 PRODUCTION: 955koz of gold
MINING METHOD: Open pit
RESERVES AND RESOURCES*: Ore Reserve: 25moz goldMineral Resource: 52moz gold
OWNERSHIP: 100% Newcrest
5 GOSOWONG
LOCATION: Halmahera Island, North Maluku Province
FY18 PRODUCTION: 251koz of gold, 298koz of silver
MINING METHOD: Underground
RESERVES AND RESOURCES*: Ore Reserve: 0.48moz gold & 0.62moz silverMineral Resource: 1.2moz gold & 1.7moz silver
OWNERSHIP: Gosowong is owned and operated by PT Nusa Halmahera Minerals (Newcrest 75%). The figures represent 100% of the Mineral Resource and Ore Reserve.
3 BONIKRO Located approximately 250 kilometres north west of Abidjan in Côte d’Ivoire, Bonikro was divested in the 2018 financial year.
INDONESIA
AFRICA
6 WAFI-GOLPU
LOCATION: Morobe Province, 65 kilometres south-west of Lae, Papua New Guinea (PNG)
POTENTIAL: Golpu: Underground copper-gold mine; Wafi: Open pit gold-copper mine; Nambonga: Underground gold-copper mine
RESERVES AND RESOURCES*+:Ore Reserve(1): 5.5moz gold & 2.4mt copperMineral Resource (2): 13moz gold & 4.4mt copper (1) Golpu; (2) Inclusive of Golpu, Wafi and Nambonga deposits
STATUS: Updated feasibility study completed – Awaiting special mining lease approval
OWNERSHIP: 50% Newcrest, 50% Harmony Gold Mining Company Limited.The figures represent Newcrest’s 50% share of the Mineral Resource and Ore Reserve.
7 NAMOSI
LOCATION: Namosi Province, 30 kilometres west of Suva, Fiji
POTENTIAL: Waisoi: Open pit copper-gold mine
RESERVES AND RESOURCES*:Ore Reserve: 3.7moz gold & 3.6mt copperMineral Resource: 5.4moz gold & 5.4mt copper
STATUS: Waisoi – Prefeasibility study
OWNERSHIP: 71.42% Newcrest. The figures represent Newcrest’s 71.42% interest in Mineral Resource and Ore Reserve.
FORGING A STRONGER NEWCREST
(1) See page 32 of this Annual Report. An updated Mineral Resources and Ore Reserves statement will be issued in February 2019. Details of updates subsequent to the Mineral Resources and Ore Reserves Statement released on 15 February 2018 can be found on pages 28 and 29.
(2) Reserve life is indicative and calculated as proven and probable gold reserves (contained metal) as at 31 December 2017 divided by gold production for the 12 months ended 30 June 2018. The reserve life calculation does not take into account gold recovery rates and therefore estimates of reserve life do not necessarily equate to operating mine life.
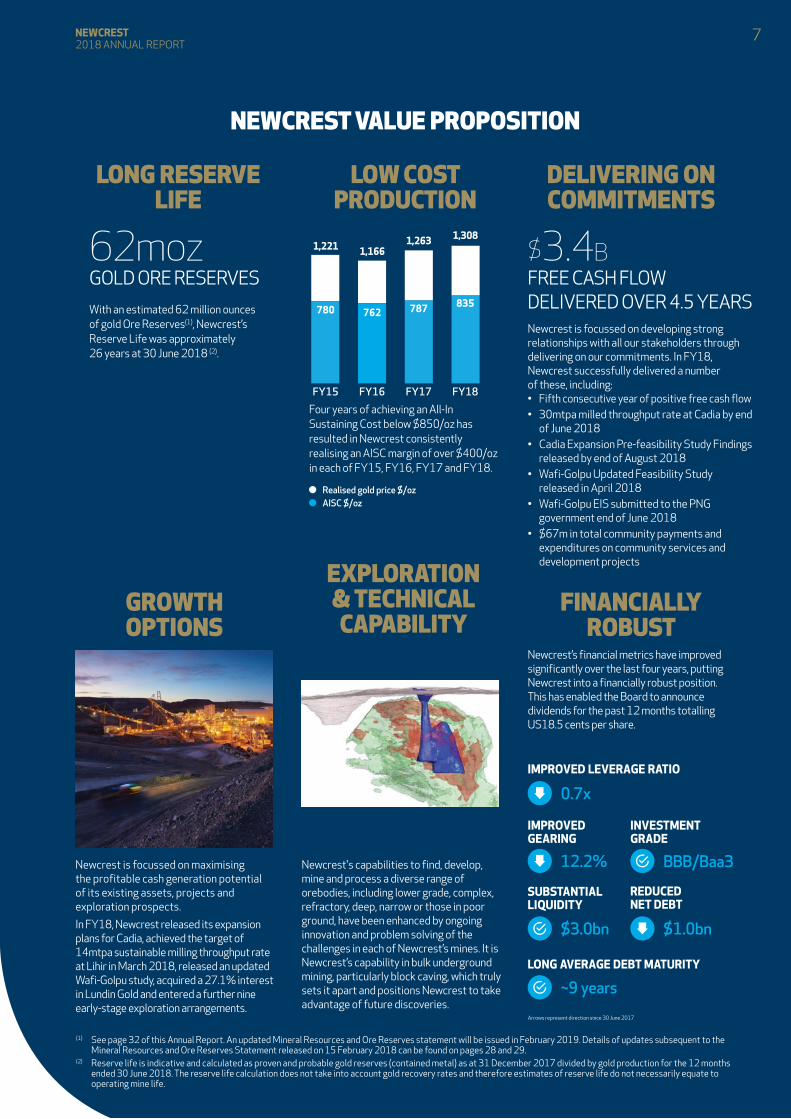
Four years of achieving an All-In Sustaining Cost below $850/oz has resulted in Newcrest consistently realising an AISC margin of over $400/oz in each of FY15, FY16, FY17 and FY18.
Newcrest is focussed on maximising the profitable cash generation potential of its existing assets, projects and exploration prospects.
In FY18, Newcrest released its expansion plans for Cadia, achieved the target of 14mtpa sustainable milling throughput rate at Lihir in March 2018, released an updated Wafi-Golpu study, acquired a 27.1% interest in Lundin Gold and entered a further nine early-stage exploration arrangements.
Newcrest's capabilities to find, develop, mine and process a diverse range of orebodies, including lower grade, complex, refractory, deep, narrow or those in poor ground, have been enhanced by ongoing innovation and problem solving of the challenges in each of Newcrest’s mines. It is Newcrest’s capability in bulk underground mining, particularly block caving, which truly sets it apart and positions Newcrest to take advantage of future discoveries.
IMPROVED LEVERAGE RATIO
0.7x
IMPROVED GEARING
12.2%
INVESTMENT GRADE
BBB/Baa3
REDUCED NET DEBT
$1.0bn
SUBSTANTIAL LIQUIDITY
$3.0bn
LONG AVERAGE DEBT MATURITY
~9 years
Newcrest’s financial metrics have improved significantly over the last four years, putting Newcrest into a financially robust position. This has enabled the Board to announce dividends for the past 12 months totalling US18.5 cents per share.
NEWCREST VALUE PROPOSITION
LONG RESERVE LIFE
LOW COST PRODUCTION
DELIVERING ON COMMITMENTS
GROWTH OPTIONS
EXPLORATION & TECHNICAL CAPABILITY
FINANCIALLY ROBUST
With an estimated 62 million ounces of gold Ore Reserves(1), Newcrest’s Reserve Life was approximately 26 years at 30 June 2018 (2).
Newcrest is focussed on developing strong relationships with all our stakeholders through delivering on our commitments. In FY18, Newcrest successfully delivered a number of these, including:• Fifth consecutive year of positive free cash flow• 30mtpa milled throughput rate at Cadia by end
of June 2018• Cadia Expansion Pre-feasibility Study Findings
released by end of August 2018• Wafi-Golpu Updated Feasibility Study
released in April 2018• Wafi-Golpu EIS submitted to the PNG
government end of June 2018• $67m in total community payments and
expenditures on community services and development projects
FY150
300
600
900
1200
1500
1,221
780
FY16
1,166
762
FY17
1,263
787
FY18
1,308
835
Realised gold price $/oz AISC $/oz
62moz GOLD ORE RESERVES
$3.4B FREE CASH FLOW DELIVERED OVER 4.5 YEARS
Arrows represent direction since 30 June 2017
7NEWCREST 2018 ANNUAL REPORT
8
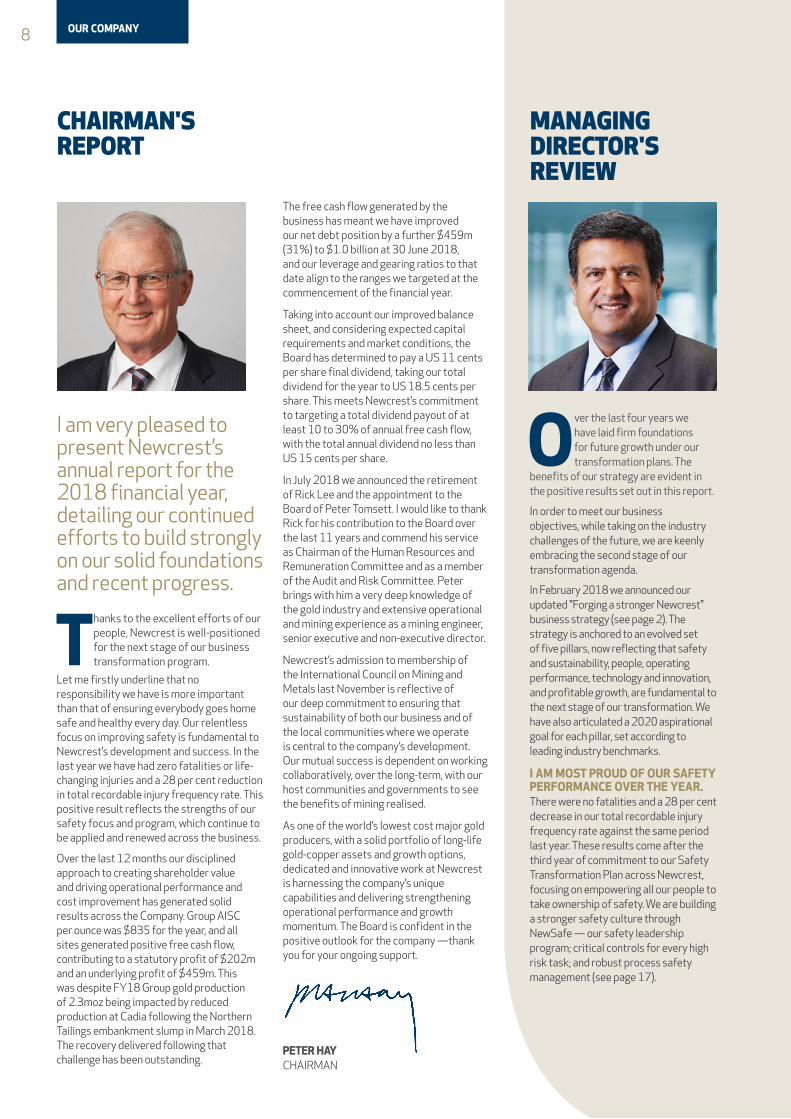
CHAIRMAN'S REPORT
I am very pleased to present Newcrest’s annual report for the 2018 financial year, detailing our continued efforts to build strongly on our solid foundations and recent progress.
Thanks to the excellent efforts of our people, Newcrest is well-positioned for the next stage of our business transformation program.
Let me firstly underline that no responsibility we have is more important than that of ensuring everybody goes home safe and healthy every day. Our relentless focus on improving safety is fundamental to Newcrest’s development and success. In the last year we have had zero fatalities or life-changing injuries and a 28 per cent reduction in total recordable injury frequency rate. This positive result reflects the strengths of our safety focus and program, which continue to be applied and renewed across the business.
Over the last 12 months our disciplined approach to creating shareholder value and driving operational performance and cost improvement has generated solid results across the Company. Group AISC per ounce was $835 for the year, and all sites generated positive free cash flow, contributing to a statutory profit of $202m and an underlying profit of $459m. This was despite FY18 Group gold production of 2.3moz being impacted by reduced production at Cadia following the Northern Tailings embankment slump in March 2018. The recovery delivered following that challenge has been outstanding.
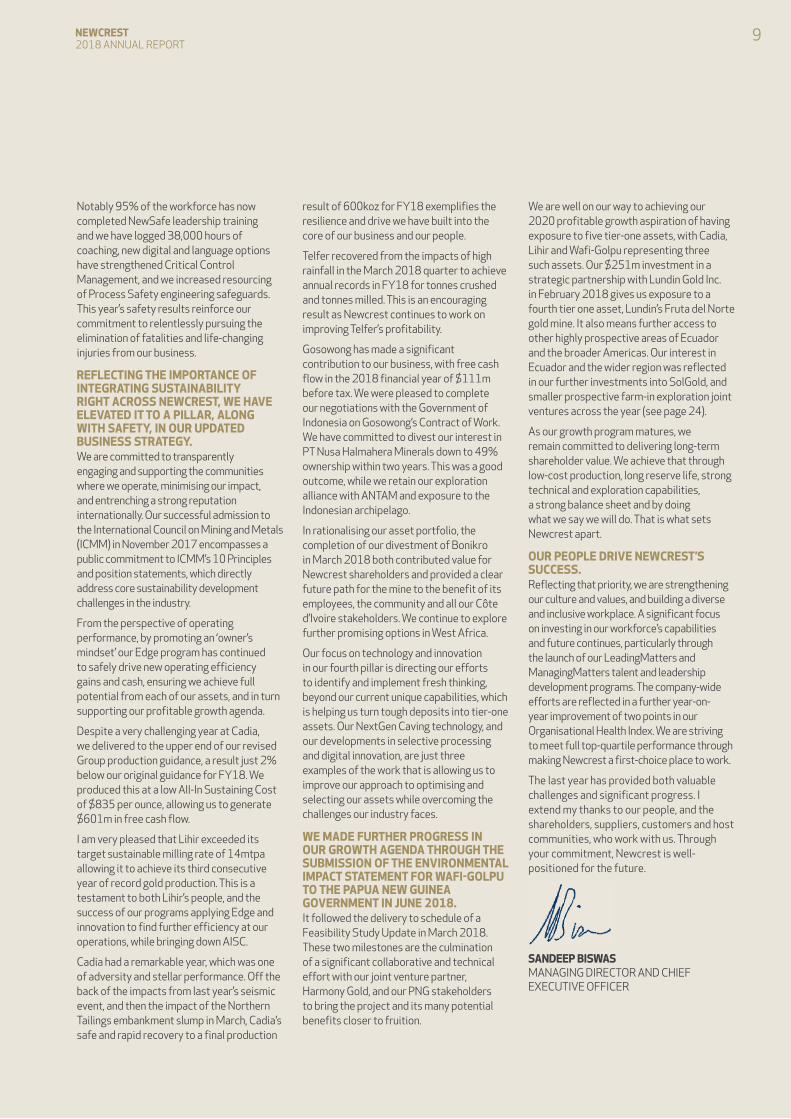
MANAGING DIRECTOR'S REVIEW
Over the last four years we have laid firm foundations for future growth under our transformation plans. The
benefits of our strategy are evident in the positive results set out in this report.
In order to meet our business objectives, while taking on the industry challenges of the future, we are keenly embracing the second stage of our transformation agenda.
In February 2018 we announced our updated "Forging a stronger Newcrest" business strategy (see page 2). The strategy is anchored to an evolved set of five pillars, now reflecting that safety and sustainability, people, operating performance, technology and innovation, and profitable growth, are fundamental to the next stage of our transformation. We have also articulated a 2020 aspirational goal for each pillar, set according to leading industry benchmarks.
I AM MOST PROUD OF OUR SAFETY PERFORMANCE OVER THE YEAR. There were no fatalities and a 28 per cent decrease in our total recordable injury frequency rate against the same period last year. These results come after the third year of commitment to our Safety Transformation Plan across Newcrest, focusing on empowering all our people to take ownership of safety. We are building a stronger safety culture through NewSafe — our safety leadership program; critical controls for every high risk task; and robust process safety management (see page 17).
The free cash flow generated by the business has meant we have improved our net debt position by a further $459m (31%) to $1.0 billion at 30 June 2018, and our leverage and gearing ratios to that date align to the ranges we targeted at the commencement of the financial year.
Taking into account our improved balance sheet, and considering expected capital requirements and market conditions, the Board has determined to pay a US 11 cents per share final dividend, taking our total dividend for the year to US 18.5 cents per share. This meets Newcrest’s commitment to targeting a total dividend payout of at least 10 to 30% of annual free cash flow, with the total annual dividend no less than US 15 cents per share.
In July 2018 we announced the retirement of Rick Lee and the appointment to the Board of Peter Tomsett. I would like to thank Rick for his contribution to the Board over the last 11 years and commend his service as Chairman of the Human Resources and Remuneration Committee and as a member of the Audit and Risk Committee. Peter brings with him a very deep knowledge of the gold industry and extensive operational and mining experience as a mining engineer, senior executive and non-executive director.
Newcrest’s admission to membership of the International Council on Mining and Metals last November is reflective of our deep commitment to ensuring that sustainability of both our business and of the local communities where we operate is central to the company’s development. Our mutual success is dependent on working collaboratively, over the long-term, with our host communities and governments to see the benefits of mining realised.
As one of the world’s lowest cost major gold producers, with a solid portfolio of long-life gold-copper assets and growth options, dedicated and innovative work at Newcrest is harnessing the company’s unique capabilities and delivering strengthening operational performance and growth momentum. The Board is confident in the positive outlook for the company —thank you for your ongoing support.
PETER HAY CHAIRMAN
OUR COMPANY
Notably 95% of the workforce has now completed NewSafe leadership training and we have logged 38,000 hours of coaching, new digital and language options have strengthened Critical Control Management, and we increased resourcing of Process Safety engineering safeguards. This year’s safety results reinforce our commitment to relentlessly pursuing the elimination of fatalities and life-changing injuries from our business.
REFLECTING THE IMPORTANCE OF INTEGRATING SUSTAINABILITY RIGHT ACROSS NEWCREST, WE HAVE ELEVATED IT TO A PILLAR, ALONG WITH SAFETY, IN OUR UPDATED BUSINESS STRATEGY. We are committed to transparently engaging and supporting the communities where we operate, minimising our impact, and entrenching a strong reputation internationally. Our successful admission to the International Council on Mining and Metals (ICMM) in November 2017 encompasses a public commitment to ICMM’s 10 Principles and position statements, which directly address core sustainability development challenges in the industry.
From the perspective of operating performance, by promoting an ‘owner’s mindset’ our Edge program has continued to safely drive new operating efficiency gains and cash, ensuring we achieve full potential from each of our assets, and in turn supporting our profitable growth agenda.
Despite a very challenging year at Cadia, we delivered to the upper end of our revised Group production guidance, a result just 2% below our original guidance for FY18. We produced this at a low All-In Sustaining Cost of $835 per ounce, allowing us to generate $601m in free cash flow.
I am very pleased that Lihir exceeded its target sustainable milling rate of 14mtpa allowing it to achieve its third consecutive year of record gold production. This is a testament to both Lihir’s people, and the success of our programs applying Edge and innovation to find further efficiency at our operations, while bringing down AISC.
Cadia had a remarkable year, which was one of adversity and stellar performance. Off the back of the impacts from last year’s seismic event, and then the impact of the Northern Tailings embankment slump in March, Cadia’s safe and rapid recovery to a final production
result of 600koz for FY18 exemplifies the resilience and drive we have built into the core of our business and our people.
Telfer recovered from the impacts of high rainfall in the March 2018 quarter to achieve annual records in FY18 for tonnes crushed and tonnes milled. This is an encouraging result as Newcrest continues to work on improving Telfer’s profitability.
Gosowong has made a significant contribution to our business, with free cash flow in the 2018 financial year of $111m before tax. We were pleased to complete our negotiations with the Government of Indonesia on Gosowong’s Contract of Work. We have committed to divest our interest in PT Nusa Halmahera Minerals down to 49% ownership within two years. This was a good outcome, while we retain our exploration alliance with ANTAM and exposure to the Indonesian archipelago.
In rationalising our asset portfolio, the completion of our divestment of Bonikro in March 2018 both contributed value for Newcrest shareholders and provided a clear future path for the mine to the benefit of its employees, the community and all our Côte d’Ivoire stakeholders. We continue to explore further promising options in West Africa.
Our focus on technology and innovation in our fourth pillar is directing our efforts to identify and implement fresh thinking, beyond our current unique capabilities, which is helping us turn tough deposits into tier-one assets. Our NextGen Caving technology, and our developments in selective processing and digital innovation, are just three examples of the work that is allowing us to improve our approach to optimising and selecting our assets while overcoming the challenges our industry faces.
WE MADE FURTHER PROGRESS IN OUR GROWTH AGENDA THROUGH THE SUBMISSION OF THE ENVIRONMENTAL IMPACT STATEMENT FOR WAFI-GOLPU TO THE PAPUA NEW GUINEA GOVERNMENT IN JUNE 2018.It followed the delivery to schedule of a Feasibility Study Update in March 2018. These two milestones are the culmination of a significant collaborative and technical effort with our joint venture partner, Harmony Gold, and our PNG stakeholders to bring the project and its many potential benefits closer to fruition.
We are well on our way to achieving our 2020 profitable growth aspiration of having exposure to five tier-one assets, with Cadia, Lihir and Wafi-Golpu representing three such assets. Our $251m investment in a strategic partnership with Lundin Gold Inc. in February 2018 gives us exposure to a fourth tier one asset, Lundin’s Fruta del Norte gold mine. It also means further access to other highly prospective areas of Ecuador and the broader Americas. Our interest in Ecuador and the wider region was reflected in our further investments into SolGold, and smaller prospective farm-in exploration joint ventures across the year (see page 24).
As our growth program matures, we remain committed to delivering long-term shareholder value. We achieve that through low-cost production, long reserve life, strong technical and exploration capabilities, a strong balance sheet and by doing what we say we will do. That is what sets Newcrest apart.
OUR PEOPLE DRIVE NEWCREST’S SUCCESS. Reflecting that priority, we are strengthening our culture and values, and building a diverse and inclusive workplace. A significant focus on investing in our workforce’s capabilities and future continues, particularly through the launch of our LeadingMatters and ManagingMatters talent and leadership development programs. The company-wide efforts are reflected in a further year-on-year improvement of two points in our Organisational Health Index. We are striving to meet full top-quartile performance through making Newcrest a first-choice place to work.
The last year has provided both valuable challenges and significant progress. I extend my thanks to our people, and the shareholders, suppliers, customers and host communities, who work with us. Through your commitment, Newcrest is well-positioned for the future.
SANDEEP BISWAS MANAGING DIRECTOR AND CHIEF EXECUTIVE OFFICER
9NEWCREST 2018 ANNUAL REPORT

10 THE BOARD
1. PETER HAY
LLB, FAICD, 68Independent Non-Executive ChairmanMr Hay was appointed as Non-Executive Chairman of the Board in January 2014, after being appointed as a Non-Executive Director in August 2013. Mr Hay is also the Chairman of the Nominations Committee.
Skills, experience and expertise
Mr Hay has a strong background and breadth of experience in business, corporate law, finance and investment banking advisory work, with a particular expertise in relation to mergers and acquisitions. He has also had significant involvement in advising governments and government-owned enterprises. Mr Hay was a partner of the legal firm Freehills until 2005, where he served as Chief Executive Officer from 2000.
Current Listed Directorships• Chairman of Vicinity Centres
(from 2015)
Other Current Directorships/Appointments• Member of AICD Corporate
Governance Committee
Former Listed Directorships (last three years)• Director of GUD Holdings
Limited (2009–2015)• Director of Novion Limited
(2014–2015)
2. SANDEEP BISWAS
BEng (Chem) (Hons), FAusIMM, 56Managing Director and Chief Executive Officer Mr Biswas was appointed Managing Director and Chief Executive Officer effective 4 July 2014. He joined Newcrest in January 2014, as an Executive Director and Chief Operating Officer.
Skills, experience and expertise
Mr Biswas was previously Chief Executive Officer of Pacific Aluminium, a wholly owned subsidiary within the Rio Tinto group, which incorporated the bauxite, alumina, refining and smelting operations in Australia and New Zealand. He began his career with Mount Isa Mines, working in both Australia and Europe. Mr Biswas has also worked for Western Mining Corporation in Australia and Rio Tinto in Canada and Australia. He has experience in research, operations, business development and projects, across commodities including aluminium, copper, lead, zinc and nickel.
Current Directorships/appointments• Vice Chairman of the
Minerals Council of Australia • Director of the World Gold
Council• Member of ICMM Council
THE BOARD
1
2
3
4
5
6
OUR COMPANY

3. GERARD BOND
BComm, Graduate Diploma Applied Finance and Investment, Chartered Accountant, F Fin, 50Finance Director and Chief Financial OfficerMr Bond was appointed to the Board as an Executive Director in February 2012, after joining Newcrest as Finance Director and Chief Financial Officer in January 2012.
Skills, experience and expertise
Mr Bond has experience in the global financial and resources industry with BHP Billiton, Coopers & Lybrand and Price Waterhouse. Prior to joining Newcrest, Mr Bond was with BHP Billiton for over 14 years where he held a number of senior executive roles in Europe and Australia including in Mergers and Acquisitions, Treasury, as Deputy CFO of the Aluminium business, CFO and then Acting President of the Nickel business, and as BHP Billiton’s Head of Group Human Resources.
Other Current Directorships/appointments• Alternate Director of the
World Gold Council
4. PHILIP AIKEN AM
BEng (Chemical), Advanced Management Program (HBS), 69Independent Non-Executive DirectorMr Aiken was appointed to the Board in April 2013. He is Chairman of the Safety and Sustainability Committee and a member of the Human Resources and Remuneration Committee and the Nominations Committee. He is retiring as Chairman of the Safety and Sustainability Committee and has been appointed as Chairman of the Human Resources and Remuneration Committee with effect immediately following the AGM on 14 November 2018.
Skills, experience and expertise
Mr Aiken has extensive Australian and international business experience, principally in the engineering and resources sectors. He was Group President Energy BHP Billiton, President BHP Petroleum, Managing Director BOC/CIG, Chief Executive of BTR Nylex and Senior Advisor Macquarie Capital (Europe).
Current Listed Directorships• Chairman of Aveva Group plc
(from 2012)• Chairman of Balfour Beatty
plc (from 2015)
Current Directorships/appointments• Business Ambassador,
Business Events Sydney (from 2016)
• Chairman of Australia Day Foundation (from 2007)
• Chairman of Gammon China Limited (from 2018)
• Chairman of Gammon Construction Holdings Limited (from 2018)
Former Listed Directorships (last 3 years)• Director of National Grid plc
(2008–2015)
5. RICK LEE AM
BEng (Chemical) (Hons), MA (Econ) (Oxon), FAICD, 68Independent Non-Executive DirectorMr Lee was appointed to the Board in August 2007. He is Chairman of the Human Resources and Remuneration Committee and a member of the Audit and Risk Committee. Mr Lee is retiring from the Board with effect immediately following the AGM on 14 November 2018.
Skills, experience and expertise
Mr Lee has extensive resources, banking, finance and international commercial experience. His previous senior executive roles include 16 years with CSR Limited and nine years as Chief Executive Officer of NM Rothschild Australia Limited. He is a former Chairman of the Australian Institute of Company Directors and C. Czarnikow Limited and is a former Non-Executive Director of CSR Limited.
Current Listed Directorships• Chairman of Ruralco Holdings
Limited (from 2016)• Chairman of Oil Search
Limited (Director from 2012, Chairman from 2013)
6. XIAOLING LIU
BEng (Extractive Metallurgy), PhD (Extractive Metallurgy), GAICD, FAusIMM, 62Independent Non-Executive DirectorDr Liu was appointed to the Board in September 2015. She is a member of the Human Resources and Remuneration Committee, the Audit and Risk Committee and the Nominations Committee.
Skills, experience and expertise
Dr Liu has extensive executive experience in leading global mining and processing businesses. Her last executive role was as President and Chief Executive Officer of Rio Tinto Minerals based in Denver, where she ran integrated mining, processing and supply chain operations in the United States, Europe and Asia. Prior to her last executive role, Dr Liu held senior management and operational roles at Rio Tinto throughout her career including President – Primary Metal Pacific, Managing Director – Global Technical Services and General Manager Bell Bay Smelter.
Current Listed Directorships• Director of Iluka Resources
Limited (from 2016)• Director of South 32 Limited
(from 2017)
Other Current Directorships/appointments• Director of Melbourne
Business School (from 2016)• Member of the China
Matters Advisory Council (from 2017)
11NEWCREST 2018 ANNUAL REPORT
12 THE BOARD
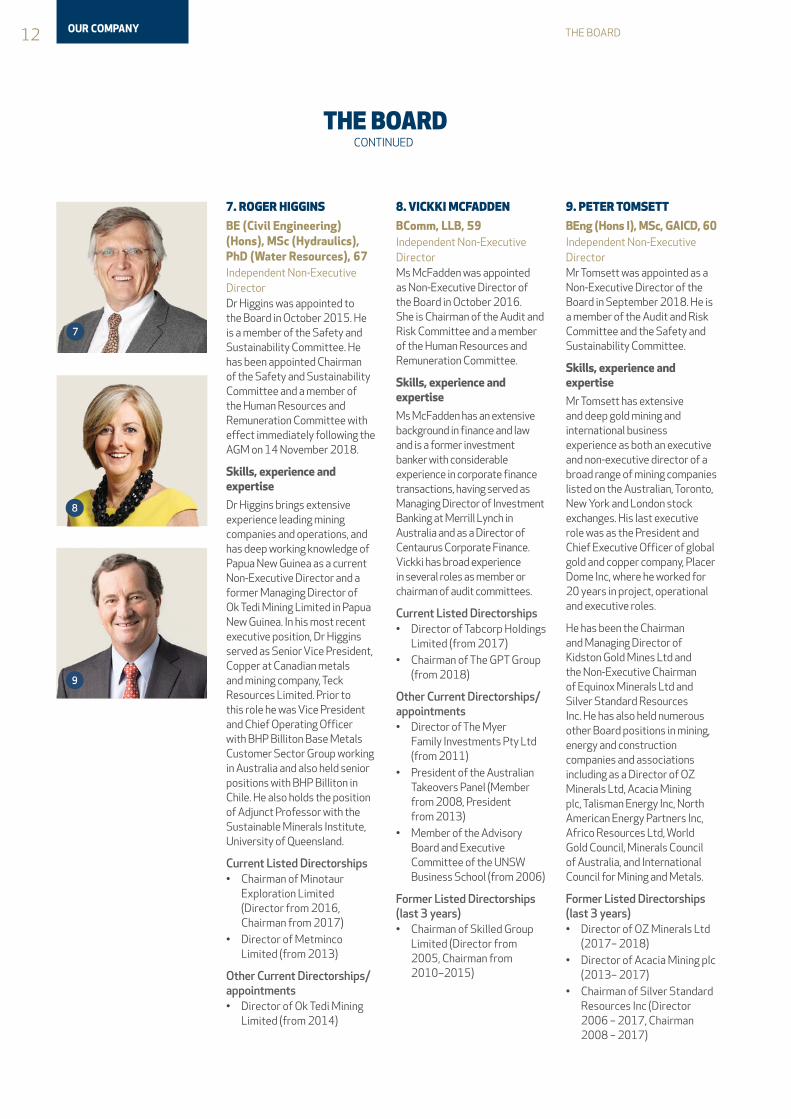
7. ROGER HIGGINS
BE (Civil Engineering) (Hons), MSc (Hydraulics), PhD (Water Resources), 67Independent Non-Executive DirectorDr Higgins was appointed to the Board in October 2015. He is a member of the Safety and Sustainability Committee. He has been appointed Chairman of the Safety and Sustainability Committee and a member of the Human Resources and Remuneration Committee with effect immediately following the AGM on 14 November 2018.
Skills, experience and expertise
Dr Higgins brings extensive experience leading mining companies and operations, and has deep working knowledge of Papua New Guinea as a current Non-Executive Director and a former Managing Director of Ok Tedi Mining Limited in Papua New Guinea. In his most recent executive position, Dr Higgins served as Senior Vice President, Copper at Canadian metals and mining company, Teck Resources Limited. Prior to this role he was Vice President and Chief Operating Officer with BHP Billiton Base Metals Customer Sector Group working in Australia and also held senior positions with BHP Billiton in Chile. He also holds the position of Adjunct Professor with the Sustainable Minerals Institute, University of Queensland.
Current Listed Directorships• Chairman of Minotaur
Exploration Limited (Director from 2016, Chairman from 2017)
• Director of Metminco Limited (from 2013)
Other Current Directorships/appointments• Director of Ok Tedi Mining
Limited (from 2014)
8. VICKKI MCFADDEN
BComm, LLB, 59Independent Non-Executive DirectorMs McFadden was appointed as Non-Executive Director of the Board in October 2016. She is Chairman of the Audit and Risk Committee and a member of the Human Resources and Remuneration Committee.
Skills, experience and expertise
Ms McFadden has an extensive background in finance and law and is a former investment banker with considerable experience in corporate finance transactions, having served as Managing Director of Investment Banking at Merrill Lynch in Australia and as a Director of Centaurus Corporate Finance. Vickki has broad experience in several roles as member or chairman of audit committees.
Current Listed Directorships• Director of Tabcorp Holdings
Limited (from 2017)• Chairman of The GPT Group
(from 2018)
Other Current Directorships/appointments• Director of The Myer
Family Investments Pty Ltd (from 2011)
• President of the Australian Takeovers Panel (Member from 2008, President from 2013)
• Member of the Advisory Board and Executive Committee of the UNSW Business School (from 2006)
Former Listed Directorships (last 3 years)• Chairman of Skilled Group
Limited (Director from 2005, Chairman from 2010–2015)
9. PETER TOMSETT
BEng (Hons I), MSc, GAICD, 60Independent Non-Executive DirectorMr Tomsett was appointed as a Non-Executive Director of the Board in September 2018. He is a member of the Audit and Risk Committee and the Safety and Sustainability Committee.
Skills, experience and expertise
Mr Tomsett has extensive and deep gold mining and international business experience as both an executive and non-executive director of a broad range of mining companies listed on the Australian, Toronto, New York and London stock exchanges. His last executive role was as the President and Chief Executive Officer of global gold and copper company, Placer Dome Inc, where he worked for 20 years in project, operational and executive roles.
He has been the Chairman and Managing Director of Kidston Gold Mines Ltd and the Non-Executive Chairman of Equinox Minerals Ltd and Silver Standard Resources Inc. He has also held numerous other Board positions in mining, energy and construction companies and associations including as a Director of OZ Minerals Ltd, Acacia Mining plc, Talisman Energy Inc, North American Energy Partners Inc, Africo Resources Ltd, World Gold Council, Minerals Council of Australia, and International Council for Mining and Metals.
Former Listed Directorships (last 3 years)• Director of OZ Minerals Ltd
(2017– 2018)• Director of Acacia Mining plc
(2013– 2017)• Chairman of Silver Standard
Resources Inc (Director 2006 – 2017, Chairman 2008 – 2017)
THE BOARD
8
9
7
CONTINUED
OUR COMPANY

13NEWCREST 2018 ANNUAL REPORT

14 INTRODUCTIONOUR FIVE PILLARS
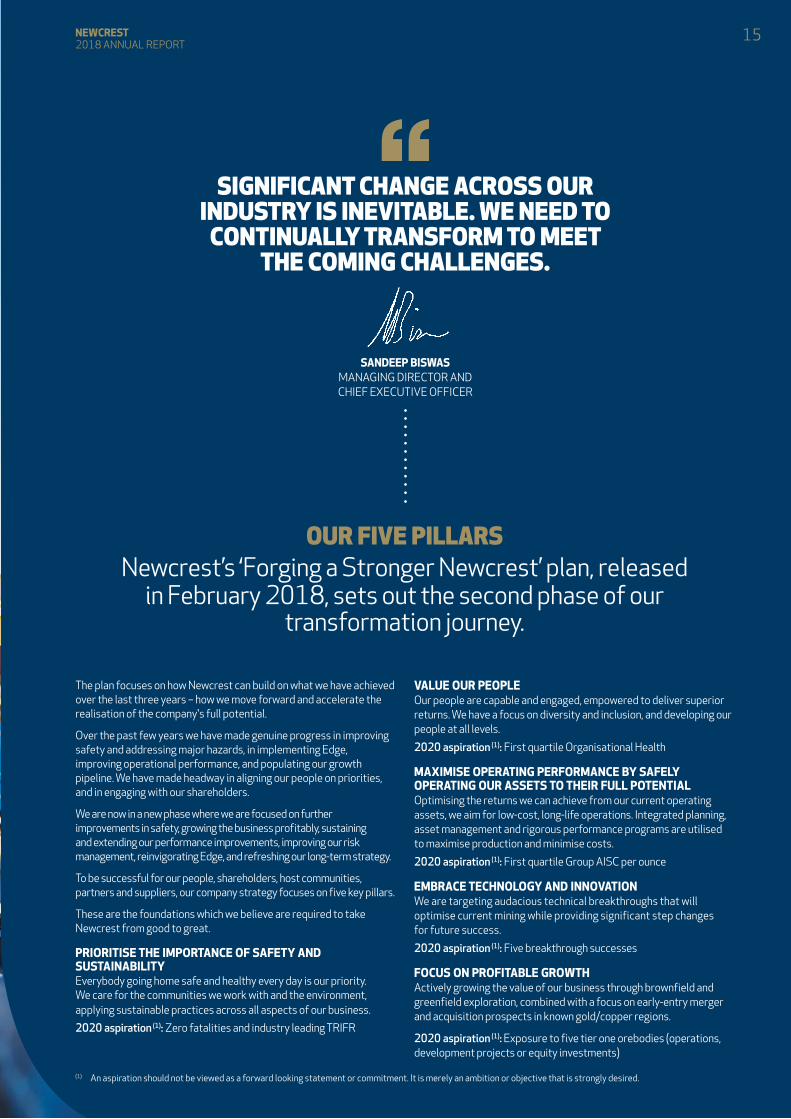
“SIGNIFICANT CHANGE ACROSS OUR INDUSTRY IS INEVITABLE. WE NEED TO
CONTINUALLY TRANSFORM TO MEET THE COMING CHALLENGES.
OUR FIVE PILLARS Newcrest’s ‘Forging a Stronger Newcrest’ plan, released
in February 2018, sets out the second phase of our transformation journey.
The plan focuses on how Newcrest can build on what we have achieved over the last three years – how we move forward and accelerate the realisation of the company's full potential.
Over the past few years we have made genuine progress in improving safety and addressing major hazards, in implementing Edge, improving operational performance, and populating our growth pipeline. We have made headway in aligning our people on priorities, and in engaging with our shareholders.
We are now in a new phase where we are focused on further improvements in safety, growing the business profitably, sustaining and extending our performance improvements, improving our risk management, reinvigorating Edge, and refreshing our long-term strategy.
To be successful for our people, shareholders, host communities, partners and suppliers, our company strategy focuses on five key pillars.
These are the foundations which we believe are required to take Newcrest from good to great.
PRIORITISE THE IMPORTANCE OF SAFETY AND SUSTAINABILITYEverybody going home safe and healthy every day is our priority. We care for the communities we work with and the environment, applying sustainable practices across all aspects of our business.
2020 aspiration (1): Zero fatalities and industry leading TRIFR
VALUE OUR PEOPLEOur people are capable and engaged, empowered to deliver superior returns. We have a focus on diversity and inclusion, and developing our people at all levels.
2020 aspiration (1): First quartile Organisational Health
MAXIMISE OPERATING PERFORMANCE BY SAFELY OPERATING OUR ASSETS TO THEIR FULL POTENTIALOptimising the returns we can achieve from our current operating assets, we aim for low-cost, long-life operations. Integrated planning, asset management and rigorous performance programs are utilised to maximise production and minimise costs.
2020 aspiration (1): First quartile Group AISC per ounce
EMBRACE TECHNOLOGY AND INNOVATIONWe are targeting audacious technical breakthroughs that will optimise current mining while providing significant step changes for future success.
2020 aspiration (1): Five breakthrough successes
FOCUS ON PROFITABLE GROWTHActively growing the value of our business through brownfield and greenfield exploration, combined with a focus on early-entry merger and acquisition prospects in known gold/copper regions.
2020 aspiration (1): Exposure to five tier one orebodies (operations, development projects or equity investments)
SANDEEP BISWASMANAGING DIRECTOR AND CHIEF EXECUTIVE OFFICER
(1) An aspiration should not be viewed as a forward looking statement or commitment. It is merely an ambition or objective that is strongly desired.
15NEWCREST 2018 ANNUAL REPORT
16 SAFETY & SUSTAINABILITY
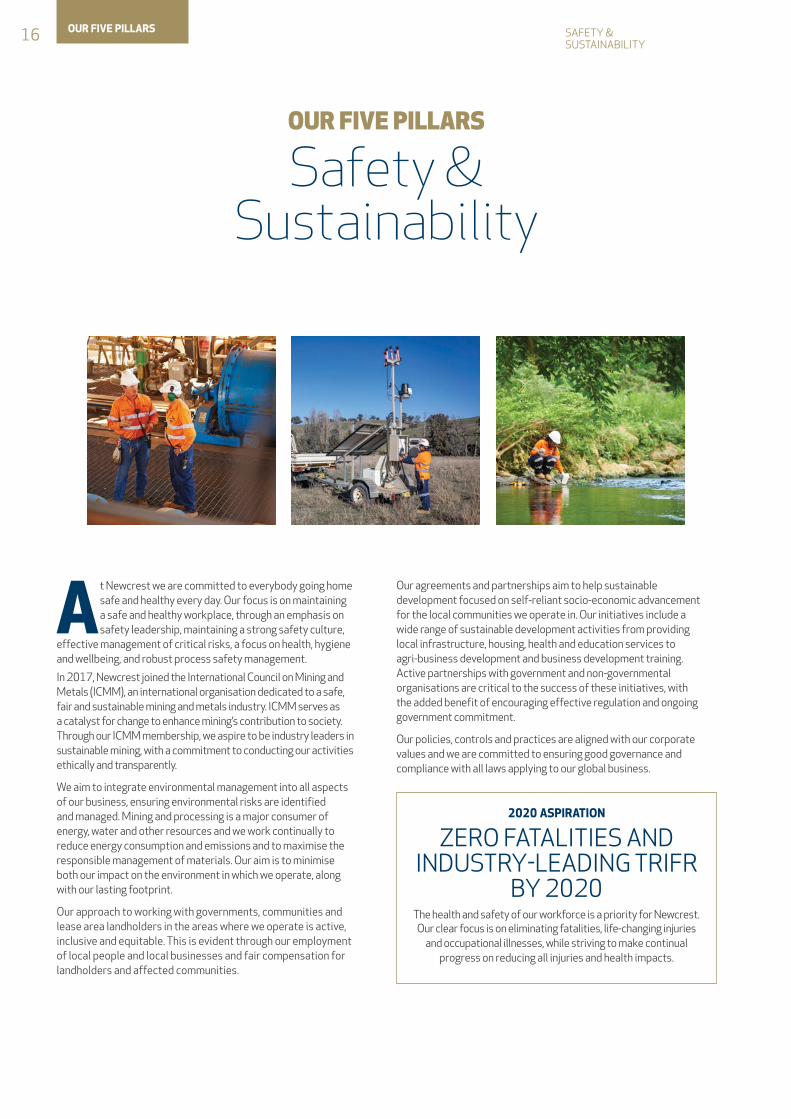
At Newcrest we are committed to everybody going home safe and healthy every day. Our focus is on maintaining a safe and healthy workplace, through an emphasis on safety leadership, maintaining a strong safety culture,
effective management of critical risks, a focus on health, hygiene and wellbeing, and robust process safety management.
In 2017, Newcrest joined the International Council on Mining and Metals (ICMM), an international organisation dedicated to a safe, fair and sustainable mining and metals industry. ICMM serves as a catalyst for change to enhance mining’s contribution to society. Through our ICMM membership, we aspire to be industry leaders in sustainable mining, with a commitment to conducting our activities ethically and transparently.
We aim to integrate environmental management into all aspects of our business, ensuring environmental risks are identified and managed. Mining and processing is a major consumer of energy, water and other resources and we work continually to reduce energy consumption and emissions and to maximise the responsible management of materials. Our aim is to minimise both our impact on the environment in which we operate, along with our lasting footprint.
Our approach to working with governments, communities and lease area landholders in the areas where we operate is active, inclusive and equitable. This is evident through our employment of local people and local businesses and fair compensation for landholders and affected communities.
OUR FIVE PILLARS
Safety & Sustainability
2020 ASPIRATION
ZERO FATALITIES AND INDUSTRY-LEADING TRIFR
BY 2020The health and safety of our workforce is a priority for Newcrest. Our clear focus is on eliminating fatalities, life-changing injuries
and occupational illnesses, while striving to make continual progress on reducing all injuries and health impacts.
Our agreements and partnerships aim to help sustainable development focused on self-reliant socio-economic advancement for the local communities we operate in. Our initiatives include a wide range of sustainable development activities from providing local infrastructure, housing, health and education services to agri-business development and business development training. Active partnerships with government and non-governmental organisations are critical to the success of these initiatives, with the added benefit of encouraging effective regulation and ongoing government commitment.
Our policies, controls and practices are aligned with our corporate values and we are committed to ensuring good governance and compliance with all laws applying to our global business.
OUR FIVE PILLARS
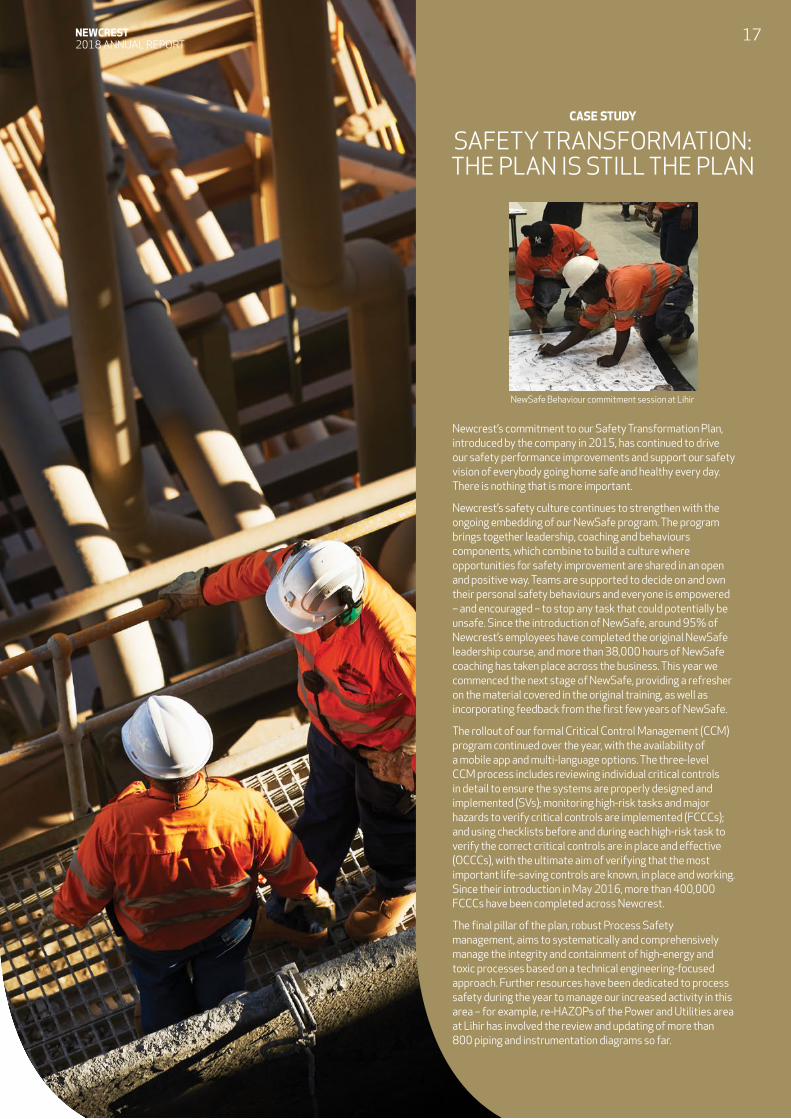
NewSafe Behaviour commitment session at Lihir
CASE STUDY
SAFETY TRANSFORMATION: THE PLAN IS STILL THE PLAN
Newcrest’s commitment to our Safety Transformation Plan, introduced by the company in 2015, has continued to drive our safety performance improvements and support our safety vision of everybody going home safe and healthy every day. There is nothing that is more important.
Newcrest’s safety culture continues to strengthen with the ongoing embedding of our NewSafe program. The program brings together leadership, coaching and behaviours components, which combine to build a culture where opportunities for safety improvement are shared in an open and positive way. Teams are supported to decide on and own their personal safety behaviours and everyone is empowered – and encouraged – to stop any task that could potentially be unsafe. Since the introduction of NewSafe, around 95% of Newcrest’s employees have completed the original NewSafe leadership course, and more than 38,000 hours of NewSafe coaching has taken place across the business. This year we commenced the next stage of NewSafe, providing a refresher on the material covered in the original training, as well as incorporating feedback from the first few years of NewSafe.
The rollout of our formal Critical Control Management (CCM) program continued over the year, with the availability of a mobile app and multi-language options. The three-level CCM process includes reviewing individual critical controls in detail to ensure the systems are properly designed and implemented (SVs); monitoring high-risk tasks and major hazards to verify critical controls are implemented (FCCCs); and using checklists before and during each high-risk task to verify the correct critical controls are in place and effective (OCCCs), with the ultimate aim of verifying that the most important life-saving controls are known, in place and working. Since their introduction in May 2016, more than 400,000 FCCCs have been completed across Newcrest.
The final pillar of the plan, robust Process Safety management, aims to systematically and comprehensively manage the integrity and containment of high-energy and toxic processes based on a technical engineering-focused approach. Further resources have been dedicated to process safety during the year to manage our increased activity in this area – for example, re-HAZOPs of the Power and Utilities area at Lihir has involved the review and updating of more than 800 piping and instrumentation diagrams so far.
NEWCREST 2018 ANNUAL REPORT
17
18 PEOPLE
OUR FIVE PILLARS
People
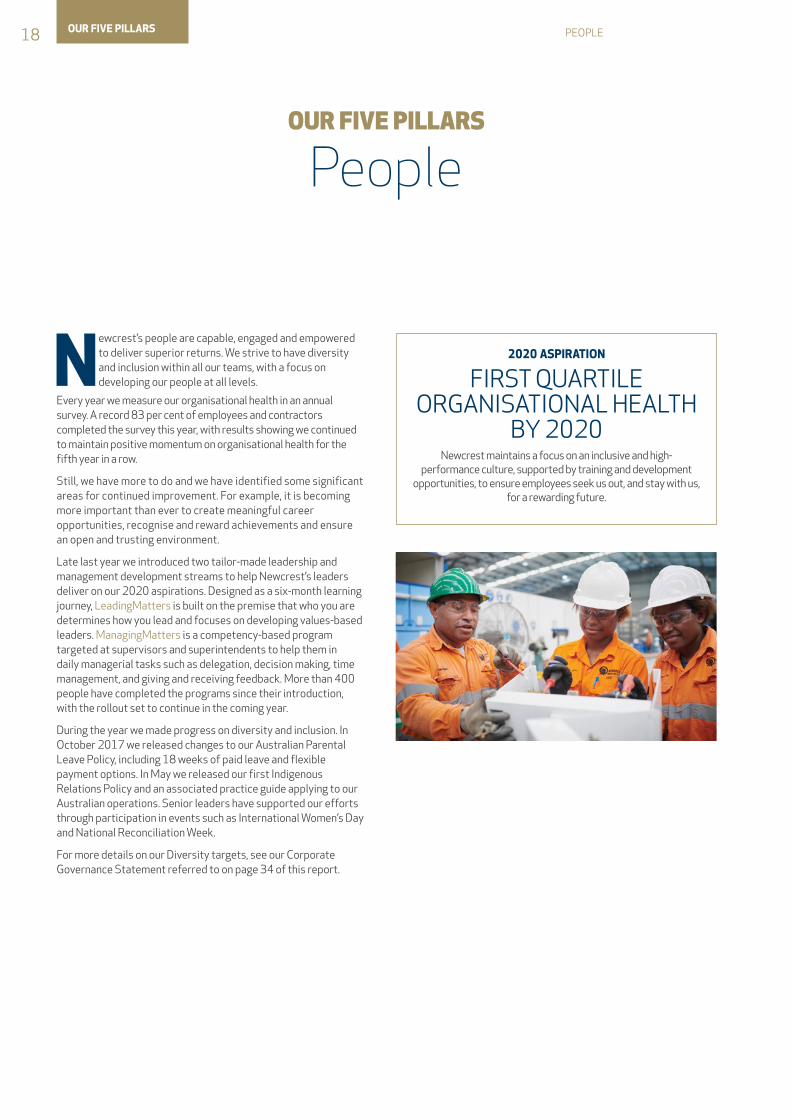
Newcrest’s people are capable, engaged and empowered to deliver superior returns. We strive to have diversity and inclusion within all our teams, with a focus on developing our people at all levels.
Every year we measure our organisational health in an annual survey. A record 83 per cent of employees and contractors completed the survey this year, with results showing we continued to maintain positive momentum on organisational health for the fifth year in a row.
Still, we have more to do and we have identified some significant areas for continued improvement. For example, it is becoming more important than ever to create meaningful career opportunities, recognise and reward achievements and ensure an open and trusting environment.
Late last year we introduced two tailor-made leadership and management development streams to help Newcrest’s leaders deliver on our 2020 aspirations. Designed as a six-month learning journey, LeadingMatters is built on the premise that who you are determines how you lead and focuses on developing values-based leaders. ManagingMatters is a competency-based program targeted at supervisors and superintendents to help them in daily managerial tasks such as delegation, decision making, time management, and giving and receiving feedback. More than 400 people have completed the programs since their introduction, with the rollout set to continue in the coming year.
During the year we made progress on diversity and inclusion. In October 2017 we released changes to our Australian Parental Leave Policy, including 18 weeks of paid leave and flexible payment options. In May we released our first Indigenous Relations Policy and an associated practice guide applying to our Australian operations. Senior leaders have supported our efforts through participation in events such as International Women’s Day and National Reconciliation Week.
For more details on our Diversity targets, see our Corporate Governance Statement referred to on page 34 of this report.
2020 ASPIRATION
FIRST QUARTILE ORGANISATIONAL HEALTH
BY 2020Newcrest maintains a focus on an inclusive and high-
performance culture, supported by training and development opportunities, to ensure employees seek us out, and stay with us,
for a rewarding future.
OUR FIVE PILLARS
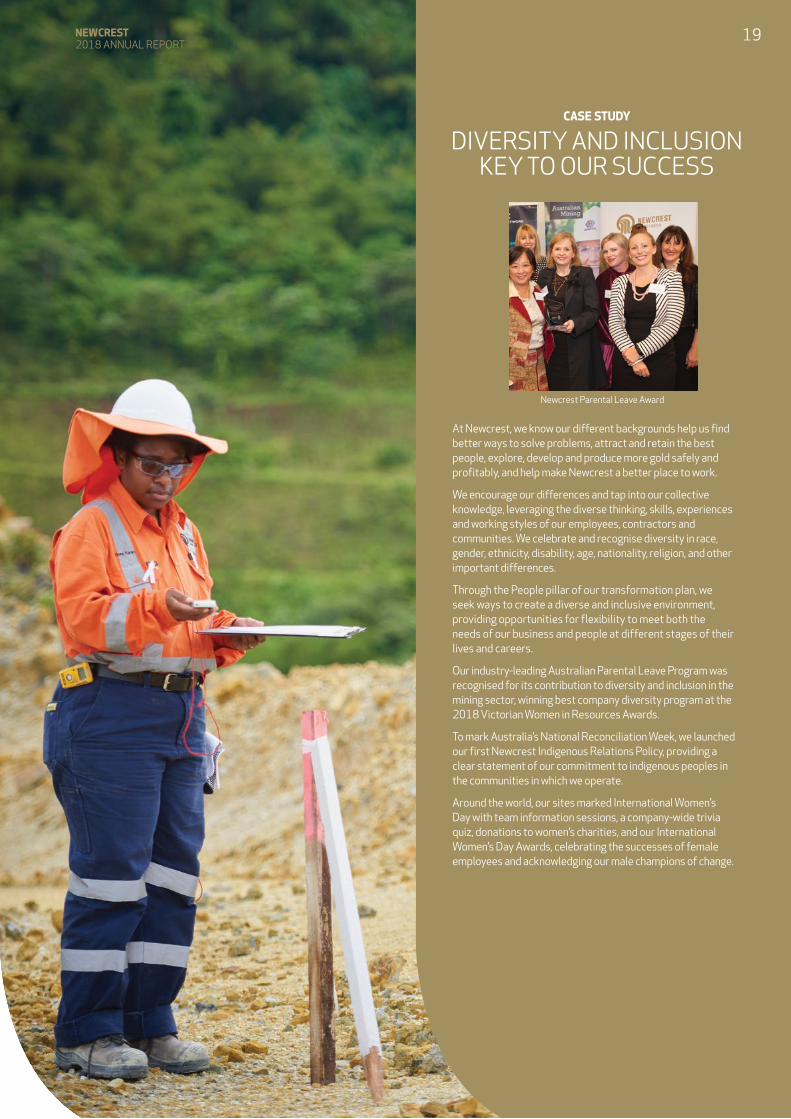
Newcrest Parental Leave Award
CASE STUDY
DIVERSITY AND INCLUSION KEY TO OUR SUCCESS
At Newcrest, we know our different backgrounds help us find better ways to solve problems, attract and retain the best people, explore, develop and produce more gold safely and profitably, and help make Newcrest a better place to work.
We encourage our differences and tap into our collective knowledge, leveraging the diverse thinking, skills, experiences and working styles of our employees, contractors and communities. We celebrate and recognise diversity in race, gender, ethnicity, disability, age, nationality, religion, and other important differences.
Through the People pillar of our transformation plan, we seek ways to create a diverse and inclusive environment, providing opportunities for flexibility to meet both the needs of our business and people at different stages of their lives and careers.
Our industry-leading Australian Parental Leave Program was recognised for its contribution to diversity and inclusion in the mining sector, winning best company diversity program at the 2018 Victorian Women in Resources Awards.
To mark Australia’s National Reconciliation Week, we launched our first Newcrest Indigenous Relations Policy, providing a clear statement of our commitment to indigenous peoples in the communities in which we operate.
Around the world, our sites marked International Women’s Day with team information sessions, a company-wide trivia quiz, donations to women’s charities, and our International Women’s Day Awards, celebrating the successes of female employees and acknowledging our male champions of change.
NEWCREST 2018 ANNUAL REPORT
19

20 OPERATING PERFORMANCE
OUR FIVE PILLARS
Operating Performance
Operating performance will always be central to what Newcrest is and how we deliver value to shareholders.
As a component of our next stage of transformation we have developed an integrated framework for achieving
world-class performance which brings together our Management Operating System (MOS), asset management, process control and analytics, and material risk management focus areas.
MOS is the framework through which we manage the implementation of our strategy. It defines the people, processes, systems and tools required to safely and efficiently define and execute all of our plans – from life of province plans through to shift plans.
Our asset management program of work ensures the right operational, technical and maintenance work is performed at the right time, using the right plant and equipment, tools, parts and skilled workforce.
Process control and analytics enable sustainable improvement and reduce variability within our operations. They also allow us to support the ongoing digitalisation of our business. Around 80% of our digital transformation focuses on enhancing our operating performance.
Our material risk management process integrates risk thinking and risk management into our end-to-end business process. It seeks to manage and mitigate those risks with the highest potential impact on our business, by seeking to maintain effective controls and remediate control deficiencies.
2020 ASPIRATION
FIRST QUARTILE GROUP AISC PER OUNCE BY 2020
Levers such as smart asset management, process control and analytics, material risk management, integrated planning and our Edge performance program are maximised to deliver
value to shareholders.
Bringing all the components together, integrated planning ensures our full value chain is linked and that transition points are managed across our operations.
Empowering every employee to adopt an owner’s mindset, Newcrest’s Edge performance improvement process allows us to implement value adding solutions to identified opportunities. Purpose built for Newcrest, Edge is designed to entrench a culture of innovation, high performance and continuous improvement.
Edge aims to unlock value by identifying opportunities for deliberate improvement actions and innovation, and safely delivering the same or higher production outcomes and lowering costs.
OUR FIVE PILLARS
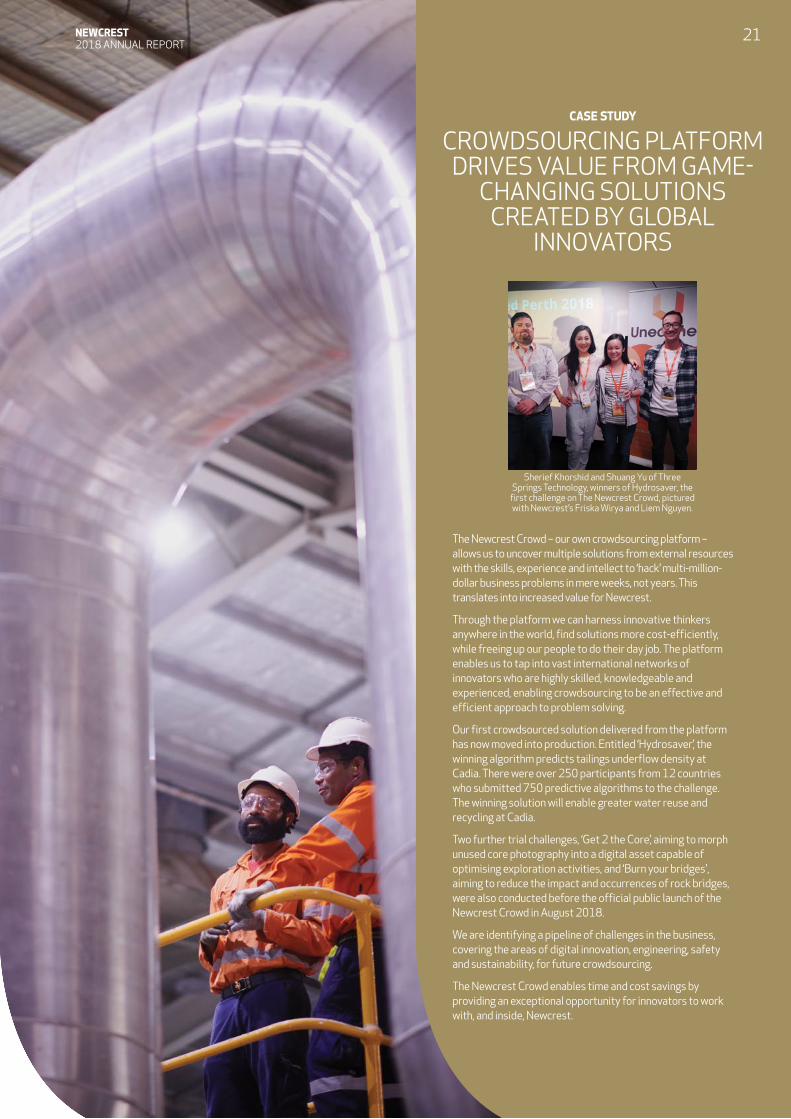
Sherief Khorshid and Shuang Yu of Three Springs Technology, winners of Hydrosaver, the
first challenge on The Newcrest Crowd, pictured with Newcrest’s Friska Wirya and Liem Nguyen.
CASE STUDY
CROWDSOURCING PLATFORM DRIVES VALUE FROM GAME-
CHANGING SOLUTIONS CREATED BY GLOBAL
INNOVATORS
The Newcrest Crowd – our own crowdsourcing platform – allows us to uncover multiple solutions from external resources with the skills, experience and intellect to ‘hack’ multi-million-dollar business problems in mere weeks, not years. This translates into increased value for Newcrest.
Through the platform we can harness innovative thinkers anywhere in the world, find solutions more cost-efficiently, while freeing up our people to do their day job. The platform enables us to tap into vast international networks of innovators who are highly skilled, knowledgeable and experienced, enabling crowdsourcing to be an effective and efficient approach to problem solving.
Our first crowdsourced solution delivered from the platform has now moved into production. Entitled ‘Hydrosaver’, the winning algorithm predicts tailings underflow density at Cadia. There were over 250 participants from 12 countries who submitted 750 predictive algorithms to the challenge. The winning solution will enable greater water reuse and recycling at Cadia.
Two further trial challenges, ‘Get 2 the Core’, aiming to morph unused core photography into a digital asset capable of optimising exploration activities, and ‘Burn your bridges', aiming to reduce the impact and occurrences of rock bridges, were also conducted before the official public launch of the Newcrest Crowd in August 2018.
We are identifying a pipeline of challenges in the business, covering the areas of digital innovation, engineering, safety and sustainability, for future crowdsourcing.
The Newcrest Crowd enables time and cost savings by providing an exceptional opportunity for innovators to work with, and inside, Newcrest.
NEWCREST 2018 ANNUAL REPORT
21
22 TECHNOLOGY & INNOVATION
OUR FIVE PILLARS
Technology & Innovation
At Newcrest we are pursuing audacious breakthroughs in technology and innovation. Our focus is to turn tough deposits into tier one assets. Take NextGen Caving as an example. We now have the uncommon capabilities required
to bulk cave mine low grade deposits at depths beyond 1.5 kilometres. This is increasingly important as the top 200 metres of the Earth’s crust is well developed and unexploited inventories are generally lower grade and deeper than 1 kilometre.
Selective Processing is another example, where we are looking at smarter ways to process lower grade ores. Historically, the gold industry has operated under a processing model where around 20% of rock processed contains 90% of the metal yet the industry pays for it all to be processed. With ever decreasing grades and increasing costs across the industry, Newcrest is focused on finding a suite of better ways to maximise financial returns rather than maximise mill throughput.
At Newcrest we consider ourselves fortunate that we are small enough to have a degree of agility that allows us to move quickly, with the financial strength to back our technology and innovation aspirations.
2020 ASPIRATION
FIVE BREAKTHROUGH SUCCESSES BY 2020
Newcrest is using technology and innovation as a competitive advantage to unlock the full potential of our assets and turn
tough deposits into tier one assets.
OUR FIVE PILLARS
CASE STUDY
INNOVATION A GAME CHANGER FOR LIHIR
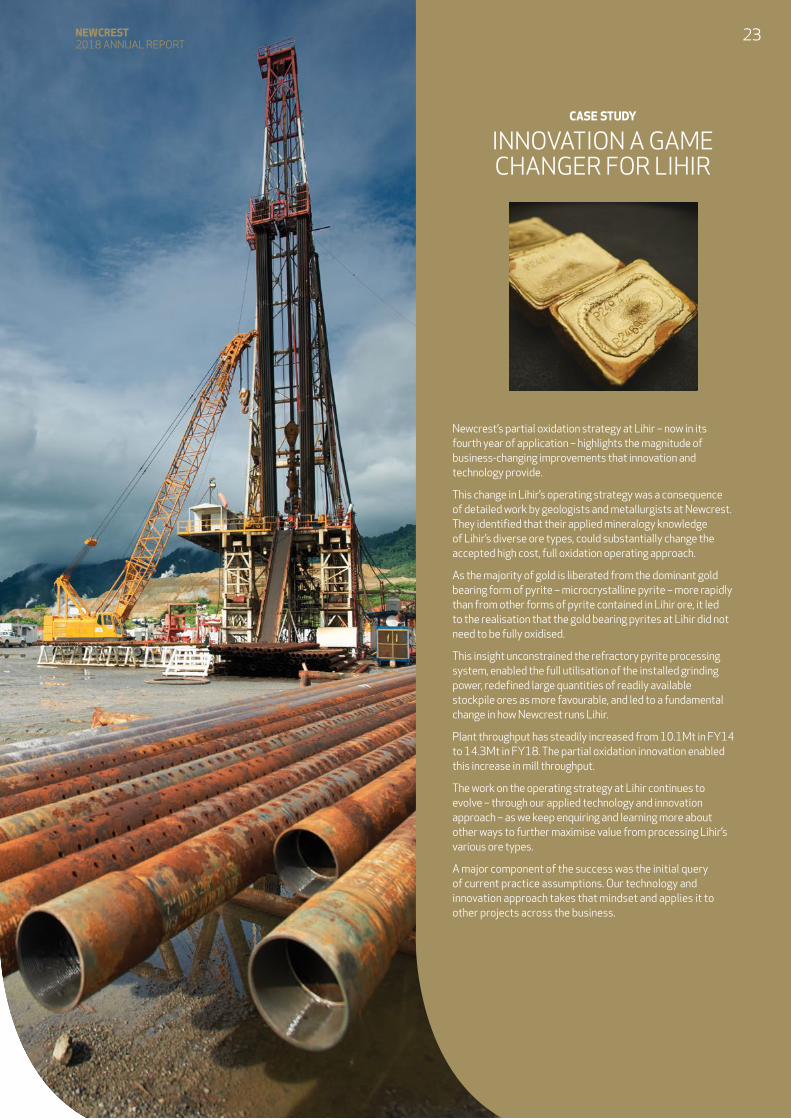
Newcrest’s partial oxidation strategy at Lihir – now in its fourth year of application – highlights the magnitude of business-changing improvements that innovation and technology provide.
This change in Lihir’s operating strategy was a consequence of detailed work by geologists and metallurgists at Newcrest. They identified that their applied mineralogy knowledge of Lihir’s diverse ore types, could substantially change the accepted high cost, full oxidation operating approach.
As the majority of gold is liberated from the dominant gold bearing form of pyrite – microcrystalline pyrite – more rapidly than from other forms of pyrite contained in Lihir ore, it led to the realisation that the gold bearing pyrites at Lihir did not need to be fully oxidised.
This insight unconstrained the refractory pyrite processing system, enabled the full utilisation of the installed grinding power, redefined large quantities of readily available stockpile ores as more favourable, and led to a fundamental change in how Newcrest runs Lihir.
Plant throughput has steadily increased from 10.1Mt in FY14 to 14.3Mt in FY18. The partial oxidation innovation enabled this increase in mill throughput.
The work on the operating strategy at Lihir continues to evolve – through our applied technology and innovation approach – as we keep enquiring and learning more about other ways to further maximise value from processing Lihir’s various ore types.
A major component of the success was the initial query of current practice assumptions. Our technology and innovation approach takes that mindset and applies it to other projects across the business.
NEWCREST 2018 ANNUAL REPORT
23
24 PROFITABLE GROWTH
OUR FIVE PILLARS
Profitable Growth
At Newcrest we are using our unique capabilities to secure world-class growth opportunities, supporting our aspiration of exposure to five tier one orebodies by 2020.
We currently have two tier one operations in our long-life Cadia and Lihir assets. Through optimising our business, and ensuring we safely operate these assets to their full potential, we are achieving organic growth in these assets.
We consider Wafi-Golpu, our project in Papua New Guinea (PNG), to be another tier one development. Wafi-Golpu is a sister mine to Cadia, in that it is our next generation of building on our world-class block caving capability. From our first block cave at Ridgeway, to our groundbreaking caves at Cadia, Wafi-Golpu takes 10 years of Newcrest's block caving experience into the first major underground mine to be developed in the Morobe Province in PNG.
During the year we formed a strategic partnership with Lundin Gold which included a $251 million investment in Lundin Gold Inc, and entering into a binding exploration Joint Venture Heads of Agreement. This is an important step for us in our pursuit of profitable growth in that it provides us with access to Lundin Gold's Fruta del Norte gold mine in Ecuador and we believe that it will open up further opportunities for us in the Americas.
Other transactions completed during the year – such as an investment to maintain a 14.5% stake in SolGold, a copper gold exploration company based in Australia with exploration ground in Ecuador; a 19.9% placement in Azucar Minerals (formerly Almadex Minerals) to gain exposure to the El Cobre prospect in Mexico; a farm-in agreement with Mirasol Resources to explore a prospect in Chile; and a number of early stage farm-in agreements in Australia – also leverage our capabilities to try and secure future growth options in the medium to long term.
Our exploration program continues with a mix of brownfield and greenfield exploration activities across West Africa, Australia, Papua New Guinea, Indonesia, United States of America, Ecuador, Argentina and Chile.
We aim to have a ‘well stocked’ portfolio and balanced exploration pipeline to provide future long-term growth optionality.
2020 ASPIRATION
EXPOSURE TO FIVE TIER ONE OREBODIES BY 2020
Through organic growth and new mining opportunities we are aiming for exposure to five tier one ore bodies – whether they
be operations, development projects or equity investments.
OUR FIVE PILLARS

CASE STUDY
OPENING UP NEW GROWTH OPPORTUNITIES
IN THE AMERICAS
In February 2018 Newcrest announced a new strategic partnership with Lundin Gold Inc, a Canadian mining company.
Lundin Gold Inc is currently building the Fruta del Norte gold mine in Ecuador which is expected to have first production by the end of 2019. This is a step forward for us as we build towards our 2020 aspiration of exposure to five tier one orebodies. The Fruta del Norte epithermal gold deposit has similarities to our Gosowong operations and contains potential for additional discoveries.
The transaction included Newcrest acquiring a 27.1% interest in Lundin Gold Inc, for US$251 million at CAD$5.50 per share. Newcrest also entered into a binding Exploration Heads of Agreement with Lundin Gold to earn up to 50% direct interest in eight exploration concessions in Ecuador by spending up to $20 million over five years.
When formed, Newcrest will manage the exploration activities and the exploration joint venture company.
Entering into the joint venture with Lundin Gold also provides Newcrest with a strategic arrangement that builds on our existing investments in Ecuador, including SolGold.
The arrangement is an important step forward in our pursuit of profitable growth and opens up further opportunities for us in the Americas.
NEWCREST 2018 ANNUAL REPORT
25
MINERAL RESOURCES AND ORE RESERVESNewcrest Mining Limited releases its Annual Statement of Mineral Resource and Ore Reserve estimates and Explanatory Notes as of 31 December each year. The Statement for the period ending 31 December 2017 was released on 15 February 2018, and can be found on Newcrest’s website at www.newcrest.com.au. This section of the Annual Report includes relevant information set out in that Statement. Changes that have occurred in the six months ending 30 June 2018 due to mining depletion and other adjustments are noted below.
For the purposes of the Annual Mineral Resources and Ore Reserves Statement as at 31 December 2017, Newcrest has completed a detailed review of all production sources. The review has taken into account updated long term metal prices, foreign exchange and cost assumptions, and mining and metallurgy performance to inform cut-off grades and physical mining parameters.
As at 31 December 2017, Group Mineral Resources are estimated to contain 120 million ounces of gold, 19 million tonnes of copper and 94 million ounces of silver. This represents a decrease of approximately 7 million ounces of gold (~6%), 0.1 million tonnes of copper (~2%) and 1 million ounces of silver (~1%), compared with the estimate as at 31 December 2016. The Group Mineral Resources estimates as at 31 December 2017 are set out in the Mineral Resource tables. Mineral Resources are reported inclusive of Ore Reserves.
The Group Mineral Resources as at 31 December 2017 includes changes at numerous deposits following updated notional constraining shells and/or resource models. These include:
• Estimated mining depletion of approximately 3 million ounces of gold, 0.1 million tonnes of copper and 1 million ounces of silver.
• Decrease at Lihir, post mining depletion, of approximately 3 million ounces of gold from Inferred Mineral Resources following re-interpretation based on alteration signatures to define mineralogical domains, updated resource model and re-optimisation of the notional spatial constraining shell. The alteration domain model is based on in situ mineralogical variation predominantly determined by multi-element geochemistry (re-analysis acquired progressively since 2012) and hyperspectral scanning of drill core (obtained progressively since 2012). The alteration based domains improve the quality of the subsequent resource estimation and better define the limits of potentially economic mineralisation.
• Decrease at Telfer, post mining depletion, of approximately 0.8 million ounces of gold and 0.07 million tonnes of copper following updated resource models and re-optimised notional constraining shells for the open pit and reductions underground of in situ and cave stocks in consideration of the maturity of the Sub Level Cave operation.
• Removal, post mining depletion, of the Bonikro Mineral Resource by 1 million ounces of gold following Newcrest agreeing to divest its 89.89% interest (refer to market release “Newcrest agrees to divest Bonikro for $81m” dated 13 December 2017).
• Addition of the maiden Mineral Resource for the Antenna Deposit within the Séguéla Project Côte d’Ivoire of approximately 0.4 million ounces of gold (refer to market release “Newcrest Quarterly Exploration Report for the three months ended 31 December 2017” dated 30 January 2018 for further detail).
As at 31 December 2017, Group Ore Reserves are estimated to contain 62 million ounces of gold, 10 million tonnes of copper and 37 million ounces of silver. This represents a decrease of approximately 3 million ounces of gold (~5%), 0.1 million tonnes of copper (~1%) and 0.7 million ounces of silver (~2%) compared with the estimate as at 31 December 2016. The Group Ore Reserves estimates as at 31 December 2017 are set out in the Ore Reserve tables.
The Group Ore Reserves as at 31 December 2017 includes the following changes:
• Estimated mining depletion of approximately 3 million ounces of gold, 0.1 million tonnes of copper and 2 million ounces of silver, offset by minor additions at operating sites.
• Removal, post mining depletion, of the Bonikro Ore Reserve by 0.3 million ounces of gold following Newcrest agreeing to divest its 89.89% interest (refer to market release “Newcrest agrees to divest Bonikro for $81m” dated 13 December 2017).
Updated mining, metallurgical and long term cost assumptions were developed with reference to recent performance data. The revised long term assumptions include performance improvements consistent with changing activity levels at each site over the life of the operation and the latest study for each deposit.
Long term metal prices and foreign exchange assumptions for Mineral Resources and Ore Reserves are set out below.
Long Term Metal Price Assumptions Newcrest &MMJV
Mineral Resource EstimatesGold – USD/oz 1,300.00Copper – USD/lb 3.40Silver – USD/oz 21.00
Ore Reserve EstimatesGold – USD/oz 1,200.00Copper – USD/lb 3.00Silver – USD/oz 18.00
Long Term Exchange Rate USD:AUD 0.80
Gold, copper and silver metal price assumptions remain unchanged from those used for December 2016 reporting. There has been no change to the AUD:USD exchange rate assumption since December 2016 reporting but local currency assumptions for Côte d’Ivoire Franc and PNG Kina have been updated (the Indonesia Rupiah remains unchanged). Moreby Mining Joint Venture (MMJV) long term metal price and exchange rate assumptions are aligned to Newcrest assumptions. The Namosi Joint Venture (NJV) continues to use the joint venture agreed long term metal price and exchange rate assumptions unchanged from December 2015. NJV agreed metal price assumptions are USD 1,350/oz gold and USD 3.40/lb copper for Mineral Resources and USD 1,250/oz gold and USD 3.00/lb copper for Ore Reserves and AUD:USD 0.85 exchange rate.
Where appropriate, Mineral Resources are also spatially constrained within notional mining volumes based on metal prices of USD 1,400/oz for gold and USD 4.00/lb for copper. This approach is adopted to eliminate mineralisation that does not have reasonable prospects of eventual economic extraction from Mineral Resource estimates.
MINERAL RESOURCES AND ORE RESERVES
26MINERAL RESOURCES AND ORE RESERVES
The Annual Statement of Mineral Resources and Ore Reserves, 31 December 2017, has been prepared in accordance with the 2012 Edition of the ‘Australasian Code for Reporting of Exploration Results, Mineral Resources and Ore Reserves’ (the JORC Code 2012).
Information prepared and first disclosed under the JORC Code 2004 Edition and not related to a material mining project and which has not materially changed since last reported has not been updated, specifically Wafi and Nambonga Mineral Resources.
Mineral Resource and Ore Reserve estimates reported for the MMJV are based on Competent Persons’ statements provided by the MMJV and are quoted as Newcrest’s 50% interest.
COMPETENT PERSON STATEMENT1. The information in this Annual Report that relates to
Mineral Resources and Ore Reserves has been approved by Mr K. Gleeson. Mr Gleeson is the Head of Mineral Resource Management and a full-time employee of Newcrest Mining Limited. He is entitled to participate in Newcrest’s executive equity long term incentive plan, details of which are included in Newcrest’s 2018 Remuneration Report. Replacement of Ore Reserves and Mineral Resources depletion is one of the performance measures under recent long term incentive plans. He is a Member of The Australasian Institute of Mining and Metallurgy. Mr Gleeson has sufficient experience which is relevant to the styles of mineralisation and types of deposits under consideration and to the activity which he is undertaking to qualify as a Competent Person as defined in the JORC Code 2012. Mr Gleeson consents to the inclusion of the Mineral Resources and Ore Reserves Statement and other references to Mineral Resource and Ore Reserves in this Annual Report in the form and context in which they appear.
2. The information in this Annual Report that relates to Mineral Resources or Ore Reserves as at 31 December 2017 has been extracted from the release titled “Annual Mineral Resources and Ore Reserves Statement – 31 December 2017” dated 15 February 2018 (the original release). Newcrest confirms that the form and context in which the competent person’s findings are presented have not been materially modified from the original release.
3. The information in this Annual Report that relates to changes in the Mineral Resources or Ore Reserves since 31 December 2017: a. for each of Gosowong Mineral Resources, Telfer Mineral
Resources, Cadia Mineral Resources and Golpu Mineral Resources, is based on and fairly represents information and supporting documentation prepared by the following Competent Persons: Denny Lesmana – Gosowong Mineral Resources, Peter Morgan – Telfer Mineral Resources, Vik Singh – Cadia Mineral Resources, David Finn – Golpu Mineral Resources; and
b. for all other Mineral Resources and Ore Reserves, is based on and fairly represents information and supporting documentation prepared by the Competent Persons named in the Mineral Resources and Ore Reserves Tables extracted from the original release.
Each of these persons referenced in paragraph (3) above, other than Mr G. Job, was at the reporting date a full-time employee of Newcrest Mining Limited or its relevant subsidiaries, holds options (and in some cases, shares) in Newcrest Mining Limited and is entitled to participate in Newcrest’s executive equity long term incentive plan, details of which are included in Newcrest’s 2018 Remuneration Report. Replacement of Ore Reserves and Mineral Resources depletion is one of the performance measures of recent long term incentive plans. Mr Job is a full time employee of Harmony Gold Mining Company Limited, Newcrest’s joint venture partner in each of the MMJVs.
All the Competent Persons referenced in paragraph (3) above are Members of The Australasian Institute of Mining and Metallurgy and / or The Australian Institute of Geoscientists, and have sufficient experience which is relevant to the styles of mineralisation and types of deposits under consideration and to the activity which they are undertaking to qualify as a Competent Person as defined in the JORC Code 2012. Each Competent Person, consents to the inclusion in this report of the matters based on their information in the form and context in which it appears.
GOVERNANCENewcrest has a policy for the Public Reporting of Exploration Results, Mineral Resources and Ore Reserves. This policy provides a clear framework for how Newcrest manages all public reporting of Exploration Results, Mineral Resources and Ore Reserves, ensuring compliance with the JORC Code 2012. This policy applies to all regulatory reporting, public presentations and other publicly released company information at both local (site) and corporate levels.
Newcrest has in place a Resource and Reserve Steering Committee (RRSC). The role of the Committee is to ensure the proper functioning of Newcrest’s Resource and Reserves development activity and reporting. The Committee’s control and assurance activities respond to a four-level compliance process:
1. Provision of standards and guidelines, and approvals consequent to these;
2. Resources and Reserves reporting process, based on well founded assumptions and compliant with external standards (JORC Code 2012, ASX Listing Rules);
3. External review of process conformance and compliance; and 4. Internal assessment of processes around all input assumptions.
Updates to the Mineral Resource and Ore Reserve estimates at 31 December 2017 were completed in accordance with the RRSC governance and review process. This included reporting in compliance with the JORC Code 2012, training and endorsement of suitably qualified Competent Persons, independent external review of Mineral Resources and Ore Reserves every three years (unless agreed by RRSC) or where there is a material change and endorsement of the Annual Mineral Resources and Ore Reserve Statement by the RRSC prior to release to the market.
MINERAL RESOURCES AND ORE RESERVES
27NEWCREST 2018 ANNUAL REPORT
CHANGES SINCE 31 DECEMBER 2017 MINERAL RESOURCE AND ORE RESERVE STATEMENTNewcrest is not aware of any new information or data that materially affects the information contained in the Annual Mineral Resource and Ore Reserve Statement 31 December 2017 other than changes due to normal mining depletion and other adjustments that occurred during the six months ended 30 June 2018. These changes are summarised by province below.
Newcrest’s Annual Statement of Mineral Resources and Ore Reserves is based upon a number of factors, including (without limitation) actual exploration and production results, economic assumptions (such as future commodity prices and exchange rates) and operating and other costs. No material changes were made to those factors or assumptions during the period to 30 June 2018, note however Golpu changed AUD:USD exchange rate to 0.75 for March 2018 Ore Reserve update financial evaluation (refer market release "Updated Wafi-Golpu Feasibility Study" dated 19 March 2018). In preparing the Annual Statement of Mineral Resources and Ore Reserves for the period ended 31 December 2018, Newcrest proposes to review long-term foreign exchange rate, metal price and cost assumptions. There are also specific ongoing studies to maximize the value of operations at Gosowong, Lihir, Telfer, Cadia and the Namosi project that may be incorporated into the Mineral Resource and Ore Reserve assumptions for the period ending 31 December 2018. Cadia Expansion Feasibility Study following on from the Pre-Feasibility Study for the Cadia Expansion is expected to be completed by December 2019. On 9 August 2018 Newcrest announced a likely carrying reduction at Telfer, where the latest life of mine plan indicates lower levels of ore mined and higher levels of waste from West Dome, lower gold recoveries, higher estimated closure costs and higher operating costs than previously forecast. An infill drilling campaign to more tightly define Telfer’s open pit Mineral Resources and Ore Reserves is underway. In addition Newcrest’s 75%-owned Indonesian subsidiary, PT Nusa Halmahera Minerals (PT NHM), has entered into an amendment agreement with the Government of Indonesia to amend the Gosowong Contract of Work (CoW), and as a result Newcrest must divest at least another 26% from its current shareholding percentage of 75%.
At this stage, the impact that the assumption changes or outcomes of the ongoing studies and amended Gosowong Contract of Work (CoW) will have on Newcrest’s Mineral Resources and Ore Reserves estimates for the period ending 31 December 2018, has not been determined.
CADIA (NSW)Mineralisation recognised to date in the Cadia Province is porphyry related gold and copper, hosted in rocks of Ordovician age. Orebodies are typically large tonnage, low grade gold-copper deposits with silver byproduct. Molybdenum and minor base metals are also present. Ore is sourced by bulk mining methods from underground operations. Changes to Mineral Resources and Ore Reserves at Cadia since 31 December 2017 have only occurred at Cadia East and Cadia Hill detailed below.
On 9 March 2018 an embankment slump of the Northern Tailings Facility (NTF) occurred at Cadia, which resulted in the temporary suspension of all mining and processing activities. Mining recommenced progressively from 27 March 2018 and processing recommenced at a limited rate from 29 March 2018 due to limitations on the capacity able to be utilised of the Southern Tailings Facility (STF). On 23 April 2018 Newcrest announced that it had received approval from the New South Wales Department of Planning and Environment to use the first 200m of the old Cadia Hill open pit as a tailings storage facility. Deposition into the pit commenced in early May and, following a short ramp up period, Cadia returned to full production rates approximately two months after the embankment slump of the NTF on 9 March.
Newcrest will look to define and commence the optimal repair solution for the NTF while also applying for permission to use the remaining 300m of the Cadia Hill open pit for tailings storage in two distinct stages. The next application submitted in the first quarter of FY19 was a proposal to use the next 140m of the Cadia Hill open pit, which is expected to provide an additional 18 months of tailings capacity. The final application to use up to 160m of the open pit is likely to be submitted during the 2019 calendar year.
Newcrest plans to undertake buttressing around the Southern Tailings Facility in preparation for the next tailings lift of the Southern Tailings Facility and to further strengthen the wall.
Cadia East UndergroundCadia East is a low-grade, porphyry related gold and copper deposit with mining based on bulk underground extraction by panel caving methods. Commercial production from Panel Cave 1 (PC1) commenced in January 2013. Commercial production from Panel Cave 2 commenced in October 2014.
The Cadia Expansion Pre-Feasibility Study Findings was announced on 22 August 2018. This study supported an update to the Cadia East Ore Reserve. Changes to the Ore Reserve since 31 December 2017 included depletion due to mining and updated Ore Reserve based on the Pre-Feasibility Study include operational learnings, removal of marginal mineralisation from the latter stage caves and inclusion of PC3 for an overall decrease of 0.3 million ounces of gold and an increase of 0.2 million tonnes of copper. Changes to the Mineral Resource since 31 December 2017 were due to mining depletion for decrease of 0.4 million ounces of gold and 0.03 million tonnes of copper.
MINERAL RESOURCES AND ORE RESERVES
28MINERAL RESOURCES AND ORE RESERVES
Cadia Hill and StockpilesOn 23 April 2018 Newcrest announced that it had received approval from the New South Wales Department of Planning and Environment to use the first 200m of the old Cadia Hill open pit as a tailings storage facility. Further study into the use of the Cadia Hill open pit for tailings storage has confirmed that this will preclude any portion of the existing Ore Reserve or Mineral Resource from future extraction. Since 31 December 2017 as announced in market release of 22 August 2018 (refer "Cadia Expansion Pre-Feasibility Study Findings") this has resulted in the removal of the entire Cadia Hill Ore Reserve containing approximately 1.5Moz gold and 0.13Mt of copper and removal of the in situ Cadia Hill Mineral Resource containing approximately 2.7Moz gold and 0.23Mt of copper. Surface stockpiles from Cadia Hill containing approximately 0.3Moz gold and 0.04Mt of copper remain in Mineral Resource.
RidgewayNo change in Reserves or Resources has been made since 31 December 2017.
TELFER (WA)Gold and copper mineralisation in the Telfer Province is intrusion related and occurs as higher-grade stratabound reefs, discordant veins and lower-grade bulk tonnage stockwork zones. The Telfer operation is comprised of open pit mining at both Main Dome and West Dome and underground mining at Main Dome. Open pit mining is a conventional truck and hydraulic excavator operation. Underground selective and bulk long hole open stope mining methods are used for excavation of the high-grade reefs and Western Flanks respectively, while stockwork ore and waste are mined using sub level cave bulk mining method. Underground sub level cave bulk mining ore and Western Flanks bulk open stope ore is hoisted to the surface via a shaft. Changes to Mineral Resources and Ore Reserves at Telfer since 31 December 2017 have only occurred in the two producing mines detailed below.
Telfer Main Dome and West Dome Open PitsOpen pit mining has continued at both Main Dome and West Dome open pits (including stockpile reclaim). Since 31 December 2017, the Mineral Resource has been depleted by 0.19 million ounces of gold and 0.01 million tonnes of copper and the Ore Reserve has been depleted by 0.18 million ounces of gold and 0.01 million tonnes of copper.
Telfer UndergroundThe Telfer Underground comprises the operating SLC mine and selective high-grade reef mining and Western Flanks reef and stockwork mining. Since 31 December 2017, both the Mineral Resource and Ore Reserve have been depleted by 0.08 million ounces of gold and less than 0.01 million tonnes of copper.
LIHIR (PNG)The Lihir Gold Mine is located on Niolam Island, 900 kilometres north-east of Port Moresby in the New Ireland Province of Papua New Guinea (PNG). Lihir is a volcanic sea mount that rises steeply from sea level to approximately 600 metres above sea level. The Luise Caldera, in which all of the known ore deposits are located, is on the east coast of the island. The Lihir Gold Mine consists of three linked open pits, Minifie, Lienetz and Kapit, that will be mined over the life of the project. Mining is by conventional open pit methods. Changes to Mineral Resources and Ore Reserves at Lihir since 31 December 2017 have occurred in both open pit and stockpiles and have comprised the depletion of 0.5 million ounces of gold from both Mineral Resource and Ore Reserve.
GOSOWONG (INDONESIA)Gosowong is located on Halmahera Island in North Maluku Province in the eastern part of the Republic of Indonesia. Gosowong is owned and operated by PT Nusa Halmahera Minerals, an incorporated joint venture between Newcrest (75 percent) and PT Aneka Tambang (25 percent). For the purpose of reporting Mineral Resources and Ore Reserves, Newcrest reports 100 percent of the assets. Economic mineralisation in the Gosowong province is low sulphidation epithermal veining containing high-grade gold and silver. On 23 June 2018 Newcrest’s 75%-owned Indonesian subsidiary, PT Nusa Halmahera Minerals (PT NHM), has entered into an amendment agreement with the Government of Indonesia to amend the Gosowong Contract of Work (CoW). Under this agreement Indonesian parties must own at least 51% of PT NHM within two years of signing the amendment agreement. As a result, Newcrest must divest at least another 26% interest from its current shareholding percentage of 75%.
Changes to Mineral Resources and Ore Reserves at Gosowong since 31 December 2017 have only occurred at the two producing mines detailed below.
Kencana UndergroundSince 31 December 2017, the Mineral Resource has changed through mining depletion offset by incremental additions from infill and near mine exploration for overall decrease of 0.03 million ounces of gold. The Ore Reserve has changed through mining depletion offset by incremental additions from infill and near mine exploration drill programs for overall increase of 0.03 million ounces of gold.
Toguraci UndergroundSince 31 December 2017, the Mineral Resource has changed through mining depletion and infill and near mine exploration drill programs for overall decrease of 0.02 million ounces of gold. The Ore Reserve has changed through mining depletion offset by incremental additions from infill and near mine exploration drill programs for overall increase of 0.02 million ounces of gold.
MMJV WAFI-GOLPU PROJECT (PNG)On the 19 March 2018 Newcrest released an updated Wafi-Golpu Feasibility Study. This study incorporates the findings from the earlier Pre-Feasibility and Feasibility Studies announced in February 2016, interpretation of the additional orebody data derived from further drilling and geotechnical studies, together with further work undertaken on mine design, hydrology, tailings and port and power options. The updated Study draws on extensive data collection undertaken since 2016, providing a deeper understanding of the project’s geotechnical, oceanographic, environmental and social parameters.
The updated Wafi-Golpu Feasibility Study is the basis of updated Ore Reserve for Golpu. Since December 2017 the Golpu Ore Reserve increased by 0.05 million ounces of gold and 0.06 million tonnes of copper. The Golpu Mineral Resource remains unchanged.
MINERAL RESOURCES AND ORE RESERVES
29NEWCREST 2018 ANNUAL REPORT
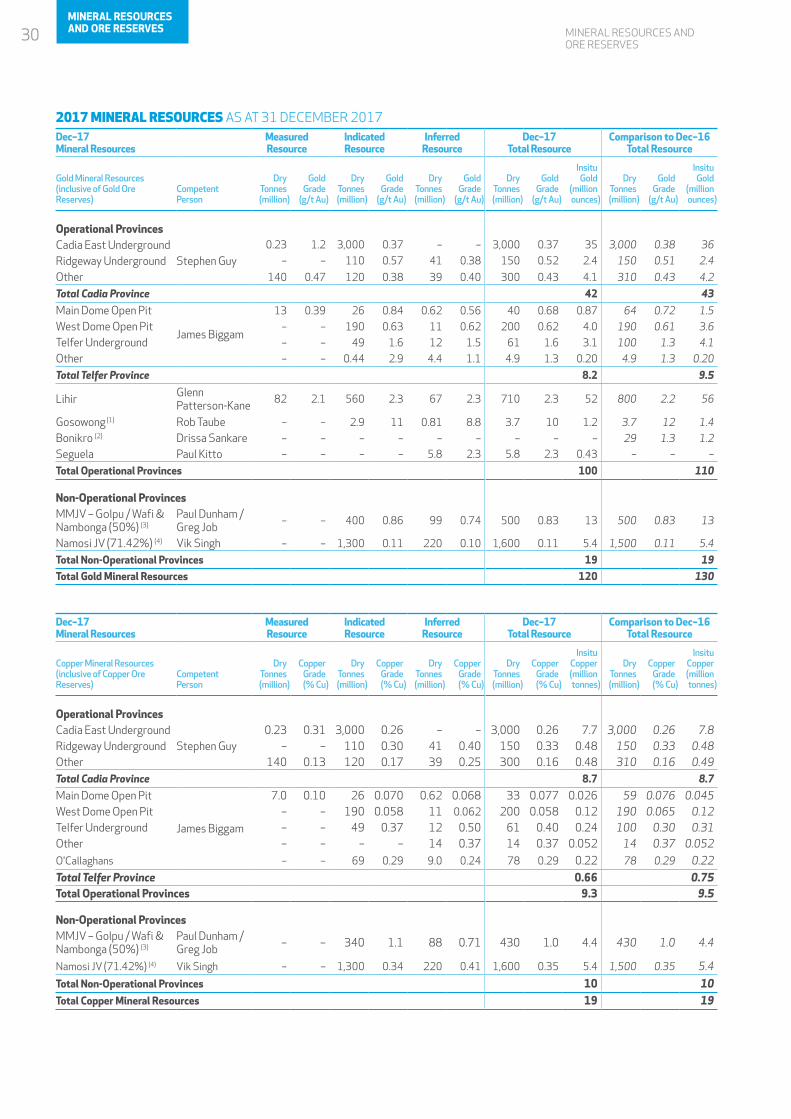
MINERAL RESOURCES AND ORE RESERVES
2017 MINERAL RESOURCES AS AT 31 DECEMBER 2017Dec–17 Mineral Resources
Measured Resource
Indicated Resource
Inferred Resource
Dec–17 Total Resource
Comparison to Dec–16 Total Resource
Gold Mineral Resources(inclusive of Gold Ore Reserves)
Competent Person
Dry Tonnes (million)
Gold Grade
(g/t Au)
Dry Tonnes (million)
Gold Grade
(g/t Au)
Dry Tonnes (million)
Gold Grade
(g/t Au)
Dry Tonnes (million)
Gold Grade
(g/t Au)
Insitu Gold
(million ounces)
Dry Tonnes (million)
Gold Grade
(g/t Au)
Insitu Gold
(million ounces)
Operational ProvincesCadia East Underground
Stephen Guy 0.23 1.2 3,000 0.37 – – 3,000 0.37 35 3,000 0.38 36
Ridgeway Underground – – 110 0.57 41 0.38 150 0.52 2.4 150 0.51 2.4
Other 140 0.47 120 0.38 39 0.40 300 0.43 4.1 310 0.43 4.2
Total Cadia Province 42 43
Main Dome Open Pit
James Biggam
13 0.39 26 0.84 0.62 0.56 40 0.68 0.87 64 0.72 1.5
West Dome Open Pit – – 190 0.63 11 0.62 200 0.62 4.0 190 0.61 3.6
Telfer Underground – – 49 1.6 12 1.5 61 1.6 3.1 100 1.3 4.1
Other – – 0.44 2.9 4.4 1.1 4.9 1.3 0.20 4.9 1.3 0.20
Total Telfer Province 8.2 9.5
Lihir Glenn Patterson-Kane
82 2.1 560 2.3 67 2.3 710 2.3 52 800 2.2 56
Gosowong (1) Rob Taube – – 2.9 11 0.81 8.8 3.7 10 1.2 3.7 12 1.4
Bonikro (2) Drissa Sankare – – – – – – – – – 29 1.3 1.2
Seguela Paul Kitto – – – – 5.8 2.3 5.8 2.3 0.43 – – –
Total Operational Provinces 100 110
Non-Operational ProvincesMMJV – Golpu / Wafi & Nambonga (50%) (3)
Paul Dunham / Greg Job
– – 400 0.86 99 0.74 500 0.83 13 500 0.83 13
Namosi JV (71.42%) (4) Vik Singh – – 1,300 0.11 220 0.10 1,600 0.11 5.4 1,500 0.11 5.4
Total Non-Operational Provinces 19 19
Total Gold Mineral Resources 120 130
Dec–17 Mineral Resources
Measured Resource
Indicated Resource
Inferred Resource
Dec–17 Total Resource
Comparison to Dec–16 Total Resource
Copper Mineral Resources(inclusive of Copper Ore Reserves)
Competent Person
Dry Tonnes (million)
CopperGrade(% Cu)
Dry Tonnes (million)
CopperGrade(% Cu)
Dry Tonnes (million)
CopperGrade(% Cu)
Dry Tonnes (million)
CopperGrade(% Cu)
Insitu Copper(million tonnes)
Dry Tonnes (million)
CopperGrade(% Cu)
Insitu Copper(million tonnes)
Operational ProvincesCadia East Underground
Stephen Guy 0.23 0.31 3,000 0.26 – – 3,000 0.26 7.7 3,000 0.26 7.8
Ridgeway Underground – – 110 0.30 41 0.40 150 0.33 0.48 150 0.33 0.48 Other 140 0.13 120 0.17 39 0.25 300 0.16 0.48 310 0.16 0.49 Total Cadia Province 8.7 8.7
Main Dome Open Pit
James Biggam
7.0 0.10 26 0.070 0.62 0.068 33 0.077 0.026 59 0.076 0.045 West Dome Open Pit – – 190 0.058 11 0.062 200 0.058 0.12 190 0.065 0.12 Telfer Underground – – 49 0.37 12 0.50 61 0.40 0.24 100 0.30 0.31 Other – – – – 14 0.37 14 0.37 0.052 14 0.37 0.052
O'Callaghans – – 69 0.29 9.0 0.24 78 0.29 0.22 78 0.29 0.22
Total Telfer Province 0.66 0.75 Total Operational Provinces 9.3 9.5
Non-Operational ProvincesMMJV – Golpu / Wafi & Nambonga (50%) (3)
Paul Dunham / Greg Job – – 340 1.1 88 0.71 430 1.0 4.4 430 1.0 4.4
Namosi JV (71.42%) (4) Vik Singh – – 1,300 0.34 220 0.41 1,600 0.35 5.4 1,500 0.35 5.4
Total Non-Operational Provinces 10 10 Total Copper Mineral Resources 19 19
30MINERAL RESOURCES AND ORE RESERVES
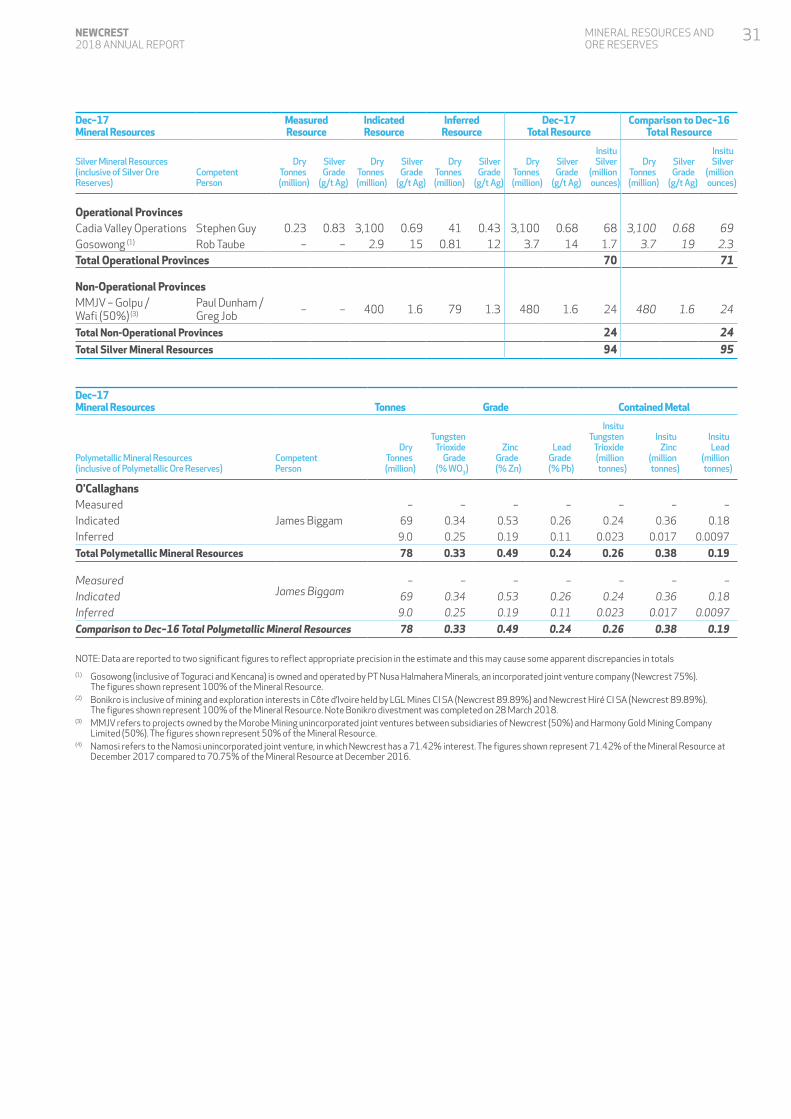
Dec–17 Mineral Resources
Measured Resource
Indicated Resource
Inferred Resource
Dec–17 Total Resource
Comparison to Dec–16 Total Resource
Silver Mineral Resources(inclusive of Silver Ore Reserves)
Competent Person
Dry Tonnes (million)
SilverGrade
(g/t Ag)
Dry Tonnes (million)
SilverGrade
(g/t Ag)
Dry Tonnes (million)
SilverGrade
(g/t Ag)
Dry Tonnes (million)
SilverGrade
(g/t Ag)
Insitu Silver
(million ounces)
Dry Tonnes (million)
SilverGrade
(g/t Ag)
Insitu Silver
(million ounces)
Operational ProvincesCadia Valley Operations Stephen Guy 0.23 0.83 3,100 0.69 41 0.43 3,100 0.68 68 3,100 0.68 69 Gosowong (1) Rob Taube – – 2.9 15 0.81 12 3.7 14 1.7 3.7 19 2.3 Total Operational Provinces 70 71
Non-Operational ProvincesMMJV – Golpu / Wafi (50%) (3)
Paul Dunham / Greg Job – – 400 1.6 79 1.3 480 1.6 24 480 1.6 24
Total Non-Operational Provinces 24 24 Total Silver Mineral Resources 94 95
Dec–17 Mineral Resources Tonnes Grade Contained Metal
Polymetallic Mineral Resources(inclusive of Polymetallic Ore Reserves)
Competent Person
Dry Tonnes(million)
Tungsten Trioxide
Grade(% WO3)
ZincGrade(% Zn)
LeadGrade(% Pb)
Insitu Tungsten
Trioxide (million tonnes)
Insitu Zinc
(million tonnes)
Insitu Lead
(million tonnes)
O'CallaghansMeasured
James Biggam – – – – – – –
Indicated 69 0.34 0.53 0.26 0.24 0.36 0.18
Inferred 9.0 0.25 0.19 0.11 0.023 0.017 0.0097
Total Polymetallic Mineral Resources 78 0.33 0.49 0.24 0.26 0.38 0.19
MeasuredJames Biggam
– – – – – – –
Indicated 69 0.34 0.53 0.26 0.24 0.36 0.18
Inferred 9.0 0.25 0.19 0.11 0.023 0.017 0.0097
Comparison to Dec–16 Total Polymetallic Mineral Resources 78 0.33 0.49 0.24 0.26 0.38 0.19
NOTE: Data are reported to two significant figures to reflect appropriate precision in the estimate and this may cause some apparent discrepancies in totals
(1) Gosowong (inclusive of Toguraci and Kencana) is owned and operated by PT Nusa Halmahera Minerals, an incorporated joint venture company (Newcrest 75%). The figures shown represent 100% of the Mineral Resource.
(2) Bonikro is inclusive of mining and exploration interests in Côte d’Ivoire held by LGL Mines CI SA (Newcrest 89.89%) and Newcrest Hiré CI SA (Newcrest 89.89%). The figures shown represent 100% of the Mineral Resource. Note Bonikro divestment was completed on 28 March 2018.
(3) MMJV refers to projects owned by the Morobe Mining unincorporated joint ventures between subsidiaries of Newcrest (50%) and Harmony Gold Mining Company Limited (50%). The figures shown represent 50% of the Mineral Resource.
(4) Namosi refers to the Namosi unincorporated joint venture, in which Newcrest has a 71.42% interest. The figures shown represent 71.42% of the Mineral Resource at December 2017 compared to 70.75% of the Mineral Resource at December 2016.
MINERAL RESOURCES AND ORE RESERVES
31NEWCREST 2018 ANNUAL REPORT
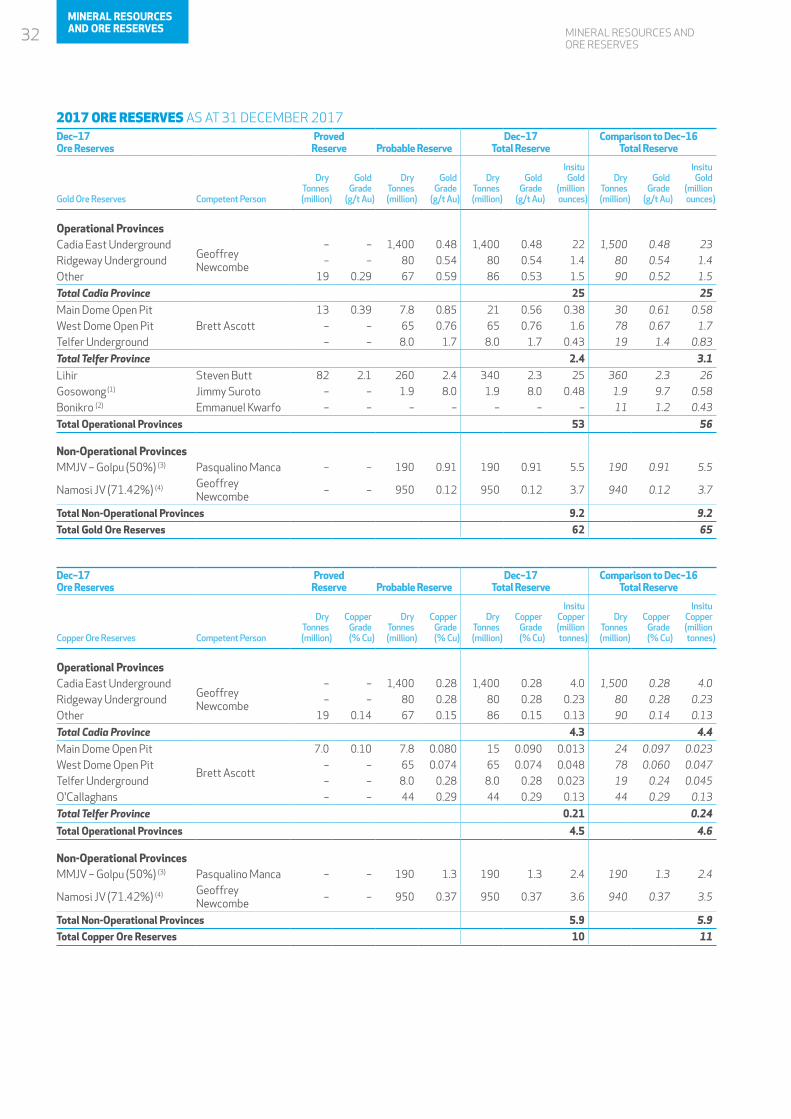
MINERAL RESOURCES AND ORE RESERVES
2017 ORE RESERVES AS AT 31 DECEMBER 2017Dec–17Ore Reserves
Proved Reserve Probable Reserve
Dec–17 Total Reserve
Comparison to Dec–16 Total Reserve
Gold Ore Reserves Competent Person
Dry Tonnes (million)
GoldGrade
(g/t Au)
Dry Tonnes (million)
GoldGrade
(g/t Au)
Dry Tonnes (million)
GoldGrade
(g/t Au)
Insitu Gold
(millionounces)
Dry Tonnes (million)
GoldGrade
(g/t Au)
Insitu Gold
(million ounces)
Operational ProvincesCadia East Underground
Geoffrey Newcombe
– – 1,400 0.48 1,400 0.48 22 1,500 0.48 23
Ridgeway Underground – – 80 0.54 80 0.54 1.4 80 0.54 1.4
Other 19 0.29 67 0.59 86 0.53 1.5 90 0.52 1.5
Total Cadia Province 25 25
Main Dome Open PitBrett Ascott
13 0.39 7.8 0.85 21 0.56 0.38 30 0.61 0.58
West Dome Open Pit – – 65 0.76 65 0.76 1.6 78 0.67 1.7
Telfer Underground – – 8.0 1.7 8.0 1.7 0.43 19 1.4 0.83
Total Telfer Province 2.4 3.1
Lihir Steven Butt 82 2.1 260 2.4 340 2.3 25 360 2.3 26
Gosowong (1) Jimmy Suroto – – 1.9 8.0 1.9 8.0 0.48 1.9 9.7 0.58
Bonikro (2) Emmanuel Kwarfo – – – – – – – 11 1.2 0.43
Total Operational Provinces 53 56
Non-Operational ProvincesMMJV – Golpu (50%) (3) Pasqualino Manca – – 190 0.91 190 0.91 5.5 190 0.91 5.5
Namosi JV (71.42%) (4) Geoffrey Newcombe
– – 950 0.12 950 0.12 3.7 940 0.12 3.7
Total Non-Operational Provinces 9.2 9.2
Total Gold Ore Reserves 62 65
Dec–17Ore Reserves
Proved Reserve Probable Reserve
Dec–17 Total Reserve
Comparison to Dec–16 Total Reserve
Copper Ore Reserves Competent Person
Dry Tonnes (million)
CopperGrade(% Cu)
Dry Tonnes (million)
CopperGrade(% Cu)
Dry Tonnes (million)
CopperGrade(% Cu)
Insitu Copper (milliontonnes)
Dry Tonnes (million)
CopperGrade(% Cu)
Insitu Copper (million tonnes)
Operational ProvincesCadia East Underground
Geoffrey Newcombe
– – 1,400 0.28 1,400 0.28 4.0 1,500 0.28 4.0
Ridgeway Underground – – 80 0.28 80 0.28 0.23 80 0.28 0.23
Other 19 0.14 67 0.15 86 0.15 0.13 90 0.14 0.13
Total Cadia Province 4.3 4.4
Main Dome Open Pit
Brett Ascott
7.0 0.10 7.8 0.080 15 0.090 0.013 24 0.097 0.023
West Dome Open Pit – – 65 0.074 65 0.074 0.048 78 0.060 0.047
Telfer Underground – – 8.0 0.28 8.0 0.28 0.023 19 0.24 0.045
O'Callaghans – – 44 0.29 44 0.29 0.13 44 0.29 0.13
Total Telfer Province 0.21 0.24
Total Operational Provinces 4.5 4.6
Non-Operational ProvincesMMJV – Golpu (50%) (3) Pasqualino Manca – – 190 1.3 190 1.3 2.4 190 1.3 2.4
Namosi JV (71.42%) (4) Geoffrey Newcombe
– – 950 0.37 950 0.37 3.6 940 0.37 3.5
Total Non-Operational Provinces 5.9 5.9
Total Copper Ore Reserves 10 11
32MINERAL RESOURCES AND ORE RESERVES
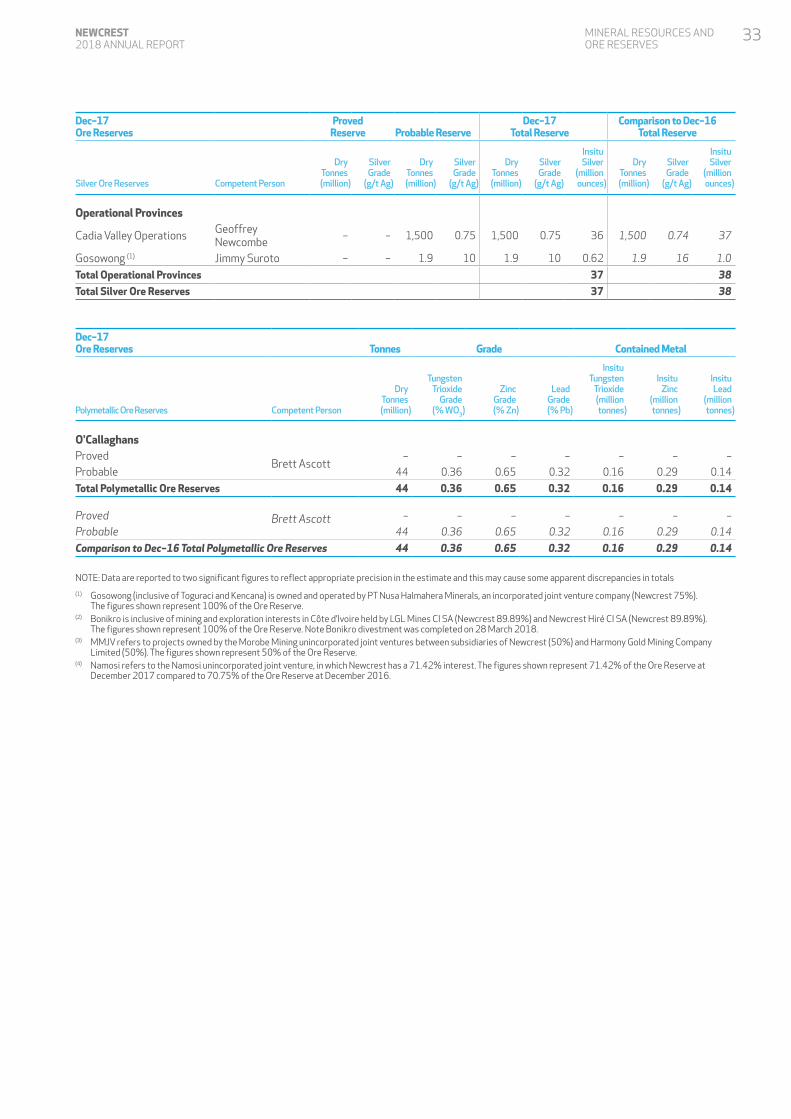
Dec–17Ore Reserves
Proved Reserve Probable Reserve
Dec–17 Total Reserve
Comparison to Dec–16 Total Reserve
Silver Ore Reserves Competent Person
Dry Tonnes (million)
SilverGrade
(g/t Ag)
Dry Tonnes (million)
SilverGrade
(g/t Ag)
Dry Tonnes (million)
SilverGrade
(g/t Ag)
Insitu Silver
(millionounces)
Dry Tonnes (million)
SilverGrade
(g/t Ag)
Insitu Silver
(million ounces)
Operational Provinces
Cadia Valley Operations Geoffrey Newcombe
– – 1,500 0.75 1,500 0.75 36 1,500 0.74 37
Gosowong (1) Jimmy Suroto – – 1.9 10 1.9 10 0.62 1.9 16 1.0
Total Operational Provinces 37 38
Total Silver Ore Reserves 37 38
Dec–17 Ore Reserves Tonnes Grade Contained Metal
Polymetallic Ore Reserves Competent Person
Dry Tonnes (million)
Tungsten Trioxide
Grade(% WO3)
ZincGrade(% Zn)
LeadGrade(% Pb)
Insitu Tungsten
Trioxide (million tonnes)
InsituZinc
(million tonnes)
Insitu Lead
(million tonnes)
O'CallaghansProved
Brett Ascott – – – – – – –
Probable 44 0.36 0.65 0.32 0.16 0.29 0.14
Total Polymetallic Ore Reserves 44 0.36 0.65 0.32 0.16 0.29 0.14
Proved Brett Ascott – – – – – – –
Probable 44 0.36 0.65 0.32 0.16 0.29 0.14
Comparison to Dec–16 Total Polymetallic Ore Reserves 44 0.36 0.65 0.32 0.16 0.29 0.14
NOTE: Data are reported to two significant figures to reflect appropriate precision in the estimate and this may cause some apparent discrepancies in totals
(1) Gosowong (inclusive of Toguraci and Kencana) is owned and operated by PT Nusa Halmahera Minerals, an incorporated joint venture company (Newcrest 75%). The figures shown represent 100% of the Ore Reserve.
(2) Bonikro is inclusive of mining and exploration interests in Côte d’Ivoire held by LGL Mines CI SA (Newcrest 89.89%) and Newcrest Hiré CI SA (Newcrest 89.89%). The figures shown represent 100% of the Ore Reserve. Note Bonikro divestment was completed on 28 March 2018.
(3) MMJV refers to projects owned by the Morobe Mining unincorporated joint ventures between subsidiaries of Newcrest (50%) and Harmony Gold Mining Company Limited (50%). The figures shown represent 50% of the Ore Reserve.
(4) Namosi refers to the Namosi unincorporated joint venture, in which Newcrest has a 71.42% interest. The figures shown represent 71.42% of the Ore Reserve at December 2017 compared to 70.75% of the Ore Reserve at December 2016.
MINERAL RESOURCES AND ORE RESERVES
33NEWCREST 2018 ANNUAL REPORT

CORPORATE GOVERNANCE STATEMENT
CORPORATE GOVERNANCE STATEMENTThe Board believes that adherence by Newcrest and its people to the highest standards of corporate governance is critical in order to achieve its vision. Accordingly, Newcrest has a detailed governance framework, which is regularly reviewed and adapted to developments in market practice and regulation.
As at the date of lodgement of this Report, Newcrest’s governance framework complies with the Corporate Governance Principles and Recommendations (3rd edition) published by the ASX Corporate Governance Council. Further information in relation to Newcrest’s governance framework is provided in the Corporate Governance
Statement, which was lodged with ASX on the date of lodgement of this Annual Report and is available in the corporate governance section of the Newcrest website at http://www.newcrest.com.au/about-us/corporate-governance. The corporate governance section of the Newcrest website also provides further information in relation to Newcrest’s governance framework, including Board and Board Committee Charters and key policies.
34CORPORATE GOVERNANCE STATEMENT

TABLE OF CONTENTS
DIRECTORS' REPORT 36
OPERATING AND FINANCIAL REVIEW 40
REMUNERATION REPORT 72
FINANCIAL REPORT 94
INDEPENDENT AUDITOR'S REPORT 144
35NEWCREST 2018 ANNUAL REPORT

DIRECTORS' REPORT
DIRECTORS’ REPORTThe Directors present their report together with the consolidated financial report of the Newcrest Mining Limited Group, comprising Newcrest Mining Limited (‘the Company’) and its controlled entities (‘Newcrest’ or ‘the Group’), for the year ended 30 June 2018.
DIRECTORSThe Directors of the Company during the year ended 30 June 2018, and up to the date of this report are set out below. All Directors held their position as a Director throughout the entire year and up to the date of this report unless otherwise stated.
Peter Hay Non-Executive Director and Non-Executive Chairman Sandeep Biswas Managing Director and Chief Executive Officer Gerard Bond Finance Director and Chief Financial Officer Philip Aiken AM Non-Executive DirectorRoger Higgins Non-Executive Director Rick Lee AM Non-Executive DirectorXiaoling Liu Non-Executive Director Vickki McFadden Non-Executive Director Winifred Kamit Non-Executive Director (resigned on 14 November 2017)John Spark Non-Executive Director (resigned on 14 November 2017)
Subsequent to year-end, the following changes to the composition of the Board of Directors have been announced:
• the appointment of Peter Tomsett as an independent Non-Executive Director, effective 1 September 2018; and• the resignation of Rick Lee as an independent Non-Executive Director, immediately after the next Newcrest Annual General Meeting
on 14 November 2018.
PRINCIPAL ACTIVITIESThe principal activities of the Group during the year were exploration, mine development, mine operations and the sale of gold and gold/copper concentrate. There were no significant changes in those activities during the year.
CONSOLIDATED RESULTThe profit after tax attributable to Newcrest shareholders (‘Statutory Profit’) for the year ended 30 June 2018 was US$202 million (2017: profit of US$308 million).
Refer to the Operating and Financial Review for further details. The Operating and Financial Review forms part of this Directors’ Report. The financial information in the Operating and Financial Review includes non-IFRS financial information. Explanations and reconciliations of non-IFRS financial information to the financial statements are included in Section 6 of the Operating and Financial Review.
DIVIDENDSThe following dividends of the Company were paid during the year:
• Final dividend for the year ended 30 June 2017 of US 7.5 cents per share, amounting to US$57.5 million, was paid on 27 October 2017. This dividend was 70% franked.
• Interim dividend for the year ended 30 June 2018 of US 7.5 cents per share, amounting to US$57.5 million, was paid on 2 May 2018. This dividend was fully franked.
The Directors have determined to pay a final dividend for the year ended 30 June 2018 of US 11 cents per share, which will be fully franked. The dividend will be paid on 5 October 2018.
SIGNIFICANT CHANGES IN THE STATE OF AFFAIRSThere have been no significant changes in the state of affairs of the Group.
FUTURE DEVELOPMENTSRefer to the Operating and Financial Review for information on likely developments and future prospects of the Group.
SUBSEQUENT EVENTSSubsequent to year-end, the Directors have determined to pay a final dividend for the year ended 30 June 2018 of US 11 cents per share, which will be fully franked. The dividend will be paid on 5 October 2018. The total amount of the dividend is US$84 million. This dividend has not been provided for in the 30 June 2018 financial statements.
There have been no other matters or events that have occurred subsequent to 30 June 2018 that have significantly affected or may significantly affect the operations of the Group, the results of those operations or the state of affairs of the Group in subsequent financial years.
OPTIONSThe Company does not have any unissued shares or unissued interests under option as at the date of this report, nor has it granted, or issued shares or interests under, any options during or since the end of the year.
36 DIRECTORS' REPORT
DIRECTORS' REPORT
NON-AUDIT SERVICESDuring the year, Ernst & Young (external auditor to the Company), has provided other services in addition to the statutory audit, as disclosed in Note 36 to the financial statements.
The Directors are satisfied that the provision of non-audit services provided by the auditor is compatible with the general standard of independence for auditors imposed by the Corporations Act 2001. The Directors are satisfied that these non-audit services do not compromise the auditor’s independence, based on advice received from the Audit and Risk Committee, for the following reasons:
• all non-audit services have been reviewed by the Audit and Risk Committee to ensure they did not impact on the impartiality and objectivity of the auditor; and
• none of the services undermine the general principles relating to auditor independence as set out in APES 110 Code of Ethics for Professional Accountants, as they did not involve reviewing or auditing the auditor’s own work, acting in a management or decision-making capacity for the Company, acting as an advocate for the Company or jointly sharing economic risks and rewards.
AUDITOR INDEPENDENCEA copy of the Auditor’s Independence Declaration, as required by the Corporations Act 2001, is included after this report.
CURRENCYAll references to dollars in the Directors’ Report and the Financial Report are a reference to US dollars ($ or US$) unless otherwise specified.
ROUNDING OF AMOUNTSNewcrest Mining Limited is a company of the kind referred to in ASIC Corporations (Rounding in Financial/Directors’ Reports) Instrument 2016/191 and in accordance with that Instrument, amounts in the Directors’ Report and the Financial Report are rounded to the nearest million dollars except where otherwise indicated.
ENVIRONMENTAL REGULATION AND PERFORMANCEThe Managing Director reports to the Board on all significant safety, health and environmental incidents. The Board also has a Safety and Sustainability Committee which has oversight of the safety, health and environmental performance of the Group and meets at least four times per year. At the Cadia mine on 9 March 2018, a limited breakthrough of tailings material occurred through the Northern Tailings Storage Facility embankment that was fully contained within the Southern Tailings Storage Facility. Although there was some business interruption from this event (refer to Section 1 of the Operating and Financial Review), due to its full containment there was no recorded environmental consequence from this incident.
The operations of the Group are subject to environmental regulation under the jurisdiction of the countries in which those operations are conducted, including Australia, Indonesia, Papua New Guinea (‘PNG’), Côte d’Ivoire and Fiji. Each mining operation is subject to particular environmental regulation specific to their activities as part of their operating licence or environmental approvals. Each of our sites are required to also manage their environmental obligations in accordance with our corporate environmental policies and standards.
The environmental laws and regulations that cover each of our sites, combined with our policies and standards, address the potential impact of the Group’s activities in relation to water and air quality, noise, land disturbance, waste and tailings management, and the potential impact upon flora and fauna. The Group releases an annual Sustainability Report in accordance with the Global Reporting Initiative that details our activities in relation to management of key environmental aspects.
The Group has an internal reporting system covering all sites. Environmental incidents are reported and assessed according to their environmental consequence and environmental authorities are notified where required and remedial action is undertaken.
Levels of environmental incidents are categorised based on factors such as spill volume, incident location (onsite or offsite) and environmental consequence. Historical reporting included five environmental incident categories related to spill classifications while the number of incidents for 2018 is based on four levels of actual environmental consequence. Levels of environmental consequence include: 1 (Minor), 2 (Major), 3 (Critical), and 4 (Catastrophic). Level 1 Minor incidents are tracked and managed at a site level and are not reported in aggregate for the Group. The number of incidents reported by level during the 2018 financial year based on actual environmental consequence is shown in the following table.
Category Level 2 Level 3 Level 4
2018 – Number of incidents 10 1 02017 – Number of incidents (1) 7 0 0(1) Comparative figures have been restated to align with the new internal reporting
system based on environmental consequence. Based on historical spill classification categories reported in the 2017 annual report, there were 18 Category II incidents and nil Category III, IV or V incidents.
INDEMNIFICATION AND INSURANCE OF DIRECTORS AND OFFICERSNewcrest indemnifies each Director, Secretary and Executive Officer of Newcrest and its subsidiaries against any liability related to, or arising out of, the conduct of the business of Newcrest or its subsidiaries or the discharge of the Director's, Secretary's or Executive Officer's duties. These indemnities are given to the extent that Newcrest is permitted by law and its Constitution to do so. No payment has been made to indemnify any Director, Secretary and Executive Officer of the Company and its subsidiaries during or since the end of the financial year.
Newcrest maintains a Directors’ and Officers’ insurance policy which, subject to some exceptions, provides insurance cover to past, present or future Directors, Secretaries and Executive Officers of Newcrest and its subsidiaries. The Company has paid an insurance premium for the policy.
INDEMNIFICATION OF AUDITORSTo the extent permitted by law, the Company has agreed to indemnify its auditors, Ernst & Young, as part of the terms of its audit engagement agreement against claims by third parties arising from the audit (for an unspecified amount). No payment has been made to indemnify Ernst & Young during or since the end of the financial year.
37NEWCREST 2018 ANNUAL REPORT
DIRECTORS' REPORT
INFORMATION ON DIRECTORSDetails of the Directors’ qualifications, experience and special responsibilities are set out on pages 10 to 12. These details have been updated since 22 August 2018.
INFORMATION ON FORMER DIRECTORS (1)
Lady Winifred KamitIndependent Non-Executive DirectorBA, LLB, 65Lady Kamit was appointed to the Board in February 2011 and resigned effective 14 November 2017. She was a member of the Human Resources and Remuneration Committee and the Safety and Sustainability Committee.
Skills, experience and expertiseLady Kamit has extensive business experience and broad community knowledge of Papua New Guinea. She is currently a consultant at Gadens Lawyers in Port Moresby and was formerly a senior partner at that firm. Lady Kamit was a Director of Lihir Gold Limited from 2004 until 2010.
Current Listed DirectorshipsDirector of Steamships Trading Company Limited (from 2005)
Other Current Directorships/AppointmentsChairman of ANZ Banking Group (PNG) LimitedDirector of Post Courier LimitedDirector of South Pacific Post Limited
John Spark Independent Non-Executive DirectorBComm, FCA, MAICD, 69Mr Spark was appointed to the Board in September 2007 and resigned effective 14 November 2017. He was Chairman of the Audit and Risk Committee and a member of the Nominations Committee.
Skills, experience and expertiseMr Spark has an extensive background in company reconstruction, accounting, profit improvement and financial analysis. He is a registered company auditor and former Managing Partner of Ferrier Hodgson, Melbourne. He is a former Director of ANL Limited, Baxter Group Limited and Macarthur Coal Limited and former Chairman of Ridley Corporation Limited.
Current Listed DirectorshipsChairman of Murray Goulburn Co-operative Co. Limited (from 2017)
(1) Information provided is at the date of cessation as a Director of the Company.
INFORMATION ON COMPANY SECRETARY AND DEPUTY COMPANY SECRETARYFrancesca Lee General Counsel and Company Secretary BComm, LLB (Hons), LLM, Grad. Dip. CSP, AGIA, 62Ms Lee joined Newcrest as General Counsel and Company Secretary in March 2014. She was General Counsel and Company Secretary of OZ Minerals Limited from 2008 until 2014, and its antecedent companies from 2003. Ms Lee has more than 30 years’ experience working across various senior legal and commercial roles within the mining industry including BHP Billiton, Rio Tinto Limited and Comalco Limited, including as General Manager Internal Audit and Risk at Rio Tinto Limited. She also spent several years as Vice President Structured Finance with Citibank Limited.
Ms Lee was a member of the Australian Government Takeovers Panel from 2009 until March 2015.
Claire HannonDeputy Company SecretaryBSc, LLB (Hons), Grad. Dip. App Fin, GAICD, 44Ms Hannon joined Newcrest in January 2013 as Corporate Counsel in the legal team. She was appointed as an additional Company Secretary in August 2015. Prior to joining Newcrest, Ms Hannon worked as a lawyer in the Melbourne office of Ashurst and the London office of Clifford Chance, specialising in mergers and acquisitions and corporate law.
REMUNERATION REPORTThe Remuneration Report is set out on pages 72 to 92 and forms part of this Directors' Report.
38 DIRECTORS' REPORT
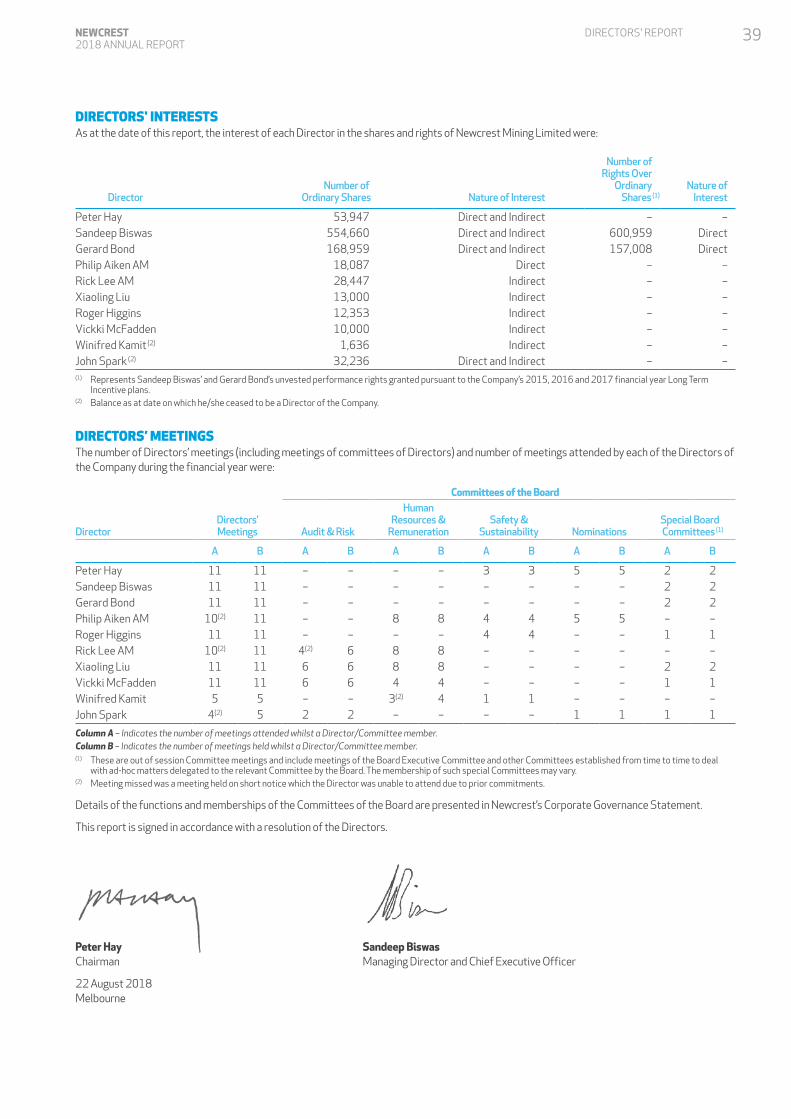
DIRECTORS' REPORT
DIRECTORS' INTERESTSAs at the date of this report, the interest of each Director in the shares and rights of Newcrest Mining Limited were:
DirectorNumber of
Ordinary Shares Nature of Interest
Number ofRights Over
OrdinaryShares (1)
Nature ofInterest
Peter Hay 53,947 Direct and Indirect – –Sandeep Biswas 554,660 Direct and Indirect 600,959 DirectGerard Bond 168,959 Direct and Indirect 157,008 DirectPhilip Aiken AM 18,087 Direct – –Rick Lee AM 28,447 Indirect – –Xiaoling Liu 13,000 Indirect – –Roger Higgins 12,353 Indirect – –Vickki McFadden 10,000 Indirect – –Winifred Kamit (2) 1,636 Indirect – –John Spark (2) 32,236 Direct and Indirect – –(1) Represents Sandeep Biswas’ and Gerard Bond’s unvested performance rights granted pursuant to the Company’s 2015, 2016 and 2017 financial year Long Term
Incentive plans.(2) Balance as at date on which he/she ceased to be a Director of the Company.
DIRECTORS’ MEETINGSThe number of Directors’ meetings (including meetings of committees of Directors) and number of meetings attended by each of the Directors of the Company during the financial year were:
Committees of the Board
DirectorDirectors’ Meetings Audit & Risk
Human Resources &
RemunerationSafety &
Sustainability NominationsSpecial Board
Committees (1)
A B A B A B A B A B A B
Peter Hay 11 11 – – – – 3 3 5 5 2 2Sandeep Biswas 11 11 – – – – – – – – 2 2Gerard Bond 11 11 – – – – – – – – 2 2Philip Aiken AM 10(2) 11 – – 8 8 4 4 5 5 – –Roger Higgins 11 11 – – – – 4 4 – – 1 1Rick Lee AM 10(2) 11 4(2) 6 8 8 – – – – – –Xiaoling Liu 11 11 6 6 8 8 – – – – 2 2Vickki McFadden 11 11 6 6 4 4 – – – – 1 1Winifred Kamit 5 5 – – 3(2) 4 1 1 – – – –John Spark 4(2) 5 2 2 – – – – 1 1 1 1
Column A – Indicates the number of meetings attended whilst a Director/Committee member.Column B – Indicates the number of meetings held whilst a Director/Committee member.(1) These are out of session Committee meetings and include meetings of the Board Executive Committee and other Committees established from time to time to deal
with ad-hoc matters delegated to the relevant Committee by the Board. The membership of such special Committees may vary.(2) Meeting missed was a meeting held on short notice which the Director was unable to attend due to prior commitments.
Details of the functions and memberships of the Committees of the Board are presented in Newcrest’s Corporate Governance Statement.
This report is signed in accordance with a resolution of the Directors.
Peter Hay Sandeep Biswas Chairman Managing Director and Chief Executive Officer
22 August 2018 Melbourne
39NEWCREST 2018 ANNUAL REPORT
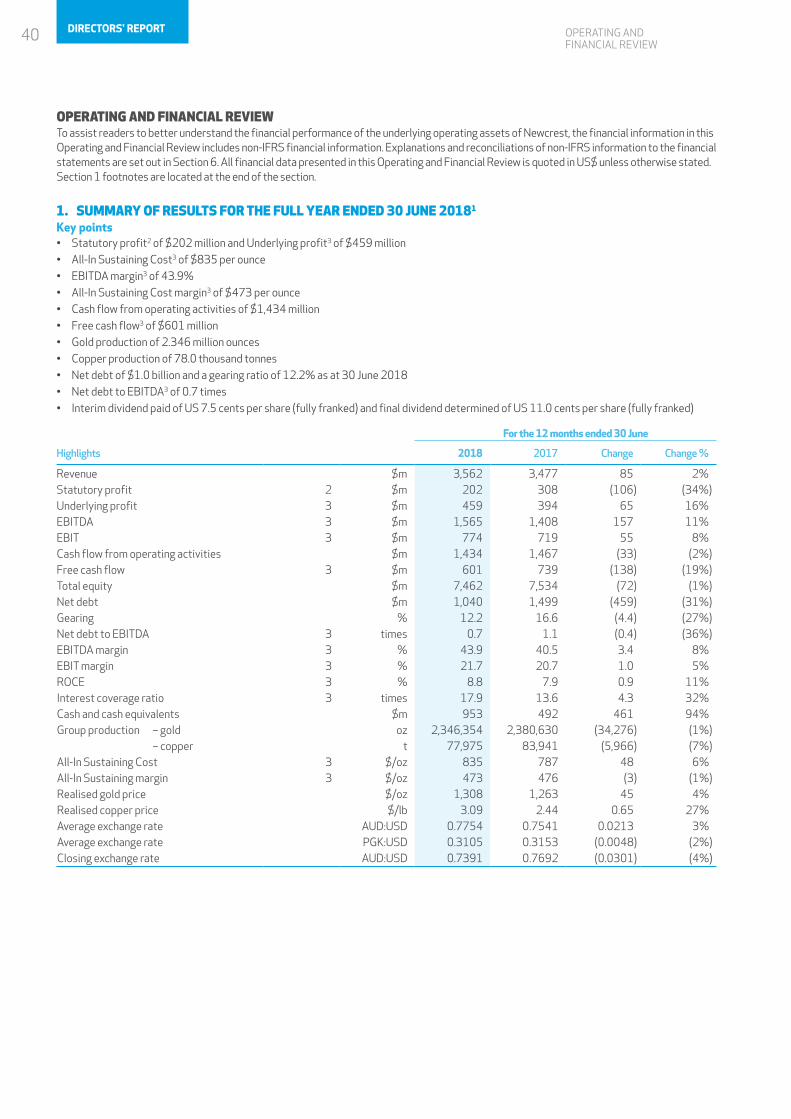
OPERATING AND FINANCIAL REVIEW
OPERATING AND FINANCIAL REVIEW To assist readers to better understand the financial performance of the underlying operating assets of Newcrest, the financial information in this Operating and Financial Review includes non-IFRS financial information. Explanations and reconciliations of non-IFRS information to the financial statements are set out in Section 6. All financial data presented in this Operating and Financial Review is quoted in US$ unless otherwise stated. Section 1 footnotes are located at the end of the section.
1. SUMMARY OF RESULTS FOR THE FULL YEAR ENDED 30 JUNE 20181 Key points• Statutory profit2 of $202 million and Underlying profit3 of $459 million• All-In Sustaining Cost3 of $835 per ounce• EBITDA margin3 of 43.9%• All-In Sustaining Cost margin3 of $473 per ounce • Cash flow from operating activities of $1,434 million• Free cash flow3 of $601 million• Gold production of 2.346 million ounces• Copper production of 78.0 thousand tonnes• Net debt of $1.0 billion and a gearing ratio of 12.2% as at 30 June 2018• Net debt to EBITDA3 of 0.7 times• Interim dividend paid of US 7.5 cents per share (fully franked) and final dividend determined of US 11.0 cents per share (fully franked)
For the 12 months ended 30 June
Highlights 2018 2017 Change Change %
Revenue $m 3,562 3,477 85 2%Statutory profit 2 $m 202 308 (106) (34%)Underlying profit 3 $m 459 394 65 16%EBITDA 3 $m 1,565 1,408 157 11%EBIT 3 $m 774 719 55 8%Cash flow from operating activities $m 1,434 1,467 (33) (2%)Free cash flow 3 $m 601 739 (138) (19%)Total equity $m 7,462 7,534 (72) (1%)Net debt $m 1,040 1,499 (459) (31%)Gearing % 12.2 16.6 (4.4) (27%)Net debt to EBITDA 3 times 0.7 1.1 (0.4) (36%)EBITDA margin 3 % 43.9 40.5 3.4 8%EBIT margin 3 % 21.7 20.7 1.0 5%ROCE 3 % 8.8 7.9 0.9 11%Interest coverage ratio 3 times 17.9 13.6 4.3 32%Cash and cash equivalents $m 953 492 461 94%Group production – gold oz 2,346,354 2,380,630 (34,276) (1%) – copper t 77,975 83,941 (5,966) (7%)All-In Sustaining Cost 3 $/oz 835 787 48 6%All-In Sustaining margin 3 $/oz 473 476 (3) (1%)Realised gold price $/oz 1,308 1,263 45 4%Realised copper price $/lb 3.09 2.44 0.65 27%Average exchange rate AUD:USD 0.7754 0.7541 0.0213 3%Average exchange rate PGK:USD 0.3105 0.3153 (0.0048) (2%)Closing exchange rate AUD:USD 0.7391 0.7692 (0.0301) (4%)
40 DIRECTORS' REPORT
OPERATING AND FINANCIAL REVIEW
Full year resultsDuring the current period, Newcrest’s operating performance was strengthened by record annual operational results at Lihir (gold production and mill throughput) and Telfer (mill throughput).
These operational achievements partially offset the adverse impacts in the current period of:
• the large seismic event on 14 April 2017 which resulted in the temporary suspension of mining operations at Cadia, with mining Panel Cave 2 (“PC2”) and Panel Cave 1 (“PC1”) recommencing in July 2017 and September 2017 respectively and subsequent progressive ramp-up in the first half of the current period; and
• the embankment slump at the Northern Tailings Storage Facility (“NTF”) at Cadia on 9 March 2018 which reduced milling rates for approximately two months of the current period.
Despite the challenges outlined above, Cadia finished the financial year strongly with its mine production and mill throughput annualised rate exceeding 30mtpa in June 2018.
Concurrent with seeking to safely maximise output from existing assets, Newcrest continued to focus on expanding its pipeline of profitable growth opportunities through both early stage entry arrangements and acquisition of equity investments. The largest investment in the current period was the $251 million acquisition of 27.1% interest in Lundin Gold Inc, which provides Newcrest exposure to the Fruta del Norte gold project in Ecuador. During the current period, Newcrest divested Bonikro for $72 million cash and a net smelter royalty on future ore mined at the Bonikro lease with a fair value of $9 million.
Statutory profit of $202 million was $106 million lower than the prior period. The current period Statutory profit includes significant items (after tax and non-controlling interests) with a net expense of $257 million. The primary significant items were an asset impairment at Telfer ($188 million) and a write-down of property, plant and equipment at Namosi ($72 million).
Underlying profit of $459 million was $65 million higher than the prior period, driven by higher realised gold and copper prices. This was partially offset by lower gold and copper sales volumes, primarily related to the effects of the Cadia seismic event and Cadia NTF event, and higher depreciation expense compared to the prior period. The result includes the receipt of insurance proceeds of $155 million, before tax, relating to the Cadia seismic event.
The average realised gold price in the current period of $1,308 per ounce was 4% higher than the prior period and the average realised copper price of $3.09 per pound was 27% higher than the prior period.
Gold production of 2.35 million ounces in the current period was negatively impacted by the temporary suspension of mining and milling activities following the seismic and NTF events at Cadia, together with lower head grades at Lihir and Gosowong. This was largely offset by an increase in mill throughput volumes at Lihir, Telfer and Gosowong.
Copper production of 78.0 thousand tonnes was 7% lower than the prior period primarily driven by lower average head grade at Telfer and the effects of the seismic and NTF events which impacted operations at Cadia.
Newcrest’s All-In Sustaining Cost of $835 per ounce was $48 per ounce higher than the prior period reflecting lower grade at some sites, higher production stripping costs at Lihir and Telfer, higher energy costs, the impacts of a stronger average Australian dollar and lower volume contribution from Cadia due to the effects of both the seismic and NTF events. The benefit of higher copper prices was partially offset by lower copper sales volumes. The current period All-In Sustaining Cost includes a net favourable normalisation of $11 per ounce which is related to the effects of the Cadia seismic event.
Free cash flow of $601 million was $138 million lower than the prior period driven by net working capital movements, lower gold and copper sales volumes, an increase in investing activities and an increase in income tax payments. These decreases were partially offset by higher gold and copper prices, and $155 million in insurance receipts related to the Cadia seismic event.
All operations were free cash flow positive before tax.
During the current period, Newcrest’s net debt reduced by $459m to $1,040 million, including an increase in cash and cash equivalents to $953 million. Newcrest’s gearing ratio improved to 12.2% and the net debt to EBITDA ratio improved to 0.7 times in the current period.
Capital structure Newcrest’s net debt at 30 June 2018 was $1,040 million, comprising $1,993 million of corporate bonds less $953 million of cash and cash equivalents.
From a liquidity perspective, Newcrest had $953 million of cash and $2,020 million4 in committed undrawn bank facilities as at 30 June 2018, which results in total liquidity of $2,973 million. Newcrest signed agreements in early August 2018 that extended the average maturity of $2,000 million of the committed undrawn bank facilities by approximately two years.
Newcrest’s financial objectives are to meet all financial obligations, maintain a strong balance sheet to withstand cash flow volatility, be able to invest capital in value-creating opportunities, and be able to return excess cash generated to shareholders. Newcrest looks to maintain a conservative level of balance sheet leverage.
41NEWCREST 2018 ANNUAL REPORT
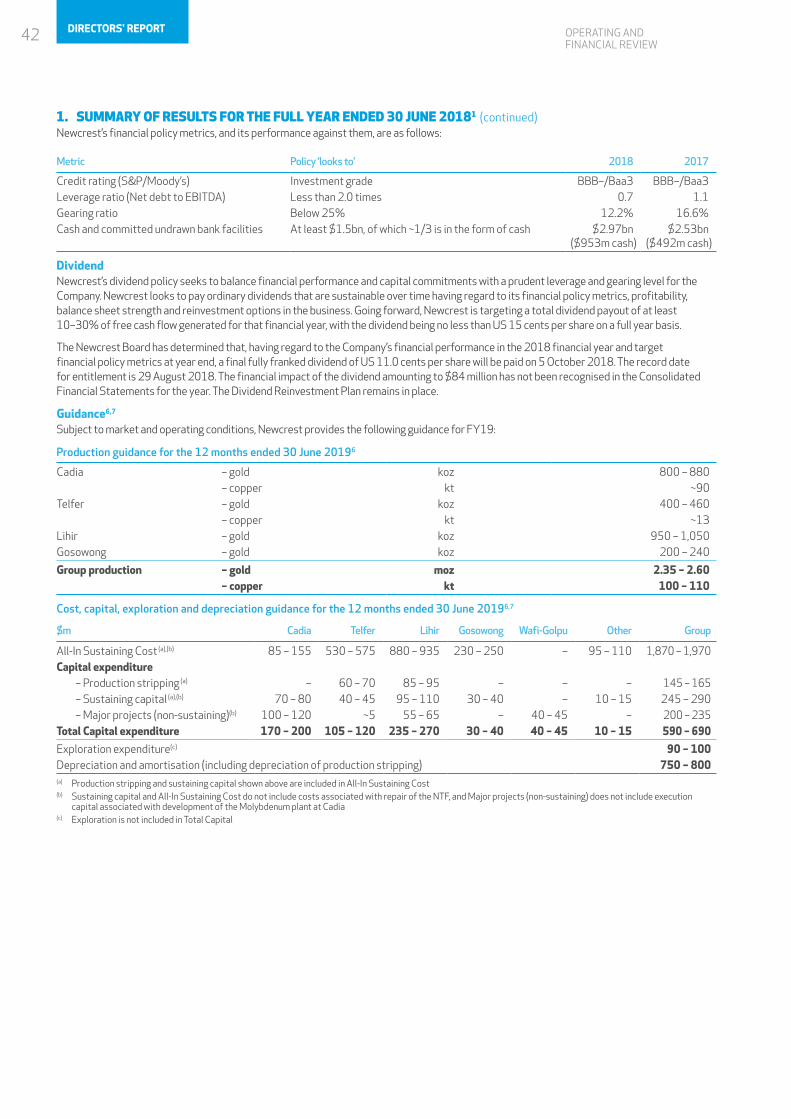
OPERATING AND FINANCIAL REVIEW
1. SUMMARY OF RESULTS FOR THE FULL YEAR ENDED 30 JUNE 20181 (continued)Newcrest’s financial policy metrics, and its performance against them, are as follows:
Metric Policy ‘looks to’ 2018 2017
Credit rating (S&P/Moody’s) Investment grade BBB–/Baa3 BBB–/Baa3Leverage ratio (Net debt to EBITDA) Less than 2.0 times 0.7 1.1Gearing ratio Below 25% 12.2% 16.6%Cash and committed undrawn bank facilities At least $1.5bn, of which ~1/3 is in the form of cash $2.97bn
($953m cash)$2.53bn
($492m cash)
Dividend Newcrest’s dividend policy seeks to balance financial performance and capital commitments with a prudent leverage and gearing level for the Company. Newcrest looks to pay ordinary dividends that are sustainable over time having regard to its financial policy metrics, profitability, balance sheet strength and reinvestment options in the business. Going forward, Newcrest is targeting a total dividend payout of at least 10–30% of free cash flow generated for that financial year, with the dividend being no less than US 15 cents per share on a full year basis.
The Newcrest Board has determined that, having regard to the Company’s financial performance in the 2018 financial year and target financial policy metrics at year end, a final fully franked dividend of US 11.0 cents per share will be paid on 5 October 2018. The record date for entitlement is 29 August 2018. The financial impact of the dividend amounting to $84 million has not been recognised in the Consolidated Financial Statements for the year. The Dividend Reinvestment Plan remains in place.
Guidance6,7 Subject to market and operating conditions, Newcrest provides the following guidance for FY19:
Production guidance for the 12 months ended 30 June 20196
Cadia – gold koz 800 – 880– copper kt ~90
Telfer – gold koz 400 – 460– copper kt ~13
Lihir – gold koz 950 – 1,050Gosowong – gold koz 200 – 240
Group production – gold moz 2.35 – 2.60– copper kt 100 – 110
Cost, capital, exploration and depreciation guidance for the 12 months ended 30 June 20196,7
$m Cadia Telfer Lihir Gosowong Wafi-Golpu Other Group
All-In Sustaining Cost (a),(b) 85 – 155 530 – 575 880 – 935 230 – 250 – 95 – 110 1,870 – 1,970Capital expenditure – Production stripping (a) – 60 – 70 85 – 95 – – – 145 – 165 – Sustaining capital (a),(b) 70 – 80 40 – 45 95 – 110 30 – 40 – 10 – 15 245 – 290 – Major projects (non-sustaining)(b) 100 – 120 ~5 55 – 65 – 40 – 45 – 200 – 235Total Capital expenditure 170 – 200 105 – 120 235 – 270 30 – 40 40 – 45 10 – 15 590 – 690
Exploration expenditure(c) 90 – 100Depreciation and amortisation (including depreciation of production stripping) 750 – 800(a) Production stripping and sustaining capital shown above are included in All-In Sustaining Cost(b) Sustaining capital and All-In Sustaining Cost do not include costs associated with repair of the NTF, and Major projects (non-sustaining) does not include execution
capital associated with development of the Molybdenum plant at Cadia (c) Exploration is not included in Total Capital
42 DIRECTORS' REPORT
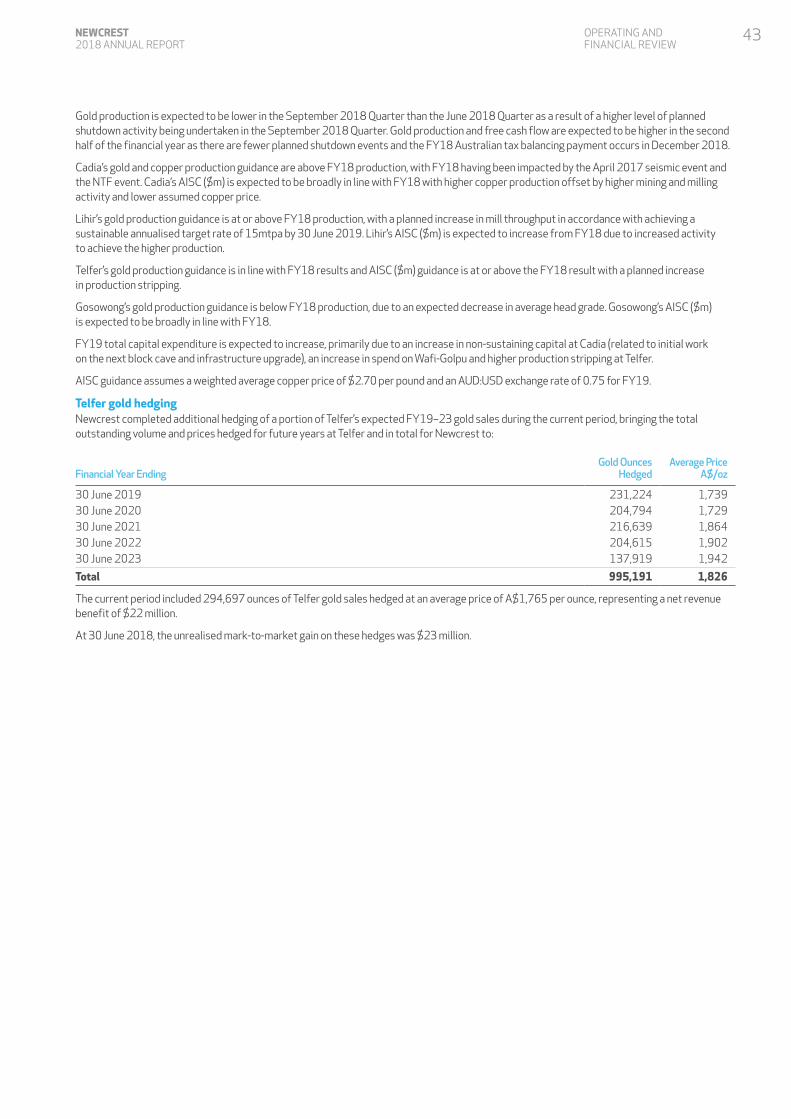
OPERATING AND FINANCIAL REVIEW
Gold production is expected to be lower in the September 2018 Quarter than the June 2018 Quarter as a result of a higher level of planned shutdown activity being undertaken in the September 2018 Quarter. Gold production and free cash flow are expected to be higher in the second half of the financial year as there are fewer planned shutdown events and the FY18 Australian tax balancing payment occurs in December 2018.
Cadia’s gold and copper production guidance are above FY18 production, with FY18 having been impacted by the April 2017 seismic event and the NTF event. Cadia’s AISC ($m) is expected to be broadly in line with FY18 with higher copper production offset by higher mining and milling activity and lower assumed copper price.
Lihir’s gold production guidance is at or above FY18 production, with a planned increase in mill throughput in accordance with achieving a sustainable annualised target rate of 15mtpa by 30 June 2019. Lihir’s AISC ($m) is expected to increase from FY18 due to increased activity to achieve the higher production.
Telfer’s gold production guidance is in line with FY18 results and AISC ($m) guidance is at or above the FY18 result with a planned increase in production stripping.
Gosowong’s gold production guidance is below FY18 production, due to an expected decrease in average head grade. Gosowong’s AISC ($m) is expected to be broadly in line with FY18.
FY19 total capital expenditure is expected to increase, primarily due to an increase in non-sustaining capital at Cadia (related to initial work on the next block cave and infrastructure upgrade), an increase in spend on Wafi-Golpu and higher production stripping at Telfer.
AISC guidance assumes a weighted average copper price of $2.70 per pound and an AUD:USD exchange rate of 0.75 for FY19.
Telfer gold hedgingNewcrest completed additional hedging of a portion of Telfer’s expected FY19–23 gold sales during the current period, bringing the total outstanding volume and prices hedged for future years at Telfer and in total for Newcrest to:
Financial Year EndingGold Ounces
HedgedAverage Price
A$/oz
30 June 2019 231,224 1,73930 June 2020 204,794 1,72930 June 2021 216,639 1,86430 June 2022 204,615 1,90230 June 2023 137,919 1,942
Total 995,191 1,826
The current period included 294,697 ounces of Telfer gold sales hedged at an average price of A$1,765 per ounce, representing a net revenue benefit of $22 million.
At 30 June 2018, the unrealised mark-to-market gain on these hedges was $23 million.
43NEWCREST 2018 ANNUAL REPORT
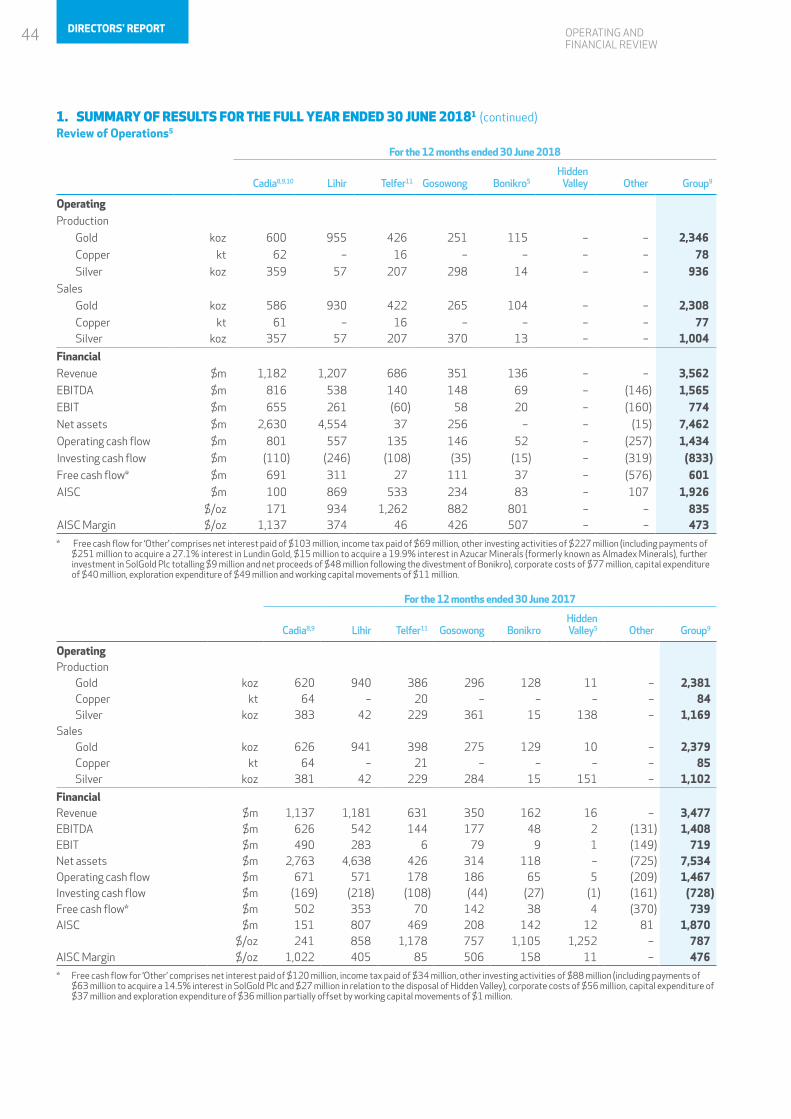
OPERATING AND FINANCIAL REVIEW
1. SUMMARY OF RESULTS FOR THE FULL YEAR ENDED 30 JUNE 20181 (continued)Review of Operations5
For the 12 months ended 30 June 2018
Cadia8,9,10 Lihir Telfer11 Gosowong Bonikro5Hidden
Valley Other Group9
OperatingProduction
Gold koz 600 955 426 251 115 – – 2,346 Copper kt 62 – 16 – – – – 78 Silver koz 359 57 207 298 14 – – 936Sales
Gold koz 586 930 422 265 104 – – 2,308 Copper kt 61 – 16 – – – – 77 Silver koz 357 57 207 370 13 – – 1,004
FinancialRevenue $m 1,182 1,207 686 351 136 – – 3,562EBITDA $m 816 538 140 148 69 – (146) 1,565EBIT $m 655 261 (60) 58 20 – (160) 774Net assets $m 2,630 4,554 37 256 – – (15) 7,462Operating cash flow $m 801 557 135 146 52 – (257) 1,434Investing cash flow $m (110) (246) (108) (35) (15) – (319) (833)Free cash flow* $m 691 311 27 111 37 – (576) 601AISC $m 100 869 533 234 83 – 107 1,926
$/oz 171 934 1,262 882 801 – – 835AISC Margin $/oz 1,137 374 46 426 507 – – 473
* Free cash flow for ‘Other’ comprises net interest paid of $103 million, income tax paid of $69 million, other investing activities of $227 million (including payments of $251 million to acquire a 27.1% interest in Lundin Gold, $15 million to acquire a 19.9% interest in Azucar Minerals (formerly known as Almadex Minerals), further investment in SolGold Plc totalling $9 million and net proceeds of $48 million following the divestment of Bonikro), corporate costs of $77 million, capital expenditure of $40 million, exploration expenditure of $49 million and working capital movements of $11 million.
For the 12 months ended 30 June 2017
Cadia8,9 Lihir Telfer11 Gosowong BonikroHidden Valley5 Other Group9
OperatingProduction Gold koz 620 940 386 296 128 11 – 2,381 Copper kt 64 – 20 – – – – 84 Silver koz 383 42 229 361 15 138 – 1,169Sales Gold koz 626 941 398 275 129 10 – 2,379 Copper kt 64 – 21 – – – – 85 Silver koz 381 42 229 284 15 151 – 1,102
FinancialRevenue $m 1,137 1,181 631 350 162 16 – 3,477EBITDA $m 626 542 144 177 48 2 (131) 1,408EBIT $m 490 283 6 79 9 1 (149) 719Net assets $m 2,763 4,638 426 314 118 – (725) 7,534Operating cash flow $m 671 571 178 186 65 5 (209) 1,467Investing cash flow $m (169) (218) (108) (44) (27) (1) (161) (728)Free cash flow* $m 502 353 70 142 38 4 (370) 739AISC $m 151 807 469 208 142 12 81 1,870
$/oz 241 858 1,178 757 1,105 1,252 – 787AISC Margin $/oz 1,022 405 85 506 158 11 – 476
* Free cash flow for ‘Other’ comprises net interest paid of $120 million, income tax paid of $34 million, other investing activities of $88 million (including payments of $63 million to acquire a 14.5% interest in SolGold Plc and $27 million in relation to the disposal of Hidden Valley), corporate costs of $56 million, capital expenditure of $37 million and exploration expenditure of $36 million partially offset by working capital movements of $1 million.
44 DIRECTORS' REPORT
OPERATING AND FINANCIAL REVIEW
1. All figures in this Report relate to businesses of the Newcrest Mining Limited Group (‘Newcrest’ or ‘the Group’) for the 12 months ended 30 June 2018 (‘current period’) compared with the 12 months ended 30 June 2017 (‘prior period’), except where otherwise stated. All references to ‘the Company’ are to Newcrest Mining Limited.
2. ‘Statutory profit’ is profit after tax attributable to owners of the Company.3. Newcrest’s results are reported under International Financial Reporting Standards (“IFRS”). This report also includes certain non-IFRS financial information,
including the following: • ‘Underlying profit’ is profit or loss after tax before significant items attributable to owners of the Company.• ‘EBITDA’ is earnings before interest, tax, depreciation and amortisation, and significant items. ‘EBIT’ is earnings before interest, tax and significant items.• ‘EBITDA Margin’ is EBITDA expressed as a percentage of revenue. ‘EBIT Margin’ is EBIT expressed as a percentage of revenue.• ‘ROCE’ is ‘Return on capital employed’ and is calculated as EBIT expressed as a percentage of average total capital employed (net debt and total equity).• ‘Interest coverage ratio’ is calculated as EBITDA adjusted for facility fees and discount unwind on provisions, divided by net interest payable (interest expense
adjusted for facility fees, discount unwind on provisions and interest capitalised).• ‘AISC’ is All-In Sustaining Cost and ‘AIC’ is All-In Cost as per World Gold Council Guidance Note on Non-GAAP Metrics released June 2013. AISC will vary from
period to period as a result of various factors including production performance, timing of sales and the level of sustaining capital and the relative contribution of each asset. AISC Margin reflects the average realised gold price less the AISC per ounce sold.
• ‘Net debt to EBITDA’ is calculated as net debt divided by EBITDA for the preceding 12 months. • ‘Free cash flow’ is calculated as cash flow from operating activities less cash flow related to investing activities. Free cash flow for each operating site is calculated
as Free cash flow before interest and tax.• Underlying profit, EBIT, EBITDA, EBITDA Margin, EBIT Margin, Free cash flow, All-In Sustaining Cost, All-In Sustaining Cost Margin, All-In Cost, Sustaining capital
and Major projects (non-sustaining) capital, ROCE and Interest coverage ratio are non-IFRS financial measures which Newcrest employs in managing the business.They are used by Management to assess the performance of the business and make decisions on the allocation of resources and have been included in this report to provide greater understanding of the underlying financial performance of Newcrest’s operations. When reviewing business performance this non-IFRS information should be used in addition to, and not as a replacement of, measures prepared in accordance with IFRS.
These measures have not been subject to audit or review by Newcrest’s external auditor. These measures do not have any standard definition under IFRS and may be calculated differently by other companies. Refer to section 6 for a reconciliation of non-IFRS measures to the most appropriate IFRS measure.
4. Comprises undrawn bilateral bank debt facilities of $2,000 million and an additional undrawn $20 million bank loan facility of a subsidiary.5. All data relating to operations is shown at 100%, apart from Hidden Valley which is shown at Newcrest’s ownership percentage of 50% up to the economic effective
disposal date of 31 August 2016. Newcrest owns 75% of Gosowong through its holding in PT Nusa Halmahera Minerals, an incorporated joint venture. For Bonikro the figures shown represent 100% up to the divestment date of 28 March 2018. Bonikro includes mining and near-mine exploration interests in Côte d’Ivoire held by LGL Mines CI SA and Newcrest Hire CI SA (of which Newcrest owned 89.89% respectively up to the divestment date).
6. Disclaimer: These materials include forward looking statements. Forward looking statements can generally be identified by the use of words such as “may”, “will”, “expect”, “intend”, “plan”, “estimate”, “anticipate”, “continue”, “outlook” and “guidance”, or other similar words and may include, without limitation, statements regarding plans, strategies and objectives of management, anticipated production or construction commencement dates and expected costs or production outputs. The Company continues to distinguish between outlook and guidance. Guidance statements relate to the current financial year. Outlook statements relate to years subsequent to the current financial year.
Forward looking statements inherently involve known and unknown risks, uncertainties and other factors that may cause the Company’s actual results, performance and achievements to differ materially from statements in these materials. Relevant factors may include, but are not limited to, changes in commodity prices, foreign exchange fluctuations and general economic conditions, increased costs and demand for production inputs, the speculative nature of exploration and project development, including the risks of obtaining necessary licences and permits and diminishing quantities or grades of reserves, political and social risks, changes to the regulatory framework within which the Company operates or may in the future operate, environmental conditions including extreme weather conditions, recruitment and retention of personnel, industrial relations issues and litigation.
Forward looking statements are based on the Company’s good faith assumptions as to the financial, market, regulatory and other relevant environments that will exist and affect the Company’s business and operations in the future. The Company does not give any assurance that the assumptions will prove to be correct. There may be other factors that could cause actual results or events not to be as anticipated, and many events are beyond the reasonable control of the Company. Readers are cautioned not to place undue reliance on forward looking statements. Forward looking statements in these materials speak only at the date of issue. Except as required by applicable laws or regulations, the Company does not undertake any obligation to publicly update or revise any of the forward looking statements or to advise of any change in assumptions on which any such statement is based.
7. The guidance stated assumes weighted average copper price of $2.70 per pound and AUD:USD exchange rate of 0.75 for FY19. 8. In the prior period, Cadia includes development production from the Cadia East project of 1,345 gold ounces and 157 tonnes of copper. Expenditure associated with
this production and revenue from the sales are capitalised and not included in the operating profit calculations. There was no further capitalisation of production following the completion of development activities at Cadia East in the prior period.
9. In the current period, Cadia’s and the Group’s AISC include a $42 and $11 per ounce normalisation (i.e. reduction) respectively, related to the Cadia seismic event. In the prior period, Cadia’s and the Group’s AISC include a $110 and $28 per ounce normalisation (i.e. reduction) respectively, related to the Cadia seismic event.
10. Cadia’s EBITDA, EBIT and free cash flow include $155 million (before tax) of insurance proceeds related to the seismic event.11. The net assets for Telfer for the prior period have been restated to exclude a deferred tax asset of $84 million to align with the current year presentation. This asset
is now presented in Other as it will be primarily realised by other members of the Australian tax consolidated group.
45NEWCREST 2018 ANNUAL REPORT
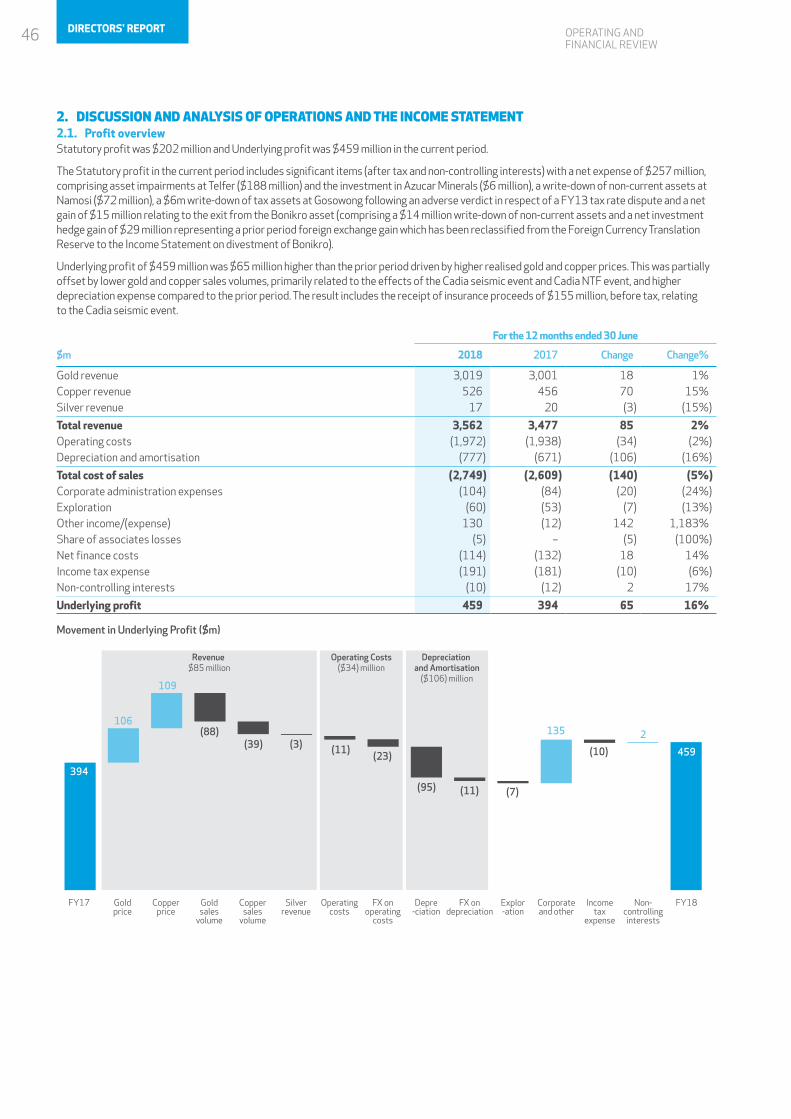
OPERATING AND FINANCIAL REVIEW
2. DISCUSSION AND ANALYSIS OF OPERATIONS AND THE INCOME STATEMENT2.1. Profit overviewStatutory profit was $202 million and Underlying profit was $459 million in the current period.
The Statutory profit in the current period includes significant items (after tax and non-controlling interests) with a net expense of $257 million, comprising asset impairments at Telfer ($188 million) and the investment in Azucar Minerals ($6 million), a write-down of non-current assets at Namosi ($72 million), a $6m write-down of tax assets at Gosowong following an adverse verdict in respect of a FY13 tax rate dispute and a net gain of $15 million relating to the exit from the Bonikro asset (comprising a $14 million write-down of non-current assets and a net investment hedge gain of $29 million representing a prior period foreign exchange gain which has been reclassified from the Foreign Currency Translation Reserve to the Income Statement on divestment of Bonikro).
Underlying profit of $459 million was $65 million higher than the prior period driven by higher realised gold and copper prices. This was partially offset by lower gold and copper sales volumes, primarily related to the effects of the Cadia seismic event and Cadia NTF event, and higher depreciation expense compared to the prior period. The result includes the receipt of insurance proceeds of $155 million, before tax, relating to the Cadia seismic event.
For the 12 months ended 30 June
$m 2018 2017 Change Change%
Gold revenue 3,019 3,001 18 1%Copper revenue 526 456 70 15%Silver revenue 17 20 (3) (15%)
Total revenue 3,562 3,477 85 2%Operating costs (1,972) (1,938) (34) (2%)Depreciation and amortisation (777) (671) (106) (16%)
Total cost of sales (2,749) (2,609) (140) (5%)Corporate administration expenses (104) (84) (20) (24%)Exploration (60) (53) (7) (13%)Other income/(expense) 130 (12) 142 1,183%Share of associates losses (5) – (5) (100%)Net finance costs (114) (132) 18 14%Income tax expense (191) (181) (10) (6%)Non-controlling interests (10) (12) 2 17%
Underlying profit 459 394 65 16%
Movement in Underlying Profit ($m)
FY17 Goldprice
Copperprice
Goldsales
volume
Coppersales
volume
Silverrevenue
Operatingcosts
FX onoperating
costs
Depre-ciation
FX ondepreciation
Explor-ation
Corporateand other
Incometax
expense
Non-controlling
interests
FY180
65130195260325390455520585650
Revenue $85 million
Operating Costs($34) million
Depreciation and Amortisation
($106) million
394
459
106
109
(39) (11)
(88)(3)
(23)
(95) (11) (7)
135
(10)
2
46 DIRECTORS' REPORT
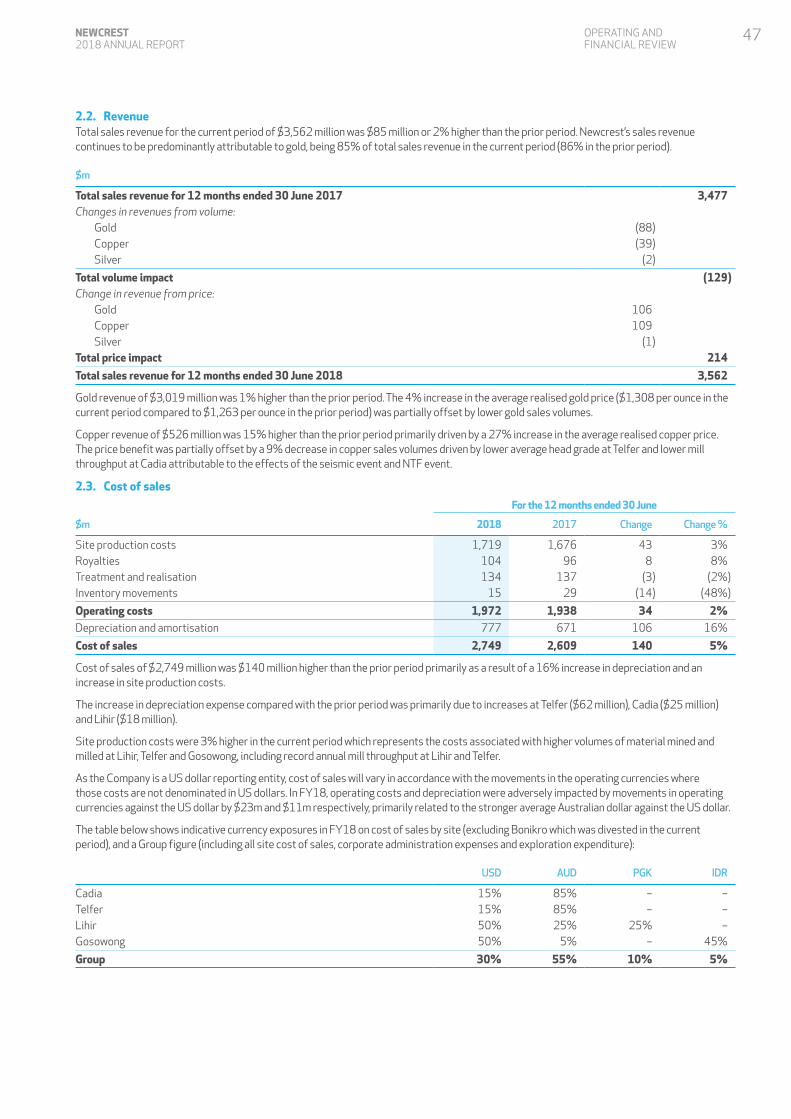
OPERATING AND FINANCIAL REVIEW
2.2. RevenueTotal sales revenue for the current period of $3,562 million was $85 million or 2% higher than the prior period. Newcrest’s sales revenue continues to be predominantly attributable to gold, being 85% of total sales revenue in the current period (86% in the prior period).
$m
Total sales revenue for 12 months ended 30 June 2017 3,477Changes in revenues from volume: Gold (88) Copper (39) Silver (2)
Total volume impact (129)Change in revenue from price: Gold 106 Copper 109 Silver (1)Total price impact 214
Total sales revenue for 12 months ended 30 June 2018 3,562
Gold revenue of $3,019 million was 1% higher than the prior period. The 4% increase in the average realised gold price ($1,308 per ounce in the current period compared to $1,263 per ounce in the prior period) was partially offset by lower gold sales volumes.
Copper revenue of $526 million was 15% higher than the prior period primarily driven by a 27% increase in the average realised copper price. The price benefit was partially offset by a 9% decrease in copper sales volumes driven by lower average head grade at Telfer and lower mill throughput at Cadia attributable to the effects of the seismic event and NTF event.
2.3. Cost of salesFor the 12 months ended 30 June
$m 2018 2017 Change Change %
Site production costs 1,719 1,676 43 3%Royalties 104 96 8 8%Treatment and realisation 134 137 (3) (2%)Inventory movements 15 29 (14) (48%)
Operating costs 1,972 1,938 34 2%Depreciation and amortisation 777 671 106 16%
Cost of sales 2,749 2,609 140 5%
Cost of sales of $2,749 million was $140 million higher than the prior period primarily as a result of a 16% increase in depreciation and an increase in site production costs.
The increase in depreciation expense compared with the prior period was primarily due to increases at Telfer ($62 million), Cadia ($25 million) and Lihir ($18 million).
Site production costs were 3% higher in the current period which represents the costs associated with higher volumes of material mined and milled at Lihir, Telfer and Gosowong, including record annual mill throughput at Lihir and Telfer.
As the Company is a US dollar reporting entity, cost of sales will vary in accordance with the movements in the operating currencies where those costs are not denominated in US dollars. In FY18, operating costs and depreciation were adversely impacted by movements in operating currencies against the US dollar by $23m and $11m respectively, primarily related to the stronger average Australian dollar against the US dollar.
The table below shows indicative currency exposures in FY18 on cost of sales by site (excluding Bonikro which was divested in the current period), and a Group figure (including all site cost of sales, corporate administration expenses and exploration expenditure):
USD AUD PGK IDR
Cadia 15% 85% – –Telfer 15% 85% – –Lihir 50% 25% 25% –Gosowong 50% 5% – 45%
Group 30% 55% 10% 5%
47NEWCREST 2018 ANNUAL REPORT
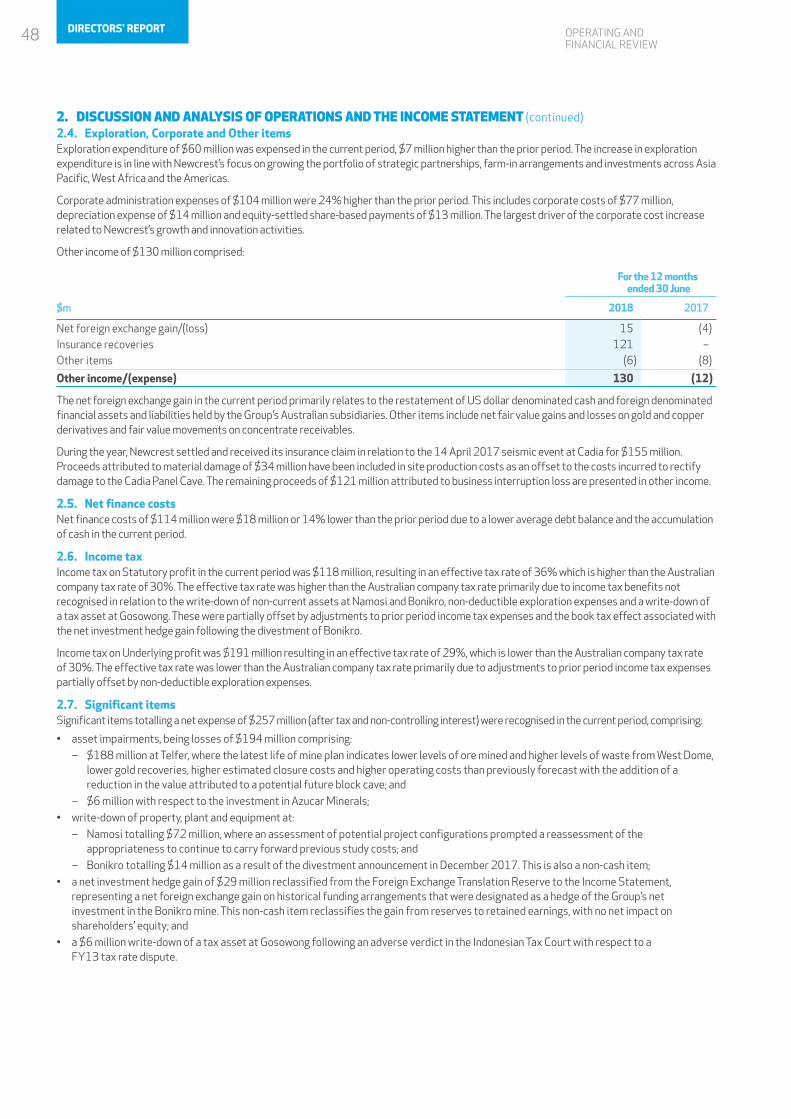
OPERATING AND FINANCIAL REVIEW
2. DISCUSSION AND ANALYSIS OF OPERATIONS AND THE INCOME STATEMENT (continued)2.4. Exploration, Corporate and Other itemsExploration expenditure of $60 million was expensed in the current period, $7 million higher than the prior period. The increase in exploration expenditure is in line with Newcrest’s focus on growing the portfolio of strategic partnerships, farm-in arrangements and investments across Asia Pacific, West Africa and the Americas.
Corporate administration expenses of $104 million were 24% higher than the prior period. This includes corporate costs of $77 million, depreciation expense of $14 million and equity-settled share-based payments of $13 million. The largest driver of the corporate cost increase related to Newcrest’s growth and innovation activities.
Other income of $130 million comprised:
For the 12 months ended 30 June
$m 2018 2017
Net foreign exchange gain/(loss) 15 (4)Insurance recoveries 121 –Other items (6) (8)
Other income/(expense) 130 (12)
The net foreign exchange gain in the current period primarily relates to the restatement of US dollar denominated cash and foreign denominated financial assets and liabilities held by the Group’s Australian subsidiaries. Other items include net fair value gains and losses on gold and copper derivatives and fair value movements on concentrate receivables.
During the year, Newcrest settled and received its insurance claim in relation to the 14 April 2017 seismic event at Cadia for $155 million. Proceeds attributed to material damage of $34 million have been included in site production costs as an offset to the costs incurred to rectify damage to the Cadia Panel Cave. The remaining proceeds of $121 million attributed to business interruption loss are presented in other income.
2.5. Net finance costsNet finance costs of $114 million were $18 million or 14% lower than the prior period due to a lower average debt balance and the accumulation of cash in the current period.
2.6. Income taxIncome tax on Statutory profit in the current period was $118 million, resulting in an effective tax rate of 36% which is higher than the Australian company tax rate of 30%. The effective tax rate was higher than the Australian company tax rate primarily due to income tax benefits not recognised in relation to the write-down of non-current assets at Namosi and Bonikro, non-deductible exploration expenses and a write-down of a tax asset at Gosowong. These were partially offset by adjustments to prior period income tax expenses and the book tax effect associated with the net investment hedge gain following the divestment of Bonikro.
Income tax on Underlying profit was $191 million resulting in an effective tax rate of 29%, which is lower than the Australian company tax rate of 30%. The effective tax rate was lower than the Australian company tax rate primarily due to adjustments to prior period income tax expenses partially offset by non-deductible exploration expenses.
2.7. Significant itemsSignificant items totalling a net expense of $257 million (after tax and non-controlling interest) were recognised in the current period, comprising:
• asset impairments, being losses of $194 million comprising: ‒ $188 million at Telfer, where the latest life of mine plan indicates lower levels of ore mined and higher levels of waste from West Dome,
lower gold recoveries, higher estimated closure costs and higher operating costs than previously forecast with the addition of a reduction in the value attributed to a potential future block cave; and
‒ $6 million with respect to the investment in Azucar Minerals;• write-down of property, plant and equipment at:
‒ Namosi totalling $72 million, where an assessment of potential project configurations prompted a reassessment of the appropriateness to continue to carry forward previous study costs; and
‒ Bonikro totalling $14 million as a result of the divestment announcement in December 2017. This is also a non-cash item; • a net investment hedge gain of $29 million reclassified from the Foreign Exchange Translation Reserve to the Income Statement,
representing a net foreign exchange gain on historical funding arrangements that were designated as a hedge of the Group’s net investment in the Bonikro mine. This non-cash item reclassifies the gain from reserves to retained earnings, with no net impact on shareholders’ equity; and
• a $6 million write-down of a tax asset at Gosowong following an adverse verdict in the Indonesian Tax Court with respect to a FY13 tax rate dispute.
48 DIRECTORS' REPORT
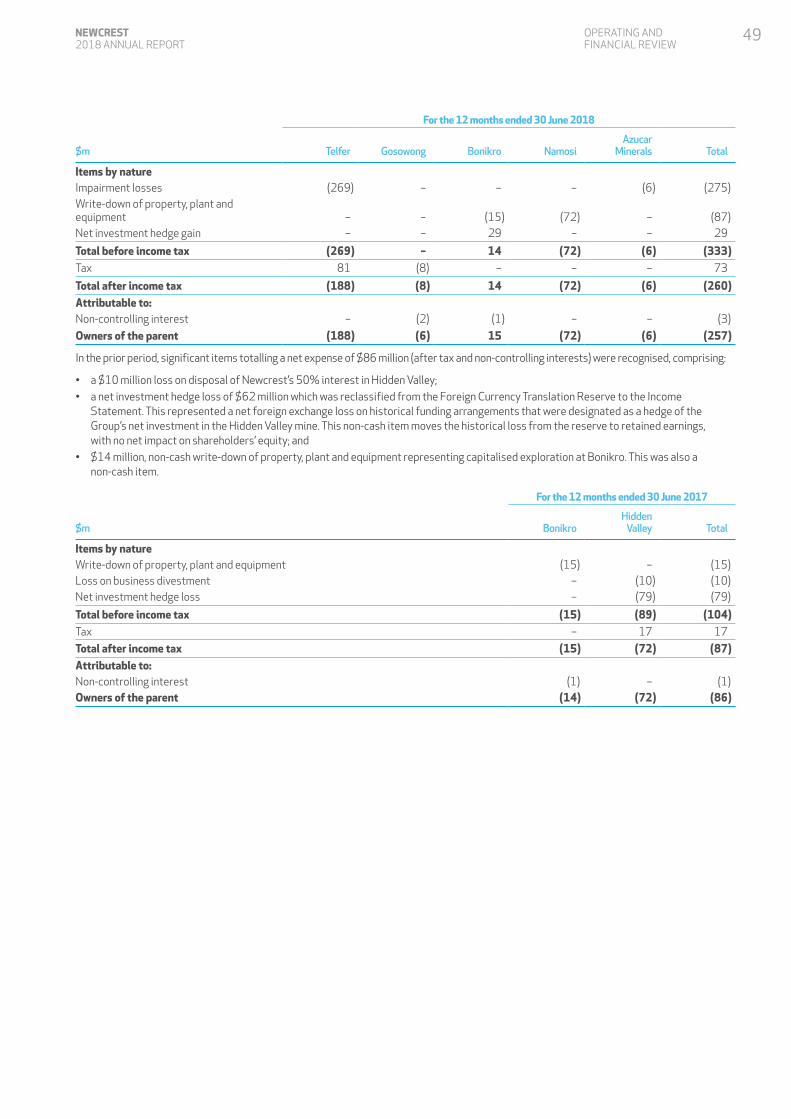
OPERATING AND FINANCIAL REVIEW
For the 12 months ended 30 June 2018
$m Telfer Gosowong Bonikro NamosiAzucar
Minerals Total
Items by natureImpairment losses (269) – – – (6) (275)Write-down of property, plant and equipment – – (15) (72) – (87)Net investment hedge gain – – 29 – – 29
Total before income tax (269) – 14 (72) (6) (333)Tax 81 (8) – – – 73
Total after income tax (188) (8) 14 (72) (6) (260)Attributable to:Non-controlling interest – (2) (1) – – (3)
Owners of the parent (188) (6) 15 (72) (6) (257)
In the prior period, significant items totalling a net expense of $86 million (after tax and non-controlling interests) were recognised, comprising:
• a $10 million loss on disposal of Newcrest’s 50% interest in Hidden Valley;• a net investment hedge loss of $62 million which was reclassified from the Foreign Currency Translation Reserve to the Income
Statement. This represented a net foreign exchange loss on historical funding arrangements that were designated as a hedge of the Group’s net investment in the Hidden Valley mine. This non-cash item moves the historical loss from the reserve to retained earnings, with no net impact on shareholders’ equity; and
• $14 million, non-cash write-down of property, plant and equipment representing capitalised exploration at Bonikro. This was also a non-cash item.
For the 12 months ended 30 June 2017
$m BonikroHidden
Valley Total
Items by natureWrite-down of property, plant and equipment (15) – (15)Loss on business divestment – (10) (10)Net investment hedge loss – (79) (79)
Total before income tax (15) (89) (104)Tax – 17 17
Total after income tax (15) (72) (87)Attributable to:Non-controlling interest (1) – (1)Owners of the parent (14) (72) (86)
49NEWCREST 2018 ANNUAL REPORT
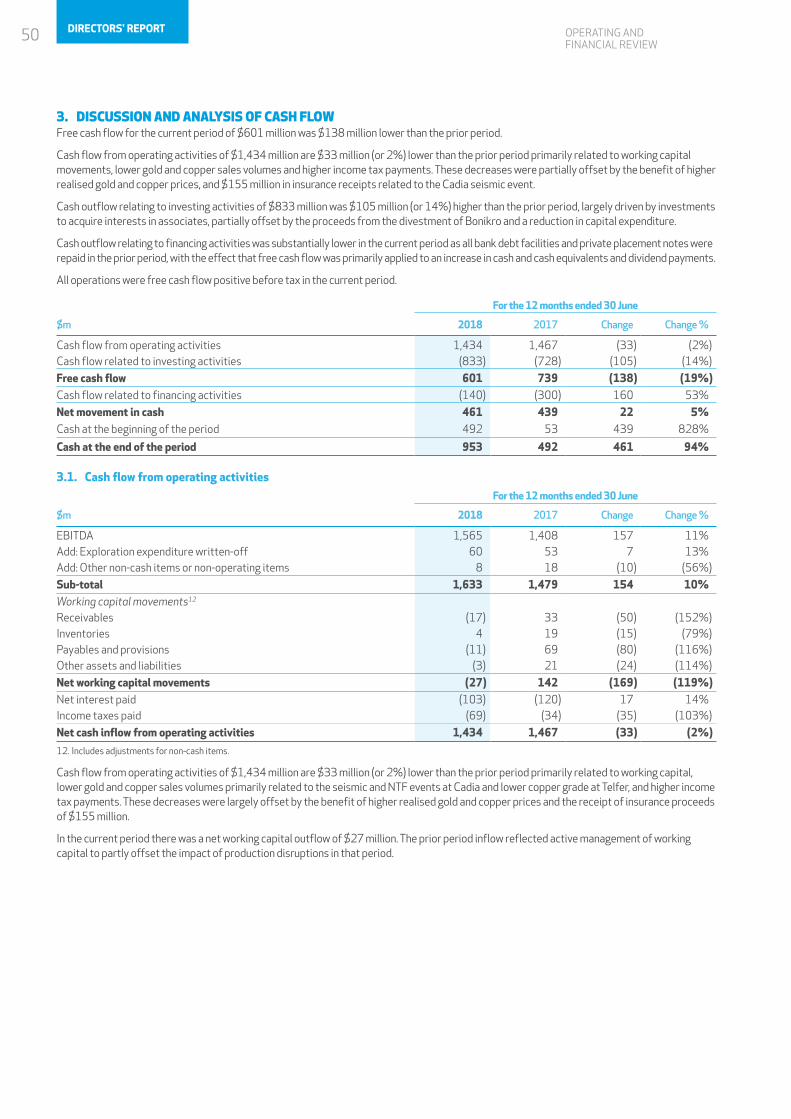
OPERATING AND FINANCIAL REVIEW
3. DISCUSSION AND ANALYSIS OF CASH FLOWFree cash flow for the current period of $601 million was $138 million lower than the prior period.
Cash flow from operating activities of $1,434 million are $33 million (or 2%) lower than the prior period primarily related to working capital movements, lower gold and copper sales volumes and higher income tax payments. These decreases were partially offset by the benefit of higher realised gold and copper prices, and $155 million in insurance receipts related to the Cadia seismic event.
Cash outflow relating to investing activities of $833 million was $105 million (or 14%) higher than the prior period, largely driven by investments to acquire interests in associates, partially offset by the proceeds from the divestment of Bonikro and a reduction in capital expenditure.
Cash outflow relating to financing activities was substantially lower in the current period as all bank debt facilities and private placement notes were repaid in the prior period, with the effect that free cash flow was primarily applied to an increase in cash and cash equivalents and dividend payments.
All operations were free cash flow positive before tax in the current period.
For the 12 months ended 30 June
$m 2018 2017 Change Change %
Cash flow from operating activities 1,434 1,467 (33) (2%)Cash flow related to investing activities (833) (728) (105) (14%)
Free cash flow 601 739 (138) (19%)Cash flow related to financing activities (140) (300) 160 53%
Net movement in cash 461 439 22 5%Cash at the beginning of the period 492 53 439 828%
Cash at the end of the period 953 492 461 94%
3.1. Cash flow from operating activitiesFor the 12 months ended 30 June
$m 2018 2017 Change Change %
EBITDA 1,565 1,408 157 11%Add: Exploration expenditure written-off 60 53 7 13%Add: Other non-cash items or non-operating items 8 18 (10) (56%)
Sub-total 1,633 1,479 154 10%Working capital movements12
Receivables (17) 33 (50) (152%)Inventories 4 19 (15) (79%)Payables and provisions (11) 69 (80) (116%)Other assets and liabilities (3) 21 (24) (114%)
Net working capital movements (27) 142 (169) (119%)Net interest paid (103) (120) 17 14%Income taxes paid (69) (34) (35) (103%)
Net cash inflow from operating activities 1,434 1,467 (33) (2%)
12. Includes adjustments for non-cash items.
Cash flow from operating activities of $1,434 million are $33 million (or 2%) lower than the prior period primarily related to working capital, lower gold and copper sales volumes primarily related to the seismic and NTF events at Cadia and lower copper grade at Telfer, and higher income tax payments. These decreases were largely offset by the benefit of higher realised gold and copper prices and the receipt of insurance proceeds of $155 million.
In the current period there was a net working capital outflow of $27 million. The prior period inflow reflected active management of working capital to partly offset the impact of production disruptions in that period.
50 DIRECTORS' REPORT
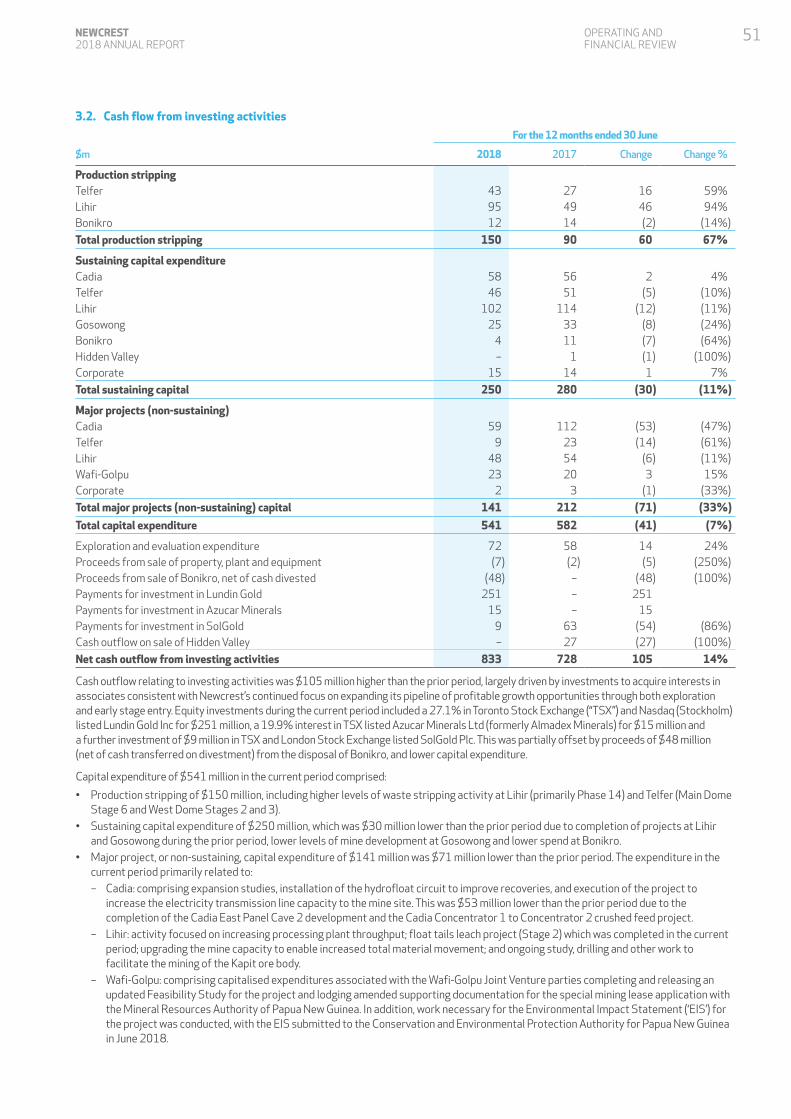
OPERATING AND FINANCIAL REVIEW
3.2. Cash flow from investing activities For the 12 months ended 30 June
$m 2018 2017 Change Change %
Production strippingTelfer 43 27 16 59%Lihir 95 49 46 94%Bonikro 12 14 (2) (14%)
Total production stripping 150 90 60 67%
Sustaining capital expenditureCadia 58 56 2 4%Telfer 46 51 (5) (10%)Lihir 102 114 (12) (11%)Gosowong 25 33 (8) (24%)Bonikro 4 11 (7) (64%)Hidden Valley – 1 (1) (100%)Corporate 15 14 1 7%
Total sustaining capital 250 280 (30) (11%)
Major projects (non-sustaining) Cadia 59 112 (53) (47%)Telfer 9 23 (14) (61%)Lihir 48 54 (6) (11%)Wafi-Golpu 23 20 3 15%Corporate 2 3 (1) (33%)
Total major projects (non-sustaining) capital 141 212 (71) (33%)
Total capital expenditure 541 582 (41) (7%)
Exploration and evaluation expenditure 72 58 14 24%Proceeds from sale of property, plant and equipment (7) (2) (5) (250%)Proceeds from sale of Bonikro, net of cash divested (48) – (48) (100%)Payments for investment in Lundin Gold 251 – 251Payments for investment in Azucar Minerals 15 – 15Payments for investment in SolGold 9 63 (54) (86%)Cash outflow on sale of Hidden Valley – 27 (27) (100%)
Net cash outflow from investing activities 833 728 105 14%
Cash outflow relating to investing activities was $105 million higher than the prior period, largely driven by investments to acquire interests in associates consistent with Newcrest’s continued focus on expanding its pipeline of profitable growth opportunities through both exploration and early stage entry. Equity investments during the current period included a 27.1% in Toronto Stock Exchange (“TSX”) and Nasdaq (Stockholm) listed Lundin Gold Inc for $251 million, a 19.9% interest in TSX listed Azucar Minerals Ltd (formerly Almadex Minerals) for $15 million and a further investment of $9 million in TSX and London Stock Exchange listed SolGold Plc. This was partially offset by proceeds of $48 million (net of cash transferred on divestment) from the disposal of Bonikro, and lower capital expenditure.
Capital expenditure of $541 million in the current period comprised:
• Production stripping of $150 million, including higher levels of waste stripping activity at Lihir (primarily Phase 14) and Telfer (Main Dome Stage 6 and West Dome Stages 2 and 3).
• Sustaining capital expenditure of $250 million, which was $30 million lower than the prior period due to completion of projects at Lihir and Gosowong during the prior period, lower levels of mine development at Gosowong and lower spend at Bonikro.
• Major project, or non-sustaining, capital expenditure of $141 million was $71 million lower than the prior period. The expenditure in the current period primarily related to:
– Cadia: comprising expansion studies, installation of the hydrofloat circuit to improve recoveries, and execution of the project to increase the electricity transmission line capacity to the mine site. This was $53 million lower than the prior period due to the completion of the Cadia East Panel Cave 2 development and the Cadia Concentrator 1 to Concentrator 2 crushed feed project.
– Lihir: activity focused on increasing processing plant throughput; float tails leach project (Stage 2) which was completed in the current period; upgrading the mine capacity to enable increased total material movement; and ongoing study, drilling and other work to facilitate the mining of the Kapit ore body.
– Wafi-Golpu: comprising capitalised expenditures associated with the Wafi-Golpu Joint Venture parties completing and releasing an updated Feasibility Study for the project and lodging amended supporting documentation for the special mining lease application with the Mineral Resources Authority of Papua New Guinea. In addition, work necessary for the Environmental Impact Statement (‘EIS’) for the project was conducted, with the EIS submitted to the Conservation and Environmental Protection Authority for Papua New Guinea in June 2018.
51NEWCREST 2018 ANNUAL REPORT
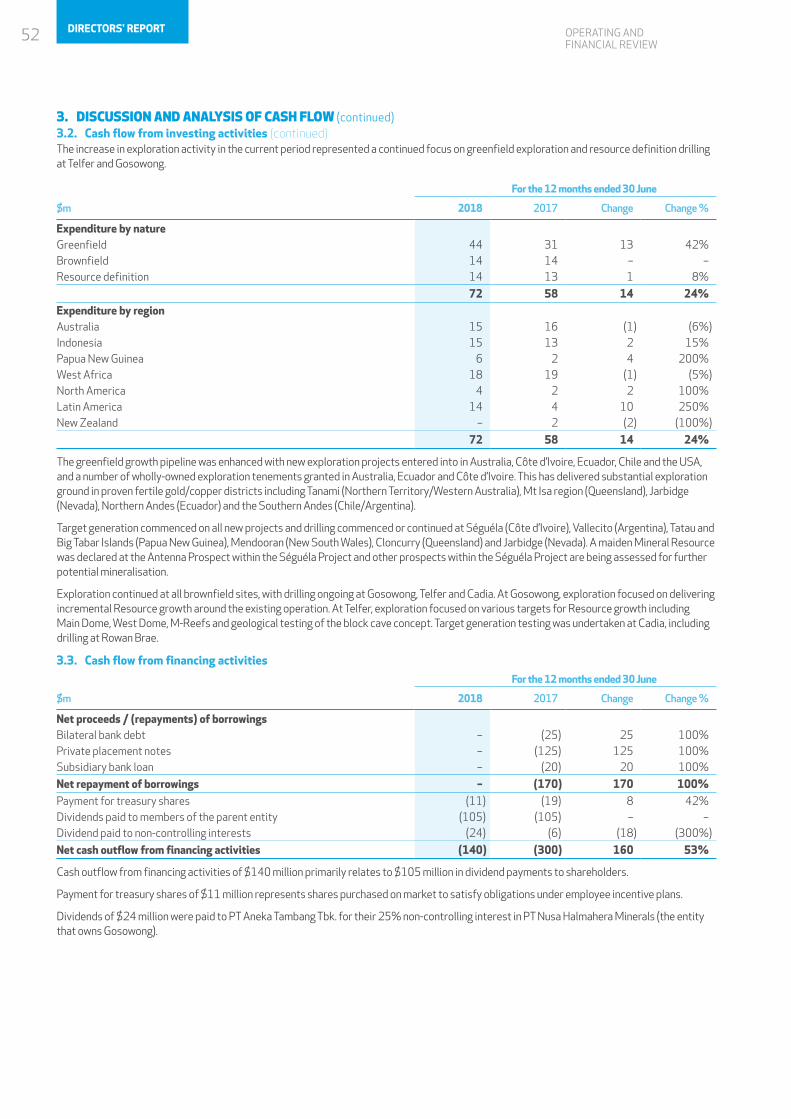
OPERATING AND FINANCIAL REVIEW
3. DISCUSSION AND ANALYSIS OF CASH FLOW (continued)3.2. Cash flow from investing activities (continued)The increase in exploration activity in the current period represented a continued focus on greenfield exploration and resource definition drilling at Telfer and Gosowong.
For the 12 months ended 30 June
$m 2018 2017 Change Change %
Expenditure by nature Greenfield 44 31 13 42%Brownfield 14 14 – –Resource definition 14 13 1 8%
72 58 14 24%Expenditure by region Australia 15 16 (1) (6%)Indonesia 15 13 2 15%Papua New Guinea 6 2 4 200%West Africa 18 19 (1) (5%)North America 4 2 2 100%Latin America 14 4 10 250%New Zealand – 2 (2) (100%)
72 58 14 24%
The greenfield growth pipeline was enhanced with new exploration projects entered into in Australia, Côte d’Ivoire, Ecuador, Chile and the USA, and a number of wholly-owned exploration tenements granted in Australia, Ecuador and Côte d’Ivoire. This has delivered substantial exploration ground in proven fertile gold/copper districts including Tanami (Northern Territory/Western Australia), Mt Isa region (Queensland), Jarbidge (Nevada), Northern Andes (Ecuador) and the Southern Andes (Chile/Argentina).
Target generation commenced on all new projects and drilling commenced or continued at Séguéla (Côte d’Ivoire), Vallecito (Argentina), Tatau and Big Tabar Islands (Papua New Guinea), Mendooran (New South Wales), Cloncurry (Queensland) and Jarbidge (Nevada). A maiden Mineral Resource was declared at the Antenna Prospect within the Séguéla Project and other prospects within the Séguéla Project are being assessed for further potential mineralisation.
Exploration continued at all brownfield sites, with drilling ongoing at Gosowong, Telfer and Cadia. At Gosowong, exploration focused on delivering incremental Resource growth around the existing operation. At Telfer, exploration focused on various targets for Resource growth including Main Dome, West Dome, M-Reefs and geological testing of the block cave concept. Target generation testing was undertaken at Cadia, including drilling at Rowan Brae.
3.3. Cash flow from financing activities For the 12 months ended 30 June
$m 2018 2017 Change Change %
Net proceeds / (repayments) of borrowingsBilateral bank debt – (25) 25 100%Private placement notes – (125) 125 100%Subsidiary bank loan – (20) 20 100%
Net repayment of borrowings – (170) 170 100%Payment for treasury shares (11) (19) 8 42%Dividends paid to members of the parent entity (105) (105) – –Dividend paid to non-controlling interests (24) (6) (18) (300%)
Net cash outflow from financing activities (140) (300) 160 53%
Cash outflow from financing activities of $140 million primarily relates to $105 million in dividend payments to shareholders.
Payment for treasury shares of $11 million represents shares purchased on market to satisfy obligations under employee incentive plans.
Dividends of $24 million were paid to PT Aneka Tambang Tbk. for their 25% non-controlling interest in PT Nusa Halmahera Minerals (the entity that owns Gosowong).
52 DIRECTORS' REPORT
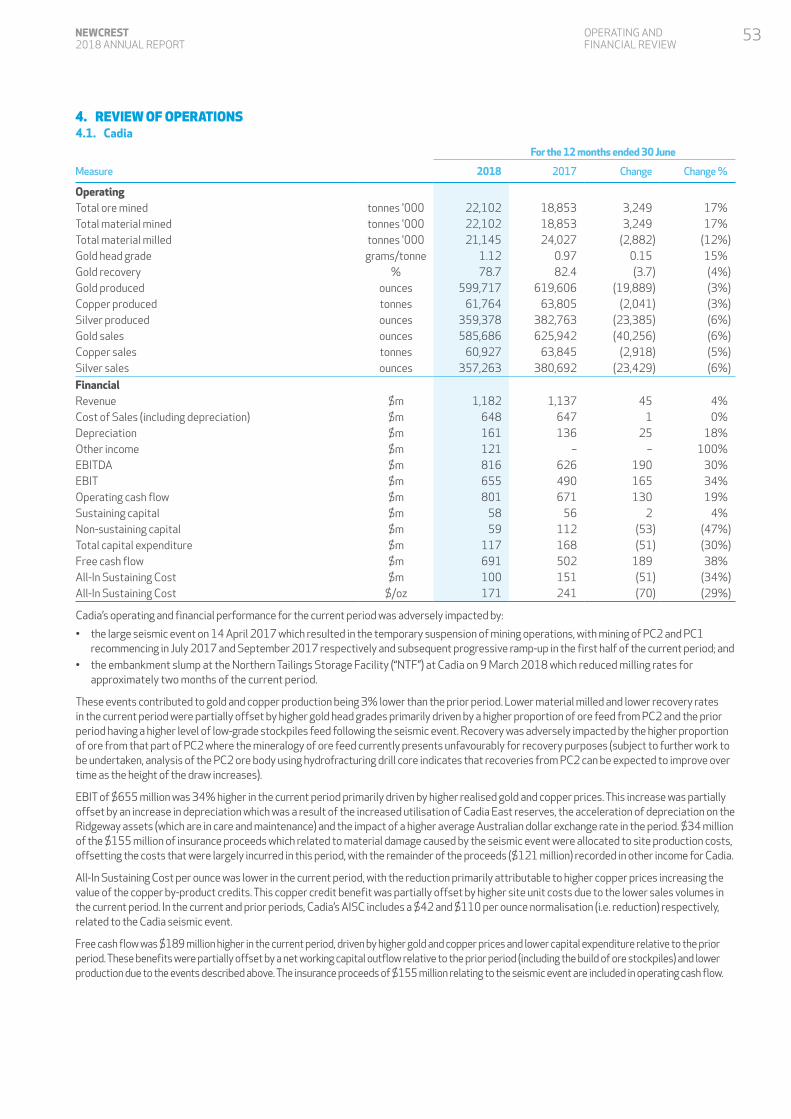
OPERATING AND FINANCIAL REVIEW
4. REVIEW OF OPERATIONS4.1. Cadia
For the 12 months ended 30 June
Measure 2018 2017 Change Change %
OperatingTotal ore mined tonnes '000 22,102 18,853 3,249 17%Total material mined tonnes '000 22,102 18,853 3,249 17%Total material milled tonnes '000 21,145 24,027 (2,882) (12%)Gold head grade grams/tonne 1.12 0.97 0.15 15%Gold recovery % 78.7 82.4 (3.7) (4%)Gold produced ounces 599,717 619,606 (19,889) (3%)Copper produced tonnes 61,764 63,805 (2,041) (3%)Silver produced ounces 359,378 382,763 (23,385) (6%)Gold sales ounces 585,686 625,942 (40,256) (6%)Copper sales tonnes 60,927 63,845 (2,918) (5%)Silver sales ounces 357,263 380,692 (23,429) (6%)
Financial Revenue $m 1,182 1,137 45 4%Cost of Sales (including depreciation) $m 648 647 1 0%Depreciation $m 161 136 25 18%Other income $m 121 – – 100%EBITDA $m 816 626 190 30%EBIT $m 655 490 165 34%Operating cash flow $m 801 671 130 19%Sustaining capital $m 58 56 2 4%Non-sustaining capital $m 59 112 (53) (47%)Total capital expenditure $m 117 168 (51) (30%)Free cash flow $m 691 502 189 38%All-In Sustaining Cost $m 100 151 (51) (34%)All-In Sustaining Cost $/oz 171 241 (70) (29%)
Cadia’s operating and financial performance for the current period was adversely impacted by:
• the large seismic event on 14 April 2017 which resulted in the temporary suspension of mining operations, with mining of PC2 and PC1 recommencing in July 2017 and September 2017 respectively and subsequent progressive ramp-up in the first half of the current period; and
• the embankment slump at the Northern Tailings Storage Facility (“NTF”) at Cadia on 9 March 2018 which reduced milling rates for approximately two months of the current period.
These events contributed to gold and copper production being 3% lower than the prior period. Lower material milled and lower recovery rates in the current period were partially offset by higher gold head grades primarily driven by a higher proportion of ore feed from PC2 and the prior period having a higher level of low-grade stockpiles feed following the seismic event. Recovery was adversely impacted by the higher proportion of ore from that part of PC2 where the mineralogy of ore feed currently presents unfavourably for recovery purposes (subject to further work to be undertaken, analysis of the PC2 ore body using hydrofracturing drill core indicates that recoveries from PC2 can be expected to improve over time as the height of the draw increases).
EBIT of $655 million was 34% higher in the current period primarily driven by higher realised gold and copper prices. This increase was partially offset by an increase in depreciation which was a result of the increased utilisation of Cadia East reserves, the acceleration of depreciation on the Ridgeway assets (which are in care and maintenance) and the impact of a higher average Australian dollar exchange rate in the period. $34 million of the $155 million of insurance proceeds which related to material damage caused by the seismic event were allocated to site production costs, offsetting the costs that were largely incurred in this period, with the remainder of the proceeds ($121 million) recorded in other income for Cadia.
All-In Sustaining Cost per ounce was lower in the current period, with the reduction primarily attributable to higher copper prices increasing the value of the copper by-product credits. This copper credit benefit was partially offset by higher site unit costs due to the lower sales volumes in the current period. In the current and prior periods, Cadia’s AISC includes a $42 and $110 per ounce normalisation (i.e. reduction) respectively, related to the Cadia seismic event.
Free cash flow was $189 million higher in the current period, driven by higher gold and copper prices and lower capital expenditure relative to the prior period. These benefits were partially offset by a net working capital outflow relative to the prior period (including the build of ore stockpiles) and lower production due to the events described above. The insurance proceeds of $155 million relating to the seismic event are included in operating cash flow.
53NEWCREST 2018 ANNUAL REPORT
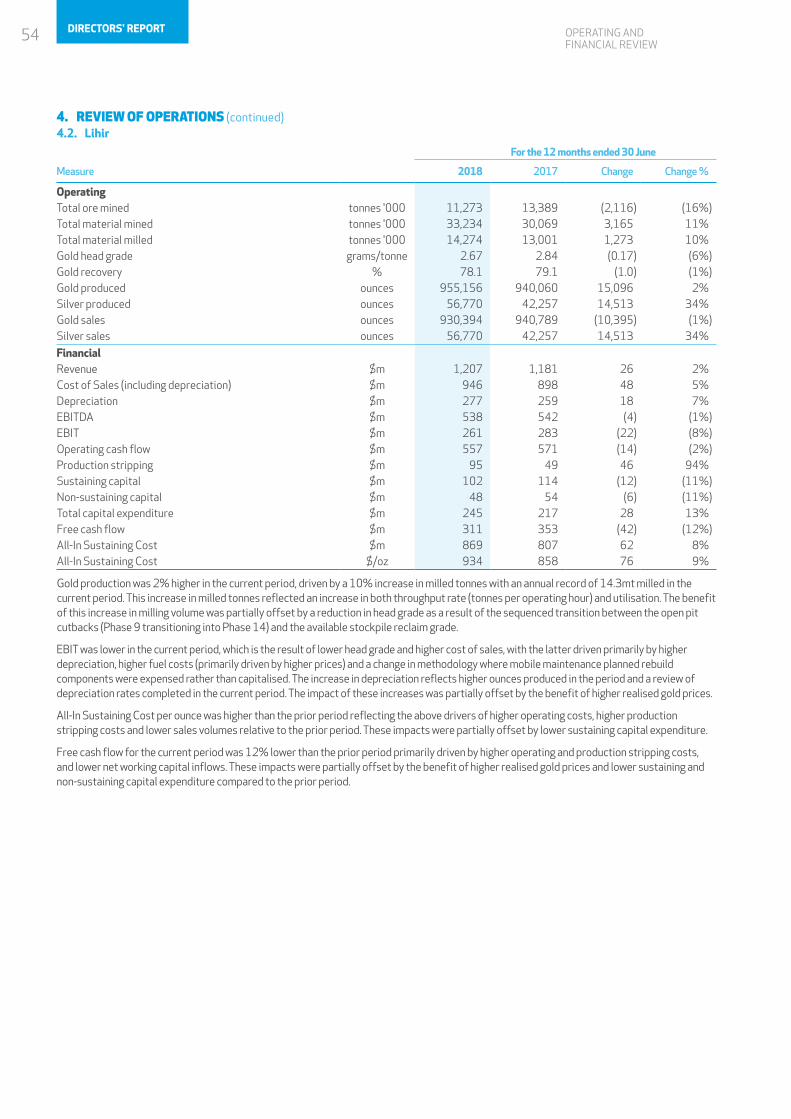
OPERATING AND FINANCIAL REVIEW
4. REVIEW OF OPERATIONS (continued)4.2. Lihir
For the 12 months ended 30 June
Measure 2018 2017 Change Change %
OperatingTotal ore mined tonnes '000 11,273 13,389 (2,116) (16%)Total material mined tonnes '000 33,234 30,069 3,165 11%Total material milled tonnes '000 14,274 13,001 1,273 10%Gold head grade grams/tonne 2.67 2.84 (0.17) (6%)Gold recovery % 78.1 79.1 (1.0) (1%)Gold produced ounces 955,156 940,060 15,096 2%Silver produced ounces 56,770 42,257 14,513 34%Gold sales ounces 930,394 940,789 (10,395) (1%)Silver sales ounces 56,770 42,257 14,513 34%
Financial Revenue $m 1,207 1,181 26 2%Cost of Sales (including depreciation) $m 946 898 48 5%Depreciation $m 277 259 18 7%EBITDA $m 538 542 (4) (1%)EBIT $m 261 283 (22) (8%)Operating cash flow $m 557 571 (14) (2%)Production stripping $m 95 49 46 94%Sustaining capital $m 102 114 (12) (11%)Non-sustaining capital $m 48 54 (6) (11%)Total capital expenditure $m 245 217 28 13%Free cash flow $m 311 353 (42) (12%)All-In Sustaining Cost $m 869 807 62 8%All-In Sustaining Cost $/oz 934 858 76 9%
Gold production was 2% higher in the current period, driven by a 10% increase in milled tonnes with an annual record of 14.3mt milled in the current period. This increase in milled tonnes reflected an increase in both throughput rate (tonnes per operating hour) and utilisation. The benefit of this increase in milling volume was partially offset by a reduction in head grade as a result of the sequenced transition between the open pit cutbacks (Phase 9 transitioning into Phase 14) and the available stockpile reclaim grade.
EBIT was lower in the current period, which is the result of lower head grade and higher cost of sales, with the latter driven primarily by higher depreciation, higher fuel costs (primarily driven by higher prices) and a change in methodology where mobile maintenance planned rebuild components were expensed rather than capitalised. The increase in depreciation reflects higher ounces produced in the period and a review of depreciation rates completed in the current period. The impact of these increases was partially offset by the benefit of higher realised gold prices.
All-In Sustaining Cost per ounce was higher than the prior period reflecting the above drivers of higher operating costs, higher production stripping costs and lower sales volumes relative to the prior period. These impacts were partially offset by lower sustaining capital expenditure.
Free cash flow for the current period was 12% lower than the prior period primarily driven by higher operating and production stripping costs, and lower net working capital inflows. These impacts were partially offset by the benefit of higher realised gold prices and lower sustaining and non-sustaining capital expenditure compared to the prior period.
54 DIRECTORS' REPORT

OPERATING AND FINANCIAL REVIEW
4.3. Telfer For the 12 months ended 30 June
Measure 2018 2017 Change Change %
OperatingTotal ore mined tonnes '000 20,321 15,686 4,635 30%Total material mined tonnes '000 44,293 34,144 10,149 30%Total material milled tonnes '000 23,026 21,187 1,839 9%Gold head grade grams/tonne 0.71 0.70 0.01 1%Gold recovery % 78.9 79.4 (0.5) (1%)Gold produced ounces 425,536 386,242 39,294 10%Copper produced tonnes 16,212 20,136 (3,924) (19%)Silver produced ounces 207,099 229,453 (22,354) (10%)Gold sales ounces 422,241 398,281 23,960 6%Copper sales tonnes 16,390 20,916 (4,526) (22%)Silver sales ounces 207,099 229,453 (22,354) (10%)
Financial Revenue $m 686 631 55 9%Cost of Sales (including depreciation) $m 746 625 121 19%Depreciation $m 200 138 62 45%EBITDA $m 140 144 (4) (3%)EBIT $m (60) 6 (66) (1,100%)Operating cash flow $m 135 178 (43) (24%)Production stripping $m 43 27 16 59%Sustaining capital $m 46 51 (5) (10%)Non-sustaining capital $m 9 23 (14) (61%)Total capital expenditure $m 98 101 (3) (3%)Free cash flow $m 27 70 (43) (61%)All-In Sustaining Cost $m 533 469 64 14%All-In Sustaining Cost $/oz 1,262 1,178 84 7%
Gold production was 10% higher in current period compared to the prior period primarily driven by an increase in total ore mined enabling higher mill throughput. Total material milled of 23mt was an annual record for Telfer. Total material mined increased as a result of the planned ramp up in West Dome Stage 3 and Main Dome Stage 4 more than offsetting the wind down of Main Dome Stage 6, and increased waste movement in West Dome Stage 2.
EBIT was lower in the current period due to higher depreciation charges, the cost of increased open pit mining activities and the higher stripping ratio from West Dome Stage 2, and the impact of a higher average Australian dollar exchange rate in the period. The increase in depreciation reflects a review of asset useful lives and depreciation rates in the current period, Reserve revisions as at 31 December 2016 and higher production in the current period. These were partially offset by higher gold and copper prices. The Telfer gold hedges had a positive $22 million impact on revenue in the period.
All-In Sustaining Cost was higher in the current period driven by the increase in mining activity (including higher production stripping activity), substantially lower copper sales (primarily due to lower feed grade) and the impact of a higher average Australian dollar exchange rate in the period. This was partially offset by higher copper prices and a reduction in sustaining capital expenditure.
Free cash flow was lower in the current period primarily due to increased mining expenditure and lower net working capital inflows, partially offset by higher gold and copper prices and lower sustaining and non-sustaining capital expenditure.
55NEWCREST 2018 ANNUAL REPORT

OPERATING AND FINANCIAL REVIEW
4. REVIEW OF OPERATIONS (continued)4.4. Gosowong5
For the 12 months ended 30 June
Measure 2018 2017 Change Change %
OperatingTotal ore mined tonnes '000 679 564 115 20%Total material mined tonnes '000 767 664 103 16%Total material milled tonnes '000 704 565 139 25%Gold head grade grams/tonne 11.49 17.03 (5.54) (33%)Gold recovery % 95.7 96.5 (0.8) (1%)Gold produced ounces 251,390 295,876 (44,486) (15%)Silver produced ounces 298,459 361,266 (62,807) (17%)Gold sales ounces 265,442 275,008 (9,566) (3%)Silver sales ounces 369,733 283,787 85,946 30%
Financial Revenue $m 351 350 1 0%Cost of Sales (including depreciation) $m 293 271 22 8%Depreciation $m 90 98 (8) (8%)EBITDA $m 148 177 (29) (16%)EBIT $m 58 79 (21) (27%)Operating cash flow $m 146 186 (40) (22%)Sustaining capital $m 25 33 (8) (24%)Free cash flow $m 111 142 (31) (22%)All-In Sustaining Cost $m 234 208 26 13%All-In Sustaining Cost $/oz 882 757 125 17%
Lower gold production in the current period was primarily due to lower head grade, partially offset by higher mined and milled tonnes. Gold sales in the current period were higher than gold produced in the current period following the unwind of prior period shipment delays following production issues at the third party owned refinery.
The lower EBIT in the current period was a result of higher milling and mining costs incurred to produce gold from lower grade ore. These impacts were partially offset by lower depreciation, reflecting lower gold production.
All-In Sustaining Cost per ounce was higher in the current period primarily due to lower gold volumes produced and sold, together with higher site costs associated with higher levels of ore mined and milled (but at lower grade), partially offset by lower sustaining capital expenditure.
Free cash flow was $31 million lower than the prior period which is primarily driven by lower EBITDA and lower net working capital inflows, partially offset by lower sustaining capital expenditure.
As announced on 26 June 2018, Newcrest’s 75% owned Indonesian subsidiary, PT Nusa Halmahera Minerals (“PT NHM”), has entered into an amendment agreement with the Government of Indonesia to amend the Gosowong Contract of Work (“CoW”). The most significant of these amendments impact the CoW as follows:
• PT NHM shall pay prevailing tax rates contained in the Indonesian Income Tax Laws law from 1 July 2018. • Indonesian parties must own at least 51% of PT NHM within two years of signing the amendment agreement. As a result, Newcrest must
divest at least another 26% interest from its current shareholding percentage of 75%.
56 DIRECTORS' REPORT
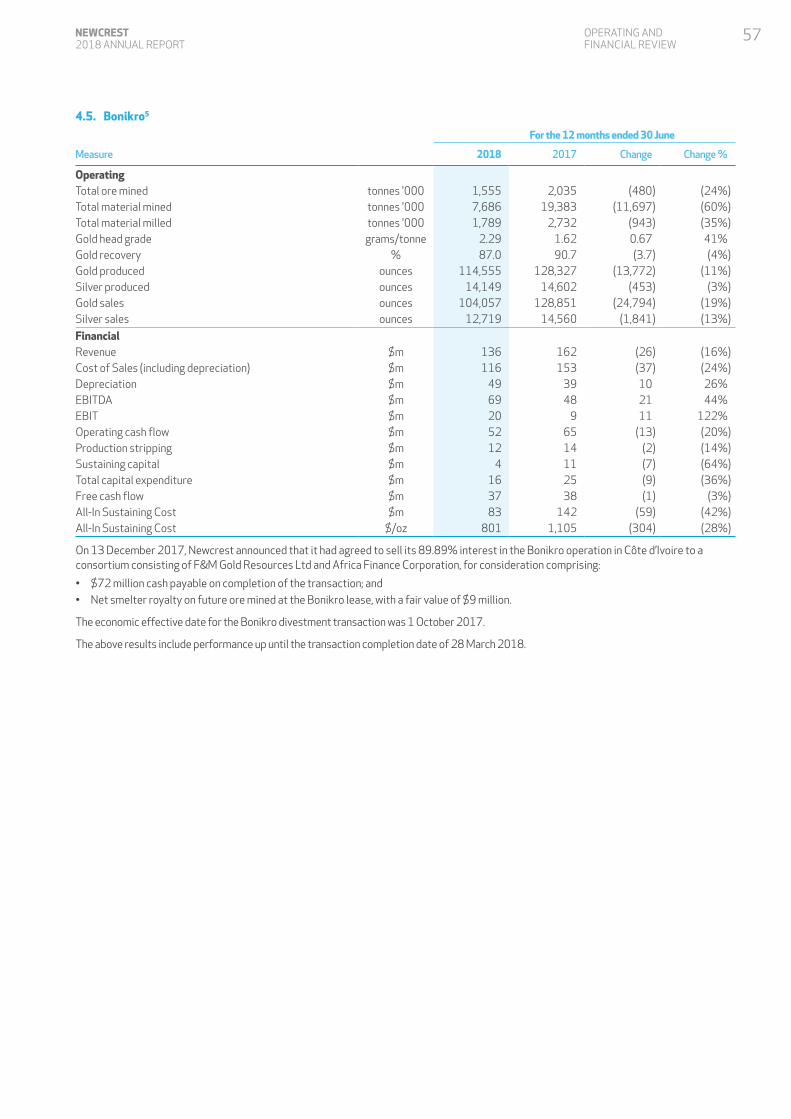
OPERATING AND FINANCIAL REVIEW
4.5. Bonikro5
For the 12 months ended 30 June
Measure 2018 2017 Change Change %
OperatingTotal ore mined tonnes '000 1,555 2,035 (480) (24%)Total material mined tonnes '000 7,686 19,383 (11,697) (60%)Total material milled tonnes '000 1,789 2,732 (943) (35%)Gold head grade grams/tonne 2.29 1.62 0.67 41%Gold recovery % 87.0 90.7 (3.7) (4%)Gold produced ounces 114,555 128,327 (13,772) (11%)Silver produced ounces 14,149 14,602 (453) (3%)Gold sales ounces 104,057 128,851 (24,794) (19%)Silver sales ounces 12,719 14,560 (1,841) (13%)
Financial Revenue $m 136 162 (26) (16%)Cost of Sales (including depreciation) $m 116 153 (37) (24%)Depreciation $m 49 39 10 26%EBITDA $m 69 48 21 44%EBIT $m 20 9 11 122%Operating cash flow $m 52 65 (13) (20%)Production stripping $m 12 14 (2) (14%)Sustaining capital $m 4 11 (7) (64%)Total capital expenditure $m 16 25 (9) (36%)Free cash flow $m 37 38 (1) (3%)All-In Sustaining Cost $m 83 142 (59) (42%)All-In Sustaining Cost $/oz 801 1,105 (304) (28%)
On 13 December 2017, Newcrest announced that it had agreed to sell its 89.89% interest in the Bonikro operation in Côte d’Ivoire to a consortium consisting of F&M Gold Resources Ltd and Africa Finance Corporation, for consideration comprising:
• $72 million cash payable on completion of the transaction; and• Net smelter royalty on future ore mined at the Bonikro lease, with a fair value of $9 million.
The economic effective date for the Bonikro divestment transaction was 1 October 2017.
The above results include performance up until the transaction completion date of 28 March 2018.
57NEWCREST 2018 ANNUAL REPORT
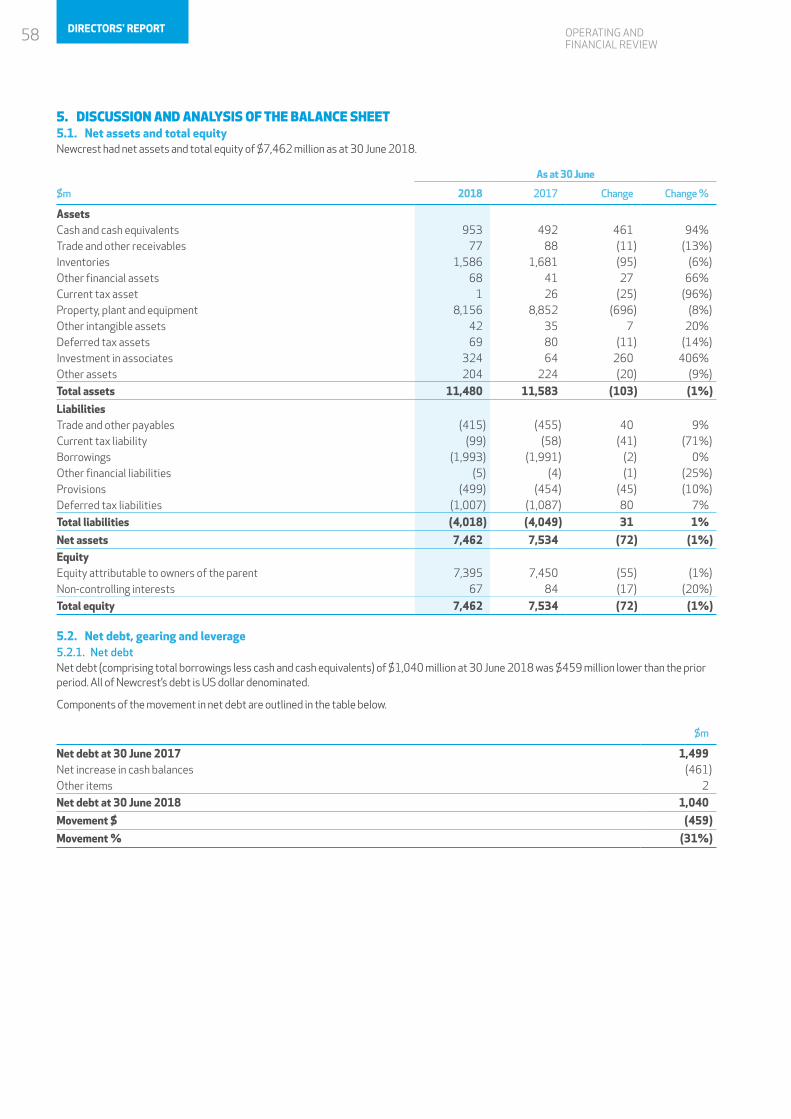
OPERATING AND FINANCIAL REVIEW
5. DISCUSSION AND ANALYSIS OF THE BALANCE SHEET 5.1. Net assets and total equityNewcrest had net assets and total equity of $7,462 million as at 30 June 2018.
As at 30 June
$m 2018 2017 Change Change %
AssetsCash and cash equivalents 953 492 461 94%Trade and other receivables 77 88 (11) (13%)Inventories 1,586 1,681 (95) (6%)Other financial assets 68 41 27 66%Current tax asset 1 26 (25) (96%)Property, plant and equipment 8,156 8,852 (696) (8%)Other intangible assets 42 35 7 20%Deferred tax assets 69 80 (11) (14%)Investment in associates 324 64 260 406%Other assets 204 224 (20) (9%)
Total assets 11,480 11,583 (103) (1%)
LiabilitiesTrade and other payables (415) (455) 40 9%Current tax liability (99) (58) (41) (71%)Borrowings (1,993) (1,991) (2) 0%Other financial liabilities (5) (4) (1) (25%)Provisions (499) (454) (45) (10%)Deferred tax liabilities (1,007) (1,087) 80 7%
Total liabilities (4,018) (4,049) 31 1%
Net assets 7,462 7,534 (72) (1%)EquityEquity attributable to owners of the parent 7,395 7,450 (55) (1%)Non-controlling interests 67 84 (17) (20%)
Total equity 7,462 7,534 (72) (1%)
5.2. Net debt, gearing and leverage5.2.1. Net debt Net debt (comprising total borrowings less cash and cash equivalents) of $1,040 million at 30 June 2018 was $459 million lower than the prior period. All of Newcrest’s debt is US dollar denominated.
Components of the movement in net debt are outlined in the table below.
$m
Net debt at 30 June 2017 1,499Net increase in cash balances (461)Other items 2
Net debt at 30 June 2018 1,040
Movement $ (459)
Movement % (31%)
58 DIRECTORS' REPORT
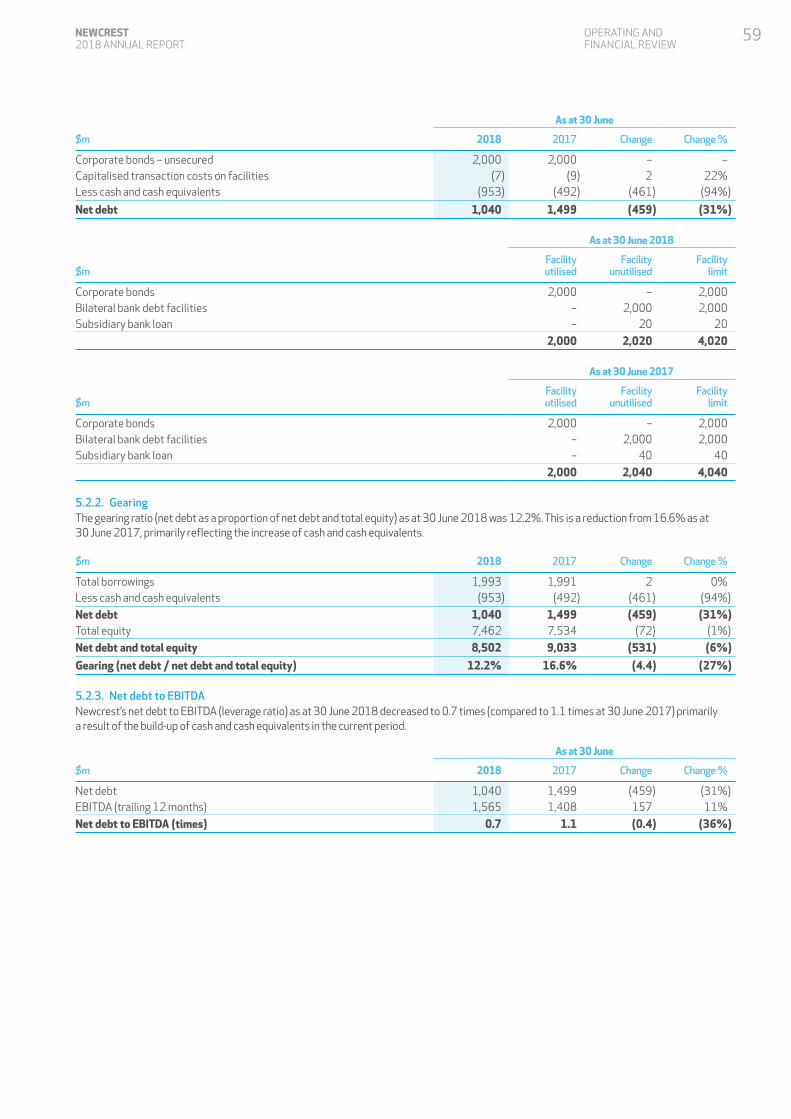
OPERATING AND FINANCIAL REVIEW
As at 30 June
$m 2018 2017 Change Change %
Corporate bonds – unsecured 2,000 2,000 – –Capitalised transaction costs on facilities (7) (9) 2 22%Less cash and cash equivalents (953) (492) (461) (94%)
Net debt 1,040 1,499 (459) (31%)
As at 30 June 2018
$mFacilityutilised
Facilityunutilised
Facilitylimit
Corporate bonds 2,000 – 2,000Bilateral bank debt facilities – 2,000 2,000Subsidiary bank loan – 20 20
2,000 2,020 4,020
As at 30 June 2017
$mFacilityutilised
Facilityunutilised
Facilitylimit
Corporate bonds 2,000 – 2,000Bilateral bank debt facilities – 2,000 2,000Subsidiary bank loan – 40 40
2,000 2,040 4,040
5.2.2. GearingThe gearing ratio (net debt as a proportion of net debt and total equity) as at 30 June 2018 was 12.2%. This is a reduction from 16.6% as at 30 June 2017, primarily reflecting the increase of cash and cash equivalents.
$m 2018 2017 Change Change %
Total borrowings 1,993 1,991 2 0%Less cash and cash equivalents (953) (492) (461) (94%)
Net debt 1,040 1,499 (459) (31%)Total equity 7,462 7,534 (72) (1%)
Net debt and total equity 8,502 9,033 (531) (6%)
Gearing (net debt / net debt and total equity) 12.2% 16.6% (4.4) (27%)
5.2.3. Net debt to EBITDANewcrest’s net debt to EBITDA (leverage ratio) as at 30 June 2018 decreased to 0.7 times (compared to 1.1 times at 30 June 2017) primarily a result of the build-up of cash and cash equivalents in the current period.
As at 30 June
$m 2018 2017 Change Change %
Net debt 1,040 1,499 (459) (31%)EBITDA (trailing 12 months) 1,565 1,408 157 11%
Net debt to EBITDA (times) 0.7 1.1 (0.4) (36%)
59NEWCREST 2018 ANNUAL REPORT
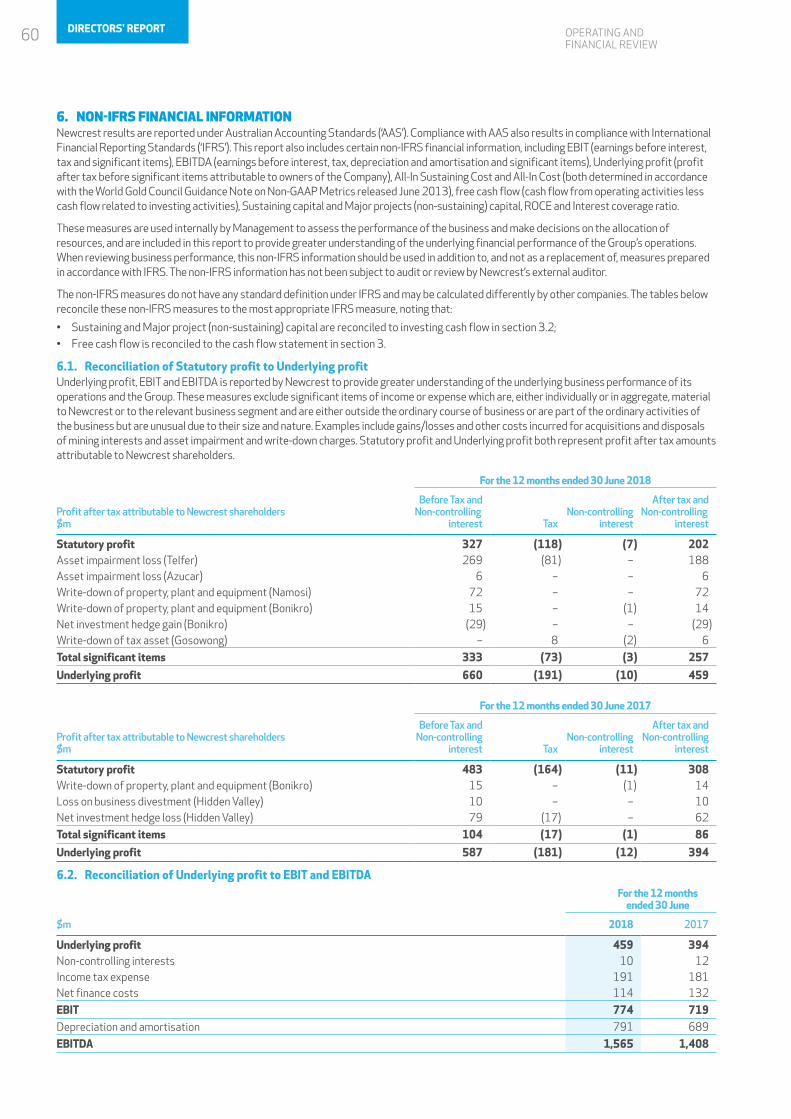
OPERATING AND FINANCIAL REVIEW
6. NON-IFRS FINANCIAL INFORMATIONNewcrest results are reported under Australian Accounting Standards (‘AAS’). Compliance with AAS also results in compliance with International Financial Reporting Standards (‘IFRS’). This report also includes certain non-IFRS financial information, including EBIT (earnings before interest, tax and significant items), EBITDA (earnings before interest, tax, depreciation and amortisation and significant items), Underlying profit (profit after tax before significant items attributable to owners of the Company), All-In Sustaining Cost and All-In Cost (both determined in accordance with the World Gold Council Guidance Note on Non-GAAP Metrics released June 2013), free cash flow (cash flow from operating activities less cash flow related to investing activities), Sustaining capital and Major projects (non-sustaining) capital, ROCE and Interest coverage ratio.
These measures are used internally by Management to assess the performance of the business and make decisions on the allocation of resources, and are included in this report to provide greater understanding of the underlying financial performance of the Group’s operations. When reviewing business performance, this non-IFRS information should be used in addition to, and not as a replacement of, measures prepared in accordance with IFRS. The non-IFRS information has not been subject to audit or review by Newcrest’s external auditor.
The non-IFRS measures do not have any standard definition under IFRS and may be calculated differently by other companies. The tables below reconcile these non-IFRS measures to the most appropriate IFRS measure, noting that:
• Sustaining and Major project (non-sustaining) capital are reconciled to investing cash flow in section 3.2; • Free cash flow is reconciled to the cash flow statement in section 3.
6.1. Reconciliation of Statutory profit to Underlying profitUnderlying profit, EBIT and EBITDA is reported by Newcrest to provide greater understanding of the underlying business performance of its operations and the Group. These measures exclude significant items of income or expense which are, either individually or in aggregate, material to Newcrest or to the relevant business segment and are either outside the ordinary course of business or are part of the ordinary activities of the business but are unusual due to their size and nature. Examples include gains/losses and other costs incurred for acquisitions and disposals of mining interests and asset impairment and write-down charges. Statutory profit and Underlying profit both represent profit after tax amounts attributable to Newcrest shareholders.
For the 12 months ended 30 June 2018
Profit after tax attributable to Newcrest shareholders $m
Before Tax and Non-controlling
interest TaxNon-controlling
interest
After tax and Non-controlling
interest
Statutory profit 327 (118) (7) 202Asset impairment loss (Telfer) 269 (81) – 188Asset impairment loss (Azucar) 6 – – 6Write-down of property, plant and equipment (Namosi) 72 – – 72Write-down of property, plant and equipment (Bonikro) 15 – (1) 14Net investment hedge gain (Bonikro) (29) – – (29)Write-down of tax asset (Gosowong) – 8 (2) 6
Total significant items 333 (73) (3) 257
Underlying profit 660 (191) (10) 459
For the 12 months ended 30 June 2017
Profit after tax attributable to Newcrest shareholders $m
Before Tax andNon-controlling
interest TaxNon-controlling
interest
After tax andNon-controlling
interest
Statutory profit 483 (164) (11) 308Write-down of property, plant and equipment (Bonikro) 15 – (1) 14Loss on business divestment (Hidden Valley) 10 – – 10Net investment hedge loss (Hidden Valley) 79 (17) – 62
Total significant items 104 (17) (1) 86
Underlying profit 587 (181) (12) 394
6.2. Reconciliation of Underlying profit to EBIT and EBITDAFor the 12 months
ended 30 June
$m 2018 2017
Underlying profit 459 394Non-controlling interests 10 12Income tax expense 191 181Net finance costs 114 132
EBIT 774 719Depreciation and amortisation 791 689
EBITDA 1,565 1,408
60 DIRECTORS' REPORT
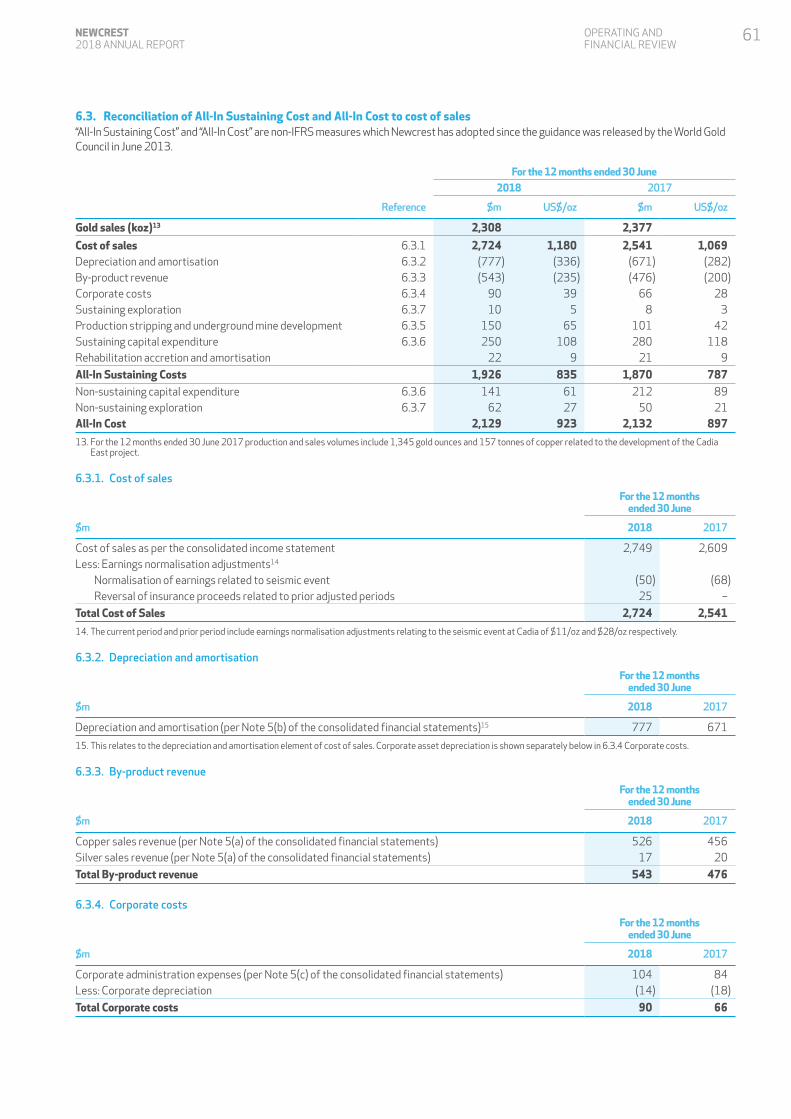
OPERATING AND FINANCIAL REVIEW
6.3. Reconciliation of All-In Sustaining Cost and All-In Cost to cost of sales“All-In Sustaining Cost” and “All-In Cost” are non-IFRS measures which Newcrest has adopted since the guidance was released by the World Gold Council in June 2013.
For the 12 months ended 30 June2018 2017
Reference $m US$/oz $m US$/oz
Gold sales (koz)13 2,308 2,377
Cost of sales 6.3.1 2,724 1,180 2,541 1,069Depreciation and amortisation 6.3.2 (777) (336) (671) (282)By-product revenue 6.3.3 (543) (235) (476) (200)Corporate costs 6.3.4 90 39 66 28Sustaining exploration 6.3.7 10 5 8 3Production stripping and underground mine development 6.3.5 150 65 101 42Sustaining capital expenditure 6.3.6 250 108 280 118Rehabilitation accretion and amortisation 22 9 21 9
All-In Sustaining Costs 1,926 835 1,870 787Non-sustaining capital expenditure 6.3.6 141 61 212 89Non-sustaining exploration 6.3.7 62 27 50 21All-In Cost 2,129 923 2,132 897
13. For the 12 months ended 30 June 2017 production and sales volumes include 1,345 gold ounces and 157 tonnes of copper related to the development of the Cadia East project.
6.3.1. Cost of sales
For the 12 monthsended 30 June
$m 2018 2017
Cost of sales as per the consolidated income statement 2,749 2,609Less: Earnings normalisation adjustments14
Normalisation of earnings related to seismic event (50) (68) Reversal of insurance proceeds related to prior adjusted periods 25 –
Total Cost of Sales 2,724 2,541
14. The current period and prior period include earnings normalisation adjustments relating to the seismic event at Cadia of $11/oz and $28/oz respectively.
6.3.2. Depreciation and amortisation
For the 12 monthsended 30 June
$m 2018 2017
Depreciation and amortisation (per Note 5(b) of the consolidated financial statements)15 777 671
15. This relates to the depreciation and amortisation element of cost of sales. Corporate asset depreciation is shown separately below in 6.3.4 Corporate costs.
6.3.3. By-product revenue
For the 12 monthsended 30 June
$m 2018 2017
Copper sales revenue (per Note 5(a) of the consolidated financial statements) 526 456Silver sales revenue (per Note 5(a) of the consolidated financial statements) 17 20
Total By-product revenue 543 476
6.3.4. Corporate costs
For the 12 monthsended 30 June
$m 2018 2017
Corporate administration expenses (per Note 5(c) of the consolidated financial statements) 104 84Less: Corporate depreciation (14) (18)
Total Corporate costs 90 66
61NEWCREST 2018 ANNUAL REPORT
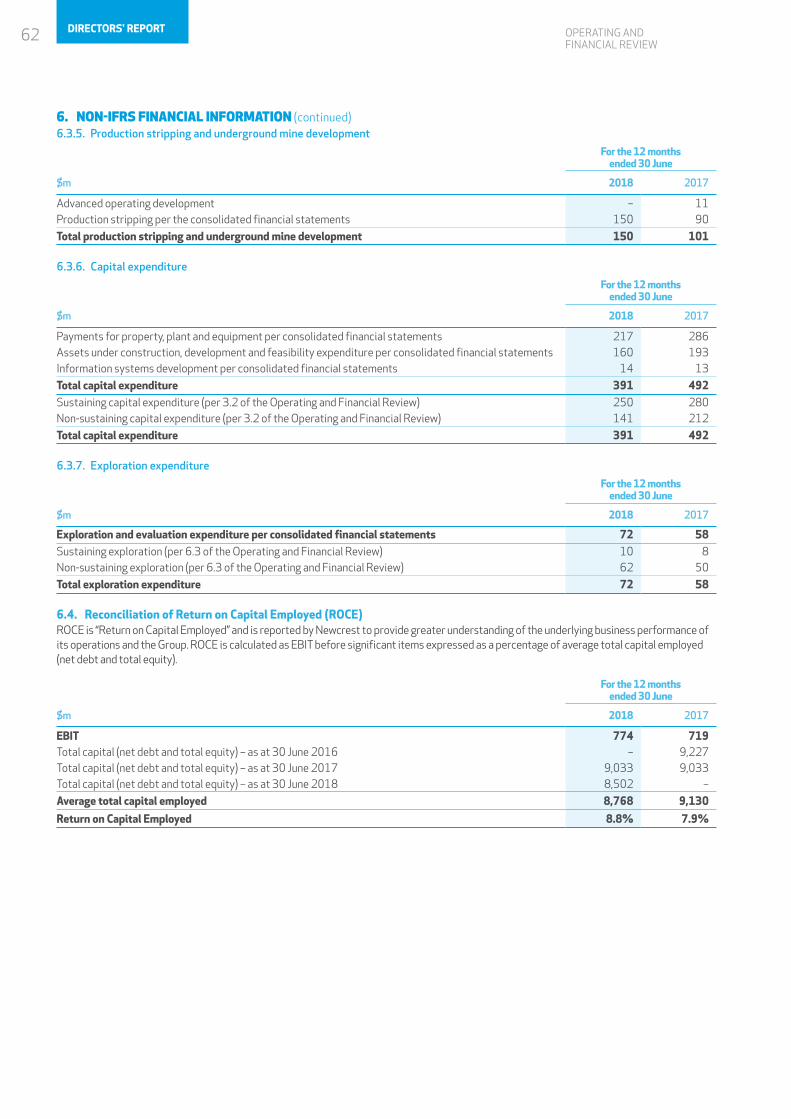
OPERATING AND FINANCIAL REVIEW
6. NON-IFRS FINANCIAL INFORMATION (continued)6.3.5. Production stripping and underground mine development
For the 12 monthsended 30 June
$m 2018 2017
Advanced operating development – 11Production stripping per the consolidated financial statements 150 90
Total production stripping and underground mine development 150 101
6.3.6. Capital expenditure
For the 12 monthsended 30 June
$m 2018 2017
Payments for property, plant and equipment per consolidated financial statements 217 286Assets under construction, development and feasibility expenditure per consolidated financial statements 160 193Information systems development per consolidated financial statements 14 13
Total capital expenditure 391 492Sustaining capital expenditure (per 3.2 of the Operating and Financial Review) 250 280Non-sustaining capital expenditure (per 3.2 of the Operating and Financial Review) 141 212
Total capital expenditure 391 492
6.3.7. Exploration expenditure
For the 12 monthsended 30 June
$m 2018 2017
Exploration and evaluation expenditure per consolidated financial statements 72 58Sustaining exploration (per 6.3 of the Operating and Financial Review) 10 8Non-sustaining exploration (per 6.3 of the Operating and Financial Review) 62 50
Total exploration expenditure 72 58
6.4. Reconciliation of Return on Capital Employed (ROCE)ROCE is “Return on Capital Employed” and is reported by Newcrest to provide greater understanding of the underlying business performance of its operations and the Group. ROCE is calculated as EBIT before significant items expressed as a percentage of average total capital employed (net debt and total equity).
For the 12 monthsended 30 June
$m 2018 2017
EBIT 774 719Total capital (net debt and total equity) – as at 30 June 2016 – 9,227Total capital (net debt and total equity) – as at 30 June 2017 9,033 9,033Total capital (net debt and total equity) – as at 30 June 2018 8,502 –
Average total capital employed 8,768 9,130
Return on Capital Employed 8.8% 7.9%
62 DIRECTORS' REPORT
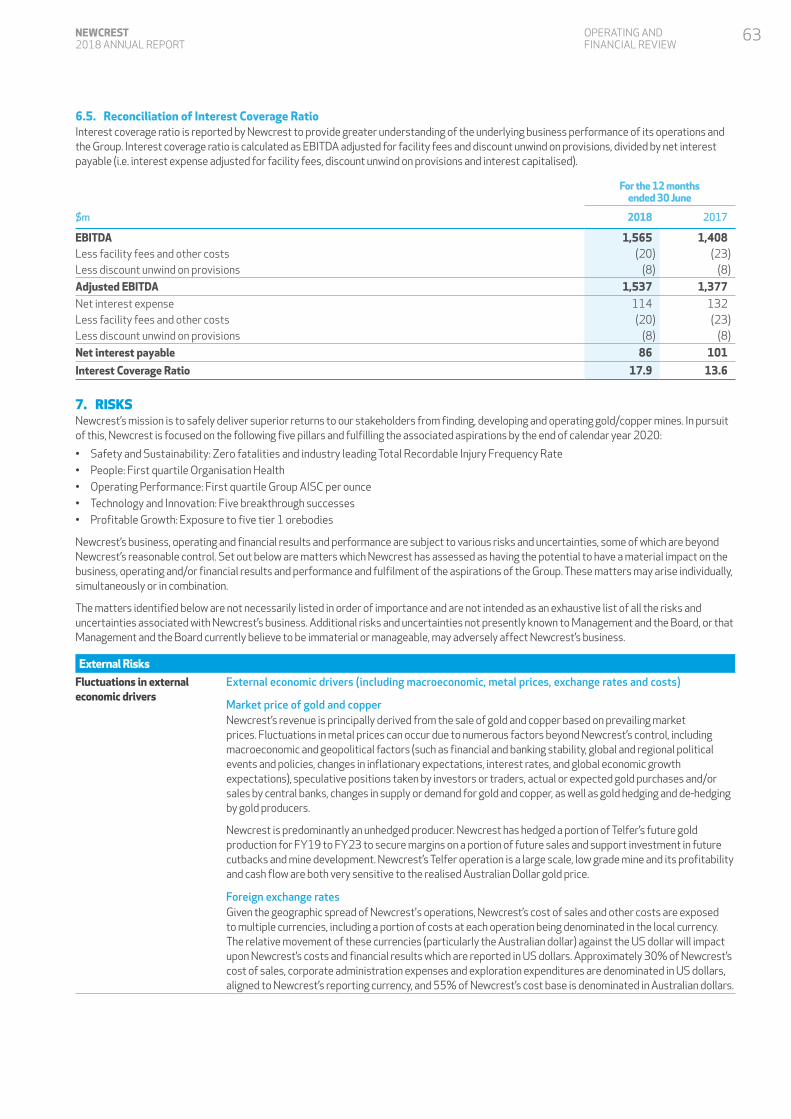
OPERATING AND FINANCIAL REVIEW
6.5. Reconciliation of Interest Coverage Ratio Interest coverage ratio is reported by Newcrest to provide greater understanding of the underlying business performance of its operations and the Group. Interest coverage ratio is calculated as EBITDA adjusted for facility fees and discount unwind on provisions, divided by net interest payable (i.e. interest expense adjusted for facility fees, discount unwind on provisions and interest capitalised).
For the 12 monthsended 30 June
$m 2018 2017
EBITDA 1,565 1,408Less facility fees and other costs (20) (23)Less discount unwind on provisions (8) (8)
Adjusted EBITDA 1,537 1,377Net interest expense 114 132Less facility fees and other costs (20) (23)Less discount unwind on provisions (8) (8)
Net interest payable 86 101
Interest Coverage Ratio 17.9 13.6
7. RISKSNewcrest’s mission is to safely deliver superior returns to our stakeholders from finding, developing and operating gold/copper mines. In pursuit of this, Newcrest is focused on the following five pillars and fulfilling the associated aspirations by the end of calendar year 2020:
• Safety and Sustainability: Zero fatalities and industry leading Total Recordable Injury Frequency Rate• People: First quartile Organisation Health• Operating Performance: First quartile Group AISC per ounce• Technology and Innovation: Five breakthrough successes• Profitable Growth: Exposure to five tier 1 orebodies
Newcrest’s business, operating and financial results and performance are subject to various risks and uncertainties, some of which are beyond Newcrest’s reasonable control. Set out below are matters which Newcrest has assessed as having the potential to have a material impact on the business, operating and/or financial results and performance and fulfilment of the aspirations of the Group. These matters may arise individually, simultaneously or in combination.
The matters identified below are not necessarily listed in order of importance and are not intended as an exhaustive list of all the risks and uncertainties associated with Newcrest’s business. Additional risks and uncertainties not presently known to Management and the Board, or that Management and the Board currently believe to be immaterial or manageable, may adversely affect Newcrest’s business.
External RisksFluctuations in external economic drivers
External economic drivers (including macroeconomic, metal prices, exchange rates and costs)
Market price of gold and copperNewcrest’s revenue is principally derived from the sale of gold and copper based on prevailing market prices. Fluctuations in metal prices can occur due to numerous factors beyond Newcrest’s control, including macroeconomic and geopolitical factors (such as financial and banking stability, global and regional political events and policies, changes in inflationary expectations, interest rates, and global economic growth expectations), speculative positions taken by investors or traders, actual or expected gold purchases and/or sales by central banks, changes in supply or demand for gold and copper, as well as gold hedging and de-hedging by gold producers.
Newcrest is predominantly an unhedged producer. Newcrest has hedged a portion of Telfer’s future gold production for FY19 to FY23 to secure margins on a portion of future sales and support investment in future cutbacks and mine development. Newcrest’s Telfer operation is a large scale, low grade mine and its profitability and cash flow are both very sensitive to the realised Australian Dollar gold price.
Foreign exchange ratesGiven the geographic spread of Newcrest's operations, Newcrest’s cost of sales and other costs are exposed to multiple currencies, including a portion of costs at each operation being denominated in the local currency. The relative movement of these currencies (particularly the Australian dollar) against the US dollar will impact upon Newcrest’s costs and financial results which are reported in US dollars. Approximately 30% of Newcrest’s cost of sales, corporate administration expenses and exploration expenditures are denominated in US dollars, aligned to Newcrest’s reporting currency, and 55% of Newcrest’s cost base is denominated in Australian dollars.
63NEWCREST 2018 ANNUAL REPORT
OPERATING AND FINANCIAL REVIEW
Increased costs, capital and commodity inputsOperating costs are subject to variations due to a number of factors, some of which are specific to a particular mine site, including changing ore grade characteristics and metallurgy, changes in the ratio of ore to waste as the mine plan follows the sequence of extracting the ore body, surface and underground haulage distances, underground geotechnical conditions and level of sustaining capital invested to maintain operations.
In addition, operating costs and capital expenditure are, to a significant extent, driven by external economic conditions impacting the cost of commodity inputs consumed in extracting and processing ore (including electricity, fuel, chemical reagents, explosives, tyres and steel), and labour costs associated with those activities. Newcrest currently hedges a portion of its expected fuel requirements. Other input costs are generally not hedged. However, where it considers appropriate, Newcrest enters into short term, medium term or evergreen contracts at fixed prices or fixed prices subject to price rise and fall mechanisms.
Examples of impactsActual or forecasted lower metal prices, and/or adverse movements in exchange rates and/or adverse movements in operating costs may:
• change the economic viability of mining operations, particularly higher cost mining operations, which may result in decisions to alter production plans or the suspension or closure of mining operations;
• reduce the market value of Newcrest’s gold or copper inventory and Newcrest’s estimates of Mineral Resources and Ore Reserves;
• result in Newcrest curtailing or suspending its exploration activities, with the result that depleted Ore Reserves may not be replaced and/or unmined Ore Reserves or Mineral Resources may not be mined;
• affect Newcrest’s future operating activities and financial results through changes to proposed project developments; and
• result in changes in the estimation of the recoverable amount of Newcrest’s assets when assessing potential accounting impairment of those assets.
Newcrest looks to mitigate the impact of any adverse movement in these factors by seeking to be a relatively low-cost gold producer, maintaining a strong balance sheet, and having sufficient liquid funds and committed undrawn bank facilities available to meet the Group’s financial commitments.
Examples of estimated potential financial impacts in the 2019 Financial Year of metal prices and exchange rates are approximately as follows:
Element Change Impact on Estimated Impact
Realised gold price +/–$10/oz Revenue +/–$25mRealised copper price +/–$0.05/lb Revenue +/–$10mAUD:USD exchange rate +/–A$0.01 EBIT –/+$15m
7. RISKS (continued)
64 DIRECTORS' REPORT

OPERATING AND FINANCIAL REVIEW
Political events, Government actions, changes in law and regulation and inability to maintain title
Political events, actions by Governments and tax authorities Newcrest has exploration, development and production activities that are subject to political, economic, social, regulatory and other risks and uncertainties.
These risks and uncertainties are unpredictable, vary from country to country and include but are not limited to law and order issues (including varying government capacity to respond), political instability, expropriation and/or nationalisation, changes in government ownership levels in projects, fraud, bribery and corruption, restrictions on repatriation of earnings or capital, land ownership disputes and tenement access issues. These risks have become more prevalent in recent years, and in particular there has been an increasing social and political focus on:
• the revenue derived by governments and other stakeholders from mining activities, which has resulted in announced reviews of the fiscal regimes applicable to mining in a number of the jurisdictions in which Newcrest has interests (including Papua New Guinea); and
• national control of and benefit from natural resources, with proposed reforms regarding government or landowner participation in mining activities, limits on foreign ownership of mining or exploration interests and/or forced divestiture (with or without adequate compensation), and broad reform agenda in relation to mining legislation, environmental stewardship and local business opportunities and employment.
In Papua New Guinea, the Government has undertaken a broad review of mining laws and its taxation regime. In addition to the risk of an increased tax cost to the Group’s operations, potential reforms from these reviews may include changes to the level and manner of local equity participation in projects and the introduction of additional retrospective reporting and compliance requirements which may increase operating costs. There is also the risk of changes to foreign exchange controls and/or laws or regulations pertaining to the holding of cash offshore and remittance of profits and capital to the parent company.
There can be no certainty as to what changes might be made to relevant law or policy in the jurisdictions where the Group has current or potential future interests, or the impact that any such changes may have on Newcrest’s ability to own and operate its mining and related interests and to otherwise conduct its business in those jurisdictions.
Changes in law and regulation and inability to maintain titleNewcrest's current and future mining operations, development projects and exploration activities are subject to various laws, policies and regulations and to obtaining and maintaining the necessary titles, authorisations, permits and licences, and associated land access arrangements with the local community and various layers of Government, which authorise those activities under the relevant law (Authorisations).
Changes in law, policies or regulations, or to the manner in which they are applied to Newcrest may have the potential to materially impact the value of a particular operation or the Group as a whole. Failure to comply with legal requirements may result in Newcrest being subject to enforcement actions with potentially material consequences, such as financial penalties, suspension of operations and forfeiture of assets.
In several jurisdictions where Newcrest has existing interests, the legal framework is increasingly complex, onerous and subject to change. Changes in laws may result in material additional expenditure, taxes or costs, restrictions on the movement of funds, or interruption to, or operation of, Newcrest's activities. Disputes arising from the application or interpretation of applicable laws, policies or regulations in the countries where Newcrest operates could also adversely impact Newcrest’s operations, financial performance and/or value.
There can be no guarantee that Newcrest will be able to successfully obtain and maintain the necessary Authorisations, or obtain and maintain the necessary Authorisations on terms acceptable to Newcrest, or that renewal of existing Authorisations will be granted in a timely manner or on terms acceptable to Newcrest. Authorisations held by or granted to Newcrest may also be subject to challenge by third parties which, if successful, could impact on Newcrest’s exploration, development and/or mining and/or processing activities.
65NEWCREST 2018 ANNUAL REPORT
OPERATING AND FINANCIAL REVIEW
Climate Change Newcrest has exposure to a range of climate risks related to the transition to a lower-carbon economy including policy and legal developments; price; technology; market and reputation; and risks related to the physical impacts of climate change.
Newcrest is assessing the Taskforce on Climate-Related Financial Disclosure (TCFD) guidelines. We are also assessing approaches to apply climate scenarios and the impact of it on the future price of energy into its medium and long term investment decisions and portfolio analysis. Whilst climate change creates risks and uncertainties, Newcrest also expects to identify opportunities.
Gold and copper mining operations are energy intensive and in the short term Newcrest expects to continue to rely heavily on fossil fuels. However, Newcrest is seeking opportunities to improve its energy efficiency to reduce direct mining and processing costs and is assessing options to use renewable power generation and low emission technologies to reduce its greenhouse gas emissions intensity.
Newcrest’s operating sites are vulnerable to physical climate impacts. As part of its risk management framework, Newcrest has identified material risks that potentially relate to physical climate impacts, mainly at an operating site level. For example, Telfer has considered pit flooding as a result of a major rainfall event and Lihir has identified loss of water supply due to a natural event. Extreme weather events have the potential to damage infrastructure, disrupt operations and delay delivery of products to market. Newcrest is working with experts and research organisations to better understand physical threats from climate change at its current and planned operating sites with the objective of building resilience into its infrastructure.
Financial RisksCapital and Liquidity Newcrest has a range of debt facilities with external financiers including unsecured bilateral bank loan facilities
and corporate unsecured senior notes (or ‘bonds’). Newcrest has structured these debt facilities to have varying maturities so that its refinancing obligations are staggered.
Although Newcrest currently forecasts to generate sufficient funds to service its debt requirements, no assurance can be given that Newcrest will be able to do so in the future or meet its financial covenants, its debt repayment obligations, or be able to refinance its debt prior to its expiry, any or all of which may adversely affect its ability to continue to operate.
Newcrest may in the future draw on available undrawn bank debt facilities or seek additional funds through means such as asset divestitures, equity raisings, or additional debt (or some combination of these). Newcrest’s ability to draw on or raise additional funding, and its ability to service that funding, may be influenced by factors including (without limitation) macroeconomic conditions such as gold and copper prices, sector appetite, Newcrest’s forecast and actual performance, regulatory change, strength of the banking sector, and the status of the financial or capital markets.
Counterparty default and credit risk
Newcrest is exposed to counterparties defaulting on their contracts or obligations which may adversely affect Newcrest’s financial condition and performance. Newcrest limits its counterparty credit risk in a variety of ways.
Bank credit risk is limited by ensuring diversification with maximum investment limits based on credit ratings. Newcrest only holds funds for investment with banks or financial institutions with credit ratings of at least A- (S&P) equivalent and in countries rated at least A- (S&P) equivalent. Newcrest only enters into derivative financial instruments with banks or financial institutions with credit ratings of at least BBB (S&P) equivalent.
All customers who wish to trade on credit terms are subject to credit risk analysis. Newcrest is also exposed to counterparty risk arising from a potential failure of an insurer on Newcrest’s panel in the event of a valid claim. Newcrest limits its counterparty risks by diversification of insurers across the Newcrest portfolio and insures with insurance companies with a credit rating of at least A- (S&P) equivalent.
Uninsured Risk Newcrest maintains a range of insurance policies to assist in mitigating the impact of events which could have a significant adverse effect on its operations and profitability. Newcrest's insurances do not cover all potential risks associated with its business. Newcrest may elect not to insure or to self-insure against certain risks, such as where insurance is not available, where the premium associated with insuring against the risk is considered excessive, or if the risk is considered to have a low likelihood of eventuating. Newcrest's insurance policies carry deductibles and limits which may lead to Newcrest not recovering the full monetary impact of an insured event.
7. RISKS (continued)
66 DIRECTORS' REPORT
OPERATING AND FINANCIAL REVIEW
Strategic RisksFailure to discover new ore reserves or to enhance and realise new ore reserves
Exploration, project evaluation and project developmentNewcrest’s current and future business, operating and financial performance and results are impacted by the discovery of new mineral prospects and actual performance of developing and operating mines and process plants, which may differ significantly from estimates determined at the time the relevant project was approved for development. Newcrest’s current or future development activities may not result in expansion or replacement of current production, or one or more new production sites or facilities may be less profitable than anticipated or may not be profitable at all.
Newcrest's ability to sustain or increase its current level of production in the future is in part dependent on the success of its exploration and acquisition activities in replacing gold and copper reserves depleted by production, the development of new projects and the expansion of existing operations. The challenge of sustaining and replacing projects for production is increased by the level of competition over these development opportunities. In the last decade, the time from discovery to production has increased significantly as a result of a variety of factors, including increases in capital requirements, environmental considerations, economic conditions, remote locations, and the complexity and depth of ore bodies.
In the absence of exploration success – or additions to Newcrest’s mineral inventory to support future operations through development activities, expansions or acquisitions – Newcrest will be unable to replace Ore Reserves and Mineral Resources depleted by operations.
Exploration activities are speculative in nature and often require substantial expenditure on exploration surveys, drilling and sampling as a basis on which to establish the presence, extent and estimated grade (metal content) of mineralised material.
Once mineralisation is discovered it may take several years to determine whether adequate Ore Reserves and/or Mineral Resources exist to support a development decision and to obtain necessary ore body knowledge to assess the technical and economic viability of mining projects. During that time the economic viability of the project may change due to fluctuations in factors that affect both revenue and costs, including metal prices, foreign exchange rates, the required return on capital and future cost of development and mining operations.
Newcrest evaluates potential acquisition and development opportunities for mineral deposits, exploration or development properties and operating mines. Newcrest's decision to acquire or develop these properties is based on a variety of factors, including historical operating results, estimates and assumptions regarding the extent and quality of mineralisation, resources and reserves, assessment of the potential for further discoveries or growth in resources and reserves, development and capital costs, cash and other operating costs, expected future commodity prices, projected economic returns, fiscal and regulatory frameworks, evaluations of existing or potential liabilities associated with the relevant assets and how these factors may change in future. Other than historical operating results (if applicable), these factors are uncertain and could have an impact on revenue, cash and other operating results, as well as the process used to estimate Mineral Resources and Ore Reserves.
Resources and reservesMineral Resources and Ore Reserves estimates are necessarily imprecise and involve subjective judgements regarding a number of factors including (but not limited to) grade distribution and/or mineralisation, the ability to economically extract and process mineralisation, and future commodity prices, exchange rates and operating costs. Such estimates relate to matters outside Newcrest’s reasonable control and involve statistical analysis which may subsequently prove to be unreliable or flawed.
Newcrest’s annual Mineral Resources and Ore Reserves statement is based upon a number of factors, including (without limitation) exploration drilling and production results, geological interpretations, economic assumptions (such as future commodity prices and exchange rates) and operating and other costs. These factors may result in reductions in Newcrest's Mineral Resources and Ore Reserves estimates, which could adversely affect the life-of-mine plans and may impact upon the value attributable to Newcrest’s mineral inventory and/or the assessment of realisable value of one or more of Newcrest’s assets and/or depreciation expense.
67NEWCREST 2018 ANNUAL REPORT

OPERATING AND FINANCIAL REVIEW
Joint venture risk Joint venture arrangements Newcrest has joint venture interests, including its interests in the Wafi-Golpu Project in Papua New Guinea, the Gosowong mine in Indonesia and the Namosi project in Fiji. These operations are subject to the risks normally associated with the conduct of joint ventures which include (but are not limited to) disagreement with joint venture partners on how to develop and operate the mines or projects efficiently, inability of joint venture partners to meet their financial and other joint venture commitments and particular risks associated with entities where a sovereign state holds an interest, including the extent to which the state intends to engage in project decision making and the ability of the state to fund its share of project costs. The existence or occurrence of one or more of these circumstances or events may have a negative impact on Newcrest’s future business, operating and financial performance and results, and/or value of the underlying asset.
Inability to make or to integrate new acquisitions
New acquisitionsNewcrest's ability to make successful acquisitions and any difficulties or time delays in achieving successful integration of any such acquisitions could have an adverse effect on its business, operating results and financial condition. Business combinations and acquisitions entail a number of risks including the effective integration of acquisitions to realise synergies, unanticipated costs and liabilities and issues impacting production. Newcrest may also be liable for the acts or omissions of previous owners of the acquired business or otherwise exposed to liabilities that were unforeseen or greater than anticipated. These and other factors may result in reductions in the Mineral Resources and Ore Reserves estimates for the acquired business, and/or impact upon the value attributable to or derived from the acquired business.
Operational Risks
Operational failures or catastrophes and natural hazards
Newcrest’s mining operations are subject to operating risks and hazards including (without limitation) unanticipated ground conditions, failure of tailings facilities, industrial incidents, infrastructure and equipment under-performance or failure, shortage of material supplies, transportation and logistics issues in relation to the Group’s workforce and equipment, natural events and environmental incidents, health and safety related incidents, and interruptions and delays due to community and/or security issues.
Some of Newcrest’s operations are in areas known to be seismically active and are subject to the risks of earthquakes and related risks of tidal surges and tsunamis, which are difficult to predict. Some of Newcrest’s operations may also experience other specific operating challenges relating to ground conditions, seismic activity and rock temperature.
A key operational risk for Newcrest is the availability and price of fuel, power and water to support mining and mineral processing activities, particularly at Newcrest’s remotely located assets. Even a temporary interruption of power or water supply could materially affect an operation.
Newcrest faces particular geotechnical, geothermal and hydrological challenges, in particular due to the trend toward more complex deposits, deeper and larger pits, and the use of deep, bulk underground mining techniques. This leads to higher pit walls, more complex underground environments and increased exposure to geotechnical and hydrological impacts.
There are a number of risks and uncertainties associated with the block cave mining methods being applied by Newcrest at its Cadia operations and elsewhere. Risks include that a cave may not propagate as anticipated, excessive air pockets may form during the cave propagation, unplanned ground movement may occur due to changes in stresses released in the surrounding rock. Excessive water ingress, disturbance and the presence of fine materials may also give rise to unplanned release of material of varying properties and/or water through drawbells.
In addition, the success of Newcrest at some of its operations, including the Lihir operation, depends, in part, upon the implementation of Newcrest’s engineering solutions to particular hydrological and geothermal conditions. At Lihir, for example, significant removal of both groundwater and sea water inflow and geothermal control is required before and during mining.
A failure to safely resolve any unexpected problems relating to these conditions at a commercially reasonable cost may adversely impact upon continuing operations, project development decisions, exploration investment decisions, Mineral Resource and Ore Reserves estimates and the assessment of the recoverable amount of Newcrest’s assets.
Information Technology and cyber risk
Newcrest’s operations are supported by information technology (IT) systems, consisting of infrastructure, networks, applications, and service providers. Newcrest could be subject to network and systems interference or disruptions from a number of sources, including (without limitation) security breaches, cyber-attacks and system defects. The impact of IT systems interference or disruption could include production downtime, operational delays, destruction or corruption of data, disclosure of commercially sensitive information and data breaches any of which could have a material impact on Newcrest's business, operations or financial condition and performance. Disaster recovery plans are in place for all of Newcrest’s major sites and critical IT systems.
7. RISKS (continued)
68 DIRECTORS' REPORT

OPERATING AND FINANCIAL REVIEW
Failure to attract and retain key employees and effectively manage industrial relations issues
Newcrest seeks to attract and retain employees and third party contractors with the appropriate technical skills and managerial experience necessary to continue to operate its business. A loss of key personnel or a failure to attract appropriately skilled and experienced personnel could affect its operations and financial condition. While, there can be no assurance that Newcrest will be able to attract and retain skilled and experienced personnel, Newcrest values its people and has policies, procedures and frameworks in place to mitigate this risk. Newcrest focuses on diversity and inclusion in the workplace, and developing its people at all levels.
Newcrest may be impacted by industrial relations issues in connection with its employees and the employees of Newcrest's contractors and suppliers. Any such activity could cause production delays, increased labour costs and adversely impact Newcrest's ability to meet its production forecasts.
In a number of jurisdictions where Newcrest has mining and related interests, there are also local requirements or expectations regarding the extent to which local and national persons are directly engaged in the mining and related activities which may result in disruptions to Newcrest’s activities where relevant requirements and/or expectations are not met. There can be no assurance that disruptions will not occur in the future which may have an adverse effect on Newcrest’s business. Similarly, there can be no assurance that Newcrest will be able to attract and retain suitably qualified and experienced local or national personnel, or that unskilled persons trained by Newcrest will be retained, in the future.
Reliance on contractors Some aspects of Newcrest's production, development and exploration activities are conducted by contractors. As a result, Newcrest's business, operating and financial performance and results may be negatively impacted by the availability and performance of these contractors and their financial strength. The material risks associated with contractors at Newcrest’s sites includes the risk of the contractor or its sub-contractors being involved in a safety or environmental incident and the potential for interruption to Newcrest’s operations due to a contractor becoming insolvent.
Marketing Newcrest produces gold dore which is currently delivered to gold refineries in Australia and Indonesia with associated risks including (without limitation) penalties from producing dore outside of the contractual specifications, theft and fluctuating transportation charges. Transportation of the dore is also subject to numerous risks including (without limitation) delays in delivery of shipments, terrorism and weather conditions. Sales of gold dore may also be adversely impacted by delays and disruption at Newcrest’s operations or the operations of one or more of the receiving refineries and consequent declarations of force majeure at Newcrest’s or buyer’s operations.
In addition to gold dore, Newcrest produces mineral concentrates which are exported by ocean vessels to smelters, located predominantly in Asia, with associated risks including (without limitation) fluctuating smelter charges, marine transportation charges and inland freight charges. Transportation of the concentrate is also subject to numerous risks including (without limitation) delays in delivery of shipments, terrorism, loss of or reduced access to export ports, weather conditions and environmental liabilities in the event of an accident or spill. Sales of concentrate may also be adversely impacted by disruption at Newcrest’s operations or the operations of one or more of the receiving smelters and consequent declarations of force majeure at Newcrest’s or buyer’s operations. Additionally, the quality of mineral concentrates, including the presence of impurities and deleterious substances, is subject to restrictions on import which vary across jurisdictions and may impact upon the saleability or price realised for the mineral concentrate.
Governance and Compliance RiskFailure to adequately manage people and corporate culture
Newcrest’s reputation and licence to operate is dependent upon on-going responsible, lawful and ethical business conduct. Failure to do so can result in serious consequences, ranging from public allegations of misbehaviour and reputational damage through to fines, regulatory intervention or investigation, temporary or permanent loss of licences, litigation and/or loss of business. Newcrest’s management, standards, policies, controls and training instil and reinforce a culture across the organisation whereby employees are encouraged to act lawfully, ethically, and in a socially-responsible manner. However, there is a risk that Newcrest employees will fail to adhere to Group standards, policies and procedures that provide guidance on acceptable business conduct and drive regulatory compliance.
69NEWCREST 2018 ANNUAL REPORT
OPERATING AND FINANCIAL REVIEW
Health, Safety and SustainabilityHealth and Safety There are numerous occupational health and safety risks associated with mining and metallurgical processes.
Newcrest has in place a full HSE management system with associated standards, tools and governance processes to ensure all hazards are identified, effectively managed and that controls are effective.
Newcrest’s Safety Transformation has been designed to manage the fatality risks in the business by improving our safety culture, increasing the effectiveness of our critical controls and improving our process safety by designing, building and maintaining our operations to a higher standard.
Health and hygiene reviews are conducted with a view to identifying the risks to our people. These include musculoskeletal disorders, fatigue, mental health illnesses and exposure to noise, diesel particulate matter, silica and acid mist. Unforeseen or past workplace exposures may lead to long-term health issues and potential compensation liabilities.
The global nature of Newcrest’s operations also means that our employees may be affected by mosquito borne diseases such as malaria, dengue fever or zika virus. Other potential health impacts include tuberculosis, and pandemic influenza outbreaks such as swine or avian flu.
Environment and Closure Mining and processing operations and development activities have inherent risks and liabilities associated with potential harm to the environment and the management of waste products. Newcrest’s activities are therefore subject to extensive environmental law and regulation in the various jurisdictions in which it operates. Compliance with these laws requires significant expenditure and non-compliance may potentially result in fines or requests for improvement actions from the regulator or could result in reputational harm. Newcrest monitors its regulatory obligations on an ongoing basis, including its reporting obligations under the Australian National Greenhouse and Energy Reporting Scheme, in addition to pursuing energy efficiency.
Newcrest’s operations may create a risk of exposure to hazardous materials. Newcrest uses hazardous material (for example, cyanide at some operations) and generates waste products that must be disposed of either through offsite facilities or onsite permitted landfills and waste management areas. Mining and ore refining processes at Newcrest sites also generate waste by-products such as tailings to be managed (by the use of tailings storage facilities or, in the case of Lihir, deep sea tailing placement) and waste rock (to be managed in waste rock dumps or in the case of Lihir, permitted barge dumping locations). Geochemical reactions within long-term waste rock dumps or low grade ore storage stockpiles may also lead to the generation of acid and metalliferous drainage that needs to be managed. Appropriate management of waste is a key consideration in Newcrest's operations. Mining operations can also impact flows and water quality in surface and ground water bodies and remedial measures may be required to prevent or minimise such impacts.
Newcrest is required to close its operations and rehabilitate the lands that it disturbs during the exploration and operating phases in accordance with applicable mining and environmental laws and regulations. A closure plan and estimate of closure and rehabilitation liabilities are prepared for each of Newcrest’s operations. These estimates of closure and rehabilitation liabilities are based on current knowledge and assumptions, however actual costs at the time of closure and rehabilitation may vary materially. In addition, adverse or deteriorating external economic conditions may bring forward mine closure and associated closure and rehabilitation costs.
7. RISKS (continued)
70 DIRECTORS' REPORT
OPERATING AND FINANCIAL REVIEW
Failure to maintain community relations and community unrest
Newcrest’s relationship with the communities in which it operates is an essential part of ensuring success of its existing operations and the development of its projects. A failure to manage relationships with the communities in which Newcrest operates may lead to local dissatisfaction, which, in turn, may lead to interruptions to Newcrest's operations, development projects and exploration activities. Particular challenges in community relations include increasing expectations regarding the level of benefits that communities receive and the level of transparency regarding the payment of compensation and the provision of other benefits to affected landholders and the wider community.
Typically, where Newcrest has exploration activities, development projects or operations, it enters into agreements with local landholders and the wider local community. These agreements include compensation and other benefits and may be subject to periodic review. The negotiation and/or review of community agreements, including compensation and other benefits, involves complicated and sensitive issues, associated expectations and often competing interests, which Newcrest seeks to manage respectfully. The nature and subject matter of these negotiations may result in community unrest which, in some instances, results in interruptions to Newcrest’s operational activities or delays to project implementation.
For example, the community agreements in place with customary landowners in relation to Newcrest's Lihir operation in Papua New Guinea are the subject of a regular review process. The duration of the review process is a result of the important and complex issues covered by the agreements and the competing interests of different landowner groups. During the current and ongoing review process, and in the context of the previous review (FY00–FY07), the Lihir operations have experienced periodic disruptions as a result of community unrest regarding the progress of the review negotiations and intra-community issues. Although community issues are generally resolved within a short period, there can be no assurance that further disputes with the customary landowners will not arise from time to time which, if prolonged, could lead to disruptions to Newcrest’s operations and development projects.
In addition, there is a level of community concern relating to the perceived effect of mining activities on the environment and on the communities located near such activities. Certain non-government-organisations are vocal critics of the mining industry and its practices, including in relation to the use of hazardous substances in processing activities and the use of deep sea tailings placement. Adverse publicity generated by non-government-organisations or others relating to extractive industries generally, or Newcrest specifically, could have an adverse impact on Newcrest's reputation or financial condition and may impact on Newcrest's relationships with the communities in which it operates. No assurance can be given that incidents will not arise that generate community concerns associated with Newcrest's activities and potentially cause operational disruptions or delays to project development until resolved.
71NEWCREST 2018 ANNUAL REPORT
REMUNERATION REPORT
REMUNERATION REPORT
22 August 2018
Dear Shareholder,
On behalf of the Board, we are pleased to provide Newcrest’s Remuneration Report for the year ended 30 June 2018, for which we seek your support at our Annual General Meeting (AGM) in November 2018.
This report explains the links between Newcrest’s Executive remuneration framework and Newcrest’s strategy and performance.
YEAR IN REVIEWDuring the current period, Newcrest’s operating performance was strengthened by record annual operational results at Lihir, both gold production and mill throughput, and improved operational performance at Telfer. These operational achievements partially offset the adverse impacts in the current period of the large seismic event on 14 April 2017 and the embankment slump at the Northern Tailings Storage Facility (NTSF) on 9 March 2018 at Cadia. Despite these challenges, Cadia finished the financial year strongly with its mine production and mill throughput annualised rate exceeding 30mtpa in June 2018.
As foreshadowed in the 2017 Notice of Annual General Meeting, Lady Winifred Kamit and John Spark retired from the Board, with effect from 14 November 2017. The second half of calendar year 2018 will see further Board renewal with Peter Tomsett joining the Board as an independent Non-Executive Director on 1 September 2018 and Rick Lee AM retiring with effect from the end of the 2018 Annual General Meeting on 14 November 2018.
REMUNERATION OUTCOMES Short term incentive (STI) outcomes for our Executives for the 2018 financial year ranged from 54.9% to 66.1% of the maximum possible award. 65.6% of the 2014 Long Term Incentives (LTIs) vested during the 2018 financial year.
None of the Executives received an increase in total fixed remuneration (TFR) during the 2018 financial year. As foreshadowed in the 2017 Remuneration Report, and approved at the 2017 Annual General Meeting, the face value of the CEO’s annual LTI grant increased from 150% to 180% of TFR following benchmarking undertaken and advice received from the Board’s independent remuneration adviser in the 2017 financial year.
The Non-Executive Directors (NEDs) did not receive any fee increases during the 2018 financial year. However, following benchmarking against a range of ASX companies, in particular those with market capitalisations ranked between 11–40, it was determined that there should be an increase of 10% in Committee fees, with effect from the commencement of the 2019 financial year (equating to an increase for each NED, other than the Chairman who does not receive Committee fees, in the range of 0.9% to 2.6%, based on the aggregate of Board and Committee fees received by the NED). The aggregate fees immediately following the increases are 30.1% below the aggregate fee pool approved by shareholders. Base Board fees have not changed.
The Board remains committed to ensuring that Newcrest’s remuneration framework is aligned to the Company’s strategy and performance and that it attracts, rewards and retains high calibre people and drives strong individual and Group performance in the interests of both the Company and its shareholders. To this end, the structure of, and the performance conditions for, both the STI and LTI Plans have been reviewed. While no changes were made to the structure and performance conditions in the 2018 financial year, the performance conditions and weighting attributed to the conditions have been modified for the 2019 financial year grants to reflect the five pillars that underpin the Company’s strategy to 2020. See section 4.4.1 for further details.
We continue to welcome shareholder feedback and thank you for your continued support.
Peter Hay Rick Lee AM Chairman, Board of Directors Chairman, Human Resources and Remuneration Committee
72 DIRECTORS' REPORT
REMUNERATION REPORT
REMUNERATION REPORTThis Report details the remuneration arrangements in place for the key management personnel (KMP), being those people who have authority for planning, directing and controlling the activities of the Company. KMP comprises all NEDs and Executives. In this Report, Executives refers to members of the Executive Committee (including the Managing Director and Chief Executive Officer (CEO) and Finance Director and Chief Financial Officer (CFO) of Newcrest, who are also Directors of the Company).
This Report has been audited under section 308(3C) of the Corporations Act 2001.
CONTENTSWe have structured the Report into the following sections:
Section 1 Key Management Personnel 73
Section 2 Remuneration Snapshot 74
Section 3 Remuneration Governance 75
Section 4 Our Executive Remuneration Framework 75
Section 5 Remuneration Outcomes 83
Section 6 Executive Service Agreements and Termination Arrangements 87
Section 7 Non-Executive Directors’ Remuneration 87
Section 8 Shareholdings 88
Section 9 Statutory Tables 89
1. KEY MANAGEMENT PERSONNEL (KMP)The following table details the Company’s KMP during the 2018 financial year.
Name Role
Executive DirectorsSandeep Biswas Managing Director and Chief Executive Officer (CEO) Gerard Bond Finance Director and Chief Financial Officer (CFO)
Other ExecutivesMelanie Allibon Executive General Manager (EGM) People Craig Jetson EGM Cadia and LihirCraig Jones EGM Wafi-Golpu Ian Kemish EGM Public Affairs and Social Performance Francesca Lee EGM General Counsel and Company Secretary Michael Nossal Chief Development Officer (CDO)Philip Stephenson EGM Gosowong, Telfer and Bonikro (1 July 2017 – 28 March 2018)
EGM Gosowong, Telfer and Health Safety Environment & Security (from 29 March 2018)
Non-Executive DirectorsPeter Hay Non-Executive ChairmanPhilip Aiken AM Non-Executive DirectorRoger Higgins Non-Executive DirectorRick Lee AM Non-Executive DirectorXiaoling Liu Non-Executive DirectorVickki McFadden Non-Executive DirectorLady Winifred Kamit Non-Executive DirectorJohn Spark Non-Executive Director
All Executives and Non-Executive Directors listed above held their position for all of the 2018 financial year, other than Lady Winifred Kamit and John Spark who both ceased as Directors on 14 November 2017.
Subsequent to 30 June 2018, the following changes to KMP have been announced:
• the appointment of Peter Tomsett as an independent Non-Executive Director, effective 1 September 2018; and• the resignation of Rick Lee AM as an independent Non-Executive Director, immediately after the next Newcrest AGM on 14 November 2018.
73NEWCREST 2018 ANNUAL REPORT
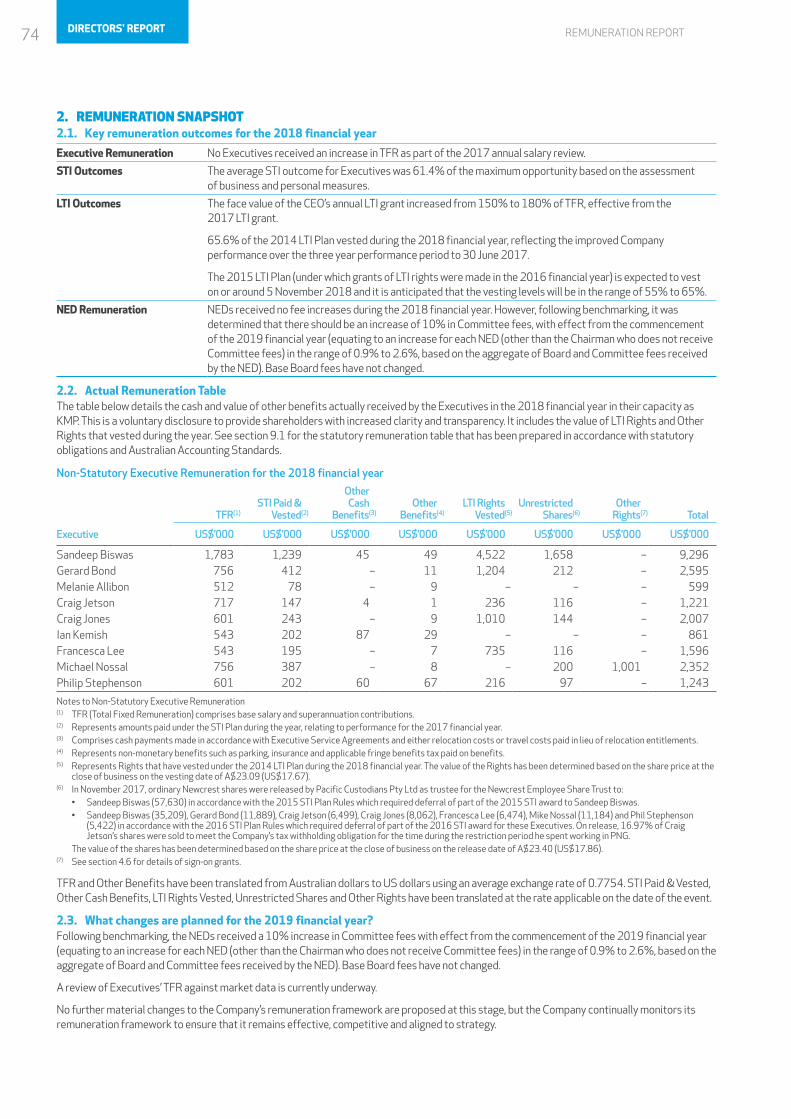
REMUNERATION REPORT
2. REMUNERATION SNAPSHOT2.1. Key remuneration outcomes for the 2018 financial year
Executive Remuneration No Executives received an increase in TFR as part of the 2017 annual salary review.
STI Outcomes The average STI outcome for Executives was 61.4% of the maximum opportunity based on the assessment of business and personal measures.
LTI Outcomes The face value of the CEO’s annual LTI grant increased from 150% to 180% of TFR, effective from the 2017 LTI grant.
65.6% of the 2014 LTI Plan vested during the 2018 financial year, reflecting the improved Company performance over the three year performance period to 30 June 2017.
The 2015 LTI Plan (under which grants of LTI rights were made in the 2016 financial year) is expected to vest on or around 5 November 2018 and it is anticipated that the vesting levels will be in the range of 55% to 65%.
NED Remuneration NEDs received no fee increases during the 2018 financial year. However, following benchmarking, it was determined that there should be an increase of 10% in Committee fees, with effect from the commencement of the 2019 financial year (equating to an increase for each NED (other than the Chairman who does not receive Committee fees) in the range of 0.9% to 2.6%, based on the aggregate of Board and Committee fees received by the NED). Base Board fees have not changed.
2.2. Actual Remuneration Table The table below details the cash and value of other benefits actually received by the Executives in the 2018 financial year in their capacity as KMP. This is a voluntary disclosure to provide shareholders with increased clarity and transparency. It includes the value of LTI Rights and Other Rights that vested during the year. See section 9.1 for the statutory remuneration table that has been prepared in accordance with statutory obligations and Australian Accounting Standards.
Non-Statutory Executive Remuneration for the 2018 financial year
TFR(1)STI Paid &
Vested(2)
OtherCash
Benefits(3)Other
Benefits(4)LTI Rights
Vested(5)Unrestricted
Shares(6) Other
Rights(7) Total
Executive US$’000 US$’000 US$’000 US$’000 US$’000 US$’000 US$’000 US$’000
Sandeep Biswas 1,783 1,239 45 49 4,522 1,658 – 9,296Gerard Bond 756 412 – 11 1,204 212 – 2,595Melanie Allibon 512 78 – 9 – – – 599Craig Jetson 717 147 4 1 236 116 – 1,221Craig Jones 601 243 – 9 1,010 144 – 2,007Ian Kemish 543 202 87 29 – – – 861Francesca Lee 543 195 – 7 735 116 – 1,596Michael Nossal 756 387 – 8 – 200 1,001 2,352Philip Stephenson 601 202 60 67 216 97 – 1,243
Notes to Non-Statutory Executive Remuneration(1) TFR (Total Fixed Remuneration) comprises base salary and superannuation contributions. (2) Represents amounts paid under the STI Plan during the year, relating to performance for the 2017 financial year.(3) Comprises cash payments made in accordance with Executive Service Agreements and either relocation costs or travel costs paid in lieu of relocation entitlements.(4) Represents non-monetary benefits such as parking, insurance and applicable fringe benefits tax paid on benefits.(5) Represents Rights that have vested under the 2014 LTI Plan during the 2018 financial year. The value of the Rights has been determined based on the share price at the
close of business on the vesting date of A$23.09 (US$17.67). (6) In November 2017, ordinary Newcrest shares were released by Pacific Custodians Pty Ltd as trustee for the Newcrest Employee Share Trust to:
• Sandeep Biswas (57,630) in accordance with the 2015 STI Plan Rules which required deferral of part of the 2015 STI award to Sandeep Biswas. • Sandeep Biswas (35,209), Gerard Bond (11,889), Craig Jetson (6,499), Craig Jones (8,062), Francesca Lee (6,474), Mike Nossal (11,184) and Phil Stephenson
(5,422) in accordance with the 2016 STI Plan Rules which required deferral of part of the 2016 STI award for these Executives. On release, 16.97% of Craig Jetson’s shares were sold to meet the Company’s tax withholding obligation for the time during the restriction period he spent working in PNG.
The value of the shares has been determined based on the share price at the close of business on the release date of A$23.40 (US$17.86). (7) See section 4.6 for details of sign-on grants.
TFR and Other Benefits have been translated from Australian dollars to US dollars using an average exchange rate of 0.7754. STI Paid & Vested, Other Cash Benefits, LTI Rights Vested, Unrestricted Shares and Other Rights have been translated at the rate applicable on the date of the event.
2.3. What changes are planned for the 2019 financial year?Following benchmarking, the NEDs received a 10% increase in Committee fees with effect from the commencement of the 2019 financial year (equating to an increase for each NED (other than the Chairman who does not receive Committee fees) in the range of 0.9% to 2.6%, based on the aggregate of Board and Committee fees received by the NED). Base Board fees have not changed.
A review of Executives’ TFR against market data is currently underway.
No further material changes to the Company’s remuneration framework are proposed at this stage, but the Company continually monitors its remuneration framework to ensure that it remains effective, competitive and aligned to strategy.
74 DIRECTORS' REPORT
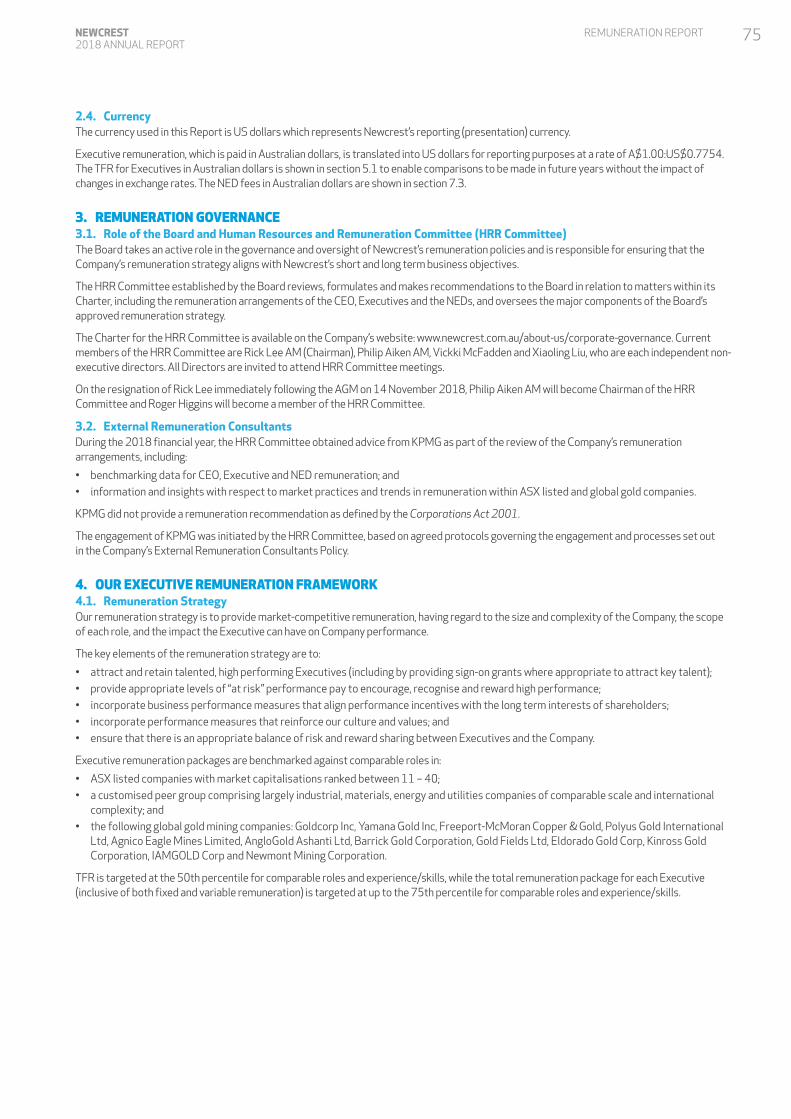
REMUNERATION REPORT
2.4. CurrencyThe currency used in this Report is US dollars which represents Newcrest’s reporting (presentation) currency.
Executive remuneration, which is paid in Australian dollars, is translated into US dollars for reporting purposes at a rate of A$1.00:US$0.7754. The TFR for Executives in Australian dollars is shown in section 5.1 to enable comparisons to be made in future years without the impact of changes in exchange rates. The NED fees in Australian dollars are shown in section 7.3.
3. REMUNERATION GOVERNANCE3.1. Role of the Board and Human Resources and Remuneration Committee (HRR Committee) The Board takes an active role in the governance and oversight of Newcrest’s remuneration policies and is responsible for ensuring that the Company’s remuneration strategy aligns with Newcrest’s short and long term business objectives.
The HRR Committee established by the Board reviews, formulates and makes recommendations to the Board in relation to matters within its Charter, including the remuneration arrangements of the CEO, Executives and the NEDs, and oversees the major components of the Board’s approved remuneration strategy.
The Charter for the HRR Committee is available on the Company’s website: www.newcrest.com.au/about-us/corporate-governance. Current members of the HRR Committee are Rick Lee AM (Chairman), Philip Aiken AM, Vickki McFadden and Xiaoling Liu, who are each independent non-executive directors. All Directors are invited to attend HRR Committee meetings.
On the resignation of Rick Lee immediately following the AGM on 14 November 2018, Philip Aiken AM will become Chairman of the HRR Committee and Roger Higgins will become a member of the HRR Committee.
3.2. External Remuneration ConsultantsDuring the 2018 financial year, the HRR Committee obtained advice from KPMG as part of the review of the Company’s remuneration arrangements, including:
• benchmarking data for CEO, Executive and NED remuneration; and• information and insights with respect to market practices and trends in remuneration within ASX listed and global gold companies.
KPMG did not provide a remuneration recommendation as defined by the Corporations Act 2001.
The engagement of KPMG was initiated by the HRR Committee, based on agreed protocols governing the engagement and processes set out in the Company’s External Remuneration Consultants Policy.
4. OUR EXECUTIVE REMUNERATION FRAMEWORK4.1. Remuneration StrategyOur remuneration strategy is to provide market-competitive remuneration, having regard to the size and complexity of the Company, the scope of each role, and the impact the Executive can have on Company performance.
The key elements of the remuneration strategy are to:
• attract and retain talented, high performing Executives (including by providing sign-on grants where appropriate to attract key talent); • provide appropriate levels of “at risk” performance pay to encourage, recognise and reward high performance;• incorporate business performance measures that align performance incentives with the long term interests of shareholders; • incorporate performance measures that reinforce our culture and values; and• ensure that there is an appropriate balance of risk and reward sharing between Executives and the Company.
Executive remuneration packages are benchmarked against comparable roles in:
• ASX listed companies with market capitalisations ranked between 11 – 40; • a customised peer group comprising largely industrial, materials, energy and utilities companies of comparable scale and international
complexity; and • the following global gold mining companies: Goldcorp Inc, Yamana Gold Inc, Freeport-McMoran Copper & Gold, Polyus Gold International
Ltd, Agnico Eagle Mines Limited, AngloGold Ashanti Ltd, Barrick Gold Corporation, Gold Fields Ltd, Eldorado Gold Corp, Kinross Gold Corporation, IAMGOLD Corp and Newmont Mining Corporation.
TFR is targeted at the 50th percentile for comparable roles and experience/skills, while the total remuneration package for each Executive (inclusive of both fixed and variable remuneration) is targeted at up to the 75th percentile for comparable roles and experience/skills.
75NEWCREST 2018 ANNUAL REPORT
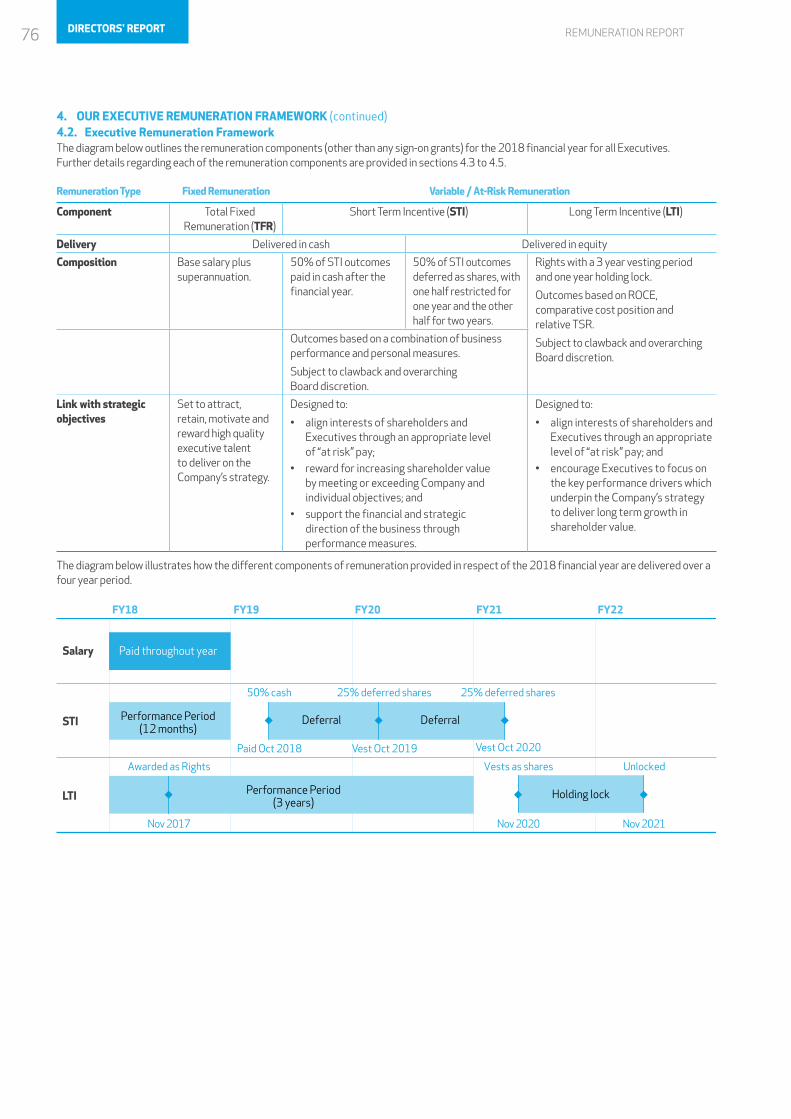
REMUNERATION REPORT
4. OUR EXECUTIVE REMUNERATION FRAMEWORK (continued)4.2. Executive Remuneration FrameworkThe diagram below outlines the remuneration components (other than any sign-on grants) for the 2018 financial year for all Executives. Further details regarding each of the remuneration components are provided in sections 4.3 to 4.5.
Remuneration Type Fixed Remuneration Variable / At-Risk Remuneration
Component Total Fixed Remuneration (TFR)
Short Term Incentive (STI) Long Term Incentive (LTI)
Delivery Delivered in cash Delivered in equity
Composition Base salary plus superannuation.
50% of STI outcomes paid in cash after the financial year.
50% of STI outcomes deferred as shares, with one half restricted for one year and the other half for two years.
Rights with a 3 year vesting period and one year holding lock.
Outcomes based on ROCE, comparative cost position and relative TSR.
Subject to clawback and overarching Board discretion.
Outcomes based on a combination of business performance and personal measures.
Subject to clawback and overarching Board discretion.
Link with strategic objectives
Set to attract, retain, motivate and reward high quality executive talent to deliver on the Company’s strategy.
Designed to:
• align interests of shareholders and Executives through an appropriate level of “at risk” pay;
• reward for increasing shareholder value by meeting or exceeding Company and individual objectives; and
• support the financial and strategic direction of the business through performance measures.
Designed to:
• align interests of shareholders and Executives through an appropriate level of “at risk” pay; and
• encourage Executives to focus on the key performance drivers which underpin the Company’s strategy to deliver long term growth in shareholder value.
The diagram below illustrates how the different components of remuneration provided in respect of the 2018 financial year are delivered over a four year period.
FY18
Salary
STI
LTI
FY19 FY20 FY21 FY22
Performance Period(12 months)
Performance Period(3 years)
Deferral
Holding lock
Deferral
50% cash
Paid Oct 2018
25% deferred shares
Vest Oct 2019
25% deferred shares
Vest Oct 2020
Awarded as Rights
Nov 2017
Vests as shares
Nov 2020
Unlocked
Nov 2021
Paid throughout year
76 DIRECTORS' REPORT
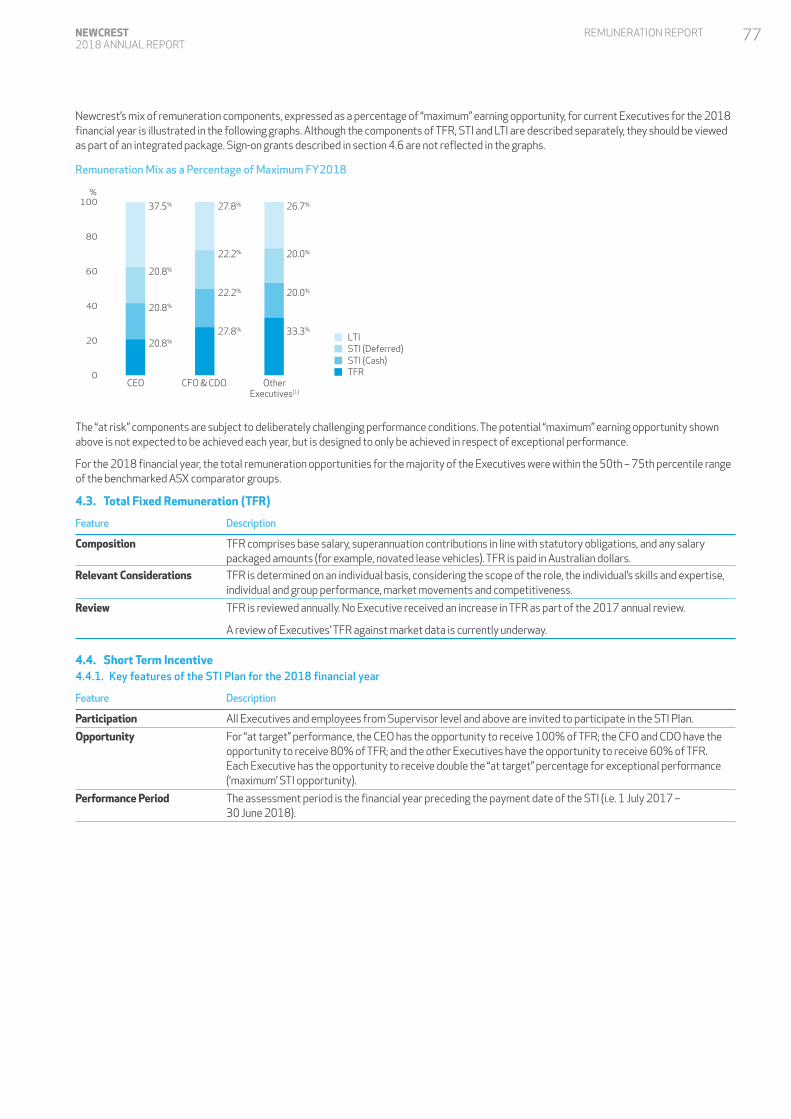
REMUNERATION REPORT
Newcrest’s mix of remuneration components, expressed as a percentage of “maximum” earning opportunity, for current Executives for the 2018 financial year is illustrated in the following graphs. Although the components of TFR, STI and LTI are described separately, they should be viewed as part of an integrated package. Sign-on grants described in section 4.6 are not reflected in the graphs.
0
20
40
60
80
100
Remuneration Mix as a Percentage of Maximum FY2018
CEO
20.8%
20.8%
20.8%
37.5%
27.8%
22.2%
22.2%
27.8%
33.3%
20.0%
20.0%
26.7%
CFO & CDO OtherExecutives(1)
LTI
TFRSTI (Cash)STI (Deferred)
%
The “at risk” components are subject to deliberately challenging performance conditions. The potential “maximum” earning opportunity shown above is not expected to be achieved each year, but is designed to only be achieved in respect of exceptional performance.
For the 2018 financial year, the total remuneration opportunities for the majority of the Executives were within the 50th – 75th percentile range of the benchmarked ASX comparator groups.
4.3. Total Fixed Remuneration (TFR)
Feature Description
Composition TFR comprises base salary, superannuation contributions in line with statutory obligations, and any salary packaged amounts (for example, novated lease vehicles). TFR is paid in Australian dollars.
Relevant Considerations TFR is determined on an individual basis, considering the scope of the role, the individual’s skills and expertise, individual and group performance, market movements and competitiveness.
Review TFR is reviewed annually. No Executive received an increase in TFR as part of the 2017 annual review.
A review of Executives’ TFR against market data is currently underway.
4.4. Short Term Incentive 4.4.1. Key features of the STI Plan for the 2018 financial year
Feature Description
Participation All Executives and employees from Supervisor level and above are invited to participate in the STI Plan.
Opportunity For “at target” performance, the CEO has the opportunity to receive 100% of TFR; the CFO and CDO have the opportunity to receive 80% of TFR; and the other Executives have the opportunity to receive 60% of TFR. Each Executive has the opportunity to receive double the “at target” percentage for exceptional performance (‘maximum’ STI opportunity).
Performance Period The assessment period is the financial year preceding the payment date of the STI (i.e. 1 July 2017 – 30 June 2018).
77NEWCREST 2018 ANNUAL REPORT
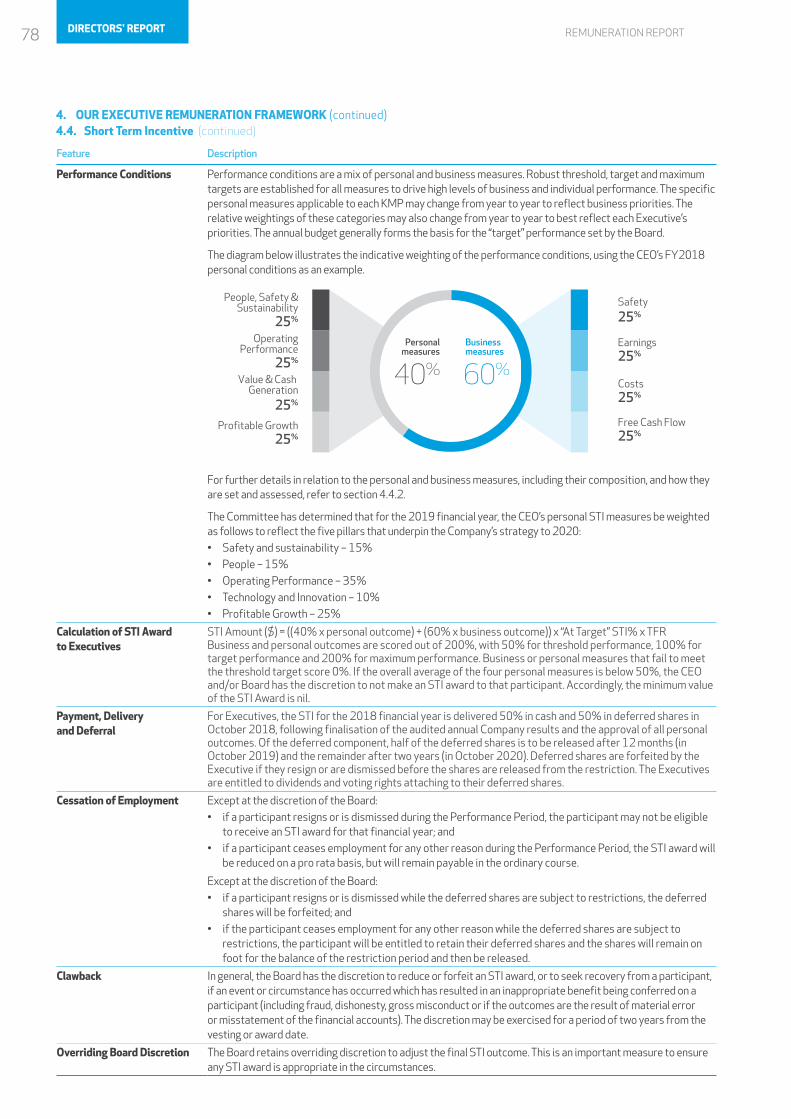
REMUNERATION REPORT
Feature Description
Performance Conditions Performance conditions are a mix of personal and business measures. Robust threshold, target and maximum targets are established for all measures to drive high levels of business and individual performance. The specific personal measures applicable to each KMP may change from year to year to reflect business priorities. The relative weightings of these categories may also change from year to year to best reflect each Executive’s priorities. The annual budget generally forms the basis for the “target” performance set by the Board.
The diagram below illustrates the indicative weighting of the performance conditions, using the CEO’s FY2018 personal conditions as an example.
Personalmeasures
40%
Businessmeasures
60%
Safety
25%
Earnings25%
Costs25%
Free Cash Flow25%
People, Safety &Sustainability
25%
OperatingPerformance
25%
Value & Cash Generation
25%
Profitable Growth25%
For further details in relation to the personal and business measures, including their composition, and how they are set and assessed, refer to section 4.4.2.
The Committee has determined that for the 2019 financial year, the CEO’s personal STI measures be weighted as follows to reflect the five pillars that underpin the Company’s strategy to 2020:• Safety and sustainability – 15%• People – 15%• Operating Performance – 35%• Technology and Innovation – 10%• Profitable Growth – 25%
Calculation of STI Award to Executives
STI Amount ($) = ((40% x personal outcome) + (60% x business outcome)) x “At Target” STI% x TFRBusiness and personal outcomes are scored out of 200%, with 50% for threshold performance, 100% for target performance and 200% for maximum performance. Business or personal measures that fail to meet the threshold target score 0%. If the overall average of the four personal measures is below 50%, the CEO and/or Board has the discretion to not make an STI award to that participant. Accordingly, the minimum value of the STI Award is nil.
Payment, Delivery and Deferral
For Executives, the STI for the 2018 financial year is delivered 50% in cash and 50% in deferred shares in October 2018, following finalisation of the audited annual Company results and the approval of all personal outcomes. Of the deferred component, half of the deferred shares is to be released after 12 months (in October 2019) and the remainder after two years (in October 2020). Deferred shares are forfeited by the Executive if they resign or are dismissed before the shares are released from the restriction. The Executives are entitled to dividends and voting rights attaching to their deferred shares.
Cessation of Employment Except at the discretion of the Board: • if a participant resigns or is dismissed during the Performance Period, the participant may not be eligible
to receive an STI award for that financial year; and• if a participant ceases employment for any other reason during the Performance Period, the STI award will
be reduced on a pro rata basis, but will remain payable in the ordinary course.
Except at the discretion of the Board:• if a participant resigns or is dismissed while the deferred shares are subject to restrictions, the deferred
shares will be forfeited; and• if the participant ceases employment for any other reason while the deferred shares are subject to
restrictions, the participant will be entitled to retain their deferred shares and the shares will remain on foot for the balance of the restriction period and then be released.
Clawback In general, the Board has the discretion to reduce or forfeit an STI award, or to seek recovery from a participant, if an event or circumstance has occurred which has resulted in an inappropriate benefit being conferred on a participant (including fraud, dishonesty, gross misconduct or if the outcomes are the result of material error or misstatement of the financial accounts). The discretion may be exercised for a period of two years from the vesting or award date.
Overriding Board Discretion The Board retains overriding discretion to adjust the final STI outcome. This is an important measure to ensure any STI award is appropriate in the circumstances.
4. OUR EXECUTIVE REMUNERATION FRAMEWORK (continued)4.4. Short Term Incentive (continued)
78 DIRECTORS' REPORT
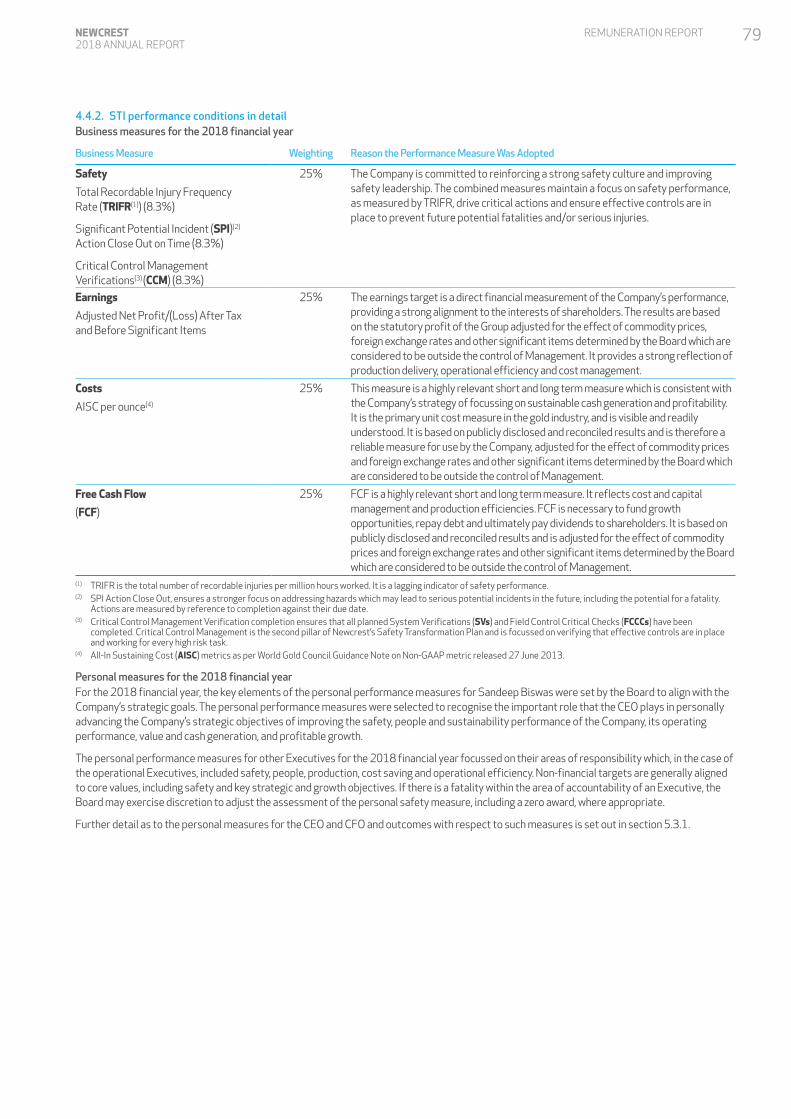
REMUNERATION REPORT
4.4.2. STI performance conditions in detail Business measures for the 2018 financial year
Business Measure Weighting Reason the Performance Measure Was Adopted
Safety
Total Recordable Injury Frequency Rate (TRIFR(1)) (8.3%)
Significant Potential Incident (SPI)(2) Action Close Out on Time (8.3%)
Critical Control Management Verifications(3) (CCM) (8.3%)
25% The Company is committed to reinforcing a strong safety culture and improving safety leadership. The combined measures maintain a focus on safety performance, as measured by TRIFR, drive critical actions and ensure effective controls are in place to prevent future potential fatalities and/or serious injuries.
Earnings
Adjusted Net Profit/(Loss) After Tax and Before Significant Items
25% The earnings target is a direct financial measurement of the Company’s performance, providing a strong alignment to the interests of shareholders. The results are based on the statutory profit of the Group adjusted for the effect of commodity prices, foreign exchange rates and other significant items determined by the Board which are considered to be outside the control of Management. It provides a strong reflection of production delivery, operational efficiency and cost management.
Costs
AISC per ounce(4)
25% This measure is a highly relevant short and long term measure which is consistent with the Company’s strategy of focussing on sustainable cash generation and profitability. It is the primary unit cost measure in the gold industry, and is visible and readily understood. It is based on publicly disclosed and reconciled results and is therefore a reliable measure for use by the Company, adjusted for the effect of commodity prices and foreign exchange rates and other significant items determined by the Board which are considered to be outside the control of Management.
Free Cash Flow
(FCF)
25% FCF is a highly relevant short and long term measure. It reflects cost and capital management and production efficiencies. FCF is necessary to fund growth opportunities, repay debt and ultimately pay dividends to shareholders. It is based on publicly disclosed and reconciled results and is adjusted for the effect of commodity prices and foreign exchange rates and other significant items determined by the Board which are considered to be outside the control of Management.
(1) TRIFR is the total number of recordable injuries per million hours worked. It is a lagging indicator of safety performance.(2) SPI Action Close Out, ensures a stronger focus on addressing hazards which may lead to serious potential incidents in the future, including the potential for a fatality.
Actions are measured by reference to completion against their due date.(3) Critical Control Management Verification completion ensures that all planned System Verifications (SVs) and Field Control Critical Checks (FCCCs) have been
completed. Critical Control Management is the second pillar of Newcrest’s Safety Transformation Plan and is focussed on verifying that effective controls are in place and working for every high risk task.
(4) All-In Sustaining Cost (AISC) metrics as per World Gold Council Guidance Note on Non-GAAP metric released 27 June 2013.
Personal measures for the 2018 financial yearFor the 2018 financial year, the key elements of the personal performance measures for Sandeep Biswas were set by the Board to align with the Company’s strategic goals. The personal performance measures were selected to recognise the important role that the CEO plays in personally advancing the Company’s strategic objectives of improving the safety, people and sustainability performance of the Company, its operating performance, value and cash generation, and profitable growth.
The personal performance measures for other Executives for the 2018 financial year focussed on their areas of responsibility which, in the case of the operational Executives, included safety, people, production, cost saving and operational efficiency. Non-financial targets are generally aligned to core values, including safety and key strategic and growth objectives. If there is a fatality within the area of accountability of an Executive, the Board may exercise discretion to adjust the assessment of the personal safety measure, including a zero award, where appropriate.
Further detail as to the personal measures for the CEO and CFO and outcomes with respect to such measures is set out in section 5.3.1.
79NEWCREST 2018 ANNUAL REPORT
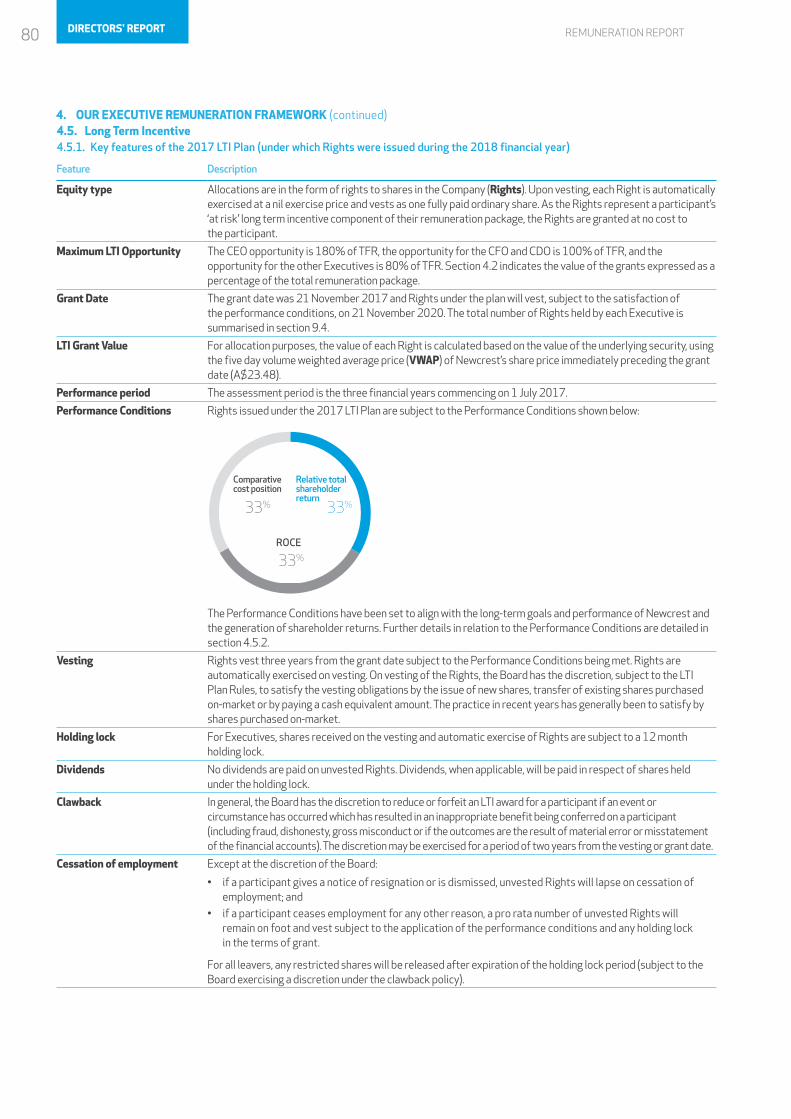
REMUNERATION REPORT
4.5. Long Term Incentive 4.5.1. Key features of the 2017 LTI Plan (under which Rights were issued during the 2018 financial year)
Feature Description
Equity type Allocations are in the form of rights to shares in the Company (Rights). Upon vesting, each Right is automatically exercised at a nil exercise price and vests as one fully paid ordinary share. As the Rights represent a participant’s ‘at risk’ long term incentive component of their remuneration package, the Rights are granted at no cost to the participant.
Maximum LTI Opportunity The CEO opportunity is 180% of TFR, the opportunity for the CFO and CDO is 100% of TFR, and the opportunity for the other Executives is 80% of TFR. Section 4.2 indicates the value of the grants expressed as a percentage of the total remuneration package.
Grant Date The grant date was 21 November 2017 and Rights under the plan will vest, subject to the satisfaction of the performance conditions, on 21 November 2020. The total number of Rights held by each Executive is summarised in section 9.4.
LTI Grant Value For allocation purposes, the value of each Right is calculated based on the value of the underlying security, using the five day volume weighted average price (VWAP) of Newcrest’s share price immediately preceding the grant date (A$23.48).
Performance period The assessment period is the three financial years commencing on 1 July 2017.
Performance Conditions Rights issued under the 2017 LTI Plan are subject to the Performance Conditions shown below:
Comparativecost position
Relative total shareholder return
ROCE
33% 33%
33%
The Performance Conditions have been set to align with the long-term goals and performance of Newcrest and the generation of shareholder returns. Further details in relation to the Performance Conditions are detailed in section 4.5.2.
Vesting Rights vest three years from the grant date subject to the Performance Conditions being met. Rights are automatically exercised on vesting. On vesting of the Rights, the Board has the discretion, subject to the LTI Plan Rules, to satisfy the vesting obligations by the issue of new shares, transfer of existing shares purchased on-market or by paying a cash equivalent amount. The practice in recent years has generally been to satisfy by shares purchased on-market.
Holding lock For Executives, shares received on the vesting and automatic exercise of Rights are subject to a 12 month holding lock.
Dividends No dividends are paid on unvested Rights. Dividends, when applicable, will be paid in respect of shares held under the holding lock.
Clawback In general, the Board has the discretion to reduce or forfeit an LTI award for a participant if an event or circumstance has occurred which has resulted in an inappropriate benefit being conferred on a participant (including fraud, dishonesty, gross misconduct or if the outcomes are the result of material error or misstatement of the financial accounts). The discretion may be exercised for a period of two years from the vesting or grant date.
Cessation of employment Except at the discretion of the Board:
• if a participant gives a notice of resignation or is dismissed, unvested Rights will lapse on cessation of employment; and
• if a participant ceases employment for any other reason, a pro rata number of unvested Rights will remain on foot and vest subject to the application of the performance conditions and any holding lock in the terms of grant.
For all leavers, any restricted shares will be released after expiration of the holding lock period (subject to the Board exercising a discretion under the clawback policy).
4. OUR EXECUTIVE REMUNERATION FRAMEWORK (continued)
80 DIRECTORS' REPORT
REMUNERATION REPORT
Change of control The Board may exercise its discretion to allow all or some unvested Rights to vest if a change of control event occurs.
Retesting There is no retesting. Rights that do not vest based on performance over the three year performance period will lapse on the third anniversary of the grant date.
Overriding Board discretion The Board retains overriding discretion to adjust the final LTI outcome. This is an important measure to ensure any LTI award is appropriate in the circumstances.
4.5.2. 2017 LTI performance conditions in detail2017 LTI Performance Conditions
Component Assessment Reason the Performance Measure Was Adopted
Comparative Cost Position
The Company’s measure for the Comparative Cost Position performance condition is the AISC per ounce, adopted by the Company in relation to costs reporting.
The AISC per ounce incorporates costs related to sustaining production.
Performance over the three year performance period, is compared against other entities based on data sourced from an independent provider selected by the Board. The entities that are included in the independent provider’s database can change from year to year (such as where additional companies begin to report AISC, or where there are mergers and demergers). Cost performance for each of the three years of the performance period is averaged to determine the number of Rights that may be exercised in relation to this performance measure.
The vesting scale for this measure is as follows:
• 0% vests if Comparative Costs are at or above the 50th percentile;
• 40% vests if Comparative Costs are less than the 50th percentile, but at or above the 25th percentile;
• 100% vests if Comparative Costs are below the 25th percentile.
Straight line vesting occurs between these thresholds.
The Comparative Costs measure will be assessed using peer data for the period from 1 July 2017 until 30 June 2020.
This measure is closely aligned to Newcrest’s strategic objective to be a low cost producer and aligned to our relative value proposition for gold equity investors.
The AISC per ounce result is a sound basis for the Company to use in assessing comparative cost as it is based on publicly disclosed results.
Return on Capital Employed (ROCE)
ROCE is an absolute measure, defined as underlying earnings before interest and tax (EBIT), divided by average capital employed, being shareholders’ equity plus net debt.
For each of the three years of the performance period ROCE is averaged to determine the number of Rights that may be exercised in relation to this performance measure.
Average capital employed is calculated as a simple average of opening and closing balances. If material equity transactions (for example, significant equity issuances or asset impairments) occur such that the simple average is not representative of actual performance, the average capital employed for the year is adjusted for the effect of these transactions.
Average capital employed for the purpose of this calculation excludes approved capital invested in long-dated projects until commercial production is achieved, so as not to discourage Management’s pursuit of long-dated growth options.
The vesting scale for this measure is as follows:
• 0% vests if ROCE is less than 6%; • 30% vests if ROCE is 6%; • 100% vests if ROCE is 13% or more;
Straight line vesting occurs between these thresholds.
ROCE aligns Management action and company outcomes closely with long term shareholder value. ROCE provides a balance to the other LTI metrics as it serves as a counter to “buying” success.
ROCE is also based on publicly disclosed and reconciled results and is therefore a sound basis for the Company to use in assessing value.
Impairments are excluded from the capital base in the year in which they occur, such that the return is on a pre-impairment basis and LTI participants do not benefit from the impairment. However, the post impairment capital base is used in the calculation of returns in subsequent years so as to not de-incentivise current or new management.
81NEWCREST 2018 ANNUAL REPORT
REMUNERATION REPORT
Relative TSR
Total Shareholder Return (TSR) is a measure of performance over time that combines share price appreciation and dividends paid to show the total return to the shareholder, expressed as an annualized percentage. Relative TSR is a measure of the Company’s TSR performance against that of other gold companies.
Relative TSR will be measured by comparing Newcrest’s AUD share price performance against the S&P TSX Global Gold Index over three years.
Relative TSR will be assessed by averaging performance over the six month period immediately prior to the start (1 January 2017 – 30 June 2017) and the end (1 January 2020 – 30 June 2020) of the performance period.
The treatment of dividend and capital adjustments will be in accordance with the adjustments made by the data provider.
The vesting schedule for this measure is detailed below.
• 0% vests if Relative TSR is below the Index;• 50% vests if Relative TSR is equal to
the Index;• 100% vests if Relative TSR exceeds the
Index by 18 percentage points or more.
Straight line vesting occurs between these thresholds.
The Relative TSR measure provides alignment between the outcomes of the Plan and the returns experienced by shareholders, in order to specifically encourage outperformance against other gold mining companies.
The S&P TSX Global Gold Index is the most appropriate comparison point for Newcrest to use for the Relative TSR measure because:
• As a gold mining company, Newcrest’s share price performance is significantly impacted by fluctuations in the gold price. Accordingly, it is appropriate to compare Newcrest’s performance to that of other gold mining companies.
• There are few ASX-listed gold mining companies which act as a directly relevant comparison to Newcrest given the differences in scale, and it is therefore considered that a comparison with international peers is more appropriate.
• Rather than hand-pick a selection of peer gold mining companies from various stock exchanges globally, the Board considers that Newcrest’s performance should be compared to the S&P TSX Global Gold Index as each of Newcrest’s major peers are constituents in the S&P TSX Global Gold Index.
4.5.3. Outlook for 2018 LTI Performance Conditions (2019 financial year)For grants made during the 2019 financial year, the LTI Performance Conditions will be structurally identical to those which apply to the 2017 LTI Plan.
4.6. Sign-on grants No sign-on rights were issued during the 2018 financial year. However, the following sign-on arrangements detailed in the 2017 Remuneration Report continued to apply.
Name Grant Date Original grantVested in FY2018 Yet to vest Conditions to vesting
Michael Nossal 27 April 2015 116,730 rights plus A$225,000 (US$174,000) cash
58,365 rights vested on 17 August 2017
Nil No performance conditions except continuing employment (other than in limited circumstances).
Ian Kemish 6 June 2016 18,993 rights plus A$80,000 (US$62,000) cash
A$80,000 (US$62,000) cash in July 2017
9,740 rights due to vest on 24 November 2018 (or as soon as possible afterwards in accordance with the Securities Dealing Policy)
4,870 rights expected to vest on 28 August 2018 (or as soon as possible afterwards in accordance with the Securities Dealing Policy)
Subject to adequate performance and continuing employment (other than in limited circumstances).
Craig Jones 31 January 2017 15,845 rights Nil 15,845 rights expected to vest on 28 August 2018 (or as soon as possible afterwards in accordance with the Securities Dealing Policy)
Subject to meeting performance objectives, overall adequate performance and continuing employment (other than in limited circumstances).
The above sign-on payments and grants of rights are detailed in section 9 of this report. The minimum value of sign-on payments that have not yet been made or are unvested is nil, if the performance / service conditions are not met. All sign-on rights were granted at no cost and have a nil exercise price.
4. OUR EXECUTIVE REMUNERATION FRAMEWORK (continued)4.5. Long Term Incentive (continued)
82 DIRECTORS' REPORT
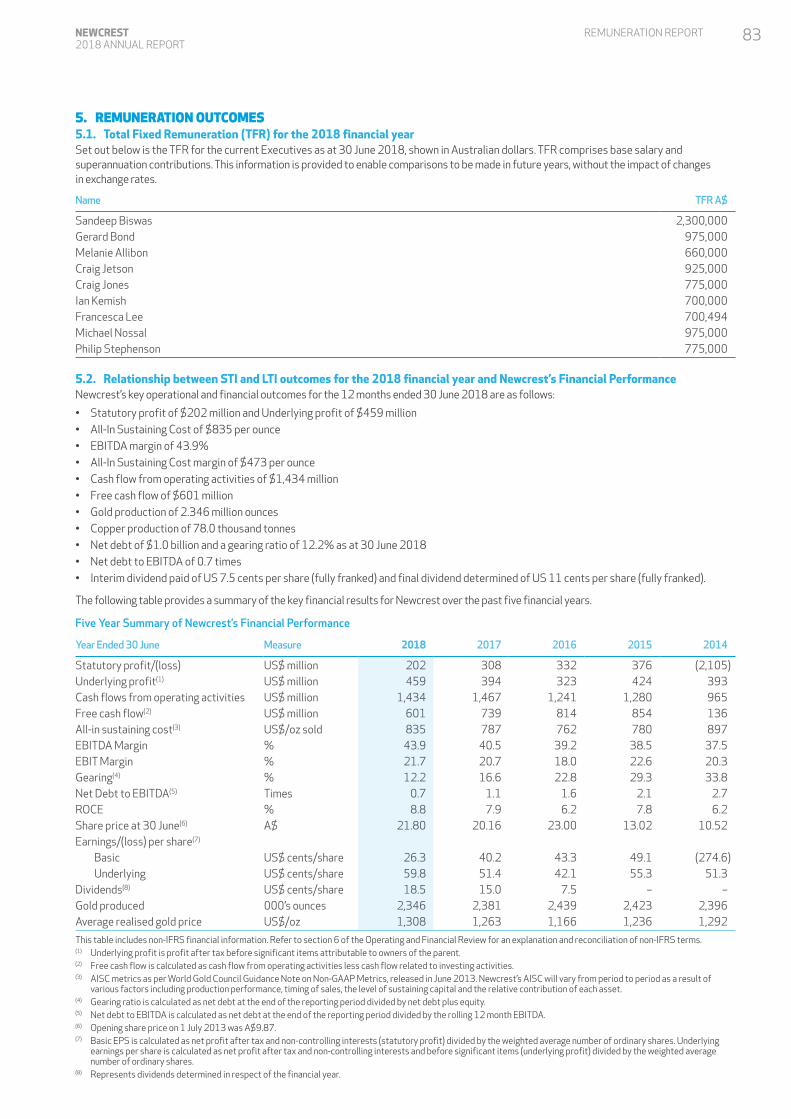
REMUNERATION REPORT
5. REMUNERATION OUTCOMES5.1. Total Fixed Remuneration (TFR) for the 2018 financial yearSet out below is the TFR for the current Executives as at 30 June 2018, shown in Australian dollars. TFR comprises base salary and superannuation contributions. This information is provided to enable comparisons to be made in future years, without the impact of changes in exchange rates.
Name TFR A$
Sandeep Biswas 2,300,000Gerard Bond 975,000Melanie Allibon 660,000Craig Jetson 925,000Craig Jones 775,000Ian Kemish 700,000Francesca Lee 700,494Michael Nossal 975,000Philip Stephenson 775,000
5.2. Relationship between STI and LTI outcomes for the 2018 financial year and Newcrest’s Financial PerformanceNewcrest’s key operational and financial outcomes for the 12 months ended 30 June 2018 are as follows:
• Statutory profit of $202 million and Underlying profit of $459 million• All-In Sustaining Cost of $835 per ounce• EBITDA margin of 43.9%• All-In Sustaining Cost margin of $473 per ounce • Cash flow from operating activities of $1,434 million• Free cash flow of $601 million• Gold production of 2.346 million ounces• Copper production of 78.0 thousand tonnes• Net debt of $1.0 billion and a gearing ratio of 12.2% as at 30 June 2018• Net debt to EBITDA of 0.7 times• Interim dividend paid of US 7.5 cents per share (fully franked) and final dividend determined of US 11 cents per share (fully franked).
The following table provides a summary of the key financial results for Newcrest over the past five financial years.
Five Year Summary of Newcrest’s Financial Performance
Year Ended 30 June Measure 2018 2017 2016 2015 2014
Statutory profit/(loss) US$ million 202 308 332 376 (2,105)Underlying profit(1) US$ million 459 394 323 424 393Cash flows from operating activities US$ million 1,434 1,467 1,241 1,280 965Free cash flow(2) US$ million 601 739 814 854 136All-in sustaining cost(3) US$/oz sold 835 787 762 780 897EBITDA Margin % 43.9 40.5 39.2 38.5 37.5EBIT Margin % 21.7 20.7 18.0 22.6 20.3Gearing(4) % 12.2 16.6 22.8 29.3 33.8Net Debt to EBITDA(5) Times 0.7 1.1 1.6 2.1 2.7ROCE % 8.8 7.9 6.2 7.8 6.2Share price at 30 June(6) A$ 21.80 20.16 23.00 13.02 10.52Earnings/(loss) per share(7)
Basic US$ cents/share 26.3 40.2 43.3 49.1 (274.6) Underlying US$ cents/share 59.8 51.4 42.1 55.3 51.3Dividends(8) US$ cents/share 18.5 15.0 7.5 – –Gold produced 000’s ounces 2,346 2,381 2,439 2,423 2,396Average realised gold price US$/oz 1,308 1,263 1,166 1,236 1,292
This table includes non-IFRS financial information. Refer to section 6 of the Operating and Financial Review for an explanation and reconciliation of non-IFRS terms.(1) Underlying profit is profit after tax before significant items attributable to owners of the parent. (2) Free cash flow is calculated as cash flow from operating activities less cash flow related to investing activities.(3) AISC metrics as per World Gold Council Guidance Note on Non-GAAP Metrics, released in June 2013. Newcrest’s AISC will vary from period to period as a result of
various factors including production performance, timing of sales, the level of sustaining capital and the relative contribution of each asset.(4) Gearing ratio is calculated as net debt at the end of the reporting period divided by net debt plus equity.(5) Net debt to EBITDA is calculated as net debt at the end of the reporting period divided by the rolling 12 month EBITDA.(6) Opening share price on 1 July 2013 was A$9.87.(7) Basic EPS is calculated as net profit after tax and non-controlling interests (statutory profit) divided by the weighted average number of ordinary shares. Underlying
earnings per share is calculated as net profit after tax and non-controlling interests and before significant items (underlying profit) divided by the weighted average number of ordinary shares.
(8) Represents dividends determined in respect of the financial year.
83NEWCREST 2018 ANNUAL REPORT
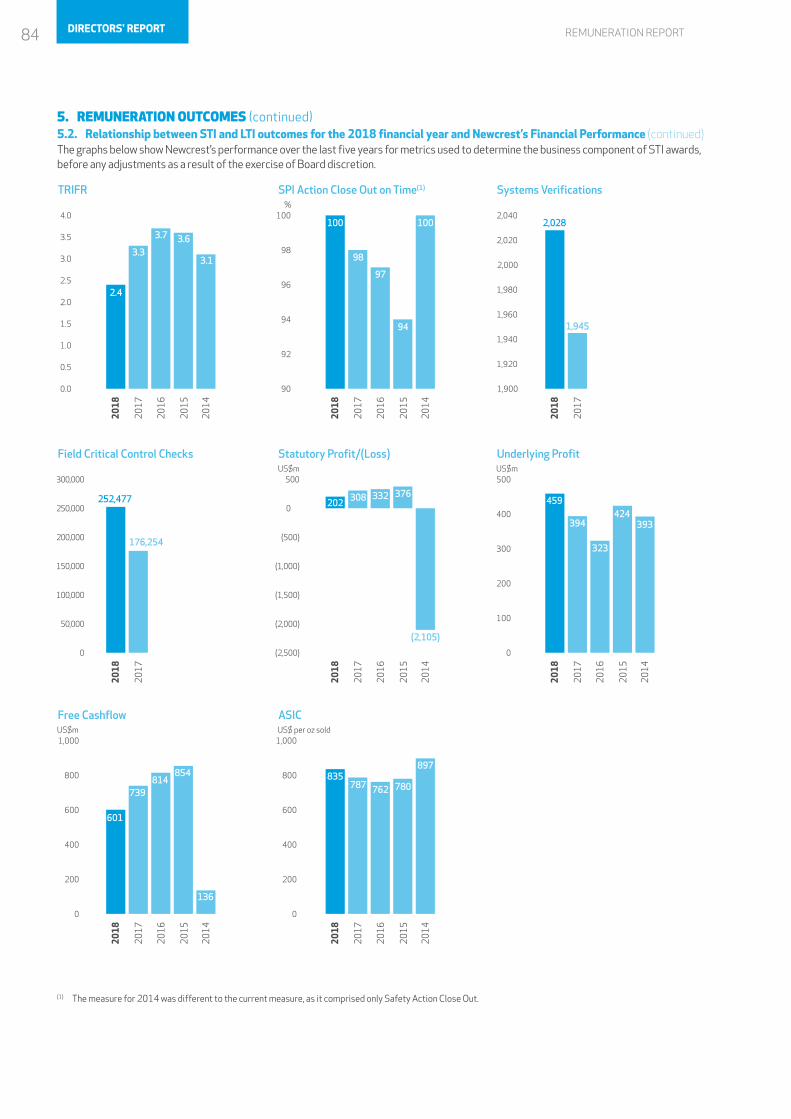
REMUNERATION REPORT
5. REMUNERATION OUTCOMES (continued)5.2. Relationship between STI and LTI outcomes for the 2018 financial year and Newcrest’s Financial Performance (continued)The graphs below show Newcrest’s performance over the last five years for metrics used to determine the business component of STI awards, before any adjustments as a result of the exercise of Board discretion.
0.0
0.5
1.0
1.5
2.0
2.5
3.0
3.5
4.0
TRIFR
2018
20
17
20
16
20
15
20
14
SPI Action Close Out on Time(1)
3.3
2.4
3.7 3.6
3.1
1,900
1,920
1,940
1,960
1,980
2,000
2,020
2,040
Systems Verifications
2018
20
17
1,945
2,0283.7 3.6
3.1
90
92
94
96
98
100
2018
20
17
20
16
20
15
20
14
98
100
97
94
100
%
0
200
400
600
800
1,000
Free Cashflow
2018
20
17
20
16
20
15
20
14
ASIC
739
601
814854
136
0
200
400
600
800
1,000
2018
20
17
20
16
20
15
20
14
787835
762 780
897
US$ per oz sold
0
50,000
100,000
150,000
200,000
250,000
300,000
Field Critical Control Checks
2018
20
17
Statutory Profit/(Loss)
176,254
252,477 3.7 3.6
3.1
0
100
200
300
400
500
Underlying Profit
2018
20
17
424
(2,500)
(2,000)
(1,500)
(1,000)
(500)
0
500
2018
20
17
20
16
20
15
20
14
20
16
20
15
20
14
308202 459
394
323
393
332 376
(2,105)
US$m
US$m
US$m
(1) The measure for 2014 was different to the current measure, as it comprised only Safety Action Close Out.
84 DIRECTORS' REPORT
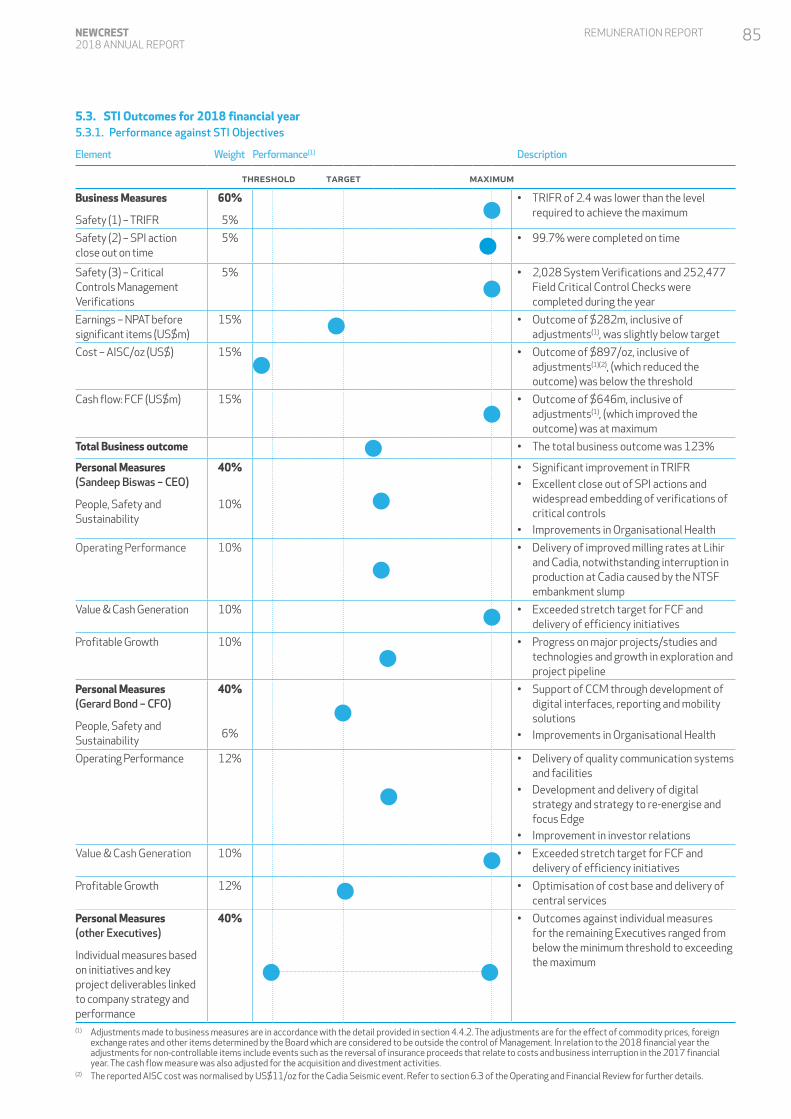
REMUNERATION REPORT
5.3. STI Outcomes for 2018 financial year5.3.1. Performance against STI Objectives
Element Weight Performance(1) Description
Business Measures
Safety (1) – TRIFR
60%
5%
• TRIFR of 2.4 was lower than the level required to achieve the maximum
Safety (2) – SPI action close out on time
5% • 99.7% were completed on time
Safety (3) – Critical Controls Management Verifications
5% • 2,028 System Verifications and 252,477 Field Critical Control Checks were completed during the year
Earnings – NPAT before significant items (US$m)
15% • Outcome of $282m, inclusive of adjustments(1), was slightly below target
Cost – AISC/oz (US$) 15% • Outcome of $897/oz, inclusive of adjustments(1)(2), (which reduced the outcome) was below the threshold
Cash flow: FCF (US$m) 15% • Outcome of $646m, inclusive of adjustments(1), (which improved the outcome) was at maximum
Total Business outcome • The total business outcome was 123%
Personal Measures (Sandeep Biswas – CEO)
People, Safety and Sustainability
40%
10%
• Significant improvement in TRIFR• Excellent close out of SPI actions and
widespread embedding of verifications of critical controls
• Improvements in Organisational Health
Operating Performance 10% • Delivery of improved milling rates at Lihir and Cadia, notwithstanding interruption in production at Cadia caused by the NTSF embankment slump
Value & Cash Generation 10% • Exceeded stretch target for FCF and delivery of efficiency initiatives
Profitable Growth 10% • Progress on major projects/studies and technologies and growth in exploration and project pipeline
Personal Measures (Gerard Bond – CFO)
People, Safety and Sustainability
40%
6%
• Support of CCM through development of digital interfaces, reporting and mobility solutions
• Improvements in Organisational Health
Operating Performance 12% • Delivery of quality communication systems and facilities
• Development and delivery of digital strategy and strategy to re-energise and focus Edge
• Improvement in investor relations
Value & Cash Generation 10% • Exceeded stretch target for FCF and delivery of efficiency initiatives
Profitable Growth 12% • Optimisation of cost base and delivery of central services
Personal Measures (other Executives)
Individual measures based on initiatives and key project deliverables linked to company strategy and performance
40% • Outcomes against individual measures for the remaining Executives ranged from below the minimum threshold to exceeding the maximum
(1) Adjustments made to business measures are in accordance with the detail provided in section 4.4.2. The adjustments are for the effect of commodity prices, foreign exchange rates and other items determined by the Board which are considered to be outside the control of Management. In relation to the 2018 financial year the adjustments for non-controllable items include events such as the reversal of insurance proceeds that relate to costs and business interruption in the 2017 financial year. The cash flow measure was also adjusted for the acquisition and divestment activities.
(2) The reported AISC cost was normalised by US$11/oz for the Cadia Seismic event. Refer to section 6.3 of the Operating and Financial Review for further details.
threshold target maximum
150125 175 2001007550
85NEWCREST 2018 ANNUAL REPORT
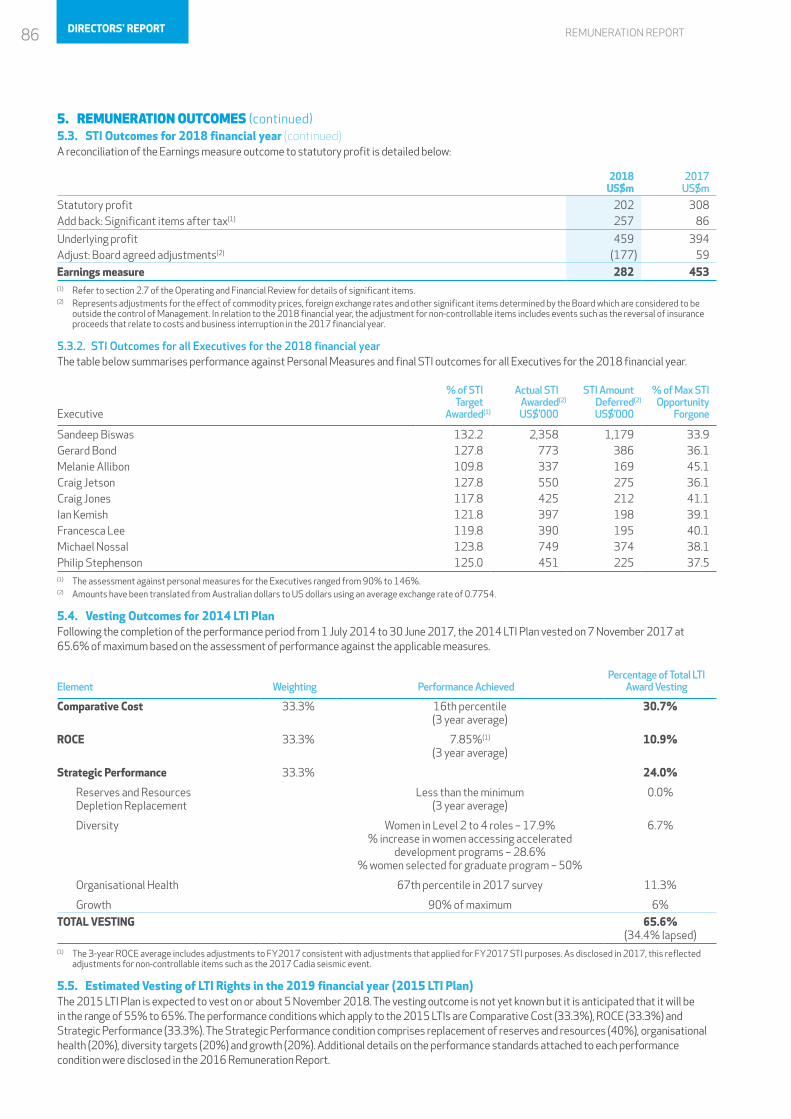
REMUNERATION REPORT
5. REMUNERATION OUTCOMES (continued)5.3. STI Outcomes for 2018 financial year (continued)A reconciliation of the Earnings measure outcome to statutory profit is detailed below:
2018US$m
2017US$m
Statutory profit 202 308Add back: Significant items after tax(1) 257 86
Underlying profit 459 394Adjust: Board agreed adjustments(2) (177) 59
Earnings measure 282 453(1) Refer to section 2.7 of the Operating and Financial Review for details of significant items.(2) Represents adjustments for the effect of commodity prices, foreign exchange rates and other significant items determined by the Board which are considered to be
outside the control of Management. In relation to the 2018 financial year, the adjustment for non-controllable items includes events such as the reversal of insurance proceeds that relate to costs and business interruption in the 2017 financial year.
5.3.2. STI Outcomes for all Executives for the 2018 financial yearThe table below summarises performance against Personal Measures and final STI outcomes for all Executives for the 2018 financial year.
Executive
% of STITarget
Awarded(1)
Actual STIAwarded(2)
US$’000
STI AmountDeferred(2)
US$’000
% of Max STIOpportunity
Forgone
Sandeep Biswas 132.2 2,358 1,179 33.9Gerard Bond 127.8 773 386 36.1Melanie Allibon 109.8 337 169 45.1Craig Jetson 127.8 550 275 36.1Craig Jones 117.8 425 212 41.1Ian Kemish 121.8 397 198 39.1Francesca Lee 119.8 390 195 40.1Michael Nossal 123.8 749 374 38.1Philip Stephenson 125.0 451 225 37.5(1) The assessment against personal measures for the Executives ranged from 90% to 146%.(2) Amounts have been translated from Australian dollars to US dollars using an average exchange rate of 0.7754.
5.4. Vesting Outcomes for 2014 LTI PlanFollowing the completion of the performance period from 1 July 2014 to 30 June 2017, the 2014 LTI Plan vested on 7 November 2017 at 65.6% of maximum based on the assessment of performance against the applicable measures.
Element Weighting Performance AchievedPercentage of Total LTI
Award Vesting
Comparative Cost 33.3% 16th percentile (3 year average)
30.7%
ROCE 33.3% 7.85%(1)
(3 year average)10.9%
Strategic Performance 33.3% 24.0%
Reserves and Resources Depletion Replacement
Less than the minimum (3 year average)
0.0%
Diversity Women in Level 2 to 4 roles – 17.9%% increase in women accessing accelerated
development programs – 28.6%% women selected for graduate program – 50%
6.7%
Organisational Health 67th percentile in 2017 survey 11.3%
Growth 90% of maximum 6%
TOTAL VESTING 65.6% (34.4% lapsed)
(1) The 3-year ROCE average includes adjustments to FY2017 consistent with adjustments that applied for FY2017 STI purposes. As disclosed in 2017, this reflected adjustments for non-controllable items such as the 2017 Cadia seismic event.
5.5. Estimated Vesting of LTI Rights in the 2019 financial year (2015 LTI Plan) The 2015 LTI Plan is expected to vest on or about 5 November 2018. The vesting outcome is not yet known but it is anticipated that it will be in the range of 55% to 65%. The performance conditions which apply to the 2015 LTIs are Comparative Cost (33.3%), ROCE (33.3%) and Strategic Performance (33.3%). The Strategic Performance condition comprises replacement of reserves and resources (40%), organisational health (20%), diversity targets (20%) and growth (20%). Additional details on the performance standards attached to each performance condition were disclosed in the 2016 Remuneration Report.
86 DIRECTORS' REPORT
REMUNERATION REPORT
6. EXECUTIVE SERVICE AGREEMENTS AND TERMINATION ARRANGEMENTSRemuneration and other terms of employment for the Executives are formalised in Executive Service Agreements (ESAs). Each of the ESAs provides for the payment of fixed and performance based at risk remuneration, employer superannuation contributions, other benefits such as, death and disablement insurance cover via the Newcrest Superannuation Plan, and salary continuance cover. The ESAs do not have a fixed end date. The remuneration for each Executive during the 2018 financial year is detailed in sections 2.2 and 9.1, and positions held are detailed in section 1.
Each ESA provides that the Executive may terminate their employment by giving the Company:
(a) in the case of Sandeep Biswas, Gerard Bond, Francesca Lee, Ian Kemish and Michael Nossal, three months’ notice; and(b) in the case of Melanie Allibon, Craig Jetson, Craig Jones and Philip Stephenson, six months’ notice.
The difference in notice period for the Executives has arisen due to a general change in policy. Those Executives mentioned in paragraph (b) above entered into ESAs following the change in policy.
The Company may terminate the Executive’s employment by giving 12 months’ notice and the Company may, at its discretion, elect to pay the Executive an amount in lieu of notice for any portion of the 12 months not worked.
The Company may terminate an Executive’s employment without notice at any time for cause. No payment in lieu of notice, or any payment in respect of STI or LTI is payable under the ESA in this circumstance.
On cessation of employment, STI or LTI awards vest in accordance with the relevant Plan Rules. Refer to sections 4.4 and 4.5 for further details.
7. NON-EXECUTIVE DIRECTORS’ REMUNERATION7.1. Remuneration PolicyThe Non-Executive Director (NED) fees and other terms are set by the Board. NEDs are paid by way of a fixed Director’s fee and Committee fees commensurate with their respective time commitments and responsibilities. The level and structure of the fees is based upon the need for the Company to attract and retain NEDs of suitable calibre, the demands of the role and prevailing market conditions.
In order to maintain impartiality and independence, NEDs do not receive any performance-related remuneration and are not entitled to participate in the Company’s short and long term incentive schemes. NEDs are not provided with any retirement benefits, other than statutory superannuation contributions.
7.2. Fee PoolThe maximum amount of fees (including superannuation contributions) that can be paid to NEDs is capped by a pool approved by shareholders. At the Annual General Meeting held on 28 October 2010, shareholders approved the current fee pool of A$2,700,000 per annum (US$2,093,580 using the average exchange rate of 0.7754 for the 2018 financial year).
7.3. Fee StructureIn reviewing the level of fees, the Board obtained independent market data from its remuneration adviser, KPMG, in relation to ASX listed companies with market capitalisations ranked between 11–40. No change was made to base Board fees. However, as the majority of Committee fees had fallen below the median, a 10% increase in Committee fees was approved, with effect from the commencement of the 2019 financial year (equating to an increase for each NED, other than the Chairman who does not receive Committee fees, in the range of 0.9% to 2.6%, based on the aggregate of Board and Committee fees received by the NED). This was the first increase in NED fees since 1 January 2011. The aggregate fees immediately following the increases are 30.1% below the aggregate fee pool approved by shareholders.
The table below outlines the main Board and Committee fees as at 30 June 2018, prior to the 10% increase in Committee fees taking effect.
Per AnnumA$’000
Per AnnumUS$’000(1)
Board Fees Chairperson(2) 600 465Non-Executive Directors 200 155
Committee Fees Audit & Risk CommitteeChairperson 50 39Members 25 19
Safety & Sustainability CommitteeChairperson 40 31Members 20 16
HRR CommitteeChairperson 40 31Members 20 16
(1) Board and Committee fees have been translated from Australian dollars to US dollars using an average exchange rate of 0.7754 for the 2018 financial year.(2) The Chairperson of the Board does not receive any additional payments for his role as Chair or Member of any Committee.
Under the Company’s Constitution, NEDs may be reimbursed for reasonable travel, accommodation and other expenses incurred while engaged on the business of the Company. NEDs may also be remunerated for additional services, for example, if they undertake specialist or consulting work on behalf of the Company outside the scope of their normal Director’s duties. No fees for additional services were paid to NEDs for the current or prior financial year.
87NEWCREST 2018 ANNUAL REPORT
REMUNERATION REPORT
8. SHAREHOLDINGS
8.1. Minimum Shareholding Policy The Company’s Minimum Shareholding Requirement Policy requires that:
Minimum requirementDeadline
(from the later of appointment or 1 July 2015)
CEO 100% of TFR in shares 5 yearsExecutives 50% of TFR in shares 5 yearsNEDs One year’s total annual fees in shares 3 years
8.2. Executive Shareholdings A summary of current shareholdings of Executives, including their closely related parties, as at 30 June 2018 are set out below.
Executive Openingbalance(1)
Granted asremuneration(2)
Acquired onexercise of
Rights(3) Net other
movements(4)Closingbalance
Value as at30 June 2018(5)
A$’000
Percentage ofTFR
%
Sandeep Biswas 269,345 73,066 255,885 (43,636) 554,660 12,092 526Gerard Bond 82,149 24,274 68,124 (5,588) 168,959 3,683 378Melanie Allibon 5,000 4,600 – – 9,600 209 32Craig Jetson 12,998 15,036 13,361 (4,483) 36,912 805 87Craig Jones 40,912 14,350 57,147 – 112,409 2,451 316Ian Kemish – 11,908 – – 11,908 260 37Francesca Lee 12,948 11,530 41,564 – 66,042 1,440 206Michael Nossal 52,368 22,836 58,365 (28,365) 105,204 2,293 235Philip Stephenson 10,844 11,916 12,237 – 34,997 763 98(1) Opening balance is as at 1 July 2017 for all Executives.(2) Remuneration granted in FY2018 includes shares allocated in respect of the deferral of 50% of an Executive’s STI award for the 2017 STI Plan. The number of shares
granted was determined by using the 5 day VWAP of A$21.6884, calculated over the period 5 to 11 October 2017, being the five trading days prior to the date the cash STI payment was made (12 October 2017). Vesting of deferred shares remains subject to service.
(3) Shares acquired on exercise of rights represents the shares acquired on vesting and automatic exercise of Rights under the 2014 LTI Plan. The amount included for Michael Nossal includes the vesting of sign-on rights as detailed in section 4.6.
(4) Net other movements represents the sale or purchase of shares by Executives.(5) Based on closing share price as at 29 June 2018 of A$21.80.
8.3. Non-Executive Directors’ Shareholdings A summary of current shareholdings of NEDs, including their closely related parties, as at 30 June 2018 are set out below.
Non-Executive DirectorsOpeningbalance(1)
Net otherMovements
Closingbalance(2)
Value as at 30 June 2018(3)
A$’000
Percentageof ongoing
annual fees%
Peter Hay 52,451 1,496 53,947 1,176 196
Philip Aiken 17,924 163 18,087 394 151
Roger Higgins 12,294 59 12,353 269 122
Rick Lee 28,447 – 28,447 620 234
Xiaoling Liu 10,000 3000 13,000 283 116Vickki McFadden 10,000 – 10,000 218 86
Former Non-Executive DirectorsWinifred Kamit 326 1,310 1,636 N/A N/AJohn Spark 32,192 44 32,236 N/A N/A(1) Opening balance is as at 1 July 2017.(2) For current Non-Executive Directors, the closing balance is as at 30 June 2018. For former Non-Executive Directors, the closing balance is as at the date of their departure.(3) Based on closing share price as at 29 June 2018 of A$21.80.
8.4. Securities Dealing PolicyThe Company has a Securities Dealing Policy which prohibits the use by Directors, Executives and employees of hedging and derivatives such as caps, collars, warrants or similar products in relation to Newcrest securities, including shares acquired under the Company’s equity incentive schemes, whether or not they are vested. The Policy also prohibits entry into transactions in associated products that operate to limit the economic risk of their security or interest holdings in the Company. Employees are not permitted to enter into margin loans in relation to Newcrest securities at any time without prior approval from the Chairman or Company Secretary. It is available on the Company’s website at: www.newcrest.com.au/about-us/corporate-governance.
88 DIRECTORS' REPORT
REMUNERATION REPORT
9. STATUTORY TABLES
9.1. Executive Remuneration
Short Term Long TermPost-
Employment Share-Based Payments
Executives Salary
ShortTerm
Incentive
OtherCash
BenefitsOther
Benefits LeaveSuper-
annuationLTI
RightsSTI
Deferral Other Total
Perfor-mance
related(A) (B) (C) (D) (E) (F) (G) (H) (I) (J)
US$’000 US$’000 US$’000 US$’000 US$’000 US$’000 US$’000 US$’000 US$’000 US$’000 %
2018Sandeep Biswas 1,768 1,179 45 49 20 16 2,146 1,191 – 6,414 70.4Gerard Bond 740 386 – 11 6 16 555 379 – 2,093 63.1Melanie Allibon 496 169 – 9 11 16 202 92 – 995 46.5Craig Jetson 702 275 4 1 (6) 16 252 202 – 1,446 50.4Craig Jones 585 212 – 9 7 16 415 225 155 1,624 52.5Ian Kemish 527 198 25 29 9 16 222 150 80 1,256 45.4Francesca Lee 528 195 – 7 14 16 325 190 – 1,275 55.7Michael Nossal 740 374 – 8 25 16 571 360 – 2,094 62.3Philip Stephenson 585 225 60 67 7 16 325 196 – 1,481 50.4
Total 6,671 3,213 134 190 93 144 5,013 2,985 235 18,678
2017Sandeep Biswas 1,720 1,195 27 41 19 15 2,503 1,124 – 6,644 72.6Gerard Bond 710 397 – 10 (12) 15 685 289 – 2,094 65.5Melanie Allibon 203 75 – 2 16 7 90 28 – 421 45.8Craig Jetson 341 142 8 1 24 7 96 92 – 711 46.4Craig Jones 568 235 – 9 (16) 15 561 183 75 1,630 60.1Ian Kemish 513 195 86 27 12 15 103 73 106 1,130 32.8Francesca Lee 513 189 – 7 (9) 15 403 147 – 1,265 58.4Michael Nossal 720 374 11 8 22 15 322 271 283 2,026 47.7Philip Stephenson 522 195 40 49 11 15 232 137 – 1,201 47.0
Total(1) 5,810 2,997 172 154 67 119 4,995 2,344 464 17,122(1) Total Executive remuneration for the 2017 financial year excludes Executives who ceased being an Executive in the 2017 financial year. Total remuneration for these Executives in 2017 was US$63,000.
The table above details the statutory remuneration disclosures as calculated with reference to the Corporations Act 2001 and relevant accounting standards. All Executives are compensated in Australian dollars. Remuneration has been presented in US dollars, consistent with Newcrest’s presentation currency. All remuneration components have been translated from Australian dollars to US dollars using an average rate of 0.7754 (2017: 0.7541).
An explanation of the relevant remuneration items included in the tables is provided in the associated footnotes. The figures provided in relation to share based payments (columns G to I) are calculated in accordance with accounting standards and represent the amortised fair value of equity instruments that have been granted to Executives.
Notes to Executive Remuneration(A) Salaries comprise cash salary and available salary package options grossed up by related fringe benefits tax, where applicable, net of superannuation commitments,
paid during the financial year. For former and new Executives, this balance is pro-rated for time served as KMP.(B) Short Term Incentive refers to cash amounts earned under the STI Plan which are paid in the following financial year.(C) Other cash benefits comprise: – For Ian Kemish and Michael Nossal, this includes the cash component awarded as “sign-on” incentives, as detailed in section 4.6. These entitlements are being
expensed over the period in which the performance and/or service conditions are fulfilled, ending on the date on which they become fully entitled to the award. – For all other Executives this relates to travel costs paid in lieu of relocation entitlements. (D) Other benefits represents non-monetary benefits such as parking, insurance and applicable fringe benefits tax payable on benefits.(E) Represents leave entitlements, measured on an accruals basis, and reflects the movement in the entitlements over the year.(F) Represents company contributions to superannuation under the Superannuation Guarantee legislation (SGC).(G) Represents the fair value of Rights over unissued shares, granted under the LTI Plan. This is calculated in accordance with Australian Accounting Standard AASB 2 Share
Based Payments. The Rights have been valued using a combination of the Monte Carlo simulation and Black-Scholes models. Valuations are as at the Grant Date and, for the portion of the awards that are not subject to market based hurdles such as TSR, are adjusted for the probability of hurdles being achieved. The amounts disclosed have been determined by allocating the value of the Rights evenly over the period from grant date to vesting date and, as a result, the table includes Rights that were granted in prior years.
(H) Represents the deferral of 50% of the STI award granted to the Executives which is deferred in the form of shares (refer to section 4.4). The deferred amount is being expensed over the period in which the performance and/ or service conditions are fulfilled, ending on the date on which the Executive fully becomes entitled to the award. As a result the table includes the accounting expense of deferrals from STI awarded in prior years.
(I) Represents Rights awarded to Executives as “sign-on” incentives in accordance with their Executive Service Agreements, as detailed in section 4.6. Their entitlements are being expensed over the period in which the performance and/or service conditions are fulfilled, ending on the date on which they become fully entitled to the award.
(J) Represents performance related remuneration as a percentage of total remuneration. Performance related remuneration comprises Short Term Incentive, LTI Rights and STI Deferral.
89NEWCREST 2018 ANNUAL REPORT
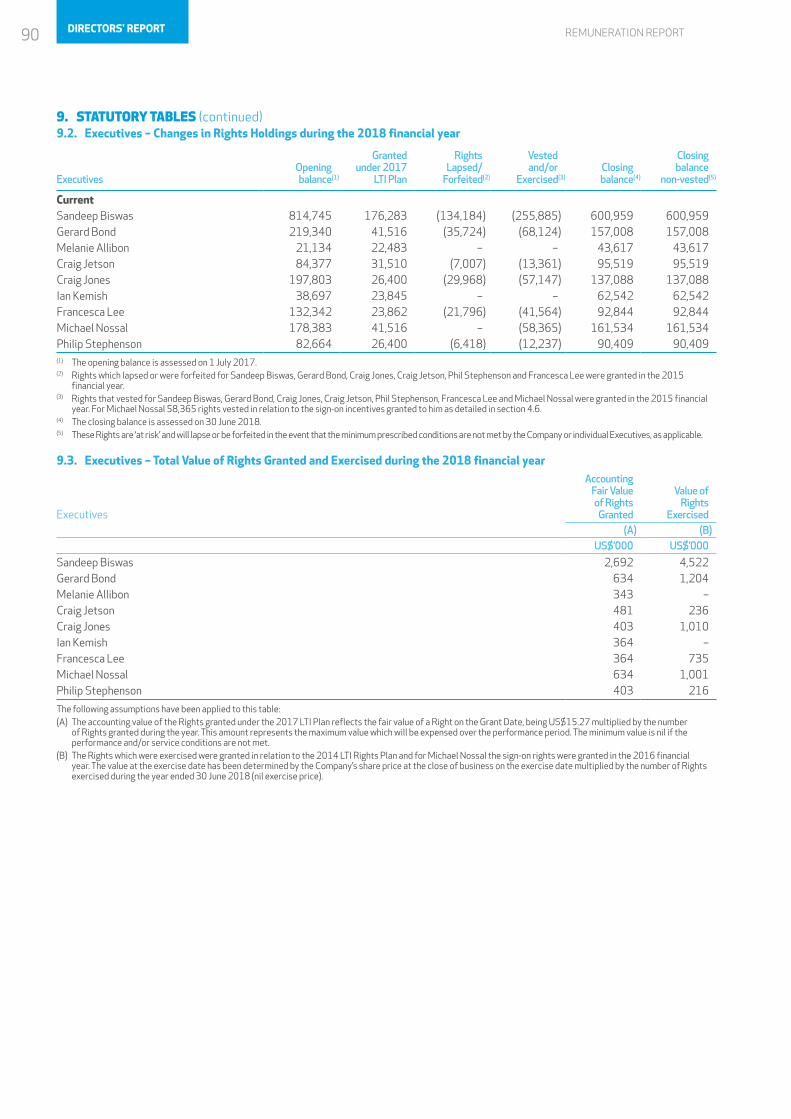
REMUNERATION REPORT
9. STATUTORY TABLES (continued)9.2. Executives – Changes in Rights Holdings during the 2018 financial year
Executives Openingbalance(1)
Grantedunder 2017
LTI Plan
RightsLapsed/
Forfeited(2)
Vestedand/or
Exercised(3)Closingbalance(4)
Closingbalance
non-vested(5)
Current Sandeep Biswas 814,745 176,283 (134,184) (255,885) 600,959 600,959Gerard Bond 219,340 41,516 (35,724) (68,124) 157,008 157,008Melanie Allibon 21,134 22,483 – – 43,617 43,617Craig Jetson 84,377 31,510 (7,007) (13,361) 95,519 95,519Craig Jones 197,803 26,400 (29,968) (57,147) 137,088 137,088Ian Kemish 38,697 23,845 – – 62,542 62,542Francesca Lee 132,342 23,862 (21,796) (41,564) 92,844 92,844Michael Nossal 178,383 41,516 – (58,365) 161,534 161,534Philip Stephenson 82,664 26,400 (6,418) (12,237) 90,409 90,409(1) The opening balance is assessed on 1 July 2017.(2) Rights which lapsed or were forfeited for Sandeep Biswas, Gerard Bond, Craig Jones, Craig Jetson, Phil Stephenson and Francesca Lee were granted in the 2015
financial year. (3) Rights that vested for Sandeep Biswas, Gerard Bond, Craig Jones, Craig Jetson, Phil Stephenson, Francesca Lee and Michael Nossal were granted in the 2015 financial
year. For Michael Nossal 58,365 rights vested in relation to the sign-on incentives granted to him as detailed in section 4.6.(4) The closing balance is assessed on 30 June 2018.(5) These Rights are ‘at risk’ and will lapse or be forfeited in the event that the minimum prescribed conditions are not met by the Company or individual Executives, as applicable.
9.3. Executives – Total Value of Rights Granted and Exercised during the 2018 financial year
Executives
AccountingFair Valueof RightsGranted
Value ofRights
Exercised(A) (B)
US$’000 US$’000
Sandeep Biswas 2,692 4,522Gerard Bond 634 1,204Melanie Allibon 343 –Craig Jetson 481 236Craig Jones 403 1,010Ian Kemish 364 –Francesca Lee 364 735Michael Nossal 634 1,001Philip Stephenson 403 216
The following assumptions have been applied to this table:(A) The accounting value of the Rights granted under the 2017 LTI Plan reflects the fair value of a Right on the Grant Date, being US$15.27 multiplied by the number
of Rights granted during the year. This amount represents the maximum value which will be expensed over the performance period. The minimum value is nil if the performance and/or service conditions are not met.
(B) The Rights which were exercised were granted in relation to the 2014 LTI Rights Plan and for Michael Nossal the sign-on rights were granted in the 2016 financial year. The value at the exercise date has been determined by the Company’s share price at the close of business on the exercise date multiplied by the number of Rights exercised during the year ended 30 June 2018 (nil exercise price).
90 DIRECTORS' REPORT
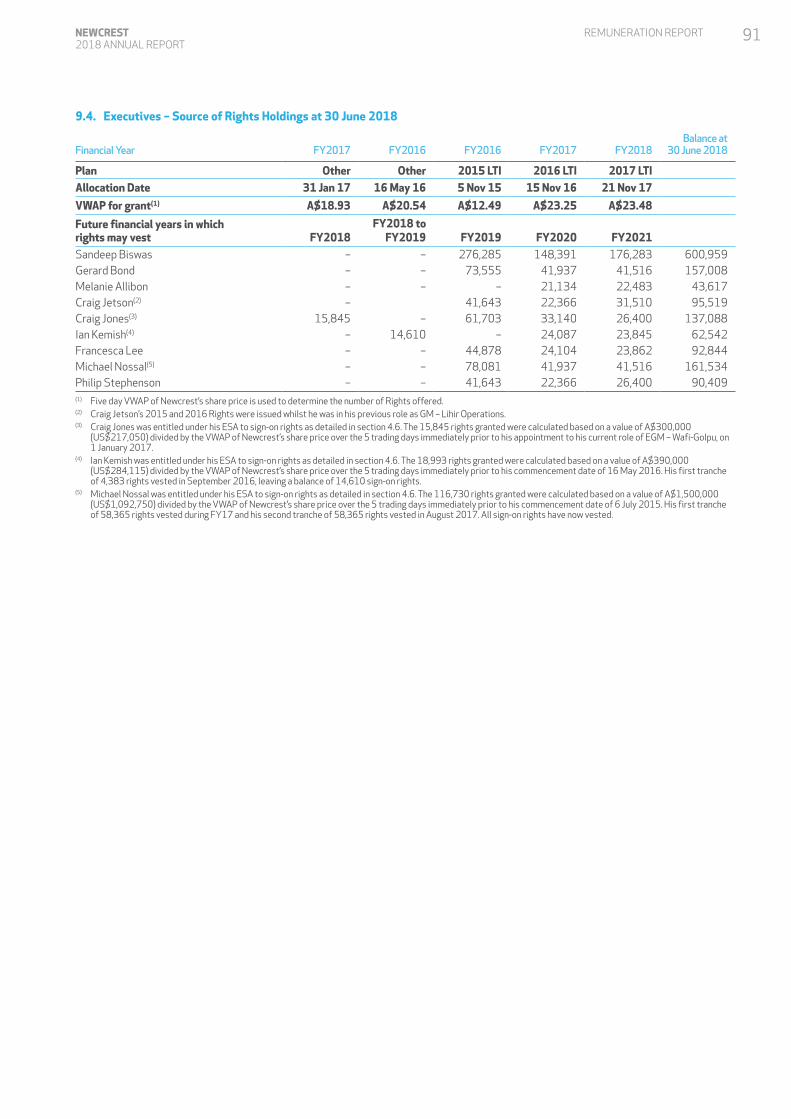
REMUNERATION REPORT
9.4. Executives – Source of Rights Holdings at 30 June 2018
Financial Year FY2017 FY2016 FY2016 FY2017 FY2018Balance at
30 June 2018
Plan Other Other 2015 LTI 2016 LTI 2017 LTIAllocation Date 31 Jan 17 16 May 16 5 Nov 15 15 Nov 16 21 Nov 17
VWAP for grant(1) A$18.93 A$20.54 A$12.49 A$23.25 A$23.48
Future financial years in which rights may vest FY2018
FY2018 toFY2019 FY2019 FY2020 FY2021
Sandeep Biswas – – 276,285 148,391 176,283 600,959Gerard Bond – – 73,555 41,937 41,516 157,008Melanie Allibon – – – 21,134 22,483 43,617Craig Jetson(2) – 41,643 22,366 31,510 95,519Craig Jones(3) 15,845 – 61,703 33,140 26,400 137,088Ian Kemish(4) – 14,610 – 24,087 23,845 62,542Francesca Lee – – 44,878 24,104 23,862 92,844Michael Nossal(5) – – 78,081 41,937 41,516 161,534Philip Stephenson – – 41,643 22,366 26,400 90,409(1) Five day VWAP of Newcrest’s share price is used to determine the number of Rights offered. (2) Craig Jetson’s 2015 and 2016 Rights were issued whilst he was in his previous role as GM – Lihir Operations.(3) Craig Jones was entitled under his ESA to sign-on rights as detailed in section 4.6. The 15,845 rights granted were calculated based on a value of A$300,000
(US$217,050) divided by the VWAP of Newcrest’s share price over the 5 trading days immediately prior to his appointment to his current role of EGM – Wafi-Golpu, on 1 January 2017.
(4) Ian Kemish was entitled under his ESA to sign-on rights as detailed in section 4.6. The 18,993 rights granted were calculated based on a value of A$390,000 (US$284,115) divided by the VWAP of Newcrest’s share price over the 5 trading days immediately prior to his commencement date of 16 May 2016. His first tranche of 4,383 rights vested in September 2016, leaving a balance of 14,610 sign-on rights.
(5) Michael Nossal was entitled under his ESA to sign-on rights as detailed in section 4.6. The 116,730 rights granted were calculated based on a value of A$1,500,000 (US$1,092,750) divided by the VWAP of Newcrest’s share price over the 5 trading days immediately prior to his commencement date of 6 July 2015. His first tranche of 58,365 rights vested during FY17 and his second tranche of 58,365 rights vested in August 2017. All sign-on rights have now vested.
91NEWCREST 2018 ANNUAL REPORT
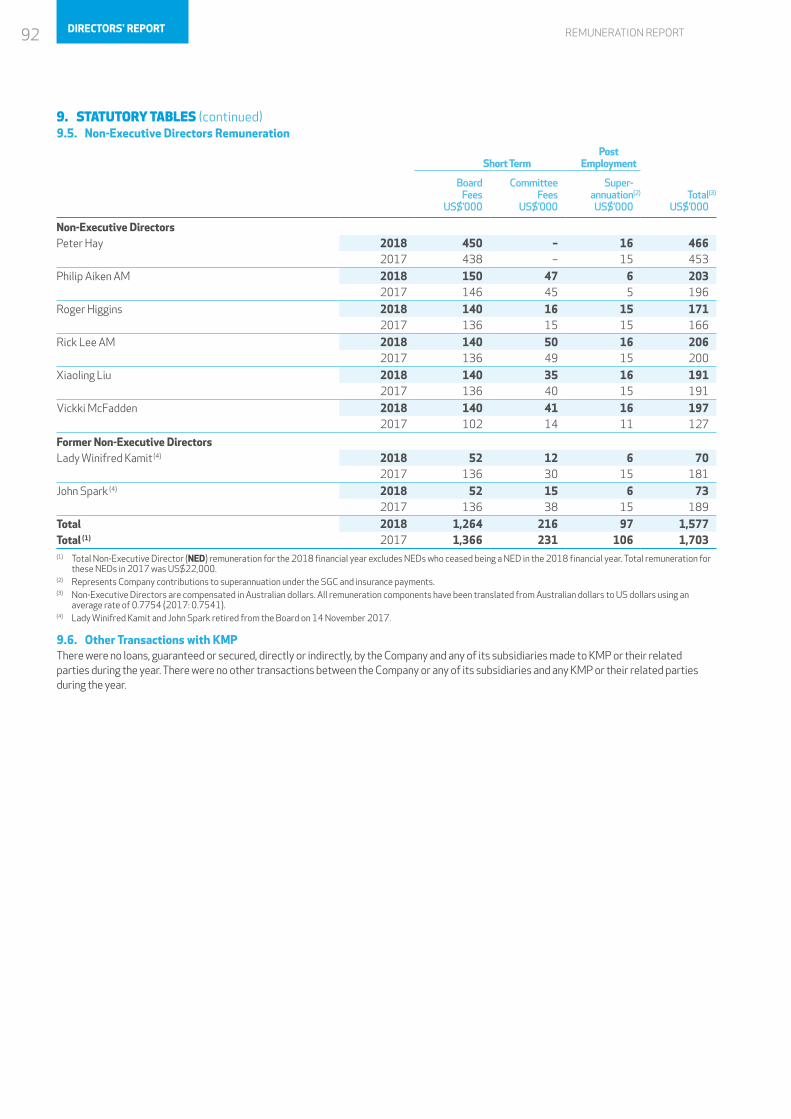
REMUNERATION REPORT
9. STATUTORY TABLES (continued)9.5. Non-Executive Directors Remuneration
Short TermPost
Employment
BoardFees
US$’000
CommitteeFees
US$’000
Super-annuation(2)
US$’000Total(3)
US$’000
Non-Executive DirectorsPeter Hay 2018 450 – 16 466
2017 438 – 15 453
Philip Aiken AM 2018 150 47 6 2032017 146 45 5 196
Roger Higgins 2018 140 16 15 1712017 136 15 15 166
Rick Lee AM 2018 140 50 16 2062017 136 49 15 200
Xiaoling Liu 2018 140 35 16 1912017 136 40 15 191
Vickki McFadden 2018 140 41 16 1972017 102 14 11 127
Former Non-Executive DirectorsLady Winifred Kamit (4) 2018 52 12 6 70
2017 136 30 15 181
John Spark (4) 2018 52 15 6 732017 136 38 15 189
Total 2018 1,264 216 97 1,577Total (1) 2017 1,366 231 106 1,703(1) Total Non-Executive Director (NED) remuneration for the 2018 financial year excludes NEDs who ceased being a NED in the 2018 financial year. Total remuneration for
these NEDs in 2017 was US$22,000.(2) Represents Company contributions to superannuation under the SGC and insurance payments.(3) Non-Executive Directors are compensated in Australian dollars. All remuneration components have been translated from Australian dollars to US dollars using an
average rate of 0.7754 (2017: 0.7541).(4) Lady Winifred Kamit and John Spark retired from the Board on 14 November 2017.
9.6. Other Transactions with KMP There were no loans, guaranteed or secured, directly or indirectly, by the Company and any of its subsidiaries made to KMP or their related parties during the year. There were no other transactions between the Company or any of its subsidiaries and any KMP or their related parties during the year.
92 DIRECTORS' REPORT
A member firm of Ernst & Young Global LimitedLiability limited by a scheme approved under Professional Standards Legislation
Ernst & Young8 Exhibition Street Melbourne VIC 3000 AustraliaGPO Box 67 Melbourne VIC 3001
Tel: +61 3 9288 8000Fax: +61 3 8650 7777ey.com/au
Auditor’s Independence Declaration to the Directors of Newcrest Mining Limited
As lead auditor for the audit of Newcrest Mining Limited for the financial year ended 30 June 2018, I declare to the best of my knowledge and belief, there have been:
a) no contraventions of the auditor independence requirements of the Corporations Act 2001 in relation to the audit; and
b) no contraventions of any applicable code of professional conduct in relation to the audit.
This declaration is in respect of Newcrest Mining Limited and the entities it controlled during the financial year.
Ernst & Young
Trent van Veen Partner
22 August 2018
AUDITOR’S INDEPENDENCE DECLARATION
AUDITOR'S INDEPENDENCE DECLARATION
93NEWCREST 2018 ANNUAL REPORT
RUNNING HEAD
FINANCIAL REPORTFOR THE YEAR ENDED 30 JUNE 2018
CONSOLIDATED FINANCIAL STATEMENTSConsolidated Income Statement 95Consolidated Statement of Comprehensive Income 96Consolidated Statement of Financial Position 97Consolidated Statement of Cash Flows 98Consolidated Statement of Changes in Equity 99
NOTES TO THE CONSOLIDATED FINANCIAL STATEMENTS 100DIRECTORS’ DECLARATION 143INDEPENDENT AUDITOR’S REPORT 144
NOTES TO THE CONSOLIDATED FINANCIAL STATEMENTSIntroduction 1001 Corporate Information 1002 Basis of Preparation 1003 Critical Accounting Judgements, Estimates and
Assumptions101
Performance 1014 Segment Information 1015 Income and Expenses 1046 Significant Items 1067 Income Tax Expense 1078 Earnings per Share (EPS) 1079 Dividends 10810 Note to the Consolidated Statement of Cash Flows 108
Resource Assets and Liabilities 10911 Property, Plant and Equipment 10912 Impairment of Non-Financial Assets 11113 Inventories 11414 Trade and Other Receivables 11415 Other Assets 11516 Other Intangible Assets 11517 Deferred Tax 11518 Provisions 116
Capital Structure and Financial Risk Management 11819 Capital Management and Financial Objectives 11820 Net Debt 11921 Other Financial Assets and Liabilities 12022 Financial Risk Management 12123 Issued Capital 12724 Reserves 128
Group Structure 12925 Controlled Entities 12926 Parent Entity Information 13027 Deed of Cross Guarantee 13128 Interest in Joint Operations 13329 Investment in Associates 13430 Business Divestment 135
Other 13731 Commitments 13732 Events Subsequent to Reporting Date 13733 Contingencies 13734 Share-Based Payments 13835 Key Management Personnel 14036 Auditors’ Remuneration 14037 New Accounting Standards and Interpretations 141
FINANCIAL REPORT94
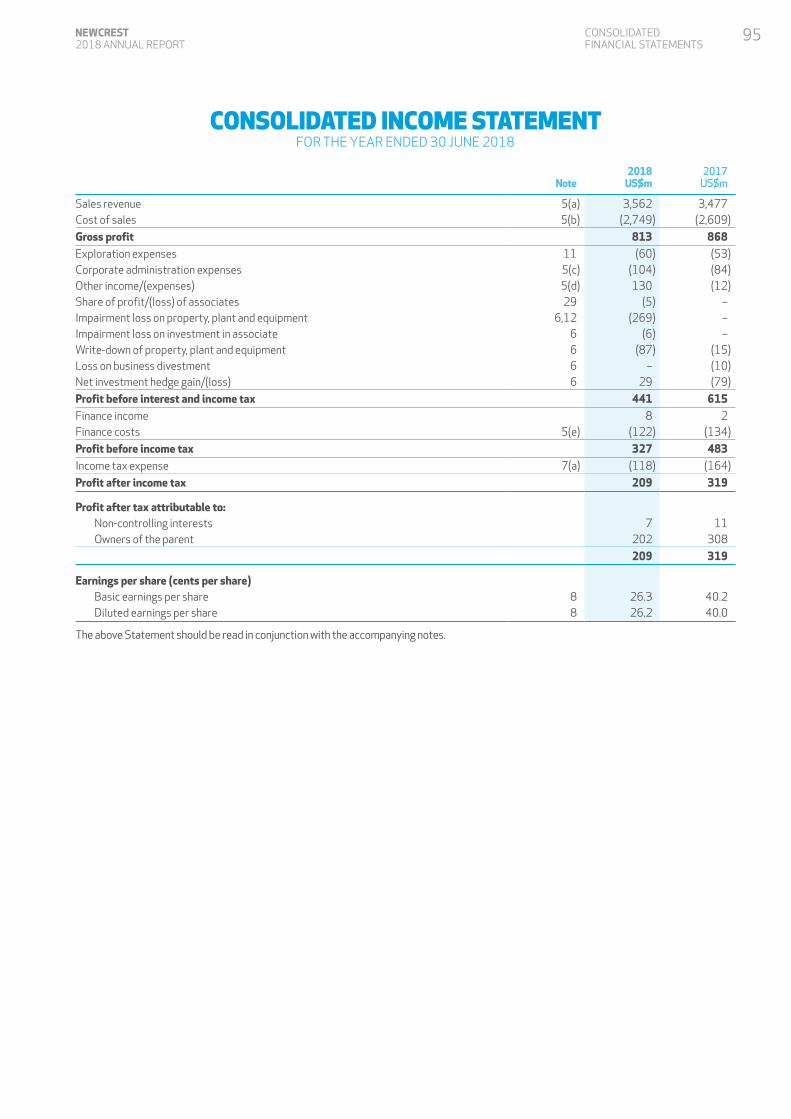
CONSOLIDATED INCOME STATEMENTFOR THE YEAR ENDED 30 JUNE 2018
Note2018
US$m2017
US$m
Sales revenue 5(a) 3,562 3,477Cost of sales 5(b) (2,749) (2,609)
Gross profit 813 868Exploration expenses 11 (60) (53)Corporate administration expenses 5(c) (104) (84)Other income/(expenses) 5(d) 130 (12)Share of profit/(loss) of associates 29 (5) –Impairment loss on property, plant and equipment 6,12 (269) –Impairment loss on investment in associate 6 (6) –Write-down of property, plant and equipment 6 (87) (15)Loss on business divestment 6 – (10)Net investment hedge gain/(loss) 6 29 (79)
Profit before interest and income tax 441 615Finance income 8 2Finance costs 5(e) (122) (134)
Profit before income tax 327 483Income tax expense 7(a) (118) (164)
Profit after income tax 209 319
Profit after tax attributable to: Non-controlling interests 7 11 Owners of the parent 202 308
209 319
Earnings per share (cents per share) Basic earnings per share 8 26.3 40.2 Diluted earnings per share 8 26.2 40.0
The above Statement should be read in conjunction with the accompanying notes.
CONSOLIDATED FINANCIAL STATEMENTS
95NEWCREST 2018 ANNUAL REPORT
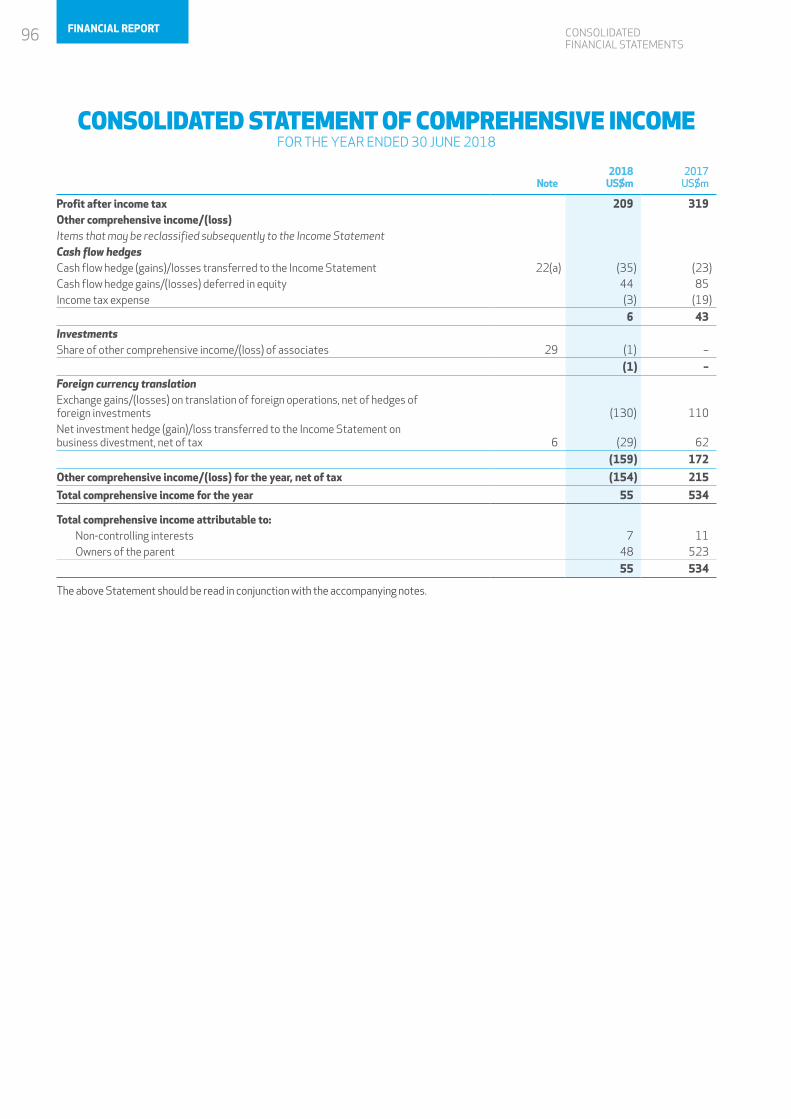
CONSOLIDATED FINANCIAL STATEMENTS
CONSOLIDATED STATEMENT OF COMPREHENSIVE INCOMEFOR THE YEAR ENDED 30 JUNE 2018
Note2018
US$m2017
US$m
Profit after income tax 209 319Other comprehensive income/(loss)Items that may be reclassified subsequently to the Income StatementCash flow hedgesCash flow hedge (gains)/losses transferred to the Income Statement 22(a) (35) (23)Cash flow hedge gains/(losses) deferred in equity 44 85Income tax expense (3) (19)
6 43InvestmentsShare of other comprehensive income/(loss) of associates 29 (1) –
(1) –Foreign currency translationExchange gains/(losses) on translation of foreign operations, net of hedges of foreign investments (130) 110Net investment hedge (gain)/loss transferred to the Income Statement on business divestment, net of tax 6 (29) 62
(159) 172
Other comprehensive income/(loss) for the year, net of tax (154) 215
Total comprehensive income for the year 55 534
Total comprehensive income attributable to: Non-controlling interests 7 11 Owners of the parent 48 523
55 534
The above Statement should be read in conjunction with the accompanying notes.
96 FINANCIAL REPORT
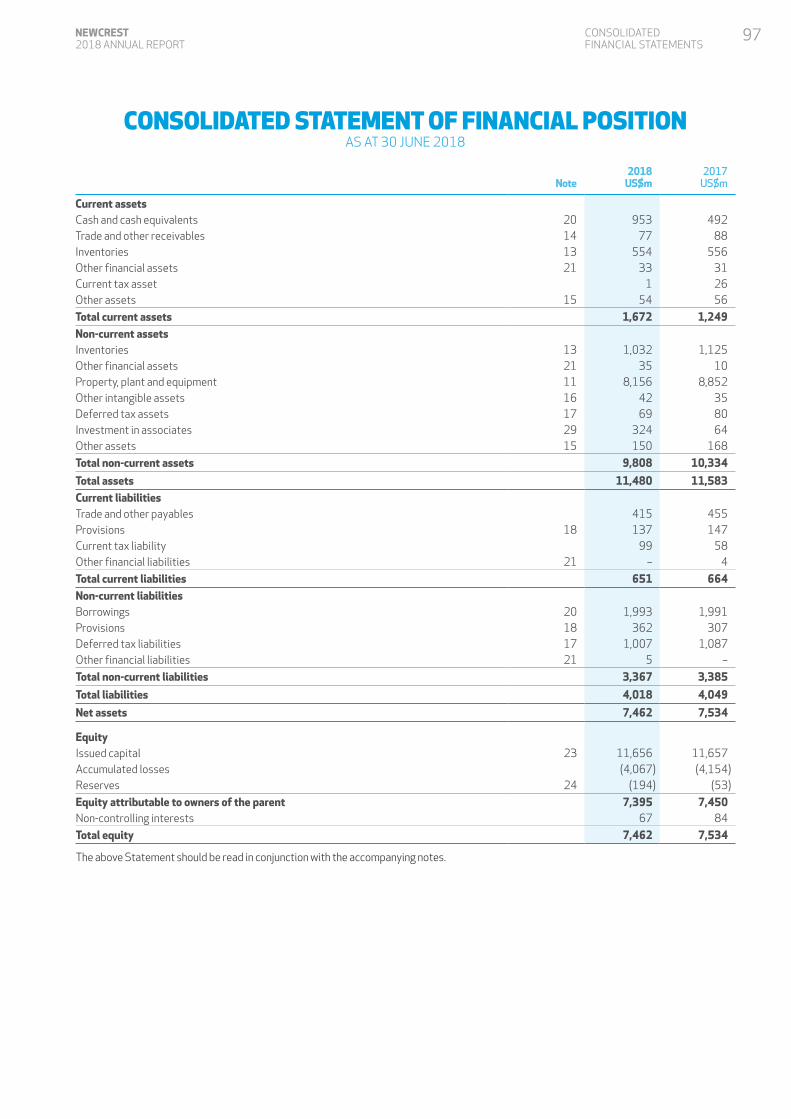
CONSOLIDATED STATEMENT OF FINANCIAL POSITIONAS AT 30 JUNE 2018
Note2018
US$m2017
US$m
Current assets Cash and cash equivalents 20 953 492Trade and other receivables 14 77 88Inventories 13 554 556Other financial assets 21 33 31Current tax asset 1 26Other assets 15 54 56
Total current assets 1,672 1,249Non-current assetsInventories 13 1,032 1,125Other financial assets 21 35 10Property, plant and equipment 11 8,156 8,852Other intangible assets 16 42 35Deferred tax assets 17 69 80Investment in associates 29 324 64Other assets 15 150 168
Total non-current assets 9,808 10,334
Total assets 11,480 11,583Current liabilitiesTrade and other payables 415 455Provisions 18 137 147Current tax liability 99 58Other financial liabilities 21 – 4
Total current liabilities 651 664Non-current liabilitiesBorrowings 20 1,993 1,991Provisions 18 362 307Deferred tax liabilities 17 1,007 1,087Other financial liabilities 21 5 –
Total non-current liabilities 3,367 3,385
Total liabilities 4,018 4,049
Net assets 7,462 7,534
EquityIssued capital 23 11,656 11,657Accumulated losses (4,067) (4,154)Reserves 24 (194) (53)
Equity attributable to owners of the parent 7,395 7,450Non-controlling interests 67 84
Total equity 7,462 7,534
The above Statement should be read in conjunction with the accompanying notes.
CONSOLIDATED FINANCIAL STATEMENTS
97NEWCREST 2018 ANNUAL REPORT
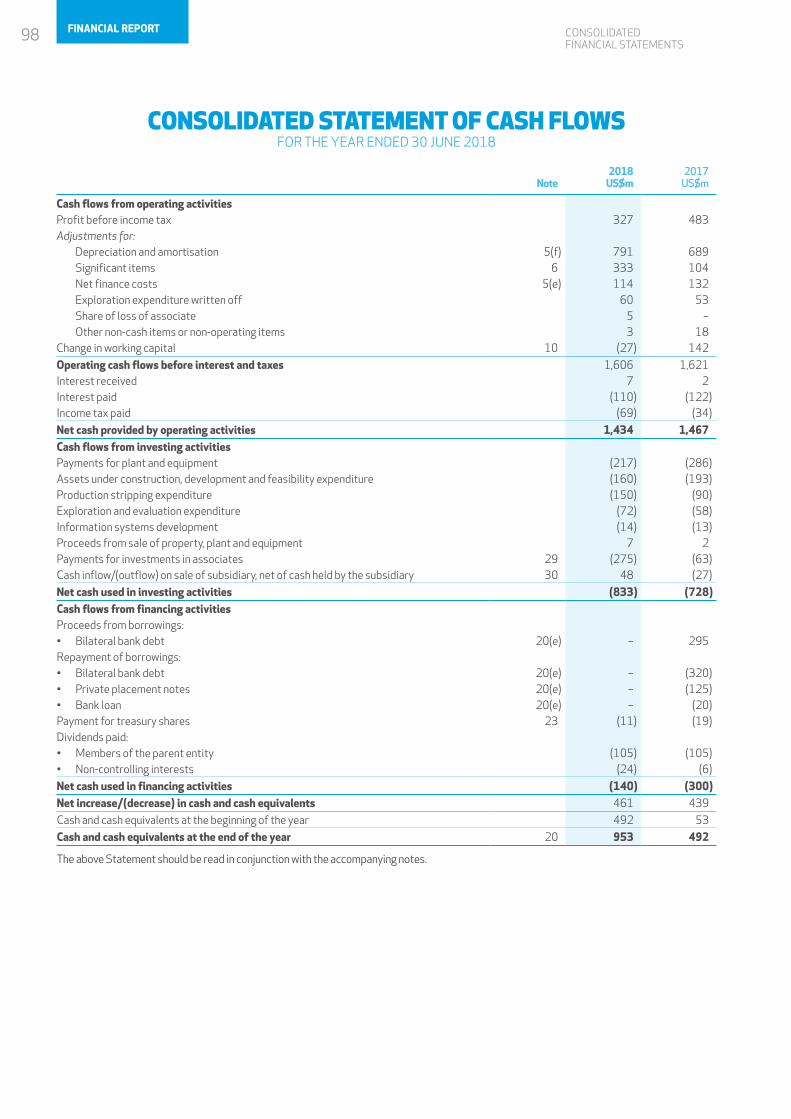
CONSOLIDATED FINANCIAL STATEMENTS
CONSOLIDATED STATEMENT OF CASH FLOWSFOR THE YEAR ENDED 30 JUNE 2018
Note2018
US$m2017
US$m
Cash flows from operating activities Profit before income tax 327 483Adjustments for: Depreciation and amortisation 5(f) 791 689 Significant items 6 333 104 Net finance costs 5(e) 114 132 Exploration expenditure written off 60 53 Share of loss of associate 5 – Other non-cash items or non-operating items 3 18Change in working capital 10 (27) 142
Operating cash flows before interest and taxes 1,606 1,621Interest received 7 2Interest paid (110) (122)Income tax paid (69) (34)
Net cash provided by operating activities 1,434 1,467Cash flows from investing activitiesPayments for plant and equipment (217) (286)Assets under construction, development and feasibility expenditure (160) (193)Production stripping expenditure (150) (90)Exploration and evaluation expenditure (72) (58)Information systems development (14) (13)Proceeds from sale of property, plant and equipment 7 2Payments for investments in associates 29 (275) (63)Cash inflow/(outflow) on sale of subsidiary, net of cash held by the subsidiary 30 48 (27)
Net cash used in investing activities (833) (728)Cash flows from financing activitiesProceeds from borrowings:• Bilateral bank debt 20(e) – 295Repayment of borrowings:• Bilateral bank debt 20(e) – (320)• Private placement notes 20(e) – (125)• Bank loan 20(e) – (20)Payment for treasury shares 23 (11) (19)Dividends paid:• Members of the parent entity (105) (105)• Non-controlling interests (24) (6)
Net cash used in financing activities (140) (300)Net increase/(decrease) in cash and cash equivalents 461 439
Cash and cash equivalents at the beginning of the year 492 53
Cash and cash equivalents at the end of the year 20 953 492
The above Statement should be read in conjunction with the accompanying notes.
98 FINANCIAL REPORT
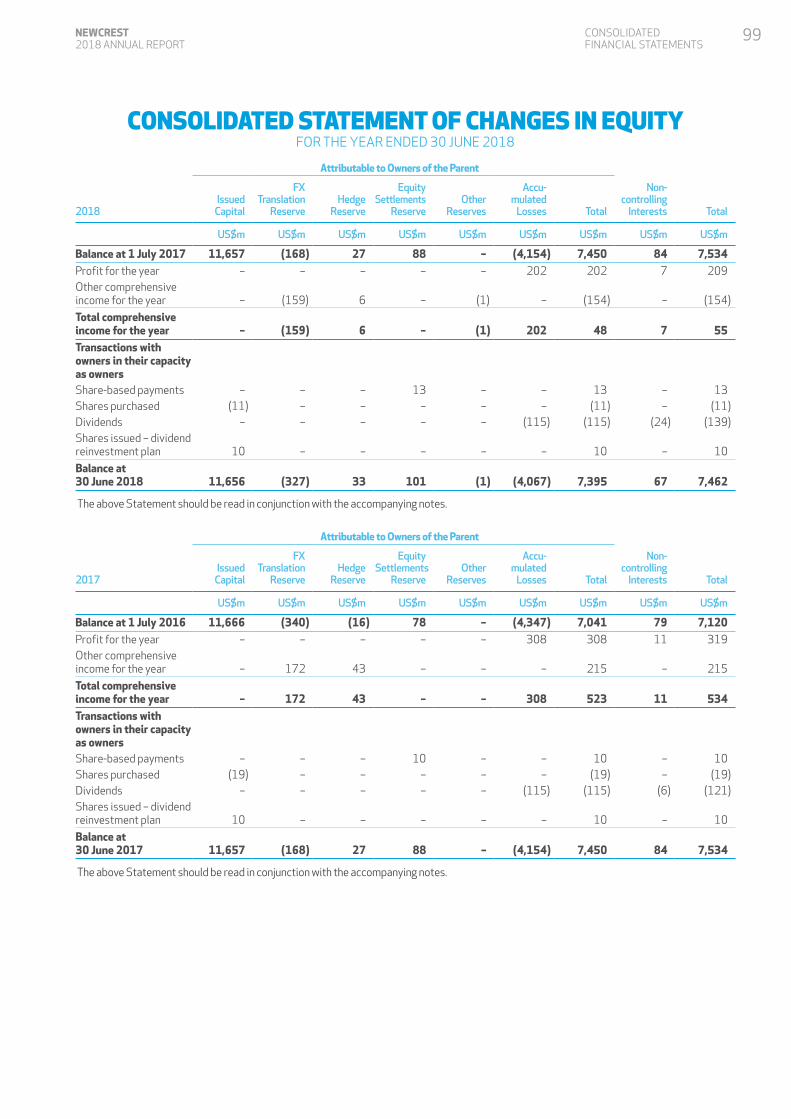
CONSOLIDATED STATEMENT OF CHANGES IN EQUITYFOR THE YEAR ENDED 30 JUNE 2018
Attributable to Owners of the Parent
2018Issued
Capital
FXTranslation
ReserveHedge
Reserve
Equity Settlements
ReserveOther
Reserves
Accu-mulated Losses Total
Non-controlling
Interests Total
US$m US$m US$m US$m US$m US$m US$m US$m US$m
Balance at 1 July 2017 11,657 (168) 27 88 – (4,154) 7,450 84 7,534Profit for the year – – – – – 202 202 7 209Other comprehensive income for the year – (159) 6 – (1) – (154) – (154)
Total comprehensive income for the year – (159) 6 – (1) 202 48 7 55Transactions with owners in their capacity as ownersShare-based payments – – – 13 – – 13 – 13Shares purchased (11) – – – – – (11) – (11)Dividends – – – – – (115) (115) (24) (139)Shares issued – dividend reinvestment plan 10 – – – – – 10 – 10
Balance at 30 June 2018 11,656 (327) 33 101 (1) (4,067) 7,395 67 7,462
The above Statement should be read in conjunction with the accompanying notes.
Attributable to Owners of the Parent
2017Issued
Capital
FXTranslation
ReserveHedge
Reserve
Equity Settlements
ReserveOther
Reserves
Accu-mulated Losses Total
Non-controlling
Interests Total
US$m US$m US$m US$m US$m US$m US$m US$m US$m
Balance at 1 July 2016 11,666 (340) (16) 78 – (4,347) 7,041 79 7,120Profit for the year – – – – – 308 308 11 319Other comprehensive income for the year – 172 43 – – – 215 – 215
Total comprehensive income for the year – 172 43 – – 308 523 11 534Transactions with owners in their capacity as ownersShare-based payments – – – 10 – – 10 – 10Shares purchased (19) – – – – – (19) – (19)Dividends – – – – – (115) (115) (6) (121)Shares issued – dividend reinvestment plan 10 – – – – – 10 – 10
Balance at 30 June 2017 11,657 (168) 27 88 – (4,154) 7,450 84 7,534
The above Statement should be read in conjunction with the accompanying notes.
CONSOLIDATED FINANCIAL STATEMENTS
99NEWCREST 2018 ANNUAL REPORT
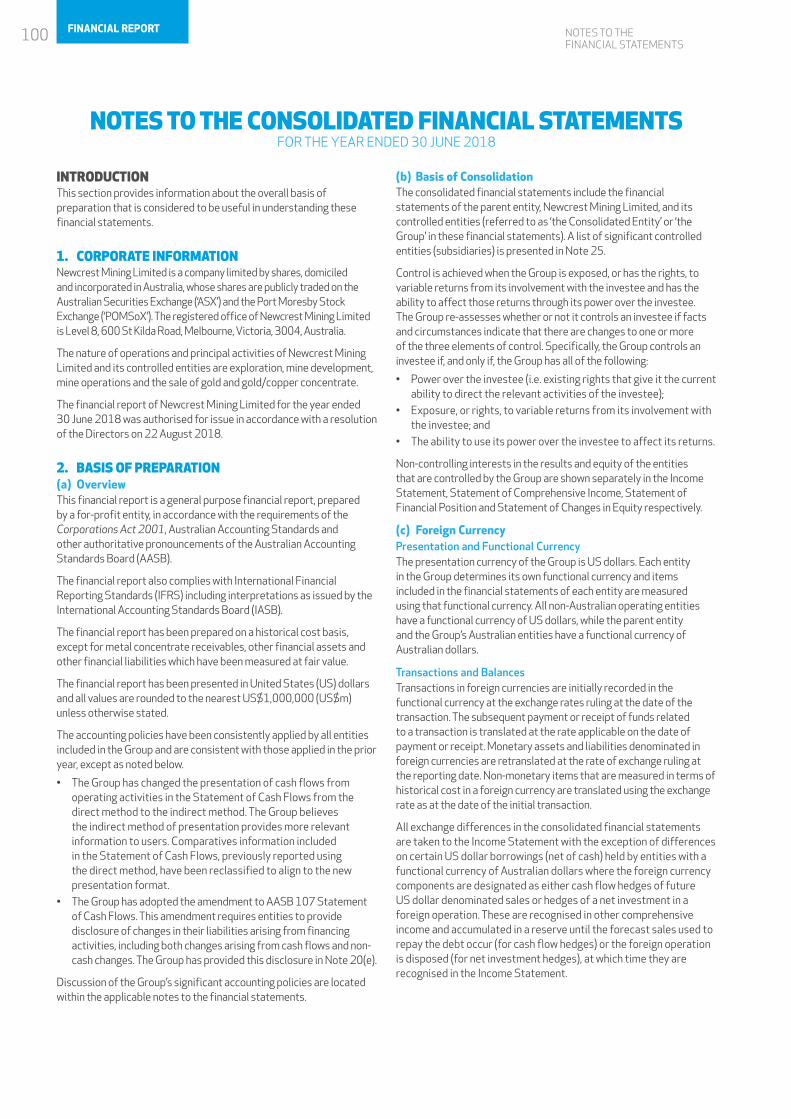
NOTES TO THE FINANCIAL STATEMENTS
NOTES TO THE CONSOLIDATED FINANCIAL STATEMENTSFOR THE YEAR ENDED 30 JUNE 2018
INTRODUCTIONThis section provides information about the overall basis of preparation that is considered to be useful in understanding these financial statements.
1. CORPORATE INFORMATIONNewcrest Mining Limited is a company limited by shares, domiciled and incorporated in Australia, whose shares are publicly traded on the Australian Securities Exchange (‘ASX’) and the Port Moresby Stock Exchange (‘POMSoX’). The registered office of Newcrest Mining Limited is Level 8, 600 St Kilda Road, Melbourne, Victoria, 3004, Australia.
The nature of operations and principal activities of Newcrest Mining Limited and its controlled entities are exploration, mine development, mine operations and the sale of gold and gold/copper concentrate.
The financial report of Newcrest Mining Limited for the year ended 30 June 2018 was authorised for issue in accordance with a resolution of the Directors on 22 August 2018.
2. BASIS OF PREPARATION(a) OverviewThis financial report is a general purpose financial report, prepared by a for-profit entity, in accordance with the requirements of the Corporations Act 2001, Australian Accounting Standards and other authoritative pronouncements of the Australian Accounting Standards Board (AASB).
The financial report also complies with International Financial Reporting Standards (IFRS) including interpretations as issued by the International Accounting Standards Board (IASB).
The financial report has been prepared on a historical cost basis, except for metal concentrate receivables, other financial assets and other financial liabilities which have been measured at fair value.
The financial report has been presented in United States (US) dollars and all values are rounded to the nearest US$1,000,000 (US$m) unless otherwise stated.
The accounting policies have been consistently applied by all entities included in the Group and are consistent with those applied in the prior year, except as noted below.
• The Group has changed the presentation of cash flows from operating activities in the Statement of Cash Flows from the direct method to the indirect method. The Group believes the indirect method of presentation provides more relevant information to users. Comparatives information included in the Statement of Cash Flows, previously reported using the direct method, have been reclassified to align to the new presentation format.
• The Group has adopted the amendment to AASB 107 Statement of Cash Flows. This amendment requires entities to provide disclosure of changes in their liabilities arising from financing activities, including both changes arising from cash flows and non-cash changes. The Group has provided this disclosure in Note 20(e).
Discussion of the Group’s significant accounting policies are located within the applicable notes to the financial statements.
(b) Basis of ConsolidationThe consolidated financial statements include the financial statements of the parent entity, Newcrest Mining Limited, and its controlled entities (referred to as ‘the Consolidated Entity’ or ‘the Group’ in these financial statements). A list of significant controlled entities (subsidiaries) is presented in Note 25.
Control is achieved when the Group is exposed, or has the rights, to variable returns from its involvement with the investee and has the ability to affect those returns through its power over the investee. The Group re-assesses whether or not it controls an investee if facts and circumstances indicate that there are changes to one or more of the three elements of control. Specifically, the Group controls an investee if, and only if, the Group has all of the following:
• Power over the investee (i.e. existing rights that give it the current ability to direct the relevant activities of the investee);
• Exposure, or rights, to variable returns from its involvement with the investee; and
• The ability to use its power over the investee to affect its returns.
Non-controlling interests in the results and equity of the entities that are controlled by the Group are shown separately in the Income Statement, Statement of Comprehensive Income, Statement of Financial Position and Statement of Changes in Equity respectively.
(c) Foreign CurrencyPresentation and Functional CurrencyThe presentation currency of the Group is US dollars. Each entity in the Group determines its own functional currency and items included in the financial statements of each entity are measured using that functional currency. All non-Australian operating entities have a functional currency of US dollars, while the parent entity and the Group’s Australian entities have a functional currency of Australian dollars.
Transactions and BalancesTransactions in foreign currencies are initially recorded in the functional currency at the exchange rates ruling at the date of the transaction. The subsequent payment or receipt of funds related to a transaction is translated at the rate applicable on the date of payment or receipt. Monetary assets and liabilities denominated in foreign currencies are retranslated at the rate of exchange ruling at the reporting date. Non-monetary items that are measured in terms of historical cost in a foreign currency are translated using the exchange rate as at the date of the initial transaction.
All exchange differences in the consolidated financial statements are taken to the Income Statement with the exception of differences on certain US dollar borrowings (net of cash) held by entities with a functional currency of Australian dollars where the foreign currency components are designated as either cash flow hedges of future US dollar denominated sales or hedges of a net investment in a foreign operation. These are recognised in other comprehensive income and accumulated in a reserve until the forecast sales used to repay the debt occur (for cash flow hedges) or the foreign operation is disposed (for net investment hedges), at which time they are recognised in the Income Statement.
100 FINANCIAL REPORT
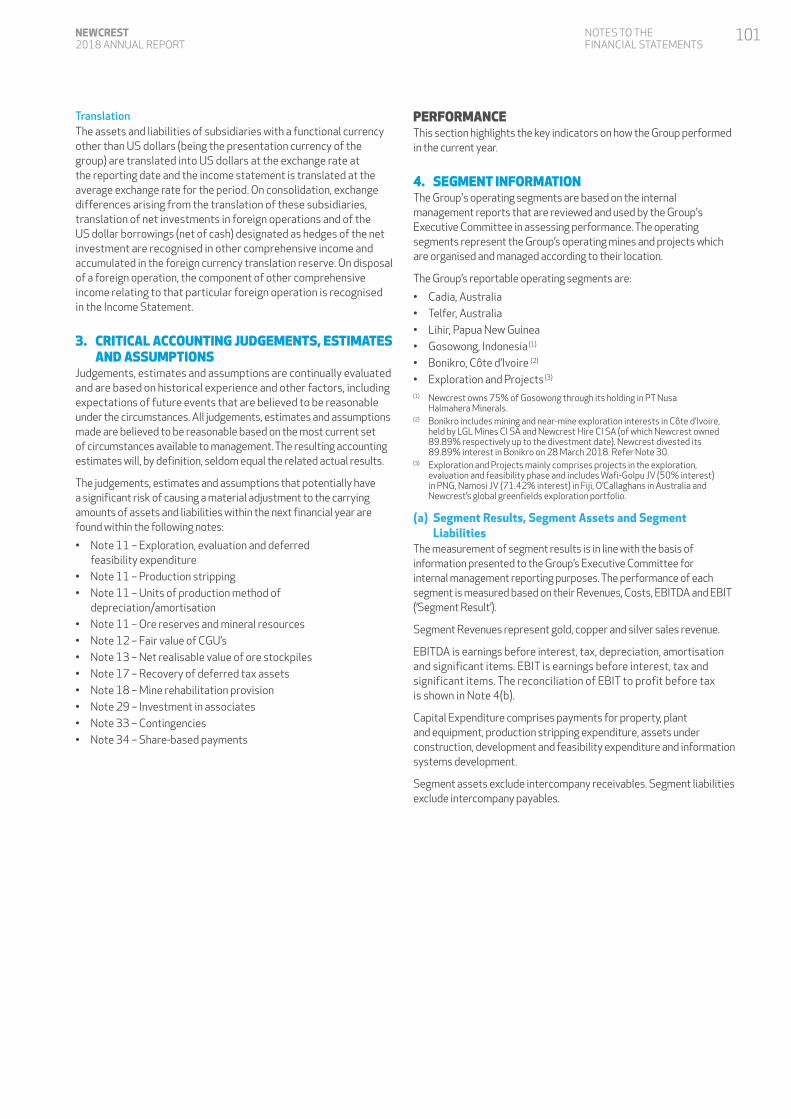
TranslationThe assets and liabilities of subsidiaries with a functional currency other than US dollars (being the presentation currency of the group) are translated into US dollars at the exchange rate at the reporting date and the income statement is translated at the average exchange rate for the period. On consolidation, exchange differences arising from the translation of these subsidiaries, translation of net investments in foreign operations and of the US dollar borrowings (net of cash) designated as hedges of the net investment are recognised in other comprehensive income and accumulated in the foreign currency translation reserve. On disposal of a foreign operation, the component of other comprehensive income relating to that particular foreign operation is recognised in the Income Statement.
3. CRITICAL ACCOUNTING JUDGEMENTS, ESTIMATES AND ASSUMPTIONS
Judgements, estimates and assumptions are continually evaluated and are based on historical experience and other factors, including expectations of future events that are believed to be reasonable under the circumstances. All judgements, estimates and assumptions made are believed to be reasonable based on the most current set of circumstances available to management. The resulting accounting estimates will, by definition, seldom equal the related actual results.
The judgements, estimates and assumptions that potentially have a significant risk of causing a material adjustment to the carrying amounts of assets and liabilities within the next financial year are found within the following notes:
• Note 11 – Exploration, evaluation and deferred feasibility expenditure
• Note 11 – Production stripping• Note 11 – Units of production method of
depreciation/amortisation• Note 11 – Ore reserves and mineral resources• Note 12 – Fair value of CGU’s• Note 13 – Net realisable value of ore stockpiles• Note 17 – Recovery of deferred tax assets• Note 18 – Mine rehabilitation provision• Note 29 – Investment in associates• Note 33 – Contingencies• Note 34 – Share-based payments
PERFORMANCEThis section highlights the key indicators on how the Group performed in the current year.
4. SEGMENT INFORMATIONThe Group's operating segments are based on the internal management reports that are reviewed and used by the Group's Executive Committee in assessing performance. The operating segments represent the Group’s operating mines and projects which are organised and managed according to their location.
The Group’s reportable operating segments are:
• Cadia, Australia• Telfer, Australia• Lihir, Papua New Guinea• Gosowong, Indonesia (1)
• Bonikro, Côte d’Ivoire (2)
• Exploration and Projects (3)
(1) Newcrest owns 75% of Gosowong through its holding in PT Nusa Halmahera Minerals.
(2) Bonikro includes mining and near-mine exploration interests in Côte d’Ivoire, held by LGL Mines CI SA and Newcrest Hire CI SA (of which Newcrest owned 89.89% respectively up to the divestment date). Newcrest divested its 89.89% interest in Bonikro on 28 March 2018. Refer Note 30.
(3) Exploration and Projects mainly comprises projects in the exploration, evaluation and feasibility phase and includes Wafi-Golpu JV (50% interest) in PNG, Namosi JV (71.42% interest) in Fiji, O’Callaghans in Australia and Newcrest’s global greenfields exploration portfolio.
(a) Segment Results, Segment Assets and Segment Liabilities
The measurement of segment results is in line with the basis of information presented to the Group’s Executive Committee for internal management reporting purposes. The performance of each segment is measured based on their Revenues, Costs, EBITDA and EBIT (‘Segment Result’).
Segment Revenues represent gold, copper and silver sales revenue.
EBITDA is earnings before interest, tax, depreciation, amortisation and significant items. EBIT is earnings before interest, tax and significant items. The reconciliation of EBIT to profit before tax is shown in Note 4(b).
Capital Expenditure comprises payments for property, plant and equipment, production stripping expenditure, assets under construction, development and feasibility expenditure and information systems development.
Segment assets exclude intercompany receivables. Segment liabilities exclude intercompany payables.
NOTES TO THE FINANCIAL STATEMENTS
101NEWCREST 2018 ANNUAL REPORT
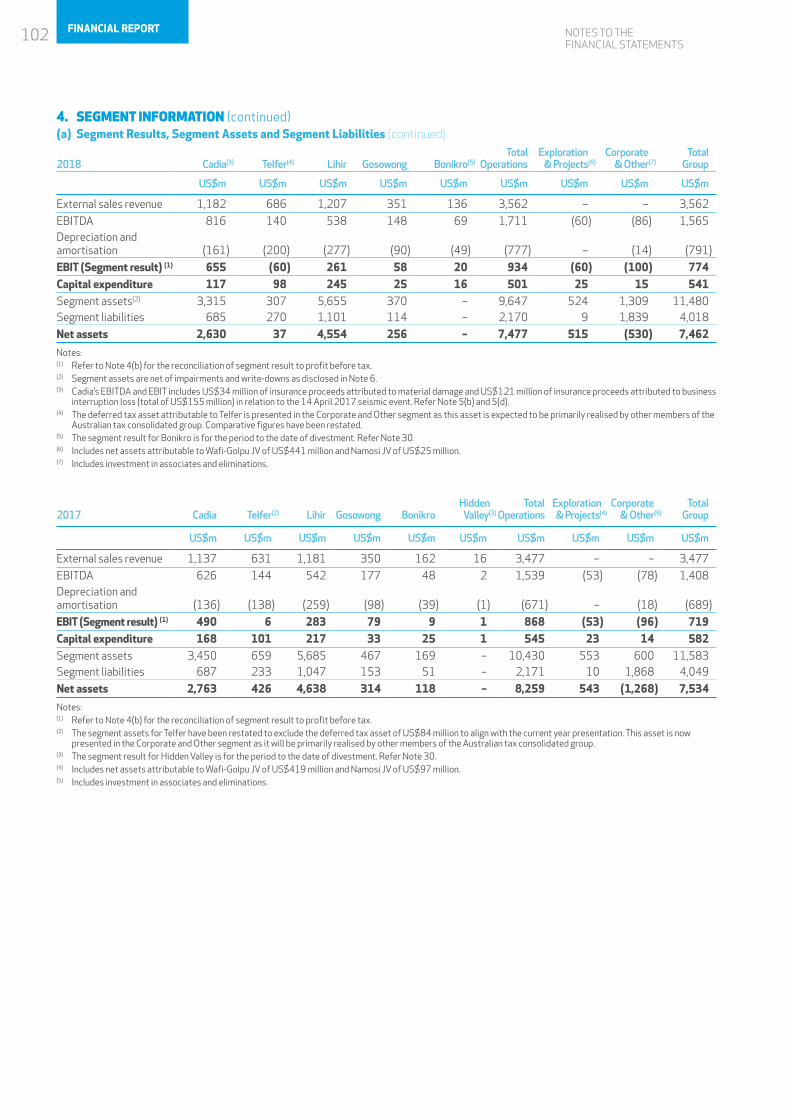
NOTES TO THE FINANCIAL STATEMENTS
4. SEGMENT INFORMATION (continued)(a) Segment Results, Segment Assets and Segment Liabilities (continued)
2018 Cadia(3) Telfer(4) Lihir Gosowong Bonikro(5)Total
OperationsExploration
& Projects(6)Corporate
& Other(7)Total
Group
US$m US$m US$m US$m US$m US$m US$m US$m US$m
External sales revenue 1,182 686 1,207 351 136 3,562 – – 3,562
EBITDA 816 140 538 148 69 1,711 (60) (86) 1,565Depreciation and amortisation (161) (200) (277) (90) (49) (777) – (14) (791)
EBIT (Segment result) (1) 655 (60) 261 58 20 934 (60) (100) 774Capital expenditure 117 98 245 25 16 501 25 15 541Segment assets(2) 3,315 307 5,655 370 – 9,647 524 1,309 11,480Segment liabilities 685 270 1,101 114 – 2,170 9 1,839 4,018
Net assets 2,630 37 4,554 256 – 7,477 515 (530) 7,462
Notes:(1) Refer to Note 4(b) for the reconciliation of segment result to profit before tax.(2) Segment assets are net of impairments and write-downs as disclosed in Note 6.(3) Cadia’s EBITDA and EBIT includes US$34 million of insurance proceeds attributed to material damage and US$121 million of insurance proceeds attributed to business
interruption loss (total of US$155 million) in relation to the 14 April 2017 seismic event. Refer Note 5(b) and 5(d).(4) The deferred tax asset attributable to Telfer is presented in the Corporate and Other segment as this asset is expected to be primarily realised by other members of the
Australian tax consolidated group. Comparative figures have been restated. (5) The segment result for Bonikro is for the period to the date of divestment. Refer Note 30.(6) Includes net assets attributable to Wafi-Golpu JV of US$441 million and Namosi JV of US$25 million.(7) Includes investment in associates and eliminations.
2017 Cadia Telfer(2) Lihir Gosowong BonikroHidden Valley(3)
Total Operations
Exploration & Projects(4)
Corporate& Other(5)
TotalGroup
US$m US$m US$m US$m US$m US$m US$m US$m US$m US$m
External sales revenue 1,137 631 1,181 350 162 16 3,477 – – 3,477
EBITDA 626 144 542 177 48 2 1,539 (53) (78) 1,408Depreciation and amortisation (136) (138) (259) (98) (39) (1) (671) – (18) (689)
EBIT (Segment result) (1) 490 6 283 79 9 1 868 (53) (96) 719Capital expenditure 168 101 217 33 25 1 545 23 14 582Segment assets 3,450 659 5,685 467 169 – 10,430 553 600 11,583Segment liabilities 687 233 1,047 153 51 – 2,171 10 1,868 4,049
Net assets 2,763 426 4,638 314 118 – 8,259 543 (1,268) 7,534
Notes:(1) Refer to Note 4(b) for the reconciliation of segment result to profit before tax.(2) The segment assets for Telfer have been restated to exclude the deferred tax asset of US$84 million to align with the current year presentation. This asset is now
presented in the Corporate and Other segment as it will be primarily realised by other members of the Australian tax consolidated group.(3) The segment result for Hidden Valley is for the period to the date of divestment. Refer Note 30.(4) Includes net assets attributable to Wafi-Golpu JV of US$419 million and Namosi JV of US$97 million.(5) Includes investment in associates and eliminations.
102 FINANCIAL REPORT

Note2018
US$m2017
US$m
(b) Reconciliation of EBIT (Segment Result) to Profit Before Tax Segment Result 4(a) 774 719Finance costs: Finance income 8 2Finance costs (122) (134)
(114) (132)Significant items: Impairment loss on property, plant and equipment 6 (269) –Impairment loss on investment in associate 6 (6) –Write-down of property, plant and equipment 6 (87) (15)Loss on business divestment 6 – (10)Net investment hedge gain/(loss) 6 29 (79)
(333) (104)
Profit before tax 327 483
(c) Geographical Information Sales Revenue from External Customers (1) Bullion (2) Australia 1,615 1,539China (including Hong Kong) 314 274Canada 38 115United Kingdom – 55Concentrate (3) Japan 926 755Singapore 211 163Switzerland 192 47India 79 70United Kingdom 77 28Korea 61 172Philippines 49 220Other – 39
Total sales revenue 3,562 3,477
Non-Current Assets (4) Australia 3,605 4,101Papua New Guinea 5,688 5,754Indonesia 224 277Canada 257 –Côte d’Ivoire 9 106Other 25 96
Total non-current assets 9,808 10,334(1) Revenue is attributable to geographic location, based on the location of customers.(2) Bullion sales to one customer amounted to US$576 million (2017: US$606 million) arising from sales by all operating segments.(3) Concentrate sales to one customer amounted to US$454 million (2017: US$647 million) arising from concentrate sales by Cadia and Telfer.(4) Non-Current Assets includes deferred tax assets of US$69 million (2017: US$80 million).
NOTES TO THE FINANCIAL STATEMENTS
103NEWCREST 2018 ANNUAL REPORT
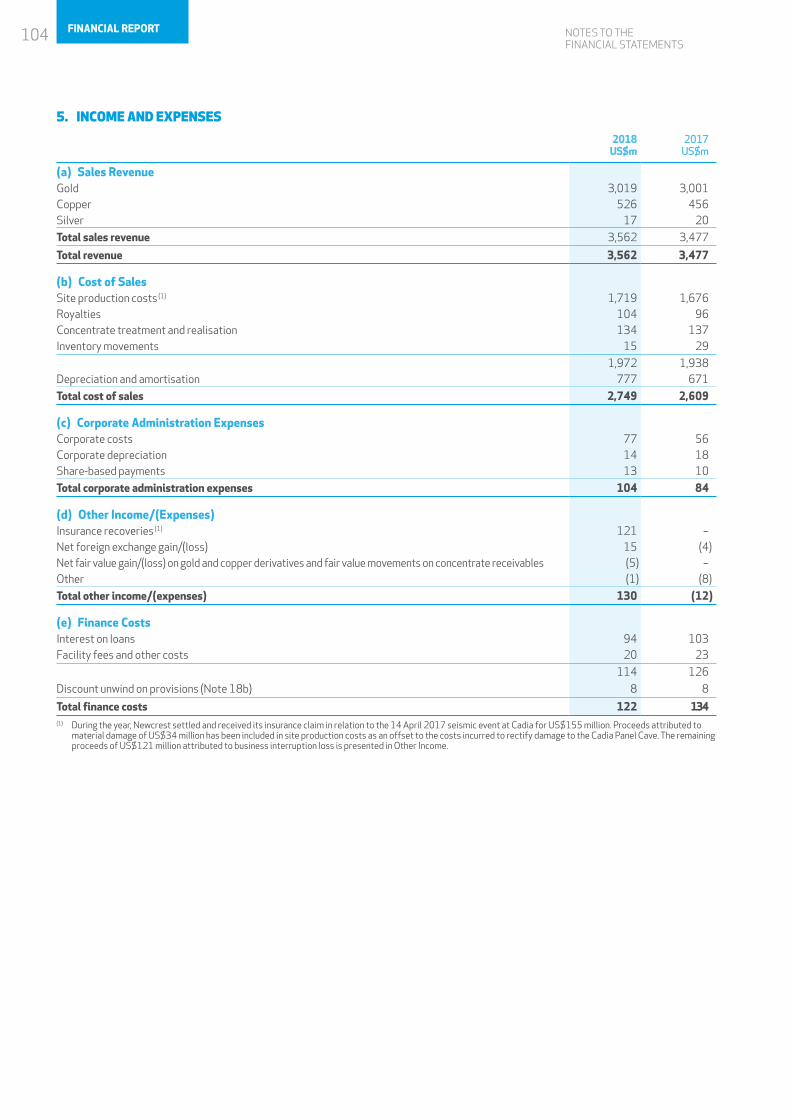
NOTES TO THE FINANCIAL STATEMENTS
5. INCOME AND EXPENSES
2018 US$m
2017 US$m
(a) Sales RevenueGold 3,019 3,001Copper 526 456Silver 17 20
Total sales revenue 3,562 3,477
Total revenue 3,562 3,477
(b) Cost of SalesSite production costs (1) 1,719 1,676Royalties 104 96Concentrate treatment and realisation 134 137Inventory movements 15 29
1,972 1,938Depreciation and amortisation 777 671
Total cost of sales 2,749 2,609
(c) Corporate Administration ExpensesCorporate costs 77 56Corporate depreciation 14 18Share-based payments 13 10
Total corporate administration expenses 104 84
(d) Other Income/(Expenses)Insurance recoveries (1) 121 –Net foreign exchange gain/(loss) 15 (4)Net fair value gain/(loss) on gold and copper derivatives and fair value movements on concentrate receivables (5) –Other (1) (8)
Total other income/(expenses) 130 (12)
(e) Finance CostsInterest on loans 94 103Facility fees and other costs 20 23
114 126
Discount unwind on provisions (Note 18b) 8 8
Total finance costs 122 134(1) During the year, Newcrest settled and received its insurance claim in relation to the 14 April 2017 seismic event at Cadia for US$155 million. Proceeds attributed to
material damage of US$34 million has been included in site production costs as an offset to the costs incurred to rectify damage to the Cadia Panel Cave. The remaining proceeds of US$121 million attributed to business interruption loss is presented in Other Income.
104 FINANCIAL REPORT
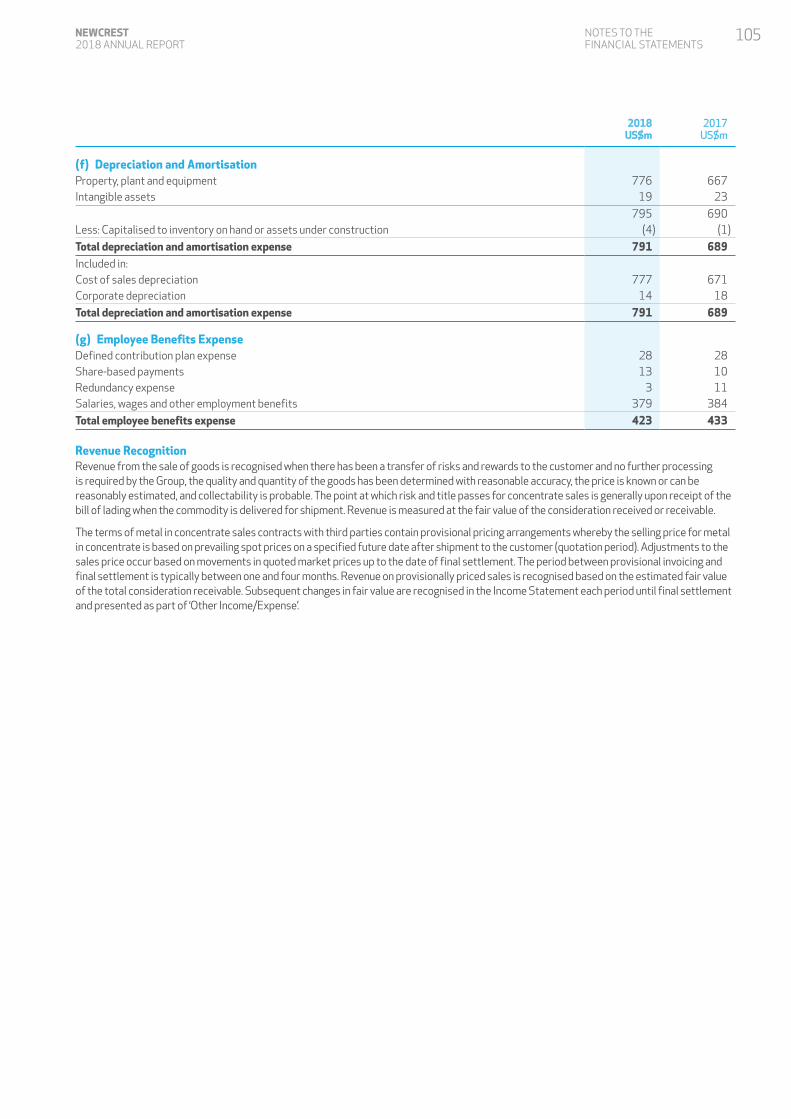
2018 US$m
2017 US$m
(f) Depreciation and AmortisationProperty, plant and equipment 776 667Intangible assets 19 23
795 690Less: Capitalised to inventory on hand or assets under construction (4) (1)
Total depreciation and amortisation expense 791 689Included in:Cost of sales depreciation 777 671Corporate depreciation 14 18
Total depreciation and amortisation expense 791 689
(g) Employee Benefits ExpenseDefined contribution plan expense 28 28Share-based payments 13 10Redundancy expense 3 11Salaries, wages and other employment benefits 379 384
Total employee benefits expense 423 433
Revenue RecognitionRevenue from the sale of goods is recognised when there has been a transfer of risks and rewards to the customer and no further processing is required by the Group, the quality and quantity of the goods has been determined with reasonable accuracy, the price is known or can be reasonably estimated, and collectability is probable. The point at which risk and title passes for concentrate sales is generally upon receipt of the bill of lading when the commodity is delivered for shipment. Revenue is measured at the fair value of the consideration received or receivable.
The terms of metal in concentrate sales contracts with third parties contain provisional pricing arrangements whereby the selling price for metal in concentrate is based on prevailing spot prices on a specified future date after shipment to the customer (quotation period). Adjustments to the sales price occur based on movements in quoted market prices up to the date of final settlement. The period between provisional invoicing and final settlement is typically between one and four months. Revenue on provisionally priced sales is recognised based on the estimated fair value of the total consideration receivable. Subsequent changes in fair value are recognised in the Income Statement each period until final settlement and presented as part of ‘Other Income/Expense’.
NOTES TO THE FINANCIAL STATEMENTS
105NEWCREST 2018 ANNUAL REPORT
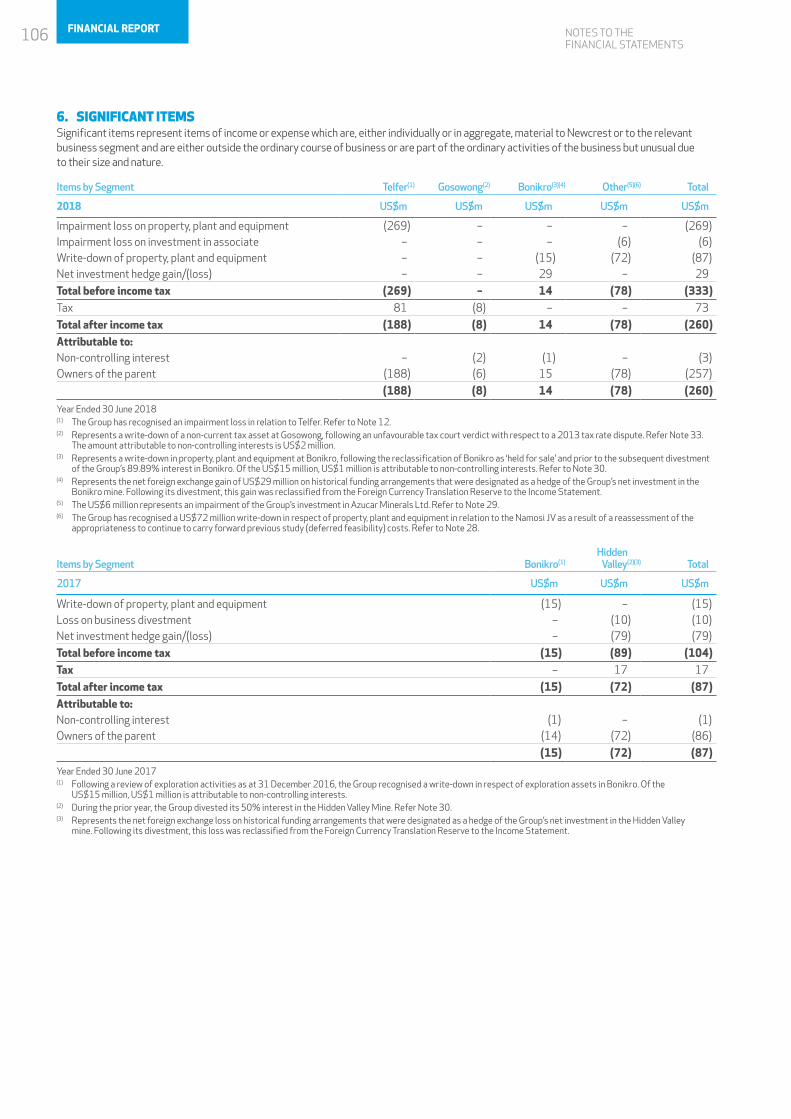
NOTES TO THE FINANCIAL STATEMENTS
6. SIGNIFICANT ITEMSSignificant items represent items of income or expense which are, either individually or in aggregate, material to Newcrest or to the relevant business segment and are either outside the ordinary course of business or are part of the ordinary activities of the business but unusual due to their size and nature.
Items by Segment Telfer(1) Gosowong(2) Bonikro(3)(4) Other(5)(6) Total
2018 US$m US$m US$m US$m US$m
Impairment loss on property, plant and equipment (269) – – – (269)Impairment loss on investment in associate – – – (6) (6)Write-down of property, plant and equipment – – (15) (72) (87)Net investment hedge gain/(loss) – – 29 – 29
Total before income tax (269) – 14 (78) (333)Tax 81 (8) – – 73
Total after income tax (188) (8) 14 (78) (260)Attributable to:Non-controlling interest – (2) (1) – (3)Owners of the parent (188) (6) 15 (78) (257)
(188) (8) 14 (78) (260)
Year Ended 30 June 2018(1) The Group has recognised an impairment loss in relation to Telfer. Refer to Note 12.(2) Represents a write-down of a non-current tax asset at Gosowong, following an unfavourable tax court verdict with respect to a 2013 tax rate dispute. Refer Note 33.
The amount attributable to non-controlling interests is US$2 million.(3) Represents a write-down in property, plant and equipment at Bonikro, following the reclassification of Bonikro as ‘held for sale’ and prior to the subsequent divestment
of the Group’s 89.89% interest in Bonikro. Of the US$15 million, US$1 million is attributable to non-controlling interests. Refer to Note 30.(4) Represents the net foreign exchange gain of US$29 million on historical funding arrangements that were designated as a hedge of the Group’s net investment in the
Bonikro mine. Following its divestment, this gain was reclassified from the Foreign Currency Translation Reserve to the Income Statement.(5) The US$6 million represents an impairment of the Group’s investment in Azucar Minerals Ltd. Refer to Note 29.(6) The Group has recognised a US$72 million write-down in respect of property, plant and equipment in relation to the Namosi JV as a result of a reassessment of the
appropriateness to continue to carry forward previous study (deferred feasibility) costs. Refer to Note 28.
Items by Segment Bonikro(1)Hidden
Valley(2)(3) Total
2017 US$m US$m US$m
Write-down of property, plant and equipment (15) – (15)Loss on business divestment – (10) (10)Net investment hedge gain/(loss) – (79) (79)
Total before income tax (15) (89) (104)Tax – 17 17
Total after income tax (15) (72) (87)Attributable to:Non-controlling interest (1) – (1)Owners of the parent (14) (72) (86)
(15) (72) (87)
Year Ended 30 June 2017(1) Following a review of exploration activities as at 31 December 2016, the Group recognised a write-down in respect of exploration assets in Bonikro. Of the
US$15 million, US$1 million is attributable to non-controlling interests.(2) During the prior year, the Group divested its 50% interest in the Hidden Valley Mine. Refer Note 30.(3) Represents the net foreign exchange loss on historical funding arrangements that were designated as a hedge of the Group’s net investment in the Hidden Valley
mine. Following its divestment, this loss was reclassified from the Foreign Currency Translation Reserve to the Income Statement.
106 FINANCIAL REPORT

7. INCOME TAX EXPENSE
2018 US$m
2017 US$m
(a) Reconciliation of Prima Facie Income Tax Expense to Income Tax Expense per the Income StatementAccounting profit before tax 327 483Income tax expense calculated at 30% (2017: 30%) 98 145Adjustments on Significant items:Impairment loss on investment in associate 2 –Write-down of property, plant and equipment 26 4Loss on business divestment – 3Net investment hedge (gain)/loss (9) 7Write-down of tax asset 8 –
27 14Other (7) 5
Income tax expense per the Income Statement 118 164
(b) Income Tax Expense Comprises:Current income taxCurrent income tax expense 166 97Adjustments to current income tax of prior periods 2 (4)
168 93Deferred tax (1)
Relating to origination and reversal of temporary differences (42) 66Adjustments to deferred tax of prior periods (8) 5
(50) 71
Income tax expense per the Income Statement 118 164(1) Refer to Note 17(a) for movements in deferred taxes.
8. EARNINGS PER SHARE (EPS)
2018US¢
2017US¢
EPS (cents per share)Basic EPS 26.3 40.2Diluted EPS 26.2 40.0
Earnings used in calculating EPS2018
US$m2017
US$m
Earnings used in the calculation of basic and diluted EPS:Profit after income tax attributable to owners of the parent 202 308
Weighted average number of shares2018
No. of shares2017
No. of shares
Share data used in the calculation of basic and diluted EPS:Weighted average number of ordinary shares used in calculating basic EPS 767,412,240 766,654,433Effect of dilutive securities: share rights 2,921,887 3,887,892
Adjusted weighted average number of ordinary shares used in calculating diluted EPS 770,334,127 770,542,325
Rights granted to employees as described in Note 34 have been included in the determination of diluted earnings per share to the extent they are dilutive.
NOTES TO THE FINANCIAL STATEMENTS
107NEWCREST 2018 ANNUAL REPORT
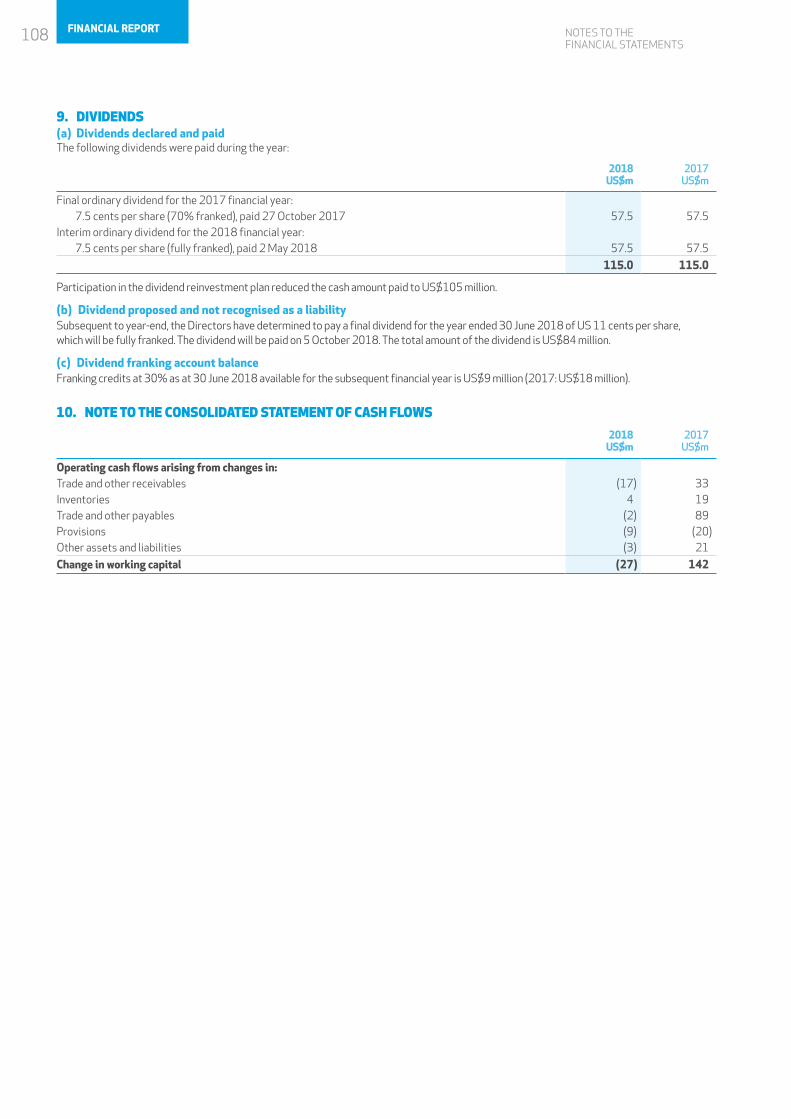
NOTES TO THE FINANCIAL STATEMENTS
9. DIVIDENDS(a) Dividends declared and paidThe following dividends were paid during the year:
2018 US$m
2017 US$m
Final ordinary dividend for the 2017 financial year: 7.5 cents per share (70% franked), paid 27 October 2017 57.5 57.5Interim ordinary dividend for the 2018 financial year: 7.5 cents per share (fully franked), paid 2 May 2018 57.5 57.5
115.0 115.0
Participation in the dividend reinvestment plan reduced the cash amount paid to US$105 million.
(b) Dividend proposed and not recognised as a liabilitySubsequent to year-end, the Directors have determined to pay a final dividend for the year ended 30 June 2018 of US 11 cents per share, which will be fully franked. The dividend will be paid on 5 October 2018. The total amount of the dividend is US$84 million.
(c) Dividend franking account balanceFranking credits at 30% as at 30 June 2018 available for the subsequent financial year is US$9 million (2017: US$18 million).
10. NOTE TO THE CONSOLIDATED STATEMENT OF CASH FLOWS
2018 US$m
2017 US$m
Operating cash flows arising from changes in:Trade and other receivables (17) 33Inventories 4 19Trade and other payables (2) 89Provisions (9) (20)Other assets and liabilities (3) 21
Change in working capital (27) 142
108 FINANCIAL REPORT
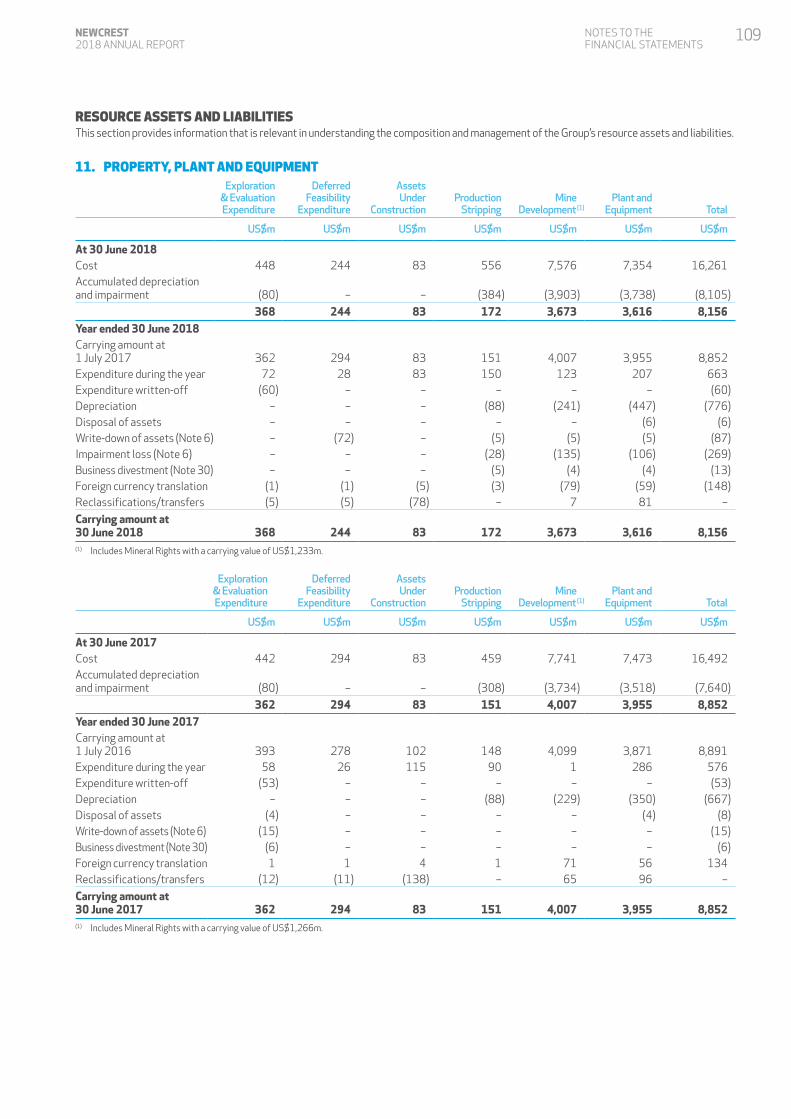
RESOURCE ASSETS AND LIABILITIESThis section provides information that is relevant in understanding the composition and management of the Group’s resource assets and liabilities.
11. PROPERTY, PLANT AND EQUIPMENT Exploration
& EvaluationExpenditure
DeferredFeasibility
Expenditure
AssetsUnder
ConstructionProduction
StrippingMine
Development (1)Plant and
Equipment Total
US$m US$m US$m US$m US$m US$m US$m
At 30 June 2018Cost 448 244 83 556 7,576 7,354 16,261Accumulated depreciation and impairment (80) – – (384) (3,903) (3,738) (8,105)
368 244 83 172 3,673 3,616 8,156Year ended 30 June 2018Carrying amount at 1 July 2017 362 294 83 151 4,007 3,955 8,852Expenditure during the year 72 28 83 150 123 207 663Expenditure written-off (60) – – – – – (60)Depreciation – – – (88) (241) (447) (776)Disposal of assets – – – – – (6) (6)Write-down of assets (Note 6) – (72) – (5) (5) (5) (87)Impairment loss (Note 6) – – – (28) (135) (106) (269)Business divestment (Note 30) – – – (5) (4) (4) (13)Foreign currency translation (1) (1) (5) (3) (79) (59) (148)Reclassifications/transfers (5) (5) (78) – 7 81 –
Carrying amount at 30 June 2018 368 244 83 172 3,673 3,616 8,156(1) Includes Mineral Rights with a carrying value of US$1,233m.
Exploration& EvaluationExpenditure
DeferredFeasibility
Expenditure
AssetsUnder
ConstructionProduction
StrippingMine
Development (1)Plant and
Equipment Total
US$m US$m US$m US$m US$m US$m US$m
At 30 June 2017Cost 442 294 83 459 7,741 7,473 16,492Accumulated depreciation and impairment (80) – – (308) (3,734) (3,518) (7,640)
362 294 83 151 4,007 3,955 8,852Year ended 30 June 2017Carrying amount at 1 July 2016 393 278 102 148 4,099 3,871 8,891Expenditure during the year 58 26 115 90 1 286 576Expenditure written-off (53) – – – – – (53)Depreciation – – – (88) (229) (350) (667)Disposal of assets (4) – – – – (4) (8)Write-down of assets (Note 6) (15) – – – – – (15)Business divestment (Note 30) (6) – – – – – (6)Foreign currency translation 1 1 4 1 71 56 134Reclassifications/transfers (12) (11) (138) – 65 96 –
Carrying amount at 30 June 2017 362 294 83 151 4,007 3,955 8,852(1) Includes Mineral Rights with a carrying value of US$1,266m.
NOTES TO THE FINANCIAL STATEMENTS
109NEWCREST 2018 ANNUAL REPORT
NOTES TO THE FINANCIAL STATEMENTS
11. PROPERTY, PLANT AND EQUIPMENT (continued)Exploration, Evaluation and Deferred Feasibility ExpenditureExploration and EvaluationExploration and evaluation expenditure related to areas of interest is capitalised and carried forward to the extent that:
(i) Rights to tenure of the area of interest are current; and (ii) (a) Costs are expected to be recouped through successful
development and exploitation of the area of interest or alternatively by sale; or
(b) Where activities in the area of interest have not yet reached a stage which permits a reasonable assessment of the existence or otherwise of economically recoverable reserves, and active and significant operations in, or in relation to, the area of interest are continuing.
Such expenditure consists of an accumulation of acquisition costs and direct exploration and evaluation costs incurred, together with an appropriate portion of directly related overhead expenditure.
The carrying value of capitalised exploration and evaluation assets are assessed for impairment when facts and circumstances suggest that the carrying value may exceed its recoverable amount.
Deferred FeasibilityFeasibility expenditure represents costs related to the preparation and completion of a feasibility study to enable a development decision to be made in relation to an area of interest and are capitalised as incurred.
At the commencement of construction, all past exploration, evaluation and deferred feasibility expenditure in respect of an area of interest that has been capitalised is transferred to assets under construction.
Accounting Judgement, Estimates and Assumptions – Exploration, Evaluation and Deferred Feasibility ExpenditureJudgement is required to determine whether future economic benefits are likely, from either exploitation or sale, or whether activities have not reached a stage that permits a reasonable assessment of the existence of reserves. In addition to these judgements, the Group has to make certain estimates and assumptions. The determination of a Joint Ore Reserves Committee (‘JORC’) resource is itself an estimation process that involves varying degrees of uncertainty depending on how the resources are classified (i.e. measured, indicated or inferred). The estimates directly impact when the Group capitalises exploration and evaluation expenditure. The capitalisation policy requires management to make certain estimates and assumptions as to future events and circumstances, in particular, the assessment of whether economic quantities of reserves will be found. Any such estimates and assumptions may change as new information becomes available.
The recoverable amount of capitalised expenditure relating to undeveloped mining projects (projects for which the decision to mine has not yet been approved at the required authorisation level within the Group) can be particularly sensitive to variations in key estimates and assumptions. If a variation in key estimates or assumptions has a negative impact on recoverable amount it could result in a requirement for impairment.
Assets Under ConstructionThis expenditure includes net direct costs of construction, borrowing costs capitalised during construction and an appropriate allocation of attributable overheads. Expenditure is net of proceeds from the sale of ore extracted during the construction phase to the extent that this ore extracted is considered integral to the development of the mine.
After production commences, all aggregated costs of construction are transferred to mine development or plant and equipment as appropriate.
Production Stripping Expenditure Stripping (waste removal) costs are incurred both during the development phase and production phase of operations. Stripping costs incurred during the development phase are capitalised as part of mine development costs. Stripping costs incurred during the production phase are generally considered to create two benefits:
• the production of ore inventory in the period – accounted for as a part of the cost of producing those ore inventories; or
• improved access to the ore to be mined in the future – recognised as ‘production stripping asset’, if the following criteria are met:
‒ Future economic benefits (being improved access to the ore body) associated with the stripping activity are probable;
‒ The component of the ore body for which access has been improved can be accurately identified; and
‒ The costs associated with the stripping activity associated with that component can be reliably measured.
The amount of stripping costs deferred is based on the ratio obtained by dividing the amount of waste tonnes mined by the quantity of gold ounces contained in the ore for each component of the mine. Stripping costs incurred in the period are deferred to the extent that the actual current period waste to contained gold ounce ratio exceeds the life of component expected waste to contained gold ounce ratio (‘life of component’) ratio.
A component is defined as a specific volume of the ore body that is made more accessible by the stripping activity and is determined based on mine plans. An identified component of the ore body is typically a subset of the total ore body of the mine. Each mine may have several components, which are identified based on the mine plan.
The production stripping asset is initially measured at cost, which is the accumulation of costs directly incurred to perform the stripping activity that improves access to the ore within an identified component, plus an allocation of directly attributable overhead costs.
The production stripping asset is depreciated over the expected useful life of the identified component of the ore body that is made more accessible by the activity, on a units of production basis. Economically recoverable reserves are used to determine the expected useful life of the identified component of the ore body.
Accounting Judgement – Production StrippingThe life of component ratio is a function of the mine design and therefore changes to that design will generally result in changes to the ratio. Changes in other technical or economic parameters that impact reserves will also have an impact on the life of component ratio even if they do not affect the mine design. Changes to production stripping resulting from a change in life of component ratios are accounted for prospectively.
110 FINANCIAL REPORT
Mineral RightsMineral rights comprise identifiable exploration and evaluation assets, mineral resources and ore reserves, which are acquired as part of a business combination or a joint arrangement acquisition and are recognised at fair value at date of acquisition. Mineral rights are attributable to specific areas of interest and are amortised when commercial production commences on a units of production basis over the estimated economically recoverable reserves of the mine to which the rights relate.
Plant and Equipment and Mine DevelopmentCostPlant and equipment and mine development is carried at cost less accumulated depreciation and any accumulated impairment losses. The initial cost of an asset comprises its purchase price or construction cost, and any costs directly attributable to bringing the asset into operation, the initial estimate of the rehabilitation obligation, and for qualifying assets (where relevant), borrowing costs. The purchase price or construction cost is the aggregate amount paid and the fair value of any other consideration given to acquire the asset.
Construction cost for mine development includes expenditure in respect of exploration, evaluation and feasibility, previously accumulated and carried forward in relation to areas of interest in which development or construction is underway.
Depreciation and AmortisationItems of plant and equipment and mine development are depreciated over their estimated useful lives.
The Group uses the units of production basis when depreciating mine specific assets which results in a depreciation charge proportional to the depletion of the anticipated remaining life of mine production. Each item’s economic life has due regard to both its physical life limitations and to present assessments of economically recoverable reserves of the mine property at which it is located.
For the remainder of assets, the straight line method is used, resulting in estimated useful lives between 3 – 20 years, the duration of which reflects the specific nature of the asset.
Estimates of remaining useful lives, residual values and depreciation methods are reviewed annually for all major items of plant and equipment and mine development. Any changes are accounted for prospectively.
When an asset is surplus to requirements or no longer has an economic value, the carrying amount of the asset is reviewed and is written down to its recoverable amount or derecognised.
Accounting Estimate and Assumptions – Units of Production Method of Depreciation/AmortisationThe Group uses the units of production basis when depreciating/amortising specific assets which results in a depreciation/amortisation charge proportional to the depletion of the anticipated remaining life of mine production. Each item’s economic life, which is assessed annually, has due regard to both its physical life limitations and to present assessments of economically recoverable reserves of the mine property at which it is located. These calculations require the use of estimates and assumptions. Any change in these estimates and assumptions are accounted for prospectively.
Accounting Estimates and Assumptions – Ore Reserves and Mineral ResourcesThe Group estimates its ore reserves and mineral resources annually at 31 December each year, and reports in the following February, based on information compiled by Competent Persons as defined in accordance with the Australasian code for reporting Exploration Results, Mineral Resources and Ore Resources (JORC code 2012). The estimated quantities of economically recoverable reserves are based upon interpretations of geological models and require assumptions to be made regarding factors such as estimates of short and long-term exchange rates, estimates of short and long-term commodity prices, future capital requirements and future operating performance. Changes in reported reserves estimates can impact the carrying value of property, plant and equipment (including exploration and evaluation assets), the provision for rehabilitation obligations, the recognition of deferred tax assets, as well as the amount of depreciation charged to the Income Statement.
12. IMPAIRMENT OF NON-FINANCIAL ASSETS (a) Impairment testingImpairment tests are performed when there is an indication of impairment. Newcrest conducts a review of the key drivers of the recoverable amount of cash generating units (‘CGUs’) annually, which is used as a source of information to determine whether there is an indication of impairment or reversal of previously recognised impairments. Other factors, such as changes in assumptions in future commodity prices, exchange rates, production rates and input costs, are also monitored to assess for indications of impairment or reversal of previously recognised impairments. Where an indicator of impairment or impairment reversal exists, a detailed estimate of the recoverable amount is determined.
CGUs represent a grouping of assets at the lowest level for which there are separately identifiable cash inflows that are largely independent of the cash inflows from other assets or groups of assets. Generally, this results in the Group evaluating its CGUs as individual mining operations, which is consistent with the Group’s representation of operating segments.
After consideration of the potential indicators which could impact the recoverable amount of the CGUs at 30 June 2018, the Group concluded:
• At Telfer, the current period underperformance to plan and updated life of mine plan (‘LOM’), which forecast a shorter mine life, lower gold recoveries from processing and higher operating costs, represented indicators of potential impairment. An updated assessment of the recoverable amount of Telfer determined that an impairment was required at 30 June 2018. Further details are provided below in section (d) ‘Impacts’.
• At Gosowong, an increase in discount rate applied to the cash flows used in determining the recoverable amount and amendments in the Contract of Work (‘CoW’) with the Government of Indonesia, which increased costs from 1 July 2018, represented indicators of potential impairment. An updated assessment of the recoverable amount of Gosowong has determined that no impairment is required at 30 June 2018.
• At Lihir, an increase in discount rate applied to the cash flows used in determining the recoverable amount represented an indicator of potential impairment. An updated assessment of the recoverable amount of Lihir has determined that no impairment is required at 30 June 2018.
NOTES TO THE FINANCIAL STATEMENTS
111NEWCREST 2018 ANNUAL REPORT
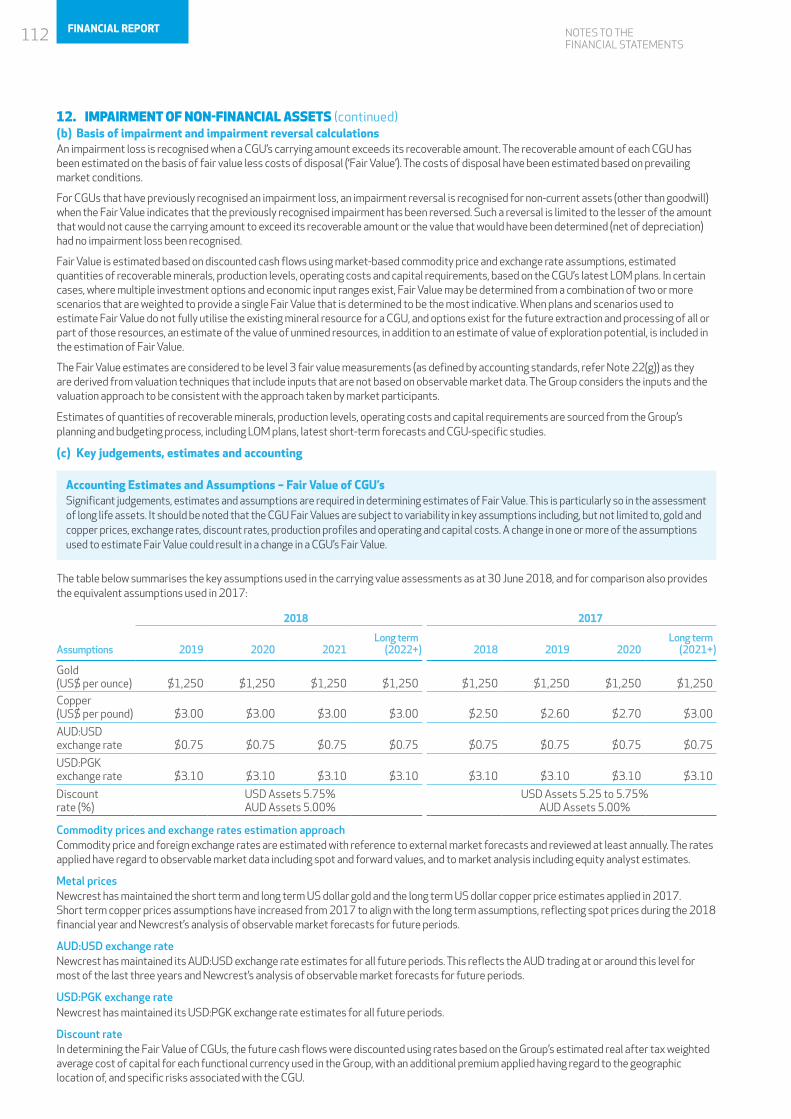
NOTES TO THE FINANCIAL STATEMENTS
12. IMPAIRMENT OF NON-FINANCIAL ASSETS (continued)(b) Basis of impairment and impairment reversal calculationsAn impairment loss is recognised when a CGU’s carrying amount exceeds its recoverable amount. The recoverable amount of each CGU has been estimated on the basis of fair value less costs of disposal (‘Fair Value’). The costs of disposal have been estimated based on prevailing market conditions.
For CGUs that have previously recognised an impairment loss, an impairment reversal is recognised for non-current assets (other than goodwill) when the Fair Value indicates that the previously recognised impairment has been reversed. Such a reversal is limited to the lesser of the amount that would not cause the carrying amount to exceed its recoverable amount or the value that would have been determined (net of depreciation) had no impairment loss been recognised.
Fair Value is estimated based on discounted cash flows using market-based commodity price and exchange rate assumptions, estimated quantities of recoverable minerals, production levels, operating costs and capital requirements, based on the CGU’s latest LOM plans. In certain cases, where multiple investment options and economic input ranges exist, Fair Value may be determined from a combination of two or more scenarios that are weighted to provide a single Fair Value that is determined to be the most indicative. When plans and scenarios used to estimate Fair Value do not fully utilise the existing mineral resource for a CGU, and options exist for the future extraction and processing of all or part of those resources, an estimate of the value of unmined resources, in addition to an estimate of value of exploration potential, is included in the estimation of Fair Value.
The Fair Value estimates are considered to be level 3 fair value measurements (as defined by accounting standards, refer Note 22(g)) as they are derived from valuation techniques that include inputs that are not based on observable market data. The Group considers the inputs and the valuation approach to be consistent with the approach taken by market participants.
Estimates of quantities of recoverable minerals, production levels, operating costs and capital requirements are sourced from the Group’s planning and budgeting process, including LOM plans, latest short-term forecasts and CGU-specific studies.
(c) Key judgements, estimates and accounting
c) Key judgements, estimates and assumptionsAccounting Estimates and Assumptions – Fair Value of CGU’sSignificant judgements, estimates and assumptions are required in determining estimates of Fair Value. This is particularly so in the assessment of long life assets. It should be noted that the CGU Fair Values are subject to variability in key assumptions including, but not limited to, gold and copper prices, exchange rates, discount rates, production profiles and operating and capital costs. A change in one or more of the assumptions used to estimate Fair Value could result in a change in a CGU’s Fair Value.
The table below summarises the key assumptions used in the carrying value assessments as at 30 June 2018, and for comparison also provides the equivalent assumptions used in 2017:
2018 2017
Assumptions 2019 2020 2021Long term
(2022+) 2018 2019 2020Long term
(2021+)
Gold (US$ per ounce) $1,250 $1,250 $1,250 $1,250 $1,250 $1,250 $1,250 $1,250
Copper (US$ per pound) $3.00 $3.00 $3.00 $3.00 $2.50 $2.60 $2.70 $3.00
AUD:USD exchange rate $0.75 $0.75 $0.75 $0.75 $0.75 $0.75 $0.75 $0.75
USD:PGK exchange rate $3.10 $3.10 $3.10 $3.10 $3.10 $3.10 $3.10 $3.10
Discount rate (%)
USD Assets 5.75% AUD Assets 5.00%
USD Assets 5.25 to 5.75% AUD Assets 5.00%
Commodity prices and exchange rates estimation approachCommodity price and foreign exchange rates are estimated with reference to external market forecasts and reviewed at least annually. The rates applied have regard to observable market data including spot and forward values, and to market analysis including equity analyst estimates.
Metal pricesNewcrest has maintained the short term and long term US dollar gold and the long term US dollar copper price estimates applied in 2017. Short term copper prices assumptions have increased from 2017 to align with the long term assumptions, reflecting spot prices during the 2018 financial year and Newcrest’s analysis of observable market forecasts for future periods.
AUD:USD exchange rateNewcrest has maintained its AUD:USD exchange rate estimates for all future periods. This reflects the AUD trading at or around this level for most of the last three years and Newcrest’s analysis of observable market forecasts for future periods.
USD:PGK exchange rateNewcrest has maintained its USD:PGK exchange rate estimates for all future periods.
Discount rateIn determining the Fair Value of CGUs, the future cash flows were discounted using rates based on the Group’s estimated real after tax weighted average cost of capital for each functional currency used in the Group, with an additional premium applied having regard to the geographic location of, and specific risks associated with the CGU.
112 FINANCIAL REPORT
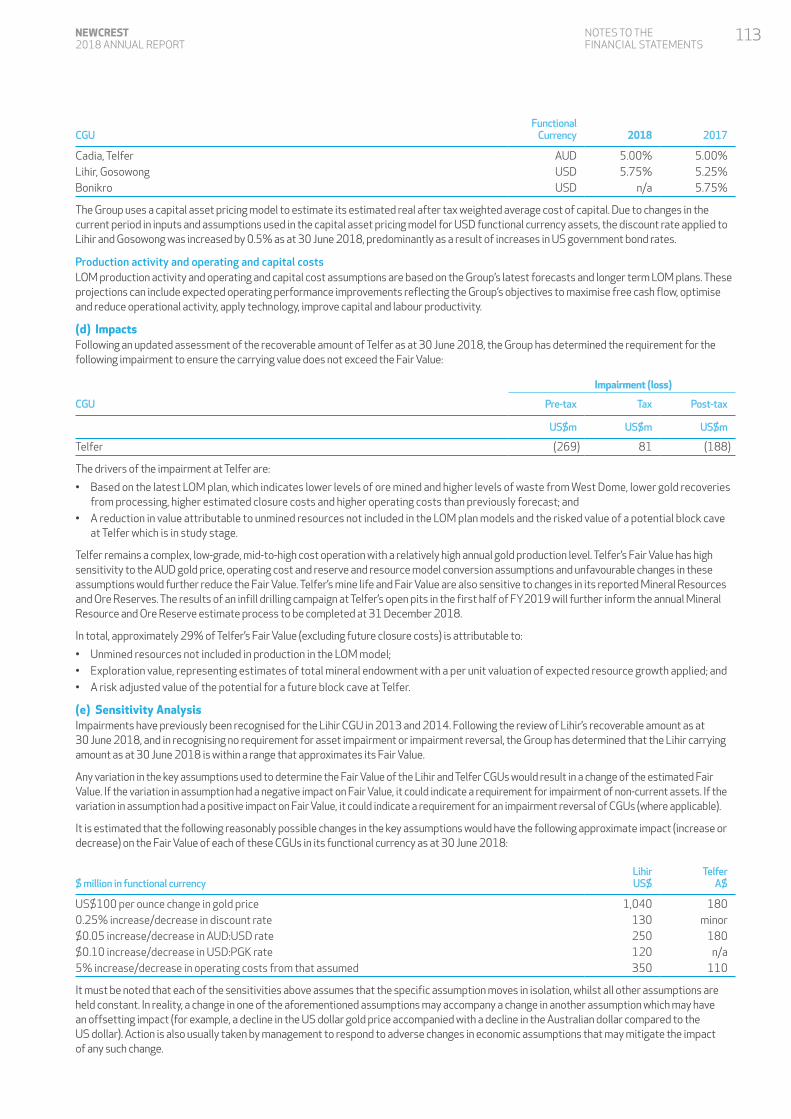
CGUFunctional
Currency 2018 2017
Cadia, Telfer AUD 5.00% 5.00%Lihir, Gosowong USD 5.75% 5.25%Bonikro USD n/a 5.75%
The Group uses a capital asset pricing model to estimate its estimated real after tax weighted average cost of capital. Due to changes in the current period in inputs and assumptions used in the capital asset pricing model for USD functional currency assets, the discount rate applied to Lihir and Gosowong was increased by 0.5% as at 30 June 2018, predominantly as a result of increases in US government bond rates.
Production activity and operating and capital costsLOM production activity and operating and capital cost assumptions are based on the Group’s latest forecasts and longer term LOM plans. These projections can include expected operating performance improvements reflecting the Group’s objectives to maximise free cash flow, optimise and reduce operational activity, apply technology, improve capital and labour productivity.
(d) ImpactsFollowing an updated assessment of the recoverable amount of Telfer as at 30 June 2018, the Group has determined the requirement for the following impairment to ensure the carrying value does not exceed the Fair Value:
Impairment (loss)
CGU Pre-tax Tax Post-tax
US$m US$m US$m
Telfer (269) 81 (188)
The drivers of the impairment at Telfer are:
• Based on the latest LOM plan, which indicates lower levels of ore mined and higher levels of waste from West Dome, lower gold recoveries from processing, higher estimated closure costs and higher operating costs than previously forecast; and
• A reduction in value attributable to unmined resources not included in the LOM plan models and the risked value of a potential block cave at Telfer which is in study stage.
Telfer remains a complex, low-grade, mid-to-high cost operation with a relatively high annual gold production level. Telfer’s Fair Value has high sensitivity to the AUD gold price, operating cost and reserve and resource model conversion assumptions and unfavourable changes in these assumptions would further reduce the Fair Value. Telfer’s mine life and Fair Value are also sensitive to changes in its reported Mineral Resources and Ore Reserves. The results of an infill drilling campaign at Telfer’s open pits in the first half of FY2019 will further inform the annual Mineral Resource and Ore Reserve estimate process to be completed at 31 December 2018.
In total, approximately 29% of Telfer’s Fair Value (excluding future closure costs) is attributable to:
• Unmined resources not included in production in the LOM model;• Exploration value, representing estimates of total mineral endowment with a per unit valuation of expected resource growth applied; and• A risk adjusted value of the potential for a future block cave at Telfer.
(e) Sensitivity AnalysisImpairments have previously been recognised for the Lihir CGU in 2013 and 2014. Following the review of Lihir’s recoverable amount as at 30 June 2018, and in recognising no requirement for asset impairment or impairment reversal, the Group has determined that the Lihir carrying amount as at 30 June 2018 is within a range that approximates its Fair Value.
Any variation in the key assumptions used to determine the Fair Value of the Lihir and Telfer CGUs would result in a change of the estimated Fair Value. If the variation in assumption had a negative impact on Fair Value, it could indicate a requirement for impairment of non-current assets. If the variation in assumption had a positive impact on Fair Value, it could indicate a requirement for an impairment reversal of CGUs (where applicable).
It is estimated that the following reasonably possible changes in the key assumptions would have the following approximate impact (increase or decrease) on the Fair Value of each of these CGUs in its functional currency as at 30 June 2018:
$ million in functional currencyLihir US$
Telfer A$
US$100 per ounce change in gold price 1,040 1800.25% increase/decrease in discount rate 130 minor$0.05 increase/decrease in AUD:USD rate 250 180$0.10 increase/decrease in USD:PGK rate 120 n/a5% increase/decrease in operating costs from that assumed 350 110
It must be noted that each of the sensitivities above assumes that the specific assumption moves in isolation, whilst all other assumptions are held constant. In reality, a change in one of the aforementioned assumptions may accompany a change in another assumption which may have an offsetting impact (for example, a decline in the US dollar gold price accompanied with a decline in the Australian dollar compared to the US dollar). Action is also usually taken by management to respond to adverse changes in economic assumptions that may mitigate the impact of any such change.
NOTES TO THE FINANCIAL STATEMENTS
113NEWCREST 2018 ANNUAL REPORT
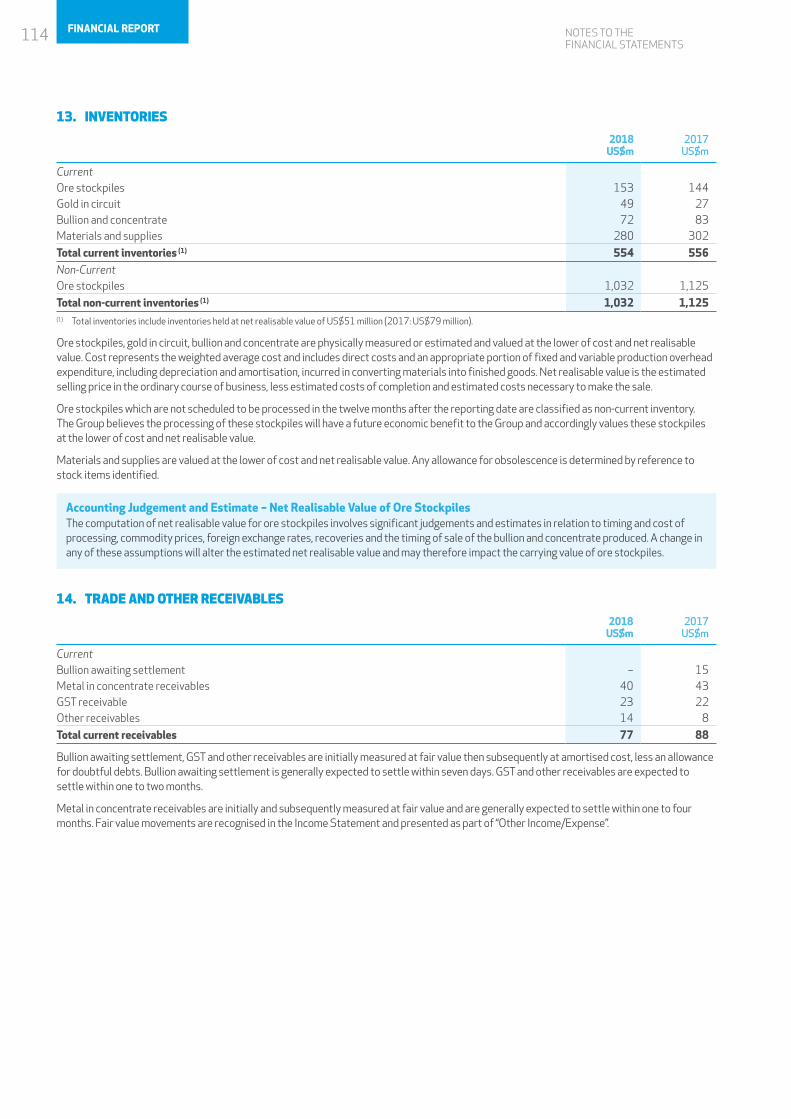
NOTES TO THE FINANCIAL STATEMENTS
13. INVENTORIES
2018 US$m
2017 US$m
CurrentOre stockpiles 153 144Gold in circuit 49 27Bullion and concentrate 72 83Materials and supplies 280 302
Total current inventories (1) 554 556Non-CurrentOre stockpiles 1,032 1,125
Total non-current inventories (1) 1,032 1,125(1) Total inventories include inventories held at net realisable value of US$51 million (2017: US$79 million).
Ore stockpiles, gold in circuit, bullion and concentrate are physically measured or estimated and valued at the lower of cost and net realisable value. Cost represents the weighted average cost and includes direct costs and an appropriate portion of fixed and variable production overhead expenditure, including depreciation and amortisation, incurred in converting materials into finished goods. Net realisable value is the estimated selling price in the ordinary course of business, less estimated costs of completion and estimated costs necessary to make the sale.
Ore stockpiles which are not scheduled to be processed in the twelve months after the reporting date are classified as non-current inventory. The Group believes the processing of these stockpiles will have a future economic benefit to the Group and accordingly values these stockpiles at the lower of cost and net realisable value.
Materials and supplies are valued at the lower of cost and net realisable value. Any allowance for obsolescence is determined by reference to stock items identified.
Accounting Judgement and Estimate – Net Realisable Value of Ore StockpilesThe computation of net realisable value for ore stockpiles involves significant judgements and estimates in relation to timing and cost of processing, commodity prices, foreign exchange rates, recoveries and the timing of sale of the bullion and concentrate produced. A change in any of these assumptions will alter the estimated net realisable value and may therefore impact the carrying value of ore stockpiles.
14. TRADE AND OTHER RECEIVABLES
2018 US$m
2017 US$m
CurrentBullion awaiting settlement – 15Metal in concentrate receivables 40 43GST receivable 23 22Other receivables 14 8
Total current receivables 77 88
Bullion awaiting settlement, GST and other receivables are initially measured at fair value then subsequently at amortised cost, less an allowance for doubtful debts. Bullion awaiting settlement is generally expected to settle within seven days. GST and other receivables are expected to settle within one to two months.
Metal in concentrate receivables are initially and subsequently measured at fair value and are generally expected to settle within one to four months. Fair value movements are recognised in the Income Statement and presented as part of “Other Income/Expense”.
114 FINANCIAL REPORT
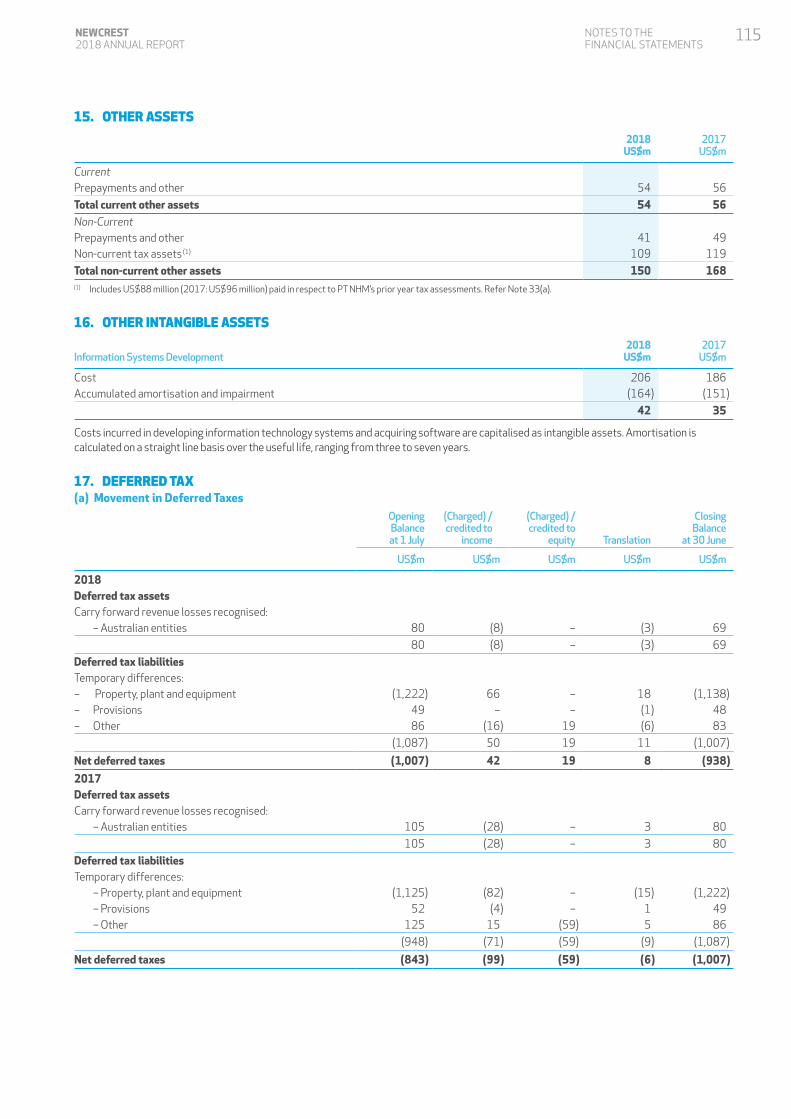
15. OTHER ASSETS
2018 US$m
2017 US$m
CurrentPrepayments and other 54 56
Total current other assets 54 56Non-CurrentPrepayments and other 41 49Non-current tax assets (1) 109 119
Total non-current other assets 150 168(1) Includes US$88 million (2017: US$96 million) paid in respect to PT NHM’s prior year tax assessments. Refer Note 33(a).
16. OTHER INTANGIBLE ASSETS
Information Systems Development2018
US$m2017
US$m
Cost 206 186Accumulated amortisation and impairment (164) (151)
42 35
Costs incurred in developing information technology systems and acquiring software are capitalised as intangible assets. Amortisation is calculated on a straight line basis over the useful life, ranging from three to seven years.
17. DEFERRED TAX(a) Movement in Deferred Taxes
OpeningBalanceat 1 July
(Charged) /credited to
income
(Charged) /credited to
equity Translation
ClosingBalance
at 30 June
US$m US$m US$m US$m US$m
2018Deferred tax assetsCarry forward revenue losses recognised: – Australian entities 80 (8) – (3) 69
80 (8) – (3) 69
Deferred tax liabilitiesTemporary differences:– Property, plant and equipment (1,222) 66 – 18 (1,138)– Provisions 49 – – (1) 48– Other 86 (16) 19 (6) 83
(1,087) 50 19 11 (1,007)
Net deferred taxes (1,007) 42 19 8 (938)
2017Deferred tax assetsCarry forward revenue losses recognised: – Australian entities 105 (28) – 3 80
105 (28) – 3 80
Deferred tax liabilitiesTemporary differences: – Property, plant and equipment (1,125) (82) – (15) (1,222) – Provisions 52 (4) – 1 49 – Other 125 15 (59) 5 86
(948) (71) (59) (9) (1,087)
Net deferred taxes (843) (99) (59) (6) (1,007)
NOTES TO THE FINANCIAL STATEMENTS
115NEWCREST 2018 ANNUAL REPORT

NOTES TO THE FINANCIAL STATEMENTS
17. DEFERRED TAX (continued)(b) Unrecognised Deferred Tax Assets Deferred tax assets have not been recognised in respect of:
• capital losses with a tax effect of US$189 million (2017: US$246 million)
• revenue losses and temporary differences with a tax effect of US$180 million (2017: US$181 million) because it is not probable that the Group will have sufficient future assessable income and/or capital gains available against which the deferred tax asset could be utilised. This is partly due to restrictions that limit the extent to which the losses can be applied to future taxable income in future periods.
(c) Tax ConsolidationThe Company and its wholly-owned Australian subsidiaries are part of a tax consolidated group. Newcrest Mining Limited is the head entity of the tax consolidated group. The tax losses attributable to the Australian entities are available for offsetting against future profits of the tax consolidated group. These tax losses are subject to restrictions that limit the extent to which the losses can be applied against future taxable income. Notwithstanding these restrictions, these losses do not have an expiry date.
Income TaxesCurrent Income TaxCurrent tax assets and liabilities for the current and prior year are measured at the amount expected to be recovered from or paid to the taxation authorities based on the current year's taxable income. The tax rates and tax laws used to compute the amount are those that are enacted or substantively enacted by the reporting date.
Deferred Income TaxDeferred tax assets are recognised for deductible temporary differences, carry-forward of unused tax credits and unused tax losses to the extent that it is probable that taxable profit will be available against which the deductible temporary differences and the carry-forward of unused tax credits and unused tax losses can be utilised.
The carrying amount of deferred tax assets is reviewed at each reporting date and reduced to the extent that it is no longer probable that sufficient taxable profit will be available to allow all or part of the
deferred income tax asset to be utilised. Unrecognised deferred tax assets are reassessed at each reporting date and are recognised to the extent that it has become probable that future taxable profit will allow the deferred tax asset to be recovered.
Deferred tax assets and liabilities are measured based on the expected manner of recovery of the carrying value of an asset or liability. Deferred tax assets and liabilities are measured at the tax rates that are expected to apply to the year when the asset is realised or the liability is settled, based on tax rates (and tax laws) that have been enacted or substantively enacted at the reporting date.
Current and deferred taxes attributable to amounts recognised directly in equity are also recognised directly in equity.
Accounting Judgements, Estimates and Assumptions – Recovery of Deferred Tax AssetsJudgement is required to determine whether deferred tax assets are recognised in the statement of financial position. Deferred tax assets, including those arising from unutilised tax losses, require management to assess the likelihood that the Group will generate sufficient taxable earnings in future periods in order to recognise and utilise those deferred tax assets. Judgement is also required in respect of the expected manner of recovery of the value of an asset or liability (which will then impact the quantum of the deferred tax assets or deferred tax liabilities recognised) and the application of existing tax laws in each jurisdiction.
Estimates of future taxable income are based on forecast cash flows from operations and existing tax laws in each jurisdiction. These assessments require the use of estimates and assumptions such as exchange rates, commodity prices and operating performance over the life of the assets. To the extent that cash flows and taxable income differ significantly from estimates, the ability of the Group to realise the net deferred tax assets reported at the reporting date could be impacted.
Additionally, future changes in tax laws in the jurisdictions in which the Group operates could limit the ability of the Group to obtain tax deductions and recover/utilise deferred tax assets in future periods.
18. PROVISIONS
Note2018
US$m2017
US$m
CurrentEmployee benefits (a) 108 108Mine rehabilitation (b) 9 10Other (c) 20 29
Total current provisions 137 147
Non-CurrentEmployee benefits (a) 39 41Mine rehabilitation (b) 320 262Other (c) 3 4
Total non-current provisions 362 307
Provisions (other than those relating to employee benefits) are recognised when the Group has a present obligation (legal or constructive) as a result of a past event, it is probable that an outflow of resources embodying economic benefits will be required to settle the obligation and a reliable estimate can be made of the amount of the obligation.
116 FINANCIAL REPORT
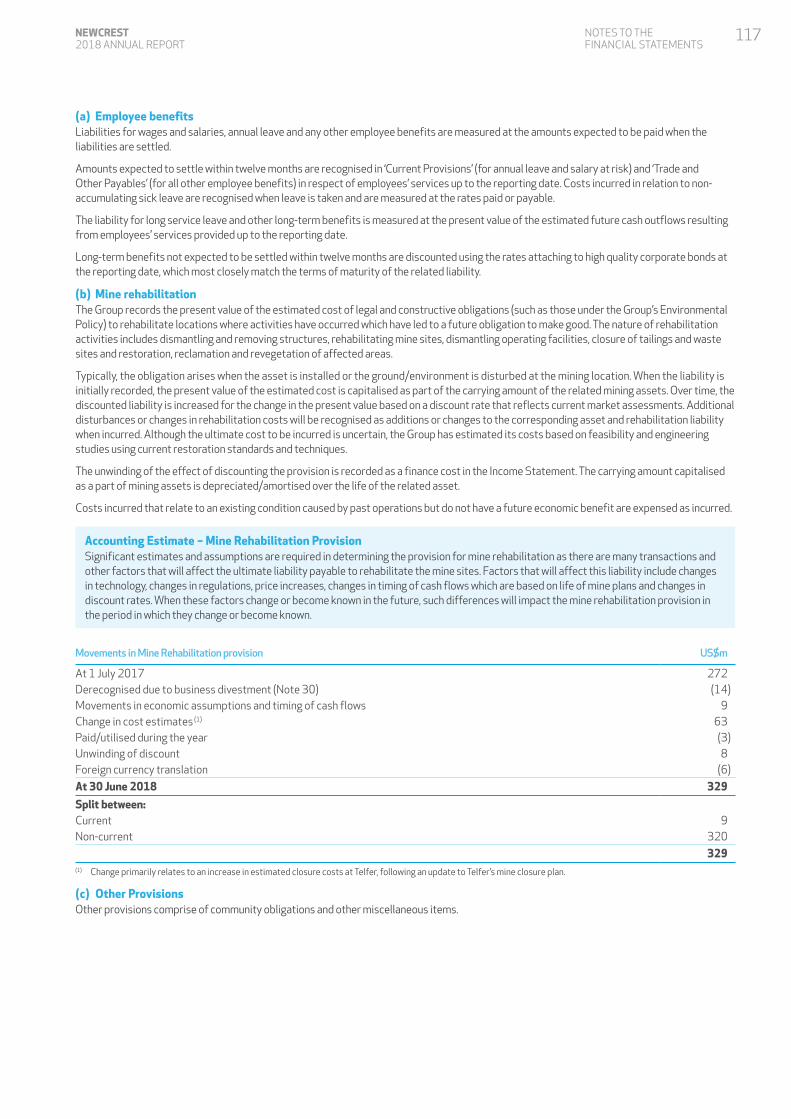
(a) Employee benefitsLiabilities for wages and salaries, annual leave and any other employee benefits are measured at the amounts expected to be paid when the liabilities are settled.
Amounts expected to settle within twelve months are recognised in ‘Current Provisions’ (for annual leave and salary at risk) and ‘Trade and Other Payables’ (for all other employee benefits) in respect of employees’ services up to the reporting date. Costs incurred in relation to non-accumulating sick leave are recognised when leave is taken and are measured at the rates paid or payable.
The liability for long service leave and other long-term benefits is measured at the present value of the estimated future cash outflows resulting from employees’ services provided up to the reporting date.
Long-term benefits not expected to be settled within twelve months are discounted using the rates attaching to high quality corporate bonds at the reporting date, which most closely match the terms of maturity of the related liability.
(b) Mine rehabilitation The Group records the present value of the estimated cost of legal and constructive obligations (such as those under the Group’s Environmental Policy) to rehabilitate locations where activities have occurred which have led to a future obligation to make good. The nature of rehabilitation activities includes dismantling and removing structures, rehabilitating mine sites, dismantling operating facilities, closure of tailings and waste sites and restoration, reclamation and revegetation of affected areas.
Typically, the obligation arises when the asset is installed or the ground/environment is disturbed at the mining location. When the liability is initially recorded, the present value of the estimated cost is capitalised as part of the carrying amount of the related mining assets. Over time, the discounted liability is increased for the change in the present value based on a discount rate that reflects current market assessments. Additional disturbances or changes in rehabilitation costs will be recognised as additions or changes to the corresponding asset and rehabilitation liability when incurred. Although the ultimate cost to be incurred is uncertain, the Group has estimated its costs based on feasibility and engineering studies using current restoration standards and techniques.
The unwinding of the effect of discounting the provision is recorded as a finance cost in the Income Statement. The carrying amount capitalised as a part of mining assets is depreciated/amortised over the life of the related asset.
Costs incurred that relate to an existing condition caused by past operations but do not have a future economic benefit are expensed as incurred.
Accounting Estimate – Mine Rehabilitation ProvisionSignificant estimates and assumptions are required in determining the provision for mine rehabilitation as there are many transactions and other factors that will affect the ultimate liability payable to rehabilitate the mine sites. Factors that will affect this liability include changes in technology, changes in regulations, price increases, changes in timing of cash flows which are based on life of mine plans and changes in discount rates. When these factors change or become known in the future, such differences will impact the mine rehabilitation provision in the period in which they change or become known.
Movements in Mine Rehabilitation provision US$m
At 1 July 2017 272Derecognised due to business divestment (Note 30) (14)Movements in economic assumptions and timing of cash flows 9Change in cost estimates (1) 63Paid/utilised during the year (3)Unwinding of discount 8Foreign currency translation (6)
At 30 June 2018 329
Split between:Current 9Non-current 320
329(1) Change primarily relates to an increase in estimated closure costs at Telfer, following an update to Telfer’s mine closure plan.
(c) Other ProvisionsOther provisions comprise of community obligations and other miscellaneous items.
NOTES TO THE FINANCIAL STATEMENTS
117NEWCREST 2018 ANNUAL REPORT
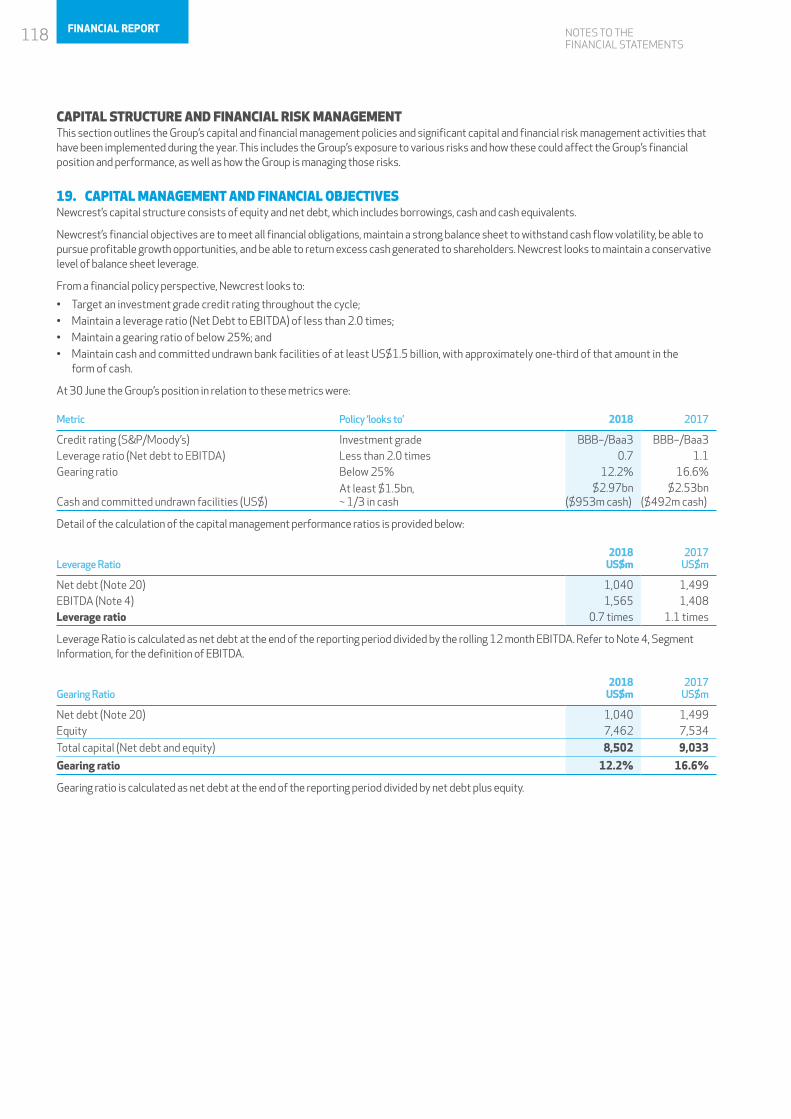
NOTES TO THE FINANCIAL STATEMENTS
CAPITAL STRUCTURE AND FINANCIAL RISK MANAGEMENTThis section outlines the Group’s capital and financial management policies and significant capital and financial risk management activities that have been implemented during the year. This includes the Group’s exposure to various risks and how these could affect the Group’s financial position and performance, as well as how the Group is managing those risks.
19. CAPITAL MANAGEMENT AND FINANCIAL OBJECTIVESNewcrest’s capital structure consists of equity and net debt, which includes borrowings, cash and cash equivalents.
Newcrest’s financial objectives are to meet all financial obligations, maintain a strong balance sheet to withstand cash flow volatility, be able to pursue profitable growth opportunities, and be able to return excess cash generated to shareholders. Newcrest looks to maintain a conservative level of balance sheet leverage.
From a financial policy perspective, Newcrest looks to:
• Target an investment grade credit rating throughout the cycle;• Maintain a leverage ratio (Net Debt to EBITDA) of less than 2.0 times;• Maintain a gearing ratio of below 25%; and• Maintain cash and committed undrawn bank facilities of at least US$1.5 billion, with approximately one-third of that amount in the
form of cash.
At 30 June the Group’s position in relation to these metrics were:
Metric Policy ‘looks to’ 2018 2017
Credit rating (S&P/Moody’s) Investment grade BBB–/Baa3 BBB–/Baa3Leverage ratio (Net debt to EBITDA) Less than 2.0 times 0.7 1.1Gearing ratio Below 25% 12.2% 16.6%
Cash and committed undrawn facilities (US$)At least $1.5bn, ~ 1/3 in cash
$2.97bn ($953m cash)
$2.53bn ($492m cash)
Detail of the calculation of the capital management performance ratios is provided below:
Leverage Ratio2018
US$m2017
US$m
Net debt (Note 20) 1,040 1,499EBITDA (Note 4) 1,565 1,408Leverage ratio 0.7 times 1.1 times
Leverage Ratio is calculated as net debt at the end of the reporting period divided by the rolling 12 month EBITDA. Refer to Note 4, Segment Information, for the definition of EBITDA.
Gearing Ratio2018
US$m2017
US$m
Net debt (Note 20) 1,040 1,499Equity 7,462 7,534
Total capital (Net debt and equity) 8,502 9,033
Gearing ratio 12.2% 16.6%
Gearing ratio is calculated as net debt at the end of the reporting period divided by net debt plus equity.
118 FINANCIAL REPORT
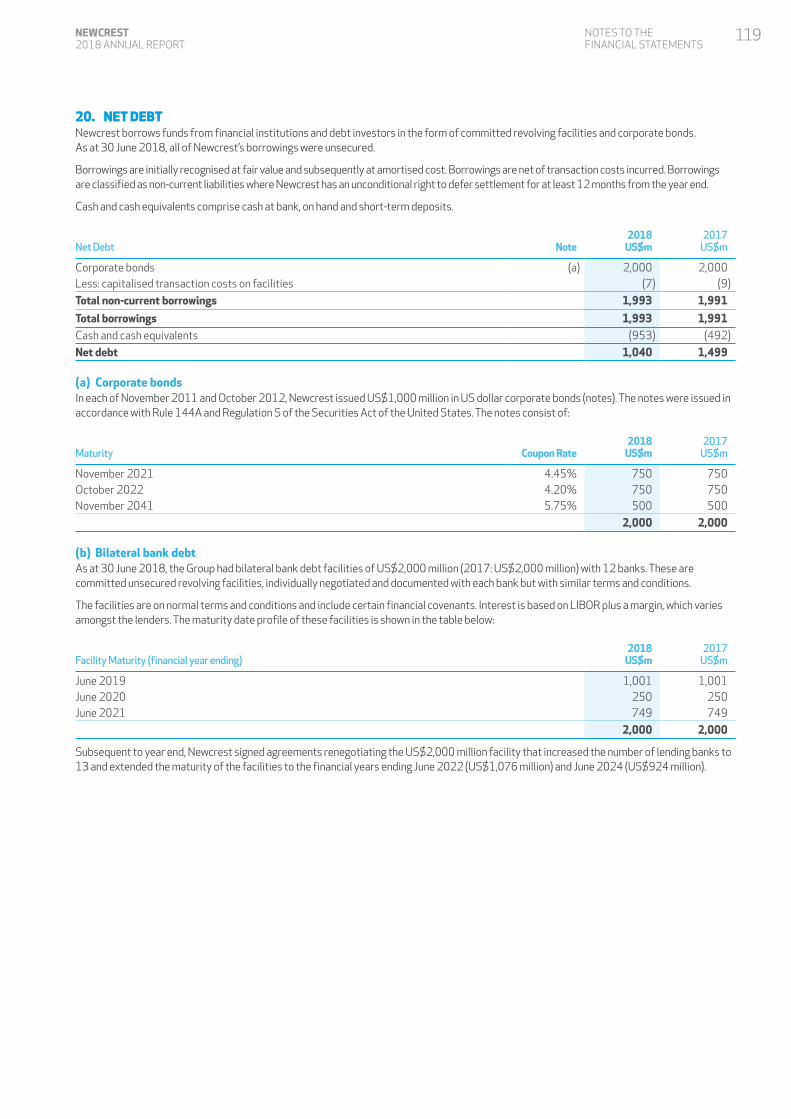
20. NET DEBTNewcrest borrows funds from financial institutions and debt investors in the form of committed revolving facilities and corporate bonds. As at 30 June 2018, all of Newcrest’s borrowings were unsecured.
Borrowings are initially recognised at fair value and subsequently at amortised cost. Borrowings are net of transaction costs incurred. Borrowings are classified as non-current liabilities where Newcrest has an unconditional right to defer settlement for at least 12 months from the year end.
Cash and cash equivalents comprise cash at bank, on hand and short-term deposits.
Net Debt Note2018
US$m2017
US$m
Corporate bonds (a) 2,000 2,000Less: capitalised transaction costs on facilities (7) (9)
Total non-current borrowings 1,993 1,991
Total borrowings 1,993 1,991Cash and cash equivalents (953) (492)
Net debt 1,040 1,499
(a) Corporate bondsIn each of November 2011 and October 2012, Newcrest issued US$1,000 million in US dollar corporate bonds (notes). The notes were issued in accordance with Rule 144A and Regulation S of the Securities Act of the United States. The notes consist of:
Maturity Coupon Rate2018
US$m2017
US$m
November 2021 4.45% 750 750October 2022 4.20% 750 750November 2041 5.75% 500 500
2,000 2,000
(b) Bilateral bank debtAs at 30 June 2018, the Group had bilateral bank debt facilities of US$2,000 million (2017: US$2,000 million) with 12 banks. These are committed unsecured revolving facilities, individually negotiated and documented with each bank but with similar terms and conditions.
The facilities are on normal terms and conditions and include certain financial covenants. Interest is based on LIBOR plus a margin, which varies amongst the lenders. The maturity date profile of these facilities is shown in the table below:
Facility Maturity (financial year ending)2018
US$m2017
US$m
June 2019 1,001 1,001June 2020 250 250June 2021 749 749
2,000 2,000
Subsequent to year end, Newcrest signed agreements renegotiating the US$2,000 million facility that increased the number of lending banks to 13 and extended the maturity of the facilities to the financial years ending June 2022 (US$1,076 million) and June 2024 (US$924 million).
NOTES TO THE FINANCIAL STATEMENTS
119NEWCREST 2018 ANNUAL REPORT
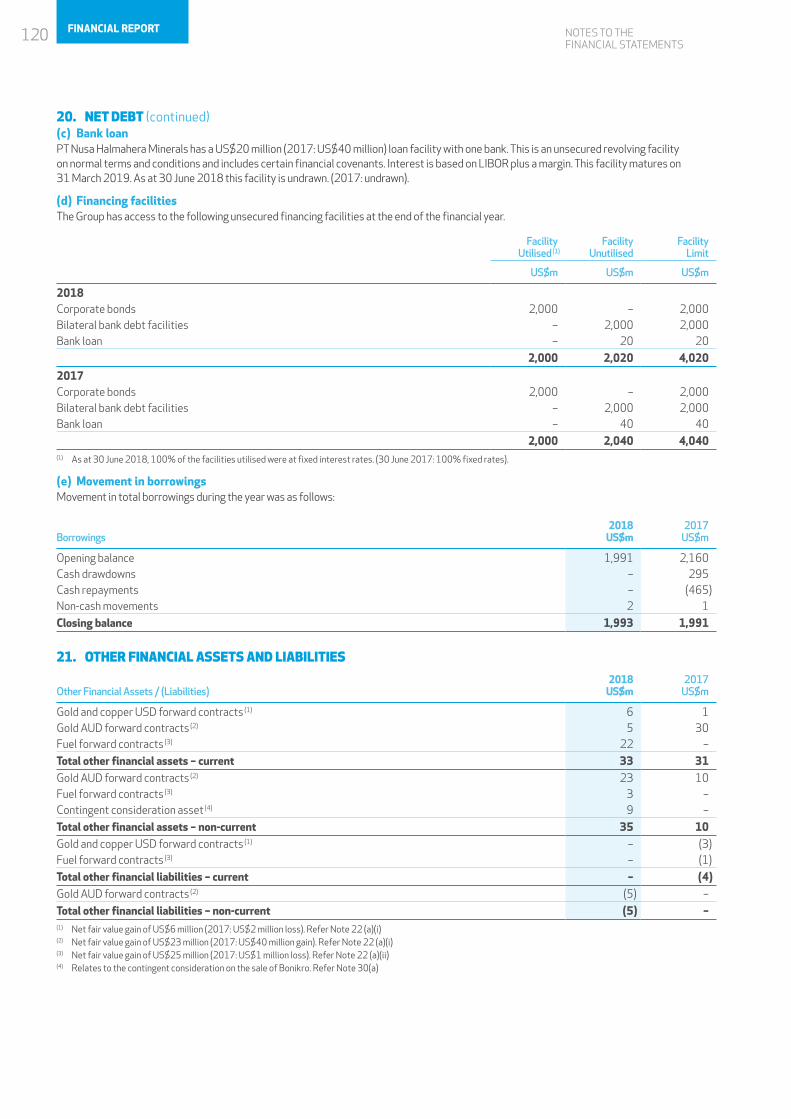
NOTES TO THE FINANCIAL STATEMENTS
20. NET DEBT (continued)(c) Bank loanPT Nusa Halmahera Minerals has a US$20 million (2017: US$40 million) loan facility with one bank. This is an unsecured revolving facility on normal terms and conditions and includes certain financial covenants. Interest is based on LIBOR plus a margin. This facility matures on 31 March 2019. As at 30 June 2018 this facility is undrawn. (2017: undrawn).
(d) Financing facilitiesThe Group has access to the following unsecured financing facilities at the end of the financial year.
FacilityUtilised (1)
FacilityUnutilised
FacilityLimit
US$m US$m US$m
2018Corporate bonds 2,000 – 2,000Bilateral bank debt facilities – 2,000 2,000Bank loan – 20 20
2,000 2,020 4,020
2017Corporate bonds 2,000 – 2,000Bilateral bank debt facilities – 2,000 2,000Bank loan – 40 40
2,000 2,040 4,040(1) As at 30 June 2018, 100% of the facilities utilised were at fixed interest rates. (30 June 2017: 100% fixed rates).
(e) Movement in borrowingsMovement in total borrowings during the year was as follows:
Borrowings2018
US$m2017
US$m
Opening balance 1,991 2,160Cash drawdowns – 295Cash repayments – (465)Non-cash movements 2 1
Closing balance 1,993 1,991
21. OTHER FINANCIAL ASSETS AND LIABILITIES
Other Financial Assets / (Liabilities)2018
US$m2017
US$m
Gold and copper USD forward contracts (1) 6 1Gold AUD forward contracts (2) 5 30Fuel forward contracts (3) 22 –
Total other financial assets – current 33 31Gold AUD forward contracts (2) 23 10Fuel forward contracts (3) 3 –Contingent consideration asset (4) 9 –
Total other financial assets – non-current 35 10Gold and copper USD forward contracts (1) – (3)Fuel forward contracts (3) – (1)
Total other financial liabilities – current – (4)Gold AUD forward contracts (2) (5) –
Total other financial liabilities – non-current (5) –(1) Net fair value gain of US$6 million (2017: US$2 million loss). Refer Note 22 (a)(i)(2) Net fair value gain of US$23 million (2017: US$40 million gain). Refer Note 22 (a)(i)(3) Net fair value gain of US$25 million (2017: US$1 million loss). Refer Note 22 (a)(ii)(4) Relates to the contingent consideration on the sale of Bonikro. Refer Note 30(a)
120 FINANCIAL REPORT
Derivative financial instruments and hedgingThe Group uses derivative financial instruments to manage certain market risks. Derivatives are initially recognised at fair value on the date a derivative contract is entered into and are subsequently remeasured to their fair value at each reporting date. The resulting gain or loss is recognised in the Income Statement immediately unless the derivative is designated and effective as a hedging instrument, in which event, the timing of recognition in the Income Statement depends on the nature of the hedge relationship.
For instruments in hedging transactions, the Group formally designates and documents the relationship between hedging instruments and hedged items at the inception of the transaction, as well as its risk management objective and strategy for undertaking various hedge transactions.
The effective portion of changes in the fair value of derivatives that are designated and qualify as cash flow hedges are recognised in Other Comprehensive Income (‘OCI’) and accumulated in the Hedge Reserve in equity. Any gain or loss relating to an ineffective portion is recognised immediately in the Income Statement. Amounts accumulated in the Hedge Reserve are transferred to the Income Statement in the periods when the hedged item affects the Income Statement, for instance when the forecast sale that is hedged takes place.
Hedge accounting is discontinued when the hedging instrument expires or is sold, terminated or exercised, if it no longer qualifies for hedge accounting or if the Group changes its risk management objective for the hedging relationship. At that point in time, any cumulative gain or loss on the hedging instrument recognised via OCI remains deferred in the Hedge Reserve until the original forecasted transaction occurs. When the forecasted transaction is no longer expected to occur, the cumulative gain or loss that was deferred in the Hedge Reserve is recognised immediately in the Income Statement.
If a hedging instrument being used to hedge a commitment for the purchase or sale of gold or copper is redesignated as a hedge of another specific commitment and the original transaction is still expected to occur, the gains and losses that arose on the hedging instrument prior to its redesignation are deferred and included in the measurement of the original purchase or sale when it takes place. If the hedging instrument is redesignated as a hedge of another commitment because the original purchase or sale transaction is no longer expected to occur, the gains and losses that arose on the hedge prior to its redesignation are recognised in the Income Statement at the date of the redesignation.
22. FINANCIAL RISK MANAGEMENTNewcrest is exposed to a number of financial risks, by virtue of the industry and geographies in which it operates and the nature of the financial instruments it holds. The key risks that could adversely affect Newcrest’s financial assets, liabilities or future cash flows are:
(a) Commodity and other price risks(b) Foreign currency risk(c) Liquidity risk(d) Interest rate risk(e) Credit risk
Further detail of each of these risks is provided below, including management’s strategies to manage each risk. These strategies are executed subject to Board approved policies and procedures and administered by Group Treasury.
(a) Commodity and Other Price Risks(i) Gold and copper priceAll of Newcrest’s gold and copper production is sold into global markets. The market prices of gold and copper are the key drivers of Newcrest’s capacity to generate cash flow. Newcrest is predominantly an unhedged producer and provides its shareholders with exposure to changes in the market price of gold and copper.
Newcrest does undertake selected financial risk management activities to mitigate specific gold and copper price risks, as follows:
Provisionally priced concentrate sales and gold and copper forward sales contractsThe terms of metal in concentrate sales contracts with third parties contain provisional pricing arrangements whereby the selling price for metal in concentrate is based on prevailing spot prices on a specified future date after shipment to the customer (quotation period or ‘QP’). The QP exposure is typically between one and four months. Revenue of provisionally priced sales is recognised based on the estimated fair value of the total consideration receivable. Subsequent changes in fair value are recognised in the Income Statement each period until final settlement and presented as part of ‘Other Income/Expense’. Refer to Note 5(d).
As at 30 June 2018, 161,000 gold ounces and 21,000 copper tonnes were subject to QP adjustment (2017: 109,000 ounces gold and 15,000 tonnes copper).
In order to minimise the short term revenue volatility impact of QP adjustments, particularly across reporting periods, the Group takes out gold and copper forward contracts at the time of concentrate shipments to lock in the price. These forward contracts are not designated into hedge relationships with the fair value adjustments at reporting date recognised in the Income Statement as part of ‘Other Income/Expense’.
NOTES TO THE FINANCIAL STATEMENTS
121NEWCREST 2018 ANNUAL REPORT
NOTES TO THE FINANCIAL STATEMENTS
22. FINANCIAL RISK MANAGEMENT (continued)(a) Commodity and Other Price Risks (continued)The following table details the gold and copper forward contracts outstanding as at the reporting date.
2018 2017
QuantityWeighted
Average Price Fair Value QuantityWeighted
Average Price Fair Value
Gold and Copper USD forward contracts (‘000s) US$ US$m (‘000s) US$ US$m
Gold (ounces)Maturing less than 6 months 100 1,283 3 104 1,257 1Copper (tonnes)Maturing less than 6 months 17 6,847 3 14 5,745 (3)
6 (2)
Partial hedging of Telfer future gold salesNewcrest has put in place hedges for a portion of the Telfer mine’s future gold production. Telfer is a large scale, low grade mine and its profitability and cash flow are both particularly sensitive to the realised Australian dollar gold price. Having regard to the favourable spot and forward prices at that time, hedging instruments in the form of Australian dollar gold forward contracts were put in place to secure margins on a portion of future production to June 2023, which will support the investment in future cutbacks and mine development.
The Telfer AUD gold forward contracts have been designated as cash flow hedges with a hedge relationship of 1:1. Potential sources of hedge ineffectiveness that may affect the hedging relationship during the term are variations to forecast production timing and volume assumptions and credit risk.
As of 30 June 2018, the Group is holding AUD gold forward contracts with the following maturity:
2018 2017Quantity(ounces)
WeightedAverage Price Fair Value
Quantity(ounces)
WeightedAverage Price Fair Value
Gold AUD forward contracts maturing: (‘000s) A$ US$m (‘000s) A$ US$m
Less than 12 months 231 1,739 5 295 1,765 30Between 1–2 years 205 1,729 (3) 135 1,767 10Between 2–3 years 217 1,864 10 – – –Between 3–4 years 204 1,902 7 – – –Between 4–5 years 138 1,942 4 – – –
Total 995 1,826 23 430 1,766 40
These forward contracts are measured at fair value with the effective portion of fair value movements being recognised in OCI and accumulated in the ‘Cash flow hedge reserve’ in equity. There was no hedge ineffectiveness recognised in the Income Statement during the year.
(ii) Fuel priceThe Group’s input costs are exposed to price fluctuations, in particular to diesel and heavy fuel oil prices. To mitigate this risk, the Group has entered into short-term fuel forward contracts to fix certain diesel and heavy fuel oil costs in line with budget expectations.
These forward contracts have been designated as cash flow hedges with a hedge relationship of 1:1. Potential sources of hedge ineffectiveness that may affect the hedging relationship during the term include differences in the pricing of the physical (hedged) item and hedging instrument, timing of physical delivery misaligned with the hedging instrument and credit risk.
2018 2017
QuantityWeighted
Average Price Fair Value QuantityWeighted
Average Price Fair Value
Forward contracts maturing in: (‘000s) US$ US$m (‘000s) US$ US$m
Less than 12 monthsDiesel (barrels) 678 74 10 400 63 (1)Heavy fuel oil (tonnes) 146 361 12 115 292 –Greater than 12 monthsDiesel (barrels) 225 73 3 – – –
Total fair value 25 (1)
These forward contracts are measured at fair value with the effective portion of fair value movements being recognised in OCI and accumulated in the ‘Cash flow hedge reserve’ in equity. There was no hedge ineffectiveness recognised in the Income Statement during the year.
122 FINANCIAL REPORT
(iii) Financial Impacts of HedgesThe impact of hedged items designated in hedging relationships on the Income Statement and OCI, is as follows:
Cash flow hedges Line item in the Income StatementGain/(loss) reclassified from
OCI to Income Statement
2018 US$m
2017 US$m
Telfer gold sales Sales revenue 22 13Diesel Cost of sales – Site production costs 5 –Heavy fuel oil Cost of sales – Site production costs 8 3Borrowings Other income/(expenses) – Net FX gain/(loss) – 7
Total 35 23
(iv) Sensitivity Analysis The following table summarises the sensitivity of financial assets and financial liabilities held at the reporting date to movement in the gold price with all other variables held constant. The 10% movement for gold (2017: 15%) is based on reasonably possible changes, over a financial year, using an observed range of actual historical rates for the preceding five year period.
Post-tax gain/(loss) Impact on Profit (1)
Higher / (Lower) Impact on Equity (2)
Higher / (Lower)
2018 US$m
2017 US$m
2018 US$m
2017 US$m
Gold Gold +10% (2017: +15%) 5 – (92) (57)Gold -10% (2017: -15%) (5) – 92 57(1) Represents the impact of the movement in commodity prices on the balance of the financial assets and financial liabilities at year end.(2) For derivatives which are in an effective hedging relationship, all fair value movements are recognised in Other Comprehensive Income.
The sensitivity of the exposure of copper, diesel and heavy fuel oil prices on financial assets and financial liabilities at year end has been analysed and determined to be not material to the Group.
(b) Foreign Currency RiskThe Group undertakes transactions denominated in foreign currencies, hence exposures to exchange rate fluctuations arise. The Group’s revenue is primarily denominated in US dollars whereas a material proportion of costs (including capital expenditure) are collectively in Australian dollars and PNG Kina. The Group’s Australian entities have AUD functional currencies, while all non-Australian operating entities have USD functional currencies.
The Group’s Statement of Financial Position can also be affected materially by movements in the AUD:USD exchange rate. Measuring the exposure to foreign exchange risk is achieved by regularly monitoring and performing sensitivity analysis on the Group’s financial position.
The carrying amounts of the Group’s US dollar denominated financial assets and liabilities in entities which do not have a US dollar functional currency at the reporting date are as follows:
US Dollar Denominated Balances 2018
US$m2017
US$m
Financial Assets Cash and cash equivalents 761 347Trade and other receivables 40 43Related party receivables 4 42Derivatives 31 1
836 433 Financial Liabilities Payables 27 32 Related party payables 28 18 Borrowings 2,000 2,000 Derivatives – 3
2,055 2,053
Gross Exposure (1,219) (1,620) Net investment in US dollar functional currency entities 1,500 2,000
Net Exposure (inclusive of net investment in foreign operations) 281 380
NOTES TO THE FINANCIAL STATEMENTS
123NEWCREST 2018 ANNUAL REPORT
NOTES TO THE FINANCIAL STATEMENTS
22. FINANCIAL RISK MANAGEMENT (continued)(b) Foreign Currency Risk (continued)Net investment hedgesThe Group seeks to mitigate the effect of its foreign currency exposure by borrowing in US dollars. The entity which undertakes the majority of the Group’s borrowing activities has an AUD functional currency. Where considered appropriate the US dollar denominated debt (net of cash) is designated as a Net investment in foreign operations.
Exchange gains or losses upon subsequent revaluation of US dollar denominated borrowings and cash from the historical draw down rate to the period end spot exchange rate are recognised through Other Comprehensive Income and deferred in equity in the Foreign Currency Translation Reserve and will be released to the Income Statement if the foreign operation is sold.
As at 30 June 2018, US dollar borrowings (net of cash) of US$1,500 million were designated as a net investment in foreign operations (2017: US$2,000 million).
Sensitivity analysisThe following table details the Group’s sensitivity arising in respect of translation of financial assets and financial liabilities to a 10% movement (2017: 10%) in the Australian dollar against the US dollar at the reporting date, with all other variables held constant. The percentage sensitivity is based on reasonably possible changes, over a financial year, using the observed range of actual historical rates for the preceding five-year period.
Post-tax gain/(loss)
Impact on Profit After Tax
Higher/(Lower) Impact on Equity Higher/(Lower)
2018 US$m
2017 US$m
2018 US$m
2017 US$m
AUD/USD +10% (2017: +10%) (18) (27) (103) (140)AUD/USD -10% (2017: -10%) 18 27 103 140
Significant assumptions used in the foreign currency exposure sensitivity analysis above include:
• Reasonably possible movements in foreign exchange rates; The reasonably possible movement of 10% (2017: 10%) was calculated by taking the AUD spot rate as at the reporting date, moving this
spot rate by 10% (2017:10%) and then re-converting the AUD into USD with the “new spot-rate”. This methodology reflects the translation methodology undertaken by the Group.
• The translation of the net assets in subsidiaries with a functional currency other than AUD has not been included in the sensitivity analysis as part of the equity movement.
(c) Liquidity Risk Newcrest is exposed to liquidity risk primarily through its capital management policies and objectives, which utilise debt as a key element of the Group’s capital structure. The specific risk exposures include the sufficiency of available unutilised facilities and the repayment maturity profile of existing financial instruments.
Liquidity risk is managed centrally by Group Treasury to ensure sufficient liquid funds are available to meet the Group’s financial commitments through the following management actions:
• Targeting to maintain cash and committed undrawn bank facilities of at least US$1,500 million, with approximately one-third of that amount in the form of cash.
• Targeting to maintain an investment grade credit rating.• Forecasting of cash flows relating to operational, investing and financing activities, including sensitivity analysis to test multiple scenarios.• Management of repayment maturities to avoid excessive refinancing in any period.• Maintain funding flexibility with committed available credit lines with a variety of counterparties.• Managing credit risk related to financial assets.
The Group maintains a balance between continuity of funding and flexibility through the use of cash, loans and committed available credit lines. Included in Note 20 is a list of undrawn facilities that the Group has at its disposal to manage liquidity risk.
124 FINANCIAL REPORT
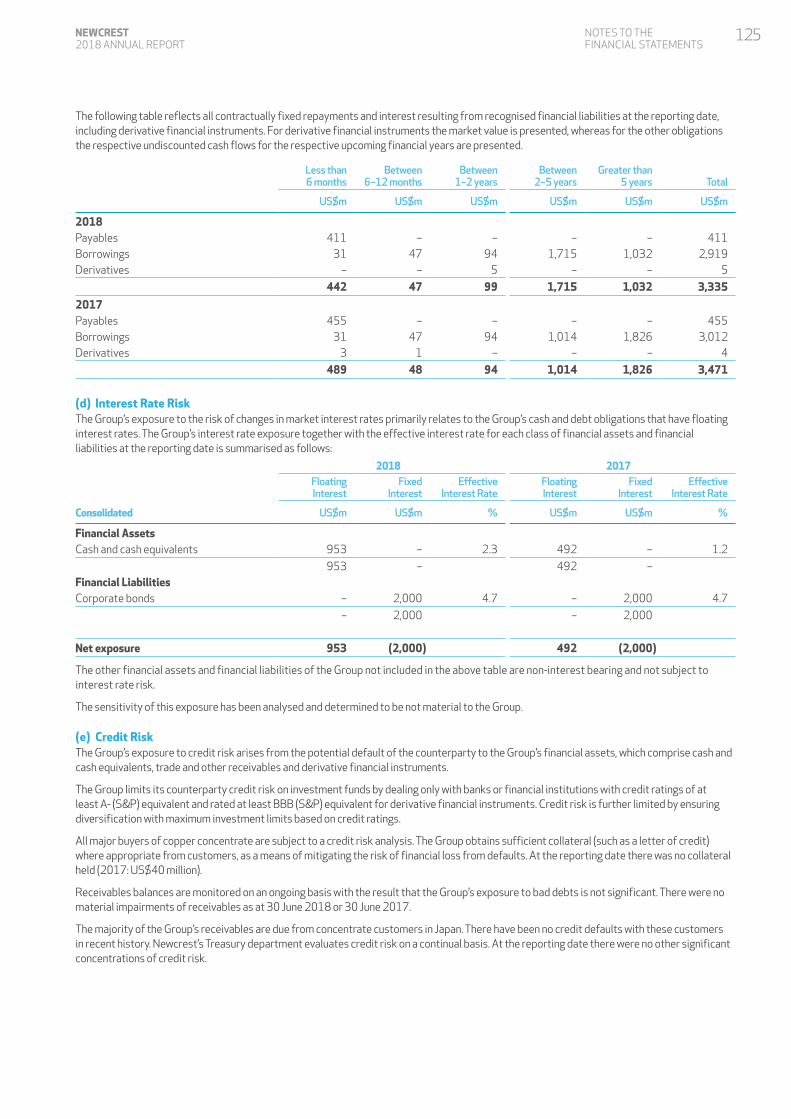
The following table reflects all contractually fixed repayments and interest resulting from recognised financial liabilities at the reporting date, including derivative financial instruments. For derivative financial instruments the market value is presented, whereas for the other obligations the respective undiscounted cash flows for the respective upcoming financial years are presented.
Less than 6 months
Between 6–12 months
Between1–2 years
Between2–5 years
Greater than 5 years Total
US$m US$m US$m US$m US$m US$m
2018Payables 411 – – – – 411Borrowings 31 47 94 1,715 1,032 2,919Derivatives – – 5 – – 5
442 47 99 1,715 1,032 3,335
2017Payables 455 – – – – 455Borrowings 31 47 94 1,014 1,826 3,012Derivatives 3 1 – – – 4
489 48 94 1,014 1,826 3,471
(d) Interest Rate RiskThe Group’s exposure to the risk of changes in market interest rates primarily relates to the Group’s cash and debt obligations that have floating interest rates. The Group’s interest rate exposure together with the effective interest rate for each class of financial assets and financial liabilities at the reporting date is summarised as follows:
2018 2017FloatingInterest
FixedInterest
EffectiveInterest Rate
FloatingInterest
FixedInterest
EffectiveInterest Rate
Consolidated US$m US$m % US$m US$m %
Financial AssetsCash and cash equivalents 953 – 2.3 492 – 1.2
953 – 492 –Financial LiabilitiesCorporate bonds – 2,000 4.7 – 2,000 4.7
– 2,000 – 2,000
Net exposure 953 (2,000) 492 (2,000)
The other financial assets and financial liabilities of the Group not included in the above table are non-interest bearing and not subject to interest rate risk.
The sensitivity of this exposure has been analysed and determined to be not material to the Group.
(e) Credit RiskThe Group’s exposure to credit risk arises from the potential default of the counterparty to the Group’s financial assets, which comprise cash and cash equivalents, trade and other receivables and derivative financial instruments.
The Group limits its counterparty credit risk on investment funds by dealing only with banks or financial institutions with credit ratings of at least A- (S&P) equivalent and rated at least BBB (S&P) equivalent for derivative financial instruments. Credit risk is further limited by ensuring diversification with maximum investment limits based on credit ratings.
All major buyers of copper concentrate are subject to a credit risk analysis. The Group obtains sufficient collateral (such as a letter of credit) where appropriate from customers, as a means of mitigating the risk of financial loss from defaults. At the reporting date there was no collateral held (2017: US$40 million).
Receivables balances are monitored on an ongoing basis with the result that the Group’s exposure to bad debts is not significant. There were no material impairments of receivables as at 30 June 2018 or 30 June 2017.
The majority of the Group’s receivables are due from concentrate customers in Japan. There have been no credit defaults with these customers in recent history. Newcrest’s Treasury department evaluates credit risk on a continual basis. At the reporting date there were no other significant concentrations of credit risk.
NOTES TO THE FINANCIAL STATEMENTS
125NEWCREST 2018 ANNUAL REPORT
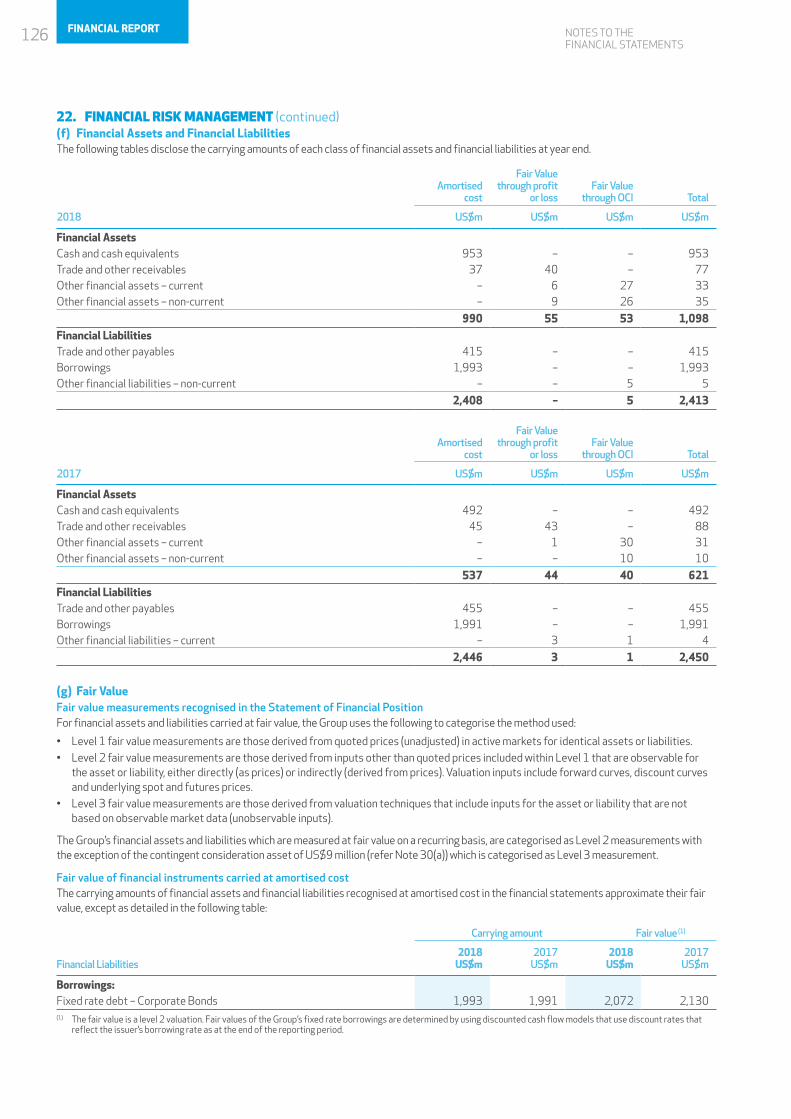
NOTES TO THE FINANCIAL STATEMENTS
22. FINANCIAL RISK MANAGEMENT (continued)(f) Financial Assets and Financial LiabilitiesThe following tables disclose the carrying amounts of each class of financial assets and financial liabilities at year end.
Amortisedcost
Fair Valuethrough profit
or lossFair Value
through OCI Total
2018 US$m US$m US$m US$m
Financial AssetsCash and cash equivalents 953 – – 953Trade and other receivables 37 40 – 77Other financial assets – current – 6 27 33Other financial assets – non-current – 9 26 35
990 55 53 1,098Financial LiabilitiesTrade and other payables 415 – – 415Borrowings 1,993 – – 1,993Other financial liabilities – non-current – – 5 5
2,408 – 5 2,413
Amortisedcost
Fair Valuethrough profit
or lossFair Value
through OCI Total
2017 US$m US$m US$m US$m
Financial AssetsCash and cash equivalents 492 – – 492Trade and other receivables 45 43 – 88Other financial assets – current – 1 30 31Other financial assets – non-current – – 10 10
537 44 40 621Financial LiabilitiesTrade and other payables 455 – – 455Borrowings 1,991 – – 1,991Other financial liabilities – current – 3 1 4
2,446 3 1 2,450
(g) Fair ValueFair value measurements recognised in the Statement of Financial PositionFor financial assets and liabilities carried at fair value, the Group uses the following to categorise the method used:
• Level 1 fair value measurements are those derived from quoted prices (unadjusted) in active markets for identical assets or liabilities.• Level 2 fair value measurements are those derived from inputs other than quoted prices included within Level 1 that are observable for
the asset or liability, either directly (as prices) or indirectly (derived from prices). Valuation inputs include forward curves, discount curves and underlying spot and futures prices.
• Level 3 fair value measurements are those derived from valuation techniques that include inputs for the asset or liability that are not based on observable market data (unobservable inputs).
The Group’s financial assets and liabilities which are measured at fair value on a recurring basis, are categorised as Level 2 measurements with the exception of the contingent consideration asset of US$9 million (refer Note 30(a)) which is categorised as Level 3 measurement.
Fair value of financial instruments carried at amortised costThe carrying amounts of financial assets and financial liabilities recognised at amortised cost in the financial statements approximate their fair value, except as detailed in the following table:
Carrying amount Fair value (1)
Financial Liabilities2018
US$m2017
US$m2018
US$m2017
US$m
Borrowings:Fixed rate debt – Corporate Bonds 1,993 1,991 2,072 2,130(1) The fair value is a level 2 valuation. Fair values of the Group’s fixed rate borrowings are determined by using discounted cash flow models that use discount rates that
reflect the issuer’s borrowing rate as at the end of the reporting period.
126 FINANCIAL REPORT
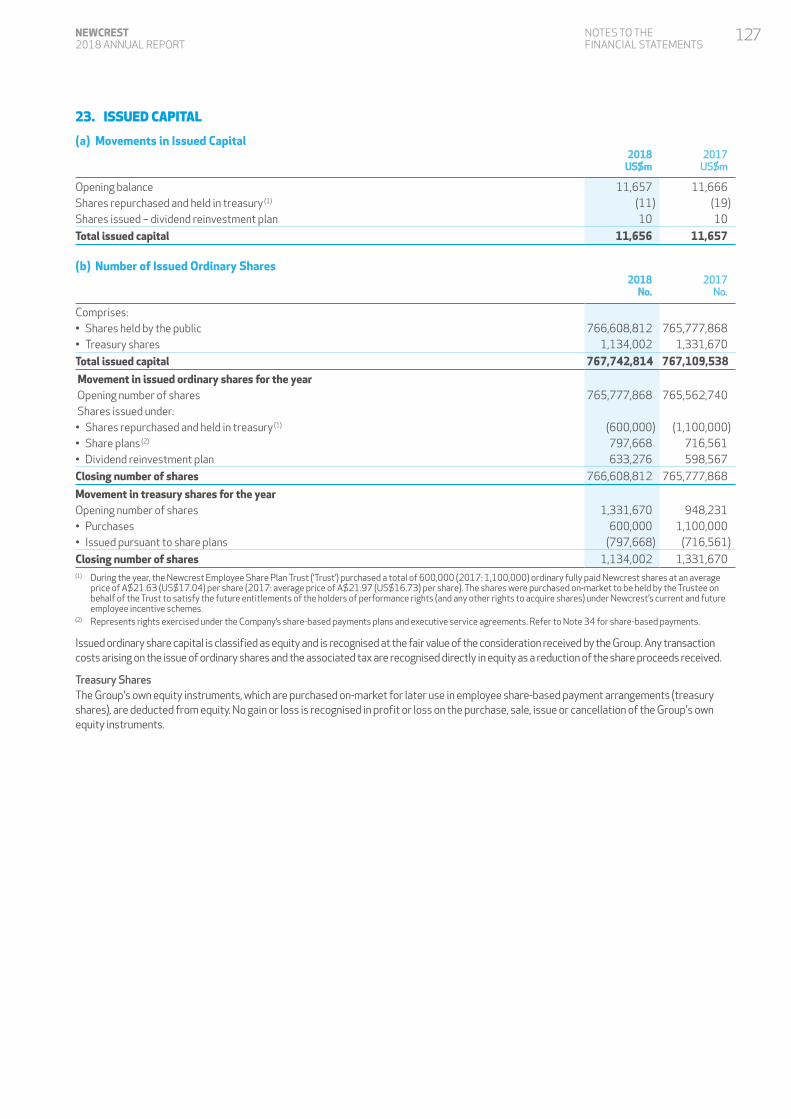
23. ISSUED CAPITAL
(a) Movements in Issued Capital 2018
US$m2017
US$m
Opening balance 11,657 11,666Shares repurchased and held in treasury (1) (11) (19)Shares issued – dividend reinvestment plan 10 10
Total issued capital 11,656 11,657
(b) Number of Issued Ordinary Shares 2018
No. 2017
No.
Comprises: • Shares held by the public 766,608,812 765,777,868• Treasury shares 1,134,002 1,331,670
Total issued capital 767,742,814 767,109,538
Movement in issued ordinary shares for the year Opening number of shares 765,777,868 765,562,740 Shares issued under: • Shares repurchased and held in treasury (1) (600,000) (1,100,000)• Share plans (2) 797,668 716,561• Dividend reinvestment plan 633,276 598,567
Closing number of shares 766,608,812 765,777,868
Movement in treasury shares for the year Opening number of shares 1,331,670 948,231• Purchases 600,000 1,100,000• Issued pursuant to share plans (797,668) (716,561)
Closing number of shares 1,134,002 1,331,670(1) During the year, the Newcrest Employee Share Plan Trust (‘Trust’) purchased a total of 600,000 (2017: 1,100,000) ordinary fully paid Newcrest shares at an average
price of A$21.63 (US$17.04) per share (2017: average price of A$21.97 (US$16.73) per share). The shares were purchased on-market to be held by the Trustee on behalf of the Trust to satisfy the future entitlements of the holders of performance rights (and any other rights to acquire shares) under Newcrest’s current and future employee incentive schemes.
(2) Represents rights exercised under the Company’s share-based payments plans and executive service agreements. Refer to Note 34 for share-based payments.
Issued ordinary share capital is classified as equity and is recognised at the fair value of the consideration received by the Group. Any transaction costs arising on the issue of ordinary shares and the associated tax are recognised directly in equity as a reduction of the share proceeds received.
Treasury SharesThe Group's own equity instruments, which are purchased on-market for later use in employee share-based payment arrangements (treasury shares), are deducted from equity. No gain or loss is recognised in profit or loss on the purchase, sale, issue or cancellation of the Group's own equity instruments.
NOTES TO THE FINANCIAL STATEMENTS
127NEWCREST 2018 ANNUAL REPORT
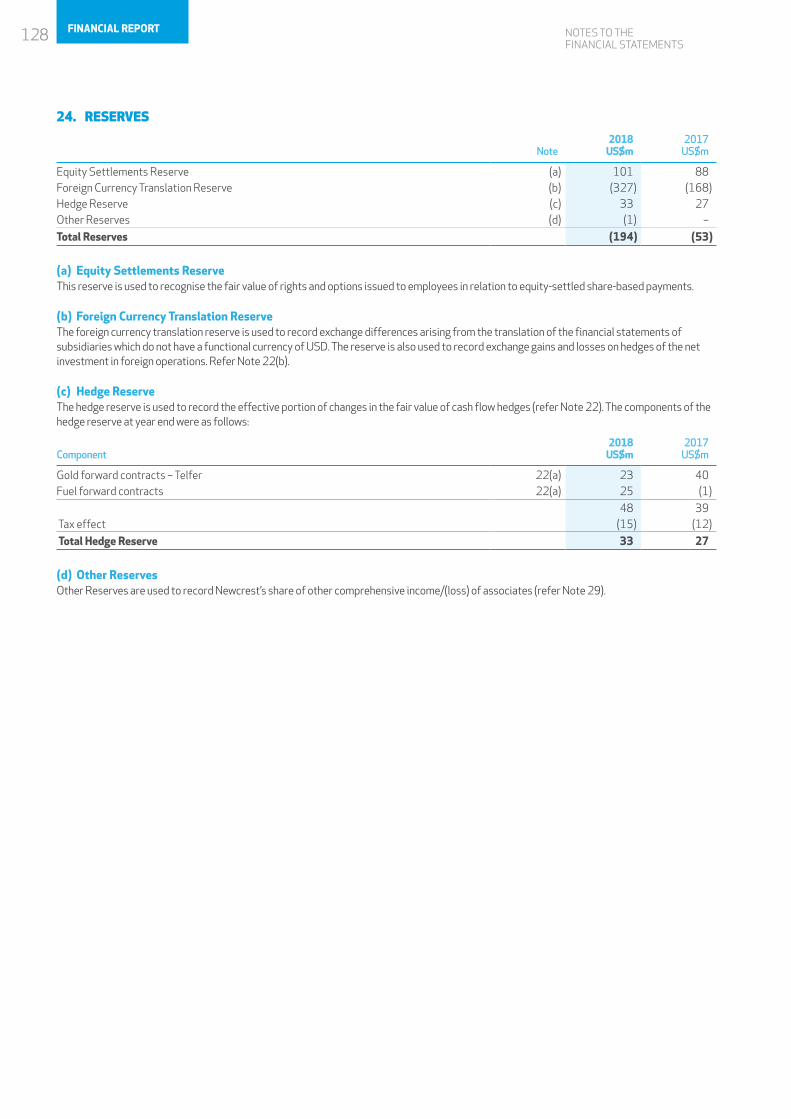
NOTES TO THE FINANCIAL STATEMENTS
24. RESERVES
Note2018
US$m2017
US$m
Equity Settlements Reserve (a) 101 88Foreign Currency Translation Reserve (b) (327) (168)Hedge Reserve (c) 33 27Other Reserves (d) (1) –
Total Reserves (194) (53)
(a) Equity Settlements ReserveThis reserve is used to recognise the fair value of rights and options issued to employees in relation to equity-settled share-based payments.
(b) Foreign Currency Translation ReserveThe foreign currency translation reserve is used to record exchange differences arising from the translation of the financial statements of subsidiaries which do not have a functional currency of USD. The reserve is also used to record exchange gains and losses on hedges of the net investment in foreign operations. Refer Note 22(b).
(c) Hedge ReserveThe hedge reserve is used to record the effective portion of changes in the fair value of cash flow hedges (refer Note 22). The components of the hedge reserve at year end were as follows:
Component2018
US$m2017
US$m
Gold forward contracts – Telfer 22(a) 23 40Fuel forward contracts 22(a) 25 (1)
48 39 Tax effect (15) (12)
Total Hedge Reserve 33 27
(d) Other ReservesOther Reserves are used to record Newcrest’s share of other comprehensive income/(loss) of associates (refer Note 29).
128 FINANCIAL REPORT
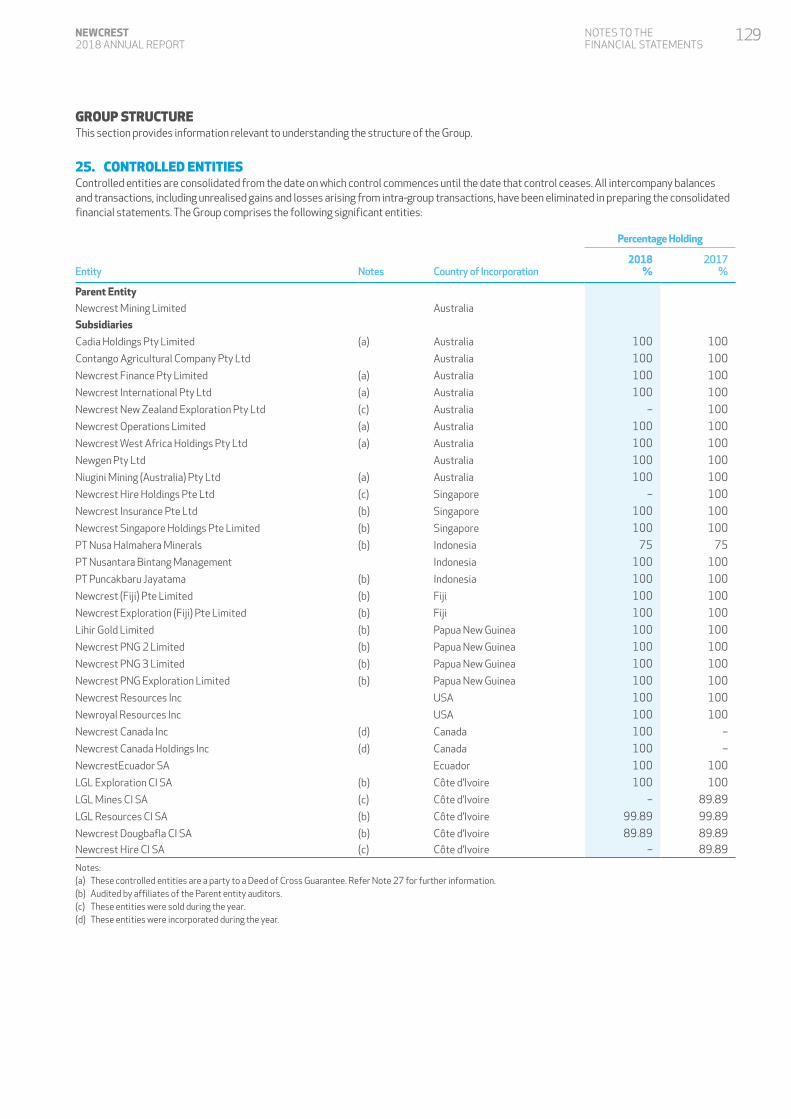
GROUP STRUCTUREThis section provides information relevant to understanding the structure of the Group.
25. CONTROLLED ENTITIESControlled entities are consolidated from the date on which control commences until the date that control ceases. All intercompany balances and transactions, including unrealised gains and losses arising from intra-group transactions, have been eliminated in preparing the consolidated financial statements. The Group comprises the following significant entities:
Percentage Holding
Entity Notes Country of Incorporation2018
%2017
%
Parent Entity
Newcrest Mining Limited Australia
Subsidiaries
Cadia Holdings Pty Limited (a) Australia 100 100
Contango Agricultural Company Pty Ltd Australia 100 100
Newcrest Finance Pty Limited (a) Australia 100 100
Newcrest International Pty Ltd (a) Australia 100 100
Newcrest New Zealand Exploration Pty Ltd (c) Australia – 100
Newcrest Operations Limited (a) Australia 100 100
Newcrest West Africa Holdings Pty Ltd (a) Australia 100 100
Newgen Pty Ltd Australia 100 100
Niugini Mining (Australia) Pty Ltd (a) Australia 100 100
Newcrest Hire Holdings Pte Ltd (c) Singapore – 100
Newcrest Insurance Pte Ltd (b) Singapore 100 100
Newcrest Singapore Holdings Pte Limited (b) Singapore 100 100
PT Nusa Halmahera Minerals (b) Indonesia 75 75
PT Nusantara Bintang Management Indonesia 100 100
PT Puncakbaru Jayatama (b) Indonesia 100 100
Newcrest (Fiji) Pte Limited (b) Fiji 100 100
Newcrest Exploration (Fiji) Pte Limited (b) Fiji 100 100
Lihir Gold Limited (b) Papua New Guinea 100 100
Newcrest PNG 2 Limited (b) Papua New Guinea 100 100
Newcrest PNG 3 Limited (b) Papua New Guinea 100 100
Newcrest PNG Exploration Limited (b) Papua New Guinea 100 100
Newcrest Resources Inc USA 100 100
Newroyal Resources Inc USA 100 100
Newcrest Canada Inc (d) Canada 100 –
Newcrest Canada Holdings Inc (d) Canada 100 –
NewcrestEcuador SA Ecuador 100 100
LGL Exploration CI SA (b) Côte d’Ivoire 100 100
LGL Mines CI SA (c) Côte d’Ivoire – 89.89
LGL Resources CI SA (b) Côte d’Ivoire 99.89 99.89
Newcrest Dougbafla CI SA (b) Côte d’Ivoire 89.89 89.89Newcrest Hire CI SA (c) Côte d’Ivoire – 89.89
Notes:(a) These controlled entities are a party to a Deed of Cross Guarantee. Refer Note 27 for further information.(b) Audited by affiliates of the Parent entity auditors.(c) These entities were sold during the year. (d) These entities were incorporated during the year.
NOTES TO THE FINANCIAL STATEMENTS
129NEWCREST 2018 ANNUAL REPORT
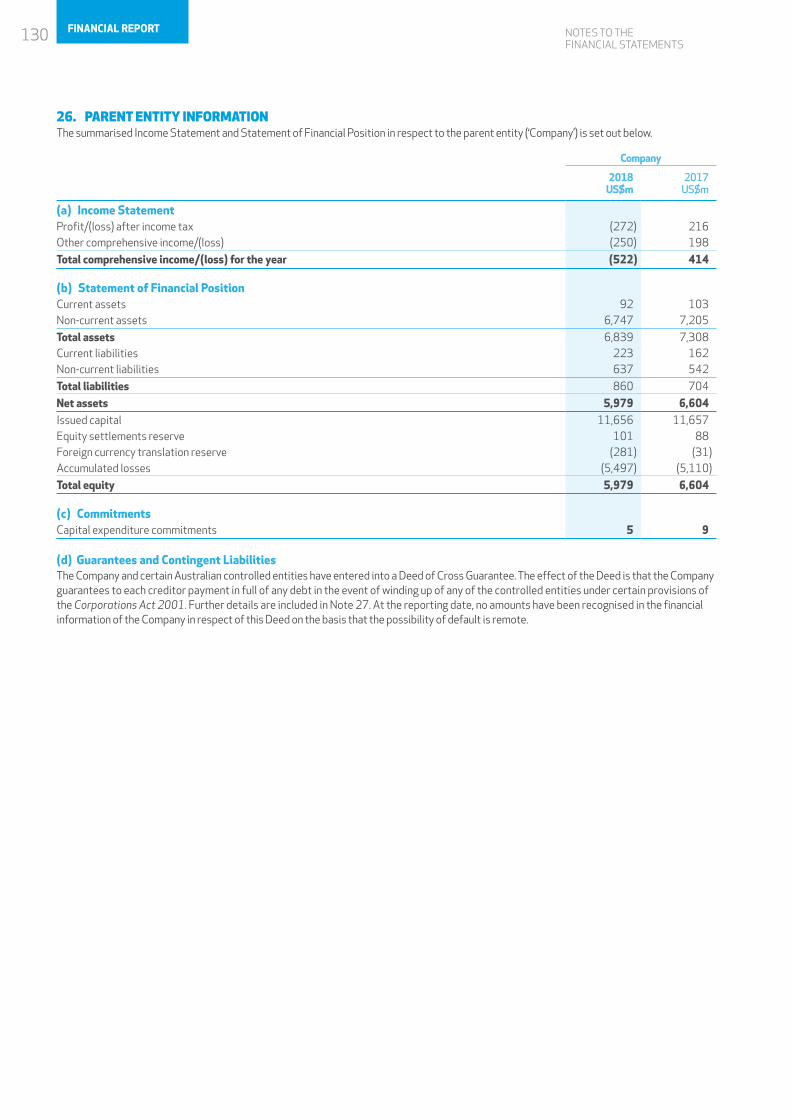
NOTES TO THE FINANCIAL STATEMENTS
26. PARENT ENTITY INFORMATIONThe summarised Income Statement and Statement of Financial Position in respect to the parent entity (‘Company’) is set out below.
Company
2018 US$m
2017 US$m
(a) Income StatementProfit/(loss) after income tax (272) 216Other comprehensive income/(loss) (250) 198
Total comprehensive income/(loss) for the year (522) 414
(b) Statement of Financial PositionCurrent assets 92 103Non-current assets 6,747 7,205
Total assets 6,839 7,308Current liabilities 223 162Non-current liabilities 637 542
Total liabilities 860 704
Net assets 5,979 6,604Issued capital 11,656 11,657Equity settlements reserve 101 88Foreign currency translation reserve (281) (31)Accumulated losses (5,497) (5,110)
Total equity 5,979 6,604
(c) CommitmentsCapital expenditure commitments 5 9
(d) Guarantees and Contingent LiabilitiesThe Company and certain Australian controlled entities have entered into a Deed of Cross Guarantee. The effect of the Deed is that the Company guarantees to each creditor payment in full of any debt in the event of winding up of any of the controlled entities under certain provisions of the Corporations Act 2001. Further details are included in Note 27. At the reporting date, no amounts have been recognised in the financial information of the Company in respect of this Deed on the basis that the possibility of default is remote.
130 FINANCIAL REPORT
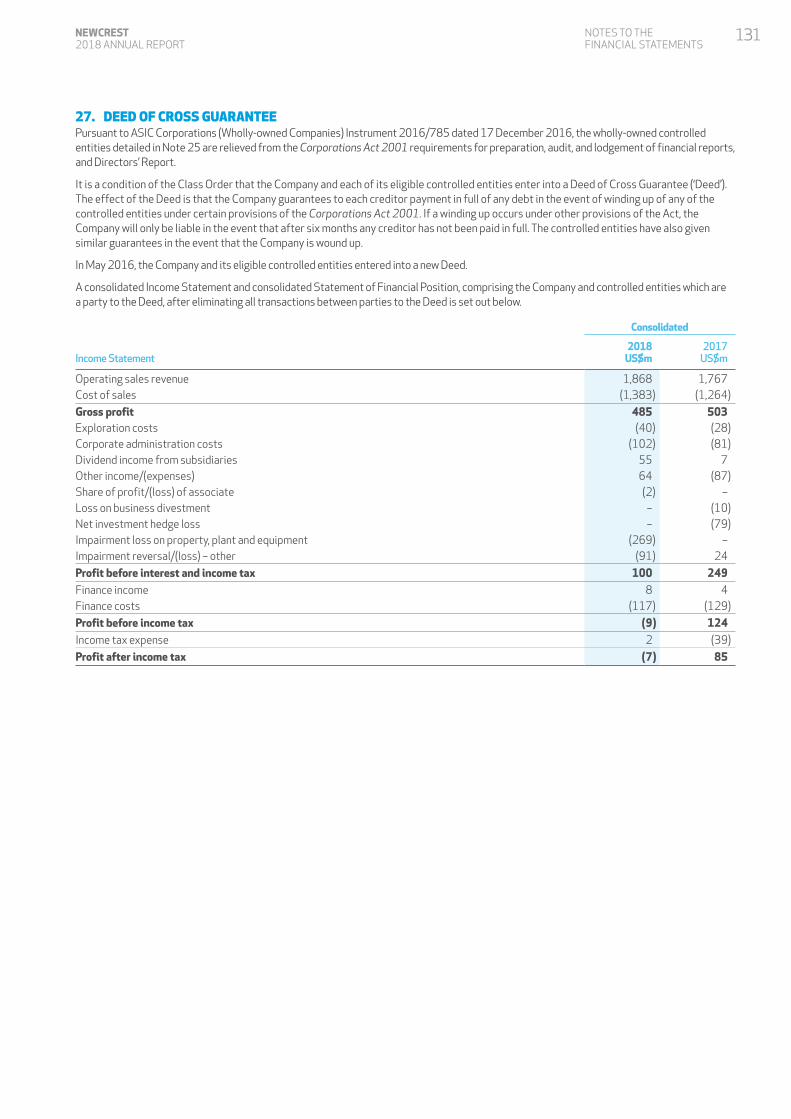
27. DEED OF CROSS GUARANTEEPursuant to ASIC Corporations (Wholly-owned Companies) Instrument 2016/785 dated 17 December 2016, the wholly-owned controlled entities detailed in Note 25 are relieved from the Corporations Act 2001 requirements for preparation, audit, and lodgement of financial reports, and Directors’ Report.
It is a condition of the Class Order that the Company and each of its eligible controlled entities enter into a Deed of Cross Guarantee (‘Deed’). The effect of the Deed is that the Company guarantees to each creditor payment in full of any debt in the event of winding up of any of the controlled entities under certain provisions of the Corporations Act 2001. If a winding up occurs under other provisions of the Act, the Company will only be liable in the event that after six months any creditor has not been paid in full. The controlled entities have also given similar guarantees in the event that the Company is wound up.
In May 2016, the Company and its eligible controlled entities entered into a new Deed.
A consolidated Income Statement and consolidated Statement of Financial Position, comprising the Company and controlled entities which are a party to the Deed, after eliminating all transactions between parties to the Deed is set out below.
Consolidated
Income Statement2018
US$m2017
US$m
Operating sales revenue 1,868 1,767Cost of sales (1,383) (1,264)
Gross profit 485 503Exploration costs (40) (28)Corporate administration costs (102) (81)Dividend income from subsidiaries 55 7Other income/(expenses) 64 (87)Share of profit/(loss) of associate (2) –Loss on business divestment – (10)Net investment hedge loss – (79)Impairment loss on property, plant and equipment (269) –Impairment reversal/(loss) – other (91) 24
Profit before interest and income tax 100 249Finance income 8 4Finance costs (117) (129)
Profit before income tax (9) 124Income tax expense 2 (39)
Profit after income tax (7) 85
NOTES TO THE FINANCIAL STATEMENTS
131NEWCREST 2018 ANNUAL REPORT
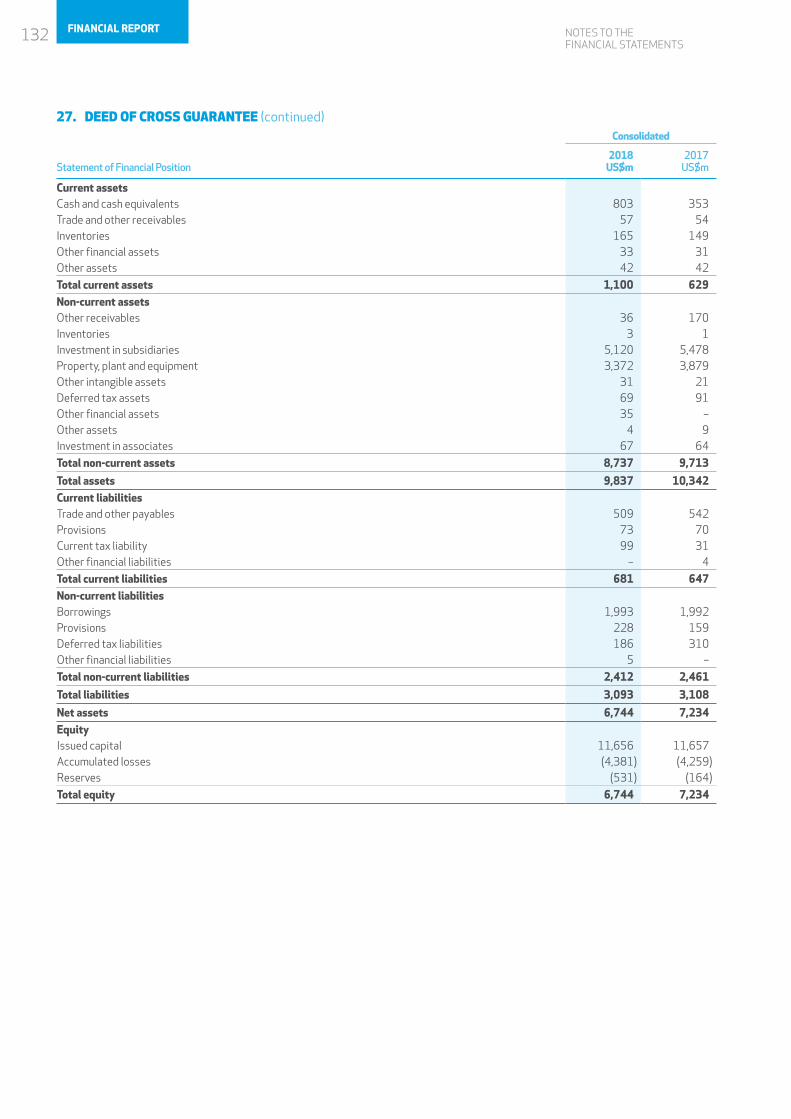
NOTES TO THE FINANCIAL STATEMENTS
27. DEED OF CROSS GUARANTEE (continued)Consolidated
Statement of Financial Position2018
US$m2017
US$m
Current assetsCash and cash equivalents 803 353Trade and other receivables 57 54Inventories 165 149Other financial assets 33 31Other assets 42 42
Total current assets 1,100 629Non-current assetsOther receivables 36 170Inventories 3 1Investment in subsidiaries 5,120 5,478Property, plant and equipment 3,372 3,879Other intangible assets 31 21Deferred tax assets 69 91Other financial assets 35 –Other assets 4 9Investment in associates 67 64
Total non-current assets 8,737 9,713
Total assets 9,837 10,342Current liabilitiesTrade and other payables 509 542Provisions 73 70Current tax liability 99 31Other financial liabilities – 4
Total current liabilities 681 647Non-current liabilitiesBorrowings 1,993 1,992Provisions 228 159Deferred tax liabilities 186 310Other financial liabilities 5 –
Total non-current liabilities 2,412 2,461
Total liabilities 3,093 3,108
Net assets 6,744 7,234EquityIssued capital 11,656 11,657Accumulated losses (4,381) (4,259)Reserves (531) (164)
Total equity 6,744 7,234
132 FINANCIAL REPORT
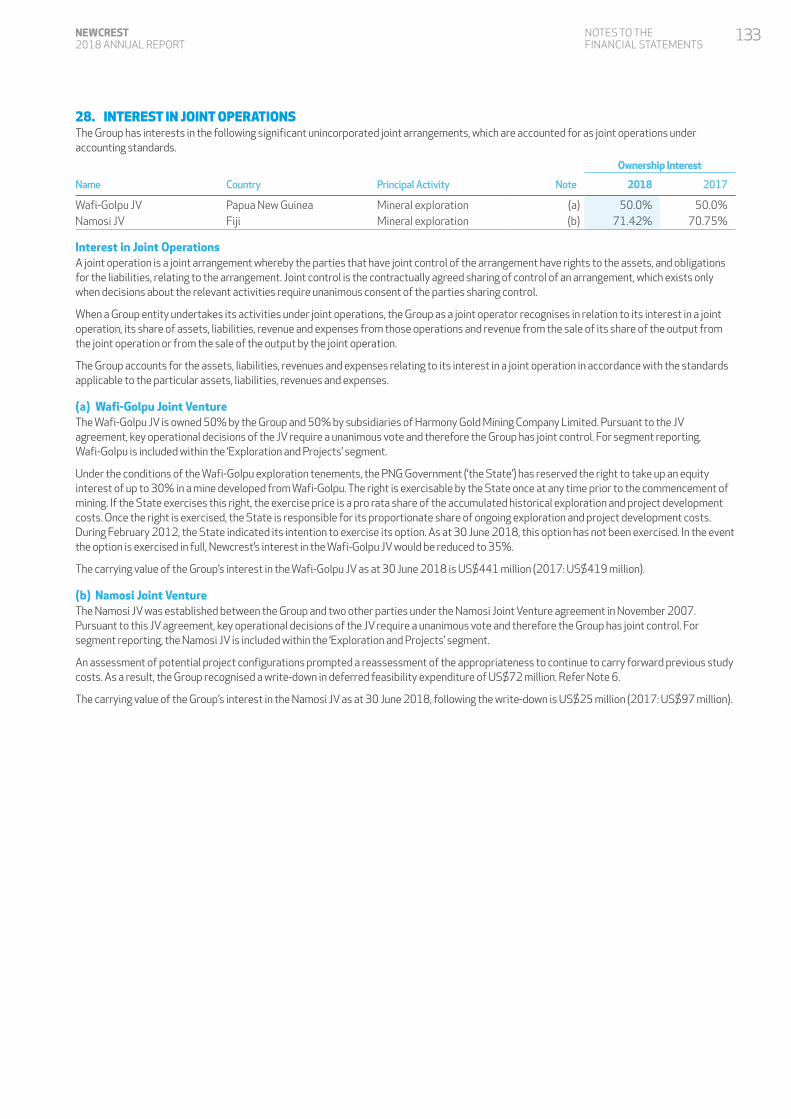
28. INTEREST IN JOINT OPERATIONSThe Group has interests in the following significant unincorporated joint arrangements, which are accounted for as joint operations under accounting standards.
Ownership Interest
Name Country Principal Activity Note 2018 2017
Wafi-Golpu JV Papua New Guinea Mineral exploration (a) 50.0% 50.0%Namosi JV Fiji Mineral exploration (b) 71.42% 70.75%
Interest in Joint OperationsA joint operation is a joint arrangement whereby the parties that have joint control of the arrangement have rights to the assets, and obligations for the liabilities, relating to the arrangement. Joint control is the contractually agreed sharing of control of an arrangement, which exists only when decisions about the relevant activities require unanimous consent of the parties sharing control.
When a Group entity undertakes its activities under joint operations, the Group as a joint operator recognises in relation to its interest in a joint operation, its share of assets, liabilities, revenue and expenses from those operations and revenue from the sale of its share of the output from the joint operation or from the sale of the output by the joint operation.
The Group accounts for the assets, liabilities, revenues and expenses relating to its interest in a joint operation in accordance with the standards applicable to the particular assets, liabilities, revenues and expenses.
(a) Wafi-Golpu Joint VentureThe Wafi-Golpu JV is owned 50% by the Group and 50% by subsidiaries of Harmony Gold Mining Company Limited. Pursuant to the JV agreement, key operational decisions of the JV require a unanimous vote and therefore the Group has joint control. For segment reporting, Wafi-Golpu is included within the ‘Exploration and Projects’ segment.
Under the conditions of the Wafi-Golpu exploration tenements, the PNG Government (‘the State’) has reserved the right to take up an equity interest of up to 30% in a mine developed from Wafi-Golpu. The right is exercisable by the State once at any time prior to the commencement of mining. If the State exercises this right, the exercise price is a pro rata share of the accumulated historical exploration and project development costs. Once the right is exercised, the State is responsible for its proportionate share of ongoing exploration and project development costs. During February 2012, the State indicated its intention to exercise its option. As at 30 June 2018, this option has not been exercised. In the event the option is exercised in full, Newcrest’s interest in the Wafi-Golpu JV would be reduced to 35%.
The carrying value of the Group’s interest in the Wafi-Golpu JV as at 30 June 2018 is US$441 million (2017: US$419 million).
(b) Namosi Joint VentureThe Namosi JV was established between the Group and two other parties under the Namosi Joint Venture agreement in November 2007. Pursuant to this JV agreement, key operational decisions of the JV require a unanimous vote and therefore the Group has joint control. For segment reporting, the Namosi JV is included within the ‘Exploration and Projects’ segment.
An assessment of potential project configurations prompted a reassessment of the appropriateness to continue to carry forward previous study costs. As a result, the Group recognised a write-down in deferred feasibility expenditure of US$72 million. Refer Note 6.
The carrying value of the Group’s interest in the Namosi JV as at 30 June 2018, following the write-down is US$25 million (2017: US$97 million).
NOTES TO THE FINANCIAL STATEMENTS
133NEWCREST 2018 ANNUAL REPORT
NOTES TO THE FINANCIAL STATEMENTS
29. INVESTMENT IN ASSOCIATES
Movements in investment in associates2018
US$m2017
US$m
Opening balance 64 –Acquisition – Lundin Gold Inc 251 –Acquisition – SolGold plc 9 63
Acquisition – Azucar Minerals Ltd 15 –Total acquisitions 275 63Share of profit/(loss) (5) –Share of other comprehensive income/(loss) (1) –Impairment loss – Azucar Minerals Ltd (6) –Foreign currency translation (3) 1
Closing balance 324 64
An associate is an entity that is neither a subsidiary nor joint arrangement, over which the Group has significant influence. Significant influence is the power to participate in the financial and operating policy decisions of the investee, but is not control or joint control over those policies. The Group’s investment in associates is accounted for using the equity method.
After application of the equity method, the Group determines whether it is necessary to recognise an additional impairment loss on its investment in its associate. The Group determines at each reporting date whether there is any objective evidence that the investment in the associate is impaired. If this is the case, the Group calculates the amount of impairment as the difference between the recoverable amount of the associate and its carrying value and recognises the amount in the Income Statement.
(a) Details of AssociatesInterest Carrying Amount
Associate Country of Incorporation2018
%2017
%2018
US$m2017
US$m
Lundin Gold Inc Canada 27.1% – 249 –SolGold plc United Kingdom 14.5% 14.5% 67 64Azucar Minerals Ltd Canada 19.9% – 8 –
324 64
Each of the Group’s associates are in the exploration and/or mine development phase and do not currently generate revenue. Further details are as follows:
Lundin Gold IncLundin Gold Inc (‘Lundin’) is a Canadian based mine development company, developing the Fruta del Norte gold project in Ecuador. Lundin is listed on the Toronto Stock Exchange (‘TSX’) and the Nasdaq Stockholm.
On 26 March 2018, Newcrest acquired a 27.1% equity interest in Lundin for US$251 million (inclusive of transaction costs of US$1 million), following a share subscription agreement entered into on 24 February 2018. In addition to holding 27.1% of the voting rights, in accordance with the share subscription agreement, Newcrest has appointed two directors to the Board of Lundin and representation on the project advisory committee of the Fruta del Norte gold project.
As at 30 June 2018, Lundin (on a 100% basis) has total assets of US$995 million, total liabilities of US$390 million and net assets of US$605 million. Assets include cash of US$393 million, property, plant and equipment of US$285 million and mineral properties of US$252 million. Liabilities include non-current borrowings of US$349 million.
As at 30 June 2018, the Group held 57,736,721 shares with a market value of US$200 million based on the closing share price on the TSX.
SolGold PlcSolGold Plc (‘SolGold’) is an Australian based, copper gold exploration and future development company with assets in Ecuador, the Solomon Islands and Australia. SolGold is listed on the London Stock Exchange (‘LSE’) and the TSX.
The Group acquired an initial 10% interest in SolGold in October 2016 following the signing of a share subscription agreement with SolGold. Under the agreement, subject to holding more than 10% of the share capital of SolGold, Newcrest has a right (but not an obligation) to appoint a Director to the Board of SolGold. Consequently, at the date of initial acquisition, it was determined that Newcrest had the ability to participate in the financial and operating policy decisions of SolGold. It was therefore determined that Newcrest has significant influence under accounting standards from the date of the initial acquisition. In March 2017, Newcrest appointed a director to the Board of SolGold.
As at 30 June 2018, the Group held 246,634,271 shares (2017: 219,772,271 shares) with a market value of US$74 million (2017: US$111 million) based on the closing share price on the LSE.
134 FINANCIAL REPORT
Azucar Minerals LtdAzucar Minerals Ltd (‘Azucar’) is a mineral exploration company listed on the TSX. Formerly Almadex Minerals Ltd, its assets include the El Cobre copper/gold porphyry project near Veracruz, Mexico.
Newcrest acquired an initial 19.9% interest in Azucar in May 2018 for US$15 million following the signing of a subscription agreement with Almadex Minerals Ltd. Under the agreement, subject to holding more than 10% of the share capital of Azucar, Newcrest has a right (but not an obligation) to appoint a Director to the Board of Azucar. Consequently, at the date of initial acquisition, it was determined that Newcrest had the ability to participate in the financial and operating policy decisions of Azucar. It was therefore determined that Newcrest has significant influence under accounting standards from the date of the initial acquisition.
As at 30 June 2018, the Group held 14,391,568 shares with a market value of US$8 million based on the closing share price on the TSX.
Accounting Judgement and Estimate – Investment in AssociatesJudgement is required in assessing whether there is objective evidence that the investment in each associate is impaired. At the reporting date, the Group impaired its investment in Azucar Minerals Ltd.
30. BUSINESS DIVESTMENT (a) Divestment of Bonikro in 2018In December 2017, Newcrest signed an agreement to sell its 89.89% interest in the Bonikro operation, to a consortium consisting of F&M Gold Resources Ltd and Africa Finance Corporation (‘the acquirer'). The divestment was completed on 28 March 2018, following the satisfaction of all closing conditions precedent under the sale agreement. Consideration for the sale was US$81 million and comprised of:
• Cash of US$72 million cash; and• Net smelter royalty on future ore mined at the Bonikro lease, with a fair value of US$9 million which has been recognised as a contingent
consideration asset (refer Note 21).
As a result of the sale agreement, Bonikro was classified as ‘held for sale’ and was disclosed as such in the 31 December 2017 half-year financial statements. The carrying value of Bonikro was compared to its recoverable amount of US$80 million, which comprised consideration of US$81 million less costs to dispose of US$1 million. This resulted in a write-down of US$15 million during the year.
The sale agreement had an economic effective date of 1 October 2017. The economic interest of Bonikro from 1 October 2017 to 28 March 2018 was to the benefit of the acquirer. The net cash generated by Bonikro during this period, which was to the benefit of the acquirer, was US$23 million.
On sale completion, Newcrest released to the Income Statement from Other Comprehensive Income, a net foreign exchange gain of US$29 million on historic funding arrangements that were designated as a hedge of the Group’s net investment in the Bonikro operations.
(b) Divestment of Hidden Valley in 2017During the prior year, Newcrest sold Newcrest PNG 1 Ltd to a wholly owned subsidiary of Harmony Gold Mining Company Limited (‘Harmony’) following the signing of a sale agreement on 18 September 2016. Newcrest PNG 1 Ltd was a wholly owned subsidiary of Newcrest that held the 50% interest in the Hidden Valley Joint Venture including the Hidden Valley mine. In addition, Newcrest also sold its 50% interest in certain exploration tenements proximate to the Hidden Valley mine to Harmony.
As part of the sale agreement Newcrest funded Newcrest PNG 1 Ltd with an amount of US$22.5m. This represented Newcrest’s one-off contribution towards future Hidden Valley closure liability partially offset by the option value of the possible future cash flows of the asset.
(c) Impact on Income StatementThe impact of the divestment of Bonikro in 2018 and of Hidden Valley in 2017 on the Income Statement is as follows:
Note2018
US$m2017
US$m
Consideration received 81 –Less: Transaction costs (1) –Less: Written down value of net assets sold 30(d) (80) (10)
Gain / (loss) on business divestment – (10)Net investment hedge gain/ (loss) transferred to the Income Statement on business divestment, net of tax 6 29 (62)Write-down of property, plant and equipment 6 (15) –
Total gain/(loss) 14 (72)
NOTES TO THE FINANCIAL STATEMENTS
135NEWCREST 2018 ANNUAL REPORT
NOTES TO THE FINANCIAL STATEMENTS
30. BUSINESS DIVESTMENT (continued)(d) Net Assets Disposed
The carrying value of the net assets of Bonikro in 2018 and of Hidden Valley in 2017 disposed of is as follows:
Book Value on Divestment2018
US$m2017
US$m
AssetsCash and cash equivalents (1) 23 27Receivables and prepayments 8 2Inventories 83 21Property, plant and equipment (2) 13 6
Total Assets 127 56LiabilitiesTrade and other payables 30 8Provisions – rehabilitation 14 35Provisions – other 3 3
Total Liabilities 47 46
Net assets divested 80 10(1) In 2018, the balance of US$23 million represents the net cash generated by Bonikro from 1 October 2017 to the 28 March 2018 which was divested in accordance
with the sale agreement. In 2017, the balance includes a cash contribution of US$22.5 million for the Hidden Valley rehabilitation liability.(2) In 2018, inclusive of a US$15 million write-down as per Note 6.
(e) Impact on Statement of Cash FlowsThe cash inflow / (outflow) on divestment of Bonikro in 2018 and of Hidden Valley in 2017, net of cash held by the subsidiaries was as follows:
2018 US$m
2017 US$m
Cash consideration received 72 –Less: Transaction costs paid (1) –Less: Cash and cash equivalents divested (23) (27)
Total 48 (27)
136 FINANCIAL REPORT
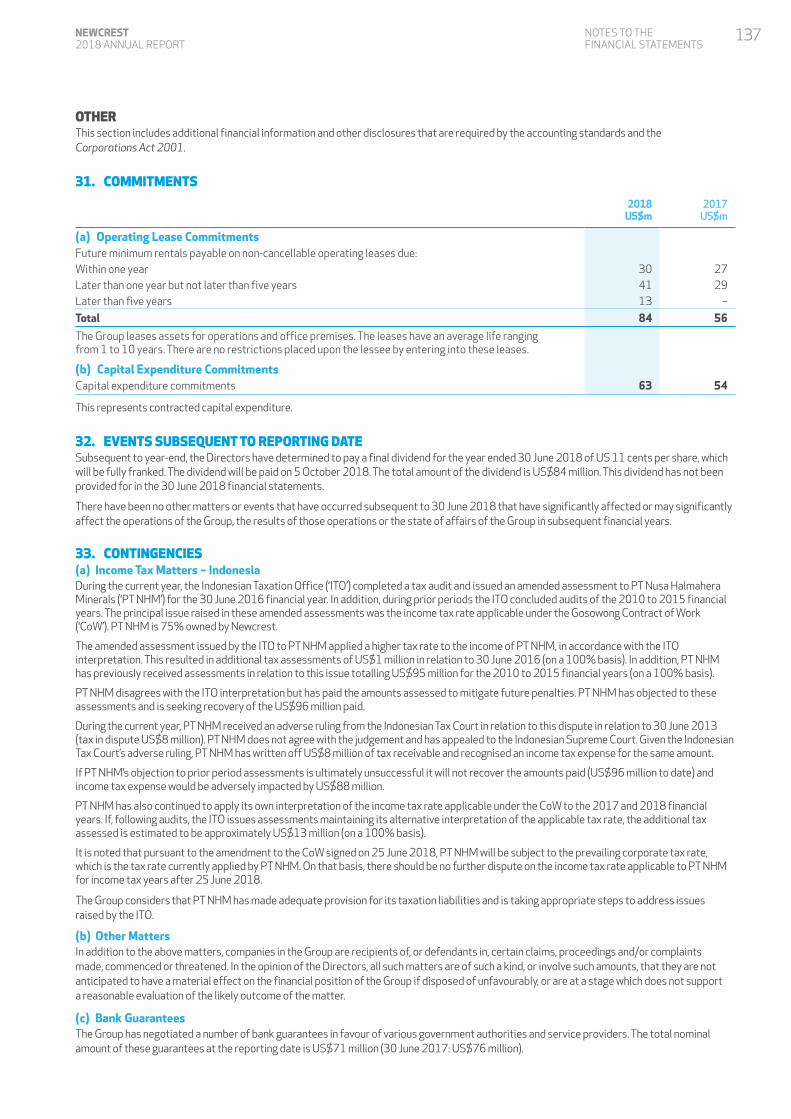
OTHERThis section includes additional financial information and other disclosures that are required by the accounting standards and the Corporations Act 2001.
31. COMMITMENTS
2018 US$m
2017 US$m
(a) Operating Lease CommitmentsFuture minimum rentals payable on non-cancellable operating leases due:Within one year 30 27Later than one year but not later than five years 41 29Later than five years 13 –
Total 84 56
The Group leases assets for operations and office premises. The leases have an average life ranging from 1 to 10 years. There are no restrictions placed upon the lessee by entering into these leases.
(b) Capital Expenditure CommitmentsCapital expenditure commitments 63 54
This represents contracted capital expenditure.
32. EVENTS SUBSEQUENT TO REPORTING DATESubsequent to year-end, the Directors have determined to pay a final dividend for the year ended 30 June 2018 of US 11 cents per share, which will be fully franked. The dividend will be paid on 5 October 2018. The total amount of the dividend is US$84 million. This dividend has not been provided for in the 30 June 2018 financial statements.
There have been no other matters or events that have occurred subsequent to 30 June 2018 that have significantly affected or may significantly affect the operations of the Group, the results of those operations or the state of affairs of the Group in subsequent financial years.
33. CONTINGENCIES(a) Income Tax Matters – IndonesiaDuring the current year, the Indonesian Taxation Office (‘ITO’) completed a tax audit and issued an amended assessment to PT Nusa Halmahera Minerals (‘PT NHM’) for the 30 June 2016 financial year. In addition, during prior periods the ITO concluded audits of the 2010 to 2015 financial years. The principal issue raised in these amended assessments was the income tax rate applicable under the Gosowong Contract of Work (‘CoW’). PT NHM is 75% owned by Newcrest.
The amended assessment issued by the ITO to PT NHM applied a higher tax rate to the income of PT NHM, in accordance with the ITO interpretation. This resulted in additional tax assessments of US$1 million in relation to 30 June 2016 (on a 100% basis). In addition, PT NHM has previously received assessments in relation to this issue totalling US$95 million for the 2010 to 2015 financial years (on a 100% basis).
PT NHM disagrees with the ITO interpretation but has paid the amounts assessed to mitigate future penalties. PT NHM has objected to these assessments and is seeking recovery of the US$96 million paid.
During the current year, PT NHM received an adverse ruling from the Indonesian Tax Court in relation to this dispute in relation to 30 June 2013 (tax in dispute US$8 million). PT NHM does not agree with the judgement and has appealed to the Indonesian Supreme Court. Given the Indonesian Tax Court’s adverse ruling, PT NHM has written off US$8 million of tax receivable and recognised an income tax expense for the same amount.
If PT NHM’s objection to prior period assessments is ultimately unsuccessful it will not recover the amounts paid (US$96 million to date) and income tax expense would be adversely impacted by US$88 million.
PT NHM has also continued to apply its own interpretation of the income tax rate applicable under the CoW to the 2017 and 2018 financial years. If, following audits, the ITO issues assessments maintaining its alternative interpretation of the applicable tax rate, the additional tax assessed is estimated to be approximately US$13 million (on a 100% basis).
It is noted that pursuant to the amendment to the CoW signed on 25 June 2018, PT NHM will be subject to the prevailing corporate tax rate, which is the tax rate currently applied by PT NHM. On that basis, there should be no further dispute on the income tax rate applicable to PT NHM for income tax years after 25 June 2018.
The Group considers that PT NHM has made adequate provision for its taxation liabilities and is taking appropriate steps to address issues raised by the ITO.
(b) Other MattersIn addition to the above matters, companies in the Group are recipients of, or defendants in, certain claims, proceedings and/or complaints made, commenced or threatened. In the opinion of the Directors, all such matters are of such a kind, or involve such amounts, that they are not anticipated to have a material effect on the financial position of the Group if disposed of unfavourably, or are at a stage which does not support a reasonable evaluation of the likely outcome of the matter.
(c) Bank GuaranteesThe Group has negotiated a number of bank guarantees in favour of various government authorities and service providers. The total nominal amount of these guarantees at the reporting date is US$71 million (30 June 2017: US$76 million).
NOTES TO THE FINANCIAL STATEMENTS
137NEWCREST 2018 ANNUAL REPORT

NOTES TO THE FINANCIAL STATEMENTS
34. SHARE-BASED PAYMENTSThe Group provides benefits to employees (including Executive Directors) in the form of share-based compensation, whereby employees render services in exchange for shares or rights over shares (equity-settled transactions). The Group operates a number of share-based payment plans, including:
• Executive Performance Share Plan (‘LTI Plan’) • Employee Share Acquisition Plan (‘ESAP’)• Share Match Plan• Sign-On Share Plan• Short Term Incentive Plan (‘STI Plan’)
(a) Executive Performance Share Plan (LTI Plan) The Executive Performance Share Plan (also referred to as the Long Term Incentive (‘LTI’) plan) entitles participants to receive rights to ordinary fully paid shares in the Company (Performance Rights). The Executive Directors, Executive General Managers, General Managers and Managers participate in this plan.
The performance measures for the Performance Rights granted in the 2018 financial year comprised of three equally weighted measures, being:
• Comparative Cost Position;• Return on Capital Employed (ROCE); and• Relative Total Shareholder Return (‘TSR’)
These measures are consistent with the prior year. Each LTI measure was chosen by the Board as it is a key driver of group performance. Performance against each of these measures over the three year vesting period accounts for 1/3rd of any grant made to participants. There is no ability to re-test performance under the Plan after the performance period.
The assessed fair value at grant date of the Performance Rights granted under the LTI plan is independently determined using an option pricing model. The model inputs included:
2018 2017
Fair value A$20.21 A$18.21Share price at grant date A$23.61 A$20.99Expected life of right 3 years 3 yearsExercise price Nil NilRisk-free interest rate 1.91% 1.83%Annualised volatility 35.0% 45.0%Expected dividend yield 1.0% 1.0%
The rights have been valued using a combination of the Monte Carlo simulation and Black-Scholes models. The fair value of the rights granted is adjusted to reflect market vesting conditions. Non-market conditions are included in the assumptions about the number of rights that are expected to become exercisable and are updated at each reporting date. The impact of the revision to original estimates is recognised in the Income Statement with a corresponding adjustment to equity.
Upon the exercise of rights, the balance of the equity settlements reserve relating to those rights remains in the Equity Settlements Reserve and the proceeds received, net of any directly attributable transaction costs, are credited to Share Capital.
Accounting Estimates and Assumptions – Share-Based PaymentsThe Group measures the cost of equity settled transactions with employees by reference to the fair value of equity instruments at the date at which they are granted. The fair value is determined by an external valuer using an option pricing model, using the assumptions detailed above.
138 FINANCIAL REPORT
(b) Movements in the Number of Rights issued under the LTI PlanDetailed information of Performance Rights over unissued ordinary shares is set out below:
Movement in Number of Rights During the Year
Grant date Exercise date Beginning of year Granted Exercised Forfeited End of year
201821 Nov 2017 21 Nov 2020 – 863,890 – (46,010) 817,88015 Nov 2016 15 Nov 2019 803,712 – – (104,038) 699,6745 Nov 2015 5 Nov 2018 1,240,665 – – (128,469) 1,112,19612 Dec 2014 7 Nov 2017 1,399,463 – (790,812) (608,651) –
Total 3,443,840 863,890 (790,812) (887,168) 2,629,750201715 Nov 2016 15 Nov 2019 – 835,916 – (32,204) 803,7125 Nov 2015 5 Nov 2018 1,402,187 – – (161,522) 1,240,66512 Dec 2014 7 Nov 2017 1,543,279 – – (143,816) 1,399,4634 Dec 2013 16 Sep 2016 1,307,868 – (280,250) (1,027,618) –
Total 4,253,334 835,916 (280,250) (1,365,160) 3,443,840
All Performance Rights have a nil exercise price. The number of performance rights exercisable at year end is nil (2017: nil).
(c) ESAP, Share Match Plan and Sign-On Share PlanUnder the ESAP, eligible employees are granted shares in the Company for no cash consideration. All Australian resident permanent employees who have been continuously employed by the Group for a period of at least one year, and are not eligible for the LTI Plan, are able to participate in the ESAP.
Under the Share Match Plan, eligible employees may contribute up to A$4,950 to acquire shares in the plan year. On the third anniversary of the start of the plan year, the Company will match the number of acquired shares held by the employee at that time with matched shares.
To support Newcrest’s ability to attract and/or retain suitable executives and senior managers, it is sometimes necessary to offer sign-on incentives. Such incentives are consistent with market practice in the industry. Rights awarded under the Sign-on Share Plan vest over periods up to three years and are subject to continued employment and/or performance.
The number of shares and rights granted under these plans during the year was not material to the Group. The number of rights outstanding at year end was 292,137 (2017: 444,052).
(d) STI PlanThis plan applies to certain employees including key management personnel. Under the STI Plan, for eligible employees, 50% of the payment is provided in cash with the remaining 50% deferred into shares. The number of shares calculated is based on the Company’s volume weighted average share price during the five trading days immediately preceding the allocation date of shares. Half the shares are released after 12 months and the remainder after 2 years.
During the year 198,180 shares were granted in respect to this plan (2017: 169,478 shares).
NOTES TO THE FINANCIAL STATEMENTS
139NEWCREST 2018 ANNUAL REPORT
NOTES TO THE FINANCIAL STATEMENTS
35. KEY MANAGEMENT PERSONNEL(a) Remuneration of Key Management Personnel and Directors
2018 US$’000
2017 US$’000
Short-term 11,688 10,850Long-term 93 26Post-employment 241 231Share-based payments expense 8,233 7,803
20,255 18,910
(b) Loans and other transactions with Key Management PersonnelThere are no loans made to KMP, or their related entities, by the Group.
36. AUDITORS’ REMUNERATION
2018 US$m
2017 US$m
(a) Amounts received or due and receivable by Ernst & Young (Australia) for:Audit or review of financial reports of the Company and subsidiaries 1,227 1,155Non-audit services:Assurance-related services 417 223Tax and advisory services 359 224
Total non-audit services 776 447Total 2,003 1,602
(b) Amounts received or due and receivable by related practices of Ernst & Young (Australia) for:Audit or review of financial reports of subsidiaries 184 164
(c) Amounts received or due and receivable by other auditors for:Audit or review of financial reports of subsidiaries 23 17
140 FINANCIAL REPORT
37. NEW ACCOUNTING STANDARDS AND INTERPRETATIONS(a) New accounting standards and interpretations issued but not yet effective and not yet adoptedThe following standards, amendments to standards and interpretations have been identified as those which may impact the Group in the period of initial application. They have been issued but are not yet effective and are available for early adoption at 30 June 2018, but have not been applied in preparing this financial report.
Reference & Title
Applicationdate for the
GroupImpact on
Group
AASB 15 Revenue from contracts with customers 1 July 2018 (i)AASB 16 Leases 1 July 2019 (ii)AASB Interpretation 23 – Uncertainty over income tax treatment 1 July 2019 (iii)
(i) AASB 15 Revenue from contracts with customersAASB 15 was issued in December 2015 and established a five-step model to account for revenue arising from contracts with customers. Under AASB 15, revenue is recognised at an amount that reflects the consideration to which an entity expects to be entitled in exchange for transferring goods or services to a customer. Under AASB 15 the revenue recognition model will change from one based on the transfer of risk and reward of ownership to the transfer of control of ownership.
The Group’s revenue from contracts with customers is derived from the sale of bullion and concentrate. The Group will adopt the new standard on the required effective date of 1 July 2018.
As a result, the effect on the Group’s revenue recognition profile and policies will be as follows.
• The timing and measurement of sale of bullion is not affected.• For the sale of concentrate, the point of revenue recognition is dependent on the contract sales terms, which are generally undertaken
on Cost, Insurance and Freight (CIF) Incoterms. As the transfer of risks and rewards generally coincides with the transfer of control at a point in time for the Incoterms as part of the Group’s concentrate sales arrangements, the timing of revenue recognised for the sale of concentrate is not affected.
• AASB 15 introduced the concept of performance obligations that are defined as a ‘distinct’ promised goods or services. For CIF Incoterms, the seller must contract for and pay the costs and freight necessary to bring the goods to the named port of destination. Consequently, the freight service on export concentrate contracts with CIF Incoterms represents a separate performance obligation as defined under the new standard. This means that, where material, a portion of the revenue earned under these contracts, representing the obligation to perform the freight service, will be deferred and recognised over time as this obligation is fulfilled, along with the associated costs. Based on assessment performed against current year arrangements the impact is not material.
• Following the Group’s assessment of the requirements of AASB 15, it was determined that effective from 1 July 2018, treatment and refining costs associated with the sale of concentrate will be presented as a reduction in revenue as this better reflects the amount the Group expects to receive from the customer. This change in presentation will not result in an overall impact to profit after tax or equity of the Group.
The Group expects to use the modified retrospective approach of adoption. The cumulative effect on retained earnings recognised upon adopting this standard on 1 July 2018 will not be material.
NOTES TO THE FINANCIAL STATEMENTS
141NEWCREST 2018 ANNUAL REPORT
NOTES TO THE FINANCIAL STATEMENTS
37. NEW ACCOUNTING STANDARDS AND INTERPRETATIONS (continued)(a) New accounting standards and interpretations issued but not yet effective and not yet adopted (continued)(ii) AASB 16 LeasesAASB 16 introduces a single lessee accounting model, requiring the recognition of assets and liabilities for all leases with a term of more than 12 months, unless the underlying asset is of low value. A lessee is required to recognise a right-of-use asset representing its right to use the underlying leased asset and a lease liability representing its obligations to make lease payments.
The Group is party to contracts for leases of property, plant and equipment; including but not limited to: office premises, mining equipment and contractor provided equipment. The Group is in the process of identifying which of its lease and other supply contracts will be within the scope of the new standard.
Adoption of the new lease standard is expected to result in lower operating costs and higher finance and depreciation costs as the accounting profile of the lease payments changes under the new model. The statement of financial position will also be impacted, with an increase to both non-current assets (right-of-use assets) and liabilities (lease liabilities) expected. Cash flows from operating activities will increase as affected lease payments will be now be classified as financing cash flows. Conversely, cash flows from financing activities will decrease for the same reason.
The Group is continuing to assess the impact of the new lease standard. The standard has an effective date for the Group of 1 July 2019. The Group will adopt the new standard on the required effective date.
(iii) AASB Interpretation 23 – Uncertainty over income tax treatmentThis interpretation addresses the accounting for income taxes when tax treatments involve uncertainty that affects the application of AASB 112 Income Taxes. The Interpretation does not apply to taxes or levies outside the scope of AABS 112, nor does it specifically include requirements relating to interest and penalties associated with uncertain tax treatments.
The Group has not yet determined the extent of the impact, if any.
Apart from the above, other accounting standards, amendments and interpretations that have been issued and will be applicable in future periods have been considered, however their impact is not considered material to the Group.
(b) Early adoption of accounting standardsAs disclosed in the 2016 annual financial report, the Group early adopted accounting standard AASB 9 Financial Instruments in the financial year ended 30 June 2016.
142 FINANCIAL REPORT
DIRECTORS' DECLARATION
DIRECTORS' DECLARATIONIn accordance with a resolution of the Directors of Newcrest Mining Limited, we state that:
1. In the opinion of the Directors:
(a) The financial statements, notes and additional disclosures included in the Directors’ Report designated as audited, of the Group is in accordance with the Corporations Act 2001, including:
(i) Giving a true and fair view of the Group’s financial position as at 30 June 2018 and of its performance for the year ended on that date; and
(ii) Complying with Australian Accounting Standards and Corporations Regulations 2001.
(b) There are reasonable grounds to believe that the Company will be able to pay its debts as and when they become due and payable.
(c) The financial statements and notes thereto are in accordance with International Financial Reporting Standards issued by the International Accounting Standards Board.
2. This declaration has been made after receiving the declarations required to be made to the Directors in accordance with section 295A of the Corporations Act 2001 for the financial year ended 30 June 2018.
3. In the opinion of the Directors, as at the date of this declaration, there are reasonable grounds to believe that the members of the Closed Group identified in Note 27 will be able to meet any obligations or liabilities to which they are, or may become, subject by virtue of the Deed of Cross Guarantee.
On behalf of the Board
Peter Hay Sandeep Biswas Chairman Managing Director and Chief Executive Officer
22 August 2018 Melbourne
143NEWCREST 2018 ANNUAL REPORT
INDEPENDENT AUDITOR'S REPORT
INDEPENDENT AUDITOR’S REPORT
A member firm of Ernst & Young Global LimitedLiability limited by a scheme approved under Professional Standards Legislation
Ernst & Young8 Exhibition Street Melbourne VIC 3000 AustraliaGPO Box 67 Melbourne VIC 3001
Tel: +61 3 9288 8000Fax: +61 3 8650 7777ey.com/au
Independent Auditor's Report to the Members of Newcrest Mining Limited
Report on the Audit of the Financial Report
Opinion
We have audited the financial report of Newcrest Mining Limited (the Company) and its subsidiaries (collectively the Group), which comprises the consolidated statement of financial position as at 30 June 2018, the consolidated income statement, consolidated statement of comprehensive income, consolidated statement of changes in equity and consolidated statement of cash flows for the year then ended, notes to the financial statements, including a summary of significant accounting policies, and the Directors' Declaration.
In our opinion, the accompanying financial report of the Group is in accordance with the Corporations Act 2001, including:
a) giving a true and fair view of the consolidated financial position of the Group as at 30 June 2018 and of its consolidated financial performance for the year ended on that date; and
b) complying with Australian Accounting Standards and the Corporations Regulations 2001.
Basis for Opinion
We conducted our audit in accordance with Australian Auditing Standards. Our responsibilities under those standards are further described in the Auditor’s Responsibilities for the Audit of the Financial Report section of our report. We are independent of the Group in accordance with the auditor independence requirements of the Corporations Act 2001 and the ethical requirements of the Accounting Professional and Ethical Standards Board’s APES 110 Code of Ethics for Professional Accountants (the Code) that are relevant to our audit of the financial report in Australia. We have also fulfilled our other ethical responsibilities in accordance with the Code.
We believe that the audit evidence we have obtained is sufficient and appropriate to provide a basis for our opinion.
144 FINANCIAL REPORT
A member firm of Ernst & Young Global LimitedLiability limited by a scheme approved under Professional Standards Legislation
Key Audit Matters
Key audit matters are those matters that, in our professional judgement, were of most significance in our audit of the financial report of the current year. These matters were addressed in the context of our audit of the financial report as a whole, and in forming our opinion thereon, but we do not provide a separate opinion on these matters. For each matter below, our description of how our audit addressed the matter is provided in that context.
We have fulfilled the responsibilities described in the Auditor’s Responsibilities for the Audit of the Financial Report section of our report, including in relation to these matters. Accordingly, our audit included the performance of procedures designed to respond to our assessment of the risks of material misstatement of the financial report. The results of our audit procedures, including the procedures performed to address the matters below, provide the basis for our audit opinion on the accompanying financial report.
1. Assessment of the carrying value of non-current assets
Why significant How our audit addressed the key audit matter As at 30 June 2018 the Group’s consolidated statement of financial position includes property, plant and equipment of $8,156 million and other intangible assets of $42 million. Group policy is to assess for indicators of impairment and impairment reversal annually or more frequently if indicators of impairment exist, for each cash generating unit (CGU). At 30 June 2018 the Group determined that: a) Indicators of impairment existed for the Telfer
CGU, arising from changes to the mine plan and the operating and financial performance for the year. An assessment of the recoverable amount was performed for the Telfer CGU and a post-tax impairment charge of $188 million was recorded. The impairment was allocated to property, plant and equipment assets.
b) Indicators of potential impairment existed for the Gosowong and Lihir CGU’s. The Group conducted a detailed review of recoverable amounts of each CGU. No impairment charge was required.
The Group also considered if previous impairment of the Lihir CGU assets, other than goodwill, should be reversed, concluding that an impairment reversal was not required. Determination as to whether or not an impairment charge or reversal relating to an asset or CGU involves significant judgement about the future results and plans for each asset and CGU. Further disclosures relating to the assessment of impairment can be found at Note 12 Impairment of Non-Financial Assets.
We evaluated the Group’s assessment of indicators of impairment or impairment reversal. Where we determined that indicators existed, we evaluated the Group’s calculations of the recoverable amount of each CGU. With the involvement of our valuation specialists, we assessed the reasonableness of the board approved cash flow projections, the value ascribed to unmined resources, exploration potential and key macro-economic assumptions used in the impairment models. The Group used internal and external experts to provide geological, metallurgical, mine planning and technological information to support key assumptions in the impairment models. We have examined the information provided by the Group’s experts, including assessment of the competence, qualifications and the objectivity of the internal and external experts, the methodology applied, and we have also substantiated the information provided to the inputs used in the impairment models. We also assessed the reasonableness of the cashflows modelled against the past performance of the Group. We assessed the key assumptions such as gold and copper prices, discount rates, foreign exchange rates, mine operating costs and capital expenditures and performed sensitivity analysis around the key drivers of the cash flow projections. Having determined the change in assumptions (individually or collectively) that would be required for the CGU’s to record an impairment charge or reversal, we considered the likelihood of such a movement in those key assumptions arising. In addition, we assessed the adequacy of the disclosures included in Note 12 Impairment of Non-Financial Assets.
INDEPENDENT AUDITOR'S REPORT
145NEWCREST 2018 ANNUAL REPORT
A member firm of Ernst & Young Global LimitedLiability limited by a scheme approved under Professional Standards Legislation
2. Taxation
Why significant How our audit addressed the key audit matter The Group operates in multiple taxation jurisdictions. International income tax matters involve significant judgement due to the complexity of legislation and regulatory requirements. The Group’s Indonesian entities have been subject to audits from the Indonesian Tax Office (ITO) in relation to the applicable income tax rate. The audits have covered multiple financial years. The Group is disputing the assessment of the applicable tax rate under the Contract of Work (CoW) for the years (2010 to 2016) and is seeking to recover the additional tax paid totaling $96 million of which $88 million is recorded as tax receivable. Disclosure in relation to tax matters can be found at Note 33 Contingencies.
We evaluated the Group’s tax provisions or tax receivables in each jurisdiction, including deferred taxes. We examined the tax assessments and relevant correspondence received from the ITO. We assessed the additional tax paid by the Group to the ITO through examination of correspondence with the ITO and tax returns. The Group has used independent tax and legal experts to support the Group’s interpretation of the CoW and the tax position adopted by the Group. With the involvement of our tax specialists we assessed the tax position adopted by the Group, including consideration of the competence, qualifications and objectivity of the independent tax and legal experts and examination of relevant supporting evidence. We assessed the adequacy of the disclosures included in Note 33 Contingencies.
3. Mine rehabilitation provisions
Why significant How our audit addressed the key audit matter The Group has rehabilitation obligations to restore and rehabilitate land and environmental disturbances created by mine operations, including exploration and development activities. These obligations are determined through regulatory and legislative requirements across multiple jurisdictions in addition to policies and processes set by the Group. At 30 June 2018 the Group has recorded $329 million as mine rehabilitation provisions. The estimation of mine rehabilitation provisions is highly complex and judgemental with respect to the timing of the activities, the associated economic assumptions and estimated cost of the future activities. Disclosure in relation to mine rehabilitation provisions can be found in Note 18 Provisions.
We evaluated the Group’s calculations for the mine rehabilitation provision at each mine. The Group has used internal and external experts to support the estimation of the mine rehabilitation provisions. With the support of our environmental specialists we assessed the competence, qualifications and objectivity of the internal and external experts and assessed the reasonableness of the assumptions in the closure plans and cost estimates used by the Group’s internal and external experts, and that the information provided by the Group’s internal and external experts has been appropriately reflected in the calculation of the mine rehabilitation provisions. We assessed the reasonableness of economic assumptions, such as the discount and inflation rates that were applied in the calculations. We assessed the adequacy of the disclosures included in Note 18 Provisions.
INDEPENDENT AUDITOR'S REPORT
146 FINANCIAL REPORT
A member firm of Ernst & Young Global LimitedLiability limited by a scheme approved under Professional Standards Legislation
Information Other than the Financial Report and Auditor’s Report
The directors are responsible for the other information. The other information comprises the information included in the Group’s 2018 Annual Report other than the financial report and our auditor’s report thereon. We obtained the Directors’ Report that is to be included in the Annual Report, prior to the date of this auditor’s report, and we expect to obtain the remaining sections of the Annual Report after the date of this auditor’s report.
Our opinion on the financial report does not cover the other information and we do not and will not express any form of assurance conclusion thereon, with the exception of the Remuneration Report and our related assurance opinion.
In connection with our audit of the financial report, our responsibility is to read the other information and, in doing so, consider whether the other information is materially inconsistent with the financial report or our knowledge obtained in the audit or otherwise appears to be materially misstated.
If, based on the work we have performed on the other information obtained prior to the date of this auditor’s report, we conclude that there is a material misstatement of this other information, we are required to report that fact. We have nothing to report in this regard.
Responsibilities of the Directors for the Financial Report
The directors of the Company are responsible for the preparation of the financial report that gives a true and fair view in accordance with Australian Accounting Standards and the Corporations Act 2001 and for such internal control as the directors determine is necessary to enable the preparation of the financial report that gives a true and fair view and is free from material misstatement, whether due to fraud or error.
In preparing the financial report, the directors are responsible for assessing the Group’s ability to continue as a going concern, disclosing, as applicable, matters relating to going concern and using the going concern basis of accounting unless the directors either intend to liquidate the Group or to cease operations, or have no realistic alternative but to do so.
Auditor’s Responsibilities for the Audit of the Financial Report
Our objectives are to obtain reasonable assurance about whether the financial report as a whole is free from material misstatement, whether due to fraud or error, and to issue an auditor’s report that includes our opinion. Reasonable assurance is a high level of assurance, but is not a guarantee that an audit conducted in accordance with the Australian Auditing Standards will always detect a material misstatement when it exists. Misstatements can arise from fraud or error and are considered material if, individually or in the aggregate, they could reasonably be expected to influence the economic decisions of users taken on the basis of this financial report.
As part of an audit in accordance with the Australian Auditing Standards, we exercise professional judgement and maintain professional scepticism throughout the audit. We also:
Identify and assess the risks of material misstatement of the financial report, whether due to fraud or error, design and perform audit procedures responsive to those risks, and obtain audit evidence that is sufficient and appropriate to provide a basis for our opinion. The risk of not detecting a material misstatement resulting from fraud is higher than for one resulting from error, as fraud may involve collusion, forgery, intentional omissions, misrepresentations, or the override of internal control.
INDEPENDENT AUDITOR'S REPORT
147NEWCREST 2018 ANNUAL REPORT
A member firm of Ernst & Young Global LimitedLiability limited by a scheme approved under Professional Standards Legislation
Obtain an understanding of internal control relevant to the audit in order to design audit procedures that are appropriate in the circumstances, but not for the purpose of expressing an opinion on the effectiveness of the Group’s internal control.
Evaluate the appropriateness of accounting policies used and the reasonableness of accounting estimates and related disclosures made by the directors.
Conclude on the appropriateness of the directors’ use of the going concern basis of accounting and, based on the audit evidence obtained, whether a material uncertainty exists related to events or conditions that may cast significant doubt on the Group’s ability to continue as a going concern. If we conclude that a material uncertainty exists, we are required to draw attention in our auditor’s report to the related disclosures in the financial report or, if such disclosures are inadequate, to modify our opinion. Our conclusions are based on the audit evidence obtained up to the date of our auditor’s report. However, future events or conditions may cause the Group to cease to continue as a going concern.
Evaluate the overall presentation, structure and content of the financial report, including the disclosures, and whether the financial report represents the underlying transactions and events in a manner that achieves fair presentation.
Obtain sufficient appropriate audit evidence regarding the financial information of the entities or business activities within the Group to express an opinion on the financial report. We are responsible for the direction, supervision and performance of the Group audit. We remain solely responsible for our audit opinion.
We communicate with the directors regarding, among other matters, the planned scope and timing of the audit and significant audit findings, including any significant deficiencies in internal control that we identify during our audit.
We also provide the directors with a statement that we have complied with relevant ethical requirements regarding independence, and to communicate with them all relationships and other matters that may reasonably be thought to bear on our independence, and where applicable, related safeguards.
From the matters communicated to the directors, we determine those matters that were of most significance in the audit of the financial report of the current year and are therefore the key audit matters. We describe these matters in our auditor’s report unless law or regulation precludes public disclosure about the matter or when, in extremely rare circumstances, we determine that a matter should not be communicated in our report because the adverse consequences of doing so would reasonably be expected to outweigh the public interest benefits of such communication.
INDEPENDENT AUDITOR'S REPORT
148 FINANCIAL REPORT
A member firm of Ernst & Young Global LimitedLiability limited by a scheme approved under Professional Standards Legislation
Report on the Remuneration Report
Opinion on the Remuneration Report
We have audited the Remuneration Report included in the Directors' Report for the year ended 30 June 2018.
In our opinion, the Remuneration Report of Newcrest Mining Limited for the year ended 30 June 2018, complies with section 300A of the Corporations Act 2001.
Responsibilities
The directors of the Company are responsible for the preparation and presentation of the Remuneration Report in accordance with section 300A of the Corporations Act 2001. Our responsibility is to express an opinion on the Remuneration Report, based on our audit conducted in accordance with Australian Auditing Standards.
Ernst & Young
Trent van Veen Matthew Honey Partner Partner Melbourne 22 August 2018
INDEPENDENT AUDITOR'S REPORT
149NEWCREST 2018 ANNUAL REPORT
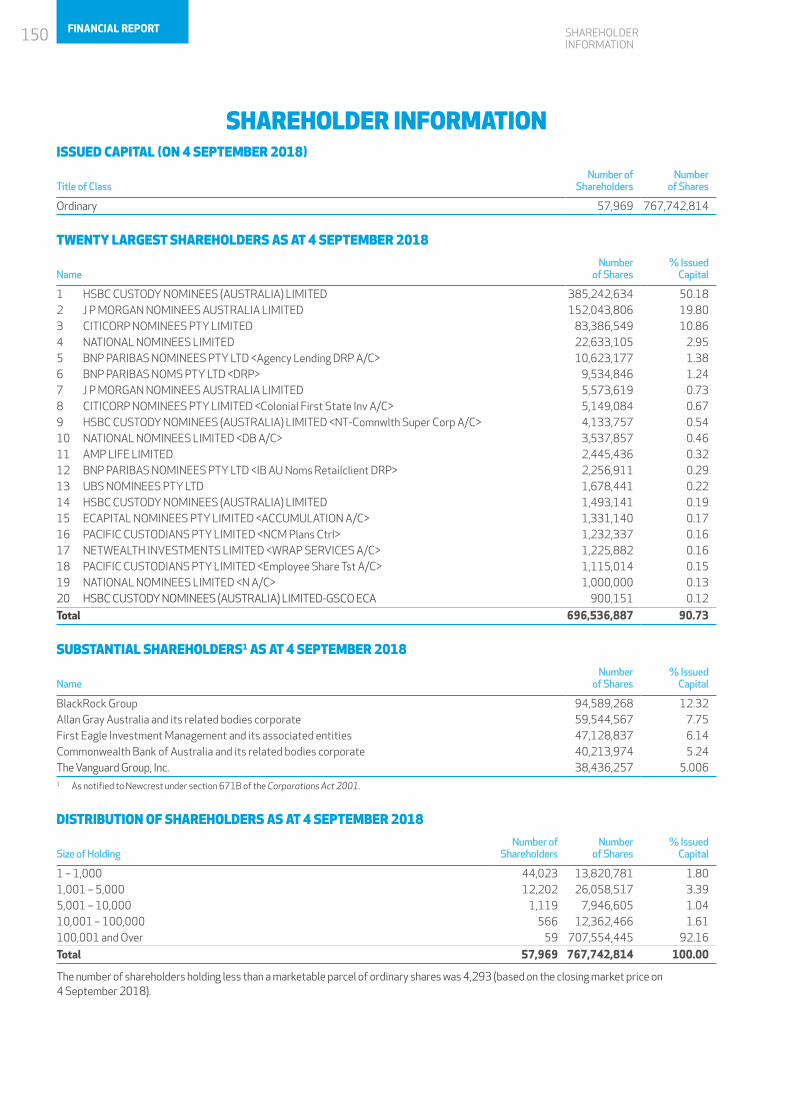
SHAREHOLDER INFORMATION
SHAREHOLDER INFORMATIONISSUED CAPITAL (ON 4 SEPTEMBER 2018)
Title of ClassNumber of
ShareholdersNumber
of Shares
Ordinary 57,969 767,742,814
TWENTY LARGEST SHAREHOLDERS AS AT 4 SEPTEMBER 2018
NameNumber
of Shares % Issued
Capital
1 HSBC CUSTODY NOMINEES (AUSTRALIA) LIMITED 385,242,634 50.182 J P MORGAN NOMINEES AUSTRALIA LIMITED 152,043,806 19.803 CITICORP NOMINEES PTY LIMITED 83,386,549 10.864 NATIONAL NOMINEES LIMITED 22,633,105 2.955 BNP PARIBAS NOMINEES PTY LTD <Agency Lending DRP A/C> 10,623,177 1.386 BNP PARIBAS NOMS PTY LTD <DRP> 9,534,846 1.247 J P MORGAN NOMINEES AUSTRALIA LIMITED 5,573,619 0.738 CITICORP NOMINEES PTY LIMITED <Colonial First State Inv A/C> 5,149,084 0.679 HSBC CUSTODY NOMINEES (AUSTRALIA) LIMITED <NT-Comnwlth Super Corp A/C> 4,133,757 0.5410 NATIONAL NOMINEES LIMITED <DB A/C> 3,537,857 0.4611 AMP LIFE LIMITED 2,445,436 0.3212 BNP PARIBAS NOMINEES PTY LTD <IB AU Noms Retailclient DRP> 2,256,911 0.2913 UBS NOMINEES PTY LTD 1,678,441 0.2214 HSBC CUSTODY NOMINEES (AUSTRALIA) LIMITED 1,493,141 0.1915 ECAPITAL NOMINEES PTY LIMITED <ACCUMULATION A/C> 1,331,140 0.1716 PACIFIC CUSTODIANS PTY LIMITED <NCM Plans Ctrl> 1,232,337 0.1617 NETWEALTH INVESTMENTS LIMITED <WRAP SERVICES A/C> 1,225,882 0.1618 PACIFIC CUSTODIANS PTY LIMITED <Employee Share Tst A/C> 1,115,014 0.1519 NATIONAL NOMINEES LIMITED <N A/C> 1,000,000 0.1320 HSBC CUSTODY NOMINEES (AUSTRALIA) LIMITED-GSCO ECA 900,151 0.12
Total 696,536,887 90.73
SUBSTANTIAL SHAREHOLDERS1 AS AT 4 SEPTEMBER 2018
NameNumber
of Shares% Issued
Capital
BlackRock Group 94,589,268 12.32Allan Gray Australia and its related bodies corporate 59,544,567 7.75First Eagle Investment Management and its associated entities 47,128,837 6.14Commonwealth Bank of Australia and its related bodies corporate 40,213,974 5.24The Vanguard Group, Inc. 38,436,257 5.0061 As notified to Newcrest under section 671B of the Corporations Act 2001.
DISTRIBUTION OF SHAREHOLDERS AS AT 4 SEPTEMBER 2018
Size of HoldingNumber of
ShareholdersNumber
of Shares% Issued
Capital
1 – 1,000 44,023 13,820,781 1.801,001 – 5,000 12,202 26,058,517 3.395,001 – 10,000 1,119 7,946,605 1.0410,001 – 100,000 566 12,362,466 1.61100,001 and Over 59 707,554,445 92.16
Total 57,969 767,742,814 100.00
The number of shareholders holding less than a marketable parcel of ordinary shares was 4,293 (based on the closing market price on 4 September 2018).
150 FINANCIAL REPORT
VOTING RIGHTSEach ordinary shareholder present at a general meeting (whether in person, by proxy or by representative) is entitled to one vote on a show of hands or, on a poll, one vote for each fully paid ordinary share held.
The Company encourages shareholders to express their views on the conduct of business by speaking at shareholder meetings or by writing to the Chairman of the Board of Directors.
DIVIDENDSThe Board has determined a final dividend of US 11.0 cents per share for the year ended 30 June 2018. An interim dividend of US 7.5 cents per share was paid on 2 May 2018.
The Dividend Reinvestment Plan (DRP) remains in place and will be offered to shareholders according to the terms of the DRP. A copy of the DRP Rules is on the Company’s website at www.newcrest.com.au.
ON MARKET BUY-BACKNewcrest has a current on-market buy-back program. There has been no activity under the program since April 2012.
AMERICAN DEPOSITARY RECEIPTSNewcrest may also be traded in the form of American Depositary Receipts (ADRs). Each ADR represents one Newcrest ordinary share. The program is administered on behalf of the Company by The Bank of New York Mellon. Contact details are set out in the Corporate Directory Section of this Report, which is inside the back cover.
ADR holders are not members of the Company, but may instruct The Bank of New York as to the exercise of voting rights pertaining to the underlying shareholding.
During the 2018 financial year, the net movement for ADRs was negative 42,260 and at year-end a net 4,664,260 ADRs were outstanding.
INVESTORSThe Company’s website at www.newcrest.com.au/investors has a section where investors have access to market releases, reports, presentations, dividend history, shareholder information, key dates and other information.
ONLINE SHARE REGISTRY INFORMATIONVisit the Company’s Share Registry, Link Market Services, at www.linkmarketservices.com.au to access a wide variety of your holding information, make the following changes online or download forms.
You can:
• check your current holding and balances;• update your electronic communication instructions;• update your address and bank details;• confirm whether you have lodged your Tax File Number (TFN), Australian Business Number (ABN) or exemption;• check transaction and dividend history;• enter your email address;• download a variety of instruction forms; and• add or update DRP instructions.
You can access your holding via a secure login using your Securityholder Reference Number (SRN) or Holder Identification Number (HIN), which you will find on your holding record. You will also need the postcode recorded on your holding record.
SHARE REGISTRY CONTACT INFORMATIONYou can also contact the Company’s Share Registry by calling 1300 554 474 within Australia or +61 1300 554 474 from outside Australia. More Share Registry contact details are set out in the Corporate Directory section of this Report, which is inside the back cover.
ANNUAL REPORTYou can access a full copy of the Annual Report online at www.newcrest.com.au. If you no longer wish to receive a hard copy of the Annual Report, log into your shareholding or contact our Share Registry to update your communication instructions.
SHAREHOLDER INFORMATION
151NEWCREST 2018 ANNUAL REPORT
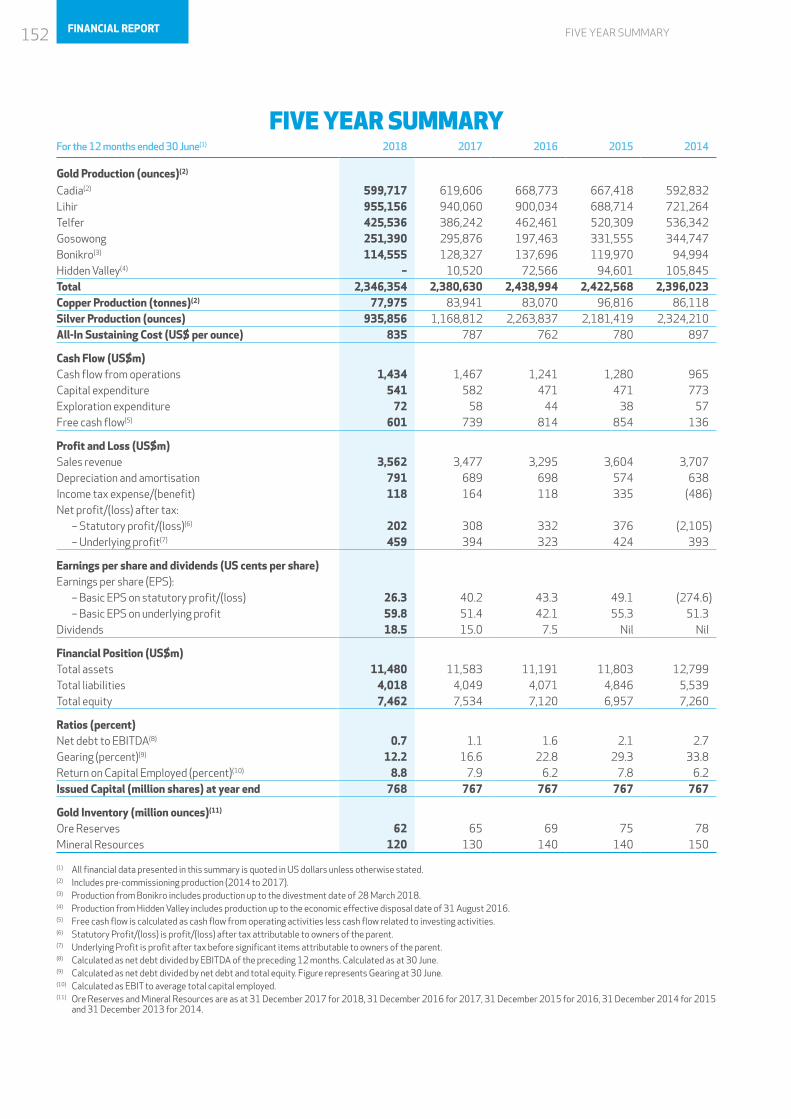
FIVE YEAR SUMMARY
FIVE YEAR SUMMARYFor the 12 months ended 30 June(1) 2018 2017 2016 2015 2014
Gold Production (ounces)(2)
Cadia(2) 599,717 619,606 668,773 667,418 592,832 Lihir 955,156 940,060 900,034 688,714 721,264 Telfer 425,536 386,242 462,461 520,309 536,342 Gosowong 251,390 295,876 197,463 331,555 344,747 Bonikro(3) 114,555 128,327 137,696 119,970 94,994 Hidden Valley(4) – 10,520 72,566 94,601 105,845 Total 2,346,354 2,380,630 2,438,994 2,422,568 2,396,023 Copper Production (tonnes)(2) 77,975 83,941 83,070 96,816 86,118 Silver Production (ounces) 935,856 1,168,812 2,263,837 2,181,419 2,324,210 All-In Sustaining Cost (US$ per ounce) 835 787 762 780 897
Cash Flow (US$m)Cash flow from operations 1,434 1,467 1,241 1,280 965 Capital expenditure 541 582 471 471 773 Exploration expenditure 72 58 44 38 57 Free cash flow(5) 601 739 814 854 136
Profit and Loss (US$m)Sales revenue 3,562 3,477 3,295 3,604 3,707 Depreciation and amortisation 791 689 698 574 638 Income tax expense/(benefit) 118 164 118 335 (486)Net profit/(loss) after tax: – Statutory profit/(loss)(6) 202 308 332 376 (2,105) – Underlying profit(7) 459 394 323 424 393
Earnings per share and dividends (US cents per share)Earnings per share (EPS): – Basic EPS on statutory profit/(loss) 26.3 40.2 43.3 49.1 (274.6) – Basic EPS on underlying profit 59.8 51.4 42.1 55.3 51.3 Dividends 18.5 15.0 7.5 Nil Nil
Financial Position (US$m)Total assets 11,480 11,583 11,191 11,803 12,799 Total liabilities 4,018 4,049 4,071 4,846 5,539 Total equity 7,462 7,534 7,120 6,957 7,260
Ratios (percent)Net debt to EBITDA(8) 0.7 1.1 1.6 2.1 2.7Gearing (percent)(9) 12.2 16.6 22.8 29.3 33.8 Return on Capital Employed (percent)(10) 8.8 7.9 6.2 7.8 6.2 Issued Capital (million shares) at year end 768 767 767 767 767
Gold Inventory (million ounces)(11)
Ore Reserves 62 65 69 75 78 Mineral Resources 120 130 140 140 150
(1) All financial data presented in this summary is quoted in US dollars unless otherwise stated.(2) Includes pre-commissioning production (2014 to 2017). (3) Production from Bonikro includes production up to the divestment date of 28 March 2018.(4) Production from Hidden Valley includes production up to the economic effective disposal date of 31 August 2016.(5) Free cash flow is calculated as cash flow from operating activities less cash flow related to investing activities. (6) Statutory Profit/(loss) is profit/(loss) after tax attributable to owners of the parent.(7) Underlying Profit is profit after tax before significant items attributable to owners of the parent. (8) Calculated as net debt divided by EBITDA of the preceding 12 months. Calculated as at 30 June.(9) Calculated as net debt divided by net debt and total equity. Figure represents Gearing at 30 June. (10) Calculated as EBIT to average total capital employed.(11) Ore Reserves and Mineral Resources are as at 31 December 2017 for 2018, 31 December 2016 for 2017, 31 December 2015 for 2016, 31 December 2014 for 2015
and 31 December 2013 for 2014.
152 FINANCIAL REPORT
CORPORATE DIRECTORYINVESTOR INFORMATION REGISTERED AND PRINCIPAL OFFICENewcrest Mining LimitedLevel 8600 St Kilda RoadMelbourne, Victoria 3004Australia
T: +61 (0)3 9522 5333F: +61 (0)3 9525 2996
E: [email protected] www.newcrest.com.au
COMPANY SECRETARIES Francesca Lee and Claire Hannon Newcrest Mining Limited
Level 8600 St Kilda RoadMelbourne, Victoria 3004Australia
T: +61 (0)3 9522 5333F: +61 (0)3 9521 3564
E: [email protected] [email protected]
INVESTOR RELATIONSChris MaitlandHead of Investor Relations Newcrest Mining Limited
Level 8600 St Kilda RoadMelbourne, Victoria 3004Australia
T: +61 (0)3 9522 5717E: [email protected]
Tamara BrownVice President Investor Relations and Corporate Development (Americas) Newcrest Mining Limited
First Canadian Place100 King Street West – Suite 5600Toronto, ON, M5X 1C9, Canada
T: + 1 647 255 3139E: [email protected]
STOCK EXCHANGE LISTINGS AUSTRALIAN SECURITIES EXCHANGE(Ticker NCM)
PORT MORESBY STOCK EXCHANGE(Ticker NCM)
NEW YORK ADRS(Ticker NCMGY)
SHARE REGISTRYLink Market Services LimitedTower 4727 Collins StreetDocklands, Victoria 3008Australia
Locked Bag A14Sydney South, New South Wales 1235Australia
T: +61 1300 554 474 (toll free within Australia)
F: +61 (0)2 9287 0303 +61 (0)2 9287 0309* *For faxing of Proxy Forms only.
E: [email protected] www.linkmarketservices.com.au
PNG REGISTRIES LIMITEDLevel 2, AON Haus McGregor Street Port Moresby, NCD Papua New Guinea
PO Box 1265Port Moresby, NCD Papua New Guinea
T: +675 321 6377/ 78F: +675 321 6379
AMERICAN DEPOSITARY RECEIPTS (ADRS)BNY MellonShareowner ServicesPO Box 505000Louisville, KY 40233-5000USA
T: + 1 888 BNY ADRS or +1888 269 2377 (toll free within the US)International Callers: +1 201 680 6825
E: [email protected]. mybnymdr.com
OTHER OFFICESPERTH OFFICELevel 1, 1 Centro AveSubiaco WA 6008Australia
T: +61 (0)8 9270 7070
PORT MORESBY OFFICELevel 4Port Tower BuildingHunter StreetPort Moresby, NCDPapua New Guinea
T: + 675 321 7711F: + 675 321 4705
COMPANY EVENTSAnnual General Meeting14 November 2018 at 10.30am
The PavilionThe Arts Centre Melbourne100 St Kilda RoadMelbourne, Victoria 3004
Visit our website at www.newcrest.com.au to view our: key dates; current share price; market releases; annual, quarterly and financial reports; operations, project and exploration information; corporate, shareholder, employment and sustainability information.
CORPORATE DIRECTORY 153NEWCREST 2018 ANNUAL REPORT