To be the leading financial services provider, partnering with our · 2019-05-30 · MCB Bank...
25
Transcript of To be the leading financial services provider, partnering with our · 2019-05-30 · MCB Bank...

To be the leading financial services provider, partnering with our customers for a more prosperous and secure future
Our Vision
We are a team of committed professionals, providing innovative and efficient financial solutions to create and nurture long-term
relationships with our customers. In doing so, we ensurethat our shareholders can invest with confidence in us
Our Mission
The standards and principles which determine our behavior and how we interact with our customers and each other
Our Values

MCB Bank Limited
CORPORATE PROFILE
Board of Directors:
Audit Committee:
Mr. Ahmad Alman Aslam Mr. Muhammad Ali Zeb
Mr. Nor Hizam Bin Hashim Mr. Samir Iqbal Saigol
Chairman Member Member Member
Chairman
Vice Chairman
Director
Director
Director
Director
Director
Director
President & CEO
DirectorDirectorDirectorDirector
Chief Financial Officer: Mr. Salman Zafar Siddiqi
Company Secretary:
Mr. Fida Ali Mirza
Auditors:
M/s. KPMG Taseer Hadi & Co.
Chartered Accountants
Legal Advisors:
M/s. Khalid Anwer & Co.
Advocates & Legal Consultants
Registered / Principal Office:
MCB House, 15-Main Gulberg
Jail Road, LahorePakistan
Registrar’s and Share Registration Office (s):
Head Office: M/s. THK Associates (Pvt.) Limited 1st Floor, 40-C, Block 6, P.E.C.H.S., Karachi Pakistan
Branch Office: M/s. THK Associates (Pvt.) Limited 2nd Floor, DYL Motorcycles Ltd. Office Building Plot No. 346, Block No. G-III,Khokhar Chowk Main Boulevard,Johar Town, Lahore Pakistan.
Mian Mohammad Mansha Mr. S. M. Muneer
Mr. Shahzad Saleem
Mian Umer Mansha
Mrs. Iqraa Hassan ManshaMr. Samir Iqbal Saigol
Mr. Ahmad Alman Aslam
Mr. Muhammad Ali ZebMr. Mohd Suhail Amar Suresh Mr. Irfan Ahmed Hashmi Mr. Nor Hizam Bin Hashim
Mr. Tariq Rafi
3Half yearly Report 2017
Bank for Life
Mr. Imran Maqbool
MCB Bank LimitedMCB Bank Limited
54 Half yearly Report 2017Half yearly Report 2017
Bank for Life Bank for Life
August 25, 2017
For and on behalf of the Board of Directors
Mian Mohammad Mansha Chairman
this merger will be reflected in MCB Bank's Financial Statements for the nine months ending September 30, 2017.
Pakistan's exports shrank by 1.4% YoY, in dollar terms, during July – June FY17 to $21.6 billion while imports have been on an uptrend, increasing by 18% YoY, in dollar terms to almost $48.5 billion. Exports have slowed down as global demand remains weak while non-oil imports such as machinery particularly under the umbrella of the China Pakistan Economic Corridor have been increasing. As a result, Pakistan's trade deficit widened to $27 billion, as per the State Bank of Pakistan, up by around $7 billion from the comparative period in the previous fiscal year. Meanwhile, workers' remittances registered a decline of 3.13% YoY, falling to $19.3 billion from last year. As a result, Pakistan's current account deficit increased to around 4.0% of GDP, more than double than last year's deficit of 1.7%.
On the positive side, however, China-Pakistan Economic Corridor ('CPEC') is beginning to show greater momentum with several energy and infrastructure projects in the pipeline, which will fuel growth in the medium term. Pakistan grew at 5.3% during the year according to the government's estimates. CPEC will also attract foreign investment to Pakistan and enhance its status as a regional manufacturing hub. During the fiscal year, net FDI stood at $2.4 billion, an eight-year high.
Pakistan's CPI inflation began the quarter at 4.78% YoY in April. However, most recently, in June, CPI inflation was registered at 3.93% YoY on the back of lower oil prices and stable food inflation while core inflation came in at 5.5% YoY. The State Bank of Pakistan, however, decided to maintain its policy rate at 5.75% at its Monetary Policy Committee meeting in May.
On the foreign exchange market side, the Pakistani Rupee remained stable relative to the US dollar, starting the quarter at 104.85 and closing at the same level. Pakistan's FX reserves decreased slightly from $21.5 billion at the beginning of the quarter to $21.2 billion by 30 June.
As regards Pakistani stock markets, the KSE-100 fell owing to political jitters beginning the quarter at 48,156 index points and ending it at 46,565 index points.
In summation, while it is expected that economic growth in Pakistan will accelerate, the effectiveness of policy measures will largely dictate whether the material benefits are realized to their inherent potential. At the same time, risks emanating from the external side will have to be closely watched.
DIRECTORS' REPORT - JUNE 2017DIRECTORS' REPORT
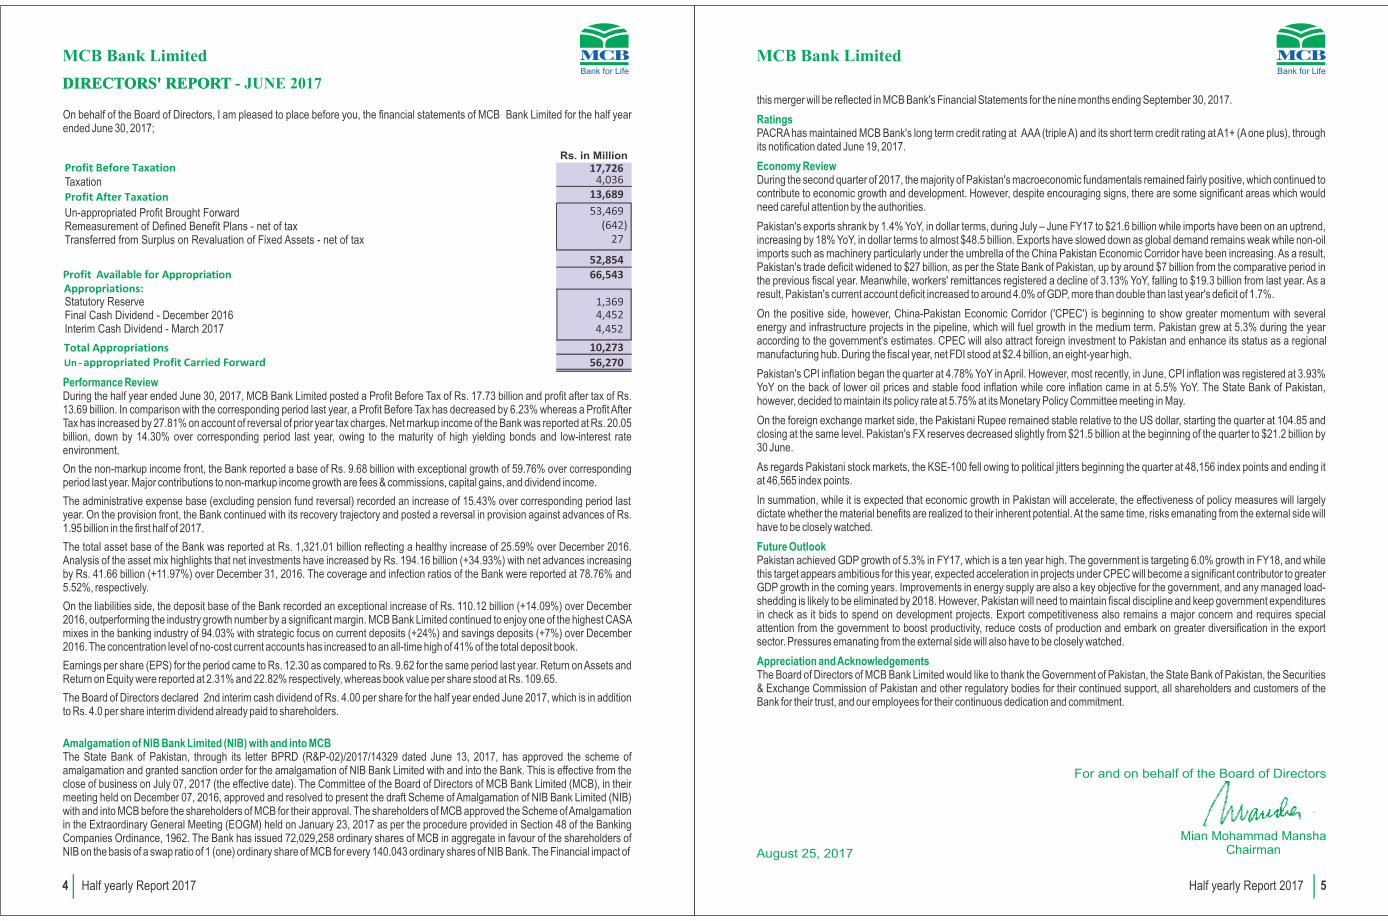
On behalf of the Board of Directors, I am pleased to place before you, the financial statements of MCB Bank Limited for the half year ended June 30, 2017;
Profit Available for Appropriation
Appropriations:
Total AppropriationsUn ‐ appropriated Profit Carried Forward
Profit Before TaxationTaxation
Un-appropriated Profit Brought ForwardRemeasurement of Defined Benefit Plans - net of taxTransferred from Surplus on Revaluation of Fixed Assets - net of tax
Statutory ReserveFinal Cash Dividend - December 2016Interim Cash Dividend - March 2017
Profit After Taxation
Rs. in Million
Performance ReviewDuring the half year ended June 30, 2017, MCB Bank Limited posted a Profit Before Tax of Rs. 17.73 billion and profit after tax of Rs. 13.69 billion. In comparison with the corresponding period last year, a Profit Before Tax has decreased by 6.23% whereas a Profit After Tax has increased by 27.81% on account of reversal of prior year tax charges. Net markup income of the Bank was reported at Rs. 20.05 billion, down by 14.30% over corresponding period last year, owing to the maturity of high yielding bonds and low-interest rate environment.
On the non-markup income front, the Bank reported a base of Rs. 9.68 billion with exceptional growth of 59.76% over corresponding period last year. Major contributions to non-markup income growth are fees & commissions, capital gains, and dividend income.
The administrative expense base (excluding pension fund reversal) recorded an increase of 15.43% over corresponding period last year. On the provision front, the Bank continued with its recovery trajectory and posted a reversal in provision against advances of Rs. 1.95 billion in the first half of 2017.
The total asset base of the Bank was reported at Rs. 1,321.01 billion reflecting a healthy increase of 25.59% over December 2016. Analysis of the asset mix highlights that net investments have increased by Rs. 194.16 billion (+34.93%) with net advances increasing by Rs. 41.66 billion (+11.97%) over December 31, 2016. The coverage and infection ratios of the Bank were reported at 78.76% and 5.52%, respectively.
On the liabilities side, the deposit base of the Bank recorded an exceptional increase of Rs. 110.12 billion (+14.09%) over December 2016, outperforming the industry growth number by a significant margin. MCB Bank Limited continued to enjoy one of the highest CASA mixes in the banking industry of 94.03% with strategic focus on current deposits (+24%) and savings deposits (+7%) over December 2016. The concentration level of no-cost current accounts has increased to an all-time high of 41% of the total deposit book.
Earnings per share (EPS) for the period came to Rs. 12.30 as compared to Rs. 9.62 for the same period last year. Return on Assets and Return on Equity were reported at 2.31% and 22.82% respectively, whereas book value per share stood at Rs. 109.65.
The Board of Directors declared 2nd interim cash dividend of Rs. 4.00 per share for the half year ended June 2017, which is in addition to Rs. 4.0 per share interim dividend already paid to shareholders.
Amalgamation of NIB Bank Limited (NIB) with and into MCBThe State Bank of Pakistan, through its letter BPRD (R&P-02)/2017/14329 dated June 13, 2017, has approved the scheme of amalgamation and granted sanction order for the amalgamation of NIB Bank Limited with and into the Bank. This is effective from the close of business on July 07, 2017 (the effective date). The Committee of the Board of Directors of MCB Bank Limited (MCB), in their meeting held on December 07, 2016, approved and resolved to present the draft Scheme of Amalgamation of NIB Bank Limited (NIB) with and into MCB before the shareholders of MCB for their approval. The shareholders of MCB approved the Scheme of Amalgamation in the Extraordinary General Meeting (EOGM) held on January 23, 2017 as per the procedure provided in Section 48 of the Banking Companies Ordinance, 1962. The Bank has issued 72,029,258 ordinary shares of MCB in aggregate in favour of the shareholders of NIB on the basis of a swap ratio of 1 (one) ordinary share of MCB for every 140.043 ordinary shares of NIB Bank. The Financial impact of
17,726
53,469(642)
27
52,85466,543
4,03613,689
1,369
10,273
56,270
4,4524,452
Economy ReviewDuring the second quarter of 2017, the majority of Pakistan's macroeconomic fundamentals remained fairly positive, which continued to contribute to economic growth and development. However, despite encouraging signs, there are some significant areas which would need careful attention by the authorities.
Appreciation and AcknowledgementsThe Board of Directors of MCB Bank Limited would like to thank the Government of Pakistan, the State Bank of Pakistan, the Securities & Exchange Commission of Pakistan and other regulatory bodies for their continued support, all shareholders and customers of the Bank for their trust, and our employees for their continuous dedication and commitment.
Future OutlookPakistan achieved GDP growth of 5.3% in FY17, which is a ten year high. The government is targeting 6.0% growth in FY18, and while this target appears ambitious for this year, expected acceleration in projects under CPEC will become a significant contributor to greater GDP growth in the coming years. Improvements in energy supply are also a key objective for the government, and any managed load-shedding is likely to be eliminated by 2018. However, Pakistan will need to maintain fiscal discipline and keep government expenditures in check as it bids to spend on development projects. Export competitiveness also remains a major concern and requires special attention from the government to boost productivity, reduce costs of production and embark on greater diversification in the export sector. Pressures emanating from the external side will also have to be closely watched.
Ratings PACRA has maintained MCB Bank's long term credit rating at AAA (triple A) and its short term credit rating at A1+ (A one plus), through its notification dated June 19, 2017.

MCB Bank LimitedMCB Bank Limited
Half yearly Report 2017
Bank for Life Bank for Life
6 Half yearly Report 2017 7

97,450,749
74,222,347
6,628,948
4,343,841
7 5,161,481
2,809,752
8 750,091,914
555,928,553
9 389,643,484
347,979,845
10 34,111,641
32,752,672
-
-
37,921,610
33,776,671
1,321,009,827
1,051,813,681
12,621,191
12,843,552
11 232,901,175
74,515,383
12 891,550,587
781,429,823
- -
- - 13 10,037,973 11,260,215
30,108,135 30,138,083
14
The annexed notes 1 to 24 form an integralpart of this unconsolidatedcondensed interim financial
information.
Assets
Cash and balances with treasury banks
Balances with other banks
Lendings to financial institutions
Investments - net
Advances - net
Operating fixed assets
Deferred tax assets - net
Other assets - net
Liabilities
Bills payable
Borrowings
Deposits and other accounts
Sub-ordinated loan
Liabilities against assets subject to finance lease
Deferred tax liabilities - net
Other liabilities
Net assets
Represented by
Share capital
Reserves
Unappropriated profit
Surplus on revaluation of assets - net of tax
Contingencies and commitments
MCB Bank Limited MCB Bank Limited
8 9Half yearly Report 2017Half yearly Report 2017
Unaudited Audited
Note June 30, December 31,
2017 2016
---------- (Rupees in '000) ----------
Unconsolidated Condensed Interim Statement of Financial PositionAs at June 30, 2017
Bank for Life Bank for Life
Introduction
We have reviewed the accompanying unconsolidated condensed interim statement of financial position of
MCB Bank Limited (“the Bank”) as at 30 June 2017, and the related unconsolidated condensed interim profit
and loss account, unconsolidated condensed interim statement of comprehensive income, unconsolidated
condensed interim statement of changes in equity, unconsolidated condensed interim statement of cash flows
and explanatory notes (here-in-after referred to as “interim financial information”) for the six months period then
ended. Management is responsible for the preparation and presentation of the interim financial information in
accordance with approved accounting standards applicable in Pakistan for interim financial reporting. Our
responsibility is to express a conclusion on this interim financial information based on our review.
Scope of review
We conducted our review in accordance with the International Standard on Review Engagements 2410,
“Review of Interim Financial Information Performed by the Independent Auditor of the Entity”. A review of
interim financial information consists of making inquiries, primarily of persons responsible for financial and
accounting matters, and applying analytical and other review procedures. A review is substantially less in scope
than an audit conducted in accordance with International Standards on Auditing and consequently does not
enable us to obtain assurance that we would become aware of all significant matters that might be identified in
an audit. Accordingly, we do not express an audit opinion.
Conclusion
Based on our review, nothing has come to our attention that causes us to believe that the accompanying interim
financial information as of and for the six months period ended 30 June 2017 is not prepared, in all material
respects, in accordance with approved accounting standards as applicable in Pakistan for interim financial
reporting.
Other matters
The figures for the unconsolidated condensed interim profit and loss account and unconsolidated condensed
interim statement of comprehensive income for the quarters ended 30 June 2017 and 30 June 2016 have not
been reviewed and we do not express a conclusion on them.
INDEPENDENT AUDITORS' REPORT TO THE MEMBERS ON REVIEW OF INTERIM FINANCIAL INFORMATION
KPMG Taseer Hadi & Co.Chartered Accountants
Engagement PartnerM. Rehan Chughtai
LahoreDated: August 25, 2017
11,130,307
54,648,451
910,187,056 143,790,766
1,177,219,061
143,790,766
141,626,625
11,130,307
53,346,861
53,469,072
117,946,240
23,680,385
141,626,625
56,269,570
122,048,328
21,742,438
Samir Iqbal Saigol
President / CEO Imran Maqbool
Director Nor Hizam Bin Hashim
Director Muhammad Ali Zeb

Profit after tax for the period
Other comprehensive income
Items that will not be reclassified to profit and loss account
Remeasurement of defined benefit plans - net of tax
Items that may be reclassified to profit and loss account
Effect of translation of net investment in foreign branches
Comprehensive income transferred to equity
Components of comprehensive income not reflected in equity
Net change in fair value of available for sale securities
Deferred tax
Total comprehensive income for the period
The annexed notes 1 to 24 form an integral part of this unconsolidated condensed interim financial information.
4,694,316 10,710,985
(81,063)
(81,063)
40,440
(33,260)
4,653,693 10,596,662
1,170,506
2,626,790
(412,715) (922,413)
757,791 1,704,377
5,411,484 12,301,039
MCB Bank LimitedMCB Bank Limited
10 11
Half year ended
June 30,
2016
Half year ended
June 30,
2017
Quarter ended
June 30,
2017
Quarter ended
June 30,
2016
---------- (Rupees in '000) ----------
For the half year ended June 30, 2017Unconsolidated Condensed Interim Statement of Comprehensive Income (Un-audited)
Bank for Life Bank for Life
Unconsolidated Condensed Interim Profit and Loss Account (Un-audited)For the half year ended June 30, 2017
The annexed notes 1 to 24 form an integral part of this unconsolidated condensed interim financial information.
Half yearly Report 2017Half yearly Report 2017
Note
Half year ended June 30,
2016
Quarter ended
June 30,
2017
---------- (Rupees in '000) ----------
Half year ended
June 30,
2017
Quarter ended June 30,
2016
Mark-up / return / interest earned
Mark-up / return / interest expensed
Net mark-up / interest income
Provision / (reversal) against loans and advances - net
Provision / (reversal) for diminution in the value of investments - net
Bad debts written off directly
Net mark-up / interest income after provisions
Non mark-up / interest income
Fee, commission and brokerage income
Dividend income
Income from dealing in foreign currencies
Gain on sale of securities - net
Other income
Total non mark-up / interest income
Non mark-up / interest expenses
Administrative expenses
Other provision - net
Other charges
Total non mark-up / interest expenses
Extraordinary / unusual item
Profit before taxation
Taxation - current period
- prior years
- deferred
Profit after taxation
Earnings per share - basic and diluted
Unrealized gain/(loss) on revaluation of investments
classified as held for trading
18,774,414
6,703,044
12,071,370
(159,208)
4,479
6
(154,723)
12,226,093
1,950,527
286,668
281,558
463,829
1,220
116,226
3,100,028
15,326,121
5,255,269
12,696
228,602
5,496,567
9,829,554
-
9,829,554
3,421,962
1,693,330
19,946
5,135,238
4,694,316
4.22
36,388,562
12,992,000
23,396,562
(624,848)
4,479
18
(620,351)
24,016,913
3,882,300
736,858
492,984
15 668,302
(212)
277,838
6,058,070
30,074,983
10,719,181
31,841
420,283
11,171,305
18,903,678
-
18,903,678
6,637,434
1,693,330
(138,071)
8,192,693
10,710,985
17 9.62
------------------------- (In Rupees) ----------------------------
6.78 12.30
36,083,679
16,033,247
20,050,432
(1,947,008)
587,107
14
(1,359,887)
21,410,319
4,637,928
800,383
694,796
3,283,619
(43,202)
304,561
9,678,085
31,088,404
12,384,962
559,987
417,874
13,362,823
17,725,581
17,725,581
6,146,267
(2,175,828)
65,806
4,036,245
13,689,336
18,763,311
8,447,797
10,315,514
(1,190,099)
710,117
-
(479,982)
10,795,496
2,442,237
446,050
411,743
1,006,377
(9,325)
197,004
4,494,086
15,289,582
6,286,192
547,845
202,808
7,036,845
8,252,737
8,252,737
2,812,285
(2,175,828)
73,600
710,057
7,542,680
7,542,680 13,689,336
(642,454)
(642,454)
(34,973)
(67,344)
6,865,253 12,979,538
(2,446,409)
(2,940,234)
856,242 1,029,081
(1,590,167) (1,911,153)
5,275,086 11,068,385
- -
Samir Iqbal Saigol
President / CEO Imran Maqbool
Director Nor Hizam Bin Hashim
Director Muhammad Ali Zeb
Samir Iqbal Saigol
President / CEO Imran Maqbool
Director Nor Hizam Bin Hashim
Director Muhammad Ali Zeb

Cash flows from operating activitiesProfit before taxation
Less: Dividend income
Adjustments for:
Depreciation
Amortization
Bad debts written off directly
Provision / (reversal) against loans and advances - net
Provision / (reversal) for diminution in the value of investments - net
Other provision - net
Provision for Workers' Welfare Fund
Charge / (reversal) for defined benefit plans
Gain on sale of shares in associate
Gain on disposal of fixed assets - net
(Increase) / decrease in operating assets
Lendings to financial institutions
Net investment in held for trading securities
Advances - net
Other assets - net
Increase / (decrease) in operating liabilities
Bills payable
Borrowings
Deposits and other accounts
Other liabilities
Defined benefits paid
Income tax paid
Net cash flows from operating activities
Cash flows from investing activities
Net investments in available-for-sale securities
Net investments in held-to-maturity securities
Dividend income received
Proceeds from demerger scheme
Proceeds from divestment in associate
Sale proceeds of property and equipment disposed off
Investment in operating fixed assets
Net cash flows from investing activities
Cash flows from financing activities
Dividend paid
Net cash flows from financing activities
Exchange difference on translation of net investment in foreign branches
Increase in cash and cash equivalents
Cash and cash equivalents at January 1
Cash and cash equivalents at June 30
The annexed notes 1 to 24 form an integral part of this unconsolidated condensed interim financial information.
Unrealized loss on revaluation of investments classified as held for trading
June 30, June 30,2017 2016
18,903,67817,725,581
(736,858)(800,383)
18,166,82016,925,198
788,178 789,228
127,584 192,926
14 18
(1,947,008)
(624,848)
587,107
4,479
559,987
31,841
354,512
378,074
(53,968)
(94,245)
43,202
212
(685,593)
(98,588)
(9,050)
(47,408)
(235,035)
531,689
16,690,163
18,698,509
(2,351,729)
(156,372)
(24,010,655)
(219,400)
(39,716,645)
(37,567,930)
(583,469)
(4,257,288)
(66,662,498)
(42,200,990)
(222,361)
(685,572)
158,108,521 21,568,657
110,120,764
58,629,264
(898,999)
(2,381,386)
267,107,925
77,130,963
217,135,590
53,628,482
(156,663)
(190,507)
(8,480,674)
(7,805,257)
208,498,253
45,632,718
(177,991,867)
(24,438,447)
4,171,394
(5,280,125)
813,799
735,674
-
5,901,988
782,817
118,330
16,288
132,719
(2,273,741) (1,226,084)
(174,481,310) (24,055,945)
(8,713,361) (9,181,940)
(8,713,361) (9,181,940)
(33,260)(67,344)
12,361,57325,236,238
63,682,34278,406,662
76,043,915103,642,900
---------- (Rupees in '000) ----------
MCB Bank LimitedMCB Bank Limited
1312
For the half year ended June 30, 2017Unconsolidated Condensed Interim Statement of Changes in Equity (Un-audited)
- - -
- - -
- - (67,344)
- - (67,344)
- - -
- - -
- - -
- - -
- - -
11,130,307 9,702,528 99,830
11,130,307 9,702,528 318,484 22,688,069 18,600,000 50,746,685 113,186,073
- - - - - 10,710,985 10,710,985
- - - - - (81,063) (81,063)
- - (33,260) - - - (33,260)
- - (33,260) - - 10,629,922 10,596,662
- - - - - (4,452,123) (4,452,123)
- - - - - (4,452,123) (4,452,123)
- - - - - (8,904,246) (8,904,246)
- - - - - 24,311 24,311
-
-
-
1,071,099
- (1,071,099) -
11,130,307
9,702,528
285,224
23,759,168
18,600,000 51,425,573 114,902,800
-
-
-
-
- 11,179,911 11,179,911
-
-
-
-
- 861,500 861,500
-
-
(118,050)
-
- - (118,050)
-
-
(118,050)
-
- 12,041,411 11,923,361
-
-
-
-
- (4,452,123) (4,452,123)
-
-
-
-
- (4,452,123) (4,452,123)
-
-
-
-
- (8,904,246) (8,904,246)
-
-
-
-
- 24,325 24,325
-
-
-
1,117,991
- (1,117,991) -
11,130,307
9,702,528
167,174
24,877,159
26,246,093
18,600,000
18,600,000
53,469,072 117,946,240
Total comprehensive income for the six months ended June 30, 2017
Profit after taxation for six months period
ended June 30, 2017
Remeasurement of defined benefit plans - net of tax
Exchange differences on translation of net
investment in foreign branches
Transactions with owners recognized directly in equity
Final cash dividend at Rs. 4.0 per share - December 31, 2016
Interim cash dividend at Rs. 4.0 per share - March 31, 2017
Transferred from surplus on revaluation of fixed
assets to unappropriated profit - net of tax
Transferred to statutory reserve
Balance as at June 30, 2017
The annexed notes 1 to 24 form an integral part of this unconsolidated condensed interim financial information.
Balance as at December 31, 2015
Change in equity for six months ended June 30, 2016
Total comprehensive income for the six months ended June 30, 2016
Profit after taxation for six months period
ended June 30, 2016
Remeasurement of defined benefit plans - net of tax
Exchange differences on translation of net
investment in foreign branches
Transactions with owners recognized directly in equity
Final cash dividend at Rs. 4.0 per share - December 31, 2015
Interim cash dividend at Rs. 4.0 per share - March 31, 2016
Transferred from surplus on revaluation of fixed
assets to unappropriated profit - net of tax
Transferred to statutory reserve
Balance as at June 30, 2016
Change in equity for six months ended December 31, 2016
Total comprehensive income for the six months ended December 31, 2016
Profit after taxation for six months period
ended December 31, 2016
Remeasurement of defined benefit plans - net of tax
Exchange differences on translation of net
investment in foreign branches
Transactions with owners recognized directly in equity
Interim cash dividend at Rs. 4.0 per share - June 30, 2016
Interim cash dividend at Rs. 4.0 per share - September 30, 2016
Transferred from surplus on revaluation of fixed
assets to unappropriated profit - net of tax
Transferred to statutory reserve
Balance as at December 31, 2016
Change in equity for six months ended June 30, 2017
Share
capital
---------------------------------------------------------- (Rupees in'000) ----------------------------------------------------------
Capital Reserves
Share
premium
Total General
reserve
Exchange
translation
reserve
Unappropriated
profit
Revenue Reserves
Statutory
reserve
---------------------------------------------------------- (Rupees in'000) ----------------------------------------------------------
Bank for Life Bank for Life
Unconsolidated Condensed Interim Cash Flow Statement (Un-audited)For the half year ended June 30, 2017
13,689,336
(642,454)
(67,344)
12,979,538
(4,452,123)
(4,452,123)
(8,904,246)
26,796
-
122,048,328
13,689,336
(642,454)
-
13,046,882
(4,452,123)
(1,368,934)1,368,934
56,269,570
(4,452,123)
(8,904,246)
26,796
-
-
-
-
-
-
-
-
-
-
-
-
-
-
-
-
-
Half yearly Report 2017Half yearly Report 2017
Samir Iqbal Saigol
President / CEO Imran Maqbool
Director Nor Hizam Bin Hashim
Director Muhammad Ali Zeb
Samir Iqbal Saigol
President / CEO Imran Maqbool
Director Nor Hizam Bin Hashim
Director Muhammad Ali Zeb

MCB Bank Limited
14 Half yearly Report 2017
Bank for Life
For the half year ended June 30, 2017Notes to the Unconsolidated Condensed Interim Financial Information (Un-audited)
1 STATUS AND NATURE OF BUSINESS
MCB Bank Limited ('the Bank') is a banking company incorporated in Pakistan and is engaged in commercial banking and related
services. The Bank's ordinary shares are listed on Pakistan Stock Exchange. The Bank's Registered Office and Principal Office are
situated at MCB -15 Main Gulberg, Lahore. The Bank operates 1,233 branches (December 31, 2016: 1,227 branches) within Pakistan
and 11 branches (December 31, 2016: 11 branches) outside the country (including the Karachi Export Processing Zone Branch).
2 BASIS OF PRESENTATION
This financial information represents unconsolidated condensed interim financial information of MCB Bank Limited. The consolidated
condensed interim financial information of the Group is being issued separately.
2.1
In accordance with the directives of the Federal Government regarding the shifting of the banking system to Islamic modes, the State
Bank of Pakistan (SBP) has issued various circulars from time to time. Permissible forms of trade-related modes of financing include
purchase of goods by banks from their customers and immediate resale to them at appropriate profit in price on deferred payment
basis. The purchases and sales arising under these arrangements are not reflected in this unconsolidated condensed interim financial
information as such but are restricted to the amount of facility actually utilized and the appropriate portion of profit thereon.
2.3
For the purpose of translation, rates of Rs. 104.8540 per US Dollar (December 31, 2016: Rs.104.5985).2.4
3 STATEMENT OF COMPLIANCE
The unconsolidated condensed interim financial information of the Bank has been prepared in accordance with the requirements of
International Accounting Standard (IAS) 34, Interim Financial Reporting, Islamic Financial Accounting Standards (IFAS) issued by the
Institute of Chartered Accountants of Pakistan, the requirements of the Companies Ordinance, 1984, the Banking Companies
Ordinance,1962 and directives issued by the Securities and Exchange Commission of Pakistan (SECP) and the SBP. In case
requirements differ, the requirements of the Companies Ordinance, 1984, the Banking Companies Ordinance, 1962 and the said
directives have been followed.
3.1
The Companies Ordinance, 1984 has been repealed after the enactment of the Companies Act, 2017. However, as allowed by the
SECP vide its press release dated July 20, 2017, this unconsolidated condensed interim financial information has been prepared in
accordance with the provisions of the repealed Companies Ordinance, 1984.
3.2
The SBP has deferred the applicability of International Accounting Standard (IAS) 39, 'Financial Instruments: Recognition and
Measurement' and International Accounting Standard (IAS) 40, 'Investment Property' for Banking Companies through BSD Circular
Letter No. 10 dated August 26, 2002. The Securities and Exchange Commission of Pakistan (SECP) has deferred applicability of
IFRS-7 "Financial Instruments: Disclosures" on banks through S.R.O 411(1) /2008 dated April 28, 2008. Accordingly, the
requirements of these standards have not been considered in the preparation of this unconsolidated condensed interim financial
information. However, investments have been classified and valued in accordance with the requirements prescribed by the SBP
through various circulars. Further, segment information is being disclosed in accordance with SBP’s prescribed formats per BSD
circular 4 dated February17, 2006 which prevails over the requirements specified in IFRS 8.
3.3
IFRS10 Consolidated Financial Statements was made applicable from period beginning on or after January 01, 2015 vide S.R.O
633(I)/2014 dated July 10, 2014 by SECP. However, SECP has directed that the requirements of consolidation under section 237 of
the repealed Companies Ordinance 1984 and IFRS-10 "Consolidated Financial Statements" is not applicable in case of investment by
companies in mutual funds established under Trust structure, through S.R.O 56(I) /2016 dated January 28, 2016. Accordingly, the
requirements of this standard have not been applied in the preparation of this unconsolidated condensed interim financial information
to the extent of their applicability to these mutual funds.
3.4
The disclosures made in this unconsolidated condensed interim financial information have, however been limited based on the format
prescribed by the SBP vide BSD Circular No. 2 dated May 12, 2004 and International Accounting Standard 34, "Interim Financial
Reporting". They do not include all of the disclosures required for annual financial statements and this unconsolidated condensed
interim financial information should be read in conjunction with the unconsolidated financial statements of the Bank for the year ended
December 31, 2016.
2.2
The State Bank of Pakistan, through its letter BPRD (R&P-02)/2017/14329 dated June 13, 2017, has approved the scheme of
amalgamation and granted sanction order for the amalgamation of NIB Bank Limited with and into the Bank. This is effective from the
close of business on July 07, 2017 (the effective date). The Committee of the Board of Directors of MCB Bank Limited (MCB), in their
meeting held on December 07, 2016, approved and resolved to present the draft Scheme of Amalgamation of NIB Bank Limited (NIB)
with and into MCB before the shareholders of MCB for their approval. The shareholders of MCB approved the Scheme of
Amalgamation in the Extraordinary General Meeting (EOGM) held on January 23, 2017 as per the procedure provided in Section 48 of
the Banking Companies Ordinance, 1962. The acquisition has added 170 branches, incremental deposit of Rs. 82 billion and
incremental gross advances of Rs.98 billion. The Bank has issued 72,029,258 ordinary shares of MCB in aggregate in favour of the
shareholders of NIB on the basis of a swap ratio of 1 (one) ordinary share of MCB for every 140.043 ordinary shares of NIB Bank. The
Financial impact of this takeover will be reflected in MCB Bank’s Financial Statements for the nine months ending September 30,
2017.
1.1
7. LENDINGS TO FINANCIAL INSTITUTIONS
8. INVESTMENTS - NET
8.1 Investments by types
Held-for-trading securities
Available-for-sale securities 8.2
Held-to-maturity securities
Associates 8.3
Subsidiaries
Investments at cost
Less: Provision for diminution in the value of investments
Investments (net of provisions)
Surplus / (deficit) on revaluation of available for sale securities - net
Surplus / (deficit) on revaluation of held-for-trading securities - net
Investments at revalued amounts - net of provisions
Call money lendings
Repurchase agreement lendings
MCB Bank Limited
15
Half yearly Report 2017
For the half year ended June 30, 2017Notes to the Unconsolidated Condensed Interim Financial Information (Un-audited)
Bank for Life
4 BASIS OF MEASUREMENT
This unconsolidated condensed interim financial information has been prepared under the historical cost convention except that
certain classes of fixed assets and non-banking assets acquired in satisfaction of claims are stated at revalued amounts and certain
investments and derivative financial instruments have been marked to market and are carried at fair value. In addition, obligations in
respect of staff retirement benefits are carried at present value.
4.1
5 SIGNIFICANT ACCOUNTING POLICIES AND FINANCIAL RISK MANAGEMENT
The accounting polices adopted in the preparation of this unconsolidated condensed interim financial information are the same as those
applied in the preparation of the unconsolidated financial statements of the Bank for the year ended December 31, 2016.
5.1
6 SIGNIFICANT ACCOUNTING ESTIMATES AND JUDGMENTS
The basis for significant accounting estimates and judgments adopted in the preparation of this unconsolidated condensed interim
financial information are the same as those applied in the preparation of the unconsolidated financial statements of the Bank for the
year ended December 31, 2016.
The financial risk management objectives and policies are consistent with those disclosed in the unconsolidated financial statements
of the Bank for the year ended December 31, 2016.
5.2
This unconsolidated condensed interim financial information is presented in Pak Rupees, which is the Bank's functional and
presentation currency.
4.2
June 30, December 31,
2017 2016
4,116,258 558,800
1,045,223 2,250,952
5,161,481 2,809,752
Note
------------ (Rupees in '000) ------------
Given as
collateral
June 30, 2017
---------- (Rupees in '000) ----------
TotalHeld by
bank
16,205,215 7,952,724 24,157,939
489,035,052 196,480,492 685,515,544
17,143,144 - 17,143,144
522,383,411
204,433,216 726,816,627
748,172
- 748,172
10,845,787 - 10,845,787
11,593,959 - 11,593,959
533,977,370 204,433,216 738,410,586
(2,473,928) - (2,473,928)
531,503,442 204,433,216 735,936,658
14,282,250 (83,792) 14,198,458
(41,494) (1,708) (43,202)
545,744,198 204,347,716 750,091,914

June 30, December 31,
Note 2017 2016
9. ADVANCES - NET
Loans, cash credits, running finances, etc
- In Pakistan 372,147,088
336,403,574
- Outside Pakistan 20,188,802
18,186,103
392,335,890
354,589,677
Net Investment in finance lease
- In Pakistan 2,294,783
1,812,760
- Outside Pakistan 87,380
80,328
2,382,163
1,893,088
Bills discounted and purchased (excluding treasury bills)
- Payable in Pakistan 5,356,024 5,768,909
- Payable outside Pakistan 7,274,032 5,426,101
12,630,056 11,195,010
Advances - gross 407,348,109 367,677,775
Less: Provision against loans and advances
- Specific provision 9.1 (16,724,131) (18,938,091)
- General provision 9.2 (555,833) (367,681)
- General provision against consumer loans & small enterprise loans 9.3 (367,953) (345,791)
- General provision by overseas operations 9.4 (56,708) (46,367)
(17,704,625) (19,697,930)
Advances - net of provision 389,643,484 347,979,845
---------- (Rupees in '000) ----------
Held-for-trading securities 145,662 - 145,662
Available-for-sale securities 8.2 468,571,422 38,952,255 507,523,677
Held-to-maturity securities 21,267,040
47,498
21,314,538
489,984,124
38,999,753
528,983,877
Associates 8.3 845,396
-
845,396
Subsidiaries 10,845,787
-
10,845,787
11,691,183
-
11,691,183
Investments at cost 501,675,307
38,999,753
540,675,060
Less: Provision for diminution in the value of investments (1,886,821)
-
(1,886,821)
Investments (net of provisions) 499,788,486
38,999,753
538,788,239
Surplus / (deficit) on revaluation of available for sale securities - net 17,147,233 (8,541) 17,138,692
Surplus / (deficit) on revaluation of held-for-trading securities - net 1,622 - 1,622
Investments at revalued amounts - net of provisions 516,937,341 38,991,212 555,928,553
------------ (Rupees in '000) ------------
Given as
collateral
TotalHeld by
bank
December 31, 2016
MCB Bank Limited
16 Half yearly Report 2017
Bank for Life
For the half year ended June 30, 2017Notes to the Unconsolidated Condensed Interim Financial Information (Un-audited)
8.2
8.3
Investments include Pakistan Investment Bonds amounting to Rs. 67.9 million (December 31, 2016: Rs. 67.9 million) earmarked by
the State Bank of Pakistan and National Bank of Pakistan against TT / DD discounting facilities and demand note facilities sanctioned
to the Bank. In addition, Pakistan Investment Bonds amounting to Rs. 5.0 million (December 31, 2016: Rs. 5.0 million) have been
pledged with the Controller of Military Accounts on the account of Regimental Fund Account.
Investment of the Bank in Adamjee Insurance Company Limited is carried at cost amounting to Rs. 695.651 million (December 31,
2016: Rs. 792.875 million) as at June 30, 2017 in accordance with the treatment specified in International Accounting Standard (IAS)
28 "Accounting for Investments in Associates". The market value of the investment in Adamjee Insurance Company Limited as at June
30, 2017 amounted to Rs. 5,138.035 million (December 31, 2016: Rs. 6,351.272 million).
9.1
Note
Other Assets Especially
Mentioned (OAEM) 9.1.1 66,642 -
66,642
3,980
3,980
Substandard 3,114,812 24,819
3,139,631
34,521
34,521
Doubtful 92,766 109,141
201,907
100,953
100,953
Loss 13,720,776 5,348,838 19,069,614 16,584,677 16,584,677
16,994,996 5,482,798 22,477,794 16,724,131 16,724,131
Other Assets Especially
Mentioned (OAEM) 9.1.1 31,918 - 31,918 1,617 1,617
Substandard 72,424 2,487 74,911 18,520 18,520
Doubtful 307,754 55,532 363,286 181,643 181,643
Loss 15,926,350 5,291,785 21,218,135 18,736,311 18,736,311
16,338,446 5,349,804 21,688,250 18,938,091 18,938,091
Specific
Provision
Held
Overseas
Specific
Provision
Held
Total
Specific
Provision
Required
Classified Advances
Advances include Rs. 22,477.794 million (December 31, 2016: Rs. 21,688.250 million) which have been placed under non-
performing status as detailed below:
June 30, 2017
Category of Classification
December 31, 2016
Domestic
-------------------------------------( Rupees in '000 )------------------------------------
-------------------------------------( Rupees in '000 )------------------------------------
Total DomesticCategory of Classification Overseas
Specific
Provision
Required
Classified Advances
MCB Bank Limited
17Half yearly Report 2017
Bank for Life
For the half year ended June 30, 2017Notes to the Unconsolidated Condensed Interim Financial Information (Un-audited)
9.1.1
9.2
This represents non-performing portfolio of agricultural financing and advances to small enterprises classified as OAEM as per the requirements of
the Prudential Regulations issued by the SBP.
General provision against advances represents provision maintained at around 0.1% of gross advances.
9.3 General provision against consumer loans represents provision maintained against fully secured performing portfolio and unsecured performing
portfolio as required by the Prudential Regulations issued by the SBP. General provision against Small Enterprise Finance represents provision
maintained at an amount equal to 1% of the fully secured performing portfolio and 2% of the unsecured performing portfolio as required by the
Prudential Regulations issued by the SBP.
9.4 General provisions pertaining to overseas advances are made in accordance with the requirements of the regulatory authorities of the respective
countries in which the overseas branches operate.
9.5 State Bank of Pakistan vide BSD Circular No. 2 dated January 27, 2009, BSD Circular No. 10 dated October 20, 2009, BSD Circular No. 02 of 2010
dated June 03, 2010 and BSD Circular No.1 of 2011 dated October 21, 2011 has allowed benefit of forced sale value (FSV) of Plant & Machinery
under charge, pledged stock and mortgaged residential, commercial & industrial properties (land and building only) held as collateral against NPLs
for five years from the date of classification. However, management has not taken the FSV benefit in calculation of specific provision.
Note

18 Half yearly Report 2016
MCB Bank LimitedBank for Life
Notes to the Unconsolidated Condensed Interim Financial Information (Un-audited)For the half year ended June 30, 2017
June 30, December 31,
13. DEFERRED TAX LIABILITY / (ASSET) - NET
The details of the tax effect of taxable and deductible temporary differences are as follows:
Taxable temporary differences on:
Surplus on revaluation of operating fixed assets 1,039,662 1,054,091
Surplus on revaluation of Non-banking assets 76,111 76,111
Accelerated tax depreciation 1,404,434 1,425,265
Receivable from pension fund 2,561,781 2,720,719
Surplus / deficit on revaluation of securities 4,969,461 5,998,542
10,051,449 11,274,728
Deductible temporary differences on:
Provision for bad debts (13,476) (7,048)
Provision for post retirement benefits - (7,465)
(13,476) (14,513)
10,037,973 11,260,215
2017 2016
10. OPERATING FIXED ASSETS
Capital work-in-progress 1,484,626 938,075
Property and equipment 32,308,178 31,471,310
Intangible asset 318,837 343,287
34,111,641 32,752,672
10.1.
June 30, December 31,
2017 2016
11. BORROWINGS
In Pakistan 229,220,152
70,180,289
Outside Pakistan 3,681,023
4,335,094
232,901,175
74,515,383
11.1. Details of borrowings (secured / unsecured)
Secured
Borrowings from State Bank of Pakistan
Export refinance scheme 13,179,977 12,535,416
Long term financing facility 7,353,584 5,841,088
Financing facility for storage of agricultural produce 269,188 318,490
20,802,749 18,694,994
Repurchase agreement borrowings 204,388,885 38,984,230
225,191,634 57,679,224
UnsecuredBorrowings from other financial institutions 766,545 1,188,851
Call borrowings 6,506,199 15,487,782
Overdrawn nostro accounts 436,797 159,526
7,709,541 16,836,159
232,901,175 74,515,383
12. DEPOSITS AND OTHER ACCOUNTS
Customers
Fixed deposits 51,771,716 45,340,915
Savings deposits 459,040,579 427,583,023
Current accounts 352,040,464 284,065,590
Margin accounts 8,883,034 6,904,119
871,735,793 763,893,647Financial institutions
Remunerative deposits 11,959,107 10,474,158
Non-remunerative deposits 7,855,687 7,062,018
19,814,794 17,536,176
891,550,587 781,429,823
---------- (Rupees in '000) ----------
---------- (Rupees in '000) ----------
Additions and disposals during the period amounted to Rs. 2,273.741 million (June 30, 2016: Rs. 1,226.084 million) and Rs. 7.238
million (June 30, 2016: Rs. 85.311 million), respectively.
19Half yearly Report 2017
MCB Bank LimitedBank for Life
For the half year ended June 30, 2017Notes to the Unconsolidated Condensed Interim Financial Information (Un-audited)
June 30, December 31,
2017 2016
14. CONTINGENCIES AND COMMITMENTS
14.1 Direct credit substitutes
Contingent liabilities in respect of guarantees given favouring
- Government 44,661,563
28,098,810
- Banks and financial institutions 5,629,939
3,848,002
- Others 2,541,829
2,010,891
52,833,331
33,957,703
14.2 Transaction-related contingent liabilities
Guarantees in favour of:
- Government 23,952,951
15,482,837
- Banks and financial institutions 35,065
60,034
- Others 11,637,882
12,512,412
- Suppliers credit / payee guarantee 1,993,023
1,930,979
37,618,921
29,986,262
14.3 Trade-related contingent liabilities 135,186,262
129,124,790
14.4 Other contingencies
Claims against the Bank not acknowledged as debts 5,583,495 7,345,639
14.5 Commitments to extend credit
June 30, December 31,
2017 2016
14.6 Commitments in respect of forward foreign exchange contracts
Purchase 82,091,788 49,411,339
Sale 84,830,879 49,341,990
14.7 Commitments for the acquisition of fixed assets 414,738 503,809
14.8 Other commitments
FX options (notional amount)
Purchase 1,007,469 1,034,994
Sale 1,007,569 1,034,994
Cross Currency Swaps (Notional) 2,388,164 1,350,386
Forward repurchase agreement borrowings - 1,000,000
Forward call borrowings - 400,000
Outright purchase of Government Securities - 200,850
The Bank makes commitments to extendcredit in the normal course of its business but these being revocablecommitments do not
attract any significant penalty or expense if the facility is unilaterally withdrawn.
---------- (Rupees in '000) ----------
---------- (Rupees in '000) ----------
These represent certain claims by third parties against the Bank, which are being contested in the Courts of law. The management is
of the view that these relate to the normal course of business and the possibilityof an outflow of economic resources is remote and
accordingly no provision has been made in this unconsolidated condensed interim financial information.
14.9 Taxation
For assessment year 1988-89 through tax year 2015, the tax department disputed Bank's treatment on certain issues, where the Bank's
appeals are pending at various appellate forums, entailing an additional tax liability of Rs. 5,361 million (2016: Rs. 2,873 million) which has been
paid. Such issues inter alia principally include disallowance of expenses for non deduction of withholding tax and non availability of underlying
records, provision for non performing loans, attribution of expenses to heads of income other than income from business and disallowance of
credit for taxes paid in advance / deducted at source.
The Bank has filed appeals which are pending at various appellate forums. In addition, certain decisions made in favour of the Bank are being
contested by the department at higher forums. No provision has been made in the financial statements regarding the aforesaid additional tax
demand and already issued favourable decisions where the department is in appeal, as the management is of the view that the issues will be
decided in the Bank's favour as and when these are taken up by the Appellate Authorities.
June 30, June 30,
2017 2016
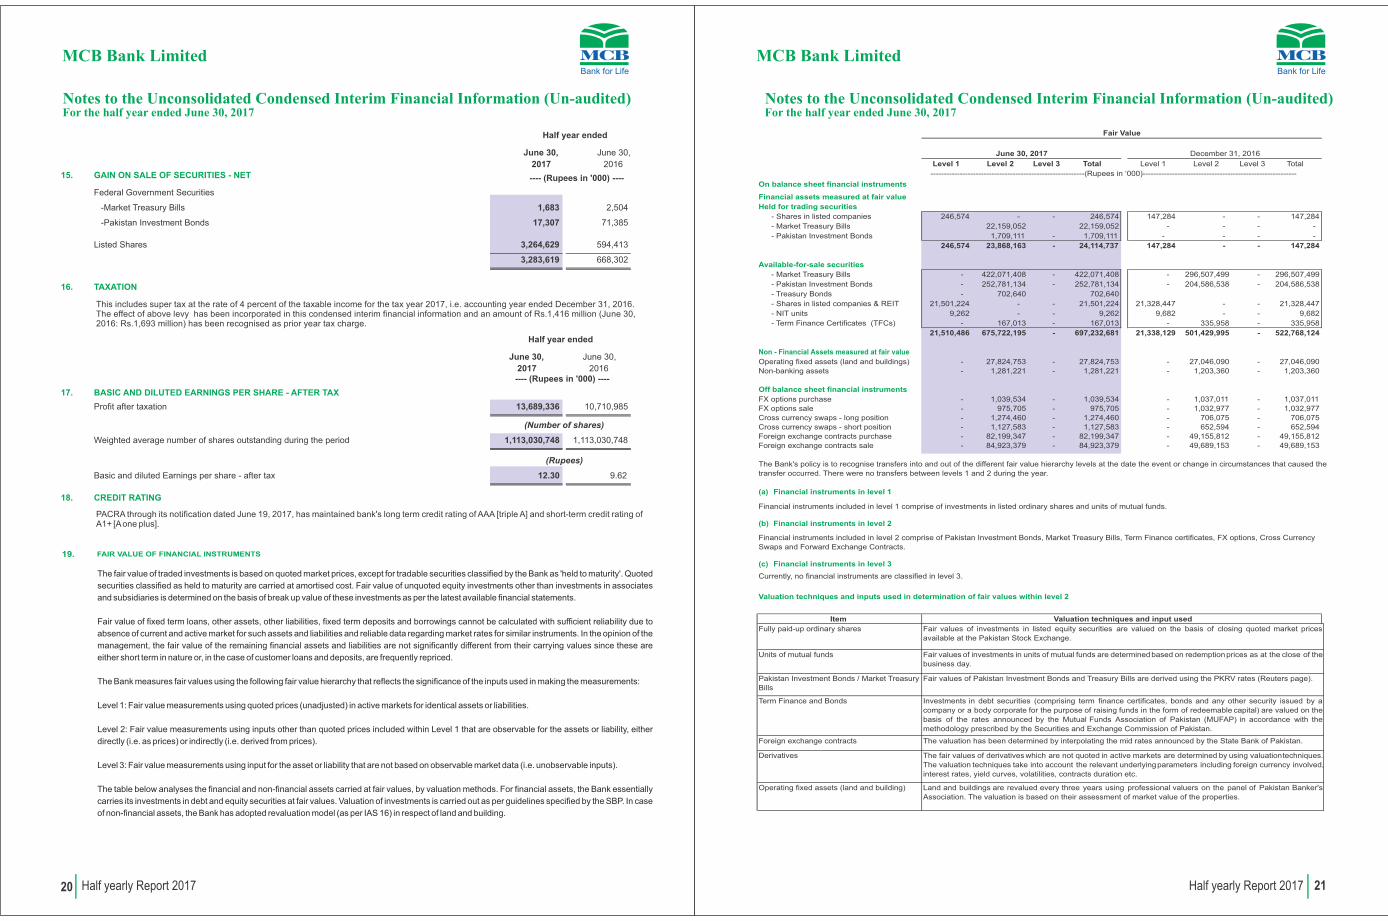
15. GAIN ON SALE OF SECURITIES - NET
Federal Government Securities
-Market Treasury Bills 1,683 2,504
-Pakistan Investment Bonds 17,307 71,385
Listed Shares 3,264,629 594,413
3,283,619 668,302
16. TAXATION
June 30, June 30,
2017 2016
17. BASIC AND DILUTED EARNINGS PER SHARE - AFTER TAX
Profit after taxation 10,710,98513,689,336
(Number of shares)
Weighted average number of shares outstanding during the period 1,113,030,748 1,113,030,748
(Rupees)
Basic and diluted Earnings per share - after tax 9.6212.30
18. CREDIT RATING
---- (Rupees in '000) ----
Half year ended
---- (Rupees in '000) ----
Half year ended
19. FAIR VALUE OF FINANCIAL INSTRUMENTS
The fair value of traded investments is based on quoted market prices, except for tradable securities classified by the Bank as 'held to maturity'. Quoted
securities classified as held to maturity are carried at amortised cost. Fair value of unquoted equity investments other than investments in associates
and subsidiaries is determined on the basis of break up value of these investments as per the latest available financial statements.
Fair value of fixed term loans, other assets, other liabilities, fixed term deposits and borrowings cannot be calculated with sufficient reliability due to
absence of current and active market for such assets and liabilities and reliable data regarding market rates for similar instruments. In the opinion of the
management, the fair value of the remaining financial assets and liabilities are not significantly different from their carrying values since these are
either short term in nature or, in the case of customer loans and deposits, are frequently repriced.
The Bank measures fair values using the following fair value hierarchy that reflects the significance of the inputs used in making the measurements:
Level 1: Fair value measurements using quoted prices (unadjusted) in active markets for identical assets or liabilities.
Level 2: Fair value measurements using inputs other than quoted prices included within Level 1 that are observable for the assets or liability, either
directly (i.e. as prices) or indirectly (i.e. derived from prices).
Level 3: Fair value measurements using input for the asset or liability that are not based on observable market data (i.e. unobservable inputs).
The table below analyses the financial and non-financial assets carried at fair values, by valuation methods. For financial assets, the Bank essentially
carries its investments in debt and equity securities at fair values. Valuation of investments is carried out as per guidelines specified by the SBP. In case
of non-financial assets, the Bank has adopted revaluation model (as per IAS 16) in respect of land and building.
MCB Bank Limited
20 Half yearly Report 2017
Bank for Life
For the half year ended June 30, 2017Notes to the Unconsolidated Condensed Interim Financial Information (Un-audited)
Operating fixed assets (land and building) Land and buildings are revalued every three years using professional valuers on the panel of Pakistan Banker's
Association. The valuation is based on their assessment of market value of the properties.
Fully paid-up ordinary shares Fair values of investments in listed equity securities are valued on the basis of closing quoted market prices
available at the Pakistan Stock Exchange.
Item Valuation techniques and input used
Foreign exchange contracts The valuation has been determined by interpolating the mid rates announced by the State Bank of Pakistan.
Units of mutual funds Fair values of investments in units of mutual funds are determinedbased on redemptionprices as at the close of the
business day.
Pakistan Investment Bonds / Market Treasury
Bills
Fair values of Pakistan Investment Bonds and Treasury Bills are derived using the PKRV rates (Reuters page).
Term Finance and Bonds Investments in debt securities (comprising term finance certificates, bonds and any other security issued by a
company or a body corporate for the purpose of raising funds in the form of redeemable capital) are valued on the
basis of the rates announced by the Mutual Funds Association of Pakistan (MUFAP) in accordance with the
methodology prescribed by the Securities and Exchange Commission of Pakistan.
Derivatives The fair values of derivatives which are not quoted in active markets are determined by using valuationtechniques.
The valuation techniques take into account the relevant underlyingparameters including foreign currency involved,
interest rates, yield curves, volatilities, contracts duration etc.
Level 1 Level 2 Level 3 Total Level 1 Level 2 Level 3 Total
On balance sheet financial instruments
Financial assets measured at fair value
Held for trading securities
- Shares in listed companies 246,574 - - 246,574 147,284 - - 147,284
- Market Treasury Bills 22,159,052 22,159,052 - - - -
- Pakistan Investment Bonds 1,709,111 - 1,709,111 -
- - -
246,574 23,868,163 - 24,114,737 147,284 - - 147,284
Available-for-sale securities
- Market Treasury Bills - 422,071,408 - 422,071,408 - 296,507,499 - 296,507,499
- Pakistan Investment Bonds - 252,781,134 - 252,781,134 - 204,586,538 - 204,586,538
- Treasury Bonds - 702,640 702,640
- Shares in listed companies & REIT 21,501,224 - - 21,501,224 21,328,447 - - 21,328,447
- NIT units 9,262 - - 9,262 9,682 - - 9,682
- Term Finance Certificates (TFCs) - 167,013 - 167,013 - 335,958 - 335,958
21,510,486 675,722,195 - 697,232,681 21,338,129 501,429,995 - 522,768,124
Non - Financial Assets measured at fair value
Operating fixed assets (land and buildings) - 27,824,753 - 27,824,753 - 27,046,090 - 27,046,090
Non-banking assets - 1,281,221 - 1,281,221 - 1,203,360 - 1,203,360
Off balance sheet financial instruments
FX options purchase - 1,039,534 - 1,039,534 - 1,037,011 - 1,037,011
FX options sale - 975,705 - 975,705 - 1,032,977 - 1,032,977
Cross currency swaps - long position - 1,274,460 - 1,274,460 - 706,075 - 706,075
Cross currency swaps - short position - 1,127,583 - 1,127,583 - 652,594 - 652,594
Foreign exchange contracts purchase - 82,199,347 - 82,199,347 - 49,155,812 - 49,155,812
Foreign exchange contracts sale - 84,923,379 - 84,923,379 - 49,689,153 - 49,689,153
(a) Financial instruments in level 1
(b) Financial instruments in level 2
(c) Financial instruments in level 3
Valuation techniques and inputs used in determination of fair values within level 2
----------------------------------------------------------(Rupees in ‘000)----------------------------------------------------------
The Bank's policy is to recognise transfers into and out of the different fair value hierarchy levels at the date the event or change in circumstances that caused the
transfer occurred. There were no transfers between levels 1 and 2 during the year.
Fair Value
June 30, 2017 December 31, 2016
Financial instruments included in level 1 comprise of investments in listed ordinary shares and units of mutual funds.
Financial instruments included in level 2 comprise of Pakistan Investment Bonds, Market Treasury Bills, Term Finance certificates, FX options, Cross Currency
Swaps and Forward Exchange Contracts.
Currently, no financial instruments are classified in level 3.
MCB Bank Limited
21Half yearly Report 2017
Bank for Life
For the half year ended June 30, 2017Notes to the Unconsolidated Condensed Interim Financial Information (Un-audited)
This includes super tax at the rate of 4 percent of the taxable income for the tax year 2017, i.e. accounting year ended December 31, 2016. The effect of above levy has been incorporated in this condensed interim financial information and an amount of Rs.1,416 million (June 30, 2016: Rs.1,693 million) has been recognised as prior year tax charge.
PACRA through its notification dated June 19, 2017, has maintained bank's long term credit rating of AAA [triple A] and short-term credit rating of A1+ [A one plus].

2,5
42
,06
71
,71
9,0
08
2,5
68
,58
42
,85
9,6
00
38
,86
81
2,8
36
5,8
52
,00
86
,64
9,3
13
10
5,7
61
13
9,1
06
1,2
04
,46
24
,10
9,8
08
19
,89
4,5
64
23
,76
4,3
90
5,2
93
,00
11
,93
1,9
75
31
,20
0,3
57
59
,46
4,8
82
45
7,4
89
50
1,7
50
(1,3
24
,71
8)
(3,2
86
,74
9)
(19
,72
6,7
31
)(2
4,0
55
,40
6)
(5,2
90
,40
9)
(1,9
05
,94
3)
(33
,25
0,7
22
)(6
0,2
62
,18
7)
(40
4,9
65
)(5
35
,09
5)
2,4
21
,811
2,5
42
,06
72
,73
6,4
17
2,5
68
,58
44
1,4
60
38
,86
83
,80
1,6
43
5,8
52
,00
81
58
,28
51
05
,76
1
19
58
86
--
27
6,3
49
27
6,7
26
26
2,1
13
-8
4,7
87
68
,52
0
--
--
--
1,4
29
,17
52
,39
8,3
24
16
,56
73
3,5
19
(19
5)
(69
1)
--
67
5(3
77
)(8
87
,08
5)
(2,1
36
,211
)(7
,58
5)
(17
,25
2)
-1
95
--
27
7,0
24
27
6,3
49
80
4,2
03
26
2,1
13
93
,76
98
4,7
87
--
--
-2
11,8
20
--
--
--
--
15
,66
7,2
06
1,9
22
,77
9-
--
-
--
--
(13
,30
6,5
52
)(2
,13
4,5
99
)-
--
-
--
--
2,3
60
,65
4-
--
--
1,6
17
73
1-
--
-7
37
22
52
,32
52
,53
7
--
--
--
7,3
19
,37
67
,77
3,4
82
--
--
9,7
64
10
,36
1-
-1
35
,16
93
73
,85
6-
-
--
--
15
6,4
95
-2
,75
9,6
70
3,2
41
,05
4-
-
--
--
15
2-
(35
0)
17
,28
6-
-
--
--
--
52
4,2
70
93
6,7
88
--
--
--
30
,07
41
,68
3-
--
-
--
74
,32
53
0,6
01
--
--
--
8,4
42
7,2
66
7,1
78
7,9
85
48
76
12
,26
11
9,9
68
56
54
49
1,7
84
4,2
26
81
27
88
21
,69
01
5,5
01
4,3
71
68
,29
5-
-
--
50
42
,99
9-
-2
7,9
29
51
,49
2-
-
--
--
7,6
89
2,6
29
3,2
41
3,1
63
1,4
40
1,1
52
--
-8
10
10
,19
07
,35
48
10
--
-
--
10
4,1
04
114
,55
71
6,2
70
32
,05
2-
1-
-
--
--
20
,00
02
0,0
00
--
--
Dir
ec
tors
Ye
ar
en
de
d
De
c 3
1,
20
16
Ye
ar
en
de
d
De
c 3
1,
20
16
Ye
ar
en
de
d
De
c 3
1,
20
16
----
----
----
----
----
----
----
----
----
----
----
----
----
----
-- (
Ru
pe
es
in '0
00
) -
----
----
----
----
----
----
----
----
----
----
----
----
----
----
----
-
Oth
er
Re
late
d P
art
ies
Ke
y M
an
ag
em
en
t S
ub
sid
iary
Co
mp
an
ies
Ha
lf y
ea
r
en
de
d J
un
e
30
, 2
01
7
Ha
lf y
ea
r
en
de
d J
un
e
30
, 2
01
7
Ha
lf y
ea
r
en
de
d J
un
e
30
, 2
01
7
Ha
lf y
ea
r
en
de
d J
un
e
30
, 2
01
7
Ye
ar
en
de
d
De
c 3
1,
20
16
Ha
lf y
ea
r
en
de
d J
un
e
30
, 2
01
7
Ye
ar
en
de
d
De
c 3
1,
20
16
As
so
cia
tes
21
RE
LA
TE
D P
AR
TY
TR
AN
SA
CT
ION
S A
ND
BA
LA
NC
ES
A.
Ba
lan
ce
s
De
po
sit
s
Op
en
ing
ba
lan
ce
Re
ceiv
ed
du
rin
g t
he
pe
rio
d /
ye
ar
With
dra
wn
du
rin
g t
he
pe
rio
d /
ye
ar
Clo
sin
g b
ala
nce
Ad
va
nc
es
Op
en
ing
ba
lan
ce
Ad
diti
on
s /
ad
just
me
nts
du
rin
g t
he
pe
rio
d /
ye
ar
Re
pa
id /
ad
just
me
nts
du
rin
g t
he
pe
rio
d /
ye
ar
Clo
sin
g b
ala
nce
Le
nd
ing
s t
o F
ina
nc
ial
Ins
titu
tio
ns
Op
en
ing
ba
lan
ce
Ad
diti
on
s /
ad
just
me
nts
du
rin
g t
he
pe
rio
d /
ye
ar
Re
pa
id /
ad
just
me
nts
du
rin
g t
he
pe
rio
d /
ye
ar
Clo
sin
g b
ala
nce
Oth
er
Ba
lan
ce
s
Ou
tsta
nd
ing
ba
lan
ce o
f cr
ed
it ca
rds
Re
ceiv
ab
le f
rom
Pe
nsi
on
Fu
nd
Co
mm
itme
nts
an
d c
on
ting
en
t lia
bili
ties
- o
uts
tan
din
g
Fo
rwa
rd f
ore
ign
exc
ha
ng
e c
on
tra
cts
(No
tion
al) -
ou
tsta
nd
ing
Un
rea
lize
d g
ain
/ (
loss
) o
n f
orw
ard
fo
reig
n e
xch
an
ge
co
ntr
act
s -
ou
tsta
nd
ing
Bo
rro
win
gs
ou
tsta
nd
ing
Ove
rdra
wn
no
stro
ba
lan
ce
Tra
de
pa
yab
le
Ma
rku
p p
aya
ble
Oth
er
pa
yab
le
Oth
er
ad
van
ces
Ma
rku
p r
ece
iva
ble
Oth
er
rece
iva
ble
Co
mm
issi
on
re
ceiv
ab
le
Ad
van
ce r
ece
ive
d a
ga
inst
sa
le o
f p
rop
ert
y
Th
e B
an
k e
nte
rs in
to t
ran
sact
ion
s w
ith r
ela
ted
pa
rtie
s in
th
e n
orm
al c
ou
rse
of
bu
sin
ess
. C
on
trib
utio
ns
to a
nd
acc
rua
ls in
re
spe
ct o
f st
aff r
etir
em
en
t b
en
efit
s a
nd
oth
er
be
ne
fit p
lan
s a
re m
ad
e in
acc
ord
an
ce w
ith t
he
act
ua
ria
l va
lua
tion
s /
term
s o
f th
e c
on
trib
utio
n p
lan
. R
em
un
era
tion
to
th
e e
xecu
tive
s /
offic
ers
is d
ete
rmin
ed
in a
cco
rda
nce
with
th
e t
erm
s o
f th
eir a
pp
oin
tme
nt.
De
tails
of
tra
nsa
ctio
ns
with
re
late
d p
art
ies
an
d b
ala
nce
s w
ith t
he
m a
s a
t th
e p
erio
d-e
nd
we
re a
s fo
llow
s:
----
----
----
----
----
----
----
----
----
----
----
----
----
----
-- (
Ru
pe
es
in '0
00
) -
----
----
----
----
----
----
----
----
----
----
----
----
----
----
----
-
Th
e B
an
k h
as
rela
ted
pa
rty
rela
tion
ship
with
its
ass
oci
ate
s, s
ub
sid
iarie
s, c
om
pa
nie
s w
ith c
om
mo
n d
ire
cto
rsh
ip,
em
plo
yee
be
ne
fit p
lan
s a
nd
its
dire
cto
rs a
nd
ke
y m
an
ag
em
en
t p
ers
on
ne
l an
d t
he
ir c
lose
fa
mily
me
mb
ers
. In
vest
me
nts
in
sub
sid
iary
co
mp
an
ies
an
d a
sso
cia
tes
are
giv
en
in n
ote
8 o
f th
is u
nco
nso
lida
ted
co
nd
en
sed
inte
rim
fin
an
cia
l in
form
atio
n f
or
the
ha
lf ye
ar
en
de
d J
un
e 3
0,
20
17
.
MCB Bank Limited
22
MCB Bank Limited
23Half yearly Report 2017Half yearly Report 2017
For the half year ended June 30, 2017Notes to the Unconsolidated Condensed Interim Financial Information (Un-audited)
Bank for Life Bank for Life
For the half year ended June 30, 2017Notes to the Unconsolidated Condensed Interim Financial Information (Un-audited)
20 SEGMENT DETAILS WITH RESPECT TO BUSINESS ACTIVITIES
The segment analysis with respect to business activity is as follows:
Total income
Total expenses
Income tax expense
Net income
Segment assets - (Gross of NPLs Provisions) 787,312
92,809
122,985
(30,176)
-
854,129,047
8,071,086
9,571,689
(1,500,603)
-
959,600,994
6,936,341
17,046,340
(10,109,999)
-
316,177,259
2,625,345
2,987,503
(362,158)
-
(803,711,282)
-
-
-
-
1,326,983,330
13,689,336
29,728,517
(12,002,936)
(4,036,245)
Advance taxation (payment less provision) - - -
-
-
10,750,628
Total assets 787,312 854,129,047 959,600,994
316,177,259
(803,711,282)
1,337,733,958
Segment non performing loans - - 6,573,007
15,904,787
-
22,477,794
Segment specific provision required - - 6,552,721
10,171,410
-
16,724,131
Segment liabilities 107,748 781,583,134 902,286,338
286,915,150
(803,711,282)
1,167,181,088
Deferred tax liabilities - net - - -
-
-
10,037,973
Total liabilities - net 107,748 781,583,134 902,286,338
286,915,150
(803,711,282)
1,177,219,061
Segment return on assets (ROA) (%)
Segment cost of fund (%)
Half year ended June 30, 2017
Inter segment
elimination Total
---------------------------------------------(Rupees in '000)-----------------------------------------
Corporate
Finance
Trading
and
Sales
Retail &
Consumer
Banking
Commercial
Banking
Total income 102,441 10,906,750 15,140,988 3,304,453 - 29,454,632
Total expenses (24,753) (654,350) (8,450,018) (1,421,833) - (10,550,954)
Income tax expense - - - - - (8,192,693)
Net income 77,688 10,252,400 6,690,970 1,882,620 - 10,710,985
Segment assets - (Gross of NPLs provision) 579,827 705,479,528 819,644,566 273,710,641 (698,264,202) 1,101,150,360
Advance taxation (payment less provision) - - - - - 2,270,040
Total assets 579,827 705,479,528 819,644,566 273,710,641 (698,264,202) 1,103,420,400
Segment non performing loans - - 7,005,086 13,551,476 - 20,556,562
Segment specific provision required - - 6,984,122 10,059,706 - 17,043,828
Segment liabilities 62,279 613,322,215 766,905,273 250,928,020 (698,264,202) 932,953,585
Deferred tax liabilities - net - - - - - 12,146,234
Total liabilities - net 62,279 613,322,215 766,905,273 250,928,020 (698,264,202) 945,099,819
Segment return on assets (ROA) (%) 35.34% 3.09% 3.73% 2.51% - -
Segment cost of fund (%) - 6.09% 3.35% 5.37% - -
Total income = Net markup income + non-markup income
Total expenses = Non Mark up expenses + Provisions
Segment assets and liabilities include inter segment balances.
Transactions between reportable segments are based on an appropriate transfer pricing mechanism using agreed rates.
Segment cost of funds have been computed based on the average balances.
---------------------------------------------(Rupees in '000)-----------------------------------------
Half year ended June 30, 2016
31.24%
-
2.24%
5.66%
3.58%
3.26%
1.95%
5.51%
-
-
-
-

For the half year ended June 30, 2017Notes to the Unconsolidated Condensed Interim Financial Information (Un-audited)
MCB Bank Limited
24 Half yearly Report 2017
Bank for Life
MCB Bank Limited
25Half yearly Report 2017
22 GENERAL
- Figures have been rounded off to the nearest thousand of rupees unless otherwise stated.
-
23 NON-ADJUSTING EVENT
24 DATE OF AUTHORIZATION FOR ISSUE
No significant reclassifications have been made in this unconsolidated condensed interim financial information.
The Board of Directors in its meeting held on August 25, 2017 has announced cash dividend in respect of the half year
ended June 30, 2017 of Rs. 4.00 per share (June 30, 2016: Rs. 4.00 per share). This unconsolidated condensed interim
financial information for the half year ended June 30, 2017 does not include the effect of this appropriationwhich will be
accounted for subsequent to the period end.
This unconsolidatedcondensed interim financial informationwas authorized for issue by the Board of Directors of the Bank
in their meeting held on August 25, 2017.
B.
Tra
ns
ac
tio
ns
du
rin
g t
he
pe
rio
d
Re
ceiv
ed
ag
ain
st s
che
me
of
de
me
rge
r
Re
ceiv
ed
ag
ain
st s
taff f
ina
nce
s
Insu
ran
ce p
rem
ium
-ne
t o
f re
fun
d
Insu
ran
ce c
laim
se
ttle
d
Ma
rku
p in
com
e o
n a
dva
nce
s a
nd
len
din
gs
Fo
rwa
rd e
xch
an
ge
co
ntr
act
s m
atu
red
du
rin
g t
he
pe
rio
d
Ga
in /
(lo
ss)
on
fo
rwa
rd f
ore
ign
exc
ha
ng
e c
on
tra
cts
ma
ture
d d
urin
g
Jun
e 3
0,
20
16
--
--
-5
,90
1,9
88
-
-
-
-
--
--
-11
1,8
79
--
--
--
35
1,0
23
29
6,7
89
--
--
--
--
7,4
74
4,9
66
--
--
--
21
8-
-4
1,7
42
10
,49
89
,03
71
,011
3,7
89
2,5
39
--
--
--
24
,61
8,8
14
31
,75
8,2
00
--
--
--
--
10
1,0
38
16
32
0
54
,49
7-
-
Div
ide
nd
inco
me
--
--
-
Co
mm
issi
on
inco
me
Re
nt
inco
me
an
d r
eim
bu
rse
me
nt
of
oth
er
exp
en
ses
Ou
tso
urc
ing
se
rvic
e e
xpe
nse
s
Sa
le o
f fo
reig
n c
urr
en
cy
Pu
rch
ase
of
fore
ign
cu
rre
ncy
Pro
cee
ds
fro
m s
ale
of
fixe
d a
sse
ts
Ga
in /
(lo
ss)
on
sa
le o
f fix
ed
ass
ets
Ca
sh s
ort
ing
exp
en
ses
Sta
tion
ery
exp
en
ses
Se
curity
gu
ard
s e
xpe
nse
s
Re
mu
ne
ratio
n a
nd
no
n-e
xecu
tive
dire
cto
rs f
ee
Ma
rk-u
p e
xpe
nse
Cle
arin
g e
xpe
nse
s p
aid
to
NIF
T
Co
ntr
ibu
tion
to
pro
vid
en
t fu
nd
Re
nt
an
d o
the
r e
xpe
nse
s
Ca
ll b
orr
ow
ing
de
als
en
tere
d a
nd
ma
ture
d d
urin
g t
he
pe
rio
d
Sa
le o
f g
ove
rnm
en
t se
curitie
s
Pu
rch
ase
of
go
vern
me
nt
secu
ritie
s
Ga
in /
(lo
ss)
on
sa
le o
f g
ove
rnm
en
t se
curitie
s
Mis
cella
ne
ou
s e
xpe
nse
s a
nd
pa
yme
nts
The c
hairm
an h
as
been p
rovi
ded w
ith fre
e u
se o
f th
e B
ank
main
tain
ed c
ar.
The C
hie
f E
xecu
tive a
nd c
ert
ain
exe
cutiv
es
are
pro
vided w
ith fre
e u
se o
f th
e B
ank'
s m
ain
tain
ed c
ars
and h
ouse
hold
equip
ment in
acc
ord
ance
with
the t
erm
s of
the
ir e
mp
loym
en
t.
18
9,7
55
14
1,6
58
55
,43
55
5,4
35
--
50
5,5
09
39
6,5
23
77
,94
55
8,4
02
3,7
90
4,5
91
-
-
--
1,6
71
1,9
74
5,7
91
5,4
44
1,6
20
2,1
60
-
-
--
73
,92
56
3,9
13
--
-
-
-
-
--
--
4,7
01
,54
81
,70
5,6
80
--
--
--
--
1,7
67
,53
61
34
,28
3-
--
-
--
--
--
--
31
9
--
--
--
--
31
9
--
--
--
25
,19
22
6,8
71
--
--
--
--
87
,75
68
7,4
68
--
--
--
--
19
4,7
111
95
,26
5-
-
81
,14
07
7,5
91
--
--
--
28
0,1
73
26
7,5
22
48
,23
13
9,2
68
34
,96
92
5,8
33
30
31
85
77
,66
91
28
,21
39
09
58
9
--
--
--
62
,31
86
6,2
96
--
--
--
--
13
5,4
32
12
2,8
48
--
--
90
73
,46
43
,92
75
,35
52
6,7
74
511
--
--
--
--
1,2
00
,00
01
,07
5,0
00
--
--
4,4
08
,58
61
,75
6,7
81
--
6,8
12
,18
83
,78
5,3
57
--
--
3,4
13
,02
64
,15
8,3
89
--
5,7
65
,74
86
,83
8,9
28
--
--
26
(44
)-
-11
42
,50
1-
-
--
--
--
18
,12
92
3,1
91
--
Oth
er
Re
late
d P
art
ies
Ke
y M
an
ag
em
en
tD
ire
cto
rs
Jun
e 3
0,
20
16
Ju
ne
30
,
20
17
Jun
e 3
0,
20
16
Ju
ne
30
,
20
17
Ju
ne
30
,
20
17
Jun
e 3
0,
20
16
As
so
cia
tes
S
ub
sid
iary
Co
mp
an
ies
Ju
ne
30
,
20
17
Jun
e 3
0,
20
16
Ju
ne
30
,
20
17
----
----
----
----
----
----
----
----
----
----
----
----
----
----
-- (
Rupees
in '0
00)
---
----
----
----
----
----
----
----
----
----
----
----
----
----
----
---
----
----
----
----
----
----
----
----
----
----
----
----
----
----
-- (
Ru
pe
es
in '0
00
) -
----
----
----
----
----
----
----
----
----
----
----
----
----
----
----
-
the
pe
rio
d
Bank for Life
Samir Iqbal Saigol
President / CEO Imran Maqbool
Director Nor Hizam Bin Hashim
Director Muhammad Ali Zeb
For the half year ended June 30, 2017Notes to the Unconsolidated Condensed Interim Financial Information (Un-audited)
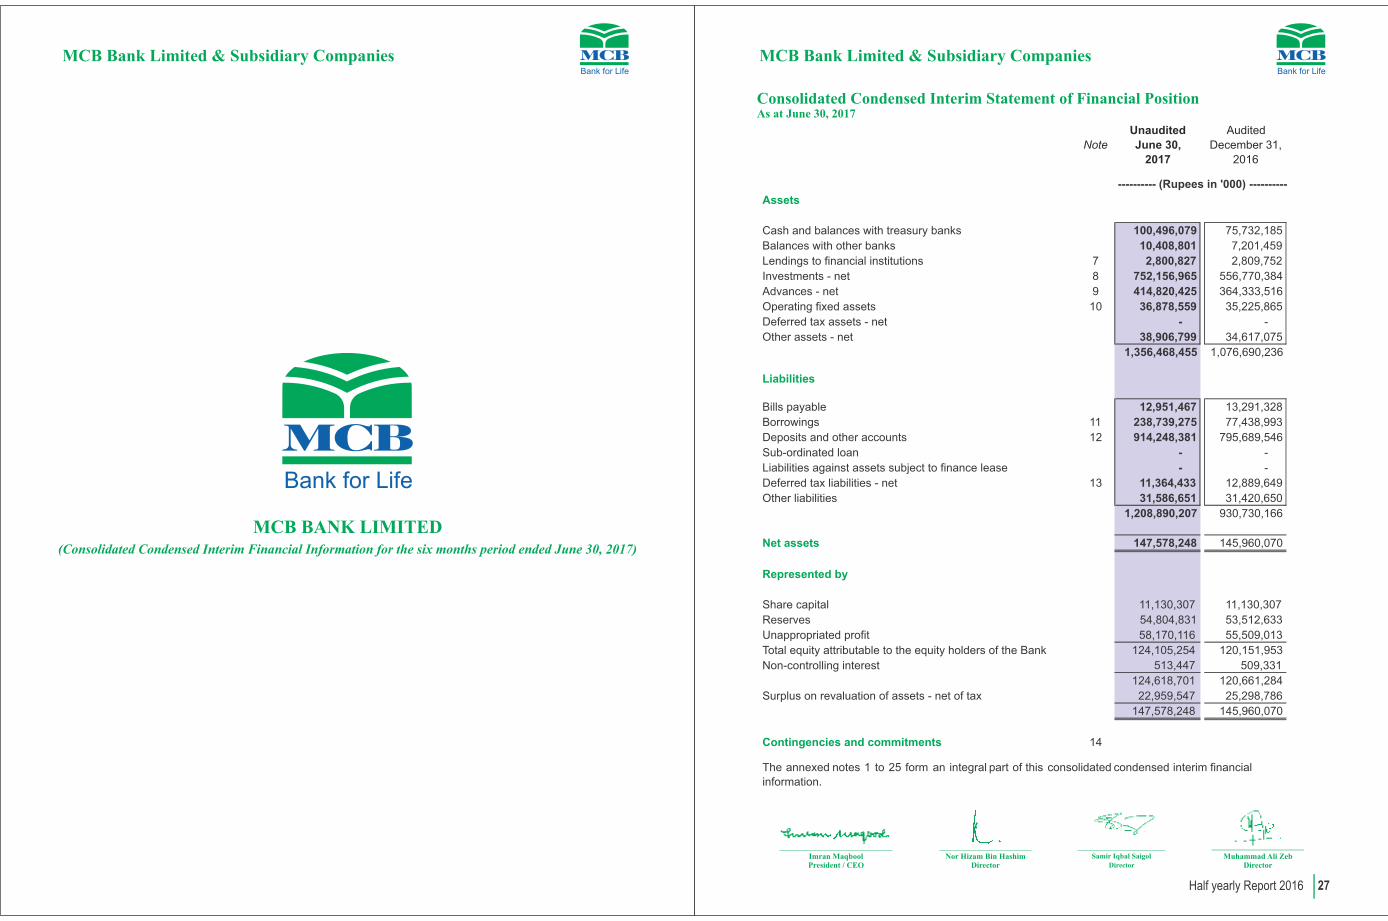
MCB Bank Limited & Subsidiary Companies MCB Bank Limited & Subsidiary Companies
27Half yearly Report 2016
As at June 30, 2017Consolidated Condensed Interim Statement of Financial Position
Unaudited Audited
Note June 30, December 31,
2017 2016
Bank for Life
(Consolidated Condensed Interim Financial Information for the six months period ended June 30, 2017)
Assets
Cash and balances with treasury banks 100,496,079 75,732,185
Balances with other banks 10,408,801 7,201,459
Lendings to financial institutions 7 2,800,827
2,809,752
Investments - net 8 752,156,965
556,770,384
Advances - net 9 414,820,425
364,333,516
Operating fixed assets 10 36,878,559
35,225,865
Deferred tax assets - net -
-
Other assets - net 38,906,799
34,617,075
1,356,468,455
1,076,690,236
Liabilities
Bills payable 12,951,467
13,291,328
Borrowings 11 238,739,275
77,438,993
Deposits and other accounts 12 914,248,381
795,689,546
Sub-ordinated loan -
-
Liabilities against assets subject to finance lease - -
Deferred tax liabilities - net 13 11,364,433 12,889,649 Other liabilities 31,586,651 31,420,650
1,208,890,207
930,730,166
Net assets 147,578,248
145,960,070
Represented by
Share capital 11,130,307
Reserves 53,512,633
Unappropriated profit 55,509,013
Total equity attributable to the equity holders of the Bank 120,151,953
Non-controlling interest 509,331
120,661,284
Surplus on revaluation of assets - net of tax 25,298,786
145,960,070
Contingencies and commitments 14
---------- (Rupees in '000) ----------
The annexed notes 1 to 25 form an integral part of this consolidated condensed interim financial
information.
11,130,307
54,804,831
58,170,116
124,105,254
513,447
124,618,701
22,959,547
147,578,248
Bank for Life
Bank for Life
Samir Iqbal Saigol
President / CEO Imran Maqbool
Director Nor Hizam Bin Hashim
Director Muhammad Ali Zeb
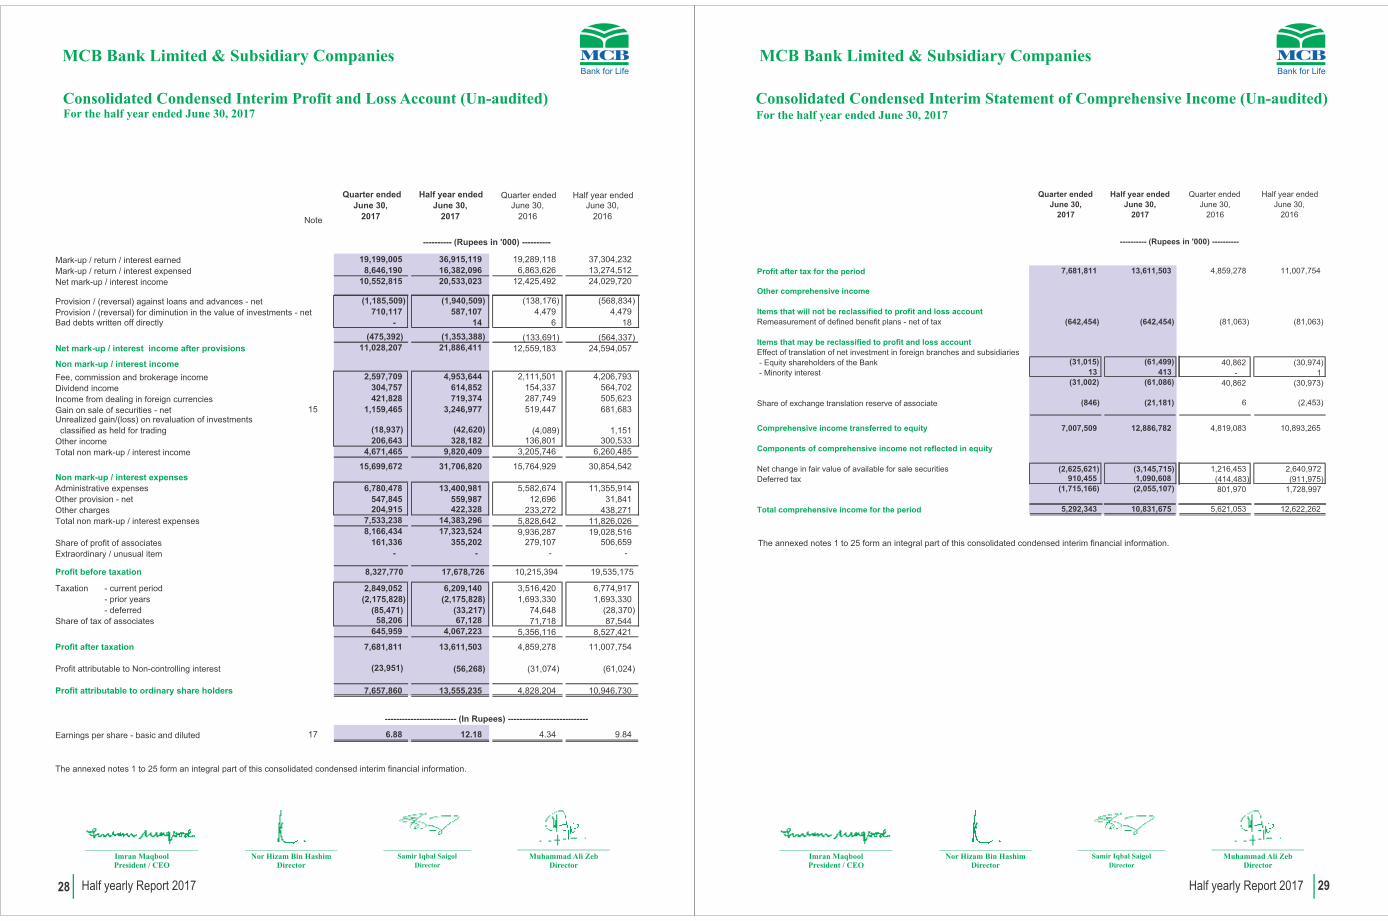
MCB Bank Limited & Subsidiary CompaniesMCB Bank Limited & Subsidiary Companies
28 29Half yearly Report 2017Half yearly Report 2017
Consolidated Condensed Interim Statement of Comprehensive Income (Un-audited) For the half year ended June 30, 2017
Bank for LifeBank for Life
Consolidated Condensed Interim Profit and Loss Account (Un-audited)For the half year ended June 30, 2017
Samir Iqbal Saigol
President / CEO Imran Maqbool
Director Nor Hizam Bin Hashim
Director Muhammad Ali Zeb
Samir Iqbal Saigol
President / CEO Imran Maqbool
Director Nor Hizam Bin Hashim
Director Muhammad Ali Zeb

Cash flows from operating activities
Profit before taxation
Less: Dividend income and share of profit of associates
Adjustments for:
Depreciation
Amortization
Bad debts written off directly
Provision / (reversal) against loans and advances - net
Provision / (reversal) for diminution in the value of investments - net
Other provision - net
Provision for Workers' Welfare Fund
Charge / (reversal) for defined benefit plans
Gain on sale of shares in associate
Gain on disposal of fixed assets - net
(Increase) / decrease in operating assets
Lendings to financial institutions
Net investment in held for trading securities
Advances - net
Other assets - net
Increase / (decrease) in operating liabilities
Bills payable
Borrowings
Deposits and other accounts
Other liabilities
Defined benefits paid
Income tax paid
Net cash flows from operating activities
Cash flows from investing activities
Net investments in available-for-sale securities
Net investments in held-to-maturity securities
Dividend income received
Proceeds from divestment in associate
Sale proceeds of property and equipment disposed off
Investment in operating fixed assets
Net cash flows from investing activities
Cash flows from financing activities
Dividend paid
Net cash flows from financing activities
Exchange difference on translation of net investment in foreign branches & subsidiairies
Increase in cash and cash equivalents
Cash and cash equivalents at January 1
Cash and cash equivalents at June 30
The annexed notes 1 to 25 form an integral part of this consolidated condensed interim financial information.
Unrealized loss on revaluation of investments classified as held for trading
June 30, June 30,2017 2016
19,535,175
(1,071,361)
18,463,814
839,305 819,662
139,372
200,592
14
18
(1,940,509)
(568,834)
587,107
4,479
559,987
31,841
354,512
378,074
(53,968)
(94,245)
42,620
(1,151)
(286,706)
(29,567)
(9,050)
(69,360)
232,684
671,509
16,941,356
19,135,323
8,925
1,554,153
(24,088,623)
(239,598)
(48,546,414)
(41,300,510)
(788,961)
(4,700,964)
(73,415,073)
(44,686,919)
(339,861) (152,130)
161,021,334 24,720,583
118,558,835
61,955,200
(703,050)
(2,113,870)
278,537,258
84,409,783
222,063,541
58,858,187
(156,663)
(190,507)
(8,471,388)
(7,862,161)
213,435,490
50,805,519
(180,074,330)
(24,949,869)
4,171,394
(5,328,749)
818,023
705,176
782,816
118,280
16,288
161,628
(2,630,381)
(1,515,957)
(176,916,190)
(30,809,491)
(8,765,926) (9,234,505)
(8,765,926) (9,234,505)
(30,973)
10,730,550
70,827,983
81,558,533
---------- (Rupees in '000) ----------
MCB Bank Limited & Subsidiary Companies MCB Bank Limited & Subsidiary Companies
30 31 Half yearly Report 2017Half yearly Report 2017
Consolidated Condensed Interim Statement of Changes in Equity (Un-audited)For the half year ended June 30, 2017
Bank for LifeBank for Life
Consolidated Condensed Interim Cash Flow Statement (Un-audited)For the half year ended June 30, 2017
Balance as at December 31, 2015
Change in equity for six months ended June 30, 2016
Total comprehensive income for the six months ended June 30, 2016
Profit after taxation for six months period
ended June 30, 2016
Remeasurement of defined benefit plans - net of tax
Exchange differences on translation of net
investment in foreign branches
Share of exchange translation reserve of associate
Transactions with owners recognized directly in equity
Final cash dividend at Rs. 4.0 per share - December 31, 2015
Interim cash dividend at Rs. 4.0 per share - March 31, 2016
Transferred from surplus on revaluation of fixed
assets to unappropriated profit - net of tax
Share of dividend attributable to Non-controlling interest
Transferred to statutory reserve
Balance as at June 30, 2016
Change in equity for six months ended December 31, 2016
Total comprehensive income for the six months ended December 31, 2016
Profit after taxation for six months period
ended December 31, 2016
Remeasurement of defined benefit plans - net of tax
Exchange differences on translation of net
investment in foreign branches
Share of exchange translation reserve of associate
Transactions with owners recognized directly in equity
Interim cash dividend at Rs. 4.0 per share - June 30, 2016
Interim cash dividend at Rs. 4.0 per share - September 30, 2016
Transferred from surplus on revaluation of fixed
assets to unappropriated profit - net of tax
Share of dividend attributable to Non-controlling interest
Transferred to statutory reserve
Balance as at December 31, 2016
Change in equity for six months ended June 30, 2017
Profit after taxation for six months period
ended June 30, 2017
Remeasurement of defined benefit plans - net of tax
Exchange differences on translation of net
investment in foreign branches & subsidiaries
Share of exchange translation reserve of associate
Transactions with owners recognized directly in equity
Final cash dividend at Rs. 4.0 per share - December 31, 2016
Interim cash dividend at Rs. 4.0 per share - March 31, 2017
Transferred from surplus on revaluation of fixed
assets to unappropriated profit - net of tax
Share of dividend attributable to Non-controlling interest
Transferred to statutory reserve
Balance as at June 30, 2017
The annexed notes 1 to 25 form an integral part of this consolidated condensed interim financial information.
11,130,307 9,924,438 269,360 22,697,586 18,600,000 52,631,368 115,253,059 512,076 115,765,135
Share
premium
Exchange Non
translation Controlling Total
reserve Interest
General
reserve Unappropriate
d profit
---------------------------------------------------------- (Rupees in'000) ----------------------------------------------------------
Share
capital
Capital Reserves
Statutory
reserve
Revenue Reserves
Sub Total
- - - - - 10,946,730 10,946,730 61,024 11,007,754
- - - - - (81,063) (81,063) - (81,063)
- - (30,974) - - - (30,974) 1 (30,973)
- - (2,453) - - - (2,453) - (2,453)
- - (33,427) - - 10,865,667 10,832,240 61,025 10,893,265
- - - - - (4,452,123) (4,452,123) - (4,452,123)
- - - - - (4,452,123) (4,452,123) - (4,452,123)
- - - - - (8,904,246) (8,904,246) - (8,904,246)
- -
-
-
-
32,734 32,734 - 32,734
- -
-
-
-
- - (52,565) (52,565)
- -
-
1,087,166
-
(1,087,166) - - -
11,130,307 9,924,438 235,933
23,784,752
18,600,000
53,538,357 117,213,787 520,536 117,734,323
- -
-
-
-
11,116,258 11,116,258 50,133 11,166,391
- -
-
-
-
861,592 861,592 - 861,592
- -
(140,143)
-
-
- (140,143) (12) (140,155)
- -
(11,197)
-
-
- (11,197) - (11,197)
- -
(151,340)
-
-
11,977,850 11,826,510 50,121 11,876,631
- -
-
-
-
(4,452,123) (4,452,123) - (4,452,123)
- - - - - (4,452,123) (4,452,123) - (4,452,123)
- - - - - (8,904,246) (8,904,246) - (8,904,246)
- - - - - 15,902 15,902 - 15,902
- - - - - - - (61,326) (61,326)
- -
-
1,118,850
-
(1,118,850) - - -
11,130,307 9,924,438 84,593
24,903,602
18,600,000
55,509,013 120,151,953 509,331 120,661,284
17,678,726
(970,054)
16,708,672
(61,086)
27,692,288
82,777,787
110,470,075
- - - - - 13,555,235 56,268 13,611,503
- -
-
-
-
(642,454) - (642,454)
- -
(61,499)
-
-
- 413 (61,086)
- -
(21,181)
-
-
- - (21,181)
- -
(82,680)
-
-
12,912,781 12,830,101 56,681 12,886,782
- - - - - (4,452,123) (4,452,123) - (4,452,123)
- - - - - (4,452,123) (4,452,123) - (4,452,123)
- - - - - (8,904,246) (8,904,246) - (8,904,246)
(61,086)
(21,181)
13,555,235
(642,454)
- - - - - 27,446 27,446 - 27,446
- - - - - - - (52,565) (52,565)
- - - 1,374,878 - (1,374,878) - - -
11,130,307 9,924,438 1,913 26,278,480 18,600,000 58,170,116 124,105,254 513,447 124,618,701
Samir Iqbal Saigol
President / CEO Imran Maqbool
Director Nor Hizam Bin Hashim
Director Muhammad Ali Zeb
Samir Iqbal Saigol
President / CEO Imran Maqbool
Director Nor Hizam Bin Hashim
Director Muhammad Ali Zeb

MCB Bank Limited & Subsidiary Companies MCB Bank Limited & Subsidiary Companies
32 33 Half yearly Report 2017Half yearly Report 2017
Notes to the Consolidated Condensed Interim Financial Information (Un-audited)For the half year ended June 30, 2017
3 STATEMENT OF COMPLIANCE
3.4 IFRS10 Consolidated Financial Statements was made applicable from period beginning on or after January 01, 2015 vide S.R.O
633(I)/2014 dated July 10, 2014 by SECP. However, SECP has directed that the requirements of consolidation under section 237 of
the repealed Companies Ordinance 1984 and IFRS-10 "Consolidated Financial Statements" is not applicable in case of investment by
companies in mutual funds established under Trust structure, through S.R.O 56(I) /2016 dated January 28, 2016. Accordingly, the
requirements of this standard have not been applied in the preparation of this consolidated condensed interim financial information to
the extent of their applicability to these mutual funds.
4.2 This consolidated condensed interim financial information is presented in Pak Rupees, which is the Bank's functional and
presentation currency.
5 SIGNIFICANT ACCOUNTING POLICIES AND FINANCIAL RISK MANAGEMENT
5.1 The accounting polices adopted in the preparation of this consolidated condensed interim financial information are the same as those
applied in the preparation of the consolidated financial statements of the Group for the year ended December 31, 2016.
Bank for Life Bank for Life
Notes to the Consolidated Condensed Interim Financial Information (Un-audited)For the half year ended June 30, 2017
2 BASIS OF PRESENTATION
MCB Bank Limited ('the Bank') is a banking company incorporated in Pakistan and is engaged in commercial banking and related
services. The Bank's ordinary shares are listed on Pakistan Stock Exchange. The Bank's Registered Office and Principal Office are
situated at MCB -15 Main Gulberg, Lahore. The Bank operates 1,233 branches (December 31, 2016: 1,227 branches) within Pakistan
and 11 branches (December 31, 2016: 11 branches) outside the country (including the Karachi Export Processing Zone Branch).
1.1 The State Bank of Pakistan, through its letter BPRD (R&P-02)/2017/14329 dated June 13, 2017, has approved the scheme of
amalgamation and granted sanction order for the amalgamation of NIB Bank Limited with and into the Bank. This is effective from the
close of business on July 07, 2017 (the effective date). The Committee of the Board of Directors of MCB Bank Limited (MCB), in their
meeting held on December 07, 2016, approved and resolved to present the draft Scheme of Amalgamation of NIB Bank Limited (NIB)
with and into MCB before the shareholders of MCB for their approval. The shareholders of MCB approved the Scheme of
Amalgamation in the Extraordinary General Meeting (EOGM) held on January 23, 2017 as per the procedure provided in Section 48 of
the Banking Companies Ordinance, 1962. The acquisition has added 170 branches, incremental deposit of Rs. 82 billion and
incremental gross advances of Rs.98 billion. The Bank has issued 72,029,258 ordinary shares of MCB in aggregate in favour of the
shareholders of NIB on the basis of a swap ratio of 1 (one) ordinary share of MCB for every 140.043 ordinary shares of NIB Bank. The
Financial impact of this takeover will be reflected in MCB Bank’s Financial Statements for the nine months ending September 30,
2017.
These consolidated financial statements include the financial statements of MCB Bank Limited and its subsidiary companies and
associates. 2.1
Subsidiaries are all entities over which the Group has the power to govern the financial and operating policies accompanying a
shareholding of more than one half of the voting rights. The existence and effect of potential voting rights that are currently exercisable
are considered when assessing whether the Group controls another entity. Subsidiaries are fully consolidated from the date on which
control is transferred to the Group. They are de-consolidated from the date when control ceases. The assets and liabilities of
subsidiary companies have been consolidated on a line by line basis based on the financial information for the period ended June 30,
2016 and the carrying value of investments held by the Group is eliminated against the subsidiaries' shareholders' equity in this
consolidated condensed interim financial information. Material intra-Group balances and transactions have been eliminated.
a.
Associates are entities over which the Group has significant influence but not control. Investments in associates are accounted for
under the equity method of accounting and are initially recognised at cost, thereafter adjusted for the post-acquisition change in the
Group's share of net assets of the associates. The cumulative post-acquisition movements are adjusted in the carrying amount of the
investment. Accounting policies of the associates have been changed where necessary to ensure consistency with the policies
adopted by the Group. The Group's share in associates have been accounted for based on the financial information for the period
ended June 30, 2017.
b.
Non-controlling interest is that part of the net results of operations and of net assets of subsidiary companies attributable to interests
which are not owned by the Group.
c.
In accordance with the directives of the Federal Government regarding the shifting of the banking system to Islamic modes, the State
Bank of Pakistan (SBP) has issued various circulars from time to time. Permissible forms of trade-related modes of financing include
purchase of goods by banks from their customers and immediate resale to them at appropriate profit in price on deferred payment
basis. The purchases and sales arising under these arrangements are not reflected in this consolidated condensed interim financial
information as such but are restricted to the amount of facility actually utilized and the appropriate portion of profit thereon.
2.2
The financial results of the Group's Islamic Banking business have been consolidated in this financial information for reporting
purposes, after eliminating material inter-group transactions / balances. Key financial figures of the Islamic Banking business are
disclosed in note 20 to this consolidated condensed interim financial information.
2.3
For the purpose of translation, rates of Rs. 104.8540 per US Dollar (December 31, 2016: Rs.104.5985).2.4
7. LENDINGS TO FINANCIAL INSTITUTIONS
Call money lendings
Repurchase agreement lendings
June 30, December 31,
2017 2016
1,755,604 558,800
1,045,223 2,250,952
2,800,827 2,809,752
---------- (Rupees in '000) ----------
The financial risk management objectives and policies are consistent with those disclosed in the consolidated financial statements of
the Group for the year ended December 31, 2016.
5.2
6 SIGNIFICANT ACCOUNTING ESTIMATES AND JUDGMENTS
The basis for significant accounting estimates and judgments adopted in the preparation of this consolidated condensed interim
financial information are the same as those applied in the preparation of the consolidated financial statements of the Group for the
year ended December 31, 2016.
3.1 The consolidated condensed interim financial information of the Bank has been prepared in accordance with the requirements of
International Accounting Standard (IAS) 34, Interim Financial Reporting, Islamic Financial Accounting Standards (IFAS) issued by the
Institute of Chartered Accountants of Pakistan, the requirements of the Companies Ordinance, 1984, the Banking Companies
Ordinance,1962 and directives issued by the Securities and Exchange Commission of Pakistan (SECP) and the SBP. In case
requirements differ, the requirements of the Companies Ordinance, 1984, the Banking Companies Ordinance, 1962 and the said
directives have been followed. The Companies Ordinance, 1984 has been repealed after the enactment of the Companies Act, 2017.
However, as allowed by the SECP vide its press release dated July 20, 2017, this consolidated condensed interim financial
information has been prepared in accordance with the provisions of the repealed Companies Ordinance, 1984.
3.2 The SBP has deferred the applicability of International Accounting Standard (IAS) 39, 'Financial Instruments: Recognition and
Measurement' and International Accounting Standard (IAS) 40, 'Investment Property' for Banking Companies through BSD Circular
Letter No. 10 dated August 26, 2002. The Securities and Exchange Commission of Pakistan (SECP) has deferred applicability of
IFRS-7 "Financial Instruments: Disclosures" on banks through S.R.O 411(1) /2008 dated April 28, 2008. Accordingly, the
requirements of these standards have not been considered in the preparation of this consolidated condensed interim financial
information. However, investments have been classified and valued in accordance with the requirements prescribed by the SBP
through various circulars. Further, segment information is being disclosed in accordance with SBP’s prescribed formats per BSD
circular 4 dated February17, 2006 which prevails over the requirements specified in IFRS 8.
4 BASIS OF MEASUREMENT4.1 This consolidated condensed interim financial information has been prepared under the historical cost convention except that certain
fixed assets and non-banking assets acquired in satisfaction of claims are stated at revalued amounts and certain investments and
commitments in respect of certain forward foreign exchange contracts have been marked to market and are carried at fair value. In
addition, obligations in respect of staff retirement benefits are carried at present value.
3.3 The disclosures made in this consolidated condensed interim financial information have, however been limited based on the format
prescribed by the SBP vide BSD Circular No. 2 dated May 12, 2004 and International Accounting Standard 34, "Interim Financial
Reporting". They do not include all of the disclosures required for annual financial statements and this consolidated condensed interim
financial information should be read in conjunction with the consolidated financial statements of the Group for the year ended
December 31, 2016.
1 STATUS AND NATURE OF BUSINESS
The Group consists of:Holding Company - MCB Bank Limited
"Percentage holding of MCB Bank Limited"
Subsidiary Companies
- MCB Financial Services Limited 99.99% - MNET Services (Private) Limited 99.95% - MCB - Arif Habib Savings and Investments Limited 51.329% - "MCB Leasing" Closed' Joint Stock Company 99.94% - MCB Islamic Bank Limited 100.00%

June 30, December 31,
2017 2016
Opening Balance 72,357 64,962
Share of profit for the period / year before tax 9,427
19,320
Share of tax (4,258)
(11,925)
5,169
7,395
Closing Balance 77,526
72,357
June 30, December 31,
Note 2017 2016
9. ADVANCES - NET
Loans, cash credits, running finances, etc
- In Pakistan 372,147,088
336,403,574
- Outside Pakistan 19,911,778
17,909,754
392,058,866 354,313,328
Islamic Financing and related assets 24,973,898 16,174,001
Net Investment in finance lease
- In Pakistan 2,300,622 1,812,760
- Outside Pakistan 569,497 537,731
2,870,119 2,350,491
Bills discounted and purchased (excluding treasury bills)
- Payable in Pakistan 5,356,024 5,768,909
- Payable outside Pakistan 7,274,032 5,426,101
12,630,056 11,195,010
Advances - gross 432,532,939 384,032,830
Less: Provision against loans and advances
- Specific provision 9.1 (16,724,860) (18,939,120)
- General provision 9.2 (556,037) (367,926)
- General provision against consumer loans & small enterprise loans 9.3 (367,953) (345,791)
- General provision by overseas operations 9.4 (63,664) (46,477)
(17,712,514) (19,699,314)
Advances - net of provision 414,820,425 364,333,516
---------- (Rupees in '000) ----------
Investment in Euronet Pakistan Private Limited under equity method - holding 30%
-------- (Rupees in '000) --------
MCB Bank Limited & Subsidiary Companies
35Half yearly Report 2017
Notes to the Consolidated Condensed Interim Financial Information (Un-audited)For the half year ended June 30, 2017
Bank for Life
June 30, December 31,
2017 2016
Opening Balance 5,375,158 5,456,165
Share of profit for the period / year before tax 345,775 927,454
Dividend from associate (189,755) (273,641)
Share of tax (62,870) (170,861)
93,150 482,952
Share of other comprehensive income 8.3.1 (268,744) 52,213
Disposal during the period / year (659,111) (616,172)
Closing Balance 4,540,453 5,375,158
8.3.1 Share of other comprehensive income
Share of unrealized surplus / (deficit) on assets -net of tax (261,857) 51,160
Share of exchange translation reserve of associate (6,887) 1,053
(268,744) 52,213
Investment in Adamjee Insurance Company Limited under equity method - holding 21.47% (2016: 24.48%)
-------- (Rupees in '000) --------
Note
Note
8. INVESTMENTS - NET
8.1 Investments by types
Held-for-trading securities 16,641,602 7,952,724
24,594,326
Available-for-sale securities 8.2 496,320,856 196,480,492
692,801,348
Held-to-maturity securities 18,293,144 -
18,293,144
531,255,602 204,433,216
735,688,818
Associates
- Adamjee Insurance Company Limited 8.3 4,540,453 -
4,540,453
- Euronet Pakistan (Private) Limited 8.4 77,526
-
77,526
4,617,979 -
4,617,979
Investments at cost 535,873,581 204,433,216
740,306,797
Less: Provision for diminution in the value of investments (2,473,928) - (2,473,928)
Investments (net of provisions) 533,399,653 204,433,216 737,832,869
Surplus / (deficit) on revaluation of available for sale securities - net 14,450,508 (83,792) 14,366,716
Surplus / (deficit) on revaluation of held-for-trading securities - net (40,912) (1,708) (42,620)
Investments at revalued amounts - net of provisions 547,809,249 204,347,716 752,156,965
Held-for-trading securities 500,089 - 500,089
Available-for-sale securities 8.2 473,774,763 38,952,255 512,727,018
Held-to-maturity securities 22,417,040 47,498 22,464,538
496,691,892 38,999,753 535,691,645
Associates
- Adamjee Insurance Company Limited 8.3 5,375,158 - 5,375,158
- Euronet Pakistan (Private) Limited 8.4 72,357 - 72,357
5,447,515 - 5,447,515
Investments at cost 502,139,407 38,999,753 541,139,160
Less: Provision for diminution in the value of investments (1,886,821) - (1,886,821)
Investments (net of provisions) 500,252,586 38,999,753 539,252,339
Surplus / (deficit) on revaluation of available for sale securities - net 17,520,972 (8,541) 17,512,431
Surplus / (deficit) on revaluation of held-for-trading securities - net 5,614 - 5,614
Investments at revalued amounts - net of provisions 517,779,172 38,991,212 556,770,384
Held by
bank
Held by
bank
Given as
collateral
June 30, 2017
December 31, 2016
Total
Given as
collateral
Total
------------ Rupees in '000 ------------
------------ Rupees in '000 ------------
MCB Bank Limited & Subsidiary Companies
34 Half yearly Report 2017
Bank for Life
Notes to the Consolidated Condensed Interim Financial Information (Un-audited)For the half year ended June 30, 2017
Investments include Pakistan Investment Bonds amounting to Rs. 67.9 million (December 31, 2016: Rs. 67.9 million) earmarked by the State Bank of Pakistan and
National Bank of Pakistan against TT / DD discounting facilities and demand note facilities sanctioned to the Bank. In addition, Pakistan Investment Bonds amounting
to Rs. 5.0 million (December 31, 2016: Rs. 5.0 million) have been pledged with the Controller of Military Accounts on the account of Regimental Fund Account.
Investment of the Bank in Adamjee Insurance Company Limited is carried at cost amounting to Rs. 695.651 million (December 31, 2016: Rs. 792.875 million) as at
June 30, 2017 in accordance with the treatment specified in International Accounting Standard (IAS) 28 "Accounting for Investments in Associates". The market value
of the investment in Adamjee Insurance Company Limited as at June 30, 2017 amounted to Rs. 5,138.035 million (December 31, 2016: Rs. 6,351.272 million).
8.3
8.2
Investment of the Group in Euronet Pakistan Private Limited has been accounted for under the equity method of accounting in accordance with the treatment
specified in International Accounting Standard 28, (IAS 28) 'Accounting for Investments in Associates'.
8.4

MCB Bank Limited & Subsidiary Companies
37Half yearly Report 2017
Notes to the Consolidated Condensed Interim Financial Information (Un-audited)For the half year ended June 30, 2017
Bank for Life
10. OPERATING FIXED ASSETS
Capital work-in-progress
Property and equipment
Intangible asset
10.1. Additions and disposals during the period amounted to Rs. 2,630.381 million (June 30, 2016: Rs. 1,515.957 million) and Rs. 7.238 million (June 30, 2016: Rs. 92.268 million), respectively.
June 30, December 31,
2017 2016
2,156,203 1,744,090
34,018,895 32,747,037
703,461 734,738
36,878,559 35,225,865
---------- (Rupees in '000) ----------
238,739,275 77,438,993
11. BORROWINGS
In Pakistan Outside Pakistan
11.1. Details of borrowings (secured / unsecured)
SecuredBorrowings from State Bank of Pakistan
Export refinance schemeLong term financing facilityFinancing facility for storage of agricultural produce
Repurchase agreement borrowings
UnsecuredBorrowings from other financial institutionsCall borrowingsOverdrawn nostro accounts
June 30, December 31,
2017 2016
234,938,152 72,962,2703,801,123 4,476,723
238,739,275 77,438,993
13,552,977 12,921,0667,353,584 5,841,088
269,188 318,490
21,175,749 19,080,644
204,388,885 38,984,230
225,564,634 58,064,874
888,637 3,730,48011,851,199 15,487,782
434,805 155,85713,174,641 19,374,119
---------- (Rupees in '000) ----------
9.1
Note
Other Assets Especially
Mentioned (OAEM) 9.1.1 66,642 -
66,642
3,980
3,980
Substandard 3,114,812 24,819 3,139,631
34,521
34,521
Doubtful 92,766 109,141 201,907
100,953
100,953
Loss 13,721,505 5,348,838 19,070,343 16,585,406 16,585,406
16,995,725 5,482,798 22,478,523 16,724,860 16,724,860
Other Assets Especially
Mentioned (OAEM) 9.1.1 31,918 - 31,918 1,617 1,617
Substandard 72,424 2,487 74,911 18,520 18,520
Doubtful 307,754 55,532 363,286 181,643 181,643
Loss 15,927,379 5,291,785 21,219,164 18,737,340 18,737,340
16,339,475 5,349,804 21,689,279 18,939,120 18,939,120
-------------------------------------( Rupees in '000 )------------------------------------
-------------------------------------( Rupees in '000 )------------------------------------
Specific
Provision
Required
Total
Classified Advances
Specific
Provision
Required
Classified Advances
Advances include Rs. 22,478.523 million (December 31, 2016: Rs. 21,689.279 million) which have been placed under non-
performing status as detailed below:
June 30, 2017
Category of Classification
December 31, 2016
Total DomesticCategory of Classification Overseas
Domestic
Specific
Provision
Held
Overseas
Specific
Provision
Held
MCB Bank Limited & Subsidiary Companies
36 Half yearly Report 2017
Bank for Life
Notes to the Consolidated Condensed Interim Financial Information (Un-audited)For the half year ended June 30, 2017
This represents non-performing portfolio of agricultural financing and advances to small enterprises classified as OAEM as per the requirements of
the Prudential Regulations issued by the SBP.
9.1.1
General provision against advances represents provision maintained at around 0.1% of gross advances.9.2
General provision against consumer loans represents provision maintained against fully secured performing portfolio and unsecured performing
portfolio as required by the Prudential Regulations issued by the SBP. General provision against Small Enterprise Finance represents provision
maintained at an amount equal to 1% of the fully secured performing portfolio and 2% of the unsecured performing portfolio as required by the
Prudential Regulations issued by the SBP.
9.3
General provisions pertaining to overseas advances are made in accordance with the requirements of the regulatory authorities of the respective
countries in which the overseas branches operate.
9.4
State Bank of Pakistan vide BSD Circular No. 2 dated January 27, 2009, BSD Circular No. 10 dated October 20, 2009, BSD Circular No. 02 of 2010
dated June 03, 2010 and BSD Circular No.1 of 2011 dated October 21, 2011 has allowed benefit of forced sale value (FSV) of Plant & Machinery
under charge, pledged stock and mortgaged residential, commercial & industrial properties (land and building only) held as collateral against NPLs
for five years from the date of classification. However, management has not taken the FSV benefit in calculation of specific provision.
9.5
14.3 Trade-related contingent liabilities 139,743,359 131,203,542
14.4 Other contingencies
Claims against the Bank not acknowledged as debts 5,583,495 7,345,639
These represent certain claims by third parties against the Bank, which are being contested in the Courts of law. The management is
of the view that these relate to the normal course of business and the possibilityof an outflow of economic resources is remote and
accordingly no provision has been made in this consolidated condensed interim financial information.
12. DEPOSITS AND OTHER ACCOUNTS
CustomersFixed deposits 53,930,146
49,292,487
Savings deposits 469,892,331
432,501,128
Current accounts 358,306,820
287,172,315
Margin accounts 9,094,682
7,003,787
891,223,979
775,969,717
Financial institutions
Remunerative deposits 15,102,700
12,657,796
Non-remunerative deposits 7,921,702
7,062,033
23,024,402
19,719,829
914,248,381
795,689,546
13. DEFERRED TAX LIABILITY / (ASSET) - NET
The details of the tax effect of taxable and deductible temporary differences are as follows:
Taxable temporary differences on:
Surplus on revaluation of operating fixed assets 1,066,162
1,080,165
Surplus on revaluation of Non-banking assets 76,111 76,111
Accelerated tax depreciation 1,509,782 1,511,887
Receivable from pension fund 2,561,781 2,720,719
Investments in associated undertaking 1,312,301 1,563,003
Surplus / deficit on revaluation of securities 4,914,948 6,005,556
11,441,085 12,957,441
Deductible temporary differences on:
Provision for bad debts (13,476) (7,048)
Provision for post retirement benefits (480) (7,945)
Taxable losses (28,811) (34,142)
Others (33,885) (18,657)
(76,652) (67,792)
11,364,433 12,889,649
14. CONTINGENCIES AND COMMITMENTS
14.1 Direct credit substitutes
Contingent liabilities in respect of guarantees given favouring
- Government 44,661,563 28,098,810
- Banks and financial institutions 5,629,939 3,848,002
- Others 2,541,829 2,010,891
52,833,331 33,957,703
14.2 Transaction-related contingent liabilities
Guarantees in favour of:
- Government 25,323,823 16,486,907
- Banks and financial institutions 35,065 60,034
- Others 11,790,960 12,671,980
- Suppliers credit / payee guarantee 1,993,023 1,930,979
39,142,871 31,149,900
June 30, December 31,
2017 2016
---------- (Rupees in '000) ----------
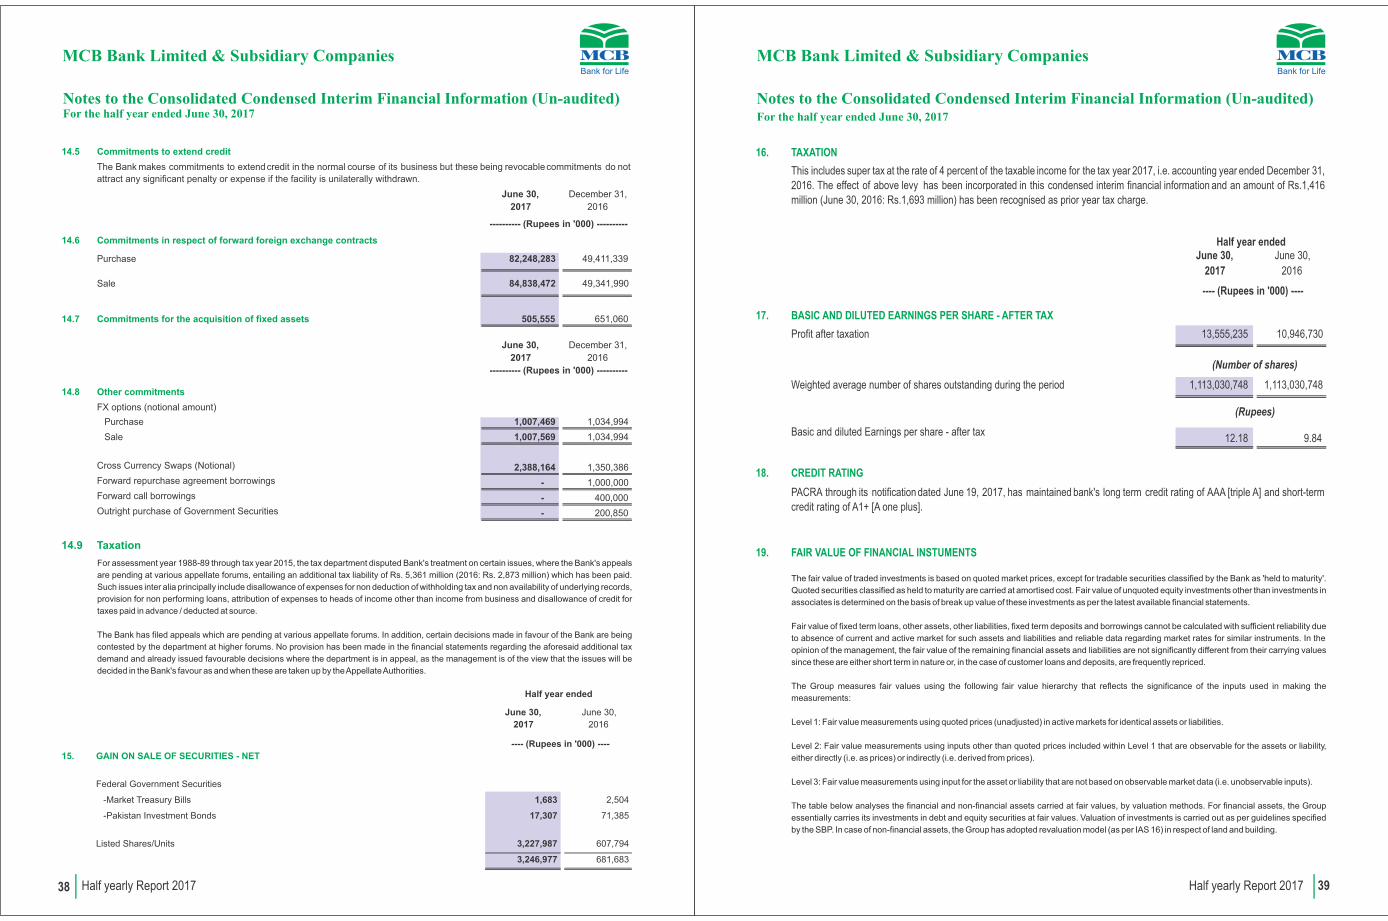
16. TAXATION
June 30, June 30,
2017 2016
17. BASIC AND DILUTED EARNINGS PER SHARE - AFTER TAX
Profit after taxation 10,946,730
(Number of shares)
Weighted average number of shares outstanding during the period 1,113,030,748
(Rupees)
Basic and diluted Earnings per share - after tax
18. CREDIT RATING
PACRA through its notification dated June 19, 2017, has maintained bank's long term credit rating of AAA [triple A] and short-term
credit rating of A1+ [A one plus].
---- (Rupees in '000) ----
Half year ended
This includes super tax at the rate of 4 percent of the taxable income for the tax year 2017, i.e. accounting year ended December 31,
2016. The effect of above levy has been incorporated in this condensed interim financial information and an amount of Rs.1,416
million (June 30, 2016: Rs.1,693 million) has been recognised as prior year tax charge.
39Half yearly Report 2017
MCB Bank Limited & Subsidiary Companies
Notes to the Consolidated Condensed Interim Financial Information (Un-audited)For the half year ended June 30, 2017
Bank for Life
The fair value of traded investments is based on quoted market prices, except for tradable securities classified by the Bank as 'held to maturity'.
Quoted securities classified as held to maturity are carried at amortised cost. Fair value of unquoted equity investments other than investments in
associates is determined on the basis of break up value of these investments as per the latest available financial statements.
Fair value of fixed term loans, other assets, other liabilities, fixed term deposits and borrowings cannot be calculated with sufficient reliability due
to absence of current and active market for such assets and liabilities and reliable data regarding market rates for similar instruments. In the
opinion of the management, the fair value of the remaining financial assets and liabilities are not significantly different from their carrying values
since these are either short term in nature or, in the case of customer loans and deposits, are frequently repriced.
The Group measures fair values using the following fair value hierarchy that reflects the significance of the inputs used in making the
measurements:
Level 1: Fair value measurements using quoted prices (unadjusted) in active markets for identical assets or liabilities.
Level 2: Fair value measurements using inputs other than quoted prices included within Level 1 that are observable for the assets or liability,
either directly (i.e. as prices) or indirectly (i.e. derived from prices).
Level 3: Fair value measurements using input for the asset or liability that are not based on observable market data (i.e. unobservable inputs).
The table below analyses the financial and non-financial assets carried at fair values, by valuation methods. For financial assets, the Group
essentially carries its investments in debt and equity securities at fair values. Valuation of investments is carried out as per guidelines specified
by the SBP. In case of non-financial assets, the Group has adopted revaluation model (as per IAS 16) in respect of land and building.
19. FAIR VALUE OF FINANCIAL INSTUMENTS
June 30, June 30,
2017 2016
1,683 2,504
17,307 71,385
15. GAIN ON SALE OF SECURITIES - NET
Federal Government Securities
-Market Treasury Bills
-Pakistan Investment Bonds
Listed Shares/Units 3,227,987 607,794
3,246,977 681,683
Half year ended
---- (Rupees in '000) ----
14.5 Commitments to extend credit
June 30, December 31,
2017 2016
14.6 Commitments in respect of forward foreign exchange contracts
Purchase 82,248,283
49,411,339
Sale 84,838,472
49,341,990
14.7 Commitments for the acquisition of fixed assets 505,555
651,060
June 30, December 31,
2017 2016
14.8 Other commitments
FX options (notional amount)
Purchase 1,007,469 1,034,994
Sale 1,007,569 1,034,994
Cross Currency Swaps (Notional) 2,388,164 1,350,386
Forward repurchase agreement borrowings - 1,000,000
Forward call borrowings - 400,000
Outright purchase of Government Securities - 200,850
The Bank makes commitments to extendcredit in the normal course of its business but these being revocablecommitments do not
attract any significant penalty or expense if the facility is unilaterally withdrawn.
---------- (Rupees in '000) ----------
---------- (Rupees in '000) ----------
38 Half yearly Report 2017
MCB Bank Limited & Subsidiary CompaniesBank for Life
Notes to the Consolidated Condensed Interim Financial Information (Un-audited)For the half year ended June 30, 2017
14.9 Taxation
For assessment year 1988-89 through tax year 2015, the tax department disputed Bank's treatment on certain issues, where the Bank's appeals
are pending at various appellate forums, entailing an additional tax liability of Rs. 5,361 million (2016: Rs. 2,873 million) which has been paid.
Such issues inter alia principally include disallowance of expenses for non deduction of withholding tax and non availability of underlying records,
provision for non performing loans, attribution of expenses to heads of income other than income from business and disallowance of credit for
taxes paid in advance / deducted at source.
The Bank has filed appeals which are pending at various appellate forums. In addition, certain decisions made in favour of the Bank are being
contested by the department at higher forums. No provision has been made in the financial statements regarding the aforesaid additional tax
demand and already issued favourable decisions where the department is in appeal, as the management is of the view that the issues will be
decided in the Bank's favour as and when these are taken up by the Appellate Authorities.
13,555,235
1,113,030,748
9.8412.18
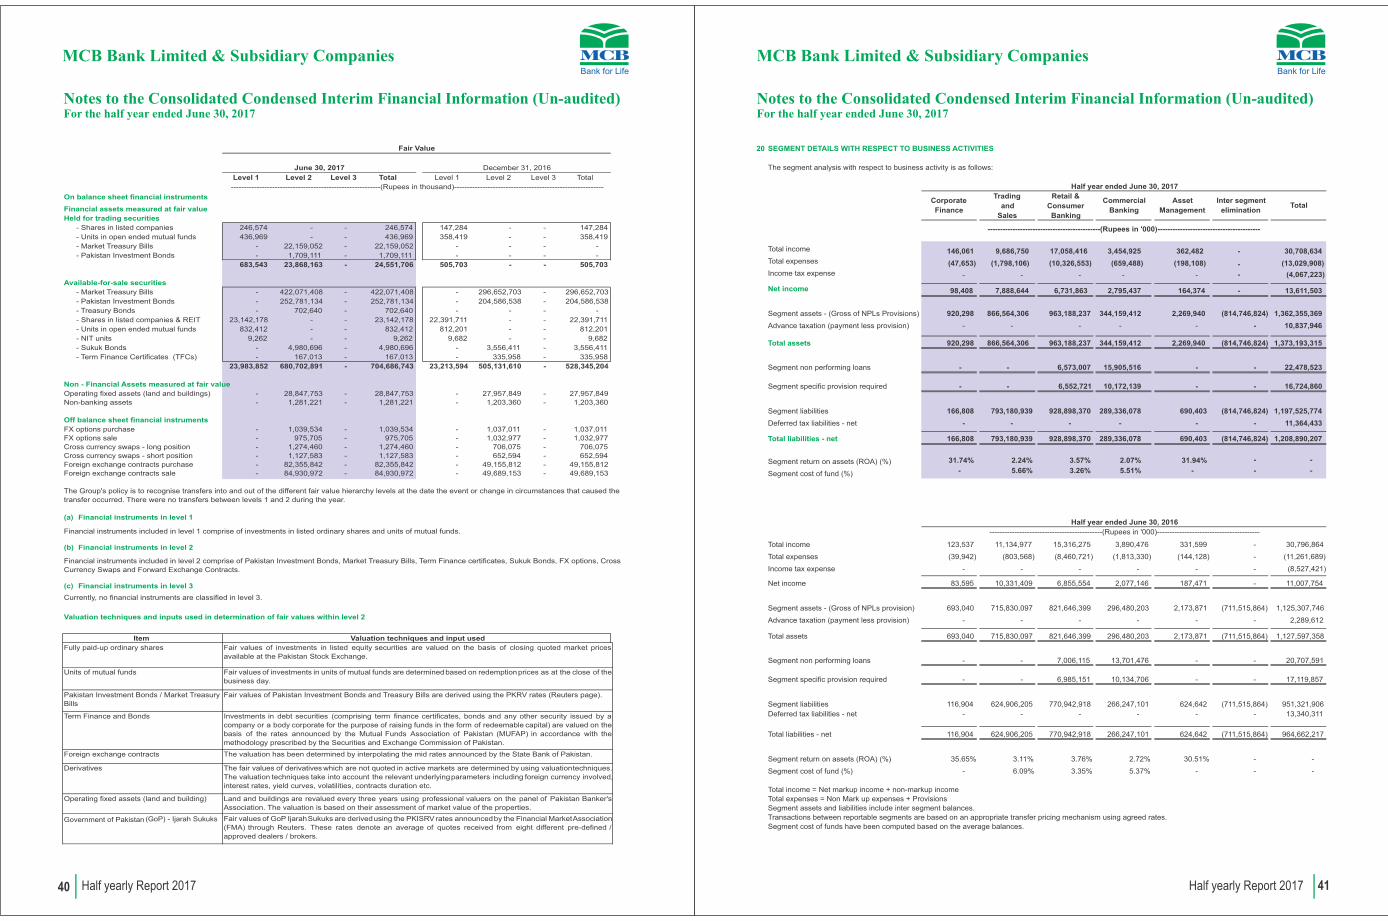
Total income 123,537 11,134,977 15,316,275 3,890,476 331,599 - 30,796,864
Total expenses (39,942) (803,568) (8,460,721) (1,813,330) (144,128) - (11,261,689)
Income tax expense - - - - - - (8,527,421)
Net income 83,595 10,331,409 6,855,554 2,077,146 187,471 - 11,007,754
Segment assets - (Gross of NPLs provision) 693,040 715,830,097 821,646,399 296,480,203 2,173,871 (711,515,864) 1,125,307,746
Advance taxation (payment less provision) - - - - - - 2,289,612
Total assets 693,040 715,830,097 821,646,399 296,480,203 2,173,871 (711,515,864) 1,127,597,358
Segment non performing loans - - 7,006,115 13,701,476 - - 20,707,591
Segment specific provision required - - 6,985,151 10,134,706 - - 17,119,857
Segment liabilities 116,904 624,906,205 770,942,918 266,247,101 624,642 (711,515,864) 951,321,906
Deferred tax liabilities - net - - - - - - 13,340,311
Total liabilities - net 116,904 624,906,205 770,942,918 266,247,101 624,642 (711,515,864) 964,662,217
Segment return on assets (ROA) (%) 35.65% 3.11% 3.76% 2.72% 30.51% - -
Segment cost of fund (%) - 6.09% 3.35% 5.37% - - -
Total income = Net markup income + non-markup income
Total expenses = Non Mark up expenses + Provisions
Segment assets and liabilities include inter segment balances.
Transactions between reportable segments are based on an appropriate transfer pricing mechanism using agreed rates.
Segment cost of funds have been computed based on the average balances.
---------------------------------------------(Rupees in '000)-----------------------------------------
Half year ended June 30, 2016
20 SEGMENT DETAILS WITH RESPECT TO BUSINESS ACTIVITIES
The segment analysis with respect to business activity is as follows:
Total income
Total expenses
Income tax expense
Net income
Segment assets - (Gross of NPLs Provisions) 920,298 866,564,306 963,188,237 344,159,412
2,269,940
(814,746,824)
1,362,355,369
Advance taxation (payment less provision) - - - -
-
-
10,837,946
Total assets 920,298 866,564,306 963,188,237 344,159,412
2,269,940
(814,746,824)
1,373,193,315
Segment non performing loans - - 6,573,007 15,905,516
-
-
22,478,523
Segment specific provision required - - 6,552,721 10,172,139
-
-
16,724,860
Segment liabilities 166,808 793,180,939 928,898,370 289,336,078
690,403
(814,746,824)
1,197,525,774
Deferred tax liabilities - net - - - -
-
-
- -
- -
11,364,433
Total liabilities - net 166,808 793,180,939 928,898,370 289,336,078 690,403 (814,746,824) 1,208,890,207
Segment return on assets (ROA) (%)
Segment cost of fund (%)
Half year ended June 30, 2017
Inter segment
elimination Total
---------------------------------------------(Rupees in '000)-----------------------------------------
Corporate
Finance
Trading
and
Sales
Retail &
Consumer
Banking
Commercial
Banking
Asset
Management
(GoP) - Ijarah Sukuks Fair values of GoP IjarahSukuks are derivedusing the PKISRV rates announcedby the Financial MarketAssociation
(FMA) through Reuters. These rates denote an average of quotes received from eight different pre-defined /
approved dealers / brokers.
Derivatives The fair values of derivatives which are not quoted in active markets are determined by using valuationtechniques.
The valuation techniques take into account the relevant underlyingparameters including foreign currency involved,
interest rates, yield curves, volatilities, contracts duration etc.
Operating fixed assets (land and building) Land and buildings are revalued every three years using professional valuers on the panel of Pakistan Banker's
Association. The valuation is based on their assessment of market value of the properties.
Fully paid-up ordinary shares Fair values of investments in listed equity securities are valued on the basis of closing quoted market prices
available at the Pakistan Stock Exchange.
Item Valuation techniques and input used
Foreign exchange contracts The valuation has been determined by interpolating the mid rates announced by the State Bank of Pakistan.
Units of mutual funds Fair values of investments in units of mutual funds are determinedbased on redemptionprices as at the close of the
business day.
Pakistan Investment Bonds / Market Treasury
Bills
Fair values of Pakistan Investment Bonds and Treasury Bills are derived using the PKRV rates (Reuters page).
Term Finance and Bonds Investments in debt securities (comprising term finance certificates, bonds and any other security issued by a
company or a body corporate for the purpose of raising funds in the form of redeemable capital) are valued on the
basis of the rates announced by the Mutual Funds Association of Pakistan (MUFAP) in accordance with the
methodology prescribed by the Securities and Exchange Commission of Pakistan.
Level 1 Level 2 Level 3 Total Level 1 Level 2 Level 3 Total
On balance sheet financial instruments
Financial assets measured at fair value
Held for trading securities
- Shares in listed companies 246,574 - - 246,574 147,284 - - 147,284
- Units in open ended mutual funds 436,969 - - 436,969 358,419 - - 358,419
- Market Treasury Bills - 22,159,052 - 22,159,052 - - - -
- Pakistan Investment Bonds - 1,709,111 - 1,709,111 - - - -
683,543 23,868,163 - 24,551,706 505,703 - - 505,703
Available-for-sale securities
- Market Treasury Bills - 422,071,408 - 422,071,408 - 296,652,703 - 296,652,703
- Pakistan Investment Bonds - 252,781,134 - 252,781,134 - 204,586,538 - 204,586,538
- Treasury Bonds -
702,640
-
702,640
-
-
- -
- Shares in listed companies & REIT 23,142,178
-
-
23,142,178
22,391,711
-
- 22,391,711
- Units in open ended mutual funds 832,412
-
-
832,412
812,201
-
- 812,201
- NIT units 9,262
-
-
9,262
9,682
-
- 9,682
- Sukuk Bonds -
4,980,696
-
4,980,696
-
3,556,411
- 3,556,411
- Term Finance Certificates (TFCs) -
167,013
-
167,013
-
335,958
- 335,958
23,983,852
680,702,891
-
704,686,743
23,213,594
505,131,610
- 528,345,204
Non - Financial Assets measured at fair value
Operating fixed assets (land and buildings) -
28,847,753
-
28,847,753
-
27,957,849
- 27,957,849
Non-banking assets -
1,281,221
-
1,281,221
-
1,203,360
- 1,203,360
Off balance sheet financial instruments
FX options purchase -
1,039,534
-
1,039,534
-
1,037,011
- 1,037,011
FX options sale -
975,705
-
975,705
-
1,032,977
- 1,032,977
Cross currency swaps - long position -
1,274,460
-
1,274,460
-
706,075
- 706,075
Cross currency swaps - short position - 1,127,583 - 1,127,583 - 652,594 - 652,594
Foreign exchange contracts purchase -
82,355,842
-
82,355,842
-
49,155,812
- 49,155,812
Foreign exchange contracts sale -
84,930,972
-
84,930,972
-
49,689,153
- 49,689,153
(a) Financial instruments in level 1
(b) Financial instruments in level 2
(c) Financial instruments in level 3
Valuation techniques and inputs used in determination of fair values within level 2
Fair Value
June 30, 2017 December 31, 2016
Financial instruments included in level 1 comprise of investments in listed ordinary shares and units of mutual funds.
Financial instruments included in level 2 comprise of Pakistan Investment Bonds, Market Treasury Bills, Term Finance certificates, Sukuk Bonds, FX options, Cross
Currency Swaps and Forward Exchange Contracts.
Currently, no financial instruments are classified in level 3.
----------------------------------------------------------(Rupees in thousand)----------------------------------------------------------
The Group's policy is to recognise transfers into and out of the different fair value hierarchy levels at the date the event or change in circumstances that caused the
transfer occurred. There were no transfers between levels 1 and 2 during the year.
40 41Half yearly Report 2017Half yearly Report 2017
MCB Bank Limited & Subsidiary CompaniesMCB Bank Limited & Subsidiary CompaniesBank for LifeBank for Life
Notes to the Consolidated Condensed Interim Financial Information (Un-audited) Notes to the Consolidated Condensed Interim Financial Information (Un-audited)For the half year ended June 30, 2017 For the half year ended June 30, 2017
Government of Pakistan
146,061 9,686,750 17,058,416 3,454,925 362,482 - 30,708,634
(13,029,908)
98,408 7,888,644 6,731,863 2,795,437 164,374 - 13,611,503
(47,653) (1,798,106) (10,326,553) (659,488) (198,108)
- (4,067,223)
-
- - - - -
- 5.66% 3.26% 5.51% -
31.74% 2.24% 3.57% 2.07% 31.94%
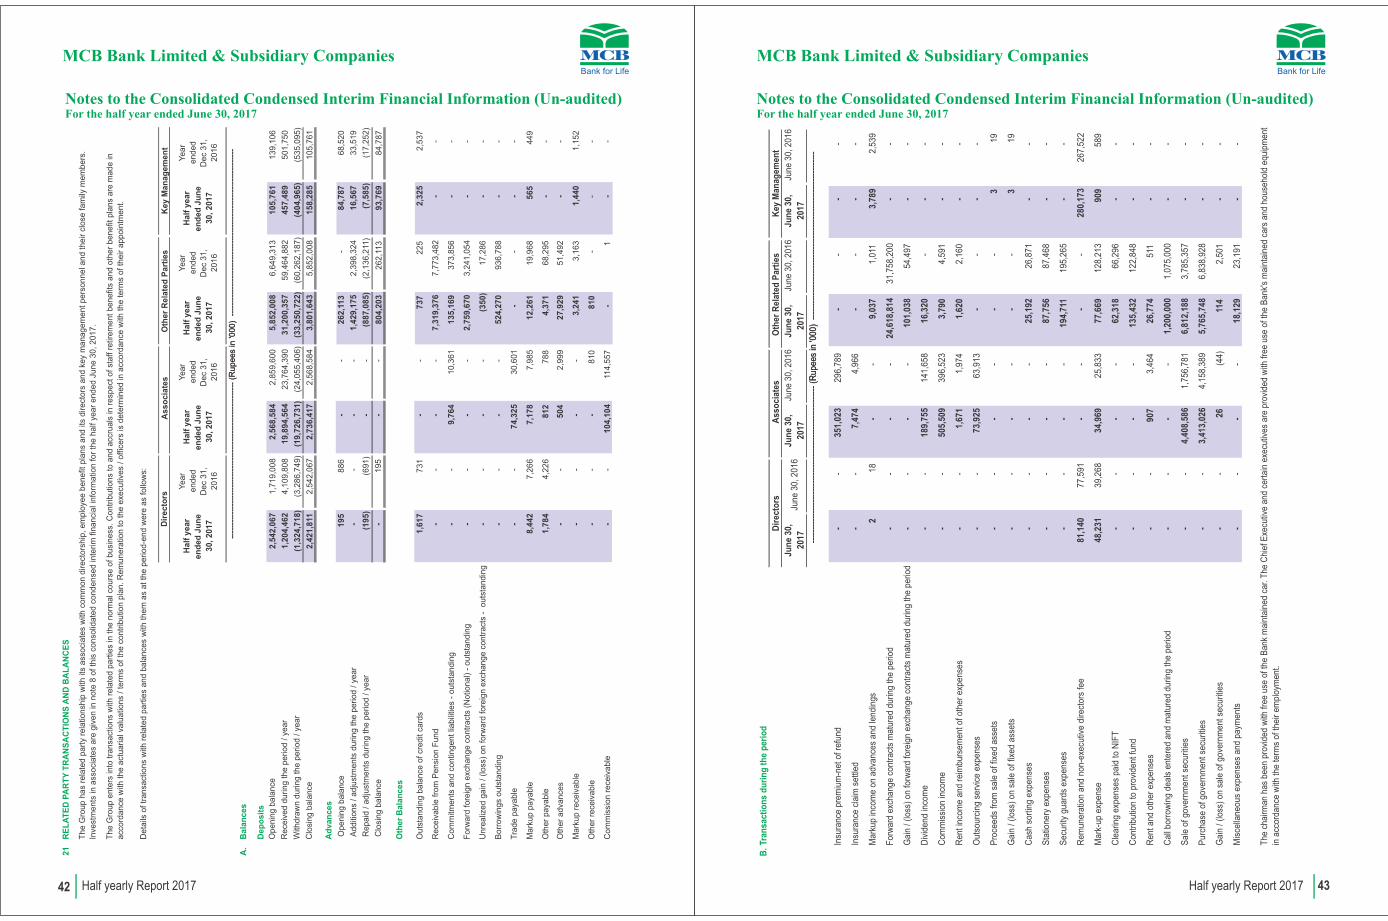
Notes to the Consolidated Condensed Interim Financial Information (Un-audited)For the half year ended June 30, 2017
--
351,
023
296,
789
-
-
-
-
--
7,47
44,
966
-
-
-
-
218
--
9,03
7
1,01
1
3,78
9
2,53
9
--
--
24,6
18,8
14
31,7
58,2
00
-
-
--
--
101,
038
54,4
97
-
-
--
189,
755
141,
658
16,3
20
-
-
-
--
505,
509
396,
523
3,79
0
4,59
1
-
-
--
1,67
11,
974
1,62
02,
160
--
--
73,9
2563
,913
--
--
--
--
--
319
--
--
--
319
--
--
25,1
9226
,871
--
--
--
87,7
5687
,468
--
--
--
194,
711
195,
265
--
81,1
4077
,591
--
--
280,
173
267,
522
48,2
3139
,268
34,9
6925
,833
77,6
6912
8,21
390
958
9
--
--
62,3
1866
,296
--
--
--
135,
432
122,
848
--
--
907
3,46
426
,774
511
--
--
--
1,20
0,00
01,
075,
000
--
--
4,40
8,58
61,
756,
781
6,81
2,18
83,
785,
357
--
--
3,41
3,02
64,
158,
389
5,76
5,74
86,
838,
928
--
--
26(4
4)11
42,
501
--
--
--
18,1
2923
,191
--
Oth
er R
elat
ed P
arti
esK
ey M
anag
emen
tD
irec
tors
Jun
e 30
,
2017
June
30,
201
6Ju
ne
30,
2017
Jun
e 30
,
2017
June
30,
201
6
Ass
oci
ates
Jun
e 30
,
2017
June
30,
201
6
----
----
----
----
----
----
----
----
----
----
----
----
----
----
-- (
Rup
ees
in '0
00)
---
----
----
----
----
----
----
----
----
----
----
----
----
----
----
---
June
30,
201
6
B.
Tran
sact
ion
s d
uri
ng
th
e p
erio
d
Insu
ranc
e pr
emiu
m-n
et o
f ref
und
Insu
ranc
e cl
aim
set
tled
Mar
kup
inco
me
on a
dvan
ces
and
lend
ings
For
war
d ex
chan
ge c
ontr
acts
mat
ured
dur
ing
the
perio
d
Gai
n / (
loss
) on
forw
ard
fore
ign
exch
ange
con
trac
ts m
atur
ed d
urin
g th
e pe
riod
Div
iden
d in
com
e
Com
mis
sion
inco
me
Ren
t inc
ome
and
reim
burs
emen
t of o
ther
exp
ense
s
Out
sour
cing
ser
vice
exp
ense
s
Pro
ceed
s fr
om s
ale
of fi
xed
asse
ts
Gai
n / (
loss
) on
sal
e of
fixe
d as
sets
Cas
h so
rtin
g ex
pens
es
Sta
tione
ry e
xpen
ses
Sec
urity
gua
rds
expe
nses
Rem
uner
atio
n an
d no
n-ex
ecut
ive
dire
ctor
s fe
e
Mar
k-up
exp
ense
Cle
arin
g ex
pens
es p
aid
to N
IFT
Con
trib
utio
n to
pro
vide
nt fu
nd
Ren
t and
oth
er e
xpen
ses
Cal
l bor
row
ing
deal
s en
tere
d an
d m
atur
ed d
urin
g th
e pe
riod
Sal
e of
gov
ernm
ent s
ecur
ities
Pur
chas
e of
gov
ernm
ent s
ecur
ities
Gai
n / (
loss
) on
sal
e of
gov
ernm
ent s
ecur
ities
Mis
cella
neou
s ex
pens
es a
nd p
aym
ents
The
cha
irman
has
bee
n pr
ovid
ed w
ith fr
ee u
se o
f the
Ban
k m
aint
aine
d ca
r. T
he C
hief
Exe
cutiv
e an
d ce
rtai
n ex
ecut
ives
are
pro
vide
d w
ith fr
ee u
se o
f the
Ban
k's
mai
ntai
ned
cars
and
hou
seho
ld e
quip
men
t
in a
ccor
danc
e w
ith th
e te
rms
of th
eir
empl
oym
ent.
----
----
----
----
----
----
----
----
----
----
----
----
----
----
-- (
Rup
ees
in '0
00)
---
----
----
----
----
----
----
----
----
----
----
----
----
----
----
---
MCB Bank Limited & Subsidiary Companies
43Half yearly Report 2017
Bank for Life
2,5
42
,06
7
1,7
19
,00
8
2,5
68
,58
4
2,8
59
,60
0
5,8
52
,00
86
,64
9,3
13
10
5,7
61
13
9,1
06
1,2
04
,46
2
4,1
09
,80
8
19
,89
4,5
64
23
,76
4,3
90
31
,20
0,3
57
59
,46
4,8
82
45
7,4
89
50
1,7
50
(1,3
24
,71
8)
(3,2
86
,74
9)
(19
,72
6,7
31
)
(24
,05
5,4
06
)
(33
,25
0,7
22
)(6
0,2
62
,18
7)
(40
4,9
65
)(5
35
,09
5)
2,4
21
,811
2,5
42
,06
7
2,7
36
,41
7
2,5
68
,58
4
3,8
01
,64
35
,85
2,0
08
15
8,2
85
10
5,7
61
19
5
88
6
-
-
26
2,1
13
-8
4,7
87
68
,52
0
-
-
-
-
1,4
29
,17
52
,39
8,3
24
16
,56
73
3,5
19
(19
5)
(69
1)
-
-
(88
7,0
85
)(2
,13
6,2
11)
(7,5
85
)(1
7,2
52
)
-
19
5
-
-
80
4,2
03
26
2,1
13
93
,76
98
4,7
87
1,6
17
73
1
-
-
73
72
25
2,3
25
2,5
37
--
--
7,3
19
,37
67
,77
3,4
82
--
--
9,7
64
10
,36
11
35
,16
93
73
,85
6-
-
--
--
2,7
59
,67
03
,24
1,0
54
--
--
--
(35
0)
17
,28
6-
-
--
--
52
4,2
70
93
6,7
88
--
--
74
,32
53
0,6
01
--
--
8,4
42
7,2
66
7,1
78
7,9
85
12
,26
11
9,9
68
56
54
49
1,7
84
4,2
26
81
27
88
4,3
71
68
,29
5-
-
--
50
42
,99
92
7,9
29
51
,49
2-
-
--
--
3,2
41
3,1
63
1,4
40
1,1
52
--
-8
10
81
0-
--
--
10
4,1
04
114
,55
7-
1-
-
Ha
lf y
ea
r
en
de
d J
un
e
30
, 2
01
7
Ye
ar
en
de
d
De
c 3
1,
20
16
Ha
lf y
ea
r
en
de
d J
un
e
30
, 2
01
7
Ye
ar
en
de
d
De
c 3
1,
20
16
As
so
cia
tes
D
ire
cto
rs
Ye
ar
en
de
d
De
c 3
1,
20
16
Ye
ar
en
de
d
De
c 3
1,
20
16
----
----
----
----
----
----
----
----
----
----
----
----
----
----
-- (
Ru
pe
es
in '0
00
) -
----
----
----
----
----
----
----
----
----
----
----
----
----
----
----
-
Oth
er
Re
late
d P
art
ies
Ke
y M
an
ag
em
en
t
Ha
lf y
ea
r
en
de
d J
un
e
30
, 2
01
7
Ha
lf y
ea
r
en
de
d J
un
e
30
, 2
01
7
21
RE
LA
TE
D P
AR
TY
TR
AN
SA
CT
ION
S A
ND
BA
LA
NC
ES
A.
Ba
lan
ce
s
De
po
sit
s
Op
en
ing
ba
lan
ce
Re
ceiv
ed
du
rin
g t
he
pe
rio
d /
ye
ar
With
dra
wn
du
rin
g t
he
pe
rio
d /
ye
ar
Clo
sin
g b
ala
nce
Ad
va
nc
es
Op
en
ing
ba
lan
ce
Ad
diti
on
s /
ad
just
me
nts
du
rin
g t
he
pe
rio
d /
ye
ar
Re
pa
id /
ad
just
me
nts
du
rin
g t
he
pe
rio
d /
ye
ar
Clo
sin
g b
ala
nce
Oth
er
Ba
lan
ce
s
Ou
tsta
nd
ing
ba
lan
ce o
f cr
ed
it ca
rds
Re
ceiv
ab
le f
rom
Pe
nsi
on
Fu
nd
Co
mm
itme
nts
an
d c
on
ting
en
t lia
bili
ties
- o
uts
tan
din
g
Fo
rwa
rd f
ore
ign
exc
ha
ng
e c
on
tra
cts
(No
tion
al) -
ou
tsta
nd
ing
Un
rea
lize
d g
ain
/ (
loss
) o
n f
orw
ard
fo
reig
n e
xch
an
ge
co
ntr
act
s -
ou
tsta
nd
ing
Bo
rro
win
gs
ou
tsta
nd
ing
Tra
de
pa
yab
le
Ma
rku
p p
aya
ble
Oth
er
pa
yab
le
Oth
er
ad
van
ces
Ma
rku
p r
ece
iva
ble
Oth
er
rece
iva
ble
Co
mm
issi
on
re
ceiv
ab
le
Th
e G
rou
p h
as
rela
ted
pa
rty
rela
tion
ship
with
its
ass
oci
ate
s w
ith c
om
mo
n d
ire
cto
rsh
ip,
em
plo
yee
be
ne
fit p
lan
s a
nd
its
dire
cto
rs a
nd
ke
y m
an
ag
em
en
t p
ers
on
ne
l an
d t
he
ir c
lose
fa
mily
me
mb
ers
.
Inve
stm
en
ts in
ass
oci
ate
s a
re g
ive
n in
no
te 8
of
this
co
nso
lida
ted
co
nd
en
sed
inte
rim
fin
an
cia
l in
form
atio
n f
or
the
ha
lf ye
ar
en
de
d J
un
e 3
0,
20
17
.
Th
e G
rou
p e
nte
rs in
to t
ran
sact
ion
s w
ith r
ela
ted
pa
rtie
s in
th
e n
orm
al c
ou
rse
of
bu
sin
ess
. C
on
trib
utio
ns
to a
nd
acc
rua
ls in
re
spe
ct o
f st
aff r
etir
em
en
t b
en
efit
s a
nd
oth
er
be
ne
fit p
lan
s a
re m
ad
e in
acc
ord
an
ce w
ith t
he
act
ua
ria
l va
lua
tion
s /
term
s o
f th
e c
on
trib
utio
n p
lan
. R
em
un
era
tion
to
th
e e
xecu
tive
s /
offic
ers
is d
ete
rmin
ed
in a
cco
rda
nce
with
th
e t
erm
s o
f th
eir a
pp
oin
tme
nt.
De
tails
of
tra
nsa
ctio
ns
with
re
late
d p
art
ies
an
d b
ala
nce
s w
ith t
he
m a
s a
t th
e p
erio
d-e
nd
we
re a
s fo
llow
s:
----
----
----
----
----
----
----
----
----
----
----
----
----
----
-- (
Ru
pe
es
in '0
00
) -
----
----
----
----
----
----
----
----
----
----
----
----
----
----
----
-
Notes to the Consolidated Condensed Interim Financial Information (Un-audited)For the half year ended June 30, 2017
MCB Bank Limited & Subsidiary CompaniesBank for Life
42 Half yearly Report 2017

Profit / return earned 868,358
Profit / return expensed 277,744
Net spread earned 590,614
Provision against non-performing Islamic financing
and related assets - net 56,000
Provision for diminution in the value of
investments - net -
Bad debts written off directly -
56,000
Net spread after provisions 534,614
Other income
Fee, commission and brokerage income 17,035 Dividend income 23,207 Income from dealing in foreign currencies 9,042 Gain on sale of securities - net 71,352
Unrealized gain / (loss) on revaluation of investments
classified as held for trading - net -
Other income 6,791
Total other income 127,427
662,041
Other expenses
Administrative expenses 464,730
Provision against other assets - net -
Other charges 13,873
Total other expenses 478,603
Extra ordinary / unusual items -
Profit before taxation 183,438
Taxation
- Current 65,294
- Prior periods 4,866
- Deferred 11,165
81,325
Profit / (loss) after taxation 102,113
The profit and loss account of the Group's Islamic banking business for the six months ended June 30, 2017
is as follows:
Half Year
Ended
June 30,
2017
Half Year
Ended
June 30,
2016
22 ISLAMIC BANKING BUSINESS
June 30, December 31,
2017 2016
ASSETS
Cash and balances with treasury banks 3,045,272
1,509,804
Balances with other banks 3,686,763
2,750,998
Due from financial institutions -
-
Investments - net 7,771,648
5,769,675
Islamic financing and related assets - net 22.1
Note
24,972,965 16,172,727
Operating fixed assets 2,403,616
2,104,250
Deferred tax assets - net 9,595
-
Other assets - net 377,565
261,048
42,267,424
28,568,502
LIABILITIES
Bills payable 330,276
447,776
Due to financial institutions 8,078,654
2,785,650
Deposits and other accounts 22,727,975
14,279,436
Sub-ordinated loans -
-
Liabilities against assets subject to finance lease - - Deferred tax liabilities - net - 40,524 Other liabilities 917,095
749,243
32,054,000 18,302,629 NET ASSETS 10,213,424
10,265,873
REPRESENTED BY
Share capital 10,000,000
Reserves 26,444
Unappropriated profit 68,087
10,094,531
Surplus on revaluation of assets - net of tax 171,342
10,265,873
---------- (Rupees in '000) ----------
June 30, December 31,
2017 2016
22.1 Islamic financing and related assets - net
Murabaha financing 4,489,998 2,719,939
Inventory held under Murabaha 8,563,319 4,987,296
Advances against Murabaha 644,080 804,071
Murabaha under Islamic export refinance scheme 86,999 87,003
Advances against Murabaha under Islamic export refinance scheme - 299,650
Diminishing Musharakah 5,251,606 4,392,900
Advances against Diminishing Musharakah 1,497,861 1,222,733
Musharakah financing 260,050 -
Running Musharakah financing 1,953,028 -
Advances against Running Musharakah under
Islamic export refinance scheme 537,000 -
Net book value of assets in Ijarah under IFAS 2 1,049,458 1,243,897
Advances against Ijarah 96,435 42,508
Istisna financing under Islamic export refinance scheme 101,233 -
Staff finance 442,831 374,004
Islamic financing and related assets - gross 24,973,898 16,174,001
Provision against non performing Islamic
financing and related assets (933) (1,274)
Islamic financing and related assets - net of provision 24,972,965 16,172,727
---------- (Rupees in '000) ----------
Notes to the Consolidated Condensed Interim Financial Information (Un-audited)For the half year ended June 30, 2017
44 Half yearly Report 2017
MCB Bank Limited & Subsidiary CompaniesBank for Life
Notes to the Consolidated Condensed Interim Financial Information (Un-audited)For the half year ended June 30, 2017
45 Half yearly Report 2017
MCB Bank Limited & Subsidiary CompaniesBank for Life
10,000,000
32,388
92,511
10,124,899
88,525
10,213,424
818,067
370,094
447,973
(341)
-
-
(341)
448,314
22,576
34,084
299,611
5,467
375,037
823,351
777,374
-
909
778,283
45,068
14,914
-
436
15,350
29,718
13,299
-
-
The Group is operating 66 Islamic branches as at June 30, 2017 (December 31, 2016: 66 Branches). The statement of financial position of the Group's Islamic Banking Business as at June 30, 2017 is as follows:
--------- (Rupees in '000) ---------

23. GENERAL
- Figures have been rounded off to the nearest thousand of rupees unless otherwise stated.
-
24. NON-ADJUSTING EVENT
25. DATE OF AUTHORIZATION FOR ISSUE
No significant reclassifications have been made in this consolidated condensed interim financial information.
The Board of Directors in its meeting held on August 25, 2017 has announced cash dividend in respect of the half year
ended June 30, 2017 of Rs. 4.00 per share (June 30, 2016: Rs. 4.00 per share). This consolidated condensed interim
financial information for the half year ended June 30, 2017 does not include the effect of this appropriationwhich will be
accounted for subsequent to the period end.
This consolidatedcondensed interim financial informationwas authorized for issue by the Board of Directors of the Bank in
their meeting held on August 25, 2017.
Notes to the Consolidated Condensed Interim Financial Information (Un-audited)For the half year ended June 30, 2017
46 Half yearly Report 2017
MCB Bank Limited & Subsidiary CompaniesBank for Life
Samir Iqbal Saigol
President / CEO Imran Maqbool
Director Nor Hizam Bin Hashim
Director Muhammad Ali Zeb