Symmetries, angular distribution in psi'->gamma chi->gamma gamma psi


To Ann

Preface
This text is intended as a first course in the physics of nuclearreactors. It is designed to be appropriate as an introduction to reactortheory within an undergraduate nuclear engineering curriculum, aswell as for a stand-alone course that can be taken by undergraduatesin mechanical, electrical, or other fields of engineering who have nothad a previous background in nuclear energy. Likewise, it is plannedto be useful to practicing engineers from a variety of disciplineswhose professional responsibilities call for familiarity with the phy-sics of nuclear reactors.
Why a new book on reactor physics when a number of legacytexts are still in print? The better of these are well written, and sincethe fundamentals of the subject were already worked out at the timeof their publication, they remain useful today. My conviction, how-ever, is that for today’s undergraduates and practicing engineers anintroduction to reactor physics is better presented through both reor-ganizing and refocusing the material of earlier texts, and in doing thatemphasizing the characteristics of modern power reactors.
Earlier textbooks most commonly have begun with the relevantnuclear physics and neutron interactions, and then presented adetailed treatment of neutron slowing down and diffusion in homo-geneous mixtures of materials. Only in the latter parts of such textsdoes the analysis of the all-important time-dependent behavior offissionable systems appear, and the dependence of criticality on lat-tice structures of reactor cores typically is late in receiving attention.To some extent such a progression is necessary for the logical devel-opment of the subject. However, both in teaching undergraduates andin offering continuing education instruction for practicing engineers,I have found it advantageous to present a quantitative but moregeneral overview early in the text, while deferring where possiblemore detailed analysis, and also the more advanced mathematics thataccompanies it, to later. Thus I have moved the treatment of reactorkinetics forward, attempting to inculcate an understanding of thetime-dependent behavior of chain reactions, before undertaking thedetailed treatment of spatial power distributions, reflector saving,
xiii

and other topics dependent on the solution of the neutron diffusionequation. Likewise, the compositions of power reactor cores areincorporated into the discussion early on, emphasizing the interdis-ciplinary nature of neutronic and thermal design.
My intent in this text is to emphasize physical phenomena,rather than the techniques necessary to obtain highly accurateresults through advanced numerical simulation. At the time thelegacy texts appeared, computers were emerging as powerful toolsfor reactor analysis. As a result, the pedagogy in teaching reactortheory often emphasized the programming of finite differencing tech-niques, matrix solution algorithms, and other numerical methods inparallel with the analysis of the physical behavior of reactors, andthus extended the range of solutions beyond what could be obtainedwith paper and pencil. Now, however, high level programming lan-guages, such as Mathcad� or MATLAB�, allow students to solvetranscendental or linear systems of equations, to integrate differen-tial equations, and to perform other operations needed to solve thepreponderance of problems encountered in an introductory coursewithout programming the algorithms themselves. Concomitantly,the numerical simulation of reactor behavior has become a highlysophisticated enterprise; one to which I have devoted much of mycareer. But I believe that the numerical techniques are better left tomore advanced courses, after a basic understanding of the physicalbehavior of reactors has been gained. Otherwise the attempt to incor-porate the numerical approaches employed in reactor design dilutesthe emphasis on the physical phenomena that must first beunderstood.
By reorganizing and refocusing the materials along these lines,I hope to have broadened the audience for whom the text may beuseful, in particular those advancing their professional development,even while they may not be taking a formal reactor physics course ina university setting. My goal is that the book may be read andphysical insight gained, even though for lack of time or backgroundsome of the more mathematical sections are read and the resultsaccepted without following each step of the development in detail.With this in mind, many of the results are presented in graphical aswell as analytical form, and where possible I have included represen-tative parameters for the major classes of power reactors in order toprovide the student with some feel for the numbers.
Examples are integrated into the text’s narrative, and a selectionof problems is provided at the end of each chapter. The problems bothenforce the concepts that have been covered and in some casesexpand the scope of the material. The majority of the problems canbe solved analytically, or with the use of a pocket calculator. In somecases, where multiple solutions or graphical results are called for, useof the formula menu of a spreadsheet program, such as Excel
TM
,
xiv Preface

removes any drudgery that might otherwise be entailed. Selectedproblems require the use of one of the earlier mentioned high levelcomputing languages for the solution of transcendental or differentialequations. These are marked with an asterisk.
The preparation of this text would have been immensely moredifficult if not impossible without the help and encouragement ofmany friends, colleagues, and students. Advice and assistance fromthe staff of the Nuclear Engineering Division of Argonne NationalLaboratory have been invaluable in the text’s preparation. Won SikYang, in particular, has provided advice, reactor parameters, graphicalillustrations, and more as well—taking the time to proofread the draftmanuscript in its entirety. Roger N. Blomquist, Taek K. Kim, Chang-hoLee, Giuseppe Palmiotti, Micheal A. Smith, Temitope Taiwo, andseveral others have also pitched in. Bruce M. Bingman and his collea-gues at the Naval Reactors Program have also provided much appre-ciated help. Finally the feedback of Northwestern University studentshas been most helpful in evolving a set of class notes into this text.Most of all, Ann, my wife, has endured yet another book with graceand encouragement, while covering for me in carrying much morethan her share of our family’s responsibilities.
Preface xv

CHAPTER 1
Nuclear Reactions
1.1 Introduction
Albert Einstein’s E = mc2 relating energy to mass and the speed oflight arguably is the most celebrated formula in the modern world.And the subject of this text, nuclear power reactors, constitutes themost widespread economic ramification of this formula. The nuclearfission reactions that underlie power reactors—that is, reactors builtto produce electric power, propulsion for ships, or other forms ofenergy use—convert measurable amounts of mass to energy. Thusan appropriate place to begin a study of the physics of nuclear poweris with the underlying nuclear reactions. To understand the largeamounts of energy produced by those reactions in relation to themass of fuel consumed it is instructive to introduce our study bycomparing the production of nuclear power with that created byfossil fuels: coal, oil, or natural gas. Contrasting these energy sources,which result from chemical reactions, to nuclear energy assists inunderstanding the very different ratios of energy created to themasses of fuel consumed and the profound differences in the quan-tities of by-products produced.
Coal is the fossil fuel that has been most widely used for theproduction of electricity. Its combustion results predominantlyfrom the chemical reaction: CþO2 ! CO2. In contrast, energy pro-duction from nuclear power reactors is based primarily on thenuclear reaction neutronþuranium-235! fission. Energy releasesfrom both chemical and nuclear reactions is measured in electronvolts or eV, and it is here that the great difference between chemicaland nuclear reactions becomes obvious. For each carbon atom com-busted about 4.0 eV results, whereas for each uranium atom fissionedapproximately 200 million eV, or 200 MeV is produced. Thus roughly50 million times as much energy is released from the nuclear fissionof a uranium nucleus as from the chemical combustion of a carbonatom.
For comparison, consider two large electrical generation plants,each producing 1000 megawatts of electricity (i.e., 1000 MW(e)), one
1

burning coal and the other fissioning uranium. Taking thermalefficiency and other factors into account, the coal plant wouldconsume approximately 10,000 tons of fuel per day. The uraniumconsumed by the nuclear plant producing the same amount of elec-trical power, however, would amount to approximately 20 tons peryear. These large mass differences in fuel requirements account fordifferences in supply patterns. The coal plant requires a train of 100or more large coal cars arriving each day to keep it operating. Thenuclear power plant does not require a continual supply of fuel.Instead, after its initial loading, it is shut down for refueling onceevery 12 to 24 months and then only one-fifth to one-fourth of its fuelis replaced. Similar comparisons can be made between fossil andnuclear power plants used for naval propulsion. The cruises of oil-powered ships must be carefully planed between ports where theycan be refueled, or tanker ships must accompany them. In contrast,ships of the nuclear navy increasingly are designed such that one fuelloading will last the vessel’s planned life.
The contrast in waste products from nuclear and chemical reac-tions is equally as dramatic. The radioactive waste from nuclear plantsis much more toxic than most by-products of coal production, but thattoxicity must be weighed against the much smaller quantities of wasteproduced. If reprocessing is used to separate the unused uranium fromthe spent nuclear fuel, then the amount of highly radioactive wasteremaining from the 1000-MW(e) nuclear plant amounts to substan-tially less than 10 tons per year. In contrast, 5% or more of the coalburned becomes ash that must be removed and stored in a landfill orelsewhere at the rate of more than five 100-ton-capacity railroad carsper day. Likewise it may be necessary to prevent nearly 100 tons ofsulfur dioxide and lesser amounts of mercury, lead, and other impu-rities from being released to the environment. But the largest environ-mental impact from burning fossil fuels may well be the globalwarming caused by the thousands of tons of CO2 released to theatmosphere each day by a 1000-MW(e) coal-fired power plant.
1.2 Nuclear Reaction Fundamentals
While an in-depth understanding of the physics of the nucleus can be aprodigious undertaking, a relatively simple model of the nucleus willsuffice for our study of nuclear power reactors. The standard model ofan atom consists of a very dense positively charged nucleus, sur-rounded by negatively charged orbiting electrons. Compared to thesize of atoms, with diameters of roughly 10�8 cm, the size of thenucleus is very small, of the order of 10�12 cm. For modeling purposeswe consider a nucleus to be made up of N neutrons and Z protons.Both are referred to as nucleons, thus the nucleus has NþZ nucleons.
2 Fundamentals of Nuclear Reactor Physics
The number of protons, Z, is the atomic number; it determines anatom’s chemical properties, while NþZ is its atomic weight. Nucleiwith the same atomic number but different atomic weights, due todifferent numbers of neutrons, are isotopes of the same chemicalelement. We refer to a nucleus as NþZ
ZX, where X is the symbol usedin the periodic table to designate the chemical element.
Reaction Equations
Nuclear reactions are written as
Aþ B! CþD: ð1:1Þ
An example of a nuclear reaction is
42Heþ 6
3Li! 94Beþ 1
1H: ð1:2Þ
This equation does not tell us how likely the reaction is to take place,or whether it is exothermic or endothermic. It does, however, illus-trate two conservation conditions that always hold: conservation ofcharge (Z) and conservation of nucleons (NþZ). Conservation ofcharge requires that the sum of the subscripts on the two sidesof the equation be equal, in this case 2þ 3 = 4þ 1. Conservation ofnucleons requires that the superscripts be equal, in this case4þ 6 = 9þ 1.
Nuclear reactions for the most part take place in two stages. Firsta compound nucleus is formed from the two reactants, but thatnucleus is unstable and so divides, most often into two components.This being the case, we might write Eq. (1.2) in two stages:
12Heþ 6
3Li! 105B! 9
4Beþ 11H: ð1:3Þ
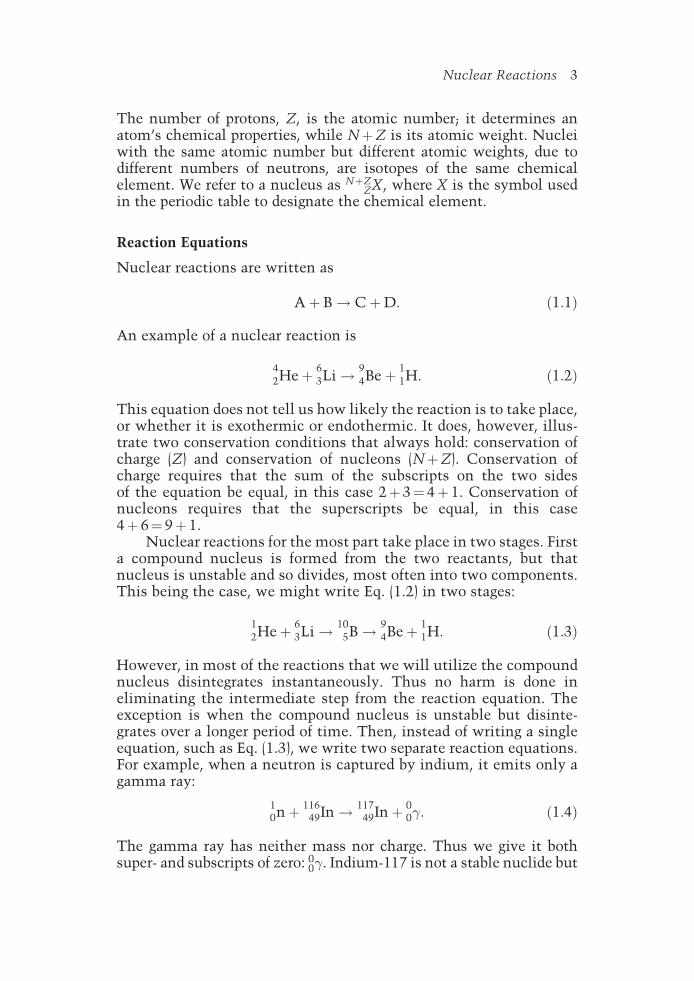
However, in most of the reactions that we will utilize the compoundnucleus disintegrates instantaneously. Thus no harm is done ineliminating the intermediate step from the reaction equation. Theexception is when the compound nucleus is unstable but disinte-grates over a longer period of time. Then, instead of writing a singleequation, such as Eq. (1.3), we write two separate reaction equations.For example, when a neutron is captured by indium, it emits only agamma ray:
10nþ 116
49In! 11749Inþ 0
0�: ð1:4Þ
The gamma ray has neither mass nor charge. Thus we give it bothsuper- and subscripts of zero: 0
0�. Indium-117 is not a stable nuclide but
Nuclear Reactions 3

rather undergoes radioactive decay, in this case the indium decays totin by emitting an electron, and an accompanying gamma ray:
11749In! 117
50Snþ 0�1eþ 0
0�: ð1:5Þ
The electron is noted by 0�1e, with a subscript of �1, since is has the
opposite charge of a proton and a superscript of zero since its mass isonly slightly more than one two-thousandths of the mass of a protonor neutron. A rudimentary way of looking at the nuclear model wouldbe to view the electron emission as resulting from one of the neutronswithin the nucleus decomposing into a proton and an electron.
Decay reactions such as Eq. (1.5) take place over time and arecharacterized by a half-life, referred to as t1=2 . Given a large numberof such nuclei, half of them will decay in a time span of t1=2 , three-fourths of them in 2t1=2 , seven-eighths of them in 3t1=2 , and so on.The half-life of indium-117 is 54 minutes. Half-lives vary over manyorders of magnitude, depending on the nuclide in question. Someradioactive materials with very long half-lives appear naturally inthe surface of the earth. For example,
23492U! 230
90Thþ 42He ð1:6Þ
with t1=2 = 2.45� 105 years. We will return to the mathematicaldescription of half-lives and radioactive decay later in the chapter.
Gamma rays are sometimes omitted from reaction equations;since they carry neither mass nor charge they do not affect the nucleonand charge balances that we have thus far discussed. Gamma rays,however, are important in the energy conservation law that we willdiscuss subsequently. Their role may be understood as follows. Fol-lowing a nuclear collision, reaction, or radioactive decay the nucleusgenerally is left in an excited state. It then relaxes to its ground orunexcited state by emitting one or more gamma rays. These rays areemitted at distinct energies, corresponding to the quantum energylevels of the nucleus. This nuclear phenomenon is analogous to thesituation in atomic physics where an orbital electron in an excitedstate emits a photon as it drops to its ground state. Both gamma raysand photons are electromagnetic radiation. However, they differgreatly in energy. For while the photons emitted from the relaxationof orbital electrons typically are in the electron volt range, the energiesof gamma rays are measured in millions of electron volts.
One remaining nuclear radiation, which we have not mentioned, isthe neutrino. In conjunction with electron emission a neutrino is cre-ated, and carries off a part of the reaction energy. Since neutrinos do notinteract with matter to any significant extent, the energy they carry awayis for all practical purposes lost. However, they must be included in theenergy conservation considerations of the following section.
4 Fundamentals of Nuclear Reactor Physics

Notation
Before proceeding, the introduction of some shorthand notation isuseful. Note from Eqs. (1.5) and (1.6) that the helium nucleus and theelectron are both emitted from the decay of radionuclides. Whenemitted from nuclei these are referred to as alpha and beta particles,respectively. A nearly universal convention is to simplify the nota-tion by simply referring to them as � and � particles. In like mannersince gamma rays carry neither charge nor mass, and the mass andcharge of neutrons and protons are simple to remember, we refer tothem simply as �, n, and p, respectively. In summary, we will oftenuse the simplifications:
42He) �
0�1 e) �
00� ) �
10n) n
11H) p: ð1:7Þ
Likewise the notation for two important isotopes of hydrogen,deuterium and tritium, is also simplified as 2
1H) D and 31H) T.
Instead of using the form of Eq. (1.1) we may write reactionequations more compactly as AðB;CÞD, where the nuclei of smalleratomic number are usually the ones placed inside the parentheses.Thus, for example,
10nþ 14
7N! 146Cþ 1
1p ð1:8Þ
may be compacted to147Nðn; pÞ14
6C or alternately as147N �!ðn;pÞ 14
6C.
Likewise radioactive decay such as in Eq. (1.5) is often expressed as11749In �!� 117
50Sn, where in all cases it is understood that some energy is
likely to be carried away as gamma rays and neutrinos.
Energetics
Einstein’s equation for the equivalence between mass and energygoverns the energetics of nuclear reactions:
Etotal ¼mc2; ð1:9Þ
where Etotal, m, and c represent the total energy of a nucleus, its mass,and the speed of light, respectively. The mass in this equation, how-ever, depends on the particles speed relative to the speed of light:
m ¼m0
� ffiffiffiffiffiffiffiffiffiffiffiffiffiffiffiffiffiffiffiffiffiffi1� ðv=cÞ2
q; ð1:10Þ
where m0 is the rest mass, or the mass of the particle when its speedv ¼ 0. For situations in which v� c, we may expand the square rootterm in powers of ðv=cÞ2,
Nuclear Reactions 5

m ¼m0 1þ 1=2ðv=cÞ2 þOðv=cÞ4h i
ð1:11Þ
and retain only the first two terms. Inserting this result into Eq. (1.9),we have
Etotal ¼m0c2 þ 1=2 m0v2: ð1:12Þ
The first term on the right is the rest energy, and the second is thefamiliar form of the kinetic energy. The neutrons found in reactors, aswell as the nuclei, will always be nonrelativistic with v� c allowingthe use of Eq. (1.12). We hereafter use E to designate kinetic energy.Thus for a nonrelativistic particle with rest mass MX, we have
E ¼ 1=2 MXv2: ð1:13Þ
Some high-energy electrons, however, may travel at speeds that area substantial fraction of the speed of light, and in these cases the relati-vistic equations must be used. We then must determine Etotal from Eqs.(1.9) and (1.10) and take E ¼ Etotal �m0c2. Finally gamma rays have nomass and travel at the speed of light. Their energy is given by
E ¼ h� ð1:14Þ
where h is Plank’s constant and � is their frequency.We are now prepared to apply the law that total energy must be
conserved. For the reaction of Eq. (1.1) this is expressed as
EA þMAc2 þ EB þMBc2 ¼ EC þMCc2 þ ED þMDc2; ð1:15Þ
where EA and MA are the kinetic energy and rest mass of A, andlikewise for B, C, and D. If one of the reactants is a gamma ray, thenfor it EþMc2 is replaced by h� since it carries no mass. The Q of areaction, defined as
Q ¼ EC þ ED � EA � EB; ð1:16Þ
determines whether the reaction is exothermic or endothermic. Witha positive Q kinetic energy is created, and with negative Q it is lost.Equation (1.15) allows us to write Q in terms of the masses as
Q ¼ MA þMB �MC �MDð Þc2: ð1:17Þ
A positive Q indicates an exothermic reaction, which creates kineticenergy and results in a net loss of rest mass. Conversely, endothermicreactions result in a net increase in rest mass. Strictly speaking
6 Fundamentals of Nuclear Reactor Physics

these same arguments apply to chemical as to nuclear reactions.However, when one is dealing with the energy changes of the order ofa few eV in chemical reactions, as opposed to changes of MeV magnitudesin nuclear reactions, the changes in mass are much too small to measure.
1.3 The Curve of Binding Energy
The foregoing conservation arguments do not indicate which nuclearreactions are likely to be exothermic or endothermic. We mustexamine mass defects and binding energies to understand whichnuclear reactions produce rather than absorb energy. If we add themasses of the Z protons and N neutrons that make up a nucleus, sayof element X, we find that the weights of these constituent massesexceed the weight MX of the nucleus as a whole. The difference isdefined as the mass defect:
D ¼ Z MP þN MN �MX; ð1:18Þ
which is positive for all nuclei. Thus the nucleus weighs less thanthe neutrons and protons from which it is composed. Multiplyingthe mass defect by the square of the speed of light then yieldsunits of energy: Dc2. This is the binding energy of the nucleus. Wemay interpret it as follows. If the nucleus could be pulled apartand separated into its constituent protons and neutrons, therewould be an increase in mass by an amount equal to the massdefect. Thus an equivalent amount of energy—the bindingenergy—would need to be expended to carry out this disassembly.All stable nuclei have positive binding energies holding themtogether. If we normalize the binding energy to the number ofnucleons, we have
Dc2�ðN þ ZÞ: ð1:19Þ
This quantity—the binding energy per nucleon—provides a mea-sure of nuclear stability; the larger it is the more stable the nucleuswill be.
Figure 1.1 is the curve of binding energy per nucleon. At lowatomic mass the curve rises rapidly. For larger atomic weights, above40 or so, the curve becomes quite smooth reaching a maximum ofslightly less than 9 MeV and then gradually decreases. Exothermicreactions are those in which result in reaction products withincreased binding energy, going from less to more stable nuclei.Two classes of such reaction are candidates for energy production:fusion reactions in which two light weight nuclei combine to form
Nuclear Reactions 7

a heaver nuclei, higher on the binding energy curve, and fissionreactions in which a heavy nucleus splits to form two lighter nuclei,each with a higher binding energy per nucleon.
1.4 Fusion Reactions
Equation (1.2) is an example of a charged particle reaction, since bothnuclei on the left have atomic numbers greater than zero. Suchreactions are difficult to bring about, for after the orbiting electronsare stripped from the nuclei, the positive charges on the nucleistrongly repel one another. Thus to bring about a reaction such asEq. (1.2), the nuclei must collide at high speed in order to overpowerthe coulomb repulsion and make contact. The most common meth-ods for achieving such reactions on earth consist of using particleaccelerations to impart a great deal of kinetic energy to one of theparticles and then slam it into a target made of the second material.An alternative is to mix the two species and bring them to a very hightemperature, where they become a plasma. Since the average kineticenergy of a nucleus is proportional to its absolute temperature, if highenough temperatures are reached the electrical repulsion of thenuclei is overpowered by the kinetic energy, and a thermonuclearreaction results.
5000
2
4
6
8
10
100
Mass number
2H
6Li
4He
12C238U
16O
Bin
ding
ene
rgy
per
nucl
eon,
MeV
150 200 250
FIGURE 1.1 Curve of binding energy per nucleon.
8 Fundamentals of Nuclear Reactor Physics

Two reactions based on fusing isotopes of hydrogen have beenwidely considered as a basis for energy production, deuterium–deuterium and deuterium–tritium:
D-D2
1Hþ 2
1H! 3
2Heþ 1
0nþ 3:25 MeV;
2
1Hþ 2
1H! 3
1Hþ 1
1Hþ 4:02 MeV;
D-T2
1Hþ 3
1H! 4
2Heþ 1
0nþ 17:59 MeV:
ð1:20Þ
The difficulty is that these are charged particle reactions. Thus for thenuclei to interact the particles must be brought together with very highkinetic energies in order to overcome the coulomb repulsion of thepositively charged nuclei. As a practical matter, this cannot be accom-plished using a particle accelerator, for the accelerator would use muchmore energy than would be produced by the reaction. Rather, meansmust be found to achieve temperatures comparable to those found inthe interior of the sun. For then the particles’ heightened kinetic energywould overcome the coulomb barrier and thermonuclear reactionswould result. While thermonuclear reactions are commonplace in theinterior of stars, on earth the necessary temperatures have beenobtained to date only in thermonuclear explosions and not in the con-trolled manner that would be needed for sustained power production.
Long-term efforts continue to achieve controlled temperatureshigh enough to obtain power from fusion reactions. Investigatorsplace most emphasis on the D-T reaction because it becomes feasibleat lower temperatures than the D-D reaction. The D-T reaction,however, has the disadvantage that most of the energy releaseappears as the kinetic energy of 14-MeV neutrons, which damagewhatever material they impact and cause it to become radioactive.
We will not consider fusion energy further here. Rather, we willproceed to fission reactions, in which energy is released by splitting aheavy nucleus into two lighter ones that have greater binding ener-gies per nucleon. Neutrons may initiate fission. Thus there is norequirement for high temperatures, since there is no electrical repul-sion between the neutron and the nucleus. Figuratively speaking, theneutron may slide into the nucleus without coulomb resistance.
1.5 Fission Reactions
Consider now a fission reaction for uranium-235 as shown in Fig. 1.2.From the reaction come approximately 200 MeV of energy, two orthree neutrons, two lighter nuclei (called fission fragments), and anumber of gamma rays and neutrinos. The fission fragments undergoradioactive decay producing additional fission products. The energy
Nuclear Reactions 9

produced from fission, the neutrons, and the fission products all playcritical roles in the physics of nuclear power reactors. We considereach of them in turn.
Energy Release and Dissipation
The approximately 200 MeV of energy released by a fission reactionappears as kinetic energy of the fission fragments, neutrons, andgamma rays, as well as that from the beta particles, gamma rays,and neutrinos emitted as the fission products undergo radioactivedecay. This kinetic energy is dissipated to heat nearly instanta-neously as the reaction products interact with the surroundingmedia. The forms that the interactions take, however, differ signifi-cantly according to whether the particles are electrically charged orneutral.
The fission fragments are highly charged, for the high speeds atwhich they emerge from fission cause electrons to be ripped fromtheir shells as they encounter surrounding atoms. Charged particlesinteract strongly with the surrounding atoms or molecules travelingat high speed, causing them to ionize. Creation of ion pairs requiresenergy, which is lost from the kinetic energy of the charged particlecausing it to decelerate and ultimately come to rest. The positive ionsand free electrons created by the passage of the charged particle willsubsequently reunite, liberating energy in the form of heat. Thedistance required to bring the particle to rest is referred to as itsrange. The range of fission fragments in solids amounts to only afew microns, and thus most of the energy of fission is converted toheat very close to the point of fission. Other charged particles, suchas the alpha and beta particles emitted in radioactive decay, behaveanalogously, rapidly decelerating and coming to rest; for lightercharged particles the ranges are somewhat longer.
Neutron U235 U236
sec
U236
Fissioning
Fissionfragment
Neutron
Neutron
Neutron
Fission fragment
110,000,000
Gamma radiation
FIGURE 1.2 A fission reaction.
10 Fundamentals of Nuclear Reactor Physics

Neutrons, gamma rays, and neutrinos are neutral and behave quitedifferently. They are affected neither by the negative charge of electronssurrounding a nucleus nor the electric field caused by a positivelycharged nucleus. They thus travel in straight lines until makinga collision, at which point they scatter or are absorbed. If absorbed,they cease to exist, with their energy dissipated by the collision. If theyscatter, they change direction and energy, and continue along anotherstraight line. The flight paths between collisions amount to very largenumbers of interatomic distances. With neutrinos these distancesare nearly infinite; for neutrons and gamma rays traveling in solidsthey are typically measured in centimeters. Neutrons scatter only fromnuclei, whereas gamma rays are scattered by electrons as well. Exceptat very low energies, a neutron will impart significant kinetic energy tothe nucleus, causing it to become striped of orbital electrons and there-fore charged. The electrons that gain kinetic energy from gamma raycollisions, of course, are already charged. In either case the collisionpartner will decelerate and come to rest in distances measured inmicrons, dissipating its energy as heat very close to the collision site.
More than 80% of the energy released by fission appears as thekinetic energy of the fission fragments. The neutrons, beta particles,and gamma and neutrino radiation account for the remainder. Theenergy of the neutrinos, however, is lost because they travel nearlyinfinite distances without interacting with matter. The remainder ofthe energy is recovered as heat within a reactor. This varies slightlybetween fissionable isotopes; for uranium-235 it is approximately193 MeV or � ¼ 3:1�10�11 J/fission.
The difference in energy dissipation mechanisms betweencharged and neutral particles also causes them to create biologicalhazards by quite different mechanisms. The alpha and beta radiationemitted by fission products or other radioisotopes are charged parti-cles. They are referred to as nonpenetrating radiation since theydeposit their energy over a very short distance or range. Alpha orbeta radiation will not penetrate the skin and therefore is not asignificant hazard if the source is external to the body. They posemore serious problems if radioisotopes emitting them are inhaled oringested. Then they can attack the lungs and digestive tract, andother organs as well, depending on the biochemical properties ofthe radioisotope. Radiostrontium, for example, collects in the bonemarrow and does its damage there, whereas for radioiodine thethyroid gland is the critical organ. In contrast, since neutral particles(neutrons and gamma rays) travel distances measured in centimetersbetween collisions in tissue, they are primarily a hazard fromexternal sources. The damage neutral particles do is more uniformlydistributed over the whole body, resulting from the ionization ofwater and other tissue molecules at the points where neutrons col-lide with nuclei or gamma rays with electrons.
Nuclear Reactions 11

Neutron Multiplication
The two or three neutrons born with each fission undergo a num-ber of scattering collisions with nuclei before ending their lives inabsorption collisions, which in many cases cause the absorbingnucleus to become radioactive. If the neutron is absorbed in afissionable material, frequently it will cause the nucleus to fissionand give birth to neutrons of the next generation. Since this pro-cess may then be repeated to create successive generations ofneutrons, a neutron chain reaction is said to exist. We characterizethis process by defining the chain reaction’s multiplication, k, asthe ratio of fission neutrons born in one generation to those bornin the preceding generation. For purposes of analysis, we alsodefine a neutron lifetime in such a situation as beginning withneutron emission from fission, progressing—or we might sayaging—though a succession of scattering collisions, and endingwith absorption.
Suppose at some time, say t = 0, we have no neutrons producedby fission; we shall call these the zeroth generation. Then the firstgeneration will contain kno neutrons, the second generation k2no,and so on: the ith generation will contain kino. On average, the timeat which the ith generation is born will be t ¼ i � l, where l is theneutron lifetime. We can eliminate i between these expressions toestimate the number of neutrons present at time t:
nðtÞ ¼ nokt=l: ð1:21Þ
Thus the neutron population will increase, decrease, or remain thesame according to whether k is greater than, less than, or equal toone. The system is then said to be supercritical, subcritical, or criti-cal, respectively.
A more widely used form of Eq. (1.21) results if we limit ourattention to situations where k is close to one: First note that theexponential and natural logarithm are inverse functions. Thus forany quantity, say x, we can write x ¼ exp½lnðxÞ� Thus with x ¼ kt=l
we may write Eq. (1.21) as
nðtÞ ¼ no exp½ðt=lÞ lnðkÞ�: ð1:22Þ
If k is close to one, that is, k� 1j j � 1, we may expand lnðkÞ about 1as lnðkÞ � k� 1, to yield:
nðtÞ ¼ no exp½ðk� 1Þt=l�: ð1:23Þ
Thus the progeny of the neutrons created at time zero behavesexponentially as indicated in Fig. 1.3. Much of the content of the
12 Fundamentals of Nuclear Reactor Physics

following chapters deals with the determination of the multiplica-tion, how it depends on the composition and size of a reactor, andhow the time-dependent behavior of a chain reaction is affected bythe presence of the small fraction of neutrons whose emissionfollowing fission is delayed. Subsequently we will examine changesin multiplication caused by changes in temperature, fuel depletion,and other factors central to the design and operation of powerreactors.
Fission Products
Fission results in many different pairs of fission fragments. In mostcases one has a substantially heavier mass than the other. For exam-ple, a typical fission reaction is
nþ 235
92U! 140
54Xeþ 94
38Srþ 2nþ 200 MeV: ð1:24Þ
Fission fragments are unstable because they have neutron toproton ratios that are too large. Figure 1.4, which plots neutronsversus protons, indicates an upward curvature in the line of stablenuclei, indicating that the ratio of neutrons to protons increasesabove 1:1 as the atomic number becomes larger (e.g., the prominentisotopes of carbon and oxygen are 12
6C and 168O but for lead and
thorium they are 20782Pb and 232
90Th). As a nucleus fissions the ratio ofneutrons to protons would stay the same in the fission fragments—as indicated by the dashed line in Fig. 1.4—were it not for the 2 to3 neutrons given off promptly at the time of fission. Even then, thefission fragments lie above the curve of stable nuclei. Less than 1%
0 0.5 10
1
2 A
B
C
n(t )
/n(o
)
3
t
FIGURE 1.3 Neutron population versus time in (A) supercritical system,(B) critical system, (C) subcritical system.
Nuclear Reactions 13

of these fragments decay by the delayed emission of neutrons. Thepredominate decay mode is through beta emission, accompanied byone or more gamma rays. Such decay moves the resulting nuclidetoward the line of stable nuclei as the arrows in Fig. 1.4 indicate.However, more than one decay is most often required to arrive atthe range of stable nuclei. For the fission fragments in Eq. (1.24) wehave
140
54Xe �!� 140
55Cs �!� 140
56Ba �!� 140
57La �!� 140
58Ce ð1:25Þ
and
94
38Sr �!� 94
39Y �!� 94
40Zr: ð1:26Þ
Each of these decays has a characteristic half-life. With some notableexceptions the half-lives earlier in the decay chain tend to be shorterthan those occurring later. The fission fragments taken together withtheir decay products are classified as fission products.
40
Number of protons (Z )
A – Z = Z
Fissionfragments
Stablenuclides
Num
ber
of n
eutr
ons
(A–Z
)
2000
20
40
60
80
100
120
140
60 80 100
FIGURE 1.4 Fission fragment instability.
14 Fundamentals of Nuclear Reactor Physics

Equation (1.24) shows only one example of the more than 40different fragment pairs that result from fission. Fission fragmentshave atomic mass numbers between 72 and 160. Figure 1.5 showsthe mass frequency distribution for uranium-235, which is typicalfor other fissionable materials provided the neutrons causing fis-sion have energies of a few eV or less. Nearly all of the fissionproducts fall into two broad groups. The light group has massnumbers between 80 and 110, whereas the heavy group has massnumbers between 125 and 155. The probability of fissions yieldingproducts of equal mass increases with the energy of the incidentneutron, and the valley in the curve nearly disappears for fissionscaused by neutrons with energies in the tens of MeV. Becausevirtually all of the 40 fission product pairs produce characteristicchains of radioactive decay from successive beta emissions, morethan 200 different radioactive fission products are produced in anuclear reactor.
Roughly 8% of the 200 MeV of energy produced from fission isattributable to the beta decay of fission products and the gamma raysassociated with it. Thus even following shutdown of a chain reaction,radioactive decay will continue to produce significant amounts ofheat. Figure 1.6 shows the decay heat for a reactor that has operated ata power P for a long time. The heat is approximated by the Wigner-Way formula as
70 90 11010–5
10–4
10–3
10–2
10–1
10
1
Mass numberA
Fis
sion
yie
ld, p
erce
nt
130 150 170
FIGURE 1.5 Fission product yields for uranium-235.
Nuclear Reactions 15

PdðtÞ ¼ 0:0622 Po t�0:2 � ðto þ tÞ�0:2h i
ð1:27Þ
where
PdðtÞ= power generation due to beta and gamma rays,Po = power before shutdown,to= time, in seconds, of power operation before shutdown,t = time, in seconds, elapsed since shutdown.
As a result of decay heat, cooling must be provided to prevent over-heating of reactor fuel for a substantial period of time followingpower plant shutdown.
1.6 Fissile and Fertile Materials
In discussing nuclear reactors we must distinguish between twoclasses of fissionable materials. A fissile material is one that willundergo fission when bombarded by neutrons of any energy. Theisotope uranium-235 is a fissile material. A fertile material is onethat will capture a neutron, and transmute by radioactive decay into afissile material. Uranium-238 is a fertile material. Fertile isotopesmay also undergo fission directly, but only if impacted by a high-energy neutron, typically in the MeV range. Thus fissile and fertilematerials together are defined as fissionable materials. Fertile mate-rials by themselves, however, are not capable of sustaining a chainreaction.
Uranium-235 is the only naturally occurring fissile material.Moreover, it constitutes only 0.7% of natural uranium. Except fortrace amounts of other isotopes, uranium-238 constitutes the
1021010.1
0.1
0.01
1.0
10.0
103
Time (sec)
Per
cent
pow
er
104
1 hour 1 day 1 wk 1 mon 1 yr10 yrs
105 106 107 108 109
FIGURE 1.6 Heat produced by decay of fission products.
16 Fundamentals of Nuclear Reactor Physics
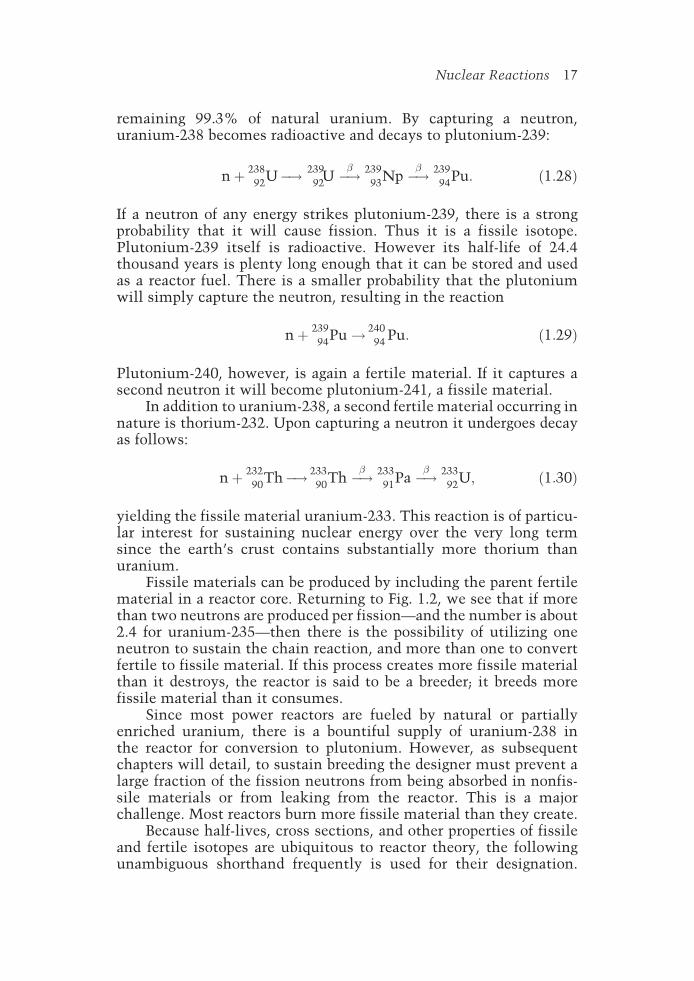
remaining 99.3% of natural uranium. By capturing a neutron,uranium-238 becomes radioactive and decays to plutonium-239:
nþ 238
92U�! 239
92U �!� 239
93Np �!� 239
94Pu: ð1:28Þ
If a neutron of any energy strikes plutonium-239, there is a strongprobability that it will cause fission. Thus it is a fissile isotope.Plutonium-239 itself is radioactive. However its half-life of 24.4thousand years is plenty long enough that it can be stored and usedas a reactor fuel. There is a smaller probability that the plutoniumwill simply capture the neutron, resulting in the reaction
nþ 239
94Pu! 240
94Pu: ð1:29Þ
Plutonium-240, however, is again a fertile material. If it captures asecond neutron it will become plutonium-241, a fissile material.
In addition to uranium-238, a second fertile material occurring innature is thorium-232. Upon capturing a neutron it undergoes decayas follows:
nþ 232
90Th�! 233
90Th �!� 233
91Pa �!� 233
92U; ð1:30Þ
yielding the fissile material uranium-233. This reaction is of particu-lar interest for sustaining nuclear energy over the very long termsince the earth’s crust contains substantially more thorium thanuranium.
Fissile materials can be produced by including the parent fertilematerial in a reactor core. Returning to Fig. 1.2, we see that if morethan two neutrons are produced per fission—and the number is about2.4 for uranium-235—then there is the possibility of utilizing oneneutron to sustain the chain reaction, and more than one to convertfertile to fissile material. If this process creates more fissile materialthan it destroys, the reactor is said to be a breeder; it breeds morefissile material than it consumes.
Since most power reactors are fueled by natural or partiallyenriched uranium, there is a bountiful supply of uranium-238 inthe reactor for conversion to plutonium. However, as subsequentchapters will detail, to sustain breeding the designer must prevent alarge fraction of the fission neutrons from being absorbed in nonfis-sile materials or from leaking from the reactor. This is a majorchallenge. Most reactors burn more fissile material than they create.
Because half-lives, cross sections, and other properties of fissileand fertile isotopes are ubiquitous to reactor theory, the followingunambiguous shorthand frequently is used for their designation.
Nuclear Reactions 17

Their properties are designated by the last digits of their atomiccharge, and atomic mass: Thus properties of fissionable elementabcdeX are simply designated sub- or superscripts ‘‘ec.’’ For example,
23290Th! 02; 235
92U! 25; 23892U! 28; and 239
94Pu! 49.One question remains: Where do the neutrons come from to
initiate a chain reaction? Some neutrons occur naturally, as the resultof very high-energy cosmic rays colliding with nuclei and causingneutrons to be ejected. If no other source were present these wouldtrigger a chain reaction. Invariably, a stronger and more reliable sourceis desirable. Although there are a number of possibilities, probablythe most widely used is the radium beryllium source. It combinesthe alpha decay of a naturally occurring radium isotope
226
88Ra �!� 222
86Rn; ð1:31Þ
which has a half-life of 1600 years with the reaction
9
4Be �!ð�;nÞ
12
6C ð1:32Þ
to provide the needed neutrons.
1.7 Radioactive Decay
To understand the behavior of fission products, the rates of conver-sion of fertile to fissile materials, and a number of other phenomenarelated to reactor physics we must quantify the behavior of radio-active materials. The law governing the decay of a nucleus states thatthe rate of decay is proportional to the number of nuclei present. Eachradioisotope—that is, an isotope that undergoes radioactive decay—has a characteristic decay constant �. Thus if the number of nucleipresent at time t is NðtÞ, the rate at which they decay is
d
dtNðtÞ ¼ ��NðtÞ: ð1:33Þ
Dividing by NðtÞ, we may integrate this equation from time zero to t,to obtain
Z NðtÞ
Nð0ÞdN=N ¼ ��
Z t
0dt; ð1:34Þ
where Nð0Þ is the initial number of nuclei. Noting that dN=N ¼d lnðNÞ, Eq. (1.34) becomes
18 Fundamentals of Nuclear Reactor Physics

ln NðtÞ=Nð0Þ½ � ¼ ��t; ð1:35Þ
yielding the characteristic exponential rate of decay,
NðtÞ ¼ Nð0Þ expð��tÞ: ð1:36Þ
Figure 1.7 illustrates the exponential decay of a radioactivematerial.
The half-life, t1=2, is a more intuitive measure of the times over
which unstable nuclei decay. As defined earlier, t1=2is the length
of time required for one-half of the nuclei to decay. Thus it maybe obtained by substituting Nðt1=2
Þ ¼ Nð0Þ=2 into Eq. (1.35) to yieldlnð1=2Þ ¼ �0:693 ¼ ��t1=2
, or simply
t1=2¼ 0:693=�: ð1:37Þ
A second, less-used measure of decay time is the mean time to decay,defined by
�t ¼Z 1
0tNðtÞdt
,Z 10
NðtÞdt ¼ 1=�: ð1:38Þ
Before proceeding, a word is in order concerning units.Normally we specify the strength of a radioactive source in termsof curies (Ci) where 1 Ci is defined as 3.7�1010 disintegrations persecond, which is the rate decay of one gram of radium-226; thebecquerel (Bq), defined as one disintegration per second, has alsocome into use as a measure of radioactivity. To calculate thenumber of nuclei present we first note that Avogadro’s number,
0
0.25
0.5
0.75
1
N (t
)/ N
(0 )
λt0 1 2 3 4
FIGURE 1.7 Exponential decay of a radionuclide.
Nuclear Reactions 19

No ¼ 0:6023 � 1024, is the number of atoms in one gram molecularweight, and thus the total number of atoms is just mNo=A wherem is the mass in grams and A is the atomic mass of the isotope. Theconcentration in atoms/cm3 is then �No=A, where � is the densityin grams/cm3.
Saturation Activity
Radionuclides are produced at a constant rate in a number of situa-tions. For example, a reactor operating at constant power producesradioactive fission fragments at a constant rate. In such situations,we determine the time dependence of the inventory of an isotopeproduced at a rate of Ao nuclei per unit time by adding a source termAo to Eq. (1.33):
d
dtNðtÞ ¼ Ao � �NðtÞ: ð1:39Þ
To solve this equation, multiply both sides by an integrating factor ofexpð�tÞ. Then utilizing the fact that
d
dtNðtÞ expð�tÞ½ � ¼ d
dtNðtÞ þ �NðtÞ
� �expð�tÞ; ð1:40Þ
we have
d
dtNðtÞ expð�tÞ½ � ¼ Ao expð�tÞ: ð1:41Þ
Now if we assume that initially there are no radionuclides present,that is, Nð0Þ ¼ 0, we may integrate this equation between 0 and t andobtain
�NðtÞ ¼ Ao 1� expð��tÞ½ �; ð1:42Þ
where �NðtÞ is the activity measured in disintegrations per unit time.Note that initially the activity increases linearly with time, since for�t�1, expð��tÞ� 1��t. After several half-lives, however, the expo-nential term becomes vanishingly small, and the rate of decay is thenequal to the rate of production or �Nð1Þ ¼ Ao. This is referred to asthe saturation activity. Figure 1.8 illustrates the buildup to saturationactivity given by Eq. (1.42).
To illustrate the importance of saturation activity, consideriodine-131 and strontium-90, which are two of the more importantfission products stemming from the operation of power reactors.Assume a power reactor produces them at rates of 0:85 � 1018 nuclei/s
20 Fundamentals of Nuclear Reactor Physics

and 1:63 � 1018 nuclei/s, respectively, and ask how many curies ofactivity each produces after 1 week, 1 month, and 1 year of operation.
The two isotopes have half-lives of 8.05 days and 10,628 days. Thusfrom Eq. (1.37) we have �I ¼ 0:0861/day, and �Sr ¼ 6:52 � 10�5/day. Toexpress the activity in curies we divide Eq. (1.42) by 3:7 � 1010 nuclei/s.Thus AI ¼ 2:30 � 107Ci, and ASr ¼ 4:40 � 107Ci. We take t = 7 days, 30days, and 365 days (i.e., 1 week, 1 month, and 1 year) in Eq. (1.42) andobtain:
�INIð7Þ ¼ 10:4 � 106 Ci; �SrNSrð7Þ ¼ 2:01 � 103 Ci�INIð30Þ ¼ 21:2 � 106 Ci; �SrNSrð30Þ ¼ 8:61 � 104 Ci
�INIð365:25Þ ¼ 23:0 � 106 Ci; �SrNSrð365:25Þ ¼ 1:04 � 106 Ci:
The shorter half-lived iodine-131 has nearly reached saturation atthe end of 1 month, and remains constant thereafter with a value thatis proportional to the reactor power. In contrast the activity ofstrontium-90, with a much longer half-life, increases linearly withtime and will continue to do so for a number of years. The plot of activityversus �t shown in Fig. 1.8 illustrates these effects more clearly. At t = 1year, �Srt¼ 6:52 � 10�5 � 365:25¼ 0:0238�1, which is far short of thetime required to reach saturation. Thus over the first year—and forsubstantially longer—the inventory of strontium-90 will grow in propor-tion to the total energy that the reactor has produced since start-up. Incontrast, at 1 month �It ¼ 0:0861 � 30 ¼ 2:58 and thus, as Fig. 1.8 indi-cates, iodine-131 is very close to saturation.
Decay Chains
The foregoing reactions may be represented as a simple decay pro-cess: A! BþC. As Eqs. (1.25) and (1.26) indicate, however, chains ofdecay often occur. Consider the two-stage decay
N (t
)/ N
(∞)
0 1 2
λ t 3 4
0
0.25
0.5
0.75
1
1.25
1.5
FIGURE 1.8 Activity versus time for a radionuclide produced at a constantrate.
Nuclear Reactions 21
A! BþC
&Dþ E
ð1:43Þ
and let the decay constants of A and B be denoted by �A and �B. Forisotope A we already have the solution in the form of Eq. (1.36).Adding subscripts to distinguish it from B, we have
NAðtÞ ¼ NAð0Þ expð��AtÞ; ð1:44Þ
and �ANAðtÞ is the number of nuclei of type A decaying per unit time.Since for each decay of a nucleus of type A a nucleus of type B isproduced, the rate at which nuclei of type B is produced is also�ANAðtÞ. Likewise if there are NBðtÞ of isotope B present, its rate ofdecay will be �BNBðtÞ. Thus the net rate of creation of isotope B is
d
dtNBðtÞ ¼ �ANAðtÞ � �BNBðtÞ: ð1:45Þ
To solve this equation, we first replace NAðtÞ by Eq. (1.44). Wethen move �BNBðtÞ to the left and use the same integrating factortechnique as before: We multiply both sides of the equation byexpð�BtÞ and employ Eq. (1.40) to simplify the left-hand side:
d
dtNBðtÞ expð�BtÞ½ � ¼ �ANAð0Þ exp½ð�B � �AÞt�: ð1:46Þ
Multiplying by dt and then integrating from 0 to t yields
NBðtÞ expð�BtÞ �NBð0Þ ¼�A
�B � �ANAð0Þ exp½ð�B � �AÞt� � 1f g: ð1:47Þ
If we assume that the isotope B is not present initially so thatNBð0Þ ¼ 0, we have
NBðtÞ ¼�A
�B � �ANAð0Þ e��At � e��Bt
� �: ð1:48Þ
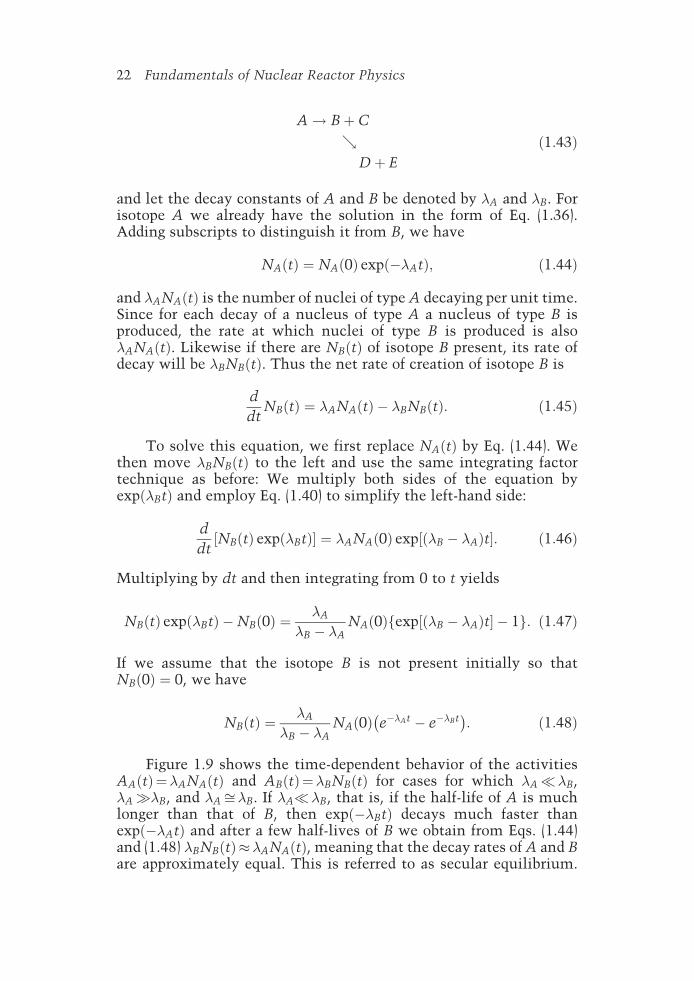
Figure 1.9 shows the time-dependent behavior of the activitiesAAðtÞ¼�ANAðtÞ and ABðtÞ¼�BNBðtÞ for cases for which �A��B,�A��B, and �Affi�B. If �A��B, that is, if the half-life of A is muchlonger than that of B, then expð��BtÞ decays much faster thanexpð��AtÞ and after a few half-lives of B we obtain from Eqs. (1.44)and (1.48) �BNBðtÞ��ANAðtÞ, meaning that the decay rates of A and Bare approximately equal. This is referred to as secular equilibrium.
22 Fundamentals of Nuclear Reactor Physics

On the other hand, if �A��B, that is, if the half-life of A is muchshorter than that of B, then expð��AtÞ will decay much faster thanexpð��BtÞ, and after a few half-lives of A we can assume that it hasvanished. In that case Eq. (1.48) reduces to NBðtÞ�NAð0Þ expð��BtÞ.Of course, if �Affi�B, neither of these approximations hold.
Bibliography
Bodansky, David, Nuclear Energy: Principles, Procedures, and Prospects,Springer, 2004.
Cember, H., Introduction to Health Physics, 3rd ed., McGraw-Hill, NY,1996.
Duderstadt, James J., and Louis J. Hamilton, Nuclear Reactor Analysis,Wiley, NY, 1976.
Glasstone, Samuel, and Alexander Sesonske, Nuclear Reactor Engineering,3rd ed., Van Nostrand-Reinhold, NY, 1981.
Knief, Ronald A., Nuclear Energy Technology: Theory and Practice ofCommercial Nuclear Power, McGraw-Hill, NY, 1981.
0 1
AA (t )/AA (0 )
AB (t )/AA (0)
2 3 40
0.25
0.5
0.75
1
t(a) λ B = 5 × λ A; t½A = 5 × t½B
Nor
mal
ized
act
ivity
AA (t )/AA (0 )
AB (t )/AA (0 )
0 1 2 3 4t
0
0.25
0.5
0.75
1
(b) λ B = λ A /5; t½A = t½B /5
Nor
mal
ized
act
ivity
AA (t )/AA (0 )
AB (t )/AA (0 )
0 1 2 3 4t
0
0.25
0.5
0.75
1
(c) λ B = λ A; t½A = t½B
Nor
mal
ized
act
ivity
FIGURE 1.9 Decay of a sequence of two radionuclides.
Nuclear Reactions 23

Lamarsh, John R., Introduction to Nuclear Reactor Theory, Addison-Wesley, Reading, MA, 1972.
Lamarsh, John, and Anthony J. Baratta, Introduction to Nuclear Engineer-ing, 3rd ed., Prentice-Hall, Englewood, NJ, 2001.
Stacey, Weston M., Nuclear Reactor Physics, Wiley, NY, 2001.Williams, W. S. C., Nuclear and Particle Physics, Oxford University Press,
USA, NY, 1991.Wong, Samuel M., Introductory Nuclear Physics, 2nd ed., Wiley, NY, 1999.
http://www.webelements.com/webelements/scholar/
Problems
1.1. The following isotopes frequently appear in reactor cores. Whatare their chemical symbols and names?
a.9038? b:
9140? c:
13755? d:
15764? e:
17872? f:
13793? g:
24195?
1.2. There are several possible modes of disintegration for theunstable nucleus 27
13Al. Complete the following reactions:
2713
Al! ?þ 10n, 27
13Al! ?þ 1
1p, 27
13Al! ?þ 2
1H, 27
13Al! ?þ 4
2He
1.3. Complete the following reactions: 9?Beþ 4
2He! ?þ 1
1H,
60?Co! ?þ 0
�1e, 73Liþ 1
1H! ?þ 4
2He, 10
5Bþ 4
2He! ?þ 1
1H
1.4. What target isotope must be used for forming the compoundnucleus 60
28Ni if the incident projective is
a. an alpha particleb. a protonc. a neutron?
1.5. The average kinetic energy of a fission neutron is 2.0 MeV.Defining the kinetic energy as Etotal �m0c2, what is thepercent error introduced into the kinetic energy from usingEq. (1.12) instead of Eq. (1.9)?
1.6. Consider the following nuclear and chemical reactions:
a. A uranium-235 nucleus fissions as a result of being bombardedby a slow neutron. If the energy of fission is 200 MeV,approximately what fraction of the reactant’s mass isconverted to energy?
b. A carbon-12 atom undergoes combustion following collisionwith an oxygen-16 molecule, forming carbon dioxide. If 4 eV
24 Fundamentals of Nuclear Reactor Physics

of energy is released, approximately what fraction of thereactant’s mass is converted to energy?
1.7. a. If plutonium-239 captures two neutrons followed by a betadecay, what isotope is produced?
b. If plutonium-239 captures three neutrons, followed by twobeta decays, what isotope is produced?
1.8. To first approximation a nucleus may be considered to be asphere with the radius in cm given by R¼ 1:25 � 10�13A1=3cm,where A is the atomic mass number. What are the radii of
a. hydrogenb. carbon-12c. xenon-140d. uranium-238?
1.9. A reactor operates at a power of 103 MW(t) for 1 year. Calculatethe power from decay heat
a. 1 day following shutdown,b. 1 month following shutdown,c. 1 year following shutdown.d. Repeat a, b, and c, assuming only one month of operation,
and compare results.
1.10. In Eq. (1.28) the uranium-239 and neptunium-239 both undergobeta decay with half-lives of 23.4 m and 2.36 d, respectively. Ifneutron bombardment in a reactor causes uranium-239 to beproduced at a constant rate, how long will it take plutonium-239to reach
a. ½ of its saturation activityb. 90% of its saturation activityc. 99% of its saturation activity? (Assume that plutonium-239
undergoes no further reactions.)
1.11. Uranium-238 has a half-life of 4.51� 109 yr, whereas the half-life of uranium-235 is only 7.13� 108 yr. Thus since the earthwas formed 4.5 billion years ago, the isotopic abundance ofuranium-235 has been steadily decreasing.
a. What was the enrichment of uranium when the earth wasformed?
b. How long ago was the enrichment 4%?
1.12. How many curies of radium-226 are needed in the reactiongiven in Eqs. (1.31) and (1.32) to produce 106 neutrons/s?
Nuclear Reactions 25

1.13. Suppose that a specimen is placed in a reactor, and neutronbombardment causes a radioisotope to be produced at a rate of2� 1012 nuclei/s. The radioisotope has a half-life of 2 weeks.How long should the specimen be irradiated to produce 25 Ci ofthe radioisotope?
1.14. The decay constant for the radioactive antimony isotope 12451
Sbis 1.33� 10�7 s�1.
a. What is its half-life in years?b. How many years would it take for it to decay to 0.01% of its
initial value?c. If it were produced at a constant rate, how many years would
it take to reach 95% of its saturation value?
1.15. Approximately what mass of cobalt-60, which has a half-life of5.26 yr, will have the same number of curies as 10 g ofstrontium-90, which has a half-life of 28.8 yr?
1.16. Ninety percent of an isotope decays in 3 hours.
a. What fraction decays in 6 hours?b. What is the half-life?c. If the isotope is produced in a reactor at the rate of 109 nuclei
per hour, after a long time how many nuclei will be presentin the reactor?
1.17. A fission product A with a half-life of 2 weeks is produced atthe rate of 5.0� 108 nuclei/s in a reactor.
a. What is the saturation activity in disintegrations per second?b. What is the saturation activity in curies?c. How long after the start-up of the reactor will 90 percent of
the saturation activity be reached?d. If the fission product undergoes decay A!B!C, where B
also has a 2-week half-life, what will be the activity of Bafter 2 weeks?
1.18. Suppose the radioactive cobalt and strontium sources inproblem 1.15 are allowed to decay for 10 years. It is foundthat after 10 years 1.0 Ci of cobalt-60 remains. How manycuries of strontium-90 will remain?
1.19. Polonium-210 decays to lead-206 by emitting an alpha particlewith a half-life of 138 days, and an energy of 5.305 MeV.
a. How many curies are there in 1 g of pure polonium?b. How many watts of heat are produced by 1 g of polonium?
26 Fundamentals of Nuclear Reactor Physics

1.20 Consider the fission product chain A �!� B �!� C with decayconstants �A and �B. A reactor is started up at t = 0 andproduces fission product A at a rate of Ao thereafter. Assumingthat B and C are not produced directly from fission:
a. Find NAðtÞ and NBðtÞ.b. What are NAð1Þ and NBð1Þ?
Nuclear Reactions 27

CHAPTER 2
Neutron Interactions
2.1 Introduction
The behavior of the neutrons emitted from fission as they interactwith matter determines the nature of neutron chain reactions, for tocreate a sustained chain reaction, on average one of the two or moreneutrons created by each fission must survive to create a subsequentfission. The kinetic energy of the neutrons as well as the manner inwhich they travel though space and interact with nuclei lie at thebasis of their behavior in nuclear reactors. At the core of neutroninteractions is the concept of the cross section—that is, the cross-sectional area of a nucleus as it appears to an oncoming neutron.Such cross sections, their dependence on the neutron’s kineticenergy, and the relative probabilities that a collision will result inscattering, capture, or fission form the basic physical data uponwhich the properties of chain reactions rest.
This chapter first describes neutrons’ behavior as they travelthrough space and defines microscopic and macroscopic cross sec-tions. We then distinguish between cross sections for scattering,absorption, and other reaction types. After determining the range ofkinetic energies over which neutrons may exist in a reactor, wedescribe the dependence of cross section on neutron energy, andthen conclude the chapter by describing the distributions of energiesof scattered neutrons.
2.2 Neutron Cross Sections
Neutrons are neutral particles. Neither the electrons surrounding anucleus nor the electric field caused by a positively charged nucleusaffect a neutron’s flight. Thus neutrons travel in straight lines,deviating from their path only when they actually collide with anucleus to be scattered into a new direction or absorbed. The life of aneutron thus consists typically of a number of scattering collisionsfollowed by absorption at which time its identity is lost. To a
29

neutron traveling through a solid, space appears to be quite empty.Since an atom has a radius typically of the order of 10�8 cm and anucleus only of the order of 10�12 cm, the fraction of the cross-sectional area perpendicular to a neutron’s flight path blocked by asingle tightly packed layer of atoms would be roughly (10�12)2/(10�8)2 = 10�8, a small fraction indeed. Thus neutrons on averagepenetrate many millions of layers of atoms between collisions withnuclei. If the target material is thin—say, a piece of paper—nearlyall of neutrons would be expected to pass through it without makinga collision.
Microscopic and Macroscopic Cross Sections
To examine how neutrons interact with nuclei, we consider abeam of neutrons traveling in the x direction as indicated inFig. 2.1. If the beam contains n000 neutrons per cm3 all travelingwith a speed v in the x direction, we designate I ¼ n000v as thebeam intensity. With the speed measured in cm/s, the beamintensity units are neutrons/cm2/s. Assume that if a neutroncollides with a nucleus it will either be absorbed or be scatteredinto a different direction. Then only neutrons that have not col-lided will remain traveling in the x direction. This causes theintensity of the uncollided beam to diminish as it penetratesdeeper into the material.
Let IðxÞ represent the beam intensity after penetrating x cm intothe material. In traveling an additional infinitesimal distance dx,the fraction of neutrons colliding will be the same as the fraction of
I (0 ) I (x ) I (x + dx )
dxx
FIGURE 2.1 Neutron passage through a slab.
30 Fundamentals of Nuclear Reactor Physics

the 1-cm2 section perpendicular to the beam direction that is shadowedby nuclei. If dx is small, and the nuclei are randomly placed, then theshadowing of one nucleus by another can be ignored. (Only in the rarelyencountered circumstance where neutrons are passing through a singlecrystal does this assumption break down.) Now assume there are Nnuclei/cm3 of the material; there will then be N dx per cm2 in theinfinitesimal thickness. If each nucleus has a cross-sectional area of� cm2, then the fraction of the area blocked is N�dx, and thus we have
Iðx þ dxÞ ¼ ð1�N�dxÞIðxÞ: ð2:1Þ
Using the definition of the derivative, we obtain the simple differen-tial equation
d
dxIðxÞ ¼ �N�IðxÞ; ð2:2Þ
which may rewritten as
dIðxÞIðxÞ ¼ �N�dx ð2:3Þ
and integrated between 0 and x to yield
IðxÞ ¼ Ið0Þ expð�N�xÞ: ð2:4Þ
We next define the macroscopic cross section as
� ¼ N�: ð2:5Þ
Here �, which has units of cm2/nucleus, is referred to as the micro-scopic cross section. Since the units of N are nuclei/cm3, �, themacroscopic cross section, must have units of cm�1.
The cross section of a nucleus is very small. Thus instead ofmeasuring microscopic cross sections in cm2 the unit of the barn iscommonly used. One barn, abbreviated as ‘‘b,’’ is equal to 10�24 cm2.The unit is said to have originated from early determinations ofneutron cross sections when one of the investigators exclaimed,‘‘That’s as big as a barn’’ in reaction to one of the measurements.
The foregoing equations have a probabilistic interpretation.Since dIðxÞ is the number of neutrons that collide in dx, out of atotal of IðxÞ, �dIðxÞ=IðxÞ ¼ �dx, as given by Eq. (2.3), must be theprobability that a neutron that has survived without colliding until x,will collide in the next dx. Likewise IðxÞ=Ið0Þ ¼ expð��xÞ is thefraction of neutrons that have moved through a distance x withoutcolliding; it may also be interpreted as the probability of a neutron
Neutron Interactions 31

traveling a distance x without making a collision. If we then ask whatis the probability pðxÞdx that a neutron will make its first collision indx, it is the probability that it has survived to dx and that it willcollide in dx. If its probability of colliding in dx is independent of itspast history, the required result is obtained simply by multiplying theprobabilities together, yielding
pðxÞdx ¼ � expð��xÞdx: ð2:6Þ
From this we can calculate the mean distance traveled by a neutronbetween collisions. It is called the mean free path and denoted by�:
� ¼Z 1
0xpðxÞdx ¼
Z 10
x� expð��xÞdx ¼1=�: ð2:7Þ
Thus the mean free path is just the inverse of the macroscopic crosssection.
Uncollided Flux
The neutrons included in IðxÞ have not made a collision. They aresometimes designated as an uncollided flux to distinguish them fromthe total population of neutrons, which also includes those that havemade one or more collisions. The neutrons in IðxÞ all travel in thesame positive x direction, while those that have made collisions maybe found traveling in all directions. The neutron beam IðxÞ may bewritten as the product of the neutron speed v, in cm/s, and n000u ðxÞ, thedensity of uncollided neutrons, measured in neutrons/cm3. We thushave IðxÞ ¼ vn000u ðxÞ, and it is this form in which the flux, which isusually designated by �, is written. Thus for the neutron beam theuncollided flux is
�uðxÞ ¼ vn000u ðxÞ: ð2:8Þ
The uncollided flux may be written for other configurations thanthe beam of neutrons used here to define the cross section. A pointsource is particularly useful in distinguishing the difference betweengeometric and material attenuation of the uncollided flux. Let asource emit sp neutrons per second. At any location all of the uncol-lided neutrons travel in a single direction: radially outward from thesource. In a vacuum the flux is only attenuated geometrically sinceno material is present: at a distance r from the source the neutronswill pass through a surface of area 4�r2 of a sphere of radius r,and thus the number passing through 1 cm2/s is �uðrÞ= sp=ð4�r2Þ.With a material present, however, only a fraction expð��rÞ of the
32 Fundamentals of Nuclear Reactor Physics

neutrons will survive to a distance r without undergoing a collision.Thus accounting for both geometrical and material attenuationsresults in the uncollided flux at a distance r from a point source being
�uðrÞ ¼ expð��rÞ4�r2 sp: ð2:9Þ
Nuclide Densities
Both factors in Eq. (2.5)—the nuclide density N and the microscopiccross section �—require further discussion. First, consider thedensities. Avogadro’s number, N0 ¼ 0:6023 � 1024, is the number ofmolecules in one gram molecular weight of a substance, Thus if A isthe molecular weight, N0=A is the number of molecules in 1g of thesubstance. If we designate � as the density in grams/cm3, then
N ¼ �N0=A ð2:10Þ
is the number of molecules/cm3. Equation (2.5) becomes
� ¼ �N0
A�; ð2:11Þ
where the density is in grams/cm3 and � is in cm2. Usually themicroscopic cross sections are tabulated in barns (designated as b)where 1b = 10�24 cm2.
In many cases the formulas above may be applied directly to achemical element even though mixtures of isotopes are included,provided the cross sections are measured for the elements as theyexist in nature. Thus, for example, we treat iron as a single crosssection without specifying the isotope, even though it has a molecu-lar weight of 55.8 because the isotopes iron—54, 56, and 57—all arepresent in significant amounts. In situations where the cross sectionsare measured from particular isotopes, A in the foregoing equations isthe atomic weight of the particular isotope.
In reactor physics the need sometimes arises to express the crosssection of an element in terms of cross sections of its constituentisotopes. To accomplish this we first let N i=N denote the atomicfraction of the isotope with atomic weight Ai. The atomic weight ofthe mixture is then
A ¼P
i
ðN i=NÞAi; ð2:12Þ
where N ¼P
i N i and the macroscopic cross section of the combina-tion of isotopes may be written as
Neutron Interactions 33

� ¼ �No
A
Pi
Ni
N� i; ð2:13Þ
where � i is the microscopic cross section of the ith isotope.To compute the cross sections of molecules, the cross sections of
the number of atoms of each element in the molecule must beincluded. Thus for water, with molecular weight 18, account mustbe taken for the number of hydrogen and oxygen atoms:
�H2O ¼ �H2ONo
182�H þ �O� �
: ð2:14Þ
We may define a composite microscopic cross section for a molecule,in the case of water
�H2O ¼ 2�H þ �O; ð2:15Þ
so thatEq. (2.14) simplifies to�H2O ¼ NH2O�H2O withNH2O ¼ �H2ONo=18.
Frequently, materials are combined by volume fractions. Let Vi
be the volumes, and Vi=V the volume fractions, where V ¼P
i Vi.The cross section for the mixture is then
� ¼P
i
ðVi=VÞNi�i; ð2:16Þ
where each of the nuclide number densities is given by
Ni ¼ �iN0=Ai; ð2:17Þ
and �i and Ai are the densities and atomic weights corresponding to anuclide with a microscopic cross section of �i. Equation (2.16) may, ofcourse, also be written in terms of the macroscopic cross sections ofthe constituents:
� ¼P
i
ðVi=VÞ�i; ð2:18Þ
where �i ¼ Ni�i. Sometimes mixtures are given in terms of mass
fractions. We treat such situations by combining Eqs. (2.16) and(2.17) to write:
� ¼P
i
ðMi=MÞ �No
Ai�i; ð2:19Þ
where Mi=M ¼ �iVi=�V is the mass fraction, M ¼P
i Mi, and thedensity is given by � ¼M=V.
34 Fundamentals of Nuclear Reactor Physics

Enriched Uranium
The cross sections designated for uranium are for natural uranium, whichconsists of 0.7% uranium-235 and 99.3% uranium-238. Frequently, how-ever, designers call for enriched uranium in order to increase the ratio offissile to fertile material. Enrichment may be defined in two ways.Atomic enrichment is the ratio of uranium-235 atoms to the total num-ber of uranium atoms. Using the shorthand notation for fissile and fertileisotopes introduced in Section 1.6, the atomic enrichment is
~ea ¼ N25=ðN25 þN28Þ; ð2:20Þ
and hence 1� ~ea ¼ N28=ðN25 þN28Þ. Inserting these expressions intoEqs. (2.12) and (2.13) yields a uranium cross section of
�U ¼ �UNo
~ea235þ ð1� ~eaÞ238~ea�
25 þ ð1� ~eaÞ�28� �
: ð2:21Þ
Alternately, mass (or weight) enrichment is the ratio of the mass ofuranium-235 to the total uranium mass:
~ew ¼M25=ðM25 þM28Þ; ð2:22Þ
and correspondingly 1� ~ew ¼M28=ðM25 þM28Þ. Then from Eq. (2.19)the uranium cross section is
�U ¼ �UNo1
235~ew�
25 þ 1
238ð1� ~ewÞ�28
� �: ð2:23Þ
The two enrichments are often quoted as atom percent (a/o) andweight percent (w/o), respectively. They are closely related. Notingthat Ni ¼ �iNo=Ai and Mi ¼ �iV, we may eliminate the densitiesbetween Eqs. (2.20) and (2.22) to obtain:
~ea ¼ ð1þ 0:0128~ewÞ�11:0128~ew : ð2:24Þ
Thus if we take ~ew ¼ 0:00700 for natural uranium, then ~ea ¼ 0:00709,and the fractional differences become smaller for higher enrichments.Except were very precise calculations are called for, we may ignore thesesmall differences and allow both Eqs. (2.21) and (2.23) to be simplified to
�U ’ �UNo
238�U ð2:25Þ
with uranium’s microscopic cross section approximated by
�U ¼ ~e�25 þ ð1� ~eÞ�28: ð2:26Þ
Neutron Interactions 35

Except were stated otherwise, the pages that follow will take ~e tobe the atom enrichment, and utilize Eqs. (2.12) and (2.13) for deter-mining uranium cross sections.
Cross Section Calculation Example
Frequently more than one of the foregoing formulas must be used incombination to obtain a macroscopic cross section. For example,suppose we want to calculate the cross sections for 8% enricheduranium dioxide (UO2) that is mixed in a 1:3 volume ratiowith graphite (C). The basic data required are the microscopic crosssections of the uranium isotopes, and of oxygen and carbon:�25 ¼ 607:5 b, �28 ¼ 11:8 b, �O ¼ 3:5 b, �C ¼ 4:9 b. We also need thedensities of UO2 and carbon: �UO2
¼ 11:0 g=cm3, �C ¼ 1:60 g=cm3.We first calculate the composite microscopic cross section for
8% enriched uranium. From Eq. (2.26) we have
�U ¼ 0:08 � 607:5þ ð1� 0:08Þ � 11:8 ¼ 59:5 b:
The microscopic cross section of UO2 is then
�UO2 ¼ 59:5þ 2 � 3:5 ¼ 66:5 b:
Noting that 1 b = 10�24 cm2, the macroscopic cross section of theenriched UO2 is
�UO2 ¼ 11 � 0:6023 � 1024
238þ 2 � 1666:5 � 10�24¼ 1:63 cm�1:
The macroscopic cross section of carbon is
�C ¼ 1:6 � 0:6023 � 1024
124:9 � 10�24¼ 0:39 cm�1:
Since UO2 and C are mixed in a 1:3 ratio by volume, form Eq. (2.18)we obtain
� ¼ 1
4�UO2 þ 3
4�C ¼ 1
41:63þ 3
40:39 ¼ 0:70 cm�1:
Reaction Types
Thus far we have considered only the probability that a neutronhas made a collision, without consideration of what happenssubsequently. The cross section that we have been dealing with isdesignated as the total cross section, and often denoted with a
36 Fundamentals of Nuclear Reactor Physics

subscript t: �t. Upon striking a nucleus, the neutron is either scat-tered or it is absorbed. The relative likelihoods of a scattering or anabsorption are represented by dividing the total cross section intoscattering and absorption cross sections:
�t ¼ �s þ �a: ð2:27Þ
Given a collision, �s=�t is the probability that the neutron will bescattered and �a=�t the probability that it will be absorbed. Scatteringmay be either elastic or inelastic. Thus in the most general case wemay divide the scattering cross section to read
�s ¼ �n þ �n0 : ð2:28Þ
Here �n denotes the elastic scattering cross section. Elastic scatteringconserves both momentum and kinetic energy; it may be modeled asa billiard ball collision between a neutron and a nucleus. In aninelastic scattering collision, with cross section denoted by �n0 , theneutron gives up some of its energy to the nucleus, leaving it in anexcited state. Thus while momentum is conserved in an inelasticcollision, kinetic energy is not; the nucleus gives up excitationenergy by emitting one or more gamma rays along with the neutron.
In its simplest form, the absorption reaction creates a compoundnucleus in an excited state. But instead of reemitting a neutron iteliminates the excitation energy by emitting one or more gammarays. This is referred to as a capture reaction, and denoted by ��. Inmany cases the new isotope thus created is not stable and will laterundergo radioactive decay. In a fissionable material, following neutronabsorption, the neutron may simply be captured, or it may cause fission.For fissionable materials we thus divide the absorption cross section as
�a ¼ �� þ �f ; ð2:29Þ
where �f is the fission cross section. We again may make aprobabilistic interpretation: Given a neutron absorption, ��=�a isthe probability that the neutron will be captured and �f=�a the prob-ability that a fission will result.
We express macroscopic cross sections for particular reactiontypes by using Eq. (2.5) in the same way as before. Suppose we letx = s, a, �, f signify scattering, absorption, capture, fission, and so on.Then we may write
�x ¼ N�x; ð2:30Þ
and analogous modifications may be made by adding these subscriptsto preceding equations for microscopic and macroscopic cross sections.
Neutron Interactions 37

From the foregoing equations we may also easily show that macro-scopic cross sections for different reaction types add in the same wayas microscopic cross sections. Thus analogous to Eq. (2.27) we have�t ¼ �s þ �a and so on.
2.3 Neutron Energy Range
Thus far we have not discussed the dependence of cross sections onneutron kinetic energy. To take energy into account we write each ofthe above cross sections as functions of energy by letting �x ! �xðEÞand similarly, as a result of Eq. (2.30), �x ! �xðEÞ. The energy depen-dence of cross sections is fundamental to neutron behavior in chainreactions and thus warrants detailed consideration. We begin byestablishing the upper and lower limits of neutron energies found infission reactors.
Neutrons born in fission are distributed over a spectrum ofenergy. Defining �ðEÞdE as the fraction of fission neutrons bornwith energies between E and EþdE, a reasonable approximation tothe fission spectrum is given by
�ðEÞ ¼ 0:453 expð�1:036EÞ sinhffiffiffiffiffiffiffiffiffiffiffiffiffi2:29Ep� �
; ð2:31Þ
where E is in MeV and �ðEÞ is normalized to one:
Z 10�ðEÞdE ¼ 1: ð2:32Þ
The logarithmic energy plot of Fig. 2.2 shows the fission spec-trum, �ðEÞ. Fission neutrons are born in the MeV energy range with
0.01 0.1 1 10 100 1 ⋅ 103 1 ⋅ 1041 ⋅ 10–3 1 ⋅ 105 1 ⋅ 106 1 ⋅ 1070
10
20
<= M(E) χ(E) =>
Neutron energy (eV)
FIGURE 2.2 Fission and thermal neutron energy spectra.
38 Fundamentals of Nuclear Reactor Physics

an average energy of about 2 MeV, and the most probable energyis about 3/4 MeV. The numbers of fission neutrons produced withenergies greater than 10 MeV is negligible, which sets the upper limitto the energy range of neutrons in reactors.
Neutrons born in fission typically undergo a number of scatteringcollisions before being absorbed. A neutron scattering from a stationarynucleus will transfer a part of its momentum to that nucleus, thuslosing energy. However at any temperature above absolute zero, thescattering nuclei will possess random thermal motions. According tokinetic theory, the mean kinetic energy of such nuclei is
�E ¼ 3
2kT; ð2:33Þ
where k is the Boltzmann constant and T is the absolute temperature.For room temperature of T = 293.61 K the mean energy amounts to0.0379 eV. Frequently, thermal neutron measurements are recordedat 1.0 kT, which, at room temperature, amounts to 0.0253 eV. Ineither case these energies are insignificant compared to the MeVenergies of fission neutrons. Thus the scatting of neutrons causesthem to lose kinetic energy as they collide with nearly stationarynuclei until they are absorbed or are slowed down to the eV range. Inthe idealized situation where no absorption is present, the neutronswould eventually come to equilibrium with the thermal motions ofthe surrounding nuclei. The neutrons would then take the form ofthe famed Maxwell-Boltzmann distribution
MðEÞ ¼ 2�
ð�kTÞ3=2E1=2 expð�E=kTÞ; ð2:34Þ
where E is in eV, Boltzmann’s constant is k = 8.617065� 10�5 eV/K,and MðEÞ is normalized to one:
Z 10
MðEÞdE ¼ 1: ð2:35Þ
Figure 2.2 shows MðEÞ along with �ðEÞto indicate the energyrange over which neutrons may exist in a nuclear reactor. Realize,however, that some absorption will always be present. As a result thespectrum will be shifted upward somewhat from MðEÞ since theabsorption precludes thermal equilibrium from ever being completelyestablished. The fraction of neutrons with energies less than 0.001eVin the room temperature Maxwell-Boltzmann distribution is quitesmall, and we thus take it as the lower bound of energies that weneed to consider. In general, we may say the primary range of interest
Neutron Interactions 39

for neutron in a chain reactor is in the range 0.001 eV<E<10 MeV.Thus the neutron energies range over roughly 10 orders of magnitude!
For descriptions of neutron cross sections important to reactor phy-sics, it is helpful to divide them into to three energy ranges. We refer tofast neutrons as being those with energies over the range where signifi-cant numbers of fission neutrons are emitted: 0.1 MeV<E< 10 MeV.We call thermal neutrons those with small enough energies thatthe thermal motions of the surrounding atoms can significantly affecttheir scattering properties: 0.001 eV<E< 1.0 eV. We lump all the neu-trons in between as epithermal or intermediate energy neutrons:1.0 eV<E< 0.1 MeV.
2.4 Cross Section Energy Dependence
We begin our description of the energy dependence of cross sectionswith hydrogen; since it consists of a single proton, its cross section iseasiest to describe. Hydrogen has only elastic scattering and absorp-tion cross sections. Since it has no internal structure, hydrogen isincapable of scattering neutrons inelastically. Figure 2.3a is a plot ofhydrogen’s elastic scattering cross section. The capture cross section,shown in Fig. 2.3b, is inversely proportional to
ffiffiffiEp
, and since energyis proportional to the square of the speed, it is referred to as a 1/v or‘‘one-over-v’’ cross section. Hydrogen’s capture cross section—whichis the same as absorption since there is no fission—is only largeenough to be of importance in the thermal energy range. The absorp-tion cross section is written as
�a Eð Þ ¼ffiffiffiffiffiffiffiffiffiffiffiEo=E
p�a Eoð Þ: ð2:36Þ
Conventionally, the energy is evaluated at Eo ¼ kT, in combi-nation with the standard room temperature of T = 293.61 K. Thus
102
101
100
10–1
10–1 100 101 102
Neutron energy (eV)
Cro
ss s
ectio
n (b
arns
)
(a) Elastic scattering (b) Absorption
Cro
ss s
ectio
n (b
arns
)
103 104 105 106 107 10–1 100 101 102
Neutron energy (eV)103 104 105 106 107
100
10–1
10–2
10–3
10–4
10–5
FIGURE 2.3 Microscopic cross sections of hydrogen-1 (from http://www.dne.bnl.gov/CoN/index.html). (a) Elastic scattering, (b) Absorption.
40 Fundamentals of Nuclear Reactor Physics

Eo = 0.0253 eV. For most purposes we may ignore the low- and high-energy tails in the scattering cross section. The total cross sectionmay then be approximated as
�t Eð Þ ¼ �s þffiffiffiffiffiffiffiffiffiffiffiEo=E
p�a Eoð Þ: ð2:37Þ
Hydrogen-2, or deuterium, cross sections have an analogousbehavior, except that the scattering cross section is moderatelylarger, and the absorption cross section much smaller.
Like hydrogen, other nuclei have elastic scattering cross sections,which may be equated to simple billiard ball collisions in which kineticenergy is conserved. These are referred to as potential scattering crosssections because the neutron scatters from the surface of the nucleus,rather than entering its interior to form a compound nucleus. Potentialscattering cross sections are energy independent except at very low orhigh energies. Their magnitude is directly proportional to the cross-sectional area of the nucleus, where the radius of the nucleus may begiven in terms of the atomic weight as R = 1.25� 10�13 A1/3 cm. Furtherunderstanding of neutron cross sections, however, requires that weexamine reactions resulting from the formation of compound nuclei.
Compound Nucleus Formation
If a neutron enters a nucleus—instead of scattering from its surface asin potential scattering—a compound nucleus is formed, and it is inan excited state. There are two contributions to this excitationenergy. The first derives from the kinetic energy of the neutron. Wedetermine excitation energy as follows. Suppose a neutron of mass mand velocity v hits a stationary nucleus of atomic weight A and formsa compound nucleus. Conservation of momentum requires that
mv ¼ ðmþAmÞV: ð2:38Þ
Kinetic energy, however, is not conserved the formation. Theamount lost is
DEke ¼1
2mv2 � 1
2ðmþAmÞV2; ð2:39Þ
where V is the speed of the resulting compound nucleus. EliminatingV between these equations then yields
DEke ¼A
1þA
1
2mv2; ð2:40Þ
which may be shown to be identical to the neutron kinetic energy beforethe collision measured in the center of mass system. Hence we hereafterdenote it by Ecm. The second contribution to the excitation energy is thebinding energy of the neutron, designated by EB. The excitation energy of
Neutron Interactions 41

the compound nucleus is Ecm þ EB. Note that even very slow movingthermal neutrons will excite a nucleus, for even though Ecm � EB, thebinding energy by itself may amount to a MeV or more.
The effects of the excitation energy on neutron cross sectionsrelate strongly to the internal structure of the nucleus. Although theanalogy is far from complete, these effects can be roughly understoodby comparing atomic to nuclear structures. The electrons surroundinga nucleus are in distinct quantum energy states and can be excited tohigher states by imparting energy from the outside. Likewise, theconfigurations of nucleons that form a nucleus are in quantum states,and the addition of a neutron accompanied by its kinetic energy createa compound nucleus that is in an excited state. Following formation ofa compound nucleus one of two things happen: the neutron may bereemitted, returning the target nucleus to its ground state; this scatter-ing is elastic, even though a compound nucleus was formed tempora-rily in the process. Alternately, the compound nucleus may return toits ground state by emitting one or more gamma rays; this is a neutroncapture reaction through which the target nucleus is transmuted to anew isotope as the result of the neutron gained.
With higher incoming neutron energies the compound nucleus maygain sufficient excitation energy to emit both a lower energy neutron anda gamma ray; thus inelastic scattering results, and at yet higher energiesother reactions may result as well. In fissile and fertile materials, ofcourse, the fission reaction is the most important consequence of com-pound nucleus formation. Before considering these reactions in detail,we first examine the resonance structure of compound nuclei and theeffect that it has on scattering and absorption cross sections.
Resonance Cross Sections
The likelihood of compound nucleus formation greatly increases ifthe excitation energy brought by the incident neutron corresponds toa quantum state of the resulting nuclei. Scattering and absorptioncross sections exhibit resonance peaks at neutron kinetic energiescorresponding to those quantum states. Figure 2.4 illustrates thepeaks in the scattering and capture cross sections of sodium-23.Each nuclide has its own unique resonance structure, but generallythe heavier a nucleus is, the more energy states it will have, and theywill be more closely packed together. Figure 2.5 illustrates thisprogression of state packing using carbon, aluminum, and uraniumisotopes as examples. The correlation between quantum statedensity and atomic weight results in the resonance of lighter nuclidesbeginning to occur only at higher energies. For example, the lowestresonance in carbon-12 occurs at 2 MeV, in oxygen-16 at 400 keV, insodium-23 at 3 keV, and in uranium-238 at 6.6 eV. Likewise theresonances of lighter nuclei are more widely spaced and tend to
42 Fundamentals of Nuclear Reactor Physics

103
102
101
10–1
100
10–1 100 101 102
Neutron energy (eV)
Cro
ss s
ectio
n (b
arns
)
103 104 105 106 107
Cro
ss s
ectio
n (b
arns
)
10–1 100 101 102
Neutron energy (eV)103 104 105 106 107
100
101
10–1
10–2
10–3
10–4
(a) Elastic scattering (b) Absorption
10–5
FIGURE 2.4 Microscopic cross sections of sodium-23 (from http://www.dne.bnl.gov/CoN/index.html). (a) Elastic scattering, (b) Absorption.
24
22
20
18
Ene
rgy
(MeV
)
C12 Al28
etc.
etc.
etc.
U235
16
14
12
10
8
6
4
2
0
FIGURE 2.5 Energy levels of carbon-12, aluminum-28, and uranium-235.Adapted from Introduction to Nuclear Reactor Theory, 1972, byJohn R. Lamarsh. Copyright by the American Nuclear Society, La GrangePark, IL.
Neutron Interactions 43

have a smaller ratio of capture to scattering cross section. Comparingthe cross sections of uranium-238 given in Fig. 2.6 with those ofsodium-23 in Fig. 2.4 illustrates these trends in resonance structure.
A noteworthy feature of the uranium cross sections in Fig. 2.6 isthat the resonances appear to suddenly stop at approximately 10 keV. Infact, they extend to higher energies but are so tightly packed that atpresent they cannot be resolved experimentally. Thus the apparentlysmooth curve conceals unresolved resonances at higher energies. Thesemust be treated by statistical theory until more refined experiments areable to resolve them. The situation is similar for other heavy nuclides.
Nuclear theory predicts that the energy dependence of the crosssections in the vicinity of each resonance will take the form of theBreit-Wigner formula. For the capture cross sections
��ðEÞ ¼ �o���
Er
E
1=2 1
1þ 4ðE� ErÞ2=�2; ð2:41Þ
where Er is the resonance energy, and G is approximately equal to thewidth of the resonance at half of the cross section’s maximum value.In general, not all of the neutrons that collide near a resonance energywill be captured; some will be reemitted in resonance elasticscattering. The elastic scattering cross section in the vicinity of theresonance has three contributions:
�nðEÞ ¼ �o�n
�
1
1þ 4ðE� ErÞ2=�2þ �o
2R
�o
2ðE� ErÞ=�
1þ 4ðE� ErÞ2=�2þ 4�R2:
ð2:42Þ
The first term is the resonance scattering, while the third is theenergy-independent potential scattering. The second term arisesfrom a quantum mechanical interference effect between resonance
103
102
101
100
10–1
10–2
10–1 100 101 102
Neutron energy (eV)
Cro
ss s
ectio
n (b
arns
)
103 104 105 106 107
103
102
101
100
10–1
10–2
10–3
10–1 100 101 102
Neutron energy (eV)
Cro
ss s
ectio
n (b
arns
)
103 104 105 106 107
(a) Elastic scattering (b) Absorption
FIGURE 2.6 Microscopic cross sections of uranium-238 (from http://www.dne.bnl.gov/CoN/index.html). (a) Elastic scattering, (b) Absorption.
44 Fundamentals of Nuclear Reactor Physics

and potential scattering. In heavier nuclei, such as uranium, the inter-ference is visible as a dip in the scattering cross section just below theresonance energy. For nonfissionable materials � ¼ �� þ �n, and thus�o is the resonance cross section when E = Er, and �o is the reducedneutron wavelength. In reactor problems distinguishing between reso-nance and potential scattering is sometimes advantageous. We do thisby writing Eq. (2.42) as
�nðEÞ ¼ �nrðEÞ þ �np; ð2:43Þ
where the first two terms of Eq. (2.41) are included in the resonancecontribution, �nr, and the third constitutes the potential scattering, �np.
No discussion of resonance cross sections is complete without adescription of Doppler broadening. Strictly speaking, neutron crosssections are written in terms of the relative speed between neutronand nucleus in the center of mass system. Normally, the kineticenergy of the incident neutron is so much larger than that of thenucleus, which is caused only by thermal motion, that the nucleuscan be assumed to be stationary. Thus the cross section formulas abovedo not account for the thermal motions of the target nuclei. If the crosssections are a relatively smooth function of energy, these motions areunimportant. However, when cross sections are sharply peaked, asthey are for the resonances described by the Breit-Wigner formulas,the formulas must be averaged over the range of relative speeds char-acterized as a function of temperature by the Maxwell-Boltzmanndistribution of atom velocities. This averaging has the net effect ofslightly smearing the resonances in energy, making them appear widerand less peaked. The smearing becomes more pronounced withincreased temperature, as shown in exaggerated form for the resonancecapture cross section curve of Fig. 2.7. The importance of Doppler
T1
T2
E
σ a(E
)
FIGURE 2.7 Doppler broadening of resonance capture cross section, withT1<T2.
Neutron Interactions 45

broadening in providing negative temperature feedback and thus sta-bility to nuclear reactors is discussed in Chapter 9.
Threshold Cross Sections
With higher incident neutron energies—and as a result higherexcitation energies—additional reactions become possible. Thesewe refer to as threshold reactions because the cross section is zerobelow the threshold energy. Inelastic scattering cross sections exhibitthreshold behavior because for such scattering to occur the incidentneutron must have enough kinetic energy both to raise the targetnucleus to an excited quantum state and to overcome the bindingenergy and be reemitted. Referring again to the examples of Fig. 2.5we note that the lowest excited state of a nucleus generally decreaseswith increasing atomic weight. As a result the threshold for inelasticscattering also decreases with increasing atomic number. For thelighter nuclides, inelastic scattering thresholds are so high that thereaction is insignificant in reactors: The threshold for carbon-12 is4.8 MeV, whereas that for oxygen-16 is 6.4 MeV. However, for heavierelements the threshold is lower; in uranium-238 is it at 0.04 MeV.Fertile materials, such as uranium-238, also have thresholds abovewhich fission becomes possible; the threshold for uranium-238 fis-sion is approximately 1.0 MeV. Figure 2.8 depicts the threshold crosssection for both the inelastic scattering and fission in uranium-238.
(n,inelastic)
Energy (eV)
Cro
ss s
ectio
n (b
arns
)
104 1050.0
0.5
1.0
1.5
2.0
2.5
3.0
3.5
106 107
(n,fiss)
FIGURE 2.8 Microscopic threshold cross sections for uranium-238(courtesy of W. S. Yang, Argonne National Laboratory).
46 Fundamentals of Nuclear Reactor Physics

A third class of threshold reaction that emits neutrons is (n, 2n) inwhich the incident neutron ejects two neutrons from a nuclide.However, the threshold for this reaction is sufficiently high and thecross section small enough that generally it can be ignored in ele-mentary treatments of reactor physics.
Fissionable Materials
Fissionable isotopes are either fissile or fertile, as discussed inChapter 1. Incident neutrons of any energy cause fission in a fissilematerial. Figure 2.9 depicts the fission cross section of urainium-235, the only fissile material that occurs naturally. Uranium-238,which makes up 99.3% of natural uranium, fissions only fromneutrons with an incident energy of a MeV or more as illustratedby the threshold in its fission cross section plotted in Fig. 2.8. It is,however, fertile, for following neutron capture it decays accordingto Eq. (1.28) to plutonium-239, which is fissile. Figure 2.10 showsthe fission cross section of plutonium-239. If plutonium-239 cap-tures an additional neutron instead of fissioning, it becomes plu-tonium-240, which is also a fertile isotope, for and if it captures anadditional neutron it becomes plutonium-241, which is fissile. Inaddition to uranium-238, thorium-232 is a naturally occurringfertile isotope, for following neutron capture it undergoes radio-active decay to become uranium-233, which is fissile. The fissioncross section of uranium-233 appears similar to those plotted inFigs. 2.9 and 2.10.
103
102
101
100
10–1
10–1 100 101 102
Neutron energy (eV)
Cro
ss s
ectio
n (b
arns
)
103 104 105 106 107
FIGURE 2.9 Microscopic fission cross sections of uranium-235 (fromhttp://www.dne.bnl.gov/CoN/index.html).
Neutron Interactions 47

2.5 Neutron Scattering
The neutron energy spectrum in a reactor lies between the extremesof fission and thermal equilibrium. It is determined largely by thecompetition between scattering and absorption reactions. Forneutrons with energies significantly above the thermal range, ascattering collision results in degradation of the neutron energy,whereas neutrons near thermal equilibrium may either gain orlose energy in interacting with the thermal motions of the nucleiof the surrounding media. Energy degradation caused by scatteringis referred to as neutron slowing down. In a medium for which theaverage energy loss per collision and the ratio of scattering toabsorption cross section is large, the neutron spectrum will beclose to thermal equilibrium and is then referred to as a soft orthermal spectrum. Conversely, in a system with small ratios ofneutron degradation to absorption, neutrons are absorbed beforesignificant slowing down takes place. The neutron spectrum thenlies closer to the fission spectrum and is said to be hard or fast. Togain a more quantitative understanding of neutron energy distribu-tions we consider first elastic and then inelastic scattering. Recallthat in elastic scattering mechanical energy is conserved, that is,the sums of the kinetic energies of the neutron and the targetnucleus are the same before and after the collision. In inelasticscattering the neutron leaves the target nucleus in an excited—that is, more energetic—state. Thus the sum of the neutron andnucleus kinetic energies following the collision is less than beforeby the amount of energy deposited to form the excited state. Bothelastic and inelastic scattering are of considerable importance innuclear reactors. We treat elastic scattering first.
103
102
101
100
10–1
10–2
10–1 100 101 102
Neutron energy (eV)
Cro
ss s
ectio
n (b
arns
)
103 104 105 106 107
FIGURE 2.10 Microscopic fission cross sections of plutonium-239 (fromhttp://www.dne.bnl.gov/CoN/index.html).
48 Fundamentals of Nuclear Reactor Physics

Elastic Scattering
For simplicity we first consider the head-on collision between aneutron with speed v and a stationary nucleus of atomic mass A. Ifwe take m as the neutron mass then the nuclear mass will beapproximately Am. If v0 and V are the neutron and nucleus speedsafter the collision then conservation of momentum yields
m � v ¼m � v0 þ ðAmÞV; ð2:44Þ
while from conservation of mechanical energy
1
2m � v2 ¼ 1
2m � v02 þ 1
2ðAmÞV2: ð2:45Þ
Letting E and E0 be the neutron energy before and after the collision,we may solve these equations to show that the ratio of neutronenergies is
E0
E¼ A� 1
Aþ 1
2
: ð2:46Þ
Clearly the largest neutron energy losses result from collisions withlight nuclei. A neutron may lose all of its energy in a collision with ahydrogen nucleus, but at the other extreme, it can lose no morethan 2% of its energy as the result of an elastic collision withuranium-238.
Of course, head-on collisions cause the maximum neutron energyloss, although in reality most neutrons will make glancing collisions inwhich they are deflected and lose a smaller part of their energy. Ifelastic scattering is analyzed not in the laboratory but in the centerof mass system as a collision between two spheres, all deflectionangles are equally likely, and the scattering is said to be isotropic inthe center of mass system (or often just isotropic). Detailed analysesfound in more advanced texts result in a probability distribution forneutron energies following a collision. Suppose a neutron scatterselastically at energy E. Then the probability that its energy followingcollision will be between E0 and E0 þ dE0 will be
pðE! E0ÞdE0 ¼1
ð1� ÞE dE0; E � E0 � E;
0 otherwise
8<: ð2:47Þ
where
¼ ðA� 1Þ2.ðAþ 1Þ2: ð2:48Þ
Neutron Interactions 49

Often the need arises to combine the probability distribution forscattered neutrons with the scattering cross section. We then define
�sðE! E0Þ ¼ �sðEÞpðE! E0Þ; ð2:49Þ
where the corresponding macroscopic form is
�sðE! E0Þ ¼ �sðEÞpðE! E0Þ: ð2:50Þ
A similar expression applies to mixtures of nuclides:
�sðE! E0Þ ¼P
i
Ni�siðE! E0Þ; ð2:51Þ
where
�siðE! E0Þ ¼ �siðEÞpiðE! E0Þ: ð2:52Þ
Alternately Eq. (2.50) is directly applicable, provided we define thecomposite scattering probability as
pðE! E0Þ ¼ 1
�sðEÞX
i
�siðEÞpiðE! E0Þ: ð2:53Þ
Slowing Down Decrement
The most widely employed measure of a nuclide’s ability to slowneutrons down by elastic scattering is the slowing down decrement.It is defined as the mean value of the logarithm of the energy lossratio or lnðE=E0Þ:
� lnðE=E0Þ ¼Z
lnðE=E0ÞpðE! E0ÞdE0: ð2:54Þ
Employing Eq. (2.47) once again we have
¼Z E
ElnðE=E0Þ 1
ð1� ÞE dE0; ð2:55Þ
which reduces to
¼ 1þ
1� ln: ð2:56Þ
The slowing down decrement is independent of the energy of thescattered neutron. Thus in elastic collisions the neutron loses onaverage the same logarithmic fraction of its energy, regardless of itsinitial energy, for depends only on the atomic mass of the scatteringnuclide. The slowing down decrement may be expressed in terms of
50 Fundamentals of Nuclear Reactor Physics

the atomic mass of the scattering nuclide. Thus for A = 1, = 1, andfor A > 1 a reasonable approximation is
� 2
Aþ 2=3; ð2:57Þ
which gives an error of roughly 3% for A = 2, and successively smal-ler errors for larger values of A.
Using the definition of we may make a rough estimate of thenumber n of elastic collisions required to slow a neutron from fissionto thermal energy. Suppose we let E1, E2, E3, . . ., En be the neutronenergies after the first, second, third, and so on collisions. Then
lnðE0=EnÞ ¼ lnðE0=E1Þ þ lnðE1=E2Þ þ lnðE3=E3Þ þ � � � þ lnðEn�1=EnÞ:ð2:58Þ
Assuming that each of the n terms can be replaced by the averagelogarithmic energy loss , we have
n ¼ 1
lnðE0=EnÞ: ð2:59Þ
Taking fission energy as E0 = 2 MeV and thermal energy as En = 0.025 eV,we have lnðE0=EnÞ ¼ lnð2:0 � 106=0:025Þ ¼ 18:2 and hence n ¼ 18:2=.Thus for hydrogen n� 18, for deuterium (A = 2) n� 25, for carbon(A = 12) n� 115, and for uranium-238 n� 2275. From this we observethat if we desire to slow neutrons down to thermal energies, light atomicweight materials are desirable components of a reactor core. Conversely,if fast neutrons are desired, lightweight materials should be avoided.Chapter 3 focuses considerable attention on elastic scattering, as wellas the other properties of neutron cross sections, in examining theireffects on the neutron energy spectra in reactors.
In situations where more than one nuclide is present, an averageslowing down decrement may be derived by employing Eqs. (2.53) inEq. (2.54):
� ¼ 1
�sðEÞX
i
�siðEÞZ
lnðE=E0ÞpiðE! E0ÞdE0: ð2:60Þ
Employing Eq. (2.47) for the scattering kernel with ! i thenleads to
� ¼ 1
�s
Xi
i�si; ð2:61Þ
Neutron Interactions 51

where for brevity we have assumed energy-independent scatteringcross sections.
Suppose, for example, we want to evaluate H2O. In the denomi-nator, we may use Eq. (2.14) for the scattering cross section of waterdirectly, �H2O
s ¼ NH2O 2�H þ �O� �
. However, in the numerator wemust use �H
s ¼ 2NH2O�Hs and �O
s ¼ NH2O�O, the macroscopic cross
sections of hydrogen and oxygen, separately. After cancellation ofNH2O from numerator and denominator, Eq. (2.61) becomes
H2O ¼2H�
Hs þ O�
Os
2�Hs þ �O
s
; ð2:62Þ
with �Hs ¼ 20 b and �O
s ¼ 3:8 b, knowing that H ¼ 1 and from Eq. (2.57)that O ¼ 2=ð16þ 2=3Þ ¼ 0:12 we have H2O ¼ ð2 � 1 � �H
s þ 0:12 � �Os Þ=
ð2 � �Hs þ �O
s Þ ¼ 0:924.
Inelastic Scattering
The situation for inelastic scattering is quite different. Elastic scatter-ing cross sections are significant over the entire energy range of neu-trons. But whereas low atomic weight nuclei cause large energy lossesfor elastic scattering, heavy isotopes do not, and so the effects of theirelastic scattering on reactor physics are small. Conversely, as discussedearlier, only neutrons with energies above a threshold that is a char-acteristic of the target isotope can scatter inelastically. Moreover, thesethresholds are low enough for significant inelastic scattering to occuronly for the heavier atomic weight materials, such as uranium.
Inelastic scattering causes neutrons to lose substantial energy.The unique structure of energy levels that characterizes each nuclide,such as those illustrated in Fig. 2.5, determines the energies of inelas-tically scattered neutrons. To scatter inelastically the neutron mustelevate the target nucleus to one of these states, from which it decaysby emitting one or more gamma rays. The threshold for inelasticscattering is determined by the energy of the lowest excited state ofthe target nucleus, whereas the neutron’s energy loss is determinedpredominantly by the energy level of the state that it excites. For
E1
E2
E3
EE ′
FIGURE 2.11 Inelastically scattered neutrons from energy E to E0:
52 Fundamentals of Nuclear Reactor Physics

example, if the neutron energy E is greater than the first three energylevels E1, E2, or E3, then following the inelastic scatter the neutronwould have energy E0= E�E1, E�E2, or E�E3. This is illustrated inFig. 2.11. The peaks, however, are slightly smeared over energy, sinceas in elastic scattering conservation of momentum requires that aneutron deflected through a larger angle will lose more energy thanone deflected through a smaller angle. As the energy of the incidentneutron increases, the spectrum of scattered neutrons can becomequite complex if many states can be excited by the neutron’s energy.
Bibliography
Bell, George I., and Samuel Glasstone, Nuclear Reactor Theory, VanNostrand Reinhold, NY, 1970.
Cullen, D. E., ‘‘Nuclear Cross Section Preparation’’ CRC Handbook ofNuclear Reactor Calculations, I, Y. Ronen, ed., CRC Press, Boca Raton,FL, 1986.
Duderstadt, James J., and Louis J. Hamilton, Nuclear Reactor Analysis,Wiley, NY, 1976.
Jakeman, D., Physics of Nuclear Reactors, Elsevier, NY, 1966.Mughabghab, S. F., Atlas of Neutron Resonances, Elsevier, Amsterdam,
2006.Stacey, Weston M., Nuclear Reactor Physics, Wiley, NY, 2001.Templin, L. J. ed., Reactor Physics Constants, 2nd ed., ANL-5800, Argonne
National Laboratory, Argonne, IL, 1963.Weinberg, A. M., and E. P. Wigner, The Physical Theory of Neutron Chain
Reactors, University of Chicago Press, Chicago, 1958.
Problems
2.1. Neutrons impinge on a material with a cross section of� = 0.8 cm�1. How thick must the material be if no more than5.0% of the neutrons are to penetrate the material withoutmaking a collision? What fraction of the neutrons make theirfirst collision within the first 2.0 cm of the material?
2.2. The uncollided flux at a distance r from a point source emittingneurons is given by Eq. (2.9).
a. If you are 1 m away from a very small 1-Ci source of neutrons,what is the flux of neutrons in n/cm2/s, neglecting scatteringand absorption in air?
b. If a shield is placed between you and the source, whatabsorption cross section would be required to reduce theflux by a factor of 10?
Neutron Interactions 53

c. Suppose the shield made of the material specified in part b isonly 0.5 m thick. How far must you be from the source, forthe flux to be reduced by the same amount as in part b?
2.3. A material has a neutron cross section of 3.50� 10�24 cm2/nuclei, and contains 4.20� 1023 nuclei/cm3.
a. What is the macroscopic cross section?b. What is the mean free path?c. If neutrons impinge perpendicularly on a slab of the material
that is 3.0 cm thick what fraction of them will penetrate theslab without making a collision?
d. What fraction of the neutrons in part c will collide in the slabbefore penetrating a distance of 1.5 cm?
2.4. A boiling water reactor operates at 1000 psi. At that pressure thedensity of water and of steam are, respectively, 0.74 g/cm3 and0.036 g/cm3. The microscopic cross sections of H and O thermalcross sections are 21.8 b and 3.8 b.
a. What is the macroscopic total cross section of the water?b. What is the macroscopic total cross section of the steam?c. If, on average, 40% of the volume is occupied by steam, then
what is the macroscopic total cross section of the steam–water mixture?
d. What is the macroscopic total cross section of water underatmospheric conditions at room temperature?
2.5.* Determine the following:
a. The fraction of fission neutrons born with energies of lessthan 0.1 MeV.
b. The fraction of fission neutrons born with energies greaterthan 10 MeV.
2.6. Neutrons are distributed in the Maxwell-Boltzmann distributiongiven by Eq. (2.34):
a. Verify Eq. (2.35).b. Verify Eq. (2.33).c. Determine the most probable neutron energy.
2.7. How may parts per million of boron must be dissolved in waterat room temperature to double its absorption cross section forthermal neutrons?
2.8. What is the total macroscopic thermal cross section ofuranium dioxide (UO2) that has been enriched to 4%?Assume �25 ¼ 607:5 b, �28 ¼ 11:8 b, �O ¼ 3:8b, and that UO2
has a density of 10.5 g/cm3.
54 Fundamentals of Nuclear Reactor Physics

2.9. In the Breit-Wigner formula for the capture cross sectionshow that G is equal to the width of the resonance at halfheight. What, if any, assumptions must you make to obtainthis result?
2.10. Verify Eqs. (2.46) and (2.56).
2.11. Boron is frequently used as a material to shield against thermalneutrons. Using the data in Appendix E, estimate the thicknessof boron required to reduce the intensity of a neutron beam byfactors 100, 1000, 10,000, and 100,000.
2.12. A 5.0-cm-thick layer of purely absorbing material is found toabsorb 99.90% of a neutron beam. The material is knownto have a density of 4.0� 1022 nuclei/cm3. Determine thefollowing:
a. The macroscopic cross section.b. The mean free path.c. The microscopic cross section.d. Is the cross section as big as a barn?
2.13. Equal volumes of graphite and iron are mixed together. Fifteenpercent of the volume of the resulting mixture is occupiedby air pockets. Find the total macroscopic cross section giventhe following data: �C = 4.75 b, �Fe = 10.9 b, �C = 1.6 g/cm3,�Fe = 7.7 g/cm3. Is it reasonable to neglect the cross section ofair? Why?
2.14. Neutrons scatter elastically at 1.0 MeV. After one scatteringcollision, determine the fraction of the neutrons that willhave energies of less than 0.5 MeV if they scatter from thefollowing:
a. Hydrogen.b. Deuterium.c. Carbon-12.d. Uranium-238.
2.15. What is the minimum number of elastic scattering collisionsrequired to slow a neutron down from 1.0 MeV to 1.0 eV in thefollowing?
a. Deuterium.b. Carbon-12.c. Iron-56.d. Uranium-238.
2.16. Using the macroscopic scattering cross sections in AppendixTable E-3, calculate the slowing down decrement for UO2,
Neutron Interactions 55

where U is natural uranium. Does the presence of oxygenhave a significant effect on the slowing down decrement?
2.17. Prove that ¼ 1 for hydrogen.
2.18. a. Show that for elastic scattering E� E0 �RðE� E0ÞpðE! E0ÞdE0
is equal to 1=2ð1� ÞE.b. Evaluate E� E0 for ordinary water.
56 Fundamentals of Nuclear Reactor Physics

CHAPTER 3
Neutron Distributionsin Energy
3.1 Introduction
In Chapter 1 we briefly introduced the concept of neutron multi-plication, defining it as
k ¼ number of neutrons in ithþ 1 generation
number of neutrons in ith generation, ð3:1Þ
where neutrons in a particular generation are considered to be born infission, undergo a number of scattering collisions, and die in absorp-tion collisions. Understanding what determines the magnitude of themultiplication is central to the study of neutron chain reactions. Thischapter examines the determinants of multiplication with primaryemphasis placed on the kinetic energy of the neutrons, for as we sawin Chapter 2, the basic data—the neutron cross sections—arestrongly energy dependent. These energy dependencies define thetwo broad classes of reactors: thermal and fast. We first discuss theproperties of nuclear fuel and of materials that moderate the neutronspectrum. With this background we proceed to provide a moredetailed description of the energy distributions of neutrons in nuclearreactors, and then discuss the averaging of neutron cross sectionsover energy. We conclude by defining the neutron multiplication interms of energy-averaged cross sections.
This chapter’s discussions maintain two simplifications in orderto focus the analysis on the energy variable. First, we assume that allneutrons are produced instantaneously at the time of fission, post-poning discussion of the effects created by the small fraction ofneutrons whose emission following fission is delayed until thedetailed treatment of reactor kinetics in Chapter 5. Second, we deferanalysis of the spatial distributions of neutrons in nuclear reactors tolater chapters. For now we take the finite size of a reactor into account
57

simply by noting that for many systems the multiplication can byapproximated by
k ¼ k1PNL; ð3:2Þ
where PNL is the neutron nonleakage probability and k1 is the multi-plication that would exist if a reactor’s dimensions were infinitelylarge. Chapters 6 and 7 treat neutron leakage and other spatial effectsin some detail. Our focus here is on neutron energy, and howthe energy dependence of the cross sections dominates the determi-nation of k1.
3.2 Nuclear Fuel Properties
Much of the physics of nuclear reactors is determined by the energydependence of the cross sections of fissile and fertile materials overthe range of incident neutron energies between the fission spectrumand the Maxwell-Boltzmann distribution of thermal neutrons, thusover the range between roughly 10 MeV and 0.001 eV. Recall thatfissile nuclides have significant fission cross sections over this entirerange as indicated by Figs. 2.9 and 2.10 for those of uranium-235 andplutonium-239. In contrast, fission of a fertile material is possibleonly for incident neutrons above some threshold; Fig. 2.8 indicatesthat the threshold for uranium-238 is at approximately 1.0 MeV. Notall of the neutrons absorbed by a fissile nucleus will cause fission.Some fraction of them will be captured, and that fraction is alsoenergy dependent. As a result, the number of fission neutrons pro-duced per neutron absorbed plays a central role in determining areactor’s neutron economy:
�ðEÞ ¼��fðEÞ�aðEÞ
¼ fission neutrons produced
neutrons absorbed; ð3:3Þ
where � is the number of neutrons produced per fission, and
�aðEÞ ¼ ��ðEÞ þ �fðEÞ: ð3:4Þ
To sustain a chain reaction, the average value of eta must be sub-stantially more than one, for in a power reactor neutrons will be lostto absorption in structural, coolant, and other materials, and somewill leak out of the system.
To examine the behavior of �ðEÞ we first consider a single fissileisotope. We may then cancel the number densities from numeratorand denominator of Eq. (3.3) to obtain
58 Fundamentals of Nuclear Reactor Physics

�ðEÞ ¼��fðEÞ�aðEÞ
: ð3:5Þ
From the plots of �ðEÞ shown in Fig. 3.1 for uranium-235 and pluto-nium-239 we see that concentrating neutrons at either high or lowenergies and avoiding the range between roughly 1.0 eV and 0.1 MeVwhere the curves dip to their lowest values most easily achieves achain reaction. Except for naval propulsion systems designed for themilitary, however, fuels consisting predominately of fissile materialare not employed in power reactors. Enrichment and fabrication costswould render them uneconomical. More importantly, the fuel would
0.0
1.0
2.0
3.0
4.0
5.0
6.0
1.0E–04 1.0E–02 1.0E+00 1.0E+02 1.0E+04 1.0E+06 1.0E+08
Energy (eV)
(a) Uranium-235
Eta
(b) Plutonium-239
0.0
1.0
2.0
3.0
4.0
5.0
6.0
1.0E–04 1.0E–02 1.0E+00 1.0E+02 1.0E+04 1.0E+06 1.0E+08
Energy (eV)
Eta
FIGURE 3.1 �ðEÞ for fissile isotopes (courtesy of W. S. Yang, ArgonneNational Laboratory). (a) Uranium-235, (b) Plutonium-249.
Neutron Distributions in Energy 59

constitute weapons grade uranium or plutonium that would com-pound the problems of nuclear proliferation. Reactor fuels consistprimarily of uranium-238 with a smaller fraction of fissile material,referred to as its enrichment. Depending on the design, civilian reactorfuels normally consist of uranium with enrichments ranging from the0.7% of natural uranium up to approximately 20% fissile material.
To determine �ðEÞ for a reactor fuel, we first define theenrichment ~e as the atom ratio of fissile to fissionable (i.e., fertileplus fissile) nuclei:
~e ¼Nfi
Nfe þNfi; ð3:6Þ
where fi and fe denote fissile and fertile. Equation (3.3) then reduces to
�ðEÞ ¼~e�� fi
f ðEÞ þ ð1� ~eÞ�� fef ðEÞ
~e� fia ðEÞ þ ð1� ~eÞ� fe
a ðEÞ: ð3:7Þ
Figure 3.2 provides plots of �ðEÞ for natural (0.7%) and 20%enriched uranium. These curves illustrate the dramatic effect thatthe capture cross section of uranium-238 has in deepening the valleyin �ðEÞ through the intermediate energy range. Conversely, above itsthreshold value 1.0 MeV, the increasing fission cross section of ura-nium-238 aids strongly in increasing the value of �ðEÞ. The curvesemphasize why power reactors are classified as fast or thermal
natural uranium
20% enrichment
0.0
1.0
2.0
3.0
4.0
5.0
6.0
1.0E–04 1.0E–02 1.0E+00 1.0E+02 1.0E+04 1.0E+06 1.0E+08
Energy (eV)
Eta
FIGURE 3.2 �ðEÞ for natural and 20% enriched uranium (courtesy ofW. S. Yang, Argonne National Laboratory).
60 Fundamentals of Nuclear Reactor Physics

according to the energy spectra over which neutrons are concen-trated, and why no intermediate spectrum reactors have been built.
Reactor designs must concentrate neutrons either in the fast orthe thermal energy range and thus avoid the sharp valley that �ðEÞexhibits over intermediate energies. As Chapter 2 emphasizes, scat-tering collisions cause neutrons to lose energy until they approachequilibrium in the thermal neutron range. Thus for fast reactor cores,designers eliminate materials other than the fuel as much as possible.They avoid low atomic weight materials in particular, for elasticscattering in such materials quickly reduces neutron energies tolevels to where resonance capture in uranium-238 predominates.Even if all other materials could be eliminated, however, a fastreactor fueled with natural uranium is not possible, for the largeinelastic scattering cross section of the 99.3% uranium-238 wouldthen cause the fission neutrons to fall too quickly into the intermedi-ate energy range. Consequently, fast reactors require fuels enrichedto more than 10%.
For thermal reactors the situation is reversed. The reactor mustcontain a substantial quantity of low atomic weight material,referred to as a moderator. Its purpose is to slow down neutronspast the valley in �ðEÞ with relatively few collisions to the thermalenergies where the fuel’s ratio of neutron production to absorptionagain exceeds one by a substantial margin. With optimized ratios ofmoderator to fuel, thermal reactors can be designed with much lowerenrichments than fast reactors; with some moderators—most nota-bly graphite or heavy water—thermal reactors may be fueled withnatural uranium. To understand why this is so we must examine theproperties of moderators more closely.
3.3 Neutron Moderators
In thermal reactors moderator materials are required to reduce theneutron energies from the fission to the thermal range with as fewcollisions as possible, thus circumventing resonance capture of neu-trons in uranium-238. To be an effective moderator a material musthave a low atomic weight. Only then is �—the slowing down decre-ment defined by Eq. (2.54)—large enough to slow neutrons down tothermal energies with relatively few collisions. A good moderator,however, must possess additional properties. Its macroscopic scatter-ing cross section must be sufficiently large. Otherwise, even though aneutron colliding with it would lose substantial energy, in the com-petition with other materials, too few moderator collisions wouldtake place to have a significant impact on the neutron spectrum.Thus a second important parameter in determining a material’svalue as a moderator is the slowing down power, defined as ��s,
Neutron Distributions in Energy 61

where �s ¼ N�s is the macroscopic scattering cross section. Notethat the number density N must not be too small. Thus gases areeliminated. Helium, for example, has sufficiently large values of �and �s to be a good moderator but its number density is too small tohave a significant impact on the energy distribution of neutrons in areactor. Conversely, for the same reason gases such as helium may beconsidered as coolants for fast reactors since they do not degrade theneutron spectrum appreciably.
Table 3.1 lists values of the slowing down decrement and powerfor the three most common moderators. The table also includes theslowing down ratio: the ratio of the material’s slowing down power toits thermal absorption cross section. If the thermal absorption crosssection �a Ethermalð Þ is large, a material cannot be used as a moderator;even though it may be effective in slowing down neutrons to thermalenergy, it will then absorb too many of those same neutrons beforethey can make collisions with the fuel and cause fission. Note thatheavy water has by far the largest slowing down ratio, followed bygraphite and then by ordinary water. Power reactors fueled by naturaluranium can be built using D2O as the moderator. Because graphitehas poorer moderating properties, the design of natural uraniumfueled power reactors moderated by graphite is a more difficult under-taking. Reactors using a light water moderator and fueled withnatural uranium are not possible; some enrichment of the uraniumis required to compensate for the larger thermal absorption crosssection of the H2O.
Large thermal absorption cross sections eliminate other materialsas possible moderators. For example, boron-10 has reasonable values ofthe slowing down decrement and power. Its thermal absorption crosssection, however, is nearly 4000 b. As a result boron cannot be used asa moderator but is, in fact, one of the more common neutron‘‘poisons,’’ which are used to control or shut down the chain reactions.
The foregoing discussion focuses on elastic scattering, sinceinelastic scattering tends to be of much less importance in determin-ing the energy distribution of neutrons in thermal reactors. Thelighter weight materials either have no inelastic scattering cross
TABLE 3.1Slowing Down Properties of Common Moderators
Slowing DownDecrement
Slowing DownPower
Slowing DownRatio
Moderator � ��s ��s=�aðthermalÞH2O 0.93 1.28 58D2O 0.51 0.18 21,000C 0.158 0.056 200
62 Fundamentals of Nuclear Reactor Physics

section, or if they do, they are zero below a threshold that is quitehigh in energy. Fertile and fissile materials do have inelastic scatter-ing above thresholds in the keV to MeV range. In thermal reactorsinelastic collisions only modestly augment the slowing down byelastic scattering. The situation is quite different in fast reactorswhere the absence of moderator material causes inelastic scatteringto become more important. Inelastic scattering of the fuel along withelastic scattering with the coolant and structural materials are theprimary causes for unwanted energy spectrum degradation.
3.4 Neutron Energy Spectra
To recapitulate, the distribution of neutrons in energy is determinedlargely by the competition between scattering and absorption reac-tions. For neutrons with energies significantly above the thermalrange, a scattering collision results in degradation of the neutronenergy, whereas neutrons in thermal equilibrium have near equalprobabilities of gaining or losing energy when interacting with thethermal motions of the nuclei that constitute the surrounding med-ium. In a medium for which the average energy loss per collision andthe ratio of scattering to absorption cross section are both large, theneutron distribution in energy will be close to thermal equilibriumand is then referred to as a soft or thermal spectrum. Conversely in asystem with small ratios of neutron degradation to absorption, neu-trons are absorbed before significant slowing down takes place. Theneutron distribution then lies closer to the fission spectrum and issaid to be hard or fast.
The neutron distribution may be expressed in terms of the den-sity distribution
~n000ðEÞdE ¼ number of neutrons/cm3
with energies between E and Eþ dE;
�ð3:8Þ
which means that
n000 ¼Z 1
0
~n000ðEÞdE ¼ total number of neutrons/cm3: ð3:9Þ
The more frequently used quantity, however, is the neutron fluxdistribution defined by
’ðEÞ ¼ vðEÞ~n000ðEÞ; ð3:10Þ
where vðEÞ is the neutron speed corresponding to kinetic energy E.
Neutron Distributions in Energy 63

The flux, often called the scalar flux, has the following physicalinterpretation: ’ðEÞdE is the total distance traveled during one sec-ond by all neutrons with energies between E and dE located in 1 cm3.Likewise, we may interpret the macroscopic cross section as
�xðEÞ ¼Probability/cm of flight of a neutronwith energy E undergoing a reaction of type x:
�ð3:11Þ
Thus multiplying a cross section by the flux, we have
�xðEÞ’ Eð ÞdE ¼ Probable number of collisions of type x=s=cm3
for neutrons with energies between E and dE:
�ð3:12Þ
Finally, we integrate over all energy to obtain
Z 10
�xðEÞ’ðEÞdE ¼ Probable number of collisionsof type x=s=cm3 of all neutrons:
�ð3:13Þ
This integral is referred to as a reaction rate, or if x = s, a, f as thescattering, absorption, or fission rate.
A more quantitative understanding of neutron energy distribu-tions results from writing down a balance equation in terms of theneutron flux. Since �ðEÞ’ðEÞ is the collision rate—or number ofneutrons of energy E colliding/s/cm3—each such collision removesa neutron from energy E either by absorption or by scattering to adifferent energy. We may thus regard it as a loss term that must bebalanced by a gain of neutrons arriving at energy E. Such gains maycome from fission and from scattering. The number coming fromfission will be �ðEÞ, given by Eq. (2.31). We next recall that theprobability that a neutron that last scattered at energies between E0
and E0 þ dE0 will be scattered to an energy E as pðE0 ! EÞdE0. Since thenumber of neutrons scattered from energy E0 is �sðE0Þ’ðE0Þ, the scat-tering contribution comes from integrating pðE0 ! EÞ�sðE0Þ’ðE0ÞdE0
over E0. The balance equation is thus
�tðEÞ’ðEÞ ¼Z
pðE0 ! EÞ�sðE0Þ’ðE0ÞdE0 þ �ðEÞs000f : ð3:14Þ
The specific form of pðE0 ! EÞ for elastic scattering by a singlenuclide is given by Eq. (2.47), whereas Eq. (2.53) defines the compo-site probability for situations where the cross sections are sums overmore than one nuclide. For brevity we write the foregoing equation as
64 Fundamentals of Nuclear Reactor Physics

�tðEÞ’ðEÞ ¼Z
�sðE0 ! EÞ’ðE0ÞdE0 þ �ðEÞs000f , ð3:15Þ
where as in Eq. (2.50) we take �sðE0 ! EÞ ¼ pðE0 ! EÞ�sðE0Þ. Thebalance equation is normalized by the fission term, which indicatesa rate of s000f fission neutrons produced/s/cm3.
Using Eq. (3.15) to examine idealized situations over three dif-ferent energy ranges provides some insight into the nature of neutronspectra, particularly of thermal reactors. First, we consider fast neu-trons, whose energies are sufficient that �ðEÞ is significant. Normallythe lower limit to this range is about 0.1 MeV. We then examineintermediate energy neutrons, which have energies below the rangewhere fission neutrons are produced but sufficiently high that up-scatter—that is, energy gained in a collision as a result of the thermalmotion of the scattering nuclide—can be ignored. The lower cutofffor intermediate neutrons is conventionally taken as 1.0 eV. Theintermediate energy range is often referred to as the resonance orslowing down region of the energy spectra because of the importanceof these two phenomena. Third, we discuss slow or thermal neutronsdefined as those with energies less than 1.0 eV; at the lower energiesthermal motions of the surrounding nuclei play a predominant rolein determining the form of the spectrum. In each of the three energyranges general restrictions apply to Eq. (3.15). In the thermal andintermediate ranges no fission neutrons are born and thus �ðEÞ= 0.In the intermediate and fast ranges there is no up-scatter, and there-fore �sðE0 ! EÞ ¼ 0 for E0 < E.
Fast Neutrons
Over the energy range where fission neutrons are born both terms onthe right of Eq. (3.15) contribute; near the top of that range the fissionspectrum �ðEÞ dominates, since on average even one scattering colli-sion will remove a neutron to a lower energy. In that case we maymake the rough approximation,
’ðEÞ � �ðEÞs000f =�tðEÞ, ð3:16Þ
which only includes the uncollided neutrons: those emitted fromfission but yet to make a scattering collision. Even in the absenceof moderators or other lower atomic weight materials the spectrumwill be substantially degraded as a result of inelastic scattering colli-sions with uranium or other heavy elements. The presence of evensmall amounts of lighter weight materials, such as the metals usedwithin a reactor core for structural support, adds to the degradation ofthe fast spectrum. Neutron moderators, of course greatly accelerate
Neutron Distributions in Energy 65

the slowing down of neutrons out of the fast range. In fast reactors,where lightweight materials are avoided, most of the neutrons areabsorbed before scattering collisions slow them down below the low-energy tail of the fission spectrum.
Neutron Slowing Down
We next examine the energy range that extends below where �ðEÞ issignificant but higher than the thermal energy range, where thethermal motions of the nuclei must be taken into account.
The Slowing Down Density
A useful concept for treating neutrons in this energy range is theslowing down density, which we define as
qðEÞ ¼ number of neutrons slowing downpast energy E=s=cm3:
�ð3:17Þ
At energies greater than where up-scatter occurs, any neutron pro-duced by fission that is not absorbed at a higher energy must slowdown past that energy. Thus
qðEÞ ¼ �Z 1
E
�aðE0Þ’ðE0ÞdE0 þZ 1
E
�ðE0ÞdE0 s000f ; E> 1:0 eV: ð3:18Þ
In the intermediate range, below where fission neutron produc-tion is significant, the normalization of �ðE0Þ given by Eq. (2.32)simplifies Eq. (3.18) to
qðEÞ ¼ �Z 1
E
�aðE0Þ’ðE0ÞdE0 þ s000f ; 1:0 eV< E < 0:1 MeV: ð3:19Þ
Taking the derivative, we have
d
dEqðEÞ ¼ �aðEÞ’ðEÞ: ð3:20Þ
Thus qðEÞdecreases as the neutrons slow down in proportion to theabsorption cross section; if there is no absorption over some energyinterval then the slowing down density remains constant.
In the intermediate range the primary form of absorption comesfrom the resonance capture cross sections discussed in Chapter 2.However, between those resonances the absorption cross section issmall enough to be ignored. Thus between resonances we see fromEq. (3.20) that the slowing down density is independent of energy.
66 Fundamentals of Nuclear Reactor Physics

Moreover, since we are below the energies where fission neutrons areproduced, with no absorption, Eq. (3.14) simplifies to
�sðEÞ’ðEÞ ¼Z
pðE0 ! EÞ�sðE0Þ’ðE0ÞdE0: ð3:21Þ
Thus we can obtain a particularly simple relationship between ’ðEÞand q, the constant slowing down density. We next assume that weare below the threshold for inelastic scattering, and that only asingle scattering material—normally a moderator—is present. (Wemay later modify the expression for combinations of materials.)Equation (2.47) provides the kernel for elastic scattering. Substitutingit into Eq. (3.21) yields
�sðEÞ’ðEÞ ¼Z E=�
E
1
ð1� �ÞE0�sðE0Þ’ðE0ÞdE0: ð3:22Þ
The solution may be shown to be
�sðEÞ’ðEÞ ¼ C=E ð3:23Þ
by simply inserting this expression into Eq. (3.22).The normalization constant C is proportional to q, the number of
neutrons slowed down by scattering past energy E. Examining Fig. 3.3,we observe that the number of neutrons that made their last scatter atE0 (>E) to energies E00 (<E) will fall in the interval �E0 �E00 �E. More-over, only neutrons with initial energies E’ between E and E=� arecapable of scattering to energies below E. Hence the number of neu-trons slowing down past E per cm3 in one second is
q ¼Z E=�
E
Z E
�E0
1
ð1� �ÞE0�sðE0Þ’ðE0ÞdE00� �
dE0: ð3:24Þ
Substituting Eq. (3.23) for the flux, and performing the double inte-gration, we obtain
q ¼ 1þ �
1� � ln�h i
C: ð3:25Þ
E ′E ′
EE ″α E E /α
FIGURE 3.3 Energy loss from elastic scattering from energy E0 to E00.
Neutron Distributions in Energy 67

Noting that the bracketed term is identical to �, the slowing downdecrement defined by Eq. (2.56), we may combine Eqs. (3.23) and(3.25) to represent the flux in terms of the slowing down density
’ðEÞ ¼ q
��sðEÞE: ð3:26Þ
This expression may be extended to situations where more thanone scattering nuclide is present by adding their contributions toEqs. (3.22) and (3.24). Suppose both fuel and moderator are present.Equation (3.26) still holds, where the scattering cross section becomesthe sum over fuel and moderator, and the slowing down decrement isreplaced by the weighted average defined by Eq. (2.61):
�� ¼ �f�f
sðEÞ þ �m�ms ðEÞ
�fsðEÞ þ �m
s ðEÞ: ð3:27Þ
Between resonances the fuel and moderator scattering cross sec-tions are nearly independent of energy. The flux is then proportionalto 1/E—and referred to as a ‘‘one-over-E’’ flux. Since the moderator ismuch lighter than the fuel, �f� �m, the fuel contribution to Eq. (3.26)is much less than that of the moderator.
Energy Self-Shielding
In the presence of resonance absorber, the flux is no longer propor-tional to 1=E. However, we may obtain a rough estimate of its energydependence by making some reasonable approximations. We assumethat only fuel and moderator are present, and that only elastic scat-tering takes place. Equation (3.14) then reduces to
�tðEÞ’ðEÞ ¼Z E=�f
E
1
ð1� �fÞE0�f
sðE0Þ’ðE0ÞdE0
þZ E=�m
E
1
ð1� �mÞE0�ms ðE0Þ’ðE0ÞdE0;
ð3:28Þ
where for the energy range of resonance absorbers we have set�ðEÞ ¼ 0. Recall from Chapter 2 that a resonance is characterized bya width �. If the resonances are widely spaced, then the bulk of theresonance absorption will take place within about �� of the reso-nance energy. Moreover, outside this interval absorption can beignored and the flux approximated as /1=E.
Scattering into the energy interval where absorption is mostpronounced originates over a larger energy interval: between E and
68 Fundamentals of Nuclear Reactor Physics

EþE=�f for the fuel, and between E and EþE=�m for the moderator.In the narrow resonance approximation, which is valid for all but afew resonances, we assume both of these intervals to be much largerthan the resonance width, as shown schematically in Fig. 3.4. In thiscase the preponderance of the areas under the integrals in Eq. (3.28)are occupied by the 1/E flux between resonances where absorptioncan be ignored and the scattering cross sections are energy indepen-dent. Thus we may insert Eq. (3.26) into the right side of Eq. (3.28)without much loss of accuracy. We evaluate the integrals withenergy-independent constant cross section to obtain
’ðEÞ ¼ q
��tðEÞE; ð3:29Þ
where q is the neutron slowing down density above the resonance.Note that the only difference from Eq. (3.26) is that in the denomi-nator the scattering has been replaced by the total cross section.
The total cross section, of course, includes both resonanceabsorption and scattering cross sections. Thus it increases greatly,causing the flux to decrease correspondingly, at energies where reso-nance absorption takes place. Such flux depression—illustratedin Fig. 3.4—is referred to as energy self-shielding. According toEqs. (3.19) and (3.20), as neutrons slow down through a resonancethe slowing down density is reduced by
Z’ðEÞ�aðEÞdE �
Z�aðEÞ�tðEÞE
dEq
�:ð3:30Þ
Since self-shielding reduces the flux where the absorption crosssection is large, it reduces overall neutron losses to absorption, andthus aids the propagation of the chain reaction. In the following chapterwe will see that by lumping the fuel spatial self-shielding of the reso-nances serves further to reduce the absorption losses of neutrons. Other
E ′
E ϕ (E )
E r /αƒ
σa (E )
E r
FIGURE 3.4 Energy loss from elastic scattering from energy to E0=E00.
Neutron Distributions in Energy 69

approximations can be applied when the resonance width is wider, butthe qualitative effects of energy self-shielding remain the same.
Thermal Neutrons
At lower energies, in the thermal neutron range, we again useEq. (3.15) as our starting point. The fission term on the right vanishes.The source of neutrons in this case comes from those scattering downfrom higher energies. We may represent this as a scattering source.We divide the integral in Eq. (3.15) according to whether E is less thanor greater than the cutoff energy for the thermal neutron range, typi-cally taken as Eo¼ 1:0 eV. We then partition the equation as
�tðEÞ’ðEÞ ¼Z Eo
0�sðE0 ! EÞ’ðE0ÞdE0 þ sðEÞqo; E < Eo; ð3:31Þ
where
sðEÞqo ¼Z 1
Eo
�sðE0 ! EÞ’ðE0ÞdE0; E < Eo; ð3:32Þ
is just the source of thermal neutrons that arises from neutrons making acollision at energies E0 > Eo, but having an energy of E < Eo after thatcollision. The source may be shown to be proportional to the slowingdown density at Eo, and if pure scattering and a 1/E flux is assumed atenergies E0 > Eo, a simple expression results for s(E), the energy distribu-tion of the source neutrons. In the thermal range the scattering distribu-tion is difficult to represent in a straightforward manner, for not onlythermal motion, but also binding of the target nuclei to molecules orwithin a crystal lattice must be factored into the analysis.
We may gain some insight by considering the idealized case of apurely scattering material. Then the solution of Eq. (3.31) wouldbecome time dependent, for without absorption in an infinite me-dium the neutron population would grow continuously with timesince each slowed down neutron would go on scattering forever. Ifafter some time the slowing down density were set equal to zero, anequilibrium distribution would be achieved satisfying the equation
�sðEÞ’MðEÞ ¼Z Eo
0�sðE0 ! EÞ’MðE0ÞdE0: ð3:33Þ
One of the great triumphs of kinetic theory was the proof that forthis equation to be satisfied, the principle of detained balance mustbe obeyed. Detailed balance states that
70 Fundamentals of Nuclear Reactor Physics

�sðE! E0Þ’MðEÞ ¼ �sðE0 ! EÞ’MðE0Þ; ð3:34Þ
no matter what scattering law is applicable. Equally important,the principle states that in these circumstances the flux thatsatisfied this condition is the form found by multiplying the famedMaxwell-Boltzmann distribution, given by Eq. (2.34), by the neutronspeed to obtain
’MðEÞ ¼1
ðkTÞ2E expð�E=kTÞ ð3:35Þ
following normalization to
Z 10’MðEÞdE ¼ 1: ð3:36Þ
In reality some absorption is always present. Absorption shiftsthe thermal neutron spectrum upward in energy from the Maxwell-Boltzmann distribution, since complete equilibrium is never reachedbefore neutron absorption takes place. Figure 3.5 illustrates theupward shift, called spectral hardening, which increases with thesize of the absorption cross section. Nevertheless, Eq. (3.35) providesa rough approximation to a reactor’s thermal neutron distribution.A somewhat better fit to hardened spectra, such as those in Fig. 3.5,may be obtained by artificially increasing the temperature T by anamount that is proportional to �a=��s.
kT E
Maxwelliandistribution(Σa = 0)
Thermal spectrum(Moderate value of Σa (E ))
Φ(E )Thermal spectrum(High value of Σa (E ))
FIGURE 3.5 Thermal spectra compared to a Maxwell-Boltzmanndistribution (adapted from A. F. Henry, Nuclear-Reactor Analysis, 1975,by permission of the MIT Press).
Neutron Distributions in Energy 71

Fast and Thermal Reactor Spectra
Figure 3.6 shows typical neutron spectra plotted as E’ðEÞ for asodium-cooled fast reactor and for a water-cooled thermal reactor.Several features are noteworthy. Fast reactor spectra are concentratedin the keV and MeV range with nearly all of the neutrons absorbedbefore slowing down to energies less than a keV. Fast reactor corescontain intermediate weight elements, such as sodium coolant andiron used for structural purposes. These intermediate atomic weightelements have large resonances in their elastic scattering cross sec-tions in the keV and MeV energy range. Thus the fast spectra arequite jagged in appearance, resulting from the energy self-shieldingphenomenon, illustrated by Eqs. (3.16) and (3.29), in which the flux isinversely proportional to the total cross section.
Thermal reactor spectra have a more modest peak in the MeVrange where fission neutrons are born. The spectra over higher ener-gies are somewhat smoother as a result of the prominent role playedby the lightweight moderator materials; moderators have no reso-nances at those energies, and therefore the cross sections in thedenominators of Eqs. (3.16) and (3.29) are smoother functions ofenergy. Moving downward through the keV range, we see that thespectrum is nearly flat. Here there is very little absorption, resultingin a nearly 1/E [or constant E’ðEÞ] spectrum with the constant
0.00
0.05
0.10
0.15
0.20
0.25
0.30
0.35
0.40
0.45
0.50
1.0E–03 1.0E–02 1.0E–01 1.0E+00 1.0E+01 1.0E+02 1.0E+03 1.0E+04 1.0E+05 1.0E+06 1.0E+07
Energy (eV)
Eϕ (
E )
Fast reactor SFR
Thermal reactor PWR
FIGURE 3.6 Neutron flux spectra from thermal (pressurized water) andfast (sodium-cooled) reactors (courtesy of W. S. Yang, Argonne NationalLaboratory).
72 Fundamentals of Nuclear Reactor Physics

slowing down density as given by Eq. (3.26). The thermal reactorspectra do decrease with decreasing energy going from 100 and1.0 eV, accentuated by sharp dips in the flux. Although barely visiblein the figure, resonance absorption in uranium over this energy rangecauses the slowing down density to decrease and the self-shieldingindicated in Eq. (3.29) to become more pronounced. Below 1.0 eV, thecharacteristic thermal peak occurs. As a result of thermal neutronabsorption in the fuel and moderator, the peak in the thermal spec-trum is at an energy somewhat higher than would be indicated by theMaxwell-Boltzmann distribution given by Eq. (3.35). Finally, notethat if we had plotted ’ðEÞ instead of E’ðEÞ for the thermal reactor,the thermal flux peak would be millions of times larger than the peakof fission energy neutrons.
3.5 Energy-Averaged Reaction Rates
As the foregoing sections indicate, the ability to sustain a chainreaction depends a great deal on the distribution of neutrons inenergy, which in turn is determined by the composition of nonfissilematerials in the core and their effectiveness in slowing down theneutrons from fission toward thermal energies. To determine theoverall characteristics of a reactor core, we must average cross sec-tions and other data over the energy spectrum of neutrons. We accom-plish this through the use of Eq. (3.13), which is termed the reactionrate for collisions of type x and has units of collisions/s/cm3.
Reaction rates are commonly expressed as products of energy-averaged cross sections and the neutron flux:Z 1
0�xðEÞ’ðEÞdE ¼ ��x; ð3:37Þ
where the cross section is
��x ¼Z 1
0�xðEÞ’ðEÞdE
,Z 10’ðEÞdE; ð3:38Þ
and the flux, integrated over energy, is
¼Z 1
0’ðEÞdE: ð3:39Þ
For a known neutron flux distribution, microscopic cross sections mayalso be averaged over energy. We simply make the replacement�x ¼ N�x in Eqs. (3.37) and (3.38) to eliminate the atom density andobtain
Neutron Distributions in Energy 73

Z 10�xðEÞ’ðEÞdE ¼ ��x ð3:40Þ
and
��x ¼Z 1
0�xðEÞ’ðEÞdE
,Z 10’ðEÞdE: ð3:41Þ
We may also express the flux as the product of the mean speedand the density of the neutrons:
¼ �vn000; ð3:42Þ
where Eq. (3.9) defines the neutron density n000. To accomplish thisinsert the flux definition given by Eq. (3.10) into Eq. (3.39):
¼Z 1
0vðEÞ~n000ðEÞdE ð3:43Þ
and note that to be consistent with Eq. (3.42) the mean speed must bedefined by
�v ¼Z 1
0vðEÞ~n000ðEÞdE
,Z 10
~n000ðEÞdE: ð3:44Þ
Frequently we will drop the bar indicating averaging from the leftsides of Eqs. (3.38) and (3.41). Thus hereafter we assume that a crosssection �x or �x appearing without the (E) attached has been averagedover energy. If a cross section is independent of energy, we have�xðEÞ ! �x, and then, of course, we may take it outside the integralin Eqs. (3.38) and (3.41), and we have simply, ��x ¼ �x and ��x ¼ �x.
More refined treatments of a neutron population often requirecross section averaging over some limited range of neutron energiesrather than over the entire neutron energy spectrum. The discussionsof Section 3.4 indicate that the analysis of neutron spectra fall natu-rally into thermal, intermediate, and fast energy ranges. Correspond-ingly we may partition reaction rates asZ
�xðEÞ’ðEÞdE ¼Z
T�xðEÞ’ðEÞdEþ
ZI�xðEÞ’ðEÞdE
þZ
F
�xðEÞ’ðEÞdE; ð3:45Þ
where hereafter attaching T, I, and F signifies integration over theranges 0 � E � 1:0 eV, 1:0 eV � E � 0:1 MeV, and 0:1 MeV � E � 1,respectively. Employing Eq. (3.40), we may write this sum in termsof energy-averaged cross sections as
74 Fundamentals of Nuclear Reactor Physics

��x ¼ ��xTT þ ��xII þ ��xFF: ð3:46Þ
Each of the terms on the right results from multiplying and dividingthe corresponding integral of Eq. (3.45) by
� ¼Z
�
’ðEÞdE; � ¼ T; I; F; ð3:47Þ
and defining the energy averaged cross sections as
��x� ¼Z
�
�xðEÞ’ðEÞdE
�Z�
’ðEÞdE; � ¼ T; I; F: ð3:48Þ
More advanced so-called multigroup methods divide the energyspectrum into more than the three intervals shown here, and con-siderable effort is expended in determining the flux spectra in eachgroup as accurately as possible. For our purposes, however, the divi-sion into thermal, intermediate, and fast energy segments is ade-quate. We perform cross section averaging by selecting appropriateflux approximations for use in Eqs. (3.46) through (3.48). We beginwith the fast neutrons and work our way downward in energy.
Fast Cross Section Averages
Even though it includes only uncollided neutrons, Eq. (3.16) provides afirst approximation to the flux distribution for fast neutrons. The totalmacroscopic cross section in the denominator, however, includes all ofthe nuclides present—fuel, coolant, and so on. Thus it is likely to be astrong and complex function of energy, particularly if significant concen-trations of iron, sodium, or other elements that have scattering reso-nances in the MeV range are present. In Fig. 3.6 these effects areapparent in the jagged appearance of the fast flux for both thermal andfast reactors. To preclude the cross sections tabulated for individual ele-ments from being dependent on the other elements present, we mustfurther simplify Eq. (3.16) by taking �tðEÞ as energy independent. Thennormalizing to s000f =�t ¼ 1:0, we have’ðEÞ � �ðEÞ. Since only a very smallfraction of fission neutrons are produced with energies less than 0.1 MeVwe can extend the limits on the integrals in Eq. (3.48) from zero to infinitywithout loss of generality. With this proviso, the normalization conditionof Eq. (2.32) sets the denominator equal to one, and Eq. (3.48) reduces to
��xF ¼Z�xðEÞ�ðEÞdE: ð3:49Þ
Table 3.2 lists fast cross sections averaged over the fission spec-trum for several of the isotopes that appear most prominently in
Neutron Distributions in Energy 75

TABLE 3.2Energy Averaged Microscopic Cross Sections (barns)
Thermal Spectrum Cross Sections Resonance Integrals Fast (Fission Spectrum) Cross Sections
Nuclide �f �a �s If Ia �f �a �s
1
1H 0 0.295 47.7 0 0.149 0 3.92� 10�5 3.93
2
1H 0 5.06� 10�4 5.37 0 2.28� 10�4 0 5.34� 10�6 2.55
10
5B 0 3409 2.25 0 1722 0 0.491 2.12
12
6C 0 3.00� 10�3 4.81 0 1.53� 10�3 0 1.23� 10�3 2.36
16
8O 0 1.69� 10�4 4.01 0 8.53� 10�5 0 1.20� 10�2 2.76
23
11Na 0 0.472 3.09 0 0.310 0 2.34� 10�4 3.13
56
26Fe 0 2.29 11.3 0 1.32 0 9.22� 10�3 3.20
91
40Zr 0 0.16 6.45 0 0.746 0 3.35� 10�3 5.89
135
54Xe 0 2.64� 106 — 0 7.65� 103 0 7.43� 10�4 —
14962 Sm 0 6.15� 104 — 0 3.49� 103 0 0.234 —

Table 3.2(continued)
Thermal Spectrum Cross Sections Resonance Integrals Fast (Fission Spectrum) Cross Sections
Nuclide �f �a �s If Ia �f �a �s
157
64 Gd 0 1.92� 105 1422 0 762 0 0.201 6.51232
90 Th 0 6.54 11.8 0 84.9 7.13� 10�2 0.155 7.08233
92 U 464 506 14.2 752 886 1.84 1.89 5.37235
92 U 505 591 15.0 272 404 1.22 1.29 6.33238
92 U 1.05� 10�5 2.42 9.37 2� 10�3 278 0.304 0.361 7.42239
94 Pu 698 973 8.62 289 474 1.81 1.86 7.42240
94 Pu 6.13� 10�2 263 1.39 3.74 8452 1.36 1.42 6.38241
94 Pu 946 1273 11.0 571 740 1.62 1.83 6.24242
94 Pu 1.30� 10�2 16.6 8.30 0.94 1117 1.14 1.22 6.62
Source: R. J. Perry and C. J. Dean, The WIMS9 Nuclear Data Library, Winfrith Technology Center Report ANSWERS/WIMS/TR.24, Sept. 2004.

power reactor cores. Such cross sections, however, provide only asmoothed approximation to what the cross sections would be ifaveraged over the actual flux distribution.
Resonance Cross Section Averages
Often the terms intermediate and resonance are used interchangeablyin describing the energy range between 1.0 eV and 0.1 MeV because asneutrons slow down from fast to thermal energy the large cross sec-tions caused by the resonances in uranium, plutonium, and otherheavy elements account for the nearly all of the neutron absorptionin this energy range. Equation (3.29) provides a reasonable approxima-tion to the flux distribution in this energy range. However, as in thefast spectrum, the �tðEÞ term in the denominator is dependent on allof the constituents present in the reactor and thus must be eliminatedin order to obtain cross sections that are independent of core composi-tion. Ignoring the energy dependence of the total cross section, wesimplify the flux to ’ðEÞ � 1=E. Equation (3.48) then becomes
��xI ¼Z
I
�xðEÞdE
E
�ZI
dE
E: ð3:50Þ
For capture and fission reactions intermediate range cross sec-tions are frequently expressed as
��xI ¼ Ix
�ZI
dE
E; ð3:51Þ
where
Ix ¼Z�xðEÞ
dE
Eð3:52Þ
defines the resonance integral. Since the predominate contributions to Ix
(x ¼ a; f) arise from resonance peaks—such as those shown in Figs. 2.6,2.9, and 2.10—that lie well within the range 1:0 eV � E � 0:1 MeV, thevalues of resonance integrals are relatively insensitive to the limits ofintegration. The denominator of Eq. (3.51), however, depends strongly onthose limits. Evaluating it between 1.0 eV and 0.1 MeV, then, yields
��xI ¼ 0:0869Ix: ð3:53Þ
Table 3.2 includes the resonance integrals for common reactorconstituents.
As the thermal reactor spectrum in Fig. 3.6 indicates, the 1/E—that is, the E’ðEÞ= constant—spectrum is a reasonable approximation
78 Fundamentals of Nuclear Reactor Physics

through the slowing down region. However, the dips that appear representthe resonance self-shielding that decreases the number of neutrons thatare lost to absorption. Since Eq. (3.52) does not include the effects of self-shielding, numbers listed in Table 3.2 only provide an upper bound onresonance absorption, which would only be obtained in the limit of aninfinitely dilute mixture of the resonance absorber in a purely scatteringmaterial. In reactor cores self-shielding dramatically reduces theamount of absorption. Advanced methods for calculating resonanceabsorption accurately are beyond the scope of this text. However,Chapter 4 includes empirical formulas that provide reasonable approx-imations to resonance absorption with the effects of self-shieldingincluded.
Thermal Cross Section Averages
Although accurate determination of the thermal spectrum alsorequires advanced computational methods, averages over simplifiedspectra often serve as a reasonable first approximation in performingrudimentary reactor calculations. We approximate the thermal fluxwith the Maxwell-Boltzmann distribution, ’ðEÞ � ’MðEÞ, given byEq. (3.35). With the normalization proved by Eq. (3.36), Eq. (3.48)thus reduces to
��xT ¼Z�xðEÞ’MðEÞdE: ð3:54Þ
Since ’MðEÞ is vanishingly small for energies greater than anelectron volt, the upper limit on this integral can be increasedfrom 1.0 eV to infinity without affecting its value. Thermal neu-tron cross sections averaged over the Maxwell-Boltzmann distri-bution at room temperature of 20 �C (i.e., 293 K) are tabulated forcommon reactor materials in Table 3.2. Appendix E provides amore comprehensive table of microscopic thermal cross sectionsintegrated over the Maxwell-Boltzmann flux distribution as in Eq.(3.54), along with molecular weights and densities. The tableincludes all naturally occurring elements and some moleculesrelevant to reactor physics.
Frequently the cross sections are measured at 0.0253 eV, whichcorresponds to a neutron speed of 2200 m/s. The convention is basedon what follows. The maximum—or most probable—value of ’MðEÞmay easily be shown to be
E ¼ kT ¼ 8:62� 10�5T eV; ð3:55Þ
Neutron Distributions in Energy 79

where T is in degrees kelvin. We take the corresponding neutronspeed to be
v ¼ffiffiffiffiffiffiffiffiffiffiffiffiffi2E=m
p¼
ffiffiffiffiffiffiffiffiffiffiffiffiffiffiffiffiffi2kT=m
p¼ 128
ffiffiffiffiTp
m=s: ð3:56Þ
Cross section measurements made at To = 293.61 K yieldEo ¼ 0:0253 eV and vo ¼ 2;200 m=s; 0.0253 eV and 2200 m/s are com-monly referred to as the energy and speed of a thermal neutron. Thecross sections tabulated in Table 3.2 and Appendix E, however, arethe averages over the Maxwell-Boltzmann spectrum given byEq. (3.54), rather than the cross sections evaluated at Eo ¼ 0:0253 eV.
In the many cases where thermal scattering cross sections areindependent of energy, Eq. (3.54) reduces to ��sT ¼ �s. At thermalenergies, however, the binding of atoms to molecules or withincrystal lattices can significantly affect the thermal scattering crosssections. To account for this, the cross sections for hydrogen, deuter-ium, and carbon given in Table 3.2 and Appendix E are corrected toinclude the effects of such binding. These corrections allow Eqs.(2.14) and (2.15), for example, to be used without modification inthe determination of the thermal scattering cross section of water.
In contrast, many thermal absorption cross sections are propor-tional to 1/v:
�aðEÞ ¼ffiffiffiffiffiffiffiffiffiffiffiEo=E
p�aðEoÞ: ð3:57Þ
To obtain the energy-averaged cross section in such cases we mustsubstitute this equation and Eq. (3.35) into Eq. (3.54):
��aT ¼Z 1
0
ffiffiffiffiffiffiffiffiffiffiffiEo=E
p�aðEoÞ
1
ðkTÞ2E expð�E=kTÞdE: ð3:58Þ
Evaluating the integral, we obtain
��aT ¼ffiffiffip
2
Eo
kT
� �1=2
�aðEoÞ ¼ 0:8862 To=Tð Þ1=2�aðEoÞ: ð3:59Þ
Thus the 1/v absorption cross section is dependent on the absolutetemperature, and even if T = T0 the averaged absorption cross sec-tions are not the same as those measured at Eo. In Table 3.2 andAppendix E, thermal absorption and capture cross sections are theaverages defined by ��aT of Eq. (3.54).
To correct these 1/v thermal cross sections for temperature, wenote from Eq. (3.59) that ��aTðTÞ ¼ To=Tð Þ1=2 ��aTðToÞ. In dealing withmacroscopic thermal cross sections correcting for temperaturebecomes more complex if the material has a significant coefficient
80 Fundamentals of Nuclear Reactor Physics

of thermal expansion. Since �x ¼ N�x, and the atom density is givenby N ¼ �N0=A, density decreases with increasing temperature willalso cause macroscopic cross sections to decease even if the micro-scopic cross sections remain constant.
3.6 Infinite Medium Multiplication
We conclude this chapter by returning to the calculation of themultiplication, k1, the ratio of the number of fission neutrons pro-duced to the number of neutrons absorbed. The ratio is determined byusing the reaction rate definition, Eq. (3.13). Since the number offission neutrons produced is
R10 ��fðEÞ’ðEÞdE, where � is the number
of neutrons/fission, and the number of neutrons absorbed isR10 �aðEÞ’ðEÞdE, we have
k1 ¼Z 1
0��fðEÞ’ðEÞdE
,Z 10
�aðEÞ’ðEÞdE: ð3:60Þ
Using the definitions of the energy-averaged cross sections and fluxgiven in Eqs. (3.37) we may express k1 as a ratio of cross sections:
k1 ¼ ���f
��a; ð3:61Þ
where only fissionable materials contribute to the numerator, whileabsorption cross sections of all of the reactor core’s constituentscontribute to the denominator.
Thus far we have assumed implicitly that the fuel, moderator,coolant, and other core constituents are all exposed to the sameenergy-dependent flux ’ðEÞ. Provided the volumes of core constituentsare finely mixed—for example, powders of uranium and graphite—thisassumption holds. However, in power reactors the diameters of fuelelements, the spacing of coolant channels, and geometric configurationsof other constituents result in larger separations between materials. Inthese circumstances the flux magnitudes to which the fuel, coolant,and/or moderator are exposed often are not identical. Power reactorcores consist of lattices of cells, each consisting of a fuel element, cool-ant channel, and in some cases a separate moderator region. The expres-sions derived above remain valid provided we interpret them as spatialaverages over the constituents of one such cell, with account taken fordifferences in flux magnitudes. In the following chapter we first examinethe lattice structures of power reactors. We then take up the modeling offast and thermal reactor lattices in order to examine these differences in
Neutron Distributions in Energy 81

flux magnitudes and then to obtain expressions for k1 explicitly interms of the various core constituents.
Bibliography
Cullen, D. E., ‘‘Nuclear Cross Section Preparation,’’ CRC Handbook ofNuclear Reactor Calculations, I, Y. Ronen, ed., CRC Press, Boca Raton, FL,1986.
Duderstadt, James J., and Louis J. Hamilton, Nuclear Reactor Analysis,Wiley, NY, 1976.
Henry, Allen F., Nuclear-Reactor Analysis, MIT Press, Cambridge, MA,1975.
Jakeman, D., Physics of Nuclear Reactors, Elsevier, NY, 1966.Mughabghab, S. F., Atlas of Neutron Resonances, Elsevier, Amsterdam,
2006.Stacey, Weston M., Nuclear Reactor Physics, Wiley, NY, 2001.Templin, L. J., ed., Reactor Physics Constants, 2nd ed., ANL-5,800, Argonne
National Laboratory, Argonne, IL, 1963.Williams, M. M. R., The Slowing Down and Thermalization of Neutrons,
North-Holland, Amsterdam, 1966.
Problems
3.1. Verify Eqs. (3.23) and (3.25).
3.2. Show that in Eq. (3.31) the normalization conditionR Eo
0 sðEÞdE ¼ 1
must be obeyed. Hint: Note thatR Eo
0 pðE0 ! EÞdE ¼ 1 for E0 � Eo.
3.3. In Eq. (3.31) suppose that the neutron slowing down past Eo is dueentirely to elastic scattering from a single nuclide with A> 1, andwith no absorption for E > Eo. Show that sðEÞ then takes the form
sðEÞ ¼1
ð1� �Þ�1
Eo� �
E
� �; �Eo < E < Eo;
0; E < �Eo
8<:
3.4. For thermal neutrons calculate �� as a function of uraniumenrichment and plot your results. Use the uranium data fromthe following table:
� �f (barns) �a (barns)
Uranium-235 2.43 505 591Plutonium-239 2.90 698 973Uranium-238 — 0 2.42
82 Fundamentals of Nuclear Reactor Physics

3.5. Suppose a new isotope is discovered with a ‘‘1/E’’ absorptioncross section given by �aðEÞ ¼ ðEo=EÞ�aðE0Þ. Determine theenergy-averaged cross section if the isotope is placed in thethermal flux distribution given by Eq. (3.35).
3.6. In the wide resonance approximation (also called narrowresonance infinite mass approximation because the fuel isassumed to have an infinite mass), Af !1 and thus �f ! 1 inthe first integral on the right of Eq. (3.28) while the remainingapproximations are the same as in narrow resonanceapproximation. Determine ’ðEÞ through the resonance. Howdoes it differ from Eq. (3.29)? In which case is there more energyself-shielding?
3.7. Lethargy defined as u ¼ lnðEo=EÞ is often used in neutron slowingdown problems; lethargy increases as energy decreases. Notethe following transformations: ’ðEÞdE ¼ �’ðuÞdu, pðE! E0ÞdE0 ¼ �pðu! u0Þdu0, and �xðEÞ ¼ �xðuÞ.
a. Show that pðE! E0Þ given by Eq. (2.47) becomes
pðu! u0Þ ¼1
1� � expðu� u0Þ; u � u0 � uþ lnð1=�Þ;
0; otherwise
8><>:
b. Express Eq. (3.22) in terms of u.
3.8. Making a change of variables from energy to speed, show thatEq. (2.47) becomes
pðv ! v0Þ ¼2v0
ð1� �Þv2; v
ffiffiffiffi�p� v0 � v;
0; otherwise
8><>:
3.9. Suppose that the Maxwell-Boltzmann distribution, Eq. (2.34),represents the neutron density in Eqs. (3.43) and (3.44):
a. Find the value of �v.b. If we define �E � 1=2 m�v2, show that �E ¼ 1:273kT.c. Why is your result different from the average energy of 3=2kT
given by Eq. (2.33)?
Neutron Distributions in Energy 83

3.10. A power reactor is cooled by heavy water (D2O) but a leakcauses a 1.0 atom % contamination of the coolant with lightwater (H2O). Determine the resulting percentage increase ordecrease in the following characteristics of the coolant:
a. Slowing down decrement.b. Slowing down power.c. Slowing down ratio.
3.11. Using the data in Appendix E calculate the microscopicabsorption cross section of water, averaged over a thermalneutron spectrum:
a. At room temperature.b. At 300 oC, which is a typical operating temperature for a
water-cooled reactor.
3.12. Repeat problem 3.11 for heavy water.
84 Fundamentals of Nuclear Reactor Physics

CHAPTER 4
The Power Reactor Core
4.1 Introduction
Two criteria play dominant roles in determining the composition of apower reactor core: Criticality must be maintained over the range ofrequired power levels and over the life of the core as fuel is depleted.The design must also allow the thermal energy produced from fissionto be transferred out of the core without overheating any of its con-stituents. Many other considerations also come into play: themechanical support of the core structure, stability and control ofthe chain reaction under widely varied circumstances, and so on.But the neutron physics discussed in the preceding chapters andheat transfer interact most strongly in determining the constructionof power reactor cores. This chapter first examines the core layouts ofthe more common classes of power reactors, relating heat transportand neutronic behavior. It then presents in more detail the impact ofthe reactor lattice structures on the neutronic behavior and in parti-cular on the determination of the multiplication.
4.2 Core Composition
Reactors have been designed with a wide variety of configurations.These include cores consisting of molten materials in a container, inwhich the liquid fuel itself is piped through circulation loops fromwhich the heat is removed, and pebble bed reactors where the fuelconsists of a bed of solid spheres through which coolant is circulatedto remove the heat. Most power reactors, however, are cylindrical inshape with coolant flowing through channels extending the axiallength of the core. These channels are one constituent of a periodiclattice consisting of cylindrical fuel elements, coolant channels, andin some thermal reactors a separate moderator region.
Figure 4.1 illustrates the fuel–coolant–moderator lattice struc-ture for four diverse classes of power reactors. In all cases, heat fromfission is produced within the fuel and conducted to the coolant
85

channel surface. It then is convected into the coolant and trans-ported axially along the coolant channel and out of the core. Thefour diagrams that make up Fig. 4.1, however, are drawn on quitedifferent scales, since in all cases the fuel element diameters are ofthe order of 1 cm. Thermal constraints on the heat flux crossing afuel element’s surface and on the temperature along its centerlinelimit both its diameter and the power per unit length—called thelinear heat rate or q0—that it can produce. Since allowable linearheat rates typically fall within the range between few and tens ofkW/m, a large power reactor designed to produce 1000 MW(t)or more of heat must contain many thousands of cylindrical fuelelements—often referred to as fuel pins.
Refueling a reactor containing thousands of fuel elements byreplacing them one by one would represent an inordinately time-consuming and hence uneconomical task. Thus fuel elements aregrouped together to form fuel assemblies. The mechanical design offuel assemblies allows them be moved as a whole in and out of thereactor during refueling procedures. Figure 4.2 illustrates three exam-ples of fuel assemblies. The assemblies’ cross-sectional areas may besquare or hexagonal as shown in Figs. 4.2a and 4.2c. Fuel elementsmay also be bundled into circular fuel assembles as shown inFig. 4.2b; in this case the bundles are inserted in tubes placed in
Coolant
Fuel
Coolant
Fuel
CoolantchannelPressure
tube
Insulation
Fuel
Coolant
Fuel
D2O
(a)
(c)
(d)
(b)
Graphite
FIGURE 4.1 Reactor lattice cross sections (not on the same scale).(a) Water-cooled reactor, (b) fast reactor, (c) CANDU heavy water reactor,(d) high temperature gas-cooled graphite reactor.
86 Fundamentals of Nuclear Reactor Physics

square or hexagonal arrays within moderator regions as indicated, forexample, in Fig. 4.1c.
Figure 4.3 depicts lateral cross sections of a power reactor coresmade up of square and hexagonal fuel assemblies, respectively. Theshading in Fig. 4.3 indicates that typically not all of the fuel assem-blies in a reactor core are identical. They may differ in fuel enrich-ment in order to flatten the power across the core, or they may havebeen placed in the core during different refueling operations. Theplacement of control poisons may also cause assemblies to differ.
In addition to fuel, coolant, and (in thermal reactors) moderator,the reactor must contain channels placed at carefully designatedintervals throughout such lattice configurations to allow the inser-tion of control rods. These rods consist of strong neutron absorbers—often referred to as neutron poisons—such as boron, cadmium, orhafnium. Their insertion controls the reactor multiplication duringpower operations, and they shut down the chain reaction when fullyinserted. Some classes of power reactors contain space for the controlrods as channels reserved for them within designated fuel assemblies;the assemblies shown in Figs. 4.2a and 4.2c fall into this category. Inother systems the control rods are inserted between the fuel assem-blies. For example, control rods with cruciform cross sections may be
3 64
1
25
1 Bearing pad
Sheath
End plate
UO2 pellet
Spacer pad
End plug
2
3
4
5
6
(a) (b) (c)
FIGURE 4.2 Reactor fuel assemblies. (a) Pressurized water reactor(courtesy of Westinghouse Electric Company), (b) CANDU heavy waterreactor (courtesy of Atomic Energy of Canada, Ltd.), (c) high temperaturegas-cooled reactor (courtesy of General Atomics Company).
The Power Reactor Core 87

placed at the intersections of square assemblies, or control rods maybe inserted into moderator regions between assemblies.
The fuel elements’ linear heat rate and the volume ratio of coolantand/or moderator to fuel, designated as Vx=Vf , along with a number ofother factors determine �P000, the average power density, that is, theaverage power produced per unit volume, achievable for each reactorclass. Since a reactor’s power is given by P ¼ �P000V, for a given powerthe core volume V, it is inversely proportional to the average powerdensity. Core lattice structures must be optimized to facilitate heattransfer, and thus maximize achievable power densities within theheat removal capabilities of the coolant. But neutronic considerationsplay an equally important role. For lattice structure and particularlythe ratios of fuel, coolant, and moderator largely determine the valueof k1 for a given fuel enrichment. On the other hand, PNL, the non-leakage probability, approaches a value of one as the core volumeincreases. Thus since k ¼ k1PNL, lattice structure and achievablepower density intertwine in determining the critical state of a powerreactor.
Table 4.1 compares typical parameters for some major classes ofpower reactors. To gain a better understanding of how the displayedvalues result from power reactor design and operational considerationswe next examine separately each broad class of the reactors in terms ofthe neutronic properties of their fuel, moderator, and/or coolant.
Light Water Reactors
Pressurized water reactors (PWRs) and boiling water reactors (BWRs)utilize ordinary water both as coolant and moderator. Both these
A
A
A
A
A
A
A
A
A
A
A
A
A
A
A
A
A
A
A
A
A
A
A
A
A
A
A
A
A
A
A
A
A
A
A
A
A
A
A
A
A
A
A
A
A
A
A
A
A
A
A
A
A
A
A
A
A
A
A
A
A
A
A
A
A
A
A
A
A
A
A
A
A
A
A
A
A
A
A
A
A
A
A
A
A
A
A
A
A
A
A
A
A
A
A
A
A
A
A
A
A
A
A
A
A
A
A
A
A
A
A
A
A
A
A
A
A
A
A
A
A
A
A
A
A
A
A
A
A
A
A
A
A
A
A
A
A
A
A
A
A
A
A
A
A
A
A
A
A
A
S
A
A
A
A
A
A
A
A
A
A
A
A
A
A
(a) (b)
FIGURE 4.3 Reactor cores consisting of square and hexagonal fuelassemblies (courtesy of W. S. Yang, Argonne National Laboratory). (a) Squarefuel assemblies, (b) hexagonal fuel assemblies.
88 Fundamentals of Nuclear Reactor Physics

TABLE 4.1Representative Reactor Lattice Properties
PWRPressurized-H2O Reactor
BWR Boiling-H2O Reactor
PHWRCANDU-D2OReactor
HTGRC-ModeratedReactor
SFRNa-CooledFast Reactor
GCFRHe-CooledFast Reactor
�q0 (kW/m) averagelinear heat rate
17.5 20.7 24.7 3.7 22.9 17.0
Vx=Vf volumeratioa 1.95 2.78 17 135 1.25 1.93
�P000 (MW/m3) averagepower density
102 56 7.7 6.6 217 115
V (m3) volume3000 MW(t)reactor
29.4 53.7 390 455 13.8 26.1
~e (weight %)enrichment
4.2 4.2 0.7 15 19 19
a x = moderator for a thermal reactor and coolant for a fast reactor, f = fuel.Source: Data courtesy of W. S. Yang, Argonne National Laboratory.

classes of light water reactors (LWRs) utilize square lattice cells,similar to that shown in Fig. 4.1a. The fuel consists of uraniumdioxide pellets clad in zirconium for structural support and to preventfission product leakage into the coolant. Moderator to fuel volumeratios are roughly 2:1, which is near optimal for maximizing k1 inwater-moderated systems. The optimal volume ratio derives from thewater’s neutron slowing down properties listed in Table 3.1. Waterhas the largest slowing down power of any moderator as a result ofthe small mass and substantial scattering cross section of hydrogen.However, water also has the largest thermal absorption cross sectionof any of the listed moderators, which manifests itself as the smallestvalue of the slowing down ratio. Thus although water is excellent forslowing down neutrons, if larger ratios of water to fuel volume areemployed in reactor lattices, the increased thermal absorption in themoderator results in an unacceptable decrease in k1. Water’s combi-nation of having the largest slowing down power but the smallestslowing down ratio of any of the moderators leads to LWR designswith substantially smaller moderator to fuel volume ratios thanfound in heavy water or graphite-moderated reactors.
These smaller ratios—and the fact that the water serves both asmoderator and coolant—leads to PWRs and BWRs having the mostcompact lattices of any of the thermal reactors. As Table 4.1 indicates,the comparatively small moderator to fuel volume ratio leads to higherpower densities and smaller reactor volumes than for heavy waterreactors or graphite-moderated systems of the same power. Water’slarge thermal absorption cross section, however, precludes the possi-bility of achieving criticality with natural uranium fuel in a LWR.To overcome this obstacle water-moderated reactors must employslightly enriched fuel, typically in the range between 2% and 5%.
In PWRs, the core is contained in a vessel pressurized to 1520 bar(~2200 psi) to prevent coolant boiling at operating temperatures in therange of 316 �C (~600 �F). As Fig. 4.4a indicates, water exiting the corecirculates through heat exchangers, called steam generators, beforebeing pumped back to the core inlet. The secondary side of the steamgenerator operates at a lower pressure such that feed water entering itboils, thus supplying steam to the turbine. Coolant temperatures aresimilar for BWRs. However, they operate at less elevated pressures of690 bar (~1000 psi), allowing boiling to take place in the coolantchannels. As Fig. 4.4b indicates, in BWRs, the feed water entersdirectly into the reactor vessel, and the steam generated within thereactor passes directly to the turbine, eliminating the need for steamgenerators.
Water-moderated reactors operate in batch mode fuel cycles: Thereactor is shut down at regular intervals, ranging from 1 to 2 years.During shutdown, typically lasting a number of weeks, 20 to 30% ofthe assemblies containing fuel from which the fissile material is
90 Fundamentals of Nuclear Reactor Physics

most depleted are removed and replaced by fresh assemblies. In batchmode operation the fuel must be sufficiently enriched to compensatefor the uranium burn up that takes place over the length of time thatthe assembly remains in the reactor.
During core life neutron poisons control the reactor multiplica-tion. In PWRs soluble boron in the coolant serves this purpose, and inmost thermal reactors burnable poisons placed in the fuel or else-where also serve to compensate for fuel burn up. Control rods mustbe present to rapidly shut down the chain reaction, but they may alsobe used to compensate for fuel depletion. As the schematic diagramsof Fig. 4.4 indicate, PWR control rods are inserted from the top,whereas those of BWRs are inserted from the bottom. The PWRcontrol rods are employed in clusters that occupy channels withinthe fuel assemblies as depicted in Fig. 4.2a. In BWRs the control rodshave cruciform-shaped cross sections and fit into channels betweenthe square fuel assemblies, with their centerlines positioned at inter-sections between four assemblies.
Heavy Water Reactors
As Table 3.1 indicates, the larger mass of deuterium causes heavywater’s slowing down power to be substantially smaller than that ofH2O. However, deuterium’s thermal absorption cross section is min-uscule, and as a result D2O has the largest slowing down ratio of anymoderator. Thus in contrast to LWRs, reactors moderated by heavywater require large volume ratios of moderator to fuel to provide
(a)
Pressurizer Steamgenerator
Controlrods
Reactorvessel
(b)
Control rods
Reactorvessel
FIGURE 4.4 Light water cooled reactors (courtesy U.S. Nuclear RegulatoryCommission). (a) Pressurized water reactor, (b) boiling water reactor.
The Power Reactor Core 91

adequate neutron slowing down. At the same time they can toleratelarger moderator volumes because the thermal absorption cross sec-tion of deuterium is so small.
Pressurized heavy water reactors (PHWRs) of the CANDU typeare by far the most common D2O-moderated power systems today.A CANDU core consists of a large cylindrical tank, called a calandria,placed on its side; an array of horizontal pressure tubes passes throughthe calandria. Each pressure tube houses several fuel assembly seg-ments, often called bundles, each containing 30 to 40 fuel pins aspictured in Figs. 4.1c and 4.2b. The fuel pins are similar to those inLWRs. They consist of UO2 pellets, clad in zirconium. Heavy water,which also serves as coolant, is pumped through the tubes, circulatedthrough steam generators similar in design to those found in PWRs,and returned to the core inlet. The substantial spacing between pres-sure tubes within the D2O-filled calandria provides the reactor’s largemoderator to fuel volume ratio. The calandria is insulated from thepressure tubes, allowing it to operate near atmospheric pressure androom temperature. Thus only the tubes containing the fuel assembliesneed be maintained at high enough pressure to keep the smallervolume of D2O coolant from boiling at operating temperatures.
The moderator properties of heavy water—most particularly itssmall thermal absorption cross section—allow PHWRs to be fueledwith natural uranium. However, without enrichment the fuel can-not sustain the levels of burn up required to operate the reactor fora year or more between refueling. Instead, CANDU reactorsundergo continuous refueling while they are operating: A pair ofon-line refueling machines isolate one pressure tube at a time andinsert a fresh fuel bundle into one end of the core while removing adepleted one from the other. This mode of operation requires lesscontrol poison to maintain the reactor in a critical state thanwould be required with batch refueling. The control rods, whichpass through the calandria, outside of the pressure tubes, serveprimarily for reactor shutdown.
Graphite-Moderated Reactors
Table 3.1 indicates that the heavier atomic mass of carbon causesgraphite’s slowing down power to be smaller than that of either lightor heavy water. Its thermal absorption cross section, however, is smallenough to give it a slowing down ratio intermediate between lightand heavy water. The net effect is that graphite reactor lattices designedto maximize k1 have very large moderator to fuel volume ratios.A number of early power reactor designs were carbon dioxide–cooledgraphite-moderated systems that utilized natural uranium fuel. Gra-phite’s smaller values of the slowing down power and ratio made thetask more difficult than with D2O moderator. Consequently as partially
92 Fundamentals of Nuclear Reactor Physics

enriched fuel became available it replaced natural uranium in subse-quent designs. More recently, helium coolant combined with partiallyenriched fuel has led to the design of graphite-moderated power reactorscapable of operating at very high temperatures.
Table 4.1 displays parameters for a high temperature gas-cooledreactor (HTGR). The core contains only graphite and ceramic materi-als, allowing the helium coolant to achieve higher coolant tempera-tures than if metal cladding or structures were present. The latticestructure is similar to that shown in Fig. 4.1d; heat generated in thefuel passes through the graphite moderator before being carried awayby the gas coolant. The fuel consist of compacts of uranium carbideparticles compacted in graphite, thus further increasing the modera-tor to fuel ratio. The fuel enrichment is quite high. Each fuel assem-bly, as pictured in Fig. 4.2c, consists of a prismatic block of graphitecontaining two arrays of holes, for fuel and coolant, respectively. Thecontrol rods occupy other axial holes in the prismatic graphite block.The helium coolant circulates through a steam generator or gasturbine and back into the core. Refueling of HTGRs is accomplishedin batch mode, similar to that employed with water-cooled reactors.The large volume of graphite moderator required causes the HTGR tohave the lowest power density and thus the largest volume of any ofthe reactors listed in Table 4.1
RBMK Reactors
Thus far we have examined thermal reactors either in which thecoolant and moderator are the same or in which the coolant is agas. In the latter case the gas density is sufficiently small that thevolume which it occupies has relatively minor effects on the deter-mination of k1. Other power reactors have been based on usingliquid coolants that differ from the moderator. For example, designssimilar to the CANDU systems may employ pressurized or boilinglight water coolant in conjunction with heavy water moderator. Lessconventional is the molten salt reactor in which the molten fuel alsoserves as coolant by circulating through a core that consists of a fixedgraphite moderator structure. Other coolant–moderator combina-tions have been employed, but for the most part only in prototypicalreactors. In contrast the Russian RBMK reactor design has beenwidely used for power production throughout the former SovietUnion.
The RBMK is a water-cooled, graphite-moderated reactor. Therequirement for large volumes of moderator translates into lowpower densities and volumes as large as 1000 m3. The RBMK hassome similarities to CANDU reactor designs in that the core consistof pressure tubes which contain fuel assemblies composed of bundlesof cylindrical fuel elements of uranium dioxide in zirconium
The Power Reactor Core 93

cladding. The pressure tubes carry the water coolant through thegraphite moderator, which forms the bulk of the core volume. Likethe CANDU reactors, the RBMK refuels on-line using machines toisolate one pressure tube at a time. The differences between RBMKand CANDU designs, however, are great. The RBMK design’s pres-sure tubes transverse the core vertically, and carry light water coolantwhich boils as it passes through the tubes. The tubes as well ascontrol rods occupy holes in the large bocks of graphite moderator,and finally the fuel is enriched to approximately 2%.
Fast Reactors
Fast reactor cores contain as little low atomic mass material aspossible in order to impede neutron slowing down by elastic scatter-ing. Even then, fast reactors require enrichments of 10%, or more.Hexagonal lattice cells similar to that pictured in Fig. 4.1b areemployed because smaller volume ratios of coolant to fuel can beutilized than in square lattices. As Table 4.1 indicates, these tightlypacked lattices are instrumental in causing fast reactors to achievehigher power densities, and hence smaller volumes, than are found inthermal reactors.
Fast reactor fuel may be metal or a ceramic, encapsulated inmetal cladding. Liquid metals are the most widely used coolantbecause their atomic weight is larger than other liquids, and theyhave excellent heat transfer properties and can be employed in low-pressure systems. Sodium-cooled fast reactors (SFRs) are the mostcommon designs. Because sodium reacts violently with water, how-ever, SFRs require the placement of an intermediate heat exchangerbetween the reactor core and the steam generator; should a steamgenerator leak occur, the sodium that passes through the reactorwould not make contact with water. Some Russian fast reactorshave utilized molten lead coolant. Gas-cooled fast reactors (GCFRs)offer an alternative to liquid metal–cooled systems since the gas’slow density causes it to have no appreciable effect on the neutronspectrum. However, high pressure and large rises in the coolanttemperatures are then required to achieve adequate heat transport.Like most other systems, fast reactor refueling is carried out in batchmode.
4.3 Fast Reactor Lattices
In the preceding chapter we examined neutron spectra assuming thatall the constituents of a reactor core were exposed to the same energy
94 Fundamentals of Nuclear Reactor Physics

dependent flux ’ðEÞ. The chapter concluded using energy-averagedcross sections to express the multiplication as
k1 ¼Z
0
1��fðEÞ’ðEÞdE
,Z0
1�aðEÞ’ðEÞdE; ð4:1Þ
which serves as the starting point for the more detailed analysis ofboth fast and thermal reactors. Fast reactors differ from thermal reac-tors in several respects. The fuel enrichments are higher than typicallyfound in thermal reactors, generally substantially exceeding 10%.Core designers eliminate low atomic weight materials to the greatestextent possible, since they have the adverse effect of degrading theneutron energy spectrum. The result is a fast neutron spectrum suchas that shown in Fig. 3.6. Since cross sections in general decrease withincreasing neutron energy, the neutron spectrum averaged cross sec-tions in a fast reactor are substantially smaller than those in a thermalsystem. Accordingly, in fast reactors neither the fuel diameter nor thecoolant thickness between fuel pins substantially exceeds a mean freepath. Under such conditions the spatial distribution of the flux will bequite flat across the lateral cross section of the lattice cell, allowing usto approximate that fuel, coolant, and any structural material are allexposed to the same flux distribution, ’ðEÞ. Thus for any reaction x,we may use Eq. (2.18) to volume-weight the cross sections of fuel,coolant and structural materials:
�xðEÞ ¼ ðVf=VÞ�fxðEÞ þ ðVc=VÞ�c
xðEÞ þ ðVst=VÞ�stx ðEÞ; ð4:2Þ
where the cell volume is the sum of contributions from these threecomponents: V ¼ Vf þ Vc þ Vst. Substituting Eq. (4.2) into Eq. (4.1)yields
k1 ¼Vf
Z 10
��ffðEÞ’ðEÞdE
Vf
Z 10
�faðEÞ’ðEÞdEþ Vc
Z 10
�caðEÞ’ðEÞdEþ Vst
Z 10
�sta ðEÞ’ðEÞdE
;
ð4:3Þ
where only the fuel contributes to the fission cross section in thenumerator.
We may express the multiplication in terms of energy-averaged(also referred to as one-energy-group) cross sections as follows. Firstintegrate the flux over energy:
� ¼Z
0
1’ðEÞdE: ð4:4Þ
The Power Reactor Core 95

Then defining the flux-averaged cross section as in Eq. (3.38), we have
��yx¼Z 1
0�y
xðEÞ’ðEÞdE
,Z0
1’ðEÞdE; ð4:5Þ
where y indicates the material in which the reaction is takingplace. Combining these two equations then expresses the reactionrate as the product of the energy-averaged cross section and theflux:
Z0
1�y
xðEÞ’ðEÞdE ¼ ��y
x�: ð4:6Þ
The cell-averaged reaction rate then becomes
Z0
1�xðEÞ’ðEÞdE ¼
Vf
V��f
x þVc
V��c
x þVst
V��st
x
� ��; ð4:7Þ
and we may write Eq. (4.3) as
k1 ¼Vf���f
f
Vf ��f
a þ Vc ��c
a þ Vst ��st
a
: ð4:8Þ
The fuel enrichment and the ratios of coolant and other materi-als to fuel nuclei become the primary determinants of the latticemultiplication. To examine enrichment we write the numberdensity of fuel atoms as a sum of the fissile (fi) and fertile (fe)contributions:
Nf ¼ Nfi þNfe: ð4:9Þ
We define enrichment ~e as in Eq. (3.6) to be the ratio of fissile to totalfuel nuclei:
~e ¼ Nfi=Nf : ð4:10Þ
We next use Eq. (2.5) to specify macroscopic cross sections (for reac-tion x in material y) in terms of their microscopic counterparts,
��y
x ¼ Ny ��yx; ð4:11Þ
96 Fundamentals of Nuclear Reactor Physics

where the energy-averaged microscopic cross sections are
��yx ¼
Z 10
�yxðEÞ’ðEÞdE
�Z 10
’ðEÞdE: ð4:12Þ
Separating the fuel into fissile and fertile contributions reducesEq. (4.11) to
��f
x ¼ Nfi ��fix þNfe ��fe
x : ð4:13Þ
Thus utilizing Eqs. (4.9) through (4.11) in this expression allows us toobtain the microscopic fuel cross section as
��fx ¼ ~e��fi
x þ ð1� ~eÞ��fex : ð4:14Þ
The foregoing definitions allow us to express k1 in terms theenrichment and these microscopic cross sections. Thus Eq. (4.8)becomes
k1 ¼VfNf
h~e�fi ��fi
f þ ð1� ~eÞ�fe ��fef
iVfNf
h~e��fi
a þ ð1� ~eÞ��fea
iþ VcNc ��c
a þ VstNst ��sta
; ð4:15Þ
or alternatively
k1 ¼~e�fi ��fi
f þ ð1� ~eÞ�fe ��fef
~e��fia þ ð1� ~eÞ��fe
a þ ðVcNc=VfNfÞ��ca þ ðVstNst=VfNfÞ��st
a
: ð4:16Þ
Because the ratio of ��f to �a is larger for fissile than for fertilematerials, fast reactor multiplication increases with enrichment. Theeffects of the coolant and structural materials are subtler. AsEq. (4.16) indicates, increasing the ratio of coolant to fuel atoms(i.e., increasing VcNc=VfNf ) increases absorption in the coolant andthus decreases k1; the presence of structural material has the sameeffect. Equally important, since coolant and structural materials havelower atomic weights than the fuel, neutron collisions with thesenuclei degrade the neutron energy. Thus the more coolant is present,the more degraded the energy spectrum will become. The degradedspectrum impacts Eq. (4.16) primarily though the energy-averagedvalues of the fuel cross sections. For as Fig. 3.1 indicates, as theenergy of the neutrons decreases, so does the ratio of ��f to �a, thusdecreasing the multiplication.
The Power Reactor Core 97

4.4 Thermal Reactor Lattices
Equation 4.1 serves as a starting point for the treatment of thermal aswell as fast reactor lattices. However, in the thermal and intermedi-ate neutron energy ranges, which are central to an understanding ofthermal reactor physics, cross sections generally are larger than forhigher energy neutrons of primary interest in fast reactor physics. Inaddition the dimensions of coolant and moderator regions typicallyare larger than those of the coolant channels in fast reactors. The netresult of these two factors is that the diameters of fuel pins and thelateral dimensions of moderator and/or coolant may measure severalmean free paths or more. In such circumstances the magnitudes ofthe flux in fuel and moderator regions may differ significantly, withthe flux becoming depressed in the fuel region over energy rangeswhere the fuel absorption cross section is large.
For clarity, we consider a simple two volume model, where Vf
and Vm are the fuel and moderator volumes, and hence V ¼ Vf þ Vm.In doing this we have assumed that the moderator is also the coolantand occupies the same volume, Vm. The model may be generalized totreat separate regions of coolant and moderator, as well as to accountfor smaller amounts of structural and control materials.
Our simplified model accounts for the difference in fluxes in fueland moderator by dividing the cellular reaction rates into fuel andmoderator contributions:
V�xðEÞ’ðEÞ ¼ Vf�fxðEÞ’fðEÞ þ Vm�m
x ðEÞ’mðEÞ; ð4:17Þ
where x denotes the reaction type, and ’fðEÞ, ’mðEÞ, and ’ðEÞ arethe spatial averages over Vf , Vm, and V, respectively. SubstitutingEq. (4.17) into Eq. (4.1) yields
k1 ¼Vf
Z 10
��ffðEÞ’fðEÞdE
Vf
Z 10
�faðEÞ’fðEÞdEþ Vm
Z 10
�ma ðEÞ’mðEÞdE
; ð4:18Þ
where only a single term appears in the numerator since �mf ðEÞ ¼ 0.
Further analysis is facilitated by dividing the energy spectruminto the thermal (T), intermediate (I), and fast (F) ranges introduced inChapter 3. As before, we take 1.0 eV and 0.1 MeV as convenientpartition points between thermal, intermediate, and fast neutrons.
98 Fundamentals of Nuclear Reactor Physics

Reaction rates then divide into these three ranges, with each having adistinct pattern of fission and capture:
Z 10
�yxðEÞ’yðEÞdE ¼
ZT
�yxðEÞ’yðEÞdE þ
ZI
�yxðEÞ’yðEÞdE
þZ
F�y
xðEÞ’yðEÞdE:
ð4:19Þ
Fission takes place primarily in the thermal neutron range, with asmaller amount added from fast fission in the fertile material. Thuswe delete the intermediate range from fission reactions and write
Z 10��f
fðEÞ’fðEÞdE �Z
T��f
fðEÞ’fðEÞdEþZ
F��f
fðEÞ’fðEÞdE: ð4:20Þ
Since moderator materials have significant absorption cross sectionsonly for thermal neutrons we make the further simplification
Z0
1�m
a ðEÞ’mðEÞdE �Z
T�m
a ðEÞ’mðEÞdE: ð4:21Þ
Finally, fuel absorbs both intermediate neutrons—through resonancecapture—and thermal neutrons, whereas fast neutron absorption isminimal. Thus
Z 10
�faðEÞ’fðEÞdE �
ZT
�faðEÞ’fðEÞdEþ
ZI
�faðEÞ’fðEÞdE: ð4:22Þ
These simplifications reduce Eq. (4.18) to the more explicit form:
k1 ¼Vf
ZT��f
fðEÞ’fðEÞdEþZ
F��f
fðEÞ’fðEÞdE
� �
Vf
ZT
�faðEÞ’fðEÞdEþ
ZI
�faðEÞ’fðEÞdE
� �þ Vm
ZT
�ma ðEÞ’mðEÞdE
:
ð4:23Þ
The Four Factor Formula
Although Eq. (4.23) brings out the importance of thermal neutrons (threeof the five integrations are over the thermal range), the central role of theneutron slowing down in determining the lattice multiplication iscontained within it only implicitly. To make the physical processesmore explicit a simplified model—the four factor formula for k1—was
The Power Reactor Core 99

developed early in the history of reactor physics. Based on physicalarguments and related to measurements that could be performed at thetime, the four factor formula remains valuable tool in understanding theneutron cycle in thermal reactors, and particularly in relating neutronbehavior to the thermal hydraulic feedback discussed in Chapter 9. Inwhat follows we present the four factors first qualitatively and thenquantitatively. Then, in the final subsection, we employ the formula toexamine enrichment, moderator to fuel volume ratio, and other designparameters in determining the multiplication of a pressurized waterreactor lattice.
Figure 4.5 illustrates schematically the behavior of neutrons in athermal reactor lattice consisting of fuel and moderator. The hori-zontal axis denotes the radial distance from the center to the outsideof a lattice cell consisting of a cylindrical fuel element surrounded bymoderator; it is separated into fuel and moderator regions. The dia-gram’s vertical axis demarks the neutron energy ranging from 0.01 eVto 10 MeV, with the neutron energies divided into thermal (T), inter-mediate (I), and fast (F) ranges.
Most of the fission neutrons are born as a result of the absorptionof thermal neutrons in the fuel, and they emerge as fast neutrons.Assume that n such fast neutrons originate in the fuel as indicated inFig. 4.5. Some nominal fraction of these neutrons will causefast fission in the fertile material, resulting in a total number of"n ("> 1) fast neutrons produced from fission, where " is the fastfission factor. The "n fission neutrons migrate into the moderatorregion as step 1 of the diagram indicates. They then undergo slowingdown, indicated as step 2, as a result of collisions with the lightatomic weight moderator nuclei. However only some fraction p sur-vive to thermal energies, with the remaining neutrons lost to theresonance capture in the fuel; p (<1) is referred to as the resonanceescape probability. Of the "n neutrons which undergo slowing down,"pn arrive at thermal energies, while "ð1� pÞn are lost to capture inthe resonances. After arrival at thermal energy some of the neutrons
F n → (1) →εpf ηT
n
→ εn↓
I↑
(4) ε (1 – p)n ←↑
↓← (2)
↓
T↑
← ← (3) ←↓
← εpn → εp (1 – f )n
Fuel Moderator
εpfn
FIGURE 4.5 Four factor formula for a thermal reactor neutron cycle.
100 Fundamentals of Nuclear Reactor Physics

are absorbed by the moderator and are thereby lost. However in step 3 alarger fraction f (<1), which is referred to as the thermal utilization,enters the fuel and is absorbed. Thus the fuel absorbs "pfn while themoderator absorbs "p ð1� fÞn neutrons. For each thermal neutronabsorbed in the fuel, �T (>1) fission neutrons result. Thus, as step 4symbolizes, "pf�Tn fission neutrons appear from thermal fission withMeV energies, generated from the n such fission neutrons of the previousgeneration. Thus according to the definition of Eqs. (3.1) and (3.2):
k1 ¼ "pf�T : ð4:24Þ
Table 4.2 displays representative values of the four factors con-tributing to k1 for the major classes of thermal reactors. The values ofk1, which are substantially greater than one, represent normal operat-ing conditions. But understand that they are calculated for fresh fuel inthe absence of all control poisons. In an operating reactor, of course,fuel depletion, which reduces �T , the presence of control rods or othercontrol poisons, which reduce f, when taken together with PNL, thenonleakage probability, must yield k ¼ k1 PNL ¼ 1. To better under-stand the importance of the neutron moderators we examine each ofthe four factors more quantitatively in terms of the neutron flux andcross sections in the thermal (T), intermediate (I), and fast (F) energyranges.
Fast Fission Factor
The fast fission factor is the ratio of total fission neutrons produced tothe thermal fission neutrons. Since the neutrons produced by fissionof intermediate energy neutrons can be neglected, we have
TABLE 4.2Representative Four Factor and k1 Values for Thermal Reactors
PWR Pressurized-H2O Reactor
BWR Boiling-H2O Reactor
PHWRCANDU-D2OReactor
HTGRC-ModeratedReactor
" 1.27 1.28 1.08 1.20
p 0.63 0.63 0.84 0.62
f 0.94 0.94 0.97 0.98
�T
1.89 1.89 1.31 2.02
k1a 1.41 1.40 1.12 1.47
a Fresh fuel without neutron poisons.Source: Data courtesy of W. S. Yang, Argonne National Laboratory.
The Power Reactor Core 101
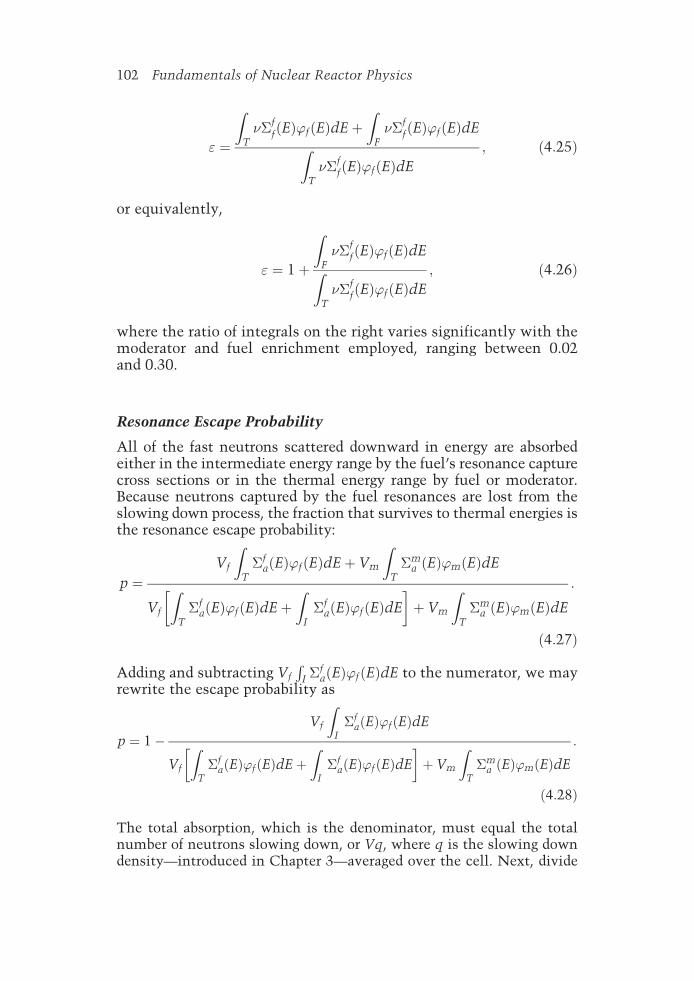
" ¼
ZT
��ffðEÞ’fðEÞdEþ
ZF
��ffðEÞ’fðEÞdEZ
T��f
fðEÞ’fðEÞdE
; ð4:25Þ
or equivalently,
" ¼ 1þ
ZF��f
fðEÞ’fðEÞdEZT
��ffðEÞ’fðEÞdE
; ð4:26Þ
where the ratio of integrals on the right varies significantly with themoderator and fuel enrichment employed, ranging between 0.02and 0.30.
Resonance Escape Probability
All of the fast neutrons scattered downward in energy are absorbedeither in the intermediate energy range by the fuel’s resonance capturecross sections or in the thermal energy range by fuel or moderator.Because neutrons captured by the fuel resonances are lost from theslowing down process, the fraction that survives to thermal energies isthe resonance escape probability:
p ¼Vf
ZT
�faðEÞ’fðEÞdEþ Vm
ZT
�ma ðEÞ’mðEÞdE
Vf
ZT
�faðEÞ’fðEÞdEþ
ZI
�faðEÞ’fðEÞdE
� �þ Vm
ZT
�ma ðEÞ’mðEÞdE
:
ð4:27Þ
Adding and subtracting Vf
RI �f
aðEÞ’fðEÞdE to the numerator, we mayrewrite the escape probability as
p ¼ 1�Vf
ZI
�faðEÞ’fðEÞdE
Vf
ZT
�faðEÞ’fðEÞdEþ
ZI
�faðEÞ’fðEÞdE
� �þ Vm
ZT
�ma ðEÞ’mðEÞdE
:
ð4:28Þ
The total absorption, which is the denominator, must equal the totalnumber of neutrons slowing down, or Vq, where q is the slowing downdensity—introduced in Chapter 3—averaged over the cell. Next, divide
102 Fundamentals of Nuclear Reactor Physics

the cell-averaged slowing down density into contributions qf and qm
from fuel and moderator regions:
q ¼Vf
Vqf þ
Vm
Vqm: ð4:29Þ
Because the fuel nuclei have much larger atomic weights than thoseof the moderator, slowing down in the fuel can be neglected to firstapproximation. We then have
Vq � Vmqm: ð4:30Þ
Replacing the denominator in Eq. (4.28) by Vmqm then yields
p ¼ 1�Vf
Vmqm
ZI
�fea ðEÞ’fðEÞdE; ð4:31Þ
where we have also replaced �faðEÞ with �fe
a ðEÞ since the dominantresonance capture takes place in the fertile material.
In the intermediate energy range moderators may be approximatedas purely scattering materials. In these circumstances Eq. (3.26)relates the flux and slowing down density; if the scattering crosssection �m
s of the moderator is energy independent then the flux is1/E, and Eq. (3.26) reduces to
qm ¼ �m�ms E’mðEÞ; ð4:32Þ
where �m is the moderator slowing down decrement defined inChapter 2. Inserting this expression into Eq. (4.31) then yields
p ¼ 1�Vf
Vm�m�ms E’mðEÞ
ZI
�fea ðE0Þ’fðE0ÞdE0: ð4:33Þ
Because qm and �m�ms are constants, Eq. (4.32) indicates that E’mðEÞ
also must be independent of energy. Hence we may move it insidethe integral. Then, writing �fe
a ðEÞ ¼ Nfe�fea ðEÞ, we obtain the custom-
ary form of the resonance escape probability:
p ¼ 1�VfNfe
Vm�m �ms
I; ð4:34Þ
where the resonance integral is defined by
I ¼Z
I
�fea ðEÞ’fðEÞE’mðEÞ
dE: ð4:35Þ
The Power Reactor Core 103

Most resonances are sufficiently widely spaced that a 1/E fluxdistribution is reestablished at energies between them, but with aslowing down density decreased in proportion to the fraction of neu-trons absorbed. This being the case we may apply the two precedingequations to the ith resonance,
pi ¼ 1�VfNfe
Vm�m �ms
Ii; ð4:36Þ
and
Ii ¼Z
I
�feaiðEÞ’fðEÞE’mðEÞ dE: ð4:37Þ
and write the resonance escape probability as the product of the pi. IfT is the total number of resonances, then
p ¼ p1p2p3 � � � pi � � �pT�1pT : ð4:38Þ
Generally, the escape probability for a single resonance is sufficientlyclose to one that Eq. (4.36) is a reasonable two-term approximation tothe exponential function. Thus we take
pi ¼ exp �VfNfe
Vm�m �ms
Ii
� �; ð4:39Þ
and inserting this result into Eq. (4.38) gives
p ¼ exp �VfNfe
Vm�m �ms
I
� �; ð4:40Þ
where the resonance integral is the sum of contributions from theindividual resonances:
I ¼PTi¼1
Ii: ð4:41Þ
Figure 3.4 illustrated that self-shielding in energy reduces theneutron capture in the resonances of the fertile material. In fact, theseparation of fuel from moderator increases this desirable effect withspace–energy self-shielding which depresses the ratio ’fðEÞ=’mðEÞ inEq. (4.37) at energies were the resonance peaks appear in the absorp-tion cross section �fe
a ðEÞ. Figure 4.6 illustrates spatial self-shieldingas well as the effect of temperature on it. A resonance cross sectionand the Doppler broadening that takes place as the temperature
104 Fundamentals of Nuclear Reactor Physics

increases from T1 to T2 is illustrated in Fig. 4.6a. We see in Fig. 4.6bthe depression in ’fðEÞ, the flux in the fuel, relative to that of ’mðEÞ,the flux in the moderator. As indicated, increasing the temperaturedecreases the self-shielding at the resonance peak, and this in turnincreases the absorption as the temperature increases.
Only the increase in the resonance escape probability caused bythe separations of fuel from moderator allowed reactors fueled withnatural uranium and graphite moderators to be built. Without thespatial self-shielding provided by the separation of fuel and modera-tor, values of k1� 1 are possible with natural uranium fuel only ifheavy water is the moderator. Even with spatial self-shielding,slightly enriched uranium is required to achieve criticality in alight water–moderated system.
More advanced texts include detailed analysis of space–energyself-shielding. However, experimental investigations have led toempirical equations for the resonance integrals of uranium-238 fuelrods given in Table 4.3. The resonance integrals are in barns, thedensity � in g/cm3, and D is the rod diameter in cm. These equationsare valid for isolated rods with 0.2 cm<D< 3.5 cm; if the rods arelocated in a tightly packed lattice the self-shielding increases some-what through what is called a Dancoff correction. In either case, the
TABLE 4.3Resonance Integrals for Fuel Rods
I ¼ 2:95þ 25:8ffiffiffiffiffiffiffiffiffiffiffiffi4=�D
pfor U metal
I ¼ 4:45þ 26:6ffiffiffiffiffiffiffiffiffiffiffiffi4=�D
pfor UO2
Source: Nordheim, L. W., ‘‘The Doppler Coefficient,’’ The Technology of Nuclear ReactorSafety, T. J. Thompson and J. G. Beckerley, eds., Vol. 1, MIT Press, Cambridge, MA, 1966.
(a)E E
1
T1
T2
T1
T2
σ a (E
)
ϕ (E
)
ϕf (E )
ϕm (E )
(b)
FIGURE 4.6 Effect of Doppler broadening on self-shielding for T2 > T1.(a) Resonance absorption cross section, (b) neutron flux in fuel andmoderator.
The Power Reactor Core 105

spatial self-shielding is evident, since as the fuel diameter increases,the resonance integral—and therefore the absorption—decreases.
Thermal Utilization and hT
The thermal utilization, f, is the fraction of thermal neutronsabsorbed in the fuel. Since all the thermal neutrons must be absorbedin either fuel or moderator, we have
f ¼Vf
ZT
�faðEÞ’fðEÞdE
Vf
ZT
�faðEÞ’fðEÞdEþ Vm
ZT
�ma ðEÞ’mðEÞdE
: ð4:42Þ
Finally, the number of fission neutrons produced per thermal neutronabsorbed in the fuel is
�T ¼
ZT��f
fðEÞ’fðEÞdE
ZT
�faðEÞ’fðEÞdE
: ð4:43Þ
The expressions for f and �T simplify considerably by definingcross sections averaged only over the thermal neutron spectrum. Let
�’fT ¼Z
T’fðEÞdE ð4:44Þ
and
�’mT ¼Z
T
’mðEÞdE ð4:45Þ
be the thermal fluxes, space-averaged, respectively, over the fuel andmoderator regions. The thermal cross sections for fuel and moderatorthen become
��fxT ¼ �’�1
fT
ZT
�fxðEÞ’fðEÞdE ð4:46Þ
and
��mxT ¼ �’�1
mT
ZT
�mx ðEÞ’mðEÞdE: ð4:47Þ
106 Fundamentals of Nuclear Reactor Physics

With these thermal cross section definitions f and �T simplify to
f ¼ 1
1þ & Vm ��m
aT
.Vf ��
f
aT
� ð4:48Þ
and
�T ¼���f
fT
��f
aT
; ð4:49Þ
where the thermal disadvantage factor is defined as the ratio ofthermal neutron flux in the moderator to that in the fuel:
& ¼ �’mT
�’fT : ð4:50Þ
The disadvantage is that the more neutrons that are captured in themoderator because of the larger flux there, the fewer will be availableto create fission in the fuel.
k¥ Reconsidered
The question remains, How does the four factor formula relate to thevalue of k1 given by Eq. (4.23)? For an answer, insert Eqs. (4.25),(4.27), (4.42), and (4.43) for ", p, f, and �T into k1 ¼ "pf�T . Cancelingterms, we see that the result is identical to Eq. (4.23):
Thus Eq. (4.23) is consistent with the four factor formula.
The Power Reactor Core 107

Pressurized Water Reactor Example
Two of the primary determinants of the thermal reactor core multi-plication are the fuel enrichment and the volume ratio of modera-tor to fuel. The multiplication increases monotonically withenrichment but exhibits a maximum when plotted with respectto the moderator to fuel ratio. Under- and overmoderated latticesrefer to those in which the moderator to fuel ratios are less than orgreater than the optimal value. We illustrate the effects of enrich-ment, moderator to fuel ratio, and other design parameters onmultiplication using UO2 pressurized water reactor lattices asexamples.
We begin by expressing the four factors in terms of the enrich-ment and the moderator to fuel atom ratio. Equations (4.9) and (4.10)define the enrichment ~e in terms of the number fissile (fi) and fertile(fe) atom densities. Thus analogous to Eq. (4.14) for fast reactors, forthermal reactors we have
�� faT ¼ ~e�� fi
aT þ ð1� ~eÞ�� feaT : ð4:52Þ
Now, however, the energy average is taken over only the thermalrange as indicated by the subscript T. With this nomenclature, wemay express �T in terms of the enrichment and �fi of the fissilematerial as
�T ¼ � fiT
.1þ ð1� ~eÞ�� fe
aT=~e�� fiaT
h i: ð4:53Þ
The resonance escape probability is a function of both theenrichment and the ratio of moderator to fuel nuclei, VmNm=VfNf .Because Nfe ¼ ð1� ~eÞNf , we may rewrite Eq. (4.40) as
p ¼ exp � ð1� ~eÞðVmNm=VfNfÞ
I
� �ms
� �; ð4:54Þ
where �ms ¼ Nm�
ms . Expressed in terms of the moderator to fuel atom
ratio the thermal utilization given by Eq. (4.48) becomes
f ¼ 1
1þ &ðVmNm=VfNfÞð��maT=��f
aTÞ; ð4:55Þ
where we have again expressed macroscopic cross section in termsof nuclide densities and microscopic cross sections: ��m
aT ¼ Nm ��maT
108 Fundamentals of Nuclear Reactor Physics

and ��faT ¼ Nf �� f
aT . Finally the fast fission factor, given by Eq. (4.26),appears as
" ¼ 1þ ð1�~eÞ
~e
�fe �� fefF
�fi ��fifT
ð4:56Þ
when written in terms of microscopic cross sections.Two phenomena compete as VmNm=VfNf , the ratio of moderator
to fuel, is increased. Equation (4.54) indicates that the resonance escapeprobability increases. This happens as a result of the greater ability ofthe moderator to slow down neutrons past the capture resonances. Incontrast, Eq. (4.55) shows that a larger value of VmNm=VfNf results inmore thermal neutron capture in the moderator, thus decreasing thethermal utilization. As a result of these opposing phenomena, thereexists an optimum moderator to fuel ratio, which for a given enrich-ment, fuel element size, and soluble absorber concentration yields themaximum value of k1. Figure 4.7 illustrates these effects.
The figure also illuminates a number of other effects. Increasingthe concentration of boron poison in the moderator reduces the
0
0 5 10 15
0.80
0.90
1.00
1.10
1.20
1.30
1.40
R3
R2
R3R2
R20
0
750
1500
ppmBoron H2O
R1R1
R3R2R1
R1 = 0.51 cmR2 = 0.45 cmR3 = 0.40 cmEnrichment:
3.0 w/o2.5 w/o
1 2 3 4 6 75
VH2O / VUO2
NH / NU
k ∞
FIGURE 4.7 k1 for pressurized water lattices vs moderator to fuel volumeratios with different rod radii, boron concentrations, and enrichments(adapted from Theorie der Kernreaktoren, 1982, by D. Emendorfer andK. H. Hocker, by permission of VGB, Essen).
The Power Reactor Core 109

multiplication, and the effect becomes larger—asone would expect—asthe moderator to fuel volume ratio increases. Likewise, increasing thefuel rod radius increases the multiplication, but by a smaller amount.This comes about from the increase in spatial self-shielding of thecapture resonances: Increased self-shielding reduces the resonanceintegral given inTable 4.3,whichsubsequently increases the resonanceescape probability displayed in Eq. (4.40). Finally, enrichment has amarked effect in increasing k1, which is apparent from observing thecurves for 2.5% (dashed) and 3.0% (solid) enrichment with the otherparameters held constant.
In liquid-moderated systems the core invariably is designed to beundermoderated—to have less moderator than the optimum—underoperating conditions. This is to ensure stability. Because a liquidexpands more rapidly than the solid fuel as the core temperatureincreases, the ratio of moderator to fuel atoms will decrease withtemperature. This will move the operating points on the curves inFig. 4.7 to the left. Thus the value of k1 will decrease with increasingtemperature in an undermoderated core, creating the negative feed-back required for a stable system. Conversely an overmoderated corewould create a positive temperature feedback, and result in anunstable system, unless a negative feedback mechanism, such asthe Doppler broadening discussed in Chapter 3, overrides the positiveeffect. As we will elaborate in Chapter 9, however, too much negativefeedback can create other challenges. Reactor designers must balancethe composite effects of moderator density, fuel temperature, andother phenomena to ensure system stability under all operationconditions.
The situation may be more complex in solid-moderated reac-tors, such as those employing graphite, because it is the relativevalues of the expansion coefficients of two solids that then comeinto play. Moreover, although the atom density of gas coolant maybe too small to have a measurable impact, the relative expansion ofthe coolant channel diameter may become a significant factor. If aliquid coolant is used in combination with graphite, such as in theRBMK reactors, then the interactions are more complex yet, for theinteracting temperature effects on fuel, coolant, and moderatormust be considered separately, and in combination.
Bibliography
Bell, George I., and Samuel Glasstone, Nuclear Reactor Theory, Van NostrandReinhold, NY, 1970.
Bonalumi, R. A., ‘‘In-Core Fuel Management in CANDU-PHR Reactors,’’Handbook of Nuclear Reactors Calculations, II, Yigan Ronen, ed., CRCPress, Boca Raton, FL, 1986.
110 Fundamentals of Nuclear Reactor Physics

Duderstadt, James J., and Louis J. Hamilton, Nuclear Reactor Analysis,Wiley, NY, 1976.
Emendorfer, D., and K. H. Hocker, Theorie der Kernreaktoren, Bibliogra-phisches Institut AG, Zurich, 1982 .
Glasstone, Samuel, and Alexander Sesonske, Nuclear Reactor Engineering,3rd ed., Van Nostrand Reinhold, NY, 1981.
Lamarsh, John, and Anthony J. Baratta, Introduction to Nuclear Engineer-ing, 3rd ed., Prentice-Hall, 2001.
Nordheim, L. W., ‘‘The Doppler Coefficient,’’ The Technology of NuclearReactor Safety , T. J. Thompson and J. G. Beckerley, eds., Vol. 1, MITPress, Cambridge, MA, 1966.
Salvatores, Max, ‘‘Fast Reactor Calculations,’’ Handbook of Nuclear Reac-tors Calculations, III, Yigan Ronen, ed., CRC Press, Boca Raton, FL, 1986.
Steward, H. B., and M. H. Merril, ‘‘Kinetics of Solid-Moderators Reactor’’,Technology of Nuclear Reactor Safety, T. J. Thompson and J. G. Beckerley,eds., Vol. 1, MIT Press, Cambridge, MA, 1966.
Turinsky, Paul J., ‘‘Thermal Reactor Calculations,’’ Handbook of NuclearReactors Calculations, III, Yigan Ronen, ed., CRC Press, Boca Raton, FL,1986.
Problems
4.1. A reactor is to be built with fuel rods of 1.2 cm in diameter and aliquid moderator with a 2:1 volume ratio of moderator to fuel.What will the distance between nearest fuel centerlines be
a. For a square lattice?b. For a hexagonal lattice?
4.2. In a fast reactor designers often want to minimize the coolant tofuel volume ratio to minimize the amount of neutron slowingdown. From a geometric point of view what is the theoreticallimit on the smallest ratio of coolant to fuel volume that can beobtained
a. With a square lattice?b. With a hexagonal lattice?
4.3. A sodium-cooled fast reactor is fueled with PuO2, mixed withdepleted UO2. The structural material is iron. Averaged over thespectrum of fast neutrons, the microscopic cross sections anddensities are as follows:
�f b �a b �t b � g/cm3
PuO2 1.95 2.40 8.6 11.0
UO2 0.05 0.404 8.2 11.0Na – 0.0018 3.7 0.97Fe – 0.0087 3.6 7.87
The Power Reactor Core 111

The fuel is 15% PuO2 and 85% UO2 by volume. The volumetriccomposition of the core is 30% fuel, 50% coolant, and 20%structural material. Calculate k1 assuming that the values of �for plutonium and uranium in the fast spectrum are 2.98 and2.47, respectively, and that the cross sections of oxygen can beneglected. What fraction of the mass of the core does the fuelaccount for?
4.4. Suppose the nonleakage probability for a sodium-cooled fastreactor specified in problem 4.3 is 0.90. Using the data fromproblem 4.3, adjust the volume fractions of PuO2 and UO2 inthe fuel so that k = 1.0. What is the % PuO2 in the fuel byvolume?
4.5. Verify Eq. (4.18).
4.6. A pressurized water reactor has 3% enriched UO2 fuel pinsthat are 1.0 cm in diameter and have a density of 11.0 g/cm3.The moderator to fuel volume ratio is 2:1. Calculate �T , p, f,and k1 at room temperature under the assumptions that" ¼ 1:24, the thermal disadvantage factor & ¼ 1:16, and theDancoff correction increases the fuel diameter for theresonance integral calculation by 10%. (Use fuel data fromProblem [3.4].)
4.7. Suppose the fuel rods from problem 4.6 are to be used in a D2O-moderated reactor.
a. What volume ratio of moderator to fuel is required to give thesame value of p as for the H2O lattice in problem 4.6?(Assume no Dancoff correction.)
b. What volume ratio of moderator to fuel is required to give thesame value of f as for the H2O lattice in problem 4.6? (Assume& is unchanged.)
4.8. A reactor lattice consists of uranium rods in a heavy watermoderator. The heavy water is replaced by light water.
a. Would the resonance escape probability increase or decrease?Why?
b. Would the thermal utilization increase or decrease? Why?c. What would you expect the net effect on k1 to be? Why?
4.9. Suppose the volume ratio of coolant to fuel is increased in apressurized water reactor:
a. Will the fast fission factor increase, decrease, or remainunchanged? Why?
b. Will the resonance escape probability increase, decrease, orremain unchanged? Why?
112 Fundamentals of Nuclear Reactor Physics

c. Will the thermal utilization increase, decrease, or remainunchanged? Why?
d. Will the value of �T increase, decrease, or remain unchanged?Why?
4.10. Using the data from problem 4.6, vary the coolant to fuel volumeratio between 0.5 and 2.5 and plot the following vs Vm=Vf :
a. The resonance escape probability.b. The thermal utilization.c. k1.d. Determine the moderator to fuel volume ratio that yields
the largest k1.e. What is the largest value of k1?
You may assume that changes in the fast fission factor and thethermal disadvantage factor are negligible.
4.11. A reactor designer decides to replace uranium with UO2 fuel ina water-cooled reactor, keeping the enrichment, fuel diameter,and water to fuel volume ratios the same.
a. Will p increase, decrease, or remain unchanged? Why?b. Will f increase, decrease, or remain unchanged? Why?c. Will �T increase, decrease, or remain unchanged? Why?
4.12. The fuel for a thermal reactor has the following composition byatom ratio: 2% uranium-235, 1% plutonium-239, and 97%uranium-238. Calculate the value of �T to be used for this fuelin the four factor formula. (Use the data given for problem 3.4.)
The Power Reactor Core 113

CHAPTER 5
Reactor Kinetics
5.1 Introduction
This chapter takes up a detailed examination of the time-depen-dent behavior of neutron chain reactions. In order to emphasize thetime variable we make two simplifications that remove the need totreat concomitantly the neutron energy and spatial variables. First,we assume that the techniques of Chapters 3 and 4 have beenapplied to average both the neutron distribution and associatedcross sections over energy. Second, we delay the explicit treatmentof spatial effects until the following chapters, assuming for nowthat neutron leakage from the system is either negligible or can betreated by the nonescape probability approximation introducedearlier.
We begin by introducing a series of neutron balance equationsand their time-dependent behavior. First we examine a system inwhich no fissionable materials are present; such a system is desig-nated as nonmultiplying. Subsequently, we include fissionable iso-topes, and examine the behavior of the resulting multiplyingsystem. In both cases we assume that neutron leakage from thesystems can be ignored. We then incorporate the effects of leakage,in order to examine the phenomena of criticality in systems offinite size.
The most noteworthy simplification in these equations is theassumption that all neutrons are produced instantaneously at thetime of fission. In reality a small fraction of fission neutrons aredelayed because they are emitted as a result of the decay of certainfission products. These delayed neutrons have profound effects onthe behavior of chain reactions. The remainder of the chapter dealswith the reactor kinetics that results from the combined effects offission neutrons, both those produced promptly and those that aredelayed.
115

5.2 Neutron Balance Equations
To obtain neutron balance equations we utilize the followingdefinitions:
nðtÞ= total number of neutrons at time t,�v = average neutron speed,
�x = energy-averaged cross section for reaction type x.
Here nðtÞ refers to all of the neutrons in the system, regardless of theirlocation or kinetic energy. Likewise �v and �x are the results obtainedfrom averaging over all neutron energies, and in the case of �x we alsoassume that in a power reactor it has been spatially averaged over thelattice cell.
Infinite Medium Nonmultiplying Systems
We first determine the time rate of change of the number of neutrons,nðtÞ, in a nonmultiplying system, that is, a system containing nofissionable material. In addition, we assume that the system’s dimen-sions are so large that the small fraction of neutrons that leak from itssurface can be neglected. The neutron balance equation is then
d
dtnðtÞ ¼ # of source neutrons produced/s
� # of neutrons absorbed/s: ð5:1Þ
We replace the first term on the right by the source SðtÞ, defined asthe number of neutrons introduced per second. Recall that themacroscopic absorption cross section �a is the probability that aneutron will be absorbed per cm of travel. Thus �v�a is the probabilityper second that a neutron will be absorbed, and �a �vnðtÞ is the num-ber of neutrons absorbed per second. Equation (5.1) becomes
d
dtnðtÞ ¼ SðtÞ � �a �vnðtÞ: ð5:2Þ
To determine the average neutron lifetime between birth andabsorption we assume that at t = 0 the system contains nð0Þ neu-trons, but no further neutrons are produced. Thus SðtÞ ¼ 0 in Eq. (5.2):
d
dtnðtÞ ¼ ��a �vnðtÞ: ð5:3Þ
Analogous in form to the radioactive decay equation in Chapter 1,Eq. (5.3) has the solution
116 Fundamentals of Nuclear Reactor Physics

nðtÞ ¼ nð0Þ expð�t=l1Þ; ð5:4Þ
where we have defined
l1 ¼ 1=�v�a: ð5:5Þ
Because l1 has the units of time, we designate it as the neutronlifetime. The subscript indicates that we are referring to an infinitemedium; the lifetime is not shortened as a result of the neutronsleaking from the system. More formal justification for designating l1as the neutron lifetime derives from the definition of �t, the meanneutron lifetime:
�t �
Z 10
tnðtÞdtZ 10
nðtÞdt
¼ 1=�v�a ¼ l1: ð5:6Þ
Using this definition for neutron lifetime we may write Eq. (5.2) as
d
dtnðtÞ ¼ So �
1
l1nðtÞ; ð5:7Þ
where we have assumed the source to be independent of time:SðtÞ ! So. Next consider the situation where no neutrons are presentuntil the source is inserted at t = 0. Solving Eq. (5.7) with the initialcondition nð0Þ ¼ 0 yields
nðtÞ ¼ l1So½1� expð�t=l1Þ�: ð5:8Þ
Thus the neutron population first increases but then stabilizes atnð1Þ ¼ l1So.
The foregoing equations illustrate that the speed at which neu-tron populations build or decay depends strongly on the neutronlifetime. Accordingly, the processes take place very rapidly in non-multiplying systems, because neutron lifetimes in them range from10�8 to 10�4 s. The longer lifetimes take place in systems in whichthe neutrons reach thermal energies before being absorbed, for thenthe speed in Eq. (5.5) is dominated by the slow neutrons. Systems inwhich most of the neutrons are absorbed at higher energies, beforeslowing down can take place, have much shorter lifetimes.
Infinite Medium Multiplying Systems
Next consider a multiplying system, that is, one in which fissionablematerial is present. We again neglect leakage effects by assuming thatthe system’s dimensions are infinitely large. For now we also assume
Reactor Kinetics 117

that all neutrons from fission are emitted instantaneously, thusignoring the small but important fraction of fission neutrons thatundergo delayed emission. With these assumptions the neutron bal-ance equation becomes
d
dtnðtÞ ¼ # of source neutrons produced/s
þ # of fission neutrons produced/s
� # of neutrons absorbed /s:
ð5:9Þ
The source and absorption terms have the same form as before.To obtain the fission term, first note that the number of fissionreactions per second is �f �vnðtÞ. Then with � denoting the averagenumber of neutrons per fission, the number of fission neutronsproduced per second is ��f �vnðtÞ. Hence the balance equationbecomes
d
dtnðtÞ ¼ SðtÞ þ ��f �vnðtÞ � �a �vnðtÞ: ð5:10Þ
With the infinite medium multiplication defined by Eq. (3.61) as
k1 ¼ ��f
��a ð5:11Þ
and l1 defined by Eq. (5.5), we may rewrite Eq. (5.10) as
d
dtnðtÞ ¼ SðtÞ þ ðk1 � 1Þ
l1nðtÞ: ð5:12Þ
The concepts of criticality and multiplication introduced inearlier chapters are closely related. Suppose we consider a system inwhich there are no sources of neutrons other than from fission.Accordingly, we set S = 0 in Eq. (5.12) and obtain
d
dtnðtÞ ¼ ðk1 � 1Þ
l1nðtÞ: ð5:13Þ
A system is defined to be critical if there can exist a time-independentpopulation of neutrons in the absence of external sources. Thus for asystem to be critical the derivative on the left of this expression mustvanish. Consequently, for the system to be critical the multiplicationk1 must be equal to one. The system is said to be sub- or supercritical,respectively, if in the absence of external sources, the neutron
118 Fundamentals of Nuclear Reactor Physics

population decreases or increases with time. Equation (5.13) indicatesthat an infinite system is subcritical, critical, or supercritical accord-ing to whether k1<1, k1 = 1, or k1 > 1.
Finite Multiplying Systems
We next reformulate the neutron balance equation for the morerealistic situation in which the reactor dimensions are finite, andhence neutron leakage from the system must be taken into account.We begin by rewriting Eq. (5.9) with a loss term appended to accountfor neutron leakage:
d
dtnðtÞ ¼ # of source neutrons produced/s
þ # of fission neutrons produced/s
� # of neutrons absorbed/s
� # neutrons leaking from system/s.
ð5:14Þ
Only the leakage term differs in form from those found in Eq. (5.10).We write it as ��a �vnðtÞ, which assumes that the number of neutronsleaking from the system is proportional to the number of neutronsabsorbed per second, with proportionality constant G. With the leak-age expressed as ��a �vnðtÞ, Eq. (5.14) becomes
d
dtnðtÞ ¼ SðtÞ þ ��f �vnðtÞ � �a �vnðtÞ � ��a �vnðtÞ: ð5:15Þ
We may cast this equation in a more physically meaningfulform by expressing G in terms of leakage and nonleakage probabi-lities. We say that neutrons are ‘‘born’’ either as external sourceneutrons, S, or from fission. They then undergo a number of scatter-ing collisions and ultimately ‘‘die’’ from one of two fates: they areabsorbed or they leak from the system. The probability that theywill leak from the system is
PL ¼��a �vn
�a �vnþ ��a �vn¼ �
1þ �: ð5:16Þ
Thus the nonleakage probability is 1� PL or
PNL ¼1
1þ �: ð5:17Þ
Thus since we expect the nonleakage probability to grow andapproach one as the reactor becomes very large, G decreases withincreased reactor size.
Reactor Kinetics 119

The nonleakage probability definition assists in writing Eq. (5.15)in a more compact form. We first multiply it by the nonleakageprobability and use Eq. (5.17) to eliminate G from the equation:
PNLd
dtnðtÞ ¼ PNLSðtÞ þ PNLð��fÞ�vnðtÞ � �a �vnðtÞ: ð5:18Þ
Equations (5.11) and (5.5) allow the last two terms to be combinedand written in terms of k1 and l1:
PNLd
dtnðtÞ ¼ PNLSðtÞ þ ðPNLk1 � 1Þ
l1nðtÞ: ð5:19Þ
Finally, we divide this expression by PNL and define the finitemedium multiplication and neutron lifetime as
k ¼ PNLk1 ð5:20Þ
and
l ¼ PNLl1: ð5:21Þ
Equation (5.19) then reduces to
d
dtnðtÞ ¼ SðtÞ þ ðk� 1Þ
lnðtÞ; ð5:22Þ
which is identical to Eq. (5.12) if the infinite medium subscripts areremoved. Both the multiplication and neutron lifetime are smallerfor the finite than for the infinite system, because of the neutrons lostto leakage.
5.3 Multiplying Systems Behavior
Although Eq. (5.22) does not incorporate the effects of delayedneutrons, it provides us with a simplified—but qualitativelycorrect—description of multiplying systems. The definition of criti-cality once again comes from the form of the equation in which theexternal source term, SðtÞ, is set equal to zero:
d
dtnðtÞ ¼ ðk� 1Þ
lnðtÞ: ð5:23Þ
If there are neutrons in the system at t = 0, that is, if nð0Þ > 0, then inthe absence of an external source,
120 Fundamentals of Nuclear Reactor Physics

nðtÞ ¼ nð0Þ expðk� 1Þ
lt
� �: ð5:24Þ
The system is said to be critical if there is a time-independentchain reaction in the absence of sources. Clearly, the system iscritical when k, the multiplication, is equal to one. Analogous tothe infinite medium, we now have
k>1 supercritical¼1 critical<1 subcritical:
8<: ð5:25Þ
Figure 5.1a shows the behavior of multiplying systems in the absenceof sources.
Considering the case where a time-independent source is presentin the system, we must solve Eq. (5.22) with SðtÞ ! So. Applying theintegrating factor technique explained in Appendix A, with an initialcondition nð0Þ ¼ 0, we obtain
nðtÞ ¼ lSo
ðk� 1Þ expðk� 1Þ
lt
� �� 1
� �: ð5:26Þ
Figure 5.1b indicates the behavior of multiplying systems with atime-independent source present. For a supercritical system, k > 1,the neutron population rises at an increasing rate, becoming expo-nential at long times. The behavior of the subcritical system, k < 1,becomes more transparent if we first manipulate the minus signs torewrite Eq. (5.26) in the form
0 0.5 10
1
2
3
(a) (b)
t
n(t )
/n(0
)
n(t )
/So
0 0.5 10
1
2
3
t
k > 1 k = 1k > 1
k < 1
k < 1
k = 1
FIGURE 5.1 Neutron populations in subcritical, critical, and supercriticalsystems. (a) n(0) = 1, no source present, (b) n(0) = 0, source present.
Reactor Kinetics 121

nðtÞ ¼ lSo
ð1� kÞ 1� exp�ð1� kÞ
lt
� �� �: ð5:27Þ
Thus for k < 1 (the subcritical case) the number of neutrons increasesat first, but then as the exponential term decays away, the populationstabilizes at long times to a time-independent solution of
nð1Þ ¼ lSo
ð1� kÞ : ð5:28Þ
The behavior of Eq. (5.26) or Eq. (5.27) is more subtle for the caseof a critical system, for which k = 1, because then both the term inbrackets and the denominator equal zero. However, if we take thelimit as k! 1 we can expand the exponential as a power seriesexpðxÞ ¼ 1þ x þ 1=2 x2 þ � � � in Eq. (5.26) to obtain
nðtÞ ¼ lSo
ðk� 1Þ 1þ ðk� 1Þl
tþ 1
2
ðk� 1Þ2
l2t2 þ � � � � 1
( ): ð5:29Þ
Canceling terms, and taking the limit k! 1 yields
nðtÞ ¼ S0t: ð5:30Þ
Thus the neutron population in a critical system will increase line-arly with time in the presence of a time-independent source.
The results of the foregoing considerations are summarized in theFig. 5.1. There are only two situations in which a time-independentpopulation of neutrons can be established: (1) a critical system in theabsence of an external source (k = 1 and S = 0) and (2) a subcriticalsystem in which there is a source of neutrons present (k< 1 and S> 0).Note that the definition of criticality depends only on the multiplica-tion k, and not on the source. The behavior of the system, however,depends very strongly on whether a source is present.
Observe that even for very small deviations of the multiplicationfrom one, large time rates of change take place in the neutron popula-tion. These are caused by the small value of the neutron lifetime,typically ranging from 10�8 to 10�4 s, which appears in the denomi-nator of the exponentials. With such small neutron lifetimes, con-trolling a nuclear reactor would be very difficult if all the neutronswere born instantaneously with fission. Fortunately, the presence ofdelayed neutrons—which have been neglected until now—greatlydecreases the rates of change in the neutron populations to moremanageable levels, provided certain restrictions are met.
122 Fundamentals of Nuclear Reactor Physics

5.4 Delayed Neutron Kinetics
More than 99% of fission neutrons are produced instantaneously atthe time of fission. The remaining fraction, �, results from the decayof the neutron-emitting fission products. These neutron precursorsare typically lumped into six groups with half-lives ranging from afraction of a second to nearly a minute. Table 5.1 displays the sixgroup half-lives and delayed fractions for the three most commonfissile isotopes. Note that � is just the sum of the delayed fractions foreach group:
� ¼P6i¼1
�i: ð5:31Þ
If we denote the half-life for the ith group by ti1=2 , then the averagehalf-life of the delayed neutrons is
t1=2¼1
�
X6
i¼1
�iti1=2 : ð5:32Þ
Moreover, since half-lives and decay constants are related by
ti1=2¼ 0:693=�i;
ð5:33Þ
the average decay constant can be defined by
1
�¼ 1
�
X6
i¼1
�i1
�i: ð5:34Þ
TABLE 5.1Delayed Neutron Properties
ApproximateHalf-life (sec)
Delayed Neutron Fraction
U233 U235 Pu239
56 0.00023 0.00021 0.0000723 0.00078 0.00142 0.000636.2 0.00064 0.00128 0.000442.3 0.00074 0.00257 0.000690.61 0.00014 0.00075 0.000180.23 0.00008 0.00027 0.00009
Total delayed fraction 0.00261 0.00650 0.00210Total neutrons/fission 2.50 2.43 2.90
Reactor Kinetics 123

In the preceding equations the quantity l designates the promptneutron lifetime, which is the average lifetime of those neutronsproduced instantaneously at the time of fission. If we define theaverage delayed neutron lifetime, ld, as the time interval betweenfission and the time at which the delayed neutrons are absorbed orleak from the system, then it has a value of
ld ¼ lþ t1=2=0:693 ¼ lþ 1=�: ð5:35Þ
Hence including the lifetimes of both prompt and delayed neutrons,we obtain the average neutron lifetime as
�l ¼ ð1� �Þlþ �ld ¼ lþ �=�: ð5:36Þ
Although delayed neutrons are a small fraction of the total, theydominate the average neutron lifetime, because �=�� l. The delayedneutrons have profound effects on the behavior of chain reactions.But the effects are not adequately described by simply replacing lwith �l in the foregoing equations. Proper treatment requires a set ofdifferential equations to account for the time-dependent behavior ofboth prompt and delayed neutrons.
Kinetics Equations
To derive a neutron balance equation in which the effects of delayedneutrons are included, we divide the fission terms in Eq. (5.15) intoprompt and delayed contributions. If � is the delayed neutron fraction,the rate at which prompt neutrons are produced is ð1� �Þ��f �vnðtÞ.Delayed neutrons, on the other hand, are produced by the decay offission products. If we define CiðtÞ as the number of radioactive pre-cursors producing neutrons with a half-life ti1=2 , then the rate of delayedneutron production is �iCiðtÞ. With the fission term divided into theprompt and delayed contributions, Eq. (5.15) becomes
d
dtnðtÞ ¼ SðtÞ þ ð1� �Þ��f �vnðtÞ þ
Xi
�iCiðtÞ � �a �vnðtÞ � ��vnðtÞ:
ð5:37Þ
We require six additional equations to determine the precursorconcentration for each delayed group. Each has the form of a balanceequation:
d
dtCiðtÞ ¼ # precursors produced=s�# precursors decaying=s:
ð5:38Þ
124 Fundamentals of Nuclear Reactor Physics

The number of precursors of type i produced per second is �i��f �vnðtÞ,whereas the decay rate is �iCiðtÞ. Hence
d
dtCiðtÞ ¼ �i��f �vnðtÞ � �iCiðtÞ; i ¼ 1; 2; � � �; 6: ð5:39Þ
Taken together, Eqs. (5.37) and (5.39) constitute the neutron kineticsequations. Expressed in terms of the multiplication and prompt neu-tron lifetime, defined by Eqs. (5.5), (5.11), (5.20), and (5.21), theseequations become
d
dtnðtÞ ¼ SðtÞ þ 1
l½ð1� �Þk� 1�nðtÞ þ
Xi
�iCiðtÞ ð5:40Þ
and
d
dtCiðtÞ ¼ �i
k
lnðtÞ � �iCiðtÞ; i ¼ 1; 2; � � �; 6: ð5:41Þ
We may ask, under what conditions can these equations have asteady state solution; that is, a solution for which n and Ci are time-independent, causing the derivatives on the left vanish? For a time-independent source, So, we have
0 ¼ So þ1
l½ð1� �Þk� 1�nþ
Xi
�iCi ð5:42Þ
and
0 ¼ �ik
ln� �iCi; i ¼ 1;2; � � �;6: ð5:43Þ
Solving for Ci, inserting the result into Eq. (5.42), and making use ofEq. (5.31) yields
0 ¼ S0 þðk� 1Þ
ln: ð5:44Þ
Thus for the situation where a source is present n ¼ lS0=ð1� kÞ,which gives a positive result only when k < 1, that is, the system issubcritical. In the absence of a source, Eq. (5.44) is satisfied with atime-independent neutron population, n, only if k = 1, that is, thesystem is critical. Moreover, if k = 1, then any value of n satisfies theequation. These are the same conditions for steady state solutions asshown in Fig. 5.1, and given by Eqs. (5.24) and (5.28). Thus thepresence of delayed neutrons has no effect on the requirements forachieving steady state neutron distributions.
Reactor Kinetics 125

Reactivity Formulation
The time-dependent behavior of a reactor is very sensitive to smalldeviations of the multiplication about one. This behavior is highlightedby writing the kinetics equations in terms of the reactivity, defined as
� ¼ k� 1
k: ð5:45Þ
Hence,
�> 0 supercritical¼ 0 critical< 0 subcritical:
8<:
Designating the prompt generation time as
� ¼ l=k ð5:46Þ
and using the definitions of � and �, we may simplify the kineticsequations—that is, Eqs. (5.40) and (5.41)—to
d
dtnðtÞ ¼ SðtÞ þ ð�� �Þ
�nðtÞ þ
Xi
�iCiðtÞ ð5:47Þ
and
d
dtCiðtÞ ¼
�i
�nðtÞ � �iCiðtÞ; i ¼ 1;2; . . . ;6: ð5:48Þ
In the many cases where the reactivity is not large, and thus, k � 1,we can approximate � � l without appreciably affecting solutions tothe equations.
The steady state condition given by Eq. (5.44) may also beexpressed in terms of � and � by setting the derivatives in Eqs. (5.47)and (5.48) equal to zero: The precursor solution is Ci ¼ ð�i=�i�Þn. Thusfor a subcritical system with SðtÞ ¼ So, Eq. (5.47) yields n ¼ �So= �j j,whereas for a critical system, � ¼ 0, any positive value of n is a solu-tion of Eq. (5.47), provided SðtÞ ¼ 0. Finally, we note that in mostsystems �i�=�i 1, and therefore under steady state conditionsCi � n. Thus the number of neutron-emitting fission products in areactor is much larger than the number of neutrons.
5.5 Step Reactivity Changes
We next consider what happens when a step change in reactivityis applied to an initially critical reactor that has been operating at
126 Fundamentals of Nuclear Reactor Physics

steady state. The two curves in Fig. 5.2 show solutions to Eqs. (5.47)and (5.48) for positive and negative reactivity insertions. At firstglance the curves appear similar to those in Fig. 5.1a. However, onfurther inspection we observe that the curves in Fig. 5.2 are morenuanced; this results from both prompt and delayed neutrons beingtaken into account. First—in less than a second—a prompt jumpoccurs in the neutron population. The jump is abrupt because it iscontrolled by the prompt neutron lifetime, here taken as� ¼ 50 � 10�6 s, which is typical for a water-cooled reactor. Therethen follows the exponential growth or decay that appears similarfor Fig. 5.1a. The exponential behavior displayed in Fig. 5.2 occursquite slowly because the half-lives from the neutron-emitting fissionproducts are the primary determinant the neutron population’sgrowth or decay following the prompt jump.
The asymptotic behavior may be represented as nðtÞ / expðt=TÞ,where T is defined as the reactor period. The period is positive ornegative depending on whether the reactor is super- or subcritical; itis the length of time required for the reactor power to increase ordecrease by a factor of e and is arguably the most important quantityderivable from the kinetics equations.
Reactor Period
We determine the reactor period by returning to the kinetics equa-tions and setting the source equal to zero. We then look for a solutionof the seven equations set in the form nðtÞ ¼ A expð!tÞ and
0 20 40 60 80 100 1200
1
2
3
4
5
Time, seconds
n(t )
/n(0
)ρ > 0
ρ < 0
FIGURE 5.2 Neutron populations following reactivity insertions of –0.10�.
Reactor Kinetics 127

CiðtÞ ¼ Bi expð!tÞ, where A, Bi, and ! are constants. Inserting theseexpressions into Eqs. (5.47) and (5.48) yields
!A ¼ ð�� �Þ�
AþX
i
�iBi ð5:49Þ
and
!Bi ¼�i
�A� �iBi: ð5:50Þ
Solving the second equation for Bi in terms of A and inserting theresult into the first, we obtain—after canceling out the A’s—thefollowing:
! ¼ ð�� �Þ�
þ 1
�
Xi
�i�i
!þ �i: ð5:51Þ
Next, we consolidate the terms on the right by making use ofEq. (5.31):
! ¼ �
�� 1
�
Xi
�i
!þ �i!: ð5:52Þ
Finally, solving for � yields
� ¼ �þX
i
�i
!þ �i
!!: ð5:53Þ
This is known as the inhour equation, since the units of ! arecommonly taken as inverse hours.
The solution of Eq. (5.53) may be examined by graphing the right-hand side versus ! as Fig. 5.3 illustrates. By drawing a horizontal linefor a specific value of �, we observe that there are seven solutions,say, !1 > !2 � � � > !7, regardless of whether the reactivity is positiveor negative. Accordingly, the neutron population takes the form
nðtÞ ¼P7i¼1
Ai expð!itÞ: ð5:54Þ
Figure 5.3 indicates that for positive reactivity only !1 is positive.The remaining terms rapidly die away, yielding an asymptotic solu-tion in the form
nðtÞ ’ A1 expðt=TÞ; ð5:55Þ
128 Fundamentals of Nuclear Reactor Physics

where T ¼ 1=!1 is the reactor period. Figure 5.3 also shows that anegative reactivity leads to a negative period: All of the !i are nega-tive, but T ¼ 1=!1 will die away more slowly than the others. ThusEq. (5.55) is valid for negative as well as positive reactivities.
The plots in Fig. 5.2 are for reactivities of � ¼ 0:1�, using para-meters for uranium-235 and � ¼ 50 � 10�6 s. The prompt jump mag-nitude at the beginning of the curves is approximately A1 � nð0Þj j.
To determine the reactivity required to produce a given period—or vice versa—a plot of � vs T must be constructed using the delayedneutron data for a particular fissionable isotope or isotopes, and for agiven prompt neutron lifetime. Figure 5.4 employs uranium-235 datain such a plot. Note that the very rapid decrease in the period takesplace as � exceeds �. The condition � ¼ � defines prompt critical, forat that point the chain reaction is sustainable without delayed neu-trons as indicated by the change in sign from negative to positive ofthe second term in Eq. (5.47).
As prompt criticality is exceeded, the distinction between theprompt jump and the reactor period vanishes, for now the promptneutron lifetime rather than the delayed neutron half-lives largelydetermines the rate of exponential increase. Indeed, as prompt criti-cal is approached, the period becomes so short that controlling thereactor by mechanical means such as the movement of control rodsbecomes exceeding difficult if not impossible. So important is it toavoid approaching prompt critical that reactivity is often measured indollars, $ ¼ �=�, or in cents.
For negative reactivities there is an asymptotic limit to how fastthe neutron population can be decreased. Note from Fig. 5.3 that thesmallest negative period possible—that is, the fastest a reactor’s powercan be decreased after the initial prompt drop—is determined by the
–β
V –λ 6 –λ 5 –λ 4 –λ 3 –λ 2 –λ 1
ω0
f (ω)
FIGURE 5.3 Solution of the in-hour equation (adapted from A. F. Henry,Nuclear-Reactor Analysis, 1975, by permission of the MIT Press).
Reactor Kinetics 129

longest half-life of delayed neutrons or T ¼ 1=�1 ¼ 0:693t1=2 maxj ,which is approximately 56 s for a uranium-fueled reactor.
Figure 5.3 indicates that when the reactivity is small, so is thelargest value of omega, !1. Suppose for a small reactivity we take!1 �i for all �i. We may then eliminate omega from the denomi-nator of Eq. (5.53), yielding
� ¼ �þX
i
�i
�i
!!1: ð5:56Þ
Using Eq. (5.34) to eliminate the summation, and solving for omega,we obtain !1 ¼ �=ð�þ �=�Þ. Generally, � �=�, yielding
T � �=ð��Þ: ð5:57Þ
Thus for small reactivities—positive or negative—the reactor per-iod is governed almost completely by the delayed neutron proper-ties � and �. This may seem surprising since delayed neutronsare such a small fraction of the fission neutrons produced. Butwhen this small fraction is multiplied by the average half-life,�=� ¼ 0:693�t1=2
, a time substantially longer than the prompt neu-tron lifetime results.
0.010
0.008
0.006
0.004
0.002
010–6 10–5 10–4 10–3 10–2 10–1
10–7
= 10–8 sec
10–6 10–5 10–4 10–3
Promptcritical
Reactor period, sec
Rea
ctiv
ity ρ
10 102 1031
V
FIGURE 5.4 Reactivity vs reactor period for various prompt neutrongeneration times.
130 Fundamentals of Nuclear Reactor Physics

Above prompt critical the period is very small, and thus !1 isvery large. In this situation, we may take !1 � �i for all �i inEq. (5.53), reducing it to � ¼ �!1 þ �, or equivalently !1 ¼ ð�� �Þ=�.Thus the reactor period is very short for � > �, for it is proportional tothe prompt neutron generation time and independent of the delayedneutron half-lives:
T � �=ð�� �Þ: ð5:58Þ
Prompt Jump Approximation
The prompt jump that occurs following small step changes in reac-tivity may be utilized in making experimental determinations ofreactor parameters using the rod drop and source jerk techniques.This jump is observed in Fig. 5.5, where we have magnified the initialpart of the flux transients appearing in Fig. 5.2. Note that althoughthe neutron population jumps rapidly at first, it then undergoeschange much more slowly. The precursor concentration behavesmuch more sluggishly than the neutron population, changing hardlyat all over the time it takes for the neutrons to undergo the initialjump up or down. This behavior stems from the long precursor half-lives compared to the prompt generation time; the precursor behaviorgoverned by Eq. (5.48) is sluggish even when responding to a rapidchange in neutron population since the decay constant multiplying
0
0 0.1
0.02 0.04 0.06 0.080.8
0.9
1
1.1
Time, seconds
n(t )
/n(0
)
ρ = 0.10β
ρ = –0.10β
FIGURE 5.5 Prompt jump in neutron populations following reactivityinsertions of – 0.10�.
Reactor Kinetics 131

Ci is small. In contrast, the neutron population at first responds veryrapidly as a result of the small value of prompt neutron generationtime � in the denominator of Eq. (5.47). After a short time haselapsed, however, the neutron response is slowed as a result of themore slowly changing value of the last term in Eq. (5.48). We canmake use of this behavior to estimate the magnitudes of the promptjump in the two following situations.
Rod Drop
Suppose we have a source-free critical reactor operating at steadystate. According to Eq. (5.48) the precursor concentrations are relatedto the neutron population by
Cio ¼ ð�i=�i�Þno: ð5:59Þ
Immediately following the rod insertion the precursor concentrationCio will remain essentially unchanged for as long as �it 1. Thus thesource-free form of Eq. (5.47) becomes
d
dtnðtÞ ¼ � ð �j j þ �Þ
�nðtÞ þ �
�no; t 1=�i; ð5:60Þ
where we have employed Eq. (5.31) and taken � ¼ � �j j to indicate anegative reactivity. We use the integrating factor technique detailedin Appendix A to obtain a solution. With an integrating factor ofexp½ð �j j þ �Þ=�� and an initial condition of nð0Þ ¼ no, we obtain aftersome simplification
nðtÞ ¼ �
ð �j j þ �Þno þ�j j
ð �j j þ �Þnoe�1�ð �j jþ�Þt: ð5:61Þ
Following decay of the second term, which is very rapid, we have fortimes substantially greater than the prompt generation time, but lessthan the half-lives of the delayed neutrons (i.e., �=ð �j j þ �Þ t 1=�i),a neutron population of approximately
n1 ¼�
ð �j j þ �Þno: ð5:62Þ
Thus the reactivity drop in dollars can be measured by taking theratio of the neutrons immediately before to immediately after thecontrol rod insertion:
�j j=� ¼ no
n1� 1: ð5:63Þ
132 Fundamentals of Nuclear Reactor Physics

Source Jerk
The source jerk is performed on a subcritical reactor, � ¼ � �j j, con-taining a neutron source So. Because the system is in a steady state,Eq. (5.43) holds, and the initial condition for the experiment isCio ¼ ð�i=�i�Þno. Following sudden removal (i.e., jerking) of thesource, the neutron population undergoes a sharp negative jump.We can again model the transient using Eq. (5.47) with the sourceterm set equal to zero, and CiðtÞ replaced with Cio for times t 1=�i.Equation (5.60) once again results, with a solution given by Eq. (5.61),and Eqs. (5.62) and (5.63) remain valid in describing the relationshipbetween reactivity, delayed neutron fraction, and the decrease inneutron population. Thus we see that either inserting a negativereactivity � ¼ � �j j into a critical reactor (the rod drop experiment)or removing the source from a subcritical system with reactivity� ¼ � �j j (the source jerk experiment) results in a measurable drop inthe neutron population from no to n1.
Rod Oscillator
A third experimental procedure may be analyzed in terms of Eqs. (5.47)and (5.48). However, in the rod oscillator experiment the equationsmay not be solved so simply. Laplace transforms or related techniquesmust be used to solve the equations in the presence of a sinusoidalreactivity of the form �ðtÞ ¼ �o sinð!tÞ. Here we simply state theresult: If no is the initial neutron population, then after transientshave died out the neutron population will oscillate as
nðtÞ ¼ no 1þAð!Þ sinð!tÞ þ !�o=�½ �; ð5:64Þ
where Að!Þ is a function of the frequency. If sinð!tÞ is averaged overtime the sinusoidal term vanishes leaving �n ¼ noð1þ !�o=�Þ. Thusplotting �n=no versus frequency determines �o=�, the ratio of reactiv-ity to prompt neutron generation time.
5.6 Prologue to Reactor Dynamics
Thus far our treatment of the time-dependent behavior of chain reac-tions has not accounted for thermal feedback effects. For this reasonsuch treatments are frequently referred to as zero-power kinetics. If theenergy created by fission, however, is large enough to cause the tem-perature of the system to rise, the material densities will then change.Because macroscopic cross sections are proportional to densities theytoo will change. Aside from the material density changes, additional
Reactor Kinetics 133

feedback effects will result from the resonance cross sections, whichbroaden and flatten with increasing temperature as a result of theDoppler broadening discussed in Chapter 4. In thermal reactors thespectrum will also harden as a result of the temperature dependence ofthe Maxwell-Boltzmann distribution. Taken together these feedbackeffects will alter the parameters in the kinetics equations. By far thelargest impact is on the reactivity. Consequently, reactor design mustassure that under all operating conditions the feedback is negative forincreases in temperature.
Negative feedback impacts the curves in Fig 5.2, for example, inthe following way. When the neutron population becomes largeenough for a temperature rise to occur, the curve will flatten ifnegative feedback is present, and then stabilize and possiblydecrease with time. In Fig. 5.6 we have redrawn the positive reac-tivity curve of Fig 5.2 on a logarithmic scale, along with a curve forthe same reactivity insertion but for which the effects of negativetemperature feedback are included. Note that both curves initiallyfollow the same period as indicated by the straight-line behavior onthe logarithmic plot. But as the power becomes larger the curvewith feedback becomes concave downward and stabilizes at a con-stant power. At this point the negative feedback has completelycompensated for the initial reactivity insertion. In Chapter 9 weshall take up reactivity feedback in detail and examine its interac-tion with reactor kinetics to determine the transient behavior ofpower reactors.
0 200 400 600 8000.1
1
10
100
Time, seconds
Without feedback
With feedback
n(t )
/n(0
)
FIGURE 5.6 Effect of negative temperature feedback on neutron populationfollowing a reactivity insertion of þ 0.10�.
134 Fundamentals of Nuclear Reactor Physics

Bibliography
Bell, George I., and Samuel Glasstone, Nuclear Reactor Theory, VanNostrand Reinhold, NY, 1970.
Duderstadt, James J., and Louis J. Hamilton, Nuclear Reactor Analysis,Wiley, NY, 1976.
Henry, Allen F., Nuclear-Reactor Analysis, MIT Press, Cambridge, MA,1975.
Hetrick, David, Dynamics of Nuclear Systems, American Nuclear Society,1993.
Keepin, G. R., Physics of Nuclear Kinetics, Addison-Wesley, Reading, MA,1965.
Knief, Ronald A., Nuclear Energy Technology: Theory and Practice ofCommerical Nuclear Power, McGraw-Hill, 1981.
Lewis, E. E., Nuclear Power Reactor Safety, Wiley, NY, 1977.Ott, Karl O., and Robert J. Neuhold, Introductory Nuclear Reactor
Dynamics, American Nuclear Society, 1985.Schultz, M. A., Control of Nuclear Reactors and Power Plants, McGraw-Hill,
NY, 1961.Stacey, Weston M., Nuclear Reactor Physics, Wiley, NY, 2001.
Problems
5.1. a. What is l1 of 0.0253 eV thermal neutrons in graphite(�a ¼ 0:273 � 10�3 cm�1)?
b. What is l1 of 1 MeV fast neutrons in iron (�a ¼0:738 � 10�3 cm�1)?(Note that a 0.0253 eV neutron has a speed of 2200 m/s.)
5.2. A power reactor is fueled with slightly enriched uranium. At theend of core life 30% of the power comes from the fissioning ofthe built up plutonium-239. Calculate the effective value of � atthe beginning and at the end of core life; determine the percentincrease or decrease.
5.3. At t = 0 there are no neutrons in a reactor. A neutron source isinserted into the reactor at t = 0 but then withdrawn at t = 1 min.Sketch the neutron population for 0 � t � 2 min:
a. For a subcritical reactor.b. For a critical reactor.
5.4. Suppose that a fissile material is discovered for which all of theneutrons are prompt. The neutron population is then governedby Eq. (5.22). Furthermore suppose that a reactor fueled with thismaterial has a prompt neutron lifetime of 0.002 s.
Reactor Kinetics 135

a. If the reactor is initially critical, and there is no sourcepresent, what period should the reactor be put on if it is totriple its power in 10 s?
b. What is the reactivity � needed in part a?
5.5. Show that Eqs. (5.47) and (5.48) result from inserting thedefinitions of � and � into Eqs. (5.40) and (5.41).
5.6. A thermal reactor fueled with uranium operates at 1.0 W. Theoperator is to increase the power to 1.0 kW over a 2 hour span oftime.
a. What reactor period should she put the reactor on?b. How many cents of reactivity must be present to achieve the
period in part a?
5.7. A thermal reactor fueled with uranium operates at 1.0 W. Theoperators put in on a 15-minute period. How long will thereactor take to reach a power of 1.0 MW?
5.8. Show that Eq. (5.53) follows from Eq. (5.51).
5.9. Find the periods for reactors fueled by uranium-235,plutonium-239, and uranium-233 if
a. One cent of reactivity is added to the critical systems.b. One cent of reactivity is withdrawn from the critical
systems.
5.10. The one delayed group approximation results from lumping allsix precursors into one, CðtÞ ¼
P6i¼1 CiðtÞ, and replacing the �i
by the average value defined by Eq. (5.34). Equations (5.47) and(5.48) then reduce to the one delayed group equations:
d
dtnðtÞ ¼ SðtÞ þ ð�� �Þ
�nðtÞ þ �CðtÞ
and
d
dtCðtÞ ¼ �
�nðtÞ � �CðtÞ:
With these equations, consider a critical reactor that is initiallyoperating with a neutron population of nð0Þ and for whichSðtÞ ¼ 0. At t = 0 a step reactivity change � is made. Using theassumptions that
1
��� � �j j � 1 and
�
��� 1
136 Fundamentals of Nuclear Reactor Physics

a. Show that
nðtÞ ¼ nð0Þ �
�� � exp�� �
�t
� �þ �
� � � exp��
� � � t
� �� �:
b. Show that for long times the solution is independent of �when � > � and independent of � when 0 < � < �.
c. Taking � ¼ 0:007, � ¼ 5 � 10�5 s, and � ¼ 0:08 s�1, make agraph of the reactivity in dollars vs the reactor period forreactivities between �2 dollars and þ2 dollars. Indicate theregion or regions on the graph where you expect the resultsfrom part a to be poor.
5.11. Using the kinetics equations with one delayed group fromproblem 5.10,
a. Find the reactor period when � ¼ �, simplifying your answerby assuming ��=� 1.
b. Calculate the reactor period for � ¼ 0:007, � ¼ 5 � 10�5 s,and � ¼ 0:08 s�1.
5.12. By differentiating the kinetics equations with one group ofdelayed neutrons (given in problem 5.10) and then letting �! 0,
a. Show that CðtÞ can be eliminated to obtain
d
dtnðtÞ ¼ �
� � � �þ 1
�
d�
dt
� �nðtÞ;
which is referred to as the zero lifetime or prompt jumpapproximation.
b. For a step change in reactivity of �j j �, find the zerolifetime approximation to the reactor period.
5.13. A critical reactor operates at a power level of 80 W. Dropping acontrol rod into the core causes the flux to undergo a suddendecrease to 60 W. How many dollars is the control rod worth?
5.14. Estimate the period of the reactor from the curve withoutfeedback in Fig. 5.6. Suppose you wanted to put the reactor ona period of one minute. What reactivity would you insert?
5.15. Solve the kinetics equations numerically with one group ofdelayed neutrons, given in problem 5.10, using the data� ¼ 0:007, � ¼ 5 � 10�5 s, and � ¼ 0:08 s�1,
a. For a step insertion of þ0.25 dollars between 0 and 5 s.b. For a step insertion of �0.25 dollars between 0 and 5 s.
Reactor Kinetics 137

Assume that the reactor is initially in the critical state, andplot nðtÞ=nð0Þ for each case.
5.16. Repeat problem 5.15 with six groups of delayed neutrons,employing the data for uranium-235 given in Table 5.1 and aprompt generation time of 50� 10�6 s.
5.17. Consider a subcritical reactor described by the pair of kineticsequations in problem 5.10, and with � ¼ 0:007, � ¼ 5 � 10�5 s,and � ¼ 0:08 s�1. The subcritical system is in steady stateequilibrium with reactivity � ¼ �10 cents and a time-independent source So. Then, at t = 0 the source is removed.Determine nðtÞ for t � 0 and plot your result, normalized to So.
5.18. Solve Eqs. (5.47) and (5.48) using the uranium-235 data fromTable 5.1 and a prompt generation time of 50� 10�6 s for thefollowing three ramp insertions.
a. �ðtÞ ¼ 0:25�t.b. �ðtÞ ¼ 0:5�t.c. �ðtÞ ¼ 1:0�t.
Normalizing your results to nð0Þ ¼ 1, make linear plots and foreach case determine: (1) at what time does the neutron popula-tion reach nðtÞ=nð0Þ ¼ 1000 and (2) what is the value ofnðtÞ=nð0Þ at the point in time when the system reaches promptcritical?
5.19. Suppose that a critical reactor is operating at a steady state levelwith a neutron population of no. You are to add reactivity suchthat the neutron population will increase linearly with time:nðtÞ ¼ nð0Þð1þ #tÞwhere # is a constant. Using the one delayedgroup kinetics equations from problem 5.10,
a. Determine the time-dependent reactivity �ðtÞ that youshould add to the reactor to achieve the linear increase.
b. Sketch �ðtÞ from part a.
138 Fundamentals of Nuclear Reactor Physics

CHAPTER 6
Spatial Diffusionof Neutrons
6.1 Introduction
Chapter 5 dealt with time-dependent behavior of nuclear reactors, andin earlier chapters we examined the importance of the energy spectrumof neutrons in determining the multiplication and other reactorproperties. Thus far, we have not dealt with the spatial distributionsof neutrons, other than the treatment in Chapter 4 of their distributionsbetween fuel, coolant, and/or moderator within lattice cells. We havecharacterized the effects of the global distribution of neutrons simply bya nonleakage probability, which as stated earlier increases toward avalue of one as the reactor core becomes larger. In this chapter and thenext we examine the spatial migration of neutrons, not only to obtainan explicit expression for the nonleakage probability, but also to under-stand the relationships between reactor size, shape, and criticality, andto determine the spatial flux distributions within power reactors.
In treating the spatial distributions of neutrons we will considera monoenergetic or one energy group model. That means that theneutrons’ flux and cross sections have already been averaged overenergy. Likewise, when dealing with reactor lattices we assume thatthe flux and cross sections have been spatially averaged over thelattice cell. Thus we are dealing only with the global variations ofthe neutron distribution, and not the spatial fluctuations with theperiodicity of the lattice cell pitch.
The neutron diffusion equation provides the most straightforwardapproach to determining spatial distributions of neutrons. In this chap-ter we first derive the diffusion equation and its associated boundaryconditions. We then apply diffusion theory to problems in nonmultiply-ing media, limiting our attention in this chapter to problems in highlyidealized one-dimensional geometries—first plane and then sphericalgeometry—for they offer the clearest introduction to the solutiontechniques. We then proceed to examine the behavior in sphericalsystems that contain fissionable material but which are subcritical.
139
Font: TrumpMediaeval Size:11/12.5pt Margins:Top:4pc6 Gutter:7pc4 T.Area:29pc�47pc6 1 Color Lines: 46 Fresh Recto

We conclude the chapter with an approach to criticality by increasingeither the value of k1 or the size of the reactor, obtaining a criticalityequation at the chapter’s end. We thus set the stage for Chapter 7 wherewe take up the important issues related to the spatial distributions offlux and power in the finite cylindrical cores of power reactors.
6.2 The Neutron Diffusion Equation
To derive the neutron diffusion equation, we first set forth the neu-tron balance condition for an incremental volume. We then employFick’s law to arrive at the diffusion equation.
Spatial Neutron Balance
To begin, consider the neutron balance within an infinitesimalvolume element dV ¼ dxdydz centered at the point r
* ¼ ðx; y; zÞ asshown in Fig. 6.1. Under steady state conditions neutron conserva-tion requires that
neutrons leakingout of dxdydz=s
� �þ neutrons absorbed
in dxdydz=s
� �
¼ source neutronsemitted in dxdydz=s
� �þ fission neutrons
produced in dxdydz=s
� �:
ð6:1Þ
The leakage is the sum of the net number of neutrons passing outthrough the six surfaces of the cubical volume. To express the leakage
z
dy
dx
dz
(x, y, z )
x
yo
r→
FIGURE 6.1 Control volume for neutron balance equation.
140 Fundamentals of Nuclear Reactor Physics
Font: TrumpMediaeval Size:11/12.5pt Margins:Top:4pc6 Gutter:7pc4 T.Area:29pc�47pc6 1 Color Lines: 46 Fresh Recto

quantitatively, we define the three components of the neutron current.Let Jxðx;y; zÞ be the net number of neutrons/cm2/s passing though they–z plane in the positive x direction at ðx; y; zÞ. Similarly, let Jyðx; y; zÞand Jzðx; y; zÞ be the net numbers of neutrons/cm2/s passing though thex–z and x–y planes, respectively. For the cubical volume, the netnumber of neutrons passing out of the cube through the front, right,and top faces is then Jxðx þ 1=2dx;y; zÞdydz, Jyðx; y þ 1=2dy; zÞdxdz, andJzðx; y; zþ 1=2dzÞdxdy. Likewise, the net number of neutrons passingout of the back, left, and bottom faces is �Jxðx � 1=2dx; y; zÞdydz,�Jyðx; y � 1=2dy; zÞdxdz, and �Jzðx; y; z� 1=2dzÞdxdy. Thus the netleakage per second from the cube is
neutrons leakingout of dxdydz=s
� �¼ Jxðx þ 1=2dx;y; zÞ � Jxðx � 1=2dx; y; zÞ½ �dydz
þ ½Jyðx;y þ 1=2dy; zÞ � Jyðx; y � 1=2dy; zÞ�dxdz
þ Jzðx; y; zþ 1=2dzÞ � Jzðx;y; z� 1=2dzÞ½ �dxdy:
ð6:2Þ
Since by definition the partial derivative is
limdx!0
Jxðx þ 1=2dx; y; zÞ � Jxðx � 1=2dx;y; zÞ½ �=dx � @
@xJxðx;y; zÞ; ð6:3Þ
and similarly in the y and z directions, we multiply and divide thethree terms on the right of Eq. (6.2) by dx, dy, and dz, respectively,and then take the limits to obtain
neutrons leakingout of dxdydz=s
� �¼ @
@xJxðx;y; zÞ þ
@
@yJyðx; y; zÞ
�
þ @
@zJzðx; y; zÞ
�dxdydz:
ð6:4Þ
The remaining terms are
neutrons absorbedin dxdydz=s
� �¼ �aðx;y; zÞ�ðx;y; zÞdxdydz; ð6:5Þ
source neutronsemitted in dxdydz=s
� �¼ s000ðx;y; zÞdxdydz; ð6:6Þ
and
fission neutronsproduced in dxdydz=s
� �¼ ��fðx;y; zÞ�ðx;y; zÞdxdydz: ð6:7Þ
Spatial Diffusion of Neutrons 141
Font: TrumpMediaeval Size:11/12.5pt Margins:Top:4pc6 Gutter:7pc4 T.Area:29pc�47pc6 1 Color Lines: 46 Fresh Recto

Inserting Eqs. (6.4) through (6.7) into Eq. (6.1) and eliminating dxdydzthen yields
@
@xJxðr
*Þ þ @
@yJyðr
*Þ þ @
@zJzðr
*Þ þ �aðr*Þ�ðr*Þ ¼ s000ðr*Þ þ ��fðr
*Þ�ðr*Þ: ð6:8Þ
For compactness, we may write the current in vector form,
J*
ðr*Þ ¼ iJxðr*Þ þ jJyðr
*Þ þ kJzðr*Þ; ð6:9Þ
and use the definition of the gradient, r*
¼ i @@xþ j @
@yþ k @
@z, to write
Eq. (6.8) as
r*
� J*
ðr*Þ þ �aðr*Þ�ðr*Þ ¼ s000ðr*Þ þ ��fðr
*Þ�ðr*Þ: ð6:10Þ
Diffusion Approximation
Equation (6.10) is a statement of neutron balance. In most of thecircumstances that we will consider, we may reasonably applyFick’s law—or more precisely, Fick’s approximation—to relate thecurrent to the flux:
J*
ðr*Þ ¼ �Dðr*Þr*
�ðr*Þ; ð6:11Þ
where D is referred to as the diffusion coefficient. Inserting Eq. (6.11)into Eq. (6.10) then yields the neutron diffusion equation:
�r*
�Dðr*Þr*
�ðr*Þ þ �aðr*Þ�ðr*Þ ¼ s000ðr*Þ þ ��fðr
*Þ�ðr*Þ: ð6:12Þ
More advanced neutron transport techniques are employed in Appen-dix C to evaluate the diffusion coefficient as
D ¼ 1=3�tr; ð6:13Þ
where the transport cross section is defined as �tr ¼ �t � ���s,where �� is the average scattering angle. For isotropic scatteringin the laboratory system, ��= 0 and thus the transport cross sec-tion reduces to the total cross section, �t. Averaging the diffusioncoefficient for mixtures of materials is accomplished by first usingthe techniques of Chapter 2 or 4 to average �tr and then applyingEq. (6.13).
In what follows, we first solve the diffusion equation for non-multiplying media in simple one-dimensional geometries, and stipu-late the boundary conditions that apply to it under a variety of
142 Fundamentals of Nuclear Reactor Physics
Font: TrumpMediaeval Size:11/12.5pt Margins:Top:4pc6 Gutter:7pc4 T.Area:29pc�47pc6 1 Color Lines: 46 Fresh Recto

circumstances. Before treating multiplying media, we return toexamine the circumstances under which the diffusion approximationis valid and the meaning of the diffusion length, which following itsintroduction makes ubiquitous appearances in the solutions of diffu-sion problems.
6.3 Nonmultiplying Systems—Plane Geometry
We consider first the case of a uniform medium with no fissionablematerial, that is, a nonmultiplying medium. Thus �f ¼ 0, and D and�a are constants, allowing Eq. (6.12) to be reduced to
�r2�ðr*Þ þ 1
L2�ðr*Þ ¼ 1
Ds000ðr*Þ; ð6:14Þ
where r2 � @2
@x2 þ @2
@y2 þ @2
@z2 ; and the diffusion length is defined by
L ¼ffiffiffiffiffiffiffiffiffiffiffiffiD=�a
p; ð6:15Þ
which has units of length.
Source Free Example
To illustrate the significance of the diffusion length we consider a simpleproblem in plane geometry, that is, where the flux varies so slowly in yand z that it can be ignored, allowing us to eliminate the y and z deriva-tives fromr2. We also set the source to zero, simplifying Eq. (6.14) to
d2
dx2�ðxÞ � 1
L2�ðxÞ ¼ 0: ð6:16Þ
We look for a solution of the form
�ðxÞ ¼ C expð�xÞ ð6:17Þ
by substituting this expression into Eq. (6.16). The result is
C �2 � 1�
L2�
expð�xÞ ¼ 0: ð6:18Þ
The left-hand side is equal to zero for all x if C ¼ 0, but that isunacceptable because it would cause the entire solution to vanish.Instead, we take
� ¼ �1=L: ð6:19Þ
Spatial Diffusion of Neutrons 143
Font: TrumpMediaeval Size:11/12.5pt Margins:Top:4pc6 Gutter:7pc4 T.Area:29pc�47pc6 1 Color Lines: 46 Fresh Recto

Thus there are two possible solutions, and the flux takes the form
�ðxÞ ¼ C1 exp x=Lð Þ þC2 exp �x=Lð Þ: ð6:20Þ
To determine the coefficients C1 and C2 we must apply boundaryconditions. Suppose that we want to solve for the problem domainthat is a semi-infinite medium occupying the space 0 � x � 1.Further assume that neutrons are supplied from the left withsufficient intensity to provide a known flux �o at x = 0, that is,�ð0Þ ¼ �o. If no neutrons are entering from the right, then all of theneutrons entering from the left will eventually be absorbed as theydiffuse to the right, requiring that �ð1Þ¼ 0. We thus have the twoneeded boundary conditions. Inserting them into Eq. (6.20), we have
�o ¼ C1 exp 0=Lð Þ þC2 exp �0=Lð Þ; ð6:21Þ
and
0 ¼ C1 exp 1=Lð Þ þC2 exp �1=Lð Þ: ð6:22Þ
Because expð1Þ¼1 and expð�1Þ¼ 0 the second equation is satis-fied only if C1¼ 0. Then because expð0Þ¼ 1 we obtain C2¼�o, andthe solution is
�ðxÞ ¼ �o exp �x=Lð Þ: ð6:23Þ
Uniform Source Example
We next examine the case where there is a uniform sources000ðr*Þ ! s000o . In plane geometry, Eq. (6.14) reduces to
� d2
dx2�ðxÞ þ 1
L2�ðxÞ ¼ 1
Ds000o : ð6:24Þ
Solutions to problems containing source terms are divided into gen-eral and particular solutions:
�ðxÞ ¼ �gðxÞ þ �pðxÞ; ð6:25Þ
where �g, the general solution (sometimes also called the homoge-neous solution), satisfies Eq. (6.24) with the source set to zero. Thusit is identical in form to the solution of Eq. (6.16), given by Eq. (6.20).The particular solution, �p, must satisfy Eq. (6.24) with the sourcepresent. For a uniform source the particular solution is a constant,since its derivative is zero. Thus the particular solution for Eq. (6.25) is
144 Fundamentals of Nuclear Reactor Physics
Font: TrumpMediaeval Size:11/12.5pt Margins:Top:4pc6 Gutter:7pc4 T.Area:29pc�47pc6 1 Color Lines: 46 Fresh Recto

�pðxÞ ¼L2
Ds000o ¼
1
�as000o : ð6:26Þ
Substituting this expression along with Eq. (6.20) into Eq. (6.25)yields a solution of Eq. (6.24):
�ðxÞ ¼ C1 exp x=Lð Þ þC2 exp �x=Lð Þ þ 1
�as0000 : ð6:27Þ
Once again we need two boundary conditions to specify the con-stants C1 and C2. Suppose the uniform source is distributed through-out a slab extending between �a � x � a and that we specify the twoboundary conditions as the flux vanishing at the slab surfaces:�ð�aÞ ¼ 0. The conditions on C1 and C2 then follow from Eq. (6.27):
0 ¼ C1 exp a=Lð Þ þC2 exp �a=Lð Þ þ 1
�as0000 ; ð6:28Þ
and
0 ¼ C1 exp �a=Lð Þ þC2 exp a=Lð Þ þ 1
�as0000 : ð6:29Þ
These equations are easily solved to show that C1 ¼ C2 ¼0�ðea=L þ e�a=lÞ�1s000o =�a. Thus the solution is
�ðxÞ ¼ 1� coshðx=LÞcoshða=LÞ
� �s000o�a; ð6:30Þ
where we have used the hyperbolic cosine defined in Appendix A.The uniform source results in the simplest form of a particular
solution—a constant. Problems involving space-dependent sourcedistributions can present more of a challenge in finding the particularsolution. One such situation is included as problem 6.12.
6.4 Boundary Conditions
The problems introduced above indicate some general proceduresused to solve the diffusion equation, which is a second order differ-ential equation. In one-dimensional problems solutions contain twoarbitrary constants. Two boundary conditions are needed to deter-mine these coefficients. The conditions that we have used thus farare on the flux itself. Often other conditions more accurately repre-sent the physical situation at hand. In deriving such conditions, a
Font: TrumpMediaeval Size:11/12.5pt Margins:Top:4pc6 Gutter:7pc4 T.Area:29pc�47pc6 1 Color Lines: 46 Fresh Recto
Spatial Diffusion of Neutrons 145

particularly useful concept is that of partial currents. Recall that thecurrent JxðxÞ is the net number of neutrons/cm2/s crossing a planeperpendicular to the x axis in the positive x direction. We maydivide it into the partial currents, Jþx ðxÞ and J�x ðxÞ, of the neutronstraveling in the positive and negative x directions, respectively.Thus we have
JxðxÞ ¼ Jþx ðxÞ � J�x ðxÞ: ð6:31Þ
As detailed in Appendix C, neutron transport theory may beemployed to show that in the diffusion approximation
J�x ðxÞ ¼1
4�ðxÞ � 1
2JxðxÞ; ð6:32Þ
or employing Eq. (6.11) to eliminate the current,
J�x ðxÞ ¼1
4�ðxÞ 1
2D
d
dx�ðxÞ: ð6:33Þ
Vacuum Boundaries
Suppose we have a surface across which no neutrons are entering.This would be the case if a vacuum containing no neutron sourcesextended to infinity. We refer to this as a vacuum boundary. If theboundary is on the left, say, at xl, the condition is Jþx ðxlÞ¼ 0. If itis on the right, say, at xr, the condition is J�x ðxrÞ¼ 0. Using thedefinition of the partial current, we may write the condition onthe right as
0 ¼ 1
4�ðxrÞ �
1
2D
d
dx�ðxÞ
xr
; ð6:34Þ
where since the derivative is negative on the right, for clarity we havetaken minus its absolute value. Recalling that for isotropic scatteringD¼ 1=ð3�tÞ and that the mean free path is defined as �¼ 1=�t, wemay rewrite the vacuum boundary condition as
�ðxrÞ�
d
dx�ðxÞ
xr
¼ 2
3�: ð6:35Þ
Figure 6.2 provides a visual interpretation of the condition. If theflux is extrapolated linearly according to Eq. (6.35) it will go to zero ata distance of 2=3� outside the boundary; thus we refer to 2=3� as theextrapolation distance.
146 Fundamentals of Nuclear Reactor Physics
Font: TrumpMediaeval Size:11/12.5pt Margins:Top:4pc6 Gutter:7pc4 T.Area:29pc�47pc6 1 Color Lines: 46 Fresh Recto

Frequently, when vacuum boundaries are encountered, simplyadjusting the dimensions and using a zero flux boundary condition ismore straightforward. Thus for a problem with left and right vacuumboundaries at xl and xr, we would take �ðxl � 2=3�Þ ¼ 0 and�ðxr þ 2=3�Þ ¼ 0, respectively. For brevity, we shall frequently denotesuch an extrapolated boundary simply by adding a tilde to the spatialdimension. Thus �ð~xrÞ ¼ 0 and �ð~xlÞ ¼ 0. In situations where theproblem dimensions are large when measured in �, a common prac-tice consists of ignoring the small correction for the extrapolationdistance and simply taking �ðxrÞ 0 and �ðxlÞ 0.
Reflected Boundaries
If the net current Jx is known at a boundary, it also may be used as acondition. Current conditions appear most frequently as a result of pro-blem symmetry. Suppose, as in the uniform source problem describedabove, the solution is symmetric about x = 0, such that the net number ofneutrons crossing the plane at x = 0 vanishes. Then we may solve theproblem only for x> 0 using the boundary condition on the left as
Jxð0Þ ¼ �Dd
dx�ðxÞ
x¼0
¼ 0; ð6:36Þ
or simply
d
dx�ðxÞ
x¼0
¼ 0:
Surface Sources and Albedos
Partial currents are particularly useful in specifying boundary condi-tions in situations where surfaces are bombarded by neutrons. Toillustrate, consider a source free solution, such as Eq. (6.23). For this
23
λx
xrxr∼
FIGURE 6.2 Neutron flux extrapolation distance at a vacuum boundary.
Spatial Diffusion of Neutrons 147
Font: TrumpMediaeval Size:11/12.5pt Margins:Top:4pc6 Gutter:7pc4 T.Area:29pc�47pc6 1 Color Lines: 46 Fresh Recto

solution to hold, neutrons must be being supplied from the left. Wecan relate the boundary flux �o to a surface source of s00 neutrons/cm2/s by noting that the number of neutrons entering from the leftis just
Jþx ð0Þ ¼ s00: ð6:37Þ
Thus combining Eqs. (6.23) and (6.33) to obtain the partial current,
Jþx ðxÞ ¼1
4þ D
2L
� ��o exp �x=Lð Þ; ð6:38Þ
we can use Eq. (6.37) to eliminate �o and write Eq. (6.38) directly interms of the surface source s00:
�ðxÞ ¼ 1
4þ D
2L
� ��1
s00 expð�x=LÞ: ð6:39Þ
Of the surface source neutrons entering the diffusing medium,some fraction will make scattering collisions and then come backout. The ratio of exiting to entering neutrons is termed the albedo.We express it in terms of the partial currents as
� ¼ J�x ð0ÞJþx ð0Þ
: ð6:40Þ
The albedo for a semi-infinite medium results from insertingEq. (6.33) into this expression and then using Eq. (6.23) to evaluatethe partial currents at x = 0. The result is
� ¼ 1� 2D=Lð Þ= 1þ 2D=Lð Þ: ð6:41Þ
Thus for the semi-infinite medium, �s00 neutrons/cm2/s will bereemitted from the surface, while the remaining neutrons, that is,ð1� �Þs00 neutrons/cm2/s, will be absorbed within the medium.Equation (6.40) is applicable at any surface with J�x ð0Þ interpreted asthe outgoing and Jþx ð0Þ as the incoming partial current.
Interface Conditions
If more than one region is present, say, with different cross sections,the diffusion equation solution will contain two arbitrary constantsfor each region. Thus two conditions are required at each interface.They are that both the flux and the net current must be continuous.Thus for an interface at xo we have
148 Fundamentals of Nuclear Reactor Physics
Font: TrumpMediaeval Size:11/12.5pt Margins:Top:4pc6 Gutter:7pc4 T.Area:29pc�47pc6 1 Color Lines: 46 Fresh Recto

�ðxo�Þ ¼ �ðxoþÞ ð6:42Þ
and
Dðxo�Þd
dx�ðxÞjxo�
¼ DðxoþÞd
dx�ðxÞjxoþ
; ð6:43Þ
where xoþ and xo� indicate evaluation immediately to the right andleft of xo. An exception to Eq. (6.43) occurs if there is a localizedsource present. If an infinitely thin surface source emits s00pl neutrons/cm2/s along the interface, the neutron balance at the interface isJðxo�Þ þ s00pl ¼ JðxoþÞ or more explicitly
�Dðxo�Þd
dx�ðxÞjxo�
þ s00pl ¼ �DðxoþÞd
dx�ðxÞjxoþ
: ð6:44Þ
Boundary Conditions in Other Geometries
The foregoing boundary conditions are applicable in cylindrical andspherical as well as Cartesian geometries: x is simply replaced by thedirection normal to the surface. In spherical or cylindrical geometries,however, boundary conditions at the origin or centerline must be treatedsomewhat differently. For a point source emitting sp neutrons/s at thecenter of a sphere, sp ¼ lim
r!0½4�r2JrðrÞ�, and for a line source emitting s0l
neutrons/cm/s along the centerline of a cylinder, s0l ¼ limr!0½2�rJrðrÞ�. If no
such sources are present then these two conditions are equivalent simplyto requiring that the flux be finite at r = 0. We illustrate the condition atthe origin for spherical geometry in the following section, but defer thetreatment of cylindrical geometry, which requires the introduction ofBessel functions, to the following chapter.
6.5 Nonmultiplying Systems—Spherical Geometry
We consider two spherical geometry problems. In the first a pointsource of neutrons is located in an infinite medium. The second is atwo region problem with a distributed source. Both demonstrateboundary conditions at the origin, and the second also extends tech-niques introduced thus far to neutron diffusion problems to includethe treatment of interface as well as boundary conditions.
We begin by replacing r2 in Eq. (6.14) by its one-dimensionalspherical form found in Appendix A:
�1
r2
d
drr2 d
dr�ðrÞ þ 1
L2�ðrÞ ¼ 1
Ds000ðrÞ: ð6:45Þ
Spatial Diffusion of Neutrons 149
Font: TrumpMediaeval Size:11/12.5pt Margins:Top:4pc6 Gutter:7pc4 T.Area:29pc�47pc6 1 Color Lines: 46 Fresh Recto

Point Source Example
Assume that a source of neutrons of strength sp is concentrated at theorigin of an infinite medium extending from r = 0 to r =1. We applyEq. (6.45) for r > 0 with s000ðrÞ= 0:
1
r2
d
drr2 d
dr�ðrÞ � 1
L2�ðrÞ ¼ 0: ð6:46Þ
If we make the substitution
�ðrÞ ¼ 1
r ðrÞ; ð6:47Þ
however, the equation simplifies to
d2
dr2 ðrÞ � 1
L2 ðrÞ ¼ 0; ð6:48Þ
which has the same form as Eq. (6.16) with x replaced by r. Thus welook for a solution of the form:
ðrÞ ¼ C expð�rÞ; ð6:49Þ
and use the identical procedure as in Eqs. (6.16) through (6.20) to obtain
ðrÞ ¼ C1 exp r=Lð Þ þC2 exp � r=Lð Þ: ð6:50Þ
Thus from Eq. (6.47),
�ðrÞ ¼ C1
rexp r=Lð Þ þC2
rexp � r=Lð Þ: ð6:51Þ
Next we employ the boundary conditions to determine C1 andC2. Infinitely far from the source at r =1 the flux must go to zero:�ð1Þ ¼ 0: Thus C1 = 0, for otherwise we would have �ð1Þ ! 1: Theboundary condition at the origin is a bit more subtle. In the limit asr! 0 the current
JrðrÞ ¼ �Dd
dr�ðrÞ ð6:52Þ
emerging from a small sphere, with surface area ¼ 4�r2, must just beequal to the source strength. Hence
sp ¼ limr!0
4�r2JrðrÞ: ð6:53Þ
Combining Eqs. (6.51) through (6.53), we find the flux distributionfrom a point source to be
150 Fundamentals of Nuclear Reactor Physics
Font: TrumpMediaeval Size:11/12.5pt Margins:Top:4pc6 Gutter:7pc4 T.Area:29pc�47pc6 1 Color Lines: 46 Fresh Recto

�ðrÞ ¼ sp
4�Drexp �r=Lð Þ: ð6:54Þ
Clearly all of the neutrons produced by the point source must beabsorbed in the infinite medium. Taking an incremental volume asdV ¼ 4�r2dr, we may show that
Zall space
�a�ðrÞdV ¼ sp: ð6:55Þ
Two Region Example
The second problem we consider has two regions and a distributedsource. It illustrates the treatment of the boundary condition at theorigin as well as interface conditions. Suppose a sphere of radiusR with material properties D and �a contains a uniform source s000o .The sphere is surrounded by a second source free medium withproperties D
_
and �_
a that extends to r =1. Our objective is to deter-mine the neutron flux.
For this problem, we obtain the following two differential equa-tions from Eq. (6.45):
� 1
r2
d
drr2 d
dr�ðrÞ þ 1
L2�ðrÞ ¼ 1
Ds000o ; 0 � r < R; ð6:56Þ
and
� 1
r2
d
drr2 d
dr�ðrÞ þ 1
L_2�ðrÞ ¼ 0; R < r � 1: ð6:57Þ
Within the sphere we must superimpose general and particular solu-tions for Eq. (6.56):
�ðrÞ ¼ �gðrÞ þ �pðrÞ; 0 � r < R: ð6:58Þ
For a uniform source the particular solution is a constant. Thus
�p ¼L2
Ds000o ¼
s000o�a
: ð6:59Þ
The general solution satisfies Eq. (6.46), and following the sametransformation of variables we obtain Eq. (6.51) for �gðrÞ. Thus insert-ing �g and �p into Eq. (6.58) we have
�ðrÞ ¼ C1
rexp r=Lð Þ þC2
rexp � r=Lð Þ þ s000o
�a; 0 � r < R: ð6:60Þ
Spatial Diffusion of Neutrons 151
Font: TrumpMediaeval Size:11/12.5pt Margins:Top:4pc6 Gutter:7pc4 T.Area:29pc�47pc6 1 Color Lines: 46 Fresh Recto

Equations (6.46) and (6.57) are identical in form. Thus the solution toEq. (6.57) has the same form as Eq. (6.51):
�ðrÞ ¼ C01r
expð r=L_
Þ þC02r
expð� r=L_
Þ; R < r � 1; ð6:61Þ
where L_
¼ffiffiffiffiffiffiffiffiffiffiffiffiD_
=�_
a
q.
The four arbitrary constants in Eqs. (6.60) and (6.61) are determinedfrom the configuration’s four boundary and interface conditions:
#1: 0 < �ð0Þ <1; #3: �ðR�Þ ¼ �ðRþÞ;
#2: �ð1Þ ¼ 0; #4: Dd
dr�ðrÞjR� ¼ D
_ d
dr�ðrÞjRþ :
ð6:62Þ
Applying boundary condition 1 by taking the limit of Eq. (6.60) asr! 0, we see that the flux will remain finite only if C2 ¼ �C1. Thenusing the definition of the hyperbolic sine defined in Appendix A,Eq. (6.60) reduces to
�ðrÞ ¼ 2C1
rsinh r=Lð Þ þ s000o
�a; 0 � r < R: ð6:63Þ
We next apply condition 2 to Eq. (6.61). Since the first term becomesinfinite, but the second vanishes as r!1, the condition is met if C01 ¼ 0:
�ðrÞ ¼ C02r
expð� r=L_
Þ; R < r � 1: ð6:64Þ
Finally we apply interface conditions 3 and 4 to obtain the remainingarbitrary coefficients:
2C1
Rsinh R=Lð Þ þ s000o
�a¼ C02
Rexpð�R=L
_
Þ: ð6:65Þ
and
2DC11
RLcoshðR=LÞ � 1
R2sinh R=Lð Þ
� �¼�D
_
C021
RL_þ 1
R2
!expð�R=L
_
Þ:
ð6:66Þ
Solving this pair of equations for C1 and C02 and inserting the resultsinto Eqs. (6.63) and (6.64) results in the solution:
�ðrÞ ¼ 1�CR
r
sinh r=Lð Þsinh R=Lð Þ
� �s000o�a
; 0 � r < R; ð6:67Þ
152 Fundamentals of Nuclear Reactor Physics
Font: TrumpMediaeval Size:11/12.5pt Margins:Top:4pc6 Gutter:7pc4 T.Area:29pc�47pc6 1 Color Lines: 46 Fresh Recto

and
�ðrÞ ¼ ð1�CÞ s000o
�a
R
rexp �ðr� RÞ=L
_h i
; R < r � 1; ð6:68Þ
where
C ¼ 1þD
D_
ðR=LÞ coth ðR=LÞ � 1
ðR=L_
Þ þ 1
" #�1
: ð6:69Þ
6.6 Diffusion Approximation Validity
The question naturally arises as to the circumstances under which thediffusion equation, Eq. (6.12) provides a reasonable approximation.Figure 6.3 shows polar plots of the directions of neutron travel forthree points in space. In each, the length of the arrows indicates thenumber of neutrons traveling in that direction. The plot of Fig. 6.3aindicates a beam of neutrons all traveling within a very narrow cone ofdirections. This is the situation we stipulated for the uncollided flux inChapter 2 in order to define the cross section. The use of Eq. (6.12) insuch situations would be inappropriate, leading to gross errors in theprediction of the spatial distribution of neutrons.
Diffusion theory is valid for the situations shown in Figs. 6.3band 6.3c. In Fig. 6.3b neutrons travel in all directions. More aretraveling to the right than to the left, but the distribution is nothighly peaked. Use of the diffusion approximation in this situationis appropriate, for it will reasonably represent the flux, whichdecreases as we move from left to right, because the net diffusion ofneutrons is in that direction.
Figure 6.3c represents an isotropic distribution of neutrons, suchas would occur if there were no spatial variation in the neutron fluxat all. In this case the use of the diffusion equation remains valid, but
(a) (b) (c)
FIGURE 6.3 Polar distributions of neutrons. (a) Neutron beam,(b) neutrons diffusing to the right, (c) isotropic neutron distribution.
Spatial Diffusion of Neutrons 153
Font: TrumpMediaeval Size:11/12.5pt Margins:Top:4pc6 Gutter:7pc4 T.Area:29pc�47pc6 1 Color Lines: 46 Fresh Recto

if the spatial variation vanishes, we would have r*
�ðr*Þ ¼ 0, and theleakage term would disappear from Eq. (6.12).
Generally, diffusion theory is valid if the neutron distribution ischanging gradually in space. It tends to lead to significant errors for spatialdistributions of neutrons near boundaries and at interfaces betweenmaterials with sharply different properties. In reactor lattices consistingof fuel, coolant, moderators, and/or other materials, we use diffusiontheory to examine the global distribution of neutrons only after takingappropriate averages over the lattice cells, as discussed in Chapter 4.
Diffusion Length
We can gain a physical interpretation of the diffusion length byexamining the mean square distance that a neutron diffuses betweenbirth and absorption. To do this we assume that the neutron is bornat r = 0 and then calculate the mean square distance weighted by theabsorption rate �a�:
r2 ¼
Zr2�a�ðrÞdVZ�a�ðrÞdV
: ð6:70Þ
Inserting Eq. (6.54) for the flux diffusing from a point source, andnoting that dV ¼ 4�r2dr, we have
r2 ¼
Z 10
r2�asp
4�Drexp �r=Lð Þ4�r2drZ 1
0�
a
sp
4�Drexp �r=Lð Þ4�r2dr
¼
Z 10
r3 expð�r=LÞdrZ 10
r expð�r=LÞdr
: ð6:71Þ
Evaluating the integrals then yields
r2 ¼ 6L2; ð6:72Þ
or correspondingly
L ¼ 1ffiffiffi6p
ffiffiffiffir2
p¼ 0:408
ffiffiffiffir2
p: ð6:73Þ
Thus the diffusion length is proportional to the root mean square(i.e., rms) distance diffused by a neutron between birth and absorp-tion. During its life the neutron undergoes a number of scatteringcollisions, which change its direction of travel. Recall from Chapter 2that � ¼ 1=�, the mean free path, is the average distance betweensuch collisions. These quantities are easily related. Suppose we
154 Fundamentals of Nuclear Reactor Physics
Font: TrumpMediaeval Size:11/12.5pt Margins:Top:4pc6 Gutter:7pc4 T.Area:29pc�47pc6 1 Color Lines: 46 Fresh Recto

assume isotropic scattering. Then in Eq. (6.13) the diffusion coeffi-cient is just D ¼ 1=ð3�tÞ ¼ �=3. Next, we define the ratio of scatter-ing to total cross section as
c ¼ �s=�t: ð6:74Þ
Because �t ¼ �s þ �a, it follows that the absorption cross sectionmay be expressed as �a ¼ ð1� cÞ�t¼ð1� cÞ=�. Finally, substitutingthese expressions for D and �a into the definition of the diffusionlength given by Eq. (6.15) we obtain
L ¼ �� ffiffiffiffiffiffiffiffiffiffiffiffiffiffiffiffiffiffi
3ð1� cÞp
: ð6:75Þ
Thus, for example, a material for which c = 0.99 would yield L 6�.The relationship between mean free path and diffusion length is
shown heuristically in Fig. 6.4. The dashed lines between scatteringcollisions average to a value of �, while the length of the solid lineis L. In general if c is less than about 0.7, the diffusion approximationpredicated on Fick’s approximation, given by Eq. (6.11), loses validity,and more advanced methods of neutron transport must be used.
Uncollided Flux Revisited
Further insight to the range of validity of the diffusion equation maybe gained by comparing the uncollided flux from a point source to thetotal (i.e., uncollidedþ collided) flux attributable to the source. Recallfrom Eq. (2.9) that the uncollided flux from a point source is
�uðrÞ ¼sp
4�r2exp �r=�ð Þ: ð6:76Þ
Comparing this expression to Eq. (6.54) reveals the following. Regard-less of cross section the uncollided flux drops off as 1/r2 while the
Neutronorigin
NeutronabsorptionL
FIGURE 6.4 Diffusion length L between neutron birth and absorption.
Spatial Diffusion of Neutrons 155
Font: TrumpMediaeval Size:11/12.5pt Margins:Top:4pc6 Gutter:7pc4 T.Area:29pc�47pc6 1 Color Lines: 46 Fresh Recto

total flux—uncollided plus collided—drops off only as 1/r. Likewise,the mean free path appears in the exponential of the uncollided fluxwhile the diffusion length—which is larger—appears in the exponen-tial of the total flux. Thus the total flux will decay more slowly withdistance.
A second point for comparison between uncollided and diffusingneutrons is the rms distances to first collision and to absorption,respectively. To obtain the rms distance traveled by uncollided neu-trons we again consider a point source at the origin, but now weemploy the first collision rate, �t�u, instead of the absorption rate:
r2u ¼
Zr2�t�uðrÞdVZ�t�uðrÞdV
: ð6:77Þ
Taking the uncollided flux from Eq. (6.76) and inserting it into defini-tion for r2
u yields
r2u ¼
Z 10
r2�tSp
4�r2exp �r=�ð Þ4�r2drZ 1
0�t
Sp
4�r2exp �r=�ð Þ4�r2dr
¼
Z 10
r2 expð�r=�ÞdrZ 10
expð�r=�Þdr
; ð6:78Þ
or evaluating the integrals:
r2u ¼ 2�2: ð6:79Þ
Or correspondingly, � ¼ ð1= ffiffi2p Þ ffiffiffiffiffir2u
q¼ 0:707
ffiffiffiffiffir2u
q, meaning that the
mean free path is proportional to the rms distance traveled by aneutron before making its first collision. The ratio of the two meansquare distances is
r2
r2u
¼ 3L2
�2¼ 1
1� c: ð6:80Þ
As the distance from the source increases, the importance of theuncollided source rapidly diminishes provided that c, the ratio ofscattering to total cross section, is sufficiently close to one. If it isnot, then on average the neutrons will not make enough scatteringcollisions before absorption for the diffusion equation to be valid.
Examining angular distributions of neutrons further illuminatesthe distinction between uncollided and diffusing neutrons. The
156 Fundamentals of Nuclear Reactor Physics
Font: TrumpMediaeval Size:11/12.5pt Margins:Top:4pc6 Gutter:7pc4 T.Area:29pc�47pc6 1 Color Lines: 46 Fresh Recto

uncollided neutrons at a point some distance r from a point source alltravel in a single direction, radially outward as shown schematicallyin Fig. 6.3a, while the diffusing neutrons will be dispersed in angle,more like Fig. 6.3b. For the diffusion equation to give reasonableaccuracy, only a small fraction of the neutron population at a pointcan remain uncollided. Again, this condition typically exists only insituations where c � �s=�t is greater than about 0.7.
6.7 Multiplying Systems
We are now prepared to consider neutron diffusion in multiplyingsystems: those containing fissionable material. We frame the prob-lems in spherical geometry, so that as we examine subcritical sys-tems as they approach criticality the spatial effects are somewhatmore realistic than in plane geometry. We defer treatment of thefinite cylindrical form that power reactors invariably take to thefollowing chapter; although spherical geometry can be treated usingan ordinary differential equation, a partial differential equation mustbe solved for the finite cylinder.
Subcritical Assemblies
In a multiplying system, ��f > 0 because fissionable material is pres-ent. If we limit our attention to a uniform system, with a uniformsource s000o , then the cross sections are space-independent constants.Dividing Eq. (6.12) by the diffusion coefficient D then yields
�r2�ðr*Þ þ 1
L2�ðr*Þ ¼ 1
Ds000o þ
1
L2k1�ðr
*Þ; ð6:81Þ
where we again employ k1 ¼ ��f
��a and L2 ¼ D=�a. Replacing r2
by its one-dimensional form in spherical geometry reduces the diffu-sion equation to
� 1
r2
d
drr2 d
dr�ðrÞ þ 1
L2ð1� k1Þ�ðrÞ ¼
s000oD: ð6:82Þ
We look for a solution once more that is a superposition of generaland particular solutions,
�ðrÞ ¼ �gðrÞ þ �pðrÞ: ð6:83Þ
For a uniform source we hypothesize a constant for the particularsolution. The derivative term thus vanishes from Eq. (6.82), and weobtain
Spatial Diffusion of Neutrons 157
Font: TrumpMediaeval Size:11/12.5pt Margins:Top:4pc6 Gutter:7pc4 T.Area:29pc�47pc6 1 Color Lines: 46 Fresh Recto

�p ¼s000o
ð1� k1Þ�a: ð6:84Þ
The general solution must satisfy
1
r2
d
drr2 d
dr�gðrÞ �
1
L2ð1� k1Þ�gðrÞ ¼ 0: ð6:85Þ
With the same substitution as in Eq. (6.47),
�gðrÞ ¼1
r ðrÞ; ð6:86Þ
the equation simplifies to
d2
dr2 ðrÞ � 1
L2ð1� k1Þ ðrÞ ¼ 0: ð6:87Þ
The form of the solution depends on whether k1 < 1 or k1 > 1. Wefirst consider k1 < 1, and look for a solution of the form used earlier:
ðrÞ ¼ C expð�rÞ: ð6:88Þ
Because
d2
dr2 ðrÞ ¼ C�2 expð�rÞ; ð6:89Þ
Eq. (6.87) is satisfied if �2 ¼ 1
L2ð1� k1Þ, or equivalently
� ¼ � 1
L
ffiffiffiffiffiffiffiffiffiffiffiffiffiffiffiffi1� k1
p: ð6:90Þ
Thus there are two solutions, each of which may be multiplied by anarbitrary constant:
ðrÞ ¼ C1 expðL�1ffiffiffiffiffiffiffiffiffiffiffiffiffiffiffiffi1� k1
prÞ þC2 expð�L�1
ffiffiffiffiffiffiffiffiffiffiffiffiffiffiffiffi1� k1
prÞ: ð6:91Þ
Inserting this expression into Eq. (6.86), and combining the resultwith Eqs. (6.83) and (6.84), we obtain for the flux
�ðrÞ ¼ C1
rexpðL�1
ffiffiffiffiffiffiffiffiffiffiffiffiffiffiffiffi1� k1
prÞ þC2
rexpð�L�1
ffiffiffiffiffiffiffiffiffiffiffiffiffiffiffiffi1� k1
prÞ þ s000oð1� k1Þ�a
:
ð6:92Þ
158 Fundamentals of Nuclear Reactor Physics
Font: TrumpMediaeval Size:11/12.5pt Margins:Top:4pc6 Gutter:7pc4 T.Area:29pc�47pc6 1 Color Lines: 46 Fresh Recto

We next apply the boundary conditions to determine C1 andC2. We can achieve condition that �ð0Þ must be finite only byrequiring the two exponential terms to cancel exactly when r = 0.Thus we take C2 ¼ �C1. Then with the definition sinhðxÞ ¼12 ex � e�xð Þ, we have
�ðrÞ ¼ 2C1
rsinhðL�1
ffiffiffiffiffiffiffiffiffiffiffiffiffiffiffiffi1� k1
prÞ þ s000oð1� k1Þ�a
: ð6:93Þ
With ~R taken to be the extrapolated radius of the sphere, the otherboundary condition is �ð ~RÞ ¼ 0, and from the above equation,
0 ¼ 2C1
~RsinhðL�1
ffiffiffiffiffiffiffiffiffiffiffiffiffiffiffiffi1� k1
p~RÞ þ s000o
ð1� k1Þ�a: ð6:94Þ
Solving for C1 and inserting the result into Eq. (6.93) yields
�ðrÞ ¼ s000oð1� k1Þ�a
1�~R
r
sinhðL�1ffiffiffiffiffiffiffiffiffiffiffiffiffiffiffiffi1� k1
prÞ
sinhðL�1ffiffiffiffiffiffiffiffiffiffiffiffiffiffiffiffi1� k1
p~RÞ
" #: ð6:95Þ
For k1 < 1, the system must be subcritical, even if there were noneutrons leaking from the sphere. We next consider the system fork1 > 1, where criticality becomes possible. Once again we must havea general and a particular solution as in Eq. (6.83); Eq. (6.84) remainsthe particular solution, and Eqs. (6.85) through (6.87) remain appli-cable to the general solution. However, the general solution takes adifferent form. This is most easily seen by noting that for k1 > 1 thesecond term of Eq. (6.87) is now positive:
d2
dr2 ðrÞ þ 1
L2ðk1 � 1Þ ðrÞ ¼ 0: ð6:96Þ
For this differential equation we hypothesize a solution of the form
ðrÞ ¼ C1 sinðBrÞ þC2 cosðBrÞ: ð6:97Þ
Because
d2
dr2 ðrÞ ¼ �C1B2 sinðBrÞ �C2B2 cosðBrÞ; ð6:98Þ
Eq. (6.96) is satisfied, provided we take
B ¼ L�1ffiffiffiffiffiffiffiffiffiffiffiffiffiffiffiffik1 � 1
p: ð6:99Þ
Spatial Diffusion of Neutrons 159
Font: TrumpMediaeval Size:11/12.5pt Margins:Top:4pc6 Gutter:7pc4 T.Area:29pc�47pc6 1 Color Lines: 46 Fresh Recto

Hence,
ðrÞ ¼ C1 sinðL�1ffiffiffiffiffiffiffiffiffiffiffiffiffiffiffiffik1 � 1
prÞ þC2 cosðL�1
ffiffiffiffiffiffiffiffiffiffiffiffiffiffiffiffik1 � 1
prÞ: ð6:100Þ
Analogous to the k1 < 1 case, we insert this expression into Eq. (6.86)and combine the result with Eqs. (6.83) and (6.84) to obtain the fluxdistribution:
�ðrÞ ¼ C1
rsinðL�1
ffiffiffiffiffiffiffiffiffiffiffiffiffiffiffiffik1 � 1
prÞ þC2
rcosðL�1
ffiffiffiffiffiffiffiffiffiffiffiffiffiffiffiffik1 � 1
prÞ � s000oðk1 � 1Þ�a
:
ð6:101Þ
We determine the constants by applying the same boundaryconditions as in the k1 < 1 case: The condition at the origin is that�ð0Þ must be finite. The first term is finite since lim
r!0r�1 sinðBrÞ ¼ B.
Because cosð0Þ ¼ 1, however, the second term becomes infiniteunless we set C2 ¼ 0. Consequently,
�ðrÞ ¼ C1
rsinðL�1
ffiffiffiffiffiffiffiffiffiffiffiffiffiffiffiffik1 � 1
prÞ � s000oðk1 � 1Þ�a
: ð6:102Þ
We determine C1 by requiring this equation to meet the boundarycondition �ð ~RÞ ¼ 0, yielding
�ðrÞ ¼ s000oðk1 � 1Þ�a
~R
r
sin L�1ffiffiffiffiffiffiffiffiffiffiffiffiffiffiffiffik1 � 1
pr
� sin L�1
ffiffiffiffiffiffiffiffiffiffiffiffiffiffiffiffik1 � 1
p~R
� � 1
24
35: ð6:103Þ
Figure 6.5 shows the spatial distribution of�ðrÞ for increasing valuesof k1, first using Eq. (6.95) for k1 < 1 and then Eq. (6.103) for k1 > 1.
The Critical Reactor
Figure 6.5 indicates that the flux level increases with the value of k1.With increasing k1, the argument of the sine in the denominator ofEq. (6.103) becomes larger, until
L�1ffiffiffiffiffiffiffiffiffiffiffiffiffiffiffiffik1 � 1
p~R ¼ �; ð6:104Þ
at which point the flux level becomes infinite, since sinð�Þ ¼ 0. Atthis point the sphere has become critical. As we saw in the precedingchapter subcritical reactors have time-independent solutions in the
160 Fundamentals of Nuclear Reactor Physics
Font: TrumpMediaeval Size:11/12.5pt Margins:Top:4pc6 Gutter:7pc4 T.Area:29pc�47pc6 1 Color Lines: 46 Fresh Recto

presence of a source, but critical reactors do not. Thus we shouldexpect the solution given by Eq. (6.103) to become singular for acritical system.
Recall that for a finite reactor the criticality condition on themultiplication is just k ¼ PNL k1 ¼ 1, where PNL is the nonleakageprobability. Squaring Eq. (6.104) and rearranging terms, we may write
1 ¼ k1
1þ �L= ~R� 2
: ð6:105Þ
Thus for the critical sphere, the nonleakage probability is
PNL ¼1
1þ �L= ~R� 2
; ð6:106Þ
or, using the notation introduced in Chapter 5, � ¼ �L= ~R� 2
.As expected the nonleakage probability increases with ~R=L,the extrapolated radius of the reactor measured in diffusion lengths.
Just as a subcritical reactor has a time-independent solution ifand only if there is a source present, a critical reactor has a solutiononly if no source is present. For the sphere, this is equivalent tospecifying that the general solution, Eq. (6.85), must be satisfied; itmust also meet the same conditions: finite �ð0Þ and �ð ~RÞ ¼ 0; it mustalso guarantee that �ðrÞ > 0 for 0 � r < ~R. In fact, if we just set s000o ¼ 0in Eq. (6.102), we obtain
�ðrÞ ¼ C1
rsinðL�1
ffiffiffiffiffiffiffiffiffiffiffiffiffiffiffiffik1 � 1
prÞ: ð6:107Þ
0.5 10
20
40
60
10.001 r/R
φ (r )
Incr
easi
ng k
∞
~
FIGURE 6.5 Flux distributions in subcritical spheres.
Spatial Diffusion of Neutrons 161
Font: TrumpMediaeval Size:11/12.5pt Margins:Top:4pc6 Gutter:7pc4 T.Area:29pc�47pc6 1 Color Lines: 46 Fresh Recto

The condition �ð ~RÞ ¼ 0, along with the requirement that �ðrÞ > 0,then yields Eq. (6.104), the criticality condition. Note that the solu-tion is not unique; that is, C1 may take on any nonnegative value. InChapter 7 we will show that C1 is proportional to the power at whichthe reactor operates.
In earlier texts, the term Bm ¼ L�1ffiffiffiffiffiffiffiffiffiffiffiffiffiffiffiffik1 � 1
pthat first appeared
(without the subscript) in Eq. (6.99) is referred to as the materialbuckling; it depends only on material properties. Likewise, for asphere, Bg ¼ �
�~R is referred to as the geometric buckling; it depends
only on the sphere’s size. With this terminology the criticality con-dition of Eq. (6.105) may also be stated as the material and geometricbuckling being equal: Bg ¼ Bm. The term buckling derived from thenotion that the flux had more concave downward or ‘‘buckled’’ cur-vature in a small reactor than in a large one. Thus if a reactor issmaller than the critical size for a given material, Bg > Bm, and thereactor is subcritical. If it is larger than the critical size, Bg < Bm, andthe reactor is supercritical. For reactors of shapes other than spheresthe geometrical buckling takes the form Bg ¼ C=R, where the coeffi-cient C is determined by the shape of the reactor and R is a character-istic dimension. Generally, the multiplication of a uniform reactor ofany shape and size is given by k ¼ k1PNL, with the nonleakage prob-ability written as
PNL ¼1
1þ L2B2; ð6:108Þ
where the subscript is dropped from B, the geometric buckling. Thefollowing chapter includes the derivation of the geometric bucklingfor the cylindrical form of a power reactor core.
Bibliography
Duderstadt, James J., and Louis J. Hamilton, Nuclear Reactor Analysis,Wiley, NY, 1976
Henry, Allen F., Nuclear-Reactor Analysis, MIT Press, Cambridge, MA, 1975.Knief, Ronald A., Nuclear Energy Technology: Theory and Practice of
Commercial Nuclear Power, McGraw-Hill, NY, 1981.Lamarsh, John R., Introduction to Nuclear Reactor Theory, Addison-
Wesley, Reading, MA, 1972.Lewis, E. E., and W. F. Miller Jr., Computational Methods of Neutron
Transport, Wiley, NY, 1984.Meghreblian, R. V., and D. K. Holmes, Reactor Analysis, McGraw-Hill, NY,
1960.
162 Fundamentals of Nuclear Reactor Physics
Font: TrumpMediaeval Size:11/12.5pt Margins:Top:4pc6 Gutter:7pc4 T.Area:29pc�47pc6 1 Color Lines: 46 Fresh Recto

Ott, Karl O., and Winfred A. Bezella, Introductory Nuclear Reactor Statics,2nd ed., American Nuclear Society, 1989.
Stacey, Weston M., Nuclear Reactor Physics, Wiley, NY, 2001.
Problems
6.1. Consider in plane geometry a slab of nonfissionable materialwith properties D and L and a thickness of a. Assumes00 neutrons/cm2/s enter the slab from the left. What fractionof the neutrons will
a. Penetrate the slab?b. Be reflected back from the left-hand surface?c. Be absorbed in the slab?
6.2. Consider an infinite slab of nonfissionable material occupyingthe region �a � x � a. It contains a uniform source s000o and hasproperties D1 and �a1. A second nonfissionable material, withD2 and �a2, contains no source and occupies the remainingregions �1 � x � �a and a � x � 1. Find the flux distributionfor 0 � x � 1.
6.3. Determine the fraction of neutrons that penetrate a 1-m-thickslab of graphite for which D = 0.84 cm and �a = 2.1� 10�4 cm�1.Evaluate the albedo of the slab.
6.4. In plane geometry, thermal neutrons enter a nonmultiplyingslab of infinite thickness from the left. The properties of thecomposite slab are D1 and �a1 for 0 � x � a and D2 and �a2 fora � x � 1.
a. Show that with �i � Di=Li the albedo may be expressed as
� ¼ð1� 2�1Þ þ
�2 ��1
�2 þ�1ð1þ 2�1Þ expð�2a=L1Þ
ð1þ 2�1Þ þ�2 ��1
�2 þ�1ð1� 2�1Þ expð�2a=L1Þ
.
b. Evaluate the albedo for a = 10 cm when material 1 is graphiteand material 2 is water.
c. Repeat part b when materials 1 and 2 are switched.
6.5. Note that if 2D=L > 1, Eq. (6.41) yields a negative albedo!Explain in terms of cross sections why diffusion theory is notvalid under these circumstances.
6.6. Neutrons impinge uniformly over the surface of a sphere madeof graphite that has a diameter of 1.0 m. For the graphiteD = 0.84 cm and �a = 2.1� 10�4 cm�1.
Spatial Diffusion of Neutrons 163
Font: TrumpMediaeval Size:11/12.5pt Margins:Top:4pc6 Gutter:7pc4 T.Area:29pc�47pc6 1 Color Lines: 46 Fresh Recto

a. Determine the albedo of the graphite sphere.b. Determine the fraction of the impinging neutrons that are
absorbed in the sphere.
6.7. Verify Eq. (6.55).
6.8. In the text the spherical geometry condition 0 < �ð0Þ <1 isemployed to reduce Eq. (6.60) to Eq. (6.63). Show that thecondition lim
r!04� r2JrðrÞ ¼ 0 produces the same result.
6.9. The point source of strength sp is located at the center of asphere of a nonmultiplying medium with properties D and �a,and an extrapolated radius ~R, in an infinite vacuum.
a. Find the flux distribution in the sphere.b. Determine the fraction of neutrons that escape from the
sphere without being absorbed if ~R ¼ L.
6.10. A thin spherical shell of radius R emits s00pl neutrons/cm2/sin an infinite nonmultiplying medium with properties Dand �a.
a. Determine the flux �ðrÞ for 0 � r � 1.b. Determine the flux ratio �ð0Þ=�ðRÞ.
6.11.*Show that the ratio of uncollided to total flux from a pointsource in an infinite medium is
�uðrÞ�ðrÞ ¼
ffiffiffiffiffiffiffiffiffiffiffiffiffiffiffiffiffiffiffiffiffiffiffi1=3ð1� cÞ
p 1
ðr=LÞ exp �� r=Lð Þ½ �
where� ¼ 3ð1� cÞ½ ��1=2�1. Then plot the curve for 1=2 < r=L < 3using thermal neutron cross sections for the following:
a. Water.b. Heavy water.c. Graphite.d. A one-to-one volume mixture of natural uranium and
water.
6.12. A semi-infinite multiplying medium having the propertiesD, �a, and k1 < 1 occupies the space 0 � x � 1, while�1 � x < 0 is a vacuum. A source embedded in the mediumemits neutrons at a rate of S000o expð��xÞ neutrons/cm3 s�1.Neglecting the extrapolation distance, show that the distributionof neutrons is
�ðxÞ¼½�2�ð1�k1Þ=L2��1S000o
Dexpð�
ffiffiffiffiffiffiffiffiffiffiffiffiffiffi1�k1
px=LÞ�expð��xÞ
h i,
0�x�1.
164 Fundamentals of Nuclear Reactor Physics
Font: TrumpMediaeval Size:11/12.5pt Margins:Top:4pc6 Gutter:7pc4 T.Area:29pc�47pc6 1 Color Lines: 46 Fresh Recto

6.13. Verify Eqs. (6.67) through (6.69).
6.14. Show that Eqs. (6.95) and (6.103) agree in the limit ofk1 ! 1.
6.15. Suppose that the material in problem 6.9 is fissionable withk1 < 1. Find the flux distribution in the sphere.
6.16. Suppose the material in problem 6.9 is fissionable with k1 > 1:
a. Find the flux distribution in the sphere.b. Show that the criticality condition is the same as Eq. (6.105).
6.17. Equations (6.95) and (6.103) give the flux distributions fora subcritical sphere with a uniform source for k1 < 1 andk1 > 1, respectively. Find the equivalent expression fork1 ¼ 1.
6.18. Using Eqs. (6.95) and (6.103),
a. Find expressions for the flux �ð0Þ at the center of thesubcritical sphere.
b. Using your results from part a make a plot of �ð0Þ for0 � k1 < 1:154 with ~R=L ¼ 8.
c. Using your results from part a make a plot of �ð0Þ for
0 < ~R=L < 8, with k1 ¼ 1:154.d. Compare the two curves and discuss their significance.
(Normalize plots to S000o =�a)
Spatial Diffusion of Neutrons 165
Font: TrumpMediaeval Size:11/12.5pt Margins:Top:4pc6 Gutter:7pc4 T.Area:29pc�47pc6 1 Color Lines: 46 Fresh Recto

CHAPTER 7
Neutron Distributionsin Reactors
7.1 Introduction
Chapter 6 concluded with the approach to criticality of a sphericalsystem, chosen for the mathematical simplicity of its one-dimensionalgeometry. This chapter deals with the spatial distributions of neutronswithin the finite cylindrical volumes that correspond to the cores ofpower reactors. We begin by reformulating the diffusion equation in aneigenvalue form that yields both the multiplication and the flux dis-tribution from a time-independent solution. We then find the critical-ity equation and flux distribution for a bare uniform reactor and relateit to the reactor power. Uniform, remember, means only that thelattice cells are identical, for in our approximate treatment we assumethat the cross sections are averaged over energy—allowing an energy-independent treatment—and over the cross-sectional area of the latticecell. The next section provides a more detailed treatment of theneutron nonleakage probability and the effects that neutron slowingdown and diffusion have on it. Following completion of our treatmentof the bare cylindrical reactor, we examine reactors that include reflec-tor regions to improve the neutron economy. We conclude the chapterwith an examination of the effects control poisons—first of a singlecontrol rod and then of a bank of control rods—on reactor multiplica-tion and flux distribution.
7.2 The Time-Independent Diffusion Equation
With the source set to zero, the steady state diffusion equation, givenby Eq. (6.12), for the flux distribution within a fissionable systembecomes
~r �D~r�þ ��f�� �a� ¼ 0; ð7:1Þ
167

where for brevity we have deleted the (~r ) that denotes spatial depen-dence. This equation has a positive flux solution within a reactoronly if it is exactly critical. Otherwise, the neutron population willvary with time, and the kinetics equations of Chapter 5 are needed todescribe the system’s behavior. Often, however, the problem at handinvolves searching for the critical state by varying the reactor’s ge-ometry (its radius or height, for example) or its material composition(for example, its fuel enrichment or its fuel to moderator ratio). We dosuch searches iteratively by hypothesizing a reactor of a particularsize, shape, and composition and determining how far from criticalthe system is and what the spatial distribution of neutrons within itwill be. This we accomplish without carrying out detailed time-dependent calculations through the following artifice.
Suppose that we could vary the average number of neutrons perfission, �, by a ratio �o=�. Equation (7.1) then becomes
~r �D~r�þ ð�o=�Þ��f�� �a� ¼ 0: ð7:2Þ
Now suppose that �o is the number of neutrons per fission that wewould require to make the reactor configuration exactly critical (i.e.,it would yield a multiplication of k ¼ 1), while � is the number ofneutrons actually produced per fission. Since k is always proportionalto the number of neutrons per fission, we have �o=� ¼ 1=k, and wemay write Eq. (7.2) as
~r �D~r�þ 1
k��f�� �a� ¼ 0: ð7:3Þ
If the number of neutrons per fission, �o, needed to make the reactorexactly critical is larger than the actual value, �, then the reactor issubcritical, and k is less than one. Conversely, the reactor is super-critical if �o is smaller than �, and k is greater than one.
By solving Eq. (7.3) for k, the foregoing technique converts theproblem from trying to find a combination of cross sections anddimensions for which a solution of Eq. (7.1) exists to specifying aset of cross sections and dimensions and determining how far fromcritical the configuration is. Equation (7.3) has the form of an eigen-value problem, where k is the eigenvalue and � is the eigenfunction.In general there will be many—in some cases an infinite number—ofeigenvalues and eigenfunctions that solve Eq. (7.3) and meet theappropriate boundary conditions. We are only interested, however,in the physically meaningful solution for which the flux is positiveeverywhere within the reactor volume. This solution may be shownto correspond to the largest eigenvalue, which is the multiplication;we refer to the corresponding eigenfunction �, which is positiveeverywhere within the reactor, as the fundamental mode solution.
168 Fundamentals of Nuclear Reactor Physics

7.3 Uniform Reactors
We begin by analyzing a reactor that is uniform throughout. Accord-ingly, none of the cross sections vary in space. Thus D is a constant,and using our earlier definitions for k1 ¼ ��f=�a and L2 ¼ D=�a wemay write Eq. (7.3) as
r2�þ k1=k� 1
L2� ¼ 0; ð7:4Þ
or equivalently
�r2�
�¼ k1=k� 1
L2: ð7:5Þ
Since the right side of this equation is independent of the spatialvariables, so must the left be the same; both sides of the equationmust be equal to the same constant for it to be satisfied. Specifyingthat constant as r2�=� ¼ �B2, we obtain for the multiplication
k ¼ k11þ L2B2
: ð7:6Þ
To determine B, referred to as the geometric buckling or simply asthe buckling, we must solve
r2�þ B2� ¼ 0; ð7:7Þ
which is a Helmholtz equation. The solution, moreover, must meetthe condition 0 < � <1within the reactor, and well as satisfying theboundary conditions at its surfaces.
We have already encountered such a problem. Recall that weconcluded Chapter 6 by going from subcritical to critical for anidealized spherical reactor. We obtained an expression, Eq. (6.105),which is identical in form to Eq. (7.6), but with k set equal to one andwith the buckling for the sphere given by B ¼ �=R. And, the nonleak-age probability of Eq. (6.106) takes the form
PNL ¼1
1þ L2B2: ð7:8Þ
Equations (7.6) through (7.8) are valid for uniform reactors of allshapes. In what follows, we analyze a cylindrical reactor of finitelength to determine the multiplication and flux distribution interms of reactor’s dimensions and material properties.
Neutron Distributions in Reactors 169

Finite Cylindrical Core
For a uniform cylindrical reactor with an extrapolated radius ~R andextrapolated height ~H, as shown in Fig. 7.1, Eq. (7.7) is a partialdifferential equation. It may be expressed in terms of the radial andaxial coordinates r and z. With the r–z geometry form of the r2
operator given in Appendix A, we have
1
r
@
@rr
d
dr�þ @2
@z2�þ B2� ¼ 0; ð7:9Þ
subject to the conditions
0 < �ðr; zÞ <1; 0 � r � ~R; � ~H=2 � z � ~H=2: ð7:10Þ
We look for a solution by separating variables, that is, by separ-ating �ðr; zÞ into a product of functions of r and of z:
�ðr; zÞ ¼ ðrÞ�ðzÞ: ð7:11Þ
Inserting this expression into Eq. (7.9) and dividing by �, we obtain
1
r
d
drr
d
dr þ 1
�
d2
dz2�þ B2 ¼ 0: ð7:12Þ
R
O
z
rH
~
~
FIGURE 7.1 Cylindrical reactor core.
170 Fundamentals of Nuclear Reactor Physics

Because the first term depends only on r, and the second only on z, bothterms must be constants for the equation to have a solution. Suppose wetake the constants to be�B2
r and�B2z. The solution then takes the form
B2r þ B2
z ¼ B2; ð7:13Þ
where B2r and B2
z must satisfy the differential equations
1
r
d
drr
d
dr þ B2
r ¼ 0; 0 � r � ~R; ð7:14Þ
and
d2
dz2�þ B2
z� ¼ 0; � ~H=2 � z � ~H=2: ð7:15Þ
Thus we have reduced Eq. (7.9), a partial differential equation, to twoordinary differential equations in r and z, respectively. Substituting
� zð Þ ¼ C1 sinðBzzÞ þC2 cosðBzzÞ; � ~H=2 � z � ~H=2; ð7:16Þ
into Eq. (7.15), we may show that it is a solution, where C1 and C2 arearbitrary constants to be determined from the boundary conditions.The boundary conditions at the ends of the cylinder are �ð� ~H=2Þ ¼ 0.Because the equation and its boundary conditions are symmetric in zabout its mid plane, the solution must be symmetric: �ðzÞ ¼ �ð�zÞ.Thus it follows that C1 ¼ 0, because sinðBzzÞ ¼ � sinð�BzzÞ.Satisfying the axial boundary conditions then translates to therequirement cosð�Bz
~H=2Þ ¼ 0. This condition is met providedBz
~H=2 ¼ �=2; 3�=2; 5�=2; � � � . Only for the �=2 root, however, will �and hence the flux be positive everywhere in the core. We thereforetake
Bz ¼ �= ~H: ð7:17Þ
For the radial direction, the solution of Eq. (7.14) takes the formof the less familiar Bessel functions, which are plotted in Fig. 7.2 anddiscussed further in Appendix B:
ðrÞ ¼ C01J0ðBrrÞ þC02Y0ðBrrÞ; 0 � r � ~R; ð7:18Þ
where C01 and C02 are arbitrary constants. We again have two arbitraryconstants to determine. Noting from Fig. 7.2 that Y0ð0Þ ! �1, we takeC02 ¼ 0; otherwise, the flux would become infinite along the centerlineof the reactor. From the graph of J0ðxÞ, we see that in order for the flux
Neutron Distributions in Reactors 171

to vanish at the extrapolated radius ~R, but remain positive for allsmaller values of r, we must have Br
~R ¼ 2:405, or correspondingly
Br ¼ 2:405= ~R: ð7:19Þ
We next combine the foregoing results to obtain the bucklingand flux distribution for a cylindrical reactor. For the buckling weinsert Eqs. (7.17) and (7.19) into Eq. (7.13):
B2 ¼ ð2:405�
~RÞ2 þ ð��
~HÞ2: ð7:20Þ
The flux distribution results from inserting Eqs. (7.16) and (7.18) intoEq. (7.11), subject to the restrictions C1 ¼ 0 and C02 ¼ 0:
�ðr; zÞ ¼ CJ0ð2:405r= ~RÞ cosð�z= ~HÞ; ð7:21Þ
where C ¼ C01C2.
Reactor Power
One arbitrary constant, C, remains. It is proportional to the powerof the reactor. The amount of recoverable energy per fission variesslightly between fissionable isotopes. A reasonable average is
2
1
0
–1
0 1 2x
3 4
To + ∞ To + ∞
To – ∞
K 0 (x )
Y 0 (x )
I 0 (x )
J 0 (x )
0.894
2.405
FIGURE 7.2 Ordinary and modified Bessel functions of order zero.
172 Fundamentals of Nuclear Reactor Physics

� ¼ 3:1� 10�11 J/fission (i.e., watt-s/fission). Then because �f� is thenumber of fissions/cm3/s the reactor power is just ��f� integratedover the volume of the reactor:
P ¼ �Z
�f�dV; ð7:22Þ
which in cylindrical geometry reduces to
P ¼ �2�
Z ~R
0
Z ~H=2
� ~H=2�f�dzrdr: ð7:23Þ
Inserting Eq. (7.21) then yields
P ¼ ��f2�C
Z ~R
0J0ð2:405r= ~RÞrdr
Z ~H=2
� ~H=2cosð�z= ~HÞdz: ð7:24Þ
We may separate this expression into more convenient radial andaxial contributions by multiplying numerator and denominator bythe volume V ¼ �R2H:
P ¼ ��fVC2~R2
Z ~R
0J0ð2:405r= ~RÞrdr
" #1~H
Z ~H=2
� ~H=2cosð�z= ~HÞdz
" #: ð7:25Þ
Changing variables � ¼ 2:405r= ~R and using the Bessel functionidentities found in Appendix B allows us to eliminate the radialintegral:
2~R2
Z ~R
0J0ð2:405r= ~RÞrdr ¼ 2
2:4052
Z 2:405
0J0ð�Þ�d� ¼
2
2:405J1ð2:405Þ
ð7:26Þ
and, likewise, substituting & ¼ �z=H yields
1~H
Z ~H=2
� ~H=2cosð�z= ~HÞdz ¼ 1
�
Z �=2
��=2cosð&Þd& ¼ 2
�ð7:27Þ
for the axial component. Noting that J1ð2:405Þ ¼ 0:519, we combinethe three preceding equations to obtain
Neutron Distributions in Reactors 173

P ¼ ��fVC2J1ð2:405Þ
2:405
2
�¼ 0:275��fVC; ð7:28Þ
or
C ¼ 3:63P
��fV: ð7:29Þ
Finally, inserting C into Eq. (7.21) expresses the flux distribution interms of the reactor power:
�ðr; zÞ ¼ 3:63P
��fVJ0ð2:405r=RÞ cosð�z=HÞ: ð7:30Þ
7.4 Neutron Leakage
In general, the cross sections and diffusion coefficients that we use inthe diffusion approximation are averaged over the entire energy spec-trum of neutrons as well as over the lattice cell compositions asdiscussed in Chapter 4. The diffusion length measures the distancethat neutrons travel between birth and death. In thermal reactorcalculations, however, the diffusion coefficient and cross sectionsused are often those averaged over only the thermal neutron energyspectrum. Uncorrected, such calculations neglect the distance thatneutrons diffuse while slowing down to thermal energies. In somesystems, particularly those with light water moderators, such neglectleads to significant error. Treating the neutron migration during bothslowing down and thermal diffusion more rigorously requires divid-ing the neutron spectrum into two or more energy groups, and devis-ing a diffusion equation for each. For thermal reactors, however,dividing the flux into just two groups—fast and thermal—is oftenadequate, particularly when considering the lattice physics in termsof the four factor formula developed in Chapter 4. Figure 7.3 illus-trates the same neutron cycle as Fig. 4.5, but with neutron diffusionadded for both fast neutrons, as they slow down through the inter-mediate or resonance regions, as well as for thermal neutrons.
Two Group Approximation
To model a reactor with two group theory, we begin by defining thefast and thermal flux as �1 and �2. To obtain the source of neutronsfor fast diffusion, we note that the number of thermal neutronsabsorbed is �a�2/cm3/s and that of these f�a�2/cm3/s are absorbedin fuel. We next multiply by �T to obtain the number of fast neutronsproduced from thermal fission. However, we also include 1/k to take
174 Fundamentals of Nuclear Reactor Physics

into account our varying of the neutrons per fission as in Eq. (7.3) inorder to obtain a steady state neutron distribution even though thereactor is not exactly critical. Finally, we multiply by ", the fastfission factor, and obtain ð1=kÞ"�Tf�a�2 as the number of fast neu-trons produced/cm3/s. The diffusion equation for fast neutrons is
�~r �D1~r�1 þ �r�1 ¼
1
k"�Tf�a�2: ð7:31Þ
The first term on the left is the fast leakage. It has the same form asEq. (7.1) except
D1 ¼ 1=3�tr1 ð7:32Þ
is the diffusion coefficient for fast neutrons. The second term �r�1
accounts for the neutrons removed from the fast group by slowingdown. In paragraphs that follow we will discuss the calculation ofD1 and the removal cross section �r.
The source of neutrons for thermal diffusion is the same as thoseremoved from the fast group, multiplied by the resonance escapeprobability p to account for those lost to capture in the fuel resonancecapture cross sections: p�r�1/cm3/s; Thus the thermal diffusionequation is
�~r �D2~r�2 þ �a�2 ¼ p�r�1; ð7:33Þ
where the first term accounts for thermal neutron leakage, and thesecond for thermal absorption, where
D2 ¼ 1=3�tr2 ð7:34Þand �a are, respectively, the thermal diffusion coefficient and absorp-tion cross section.
F n → ( )1 →
Tpf ηε
ε
ε
εε pn
→ n → →↓
FastDiffusion
→
I↑
(4) (1 )p n− ←↑
↓← (2)
↓
T↑
ε pfn ← ← (3) ←↓ → →
← → (1 )p f n−ThermalDiffusion
→
Fuel Moderator Leakage
n
FIGURE 7.3 Four factor formula with leakage for a thermal reactorneutron cycle.
Neutron Distributions in Reactors 175

For a uniform region the diffusion coefficients are space indepen-dent and may be pulled outside the divergence operator. Dividing thetwo diffusion equations by �r and �a, respectively, and defining fastand thermal diffusion lengths by
L1 ¼ffiffiffiffiffiffiffiffiffiffiffiffiffiffiD1=�r
pð7:35Þ
and
L2 ¼ffiffiffiffiffiffiffiffiffiffiffiffiffiffiD2=�a
p; ð7:36Þ
we obtain
�L21r2�1 þ �1 ¼
1
k"�Tf
�a
�r�2 ð7:37Þ
and
�L22r2�2 þ �2 ¼ p
�r
�a�1: ð7:38Þ
Next consider a uniform reactor with zero flux boundary condi-tions on all its extrapolated outer surfaces. Similar to the techniqueapplied to the one group model in the preceding section, we may repre-sent the spatial dependence of the flux with Helmholtz equations:
r2�1 þ B2�1 ¼ 0 ð7:39Þ
and
r2�2 þ B2�2 ¼ 0: ð7:40Þ
Using these equations to replace ther2 terms in Eqs. (7.37) and (7.38)we obtain
�1 ¼1
1þ L21B2
1
k"�Tf
�a
�r�2 ð7:41Þ
and
�2 ¼1
1þ L22B2
p�r
�a�1: ð7:42Þ
176 Fundamentals of Nuclear Reactor Physics

Finally, combining equations we have
k ¼ 1
1þ L21B2
1
1þ L22B2
k1; ð7:43Þ
where the infinite medium multiplication is given by the four factorformula: k1 ¼ p"f�T . Note that we may now write—as in Eq. (3.2)—k ¼ k1PNL, provided we replace the nonleakage probability given byEq. (7.8) with
PNL ¼1
1þ L21B2
1
1þ L22B2
: ð7:44Þ
The definition of the thermal diffusion length is straightforward,with both the transport and absorption cross sections appearing inEqs. (7.34) and (7.36) averaged over the thermal neutron spectrum.However, the diffusion length for fast neutrons requires more carefulscrutiny. The Fermi age is the most frequently employed approxima-tion for L2
1. It is defined as
¼Z E1
E2
DðEÞ��sðEÞE
dE; ð7:45Þ
where the integral extends from fission energy neutrons down tothermal neutrons, typically from E1= 2.0 MeV to E2 = 0.0253 eV.Note that the slowing down power, ��s, introduced in Chapter 2,appears in the denominator. Thus taking
L21 ¼ ; ð7:46Þ
we see that a strong moderator results in a small diffusion length forfast neutrons. We may gain some further insight with the followingsimplified model. Over the energy range included in Eq. (7.45) weapproximate the diffusion coefficient and scattering cross section asenergy independent. Equation (7.46) thus reduces to
L21 �
D1
��slnðE1=E2Þ: ð7:47Þ
Combining this result with Eq. (7.35) allows us to write the removalcross section as �r ¼ ��s= lnðE1=E2Þ. Next, recall from Eq. (2.59) thatthe estimated number of elastic scattering collisions required to slowa neutron down from E1 to E2 is n � ð1=�Þ lnðE1=E2Þ. Hence wemay approximate the removal cross section as �r � �s=n. Because
Neutron Distributions in Reactors 177

L1 �ffiffiffiffiffiffiffiffiffiffiffiffiffiffiffiffiffinD1=�s
p, the smaller the number of collisions required to slow
the fission neutrons to thermal energies, the shorter the distance thatfast neutrons will diffuse before being slowed to thermal energies.
Migration Length
Retaining the one group theory developed in earlier sections forthermal as well as fast reactors simplifies further analysis consider-ably. For large reactors, we can accomplish this without a substantialloss of accuracy simply by replacing the diffusion length L by themigration length M in the one group equations. To define the migra-tion length we multiply the nonleakage contributions from the twogroups, found in Eq. (7.44), together and obtain
PNL ¼1
1þ ðL21 þ L2
2ÞB2 þ L21L2
2B4: ð7:48Þ
Since B2 is small for large reactors, a reasonable approximation is todrop the B4 term from the denominator. We may then write
PNL ¼1
1þM2B2; ð7:49Þ
where the migration area is defined as
M2 ¼ L21 þ L2
2; ð7:50Þ
and correspondingly the migration length is
M ¼ffiffiffiffiffiffiffiffiffiffiffiffiffiffiffiffiL2
1 þ L22
q: ð7:51Þ
Table 7.1 lists the values of L1 (=ffiffiffip
), L2, and M for the threemost common moderators and also representative values for powerreactors using each of them. The table indicates that the largestcorrection to the thermal diffusion length is for water-moderatedsystems. This comes about primarily because hydrogen’s large ther-mal absorption cross section causes L2 to be quite small compared toreactors utilizing other moderators. To lesser extent, the hydrogen’sdecreased scattering cross section over the energy range where fissionneutrons are born, pictured in Fig. 2.3a, increases the value of L1since �s appears in the denominator of Eq. (7.45). For fast reactorsthe diffusion and migration length are considered one and the same.To complete Table 7.1, a representative value for a sodium-cooledfast reactor (SFR) is M = 19.2 cm and for a gas-cooled fast reactor(GCFR), M = 25.5 cm.
178 Fundamentals of Nuclear Reactor Physics

Leakage and Design
To examine the relationship between neutron leakage and power reac-tor design, we begin by combining Eq. (7.49) with k ¼ PNLk1 to obtain
k ¼ 1
1þM2B2k1: ð7:52Þ
Suppose we make this expression more explicit by assuming that thereactor is a cylinder with a height to diameter ratio of one. Then with~H ¼ 2 ~R the buckling given by Eq. (7.20) becomes B2 ¼ 33:0= ~H2, andwe may write
k ¼ 1
1þ 33:0ðM= ~HÞ2k1: ð7:53Þ
Thus the primary determinant of neutron leakage is ~H=M, the char-acteristic dimension of the reactor, measured in migration lengths.
Very roughly speaking the reactor design process may be char-acterized as follows. Ordinarily, the power P that the reactor must becapable of producing has been set before the design commences. Thedesigners first fix the structure of the core lattice, selecting the fuel,moderator, coolant, and other materials, their volume ratios, andtheir geometrical configuration (i.e., fuel radius, lattice pitch, etc.).
TABLE 7.1Representative Diffusion Properties for Moderators and Thermal Reactors
Type Description
L1 ¼ffiffiffip
(cm)Fast DiffusionLength
L2 (cm)ThermalDiffusionLength
M (cm)MigrationLength
H2O Light Water 5.10 2.85 5.84PWR Pressurized-H2O
Reactor7.36 1.96 7.62
BWR Boiling-H2Oreactor
7.16 1.97 7.43
D2O Heavy water 11.5 173 174PHWR CANDU-D2O
reactor11.6 15.6 19.4
C Graphite 19.5 59.0 62.0HTGR Graphite-
moderated He-cooled reactor
17.1 10.6 20.2
Source: Data courtesy of W. S. Yang, Argonne National Laboratory.
Neutron Distributions in Reactors 179

In doing so they attempt to select lattice parameters such that (a) for agiven fuel enrichment the value of k1 is near optimum and (b) thepower per unit volume (i.e., P000, the power density) that can betransported from fuel to coolant outlet is maximized.
Because the core materials and lattice parameters largely deter-mine the value of the migration length—which is, however, onlyvery weakly dependent on the fuel enrichment—at this point thevalue of M is pretty much fixed. The core lattice design takentogether with maximum to average flux ratio determines �P000, theachievable core averaged power density. Then with P and �P000 deter-mined, the relationship P ¼ V �P000 determines the core volume. For acylindrical reactor with a height to diameter ratio of one, the volume isV ¼ � ~H3=4 and consequently ~H ¼
ffiffiffiffiffiffiffiffiffiffiffiffi4V=�3
p¼
ffiffiffiffiffiffiffiffiffiffiffiffiffiffiffiffiffi4P=� �P0003
p. Thus the core
lattice design determines M, and the achievable �P000, whereas a reactor’score volume increases linearly with the required output P of thereactor at full power. Equation (7.53) indicates that as the volumeand therefore ~H=M increases, the nonleakage probability becomescloser to one; that is, the leakage probability decreases. With a reac-tor’s size and neutron nonleakage probability determined, the fuelenrichment—which has very little effect on the migration length—isadjusted to obtain the desired value of k1.
Chapter 8 details the thermal and hydraulic properties of reactorcores that determine the power densities achievable in reactor latticesas well as the coupling between neutronic and thermal-hydraulicdesign. In the remainder of this chapter we examine first reactorreflectors and their effects on multiplication and flux distributionand then the neutron poisons used to control reactivity and theirinteractions with the spatial flux distributions.
7.5 Reflected Reactors
Reflectors derive their name from the fact that some fraction of theneutrons that escape the core will make a sufficient number ofscattering collisions in the diffusing reflector material to turn themaround such that they reenter the core—that is, they are reflectedback into to it. A reflector thus reduces the fraction of neutronsleaking from the reactor. Figure 7.4 shows schematic diagrams ofcores with axial and radial reflectors. Reflectors have their largestimpacts on smaller cores, where the leakage probability is signifi-cant. As we shall illustrate, a reflector’s importance diminishes asthe size of a reactor—measured by ~H=M—becomes larger.
Equation (7.9) for the neutron distribution within a uniformcore remains valid for reflected reactors. If both axial and radialreflectors are employed, however, the separation of variables techni-que applied in Section 7.3 is no longer applicable, and more advanced
180 Fundamentals of Nuclear Reactor Physics

mathematical methods are required. If only an axial or a radialreflector—but not both—is present, the solution again results frominserting Eqs. (7.16) and (7.18) into Eq. (7.11). However the boundaryconditions are different, causing the height H of the critical core todecrease in the case of an axial reflector, and the core radius R todecrease in the case of a radial reflector. Conversely, if a reflector isadded and the core dimensions are not reduced, the multiplicationwill increase, and this must be compensated by decreasing k1, forexample, by reducing the fuel enrichment or adding a neutron absor-ber to the core. We treat only the axial reflector here; the effectswould be analogous for a radial reflector.
Axial Reflector Example
Because no fissionable material is present in a reflector, Eq. (7.3)reduces to
r2�� 1
M_ 2
� ¼ 0; ð7:54Þ
where we have replaced the diffusion length with M_
, the migrationlength of the reflector material. In cylindrical geometry the r2 opera-tor in Eq. (7.54) takes the same form as in Eq. (7.9). Hence
1
r
d
drr
d
dr�þ d2
dz2�� 1
M_ 2
� ¼ 0: ð7:55Þ
We again separate variables
�ðr; zÞ ¼ ðrÞðzÞ ð7:56Þ
(a) (b)
FIGURE 7.4 Reflected reactor cores. (a) Axial reflector, (b) radial reflector.
Neutron Distributions in Reactors 181

and divide the result by to yield
1
r
d
drr
d
dr þ 1
d2
dz2 � 1
M_ 2¼ 0: ð7:57Þ
The radial flux distribution must satisfy Eq. (7.18), with C02 ¼ 0, andEq. (7.19) once again determines Br since must meet the zero fluxboundary condition at r ¼ ~R in the reflector as well as the core. UsingEq. (7.14) to eliminate , and defining
�2 ¼ B2r þ
1
M_ 2
ð7:58Þ
reduces Eq. (7.57) to
d2
dz2 � �2 ¼ 0; ð7:59Þ
which has a solution of the form
zð Þ ¼ C001 expð�zÞ þC002 expð��zÞ: ð7:60Þ
Alternately, using the definitions of sinh and cosh given inAppendix A, we may replace this expression with
zð Þ ¼ C0001 sinhð�zÞ þC0002 coshð�zÞ: ð7:61Þ
We next add a reflector of height a to the top and bottom ofthe core. Adding the reflector reduces the height of the criticalreactor from ~H to a yet to be determined value of H0; thus theboundary condition at the top of the reflector is H0=2þ að Þ ¼ 0.This boundary condition removes one of the arbitrary coefficientsfrom Eq. (7.61). After some algebra, the result may be shown to be
zð Þ ¼ C0 sinh �ðH0=2þ a� zÞ½ �: ð7:62Þ
The solution in the core once again takes the form of Eq. (7.16) withC1 ¼ 0, because the solution still must be symmetric about the coremidplane. However, the axial buckling, which we now denote as B0z, isyet to be determined since we no longer employ �ð� ~H=2Þ ¼ 0, the axialboundary condition for a bare reactor. Thus in the core we have
� zð Þ ¼ C2 cosðB0zzÞ ð7:63Þ
182 Fundamentals of Nuclear Reactor Physics

We are now prepared to apply the interface conditions specifiedby Eqs. (6.42) and (6.43) at the core–reflector interface: continuity offlux,
� H0=2ð Þ ¼ H0=2ð Þ; ð7:64Þ
and of current
Dd
dz� zð Þ
����H0=2
¼ D_ d
dz zð Þ
����H0=2
; ð7:65Þ
where D_
is the reflector diffusion coefficient. Inserting Eqs. (7.62),and (7.63) into Eqs. (7.64) and (7.65) we obtain, respectively,
C2 cosðB0zH0=2Þ ¼ C0 sinhð�aÞ ð7:66Þ
and
B0zDC2 sinðB0zH0=2Þ ¼ �D_
C0 coshð�aÞ: ð7:67Þ
Taking the ratio of these equations then yields
B0zD tanðB0zH0=2Þ ¼ �D_
cothð�aÞ: ð7:68Þ
For thick reflectors (i.e., ones which are several diffusionlengths thick) the fraction of neutrons that escapes from the outerreflector surface becomes negligible. We may then approximate thereflector as infinite, taking a!1. Because cothð1Þ ¼ 1, Eq. (7.68)reduces to
B0z tanðB0zH0=2Þ ¼ �D_
=D; ð7:69Þ
or, solving for H0,
H0 ¼ 2
B0zarctan �
D_
B0zD
!: ð7:70Þ
Note that once the radial dimension of the reactor andthe reflector material properties have been specified, �, given byEq. (7.58), and D
_
are specified. For simplicity we assume that D isfixed. Then of the two remaining quantities, B0z and H0, we may fixone and determine the other.
Neutron Distributions in Reactors 183

Reflector Savings and Flux Flattening
We proceed by applying the foregoing formulas to two situations. Inthe first we specify B0z ! Bz ¼ �= ~H. This is equivalent to stating thatthe core composition is the same as it would be for a bare core oflength ~H. Replacing the buckling in Eq. (7.70) then gives
H0 ¼ 2 ~H
�arctan �
~HD_
�D
!; ð7:71Þ
which may be shown to be less than ~H. The reduction in the half coreheight of the critical reactor is defined as the axial reflector savings:�z ¼ 1=2ð ~H �H0Þ. For a thick reflector, it is approximately �z �M
_
D=D_
.Figure 7.5 provides a comparison of the flux distributions for a bareand a reflected reactor in which the core composition is held constantand the axial dimension reduced to maintain criticality. The treat-ment of the radial reflector is analogous, with the complication thatBessel functions are involved. Applying the thick reflector approxi-mation to the radial reflector savings defined by �r ¼ ~R� R0, wewould obtain �r �M
_
D=D_
, again for a thick reflector.The second situation arises from specifying that the core height
remain constant by taking H0= ~H. Solving Eq. (7.70) then yields avalue B0z < �= ~H. Consequently, replacing Bz with the smaller valueB0z in Eq. (7.13) reduces the overall buckling in Eq. (7.6). Since thedenominator decreases with the addition of the reflector, the value ofk1must also be decreased—most likely by reducing the fuel enrich-ment—in order for the multiplication to remain unchanged. Figure 7.6compares the normalized flux distributions for bare and reflected
~H
H ′
Neu
tron
flux
FIGURE 7.5 Axial flux distributions for bare (—) and reflected (– –) reactorswith the same core composition.
184 Fundamentals of Nuclear Reactor Physics

reactors in which the height is held constant and the compositionchanged to maintain criticality.
To recapitulate, adding a reflector to a reactor allows either thevolume of the reactor or the value of k1 to be reduced, or somecombination of the two. Figure 7.6 also illustrates a third effect: Add-ing a reflector flattens the flux distribution, thus lowering the ratio ofpeak to average flux. These effects, however, become less significant asthe size of the reactor—measured in migration lengths—increases.Clearly, the reflector savings amounts to a smaller fraction of thecore dimension as its size becomes larger. Likewise, if the core dimen-sions are held constant, adding a reflector has a smaller effect on themultiplication of a large reactor than on a small one. Table 7.2 com-pares the maximum and minimum flux for two reflected reactors withheight to migration length ratios of ~H=M ¼ 10 and ~H=M ¼ 50 to a barereactor, with each of the three average fluxes normalized to one. Thenumbers clearly indicate the reflector’s diminishing effect on fluxflattening as the size of the reactor increases.
–0.5 –0.25 0 0.25 0.50
0.5
1
1.5
2
H/M = 10H/M = 50bare core
Axial distance z/H
Neu
tron
flux
~~
FIGURE 7.6 Comparison of bare and axial reflected reactor flux distributionswith the same core height.
TABLE 7.2Flux Characteristics for axial Reflected and Bare Reactors
Reactor Maximum � Minimum � Average �
Reflected, ~H=M ¼ 10 1.373 0.323 1.00Reflected, ~H=M ¼ 50 1.515 0.091 1.00Bare 1.571 0.000 1.00
Neutron Distributions in Reactors 185

7.6 Control Poisons
Control poisons are neutron absorbers that are deliberately includedin a reactor core. They may take the form of control rods, of solublepoisons dissolved in liquid coolants, or of so-called burnable poisonspermanently embedded in the fuel or other core constituents.Poisons serve a number of purposes. Control rods are inserted orwithdrawn to control the value of k as needed for startup, shutdown,and changes in power level. They may also be used to keep the reactorcritical at a constant power by compensating for fuel depletion, fis-sion product buildup, temperature changes, or other phenomena thataffect the multiplication. Control poisons affect both the multiplica-tion and the flux distribution of a core; thus we must consider both.
We begin our analysis of control poisons with Eq. (7.3), assumingfor simplicity that we have a uniform unreflected reactor to which weadd a control poison. We further assume that the poison has no effecton the fission cross section, and that its small effects on the diffusioncoefficient can be ignored. Its primary effect will be an increase in theabsorption cross section. We designate this increase by letting�a!�aþ��a. Here, the additional absorption, ��a, may be uniformacross the core, as in the case of the boron absorber that is added tothe coolant of pressurized water reactors, or it may be localized as inthe form of one or more control rods. Burnable poisons typically aredistributed throughout the core but in an optimized nonuniformmanner that is beyond the scope of the following analysis.
Reactivity Worth
Before examining specific control rod configurations we derive ageneral expression for the reactivity decrease resulting from the addi-tion of a neutron absorber. Such a decrease frequently is referred to asthe worth of the absorber. We designate k and � as the multiplicationand flux distribution before the neutron poison is inserted and k0 and�0 as the corresponding values following insertion. Thus the additionof the absorber causes Eq. (7.3) to be replaced by
Dr2�0 þ 1
k0��f�
0 � ð�a þ ��aÞ�0 ¼ 0: ð7:72Þ
We multiply by � and integrate over the reactor volume, V:
D
Z�r2�0dV þ 1
k0
Z���f�
0dV �Z�ð�a þ ��aÞ�0dV ¼ 0: ð7:73Þ
186 Fundamentals of Nuclear Reactor Physics

Likewise, we multiply Eq. (7.3) by �0 and perform the same volu-metric integration to obtain
D
Z�0 r2�dV þ 1
k
Z�0��f�dV �
Z�0�a�dV ¼ 0: ð7:74Þ
Subtracting Eq. (7.74) from Eq. (7.73) then yields
D
Zð�r2�0 � �0 r2�ÞdV þ 1
k0� 1
k
� �Z���f�
0dV �Z���a�
0dV ¼ 0:
ð7:75ÞNext we demonstrate that the first integral on the left vanishes.
Noting that
~r � ð�~r�0Þ ¼ �r2�0 þ ð~r�Þ � ð~r�0Þ ð7:76Þ
and
~r � ð�0~r�Þ ¼ �0 r2�þ ð~r�0Þ � ð~r�Þ; ð7:77Þ
we substitute these identities into the first integral of Eq. (7.75) andthen use the divergence theorem to convert the volume integral to anintegral over the reactor’s outer surface area A:
Zð�r2�0 � �0r2�ÞdV ¼
Z~r�ð�~r�0 � �0~r�ÞdV
¼Z
n_�ð�~r�0 � �0~r�ÞdA ¼ 0:
ð7:78Þ
The surface integral vanishes since both the flux before and after thechange in absorption, that is � and �0, must vanish on the extrapo-lated surface A.
With its first term eliminated, Eq. (7.75) reduces to
1
k0� 1
k
� �Z���f�
0dV ¼Z���a�
0dV: ð7:79Þ
Suppose the reactor is initially critical, then k = 1 and the reactivityfollowing control insertion will be ¼ ðk0 � 1Þ=k0, reducing Eq. (7.79) to
¼ �Z���a�
0dV
�Z���f�
0dV: ð7:80Þ
We have made no approximations in obtaining this equation.Moreover, if the added absorption is uniform over the core, the cross
Neutron Distributions in Reactors 187

sections may be pulled outside the integrals, yielding for thereactivity,
¼ ���a
���f ¼ �
1
k1��a=�a: ð7:81Þ
If the control material is localized within some volume of thereactor, the distribution of the perturbed flux �0 must be treatedexplicitly. Provided the perturbation to the flux is small, however,we may write �0 ¼ �þ �� and ignore the size of �� relative to �. Theresult is called the first-order perturbation approximation:
¼ �Z��a�
2dV
�Z��f�
2dV: ð7:82Þ
Partially Inserted Control Rod
Equation (7.82) serves as a basis for estimating the reactivity worth ofa partially inserted control rod, provided the reactivity associatedwith it is not large enough to significantly distort the flux distribu-tion. Consider a uniform cylindrical reactor and begin by rewritingthe numerator of Eq. (7.82) explicitly in cylindrical coordinates:
¼ �Z H=2
�H=2
Z 2�
0
Z R
0��a�
2rdrd!dz
,Z��f�
2dV: ð7:83Þ
We evaluate the numerator only over that volume occupied by thecontrol rod. Let ��a ¼ �ac in that volume, and ��a ¼ 0 elsewhere.Assume that the rod is located at a distance r from the center of thecore and is inserted into the core a distance x from its top as indicatedin Fig. 7.7. We continue to assume that the flux is a function only of rand z, and not of the azimuthal angle !. If the cross-sectional area ofthe rod, say, ac, is small we can ignore the r variation of the flux overits diameter and approximate the above expression as
r;x ¼ �ac�ac
Z H=2
H=2�x
�2ðr; zÞdz
,Z��f�
2ðr; zÞdV: ð7:84Þ
For the uniform core with the flux described by Eq. (7.21), we obtain
r;x ¼ �ac�acC2J2
0ð2:405r= ~RÞR��f�2ðr; zÞdV
Z ~H=2
~H=2�x
cos2ð�z= ~HÞdz: ð7:85Þ
188 Fundamentals of Nuclear Reactor Physics

This expression simplifies when normalized to a fully inserted con-trol rod (x = ~H) at the same radial location. Dividing r;x by r;H weobtain
r;x ¼
R ~H=2~H=2�x
cos2ð�z= ~HÞdzR ~H=2
� ~H=2cos2ð�z= ~HÞdz
r;H ¼x~H� 1
2�sinð2�x= ~HÞ
� r;H: ð7:86Þ
Figure 7.8 shows the control rod worth, that is, the negativereactivity created by the rod, normalized to the fully inserted rod.Note that the worth changes most rapidly when the tip is near themidplane of the core, where the flux is largest. Control rod worth also
H
R
O
r
x
z
~
~
FIGURE 7.7 Control rod inserted to a depth x at a distance r from a corecenterline.
0 0.25 0.5 0.75 10
0.25
0.5
0.75
1
Control rod insertion depth x/H
Rea
ctiv
ity r
ho(x
)/rh
o(H
)
~
~
FIGURE 7.8 Normalized control rod worth vs insertion depth.
Neutron Distributions in Reactors 189

varies with the radial position of the core. For example, if we comparea rod situated at a radius r to one located along the core’s centerline,because J0ð0Þ ¼ 1, we obtain
r;x ¼ J20ð2:405r= ~RÞ 0;x: ð7:87Þ
Control Rod Bank Insertion
Normally, control rods are grouped into banks, which may be insertedor withdrawn in unison. As such, rod banks have large enough effectson reactivity and on the flux distribution that the perturbation tech-nique described above is no longer applicable. To model the reactivityworth of a bank of control rods, we again consider a uniform cylin-drical reactor, and specify a height to diameter ratio of one. To simplifythe derivation we take the origin of our r–z coordinates at the base ofthe reactor, as indicated in Fig. 7.9, and assume that the bank isinserted a distance x from the top of the reactor as indicated. Ourstarting point is therefore Eq. (7.4), but k1 and M are no longer con-stants; they are functions of z, taking different values in the rodded andunrodded volumes of the core. Since the core is uniform in the radialdirection, however, we may again employ separation of variables as inEq. (7.11). Inserting these separated variables into Eq. (7.5) yields
1
r
d
drr
d
dr þ 1
�
d2
dz2�þ k1=k� 1
M2¼ 0; ð7:88Þ
where we have replaced the diffusion with the migration length. Thefirst term on the left must be a constant, since the remaining two
H
R
rO
x
z
~
~
FIGURE 7.9 Cylindrical reactor with a control rod bank inserted to depth x.
190 Fundamentals of Nuclear Reactor Physics

terms vary only in z. We set it equal to �B2r given by Eq. (7.19), thus
satisfying Eq. (7.14) and meeting the boundary condition that�ð ~R; zÞ ¼ 0. Thus Eq. (7.88) reduces to
d2
dz2�þ k1=k� 1
M2� B2
r
� �� ¼ 0: ð7:89Þ
To account for the absorption in the control rod bank we subtract�k1 from the infinite medium multiplication in the axial region ofthe core occupied by the rod bank. Hence for that region,
k1 ! k1 � �k1 ¼ k1ð1� bÞ; ð7:90Þ
where b ¼ �k1=k1 is the reactivity worth of the bank when insertedthe entire length of the core. For simplicity we assume that thepresence of the control rods has no appreciable effect on the migra-tion length. Equation (7.89) takes two forms for unrodded and roddedvolumes (u and r, respectively). With the rod bank inserted to a depthx from the top of the core:
d2
dz2�u þ �2�u ¼ 0; 0 � z � ~H � x; ð7:91Þ
and
d2
dz2�r þ ð�2 � �2Þ�r ¼ 0; ~H � x � z � ~H; ð7:92Þ
where
�2 ¼ 1
M2
k1k� 1
� �� B2
r ð7:93Þ
and
�2 ¼ 1
M2
k1k b: ð7:94Þ
The solutions must meet the boundary conditions �uð0Þ ¼ 0 and�rð ~HÞ ¼ 0 as well as the interface conditions
�uð ~H � xÞ ¼ �rð ~H � xÞ ð7:95Þ
Neutron Distributions in Reactors 191

and
d
dz�uðzÞ
����~H�x
¼ d
dz�rðzÞ
����~H�x
; ð7:96Þ
where we have made the assumption that the diffusion coefficientsin the rodded and unrodded core regions are the same. Solutionsmeeting the boundary conditions at z ¼ 0 and z ¼ ~H may be shownto be
�uðzÞ ¼ C sinð�zÞ ð7:97Þ
and
�rðzÞ ¼C0 sin
ffiffiffiffiffiffiffiffiffiffiffiffiffiffiffiffi�2 � �2
pð ~H � zÞ
h i; �2 > �2
C0 sinhffiffiffiffiffiffiffiffiffiffiffiffiffiffiffiffi�2 � �2
pð ~H � zÞ
h i; �2 < �2:
:
8<: ð7:98Þ
Application of the interface conditions, Eqs. (7.95) and (7.96),leads to two additional equations relating C and C0. Taking theirratio yields the transcendental equation
� cot½�ð ~H � xÞ� ¼ �ffiffiffiffiffiffiffiffiffiffiffiffiffiffiffiffi�2 � �2
pcot
ffiffiffiffiffiffiffiffiffiffiffiffiffiffiffiffi�2 � �2
px
�; �2 > �2; ð7:99Þ
or
� cot½�ð ~H � xÞ� ¼ �ffiffiffiffiffiffiffiffiffiffiffiffiffiffiffiffi�2 � �2
pcoth
ffiffiffiffiffiffiffiffiffiffiffiffiffiffiffiffi�2 � �2
px
�; �2 < �2: ð7:100Þ
Given the reactor’s material properties, along with the definitions of� and �, these transcendental equations can be solved numericallyfor k.
The two limiting values of k reduce to be what is expected. Forthe rods out case, Eq. (7.97) is applicable over the entire core. Thus wemust have �uð ~HÞ ¼ 0, from which it follows that �2
u ¼ ð�= ~HÞ2 ¼ B2z ,
so that Eq. (7.93) yields
ku ¼k1
1þM2ðB2r þ B2
zÞ: ð7:101Þ
Similarly, with the control rods fully inserted, Eq. (7.98) holds over theentire core, and we must have �rð0Þ ¼ 0. Only the first of the pair can
meet this condition, and we obtain �2r � �2
r ¼ ð� = ~HÞ2 ¼ B2z , from
which Eqs. (7.93) and (7.94) yield kr ¼ ð1� bÞku. Next we considersituations where the rod bank is partially inserted to a distance x.
192 Fundamentals of Nuclear Reactor Physics

Figure 7.10 is a plot of the reactivity versus insertion lengthfor two cores, both with height to diameter ratios of one, and bothwith rod bank worths of b ¼ 0:02. The ratio of core dimension tomigration length, ~H/M, is central to understanding the reactivitycurves and flux distributions. A core with a smaller value of ~H/Mis referred to as neutronically tightly coupled, because distur-bances, such as control rod bank insertions, travel across it inrelatively few migration lengths, and therefore over relatively fewneutron generations. In a loosely coupled core—one with a large~H/M ratio—the converse is true: Many neutron generations arerequired to propagate a disturbance across the reactor. The neteffect is that in the more tightly coupled core distribution of theneutron flux deviates less from that of a uniform core, and thepattern of control rod worth is closer to that of Eq. (7.86); this canbe observed by comparing the ~H/M = 10 curve to Fig. 7.8, whichassumes no disturbance to the flux distribution. In contrast, the~H/M = 50 curve is quite skewed; the rod bank has little effectuntil it is inserted more than halfway into the core.
The effects on flux distribution are also pronounced. AsFig. 7.11a indicates, as the rod bank is inserted into the moretightly coupled core, with ~H/M = 10, the perturbed flux does notdeviate greatly from the standard axial cosine distribution. For themore loosely coupled core, however, the flux is pushed toward thebottom of the core as the rods are inserted. This is illustrated forthe ~H/M = 50 case shown in Fig. 7.11b. Note that all the curves inFigs. 7.11a and 7.11b are normalized to the same average flux, thusillustrating that the flux peaking can become quite severe in themore loosely coupled core.
00
0.25
0.25
0.5
0.5
0.75
0.75
1
1
(H/L) = 10
(H/L) = 50
Rod bank insertion depth: x/H
Rea
ctiv
ity r
ho(x
)/ rh
o(H
)
~
~
~
FIGURE 7.10 Normalized control rod bank worth vs insertion depth forcore of heights ~H/M = 10 and ~H/M = 50 H.
Neutron Distributions in Reactors 193

A reactor’s power density (i.e., power per unit volume) is limitedby thermal-hydraulic considerations. Thus for a given class of reac-tors, higher powers imply larger volumes, and therefore larger valuesof ~H/M, and more loosely coupled cores.
Comparing Tables 4.1 and 7.1 we see that both achievable aver-age power densities and migration lengths vary greatly between reac-tor designs. Generally, thermal reactors are more loosely coupledthan fast reactors, and they may have values of ~H/M substantiallyexceeding 50. Thus prevention of excessive power peaking from con-trol rod movements, refueling patterning, and other phenomenabecomes an increasing concern. In the following chapter we take upthe coupling between neutronics and the removal of heat from powerreactors that bears heavily on these issues.
Axial distance z/H
00
1
0.25
2
0.5
3
0.75
4
1
Neu
tron
flux
x /H = 0.50x /H = 0.75
Axial distance z/H
00
1
0.25
2
0.5
3
0.75
4(b)
(a)
1
Neu
tron
flux
~
~
x /H = 0.25~~~
x /H = 0.25~
x /H = 0.50~
x /H = 0.75~
FIGURE 7.11 Normalized axial flux distributions for control rod bankinsertion depths of x/ ~H= 0.25, 0.50, and 0.75. (a) ~H/ ~M= 10, (b) ~H/M = 50.
194 Fundamentals of Nuclear Reactor Physics

Bibliography
Bell, George I., and Samuel Glasstone, Nuclear Reactor Theory, VanNostrand-Reinhold, NY, 1970.
Duderstadt, James J., and Louis J. Hamilton, Nuclear Reactor Analysis,Wiley, NY, 1976.
Henry, Allen F., Nuclear-Reactor Analysis, MIT Press, Cambridge, MA, 1975.Lamarsh, John R., Introduction to Nuclear Reactor Theory, Addison-
Wesley, Reading, MA, 1972.Meghreblian, R. V., and D. K. Holmes, Reactor Analysis, McGraw-Hill,
NY, 1960.Ott, Karl O., and Winfred A. Bezella, Introductory Nuclear Reactor Statics,
2nd ed., American Nuclear Society, 1989.Stacey, Weston M., Nuclear Reactor Physics, Wiley, NY, 2001.
Problems
7.1. The material composition for the core of a large reactor yieldsk1 ¼ 1:02 and M = 25 cm.
a. Calculate the critical volume for a bare cylinder with a heightto diameter ratio of one.
b. Calculate the critical volume of a bare sphere.
Which of the two volumes did you expect to be larger? Why?
7.2. Determine the height to diameter ratio of a bare cylindricalreactor that will lead to the smallest critical mass.
7.3. Critical assemblies for studying the properties of fast reactors aresometimes built in halves as shown in the figure. The two halvesare maintained in subcritical states by separating them with asufficient distance that neutronic coupling between the two isnegligible; they are then brought together to form a criticalassembly. Suppose the core composition under investigation hasan infinite medium multiplication of 1.36 and a migration lengthof 18.0 cm. The assembly is configured with a height to diameterratio of one (H = D). Neglecting extrapolation distances,
D
H/2
D
H/2
Neutron Distributions in Reactors 195

a. Determine the dimensions required to make the assemblyexactly critical when the two halves are brought into contact.
b. Determine the value of k for each of the halves when they areisolated from each other.
7.4. A sodium-cooled fast reactor is to be built with the compositiongiven in problem 4.3 with a height to diameter ratio of 0.8. If thereactor, which is bare, is to have a value of k = 1.005 when nocontrol rods are inserted, what should the value of the reactor’sdiameter be?
7.5. A cylindrical tank is constructed for storage of liquidscontaining fissionable material. The tank has a diameter of0.90 m, and it is surrounded by a nonreflecting neutronabsorber. Material with k1 ¼ 1:16 and M = 7.0 cm is pouredinto the tank. Neglecting extrapolation lengths,
a. To what height can the tank be filled before it becomes critical?b. Estimate the maximum value of k1 permissible (M remaining
unchanged) if it must be guaranteed that criticality will not bereached no matter to what height the tank is filled.
c. It is decided to reduce the diameter of the tank so that thematerial in part a can never reach criticality. Estimate thereduced diameter.
7.6. Consider a critical reactor that is a cube with extrapolated sidelength a.
a. With the origin at the center, apply separation of variables inthree-dimensional Cartesian geometry to show that the fluxdistribution is
�ðx;y; zÞ ¼ C cosð�x=aÞ cosð�y=aÞ cosð�z=aÞ:
b. Find C in terms of the reactor power, volume, and ��f .c. Determine the reactor’s buckling.d. Suppose that a = 2.0 m and M = 20 cm. Determine the value
of k1 required to obtain criticality (i.e., k = 1.0).
7.7.*A cylindrical fast reactor has a volume of 1.4 m3 and a migrationlength of 20 cm. For height to diameter ratios between 0.5 and2.0 make plots on the same graph of the following:
a. The nonleakage probability PNL.b. The value of k1 required for the reactor to be critical.
7.8. A critical bare cylindrical reactor has a height to diameter ratioof one and a migration length of 7.5 cm. The core volume is15 m3. To simplify analysis, an engineer replaced the cylinderwith a sphere of the same volume.
196 Fundamentals of Nuclear Reactor Physics

a. What is the sign and magnitude of the error in themultiplication caused by this simplification?
b. If the reactor has a larger volume of 30 m3, will the error belarger or smaller than in part a? Justify your result.
7.9. Show that C1 = 0 in Eq. (7.16) from the boundary conditions�ð� ~H=2Þ ¼ 0 without employing the symmetry condition�ðzÞ ¼ �ð�zÞ.
7.10. Express C0001 and C0002 in Eqs. (7.61) in terms of C001 and C002 inEq. (7.60).
7.11. Apply the boundary condition ð ~H0=2þ aÞ ¼ 0 to determine C0002in terms of C0001 in Eq. (7.61). Then determine C0 in Eq. (7.62) interms of C0001 and C0002 .
7.12. Consider the situation when the spherical system discussed inSection 6.7 is critical. Determine the ratio of maximum toaverage flux in the sphere.
7.13. A spherical reactor of radius R is surrounded by a reflectorthat extends to r ¼ 1. L and D are the same for coreand reflector. Find the criticality equation relating k1, R, L,and D.
7.14. A spherical reactor is constructed with an internal reflectorwith parameters and D and �r
a and extending 0 � r � R. Theannular core, with parameters D, �a, and k1 (>1), extendsR � r � 2R.
a. Find the criticality condition (neglecting the extrapolationdistance).
b. Sketch the flux distribution for 0 � r � 2R.
7.15. Show from Eq. (7.71) that the reflector savings is approximatedby �z �M
_
D=D_
for a thick reflector.
7.16. An infinite slab reactor (extending to infinity in the y and zdirections) has a thickness of 2a with vacuum on either side.The properties for material 1 occupying 0 � x � a are k1
1 ¼ k1,D1 ¼ D, and �1
a ¼ �a and those for material 2 occupyinga � x � 2a are k2
1 ¼ 0, D2 ¼ D, and �2a ¼ 0. Neglecting
extrapolation distances,
a. Find a criticality equation relating a, k1, D, and �a.b. Sketch the flux between 0 and 2a.
7.17. Apply the interface conditions at the tip of the control rod bankto show that Eqs. (7.97) and (7.98) yield the criticality conditiongiven by Eqs. (7.99) and (7.100).
Neutron Distributions in Reactors 197

7.18. Beginning with Eq. (7.98) prove that with the control rodbank fully inserted.
a. �2r � �2r ¼ B2
z
b. kr ¼ ð1� bÞku
198 Fundamentals of Nuclear Reactor Physics

CHAPTER 8
Energy Transport
8.1 Introduction
The preceding three chapters concentrated on the time and spacedistributions of neutrons in a reactor core, leading to Eq. (7.30),which shows that in a critical reactor the flux level is proportionalto the reactor power. At very low power any level can be chosen, andthe equation still holds. However, for higher powers, at the levelstypically found in power reactors, two important limitations comeinto play. First, the energy must be transported out of the core with-out overheating the fuel, coolant, or other constituents; these ther-mal limits determine the maximum power at which a reactor canoperate. Second, as temperatures rise, the densities of the core materi-als change at different rates, and other temperature-related phenomenaoccur. These affect the multiplication, causing temperature-relatedreactivity feedback effects to ensue.
This chapter examines the energy transport from reactor cores,defining power density and related quantities that determine tem-perature distributions. These quantities allow the thermal limitsimposed on reactor operation to be examined in the later part of thechapter. Chapter 9 combines the temperature distributions with theneutron physics of reactor lattices to examine reactivity feedbackeffects.
8.2 Core Power Distribution
The interaction of neutron physics with heat transport requirementsmay be understood in broad terms as follows. Let P signify the reactorpower and V the core volume. Then
�P000 ¼ P=V ð8:1Þ
199

defines the core-averaged power density. The ratio of maximum toaverage power density is the power peaking factor:
Fq ¼ P000max
��P000: ð8:2Þ
Eliminating �P000 between these definitions offers some insight intothe interdisciplinary nature of reactor core design:
P ¼ P000max
FqV: ð8:3Þ
Reactors are normally designed to produce a specified amount ofpower, while with other variables held constant the cost of construc-tion rises dramatically with the core volume. Thus maximizingthe ratio P000max
�Fq is a central optimization problem of core design.
The achievable maximum power density is dependent primarily onmaterials properties and the temperatures and pressures that can betolerated by fuel, coolant, and other core constituents. Minimizingthe peaking factor falls much more into the domain of reactor phys-ics, for nonuniform distributions of fuel enrichment, the positioningof control rods and other neutron poisons, as well as other neutronicconsiderations largely determine the value of Fq. The core volumethat is ultimately selected also has reactor physics repercussions,most importantly on the core-averaged fuel enrichment and the non-leakage probability. Table 8.1 displays representative properties forthe major classes of power reactors.
Finite Cylindrical Core
The distribution of power density is central to the interaction of reactorphysics with thermal-hydraulic phenomena. The power density inwatts/cm3, kW/liter or MW/m3 at any point~r in the reactor is given by
P000ðr*Þ ¼ ��fðr*Þ�ðr*Þ; ð8:4Þ
where � is the number of W-s/fission and �f� is the number of fis-sions/cm3/s. The fission cross section and the flux are spatial averagesover lattice cells of fuel, coolant, and other core constituents, with theaverages determined by the methods discussed in Chapter 4. We con-sider specifically a cylindrical reactor of height H and radius R, andtake the origin at r = z = 0, the center of the reactor. We further assumethat the power distribution, and therefore �f and � in Eq. (8.4), areseparable functions of r and z. With this restriction we may representthe power density distribution as
P000ðr; zÞ ¼ �P000frðrÞfzðzÞ: ð8:5Þ
200 Fundamentals of Nuclear Reactor Physics

TABLE 8.13000 MW(t) Power Reactor Approximate Core Properties
PWRPressurized-H2OReactor
BWRBoiling-H2OReactor
PHWRCANDU-D2O Reactor
HTGRC-ModeratedReactor
SFR Na-CooledFast Reactor
GCFR He-cooledFast Reactor
�P000 (MW/m3) averagepower density
102 56 7.7 6.6 217 115
�q0 (kW/m) averagelinear heat rate 17.5 20.7 24.7 3.7 22.9 17
V (m3) core volume 29.4 53.7 390 455 13.8 26.1
H=M height anddiameter in migrationlengths
43.9 55.0 40.8 68.8 13.5 12.6
N number offuel pins 51,244 35,474 15,344 97,303 50,365 54,903
PNL nonleakageprobability
0.956 0.972 0.950 0.982 0.676 0.644
Source: Data courtesy of W. S. Yang, Argonne National Laboratory.

Since the volume integral
�P000 ¼ 1
V
ZP000ðr*ÞdV ð8:6Þ
defines the core-averaged power density, inserting P000ðr; zÞ into thisexpression determines normalization conditions on frðrÞ and fzðzÞ.For cylindrical geometry we write the volume integration as
dV
V¼ 2�r dr
�R2
dz
Hð8:7Þ
and obtain
�P000 ¼ �P0002
R2
Z R
0frðrÞr dr
1
H
Z H=2
�H=2fzðzÞdz: ð8:8Þ
Equations (8.5) and (8.6) are thus satisfied by the normalizationconditions
2
R2
Z R
0frðrÞrdr ¼ 1 ð8:9Þ
and
1
H
Z H=2
�H=2fzðzÞdz ¼ 1: ð8:10Þ
The power peaking factor is then the product of radial and axialcomponents, Fq ¼ FrFz; where the radial and axial peaking factors are
Fr ¼ frðrÞmax ð8:11Þ
andFz ¼ fzðzÞmax: ð8:12Þ
Common practice is also to include a local peaking factor Fl toaccount for fuel element manufacturing tolerances, local controland instrumentation perturbations, and other localized effects onthe power density, in which case
Fq ¼ FrFzFl: ð8:13Þ
In the quest to flatten the power distribution and reduce thepeaking factor, two or more radial zones containing fuels of differentenrichments frequently serve to decrease the radial peaking factor.
202 Fundamentals of Nuclear Reactor Physics
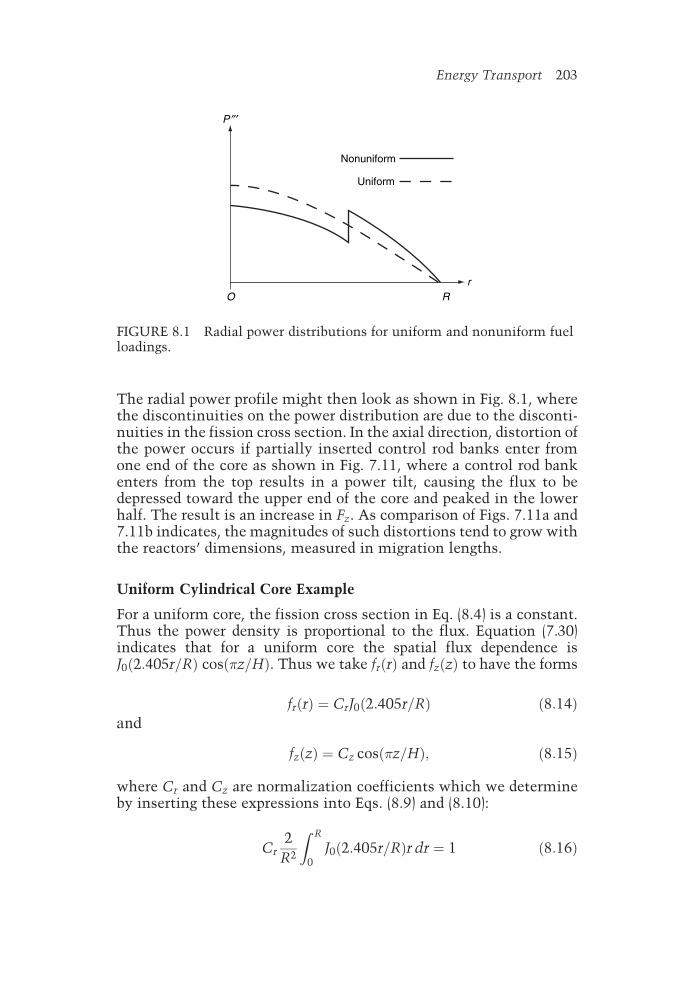
The radial power profile might then look as shown in Fig. 8.1, wherethe discontinuities on the power distribution are due to the disconti-nuities in the fission cross section. In the axial direction, distortion ofthe power occurs if partially inserted control rod banks enter fromone end of the core as shown in Fig. 7.11, where a control rod bankenters from the top results in a power tilt, causing the flux to bedepressed toward the upper end of the core and peaked in the lowerhalf. The result is an increase in Fz. As comparison of Figs. 7.11a and7.11b indicates, the magnitudes of such distortions tend to grow withthe reactors’ dimensions, measured in migration lengths.
Uniform Cylindrical Core Example
For a uniform core, the fission cross section in Eq. (8.4) is a constant.Thus the power density is proportional to the flux. Equation (7.30)indicates that for a uniform core the spatial flux dependence isJ0ð2:405r=RÞ cosð�z=HÞ. Thus we take frðrÞ and fzðzÞ to have the forms
frðrÞ ¼ CrJ0ð2:405r=RÞ ð8:14Þand
fzðzÞ ¼ Cz cosð�z=HÞ; ð8:15Þ
where Cr and Cz are normalization coefficients which we determineby inserting these expressions into Eqs. (8.9) and (8.10):
Cr2
R2
Z R
0J0ð2:405r=RÞr dr ¼ 1 ð8:16Þ
Nonuniform
Uniform
P ″′
ROr
FIGURE 8.1 Radial power distributions for uniform and nonuniform fuelloadings.
Energy Transport 203

and
Cz1
H
Z H=2
�H=2cosð�z=HÞdz ¼ 1: ð8:17Þ
We have already evaluated integrals identical to these in Eqs. (7.26)and (7.27), yielding
frðrÞ ¼ 2:32J0ð2:405r=RÞ ð8:18Þ
and
fzðzÞ ¼ 1:57 cosð�z=HÞ: ð8:19Þ
Because both the Bessel function and cosine have maximumvalues of one, the radial and axial peaking factors are
Fr ¼ 2:32 ð8:20Þ
and
Fz ¼ 1:57; ð8:21Þ
and Eq. (8.13) yields
Fq ¼ 3:63Fl: ð8:22Þ
8.3 Heat Transport
The same lattice structure that profoundly affects the reactor multi-plication, as detailed in Chapter 4, largely determines the transport ofheat out of the reactor. In what follows we present a simple fuel–coolant model that is applicable to fast reactors and to thermalreactors in which the liquid coolant also serves as the moderator. Inthermal reactors using solid moderators, most frequently graphite, athree-region model would be required, taking into account thetemperatures in the moderator as well as the coolant. We considersteady state heat transfer in this section before making a brief exam-ination of thermal transients in Section 8.4.
Heat Source Characterization
Consider the cylindrical reactor discussed above, with a height H anda radius R. Taking the origin of the coordinate system at the reactor’scenter, we designate the properties at a distance z along the axis of alattice cell whose centerline is located a radial distance r from the
204 Fundamentals of Nuclear Reactor Physics

core centerline by the arguments ðr; zÞ. For simplicity, we assume thatthe reactor’s power distribution is separable in the r and z directionsallowing us to describe it with Eq. (8.5).
Let q0ðr; zÞ be the thermal power produced per unit length of a fuelelement located in a lattice cell at ðr; zÞ; q0 is referred to as the linearheat rate; it has units of W/cm or kW/m. A related quantity is thesurface heat flux q00ðr; zÞ, measured in W/cm2 or kW/m2. It measuresthe rate of heat flow across the fuel element surface and into thecoolant, for a lattice cell located at ðr; zÞ. For a cylindrical fuel elementwith radius a, surface heat flux and linear heat rate are related by
q00ðr; zÞ ¼ 1
2�aq0ðr; zÞ: ð8:23Þ
Let Acell be the cross-sectional area of a lattice cell containing onefuel element. The thermal power produced per unit volume of core atthat point (i.e., the power density) is then
P000ðr; zÞ ¼ q0ðr; zÞ=Acell: ð8:24Þ
Combining this expression with Eq. (8.5) allows the linear heat rateto be expressed in terms of the radial and axial power components ofthe power density:
q0ðr; zÞ ¼ Acell�P000frðrÞfzðzÞ; ð8:25Þ
or correspondingly in terms of the reactor power,
q0ðr; zÞ ¼ Acell
VPfrðrÞfzðzÞ; ð8:26Þ
since �P000 ¼P=V. If the reactor consists of N identical lattice cells,each with a cross-sectional area of Acell, then we may expressreactor’s volume approximately as
V ¼ �R2 H ¼ NAcellH ð8:27Þ
and combine this expression with Eq. (8.26) to yield
q0ðr; zÞ ¼ 1
NHPfrðrÞfzðzÞ: ð8:28Þ
Note that NH is just the total length of the N fuel elements containedin the reactor core.
Steady State Temperatures
In what follows we develop some approximate expressions forestimating the fuel and coolant temperature distributions in terms
Energy Transport 205

of the reactor power. The temperature drop from fuel to coolant isproportional to the linear heat rate:
Tfeðr; zÞ � Tcðr; zÞ ¼ R0feq0ðr; zÞ; ð8:29Þ
where Tfeðr; zÞ is the fuel element temperature averaged over the fuelelement’s cross section, �a2, and Tcðr; zÞ is the coolant temperatureaveraged over the cross-sectional area of the coolant channel asso-ciated with the lattice cell. We designate the proportionality con-stant, R0fe, as the fuel element thermal resistance.
Appendix D contains the derivation of a simple expression for R0feand shows that for cylindrical fuel elements R0fe is nearly independentof the pin diameter but inversely proportional to the fuel thermalconductivity. The combination of Eqs. (8.28) and (8.29) expresses thetemperature drop in terms of the reactor power:
Tfeðr; zÞ � Tcðr; zÞ ¼ RfPfrðrÞfzðzÞ; ð8:30Þ
where
Rf ¼1
NHR0fe ð8:31Þ
defines the reactor core thermal resistance. We may volume-averagethe fuel and coolant temperatures over the core by applying theintegration, defined by Eq. (8.7), to Eq. (8.30):
Tf � Tc ¼ RfP; ð8:32Þ
where we have used the normalization conditions of Eqs. (8.9) and(8.10) to simplify the result.
We proceed by modeling the average and outlet coolant tempera-tures, Tc and ToðrÞ, under the stipulation that Ti, the inlet tempera-ture, is uniform over the cross-sectional area of the core. The coolantheat balance for a lattice cell located a distance r from the reactorcenterline states that the heat added to the coolant is equal to thatproduced in the fuel element:
Wchcp ToðrÞ � Ti½ � ¼Z H=2
�H=2q0ðr; z0Þdz0; ð8:33Þ
where Wch is the mass flow rate in kg/s and cp is the coolant specificheat at constant pressure, in J/kg K. Inserting Eq. (8.28) expresses theequation’s right-hand side in terms of the reactor power. Solving forToðrÞ yields
206 Fundamentals of Nuclear Reactor Physics

ToðrÞ ¼1
Wcp
P
NHfrðrÞ
Z H=2
�H=2fzðzÞdzþ Ti: ð8:34Þ
Next, we define
W ¼ NWch ð8:35Þ
as the core mass flow rate through the N identical channels. Then,using Eq. (8.10) to eliminate fzðzÞ, we have
T0ðrÞ ¼1
WcpPfrðrÞ þ Ti: ð8:36Þ
The average core outlet temperature results from integrating thisrelationship over the cross-sectional area of the core, that is, bytaking 2rdr=R2, and applying the normalization of Eq. (8.9):
�T0 ¼1
WcpPþ Ti: ð8:37Þ
The coolant temperature averaged over the core volume depends ondetails of the axial power distribution. However, if the power distribu-tion does not depart significantly from the axially symmetric condition
fzðzÞ � fzð�zÞ; ð8:38Þ
a reasonable approximation for the average coolant temperature is
�Tc ¼1
2ðTo þ TiÞ: ð8:39Þ
Using this approximation, we may employ Eq. (8.37) to obtain theaverage coolant temperature in terms of the known inlet temperatureand the reactor power:
�Tc ¼1
2WcpPþ Ti: ð8:40Þ
Likewise, inserting this expression into Eq. (8.32) yields an averagefuel temperature of
�Tf ¼ Rf þ1
2Wcp
� �Pþ Ti: ð8:41Þ
Average coolant and fuel temperatures are required for modelingthe reactivity feedback effects discussed in the following chapter. Ther-mal limits, however, are more closely related to maximum fuel and
Energy Transport 207

coolant temperatures as well as to the maximum values of the linearheat rate and surface heat flux. The maximum coolant temperatureoccurs at the core outlet, and may be obtained directly from Eq. (8.36):
T0jmax¼1
WcpPFr þ Ti; ð8:42Þ
where Fr is the radial peaking factor defined by Eq. (8.11). The max-imum temperature drop from fuel to coolant is determined fromEq. (8.30) by employing the definitions of Fr and Fz:
Tfeðr; zÞ � Tcðr; zÞ� ���
max¼ RfPFrFz: ð8:43Þ
Determining Tfe
��max
, however, requires that we know the coolanttemperature at the point where it occurs. Taking the maximum out-let temperature from Eq. (8.42) would yield too large a value. A closerestimate results from taking the average coolant temperature fromthe channel with the maximum power output, that is, FrTc. Combin-ing Eqs. (8.41) and (8.43) with this approximation then yields amaximum fuel temperature of
Tf
��max¼ RfFrFz þ
1
2WcpFr
� �Pþ Ti: ð8:44Þ
For liquid-cooled reactors, particularly those utilizing oxide orcarbide fuels, the temperature drop from fuel to coolant is much largerthan the temperature increase in the coolant. Thus from Eqs. (8.32)and (8.40),
�Tf � �Tc
�Tc � Ti
¼ 2WcpRf � 1: ð8:45Þ
Because Rf � 1=Wcp, approximations made in determining thecoolant temperature for use in Eq. (8.43) have relatively little impacton maximum fuel temperature. Much more important is the follow-ing: The core thermal resistance Rf is derived for Tfe averaged over thecross-sectional area of the fuel rod. The temperature at the rod’shottest point, which is along its centerline, determinesthe limitation on the linear heat rate. As indicated in Appendix D,the centerline temperature may be obtained by replacing Rf in Eq.(8.44) with Rcl, the thermal resistance from the centerline to thecoolant, which for a cylindrical fuel element is approximately
Rcl � 2 � Rf : ð8:46Þ
208 Fundamentals of Nuclear Reactor Physics

Pressurized Water Reactor Example
The interplay between neutronics and thermal hydraulics may bedemonstrated though the following simplified design analysis of areactor that is cooled and moderated by pressurized water. The initialdesign study assumes a uniform cylindrical core with a height todiameter ratio of one, and no significant reflector savings. Assumethe following specifications:
Power P = 3000 MW(t)
Moderator/fuel ratio VH2O=Vfuel ¼ 1:9
Linear heat rate q0jmax ¼ 400 W/cm
Surface heat flux q00jmax ¼ 125 W/cm2
Inlet coolant temperature Ti ¼ 290�C
Outlet coolant temperature Tojmax ¼ 330�C
The reactor’s owner determines the power at which thereactor must operate. The moderator to fuel ratio depends pri-marily on reactor physics considerations. Fuel properties such asthermal conductivity and melting temperature determine themaximum linear heat rate. Surface heat flux in a pressurizedwater reactor is limited to prevent the possibility of a boilingcrisis in which the fuel is insulated from the coolant as theresult of the formation of a vapor blanket at the fuel–coolantinterface. The coolant inlet temperature results from thermody-namic analysis of the power plant, whereas the outlet tempera-ture must be limited to prevent coolant boiling while operatingat the reactor’s design pressure.
The foregoing specifications—of which only the moderator tofuel volume ratio depends primarily on neutronics—determine agreat many of the reactor’s physical characteristics:
a. Fuel radiusb. Lattice pitchc. Core volume and dimensionsd. Core-averaged power densitye. Number of fuel elementsf. Coolant mass flow rateg. Mean coolant velocity.
In what follows, we determine each of these in sequence.The fuel radius is determined from Eq. (8.23):
ðaÞ a ¼ q0jmax
2�q00jmax
¼ 400
2� � 125¼ 0:509 cm:
Energy Transport 209

Assuming square cells, the lattice pitch is determined fromVH2O=Vfuel ¼ ðp2 � �a2Þ=�a2 or
ðbÞ p ¼ffiffiffiffiffiffiffiffiffiffiffiffiffiffiffiffiffiffiffiffiffiffiffiffiffiffiffiffiffiffiffiffiffiffiffiffiffiffiffi� VH2O=Vfuel þ 1 q
a ¼ffiffiffiffiffiffiffiffiffiffi2:9�p
0:509 ¼ 1:536 cm:
For the core volume we evaluate Eq. (8.26) at the point of themaximum linear heat rate to obtain V ¼ AcellPFrFz=q
0jmax, whereAcell ¼ p2. For a bare, uniform core, Eqs. (8.20) and (8.21) stipulatethat Fr ¼ 2:32 and Fz ¼ 1:57. Thus
V ¼ p2PFrFz=q0jmax¼ 1:5362 � 3000 � 106 � 2:32 � 1:57=400
¼ 6:445 � 107 cm3¼ 64:45 m3:
For a height to diameter ratio of one, V ¼ �ðH=2Þ2H. Hence
ðcÞ H ¼ ð4V=�Þ1=3 ¼ ð4 � 6:445 � 107=�Þ1=3 ¼ 434 cm ¼ 4:34 m:
The core-averaged power density is just
ðdÞ �P000 ¼ P=V ¼ 3000 � 106=6:445 � 107 ¼ 46:5 W=cm3 ¼ 46:5 MW=m3:
The number of fuel elements is determined by dividing the corecross-sectional area by the area of a lattice cell:
ðeÞ N ¼ �R2
Acell¼ �ðH=2Þ
2
p2¼ �ð434=2Þ2
1:5362¼ 62;702:
Because the maximum outlet temperature is limited to 330 �C we deter-mine the mass flow rate from Eq. (8.42); taking cp =6.4 �103 J/kg �C asthe specific heat of water at the operating coolant temperature yields
ðfÞ W ¼ 1
cp
PFr
ðT0jmax�TiÞ¼ 1
6:4 � 103
3000 � 106 � 2:32
ð330� 290Þ¼ 27:2 � 103 kg=s ¼ 27:2 � 106 g=s:
We determine the mean coolant velocity from W ¼ �Aflow�v, whereAflow ¼ N � ðp2 � �a2Þ, and we take the density of the pressurizedwater at 300 �C as 0.676 g/cm3. Thus
ðgÞ �v ¼ W
�Nðp2 � �a2Þ ¼27:2 � 106
0:676 � 62;702 � ð1:5362 � �0:5092Þ¼ 415 cm=s ¼ 4:15 m=s:
210 Fundamentals of Nuclear Reactor Physics

Finally, once the foregoing parameters are settled upon, the fuelenrichment and control poison requirements must be specified toobtain an acceptable value of k, the neutron multiplication.
The simplified modeling assumptions employed in this analysishave not taken into account a number of significant factors. Forexample, they do not allow space for control rods or structural sup-ports, and these could add 10% or more to the core volume. Likewise,they do not include Fl, the local peaking factor, nor do they allow forsubstantial reductions in Fr that typically result from reducing theenrichment of the fuel elements or increasing the number of burnablepoison rods to be placed in the highest flux regions of the core. Thereduction in peaking factor in real designs substantially increasesthe average power density and decreases the core volume toward thePWR numbers quoted in Table 8.1. Nevertheless, the model demon-strates the substantial constraints under which the neutronics designof a power reactor core must proceed. Moreover, the foregoing calcula-tions model represents only an attempt to obtain a workable set of coreparameters; in reality, design is an iterative process. So, for example, ifit turned out that the calculated coolant flow required a mean coolantvelocity that is too large or resulted in an excessive pressure drop acrossthe core, it would need to be reduced, and the other core parametersadjusted to accommodate the reduction.
8.4 Thermal Transients
As Eq. (8.32) indicates, the heat transferred from fuel to coolant understeady state conditions is just P ¼ ðTf � TcÞ=Rf . Conversely if coolingwere cut off entirely, all of the heat produced would go into heatingup the fuel adiabatically:
Mfcfd
dt�TfðtÞ ¼ PðtÞ; ð8:47Þ
where Mf and cf are the total fuel mass and specific heat, respectively.We may obtain an approximate lumped parameter model for thermaltransients by combining these two expressions:
Mfcf
d
dt�TfðtÞ ¼ PðtÞ � 1
Rf
�TfðtÞ � �TcðtÞ� �
: ð8:48Þ
As justification for this equation consider the two bounding cases.At steady state the derivative on the left vanishes and Eq. (8.32) results.If all cooling is lost (say, by setting the convection from fuel to coolantto zero, which is equivalent to Rf !1) the last term vanishes and
Energy Transport 211

Eq. (8.47) results. A more convenient form of this model results fromdividing by Mfcf :
d
dt�TfðtÞ ¼
1
MfcfPðtÞ � 1
��TfðtÞ � �TcðtÞ� �
: ð8:49Þ
The first term on the right is the adiabatic heat-up rate, that is, therate of fuel temperature rise if a power P is maintained but all coolingis cut off. The last term includes the core thermal time constant,
� ¼MfcfRf ; ð8:50Þ
which is a measure of the time required for heat to be transferredfrom fuel to coolant.
The thermal time constant is useful for the analysis of transi-ents; comparisons of it to other time constants such as the promptand delayed neutron lifetimes, the rates of control rod insertions, andso on are often useful in judging the degree to which differing phe-nomena interact. For cores with liquid coolants, the value of � istypically of the order of a few seconds, larger for oxide than for metalfuel. It is substantially larger for high temperature gas-cooled lattices,such as pictured in Fig. 4.1d, where the heat must pass through thegraphite moderator before arriving at a coolant channel.
Fuel Temperature Transient Examples
Reactor power levels cannot change instantaneously, because ofthe kinetic effects of delayed neutrons discussed in Chapter 5.However, idealized step changes are useful in focusing attention onthe significance of the thermal time constant. We consider two suchhypothetical situations. In the first, a reactor operating at steady statepower Po is shut down instantaneously at t ¼ 0. Equation (8.32)stipulates that the initial condition on the fuel temperature is�Tfð0Þ ¼ RfPo þ �Tc. Assuming the coolant temperature remains con-stant, Eq. (8.49) then reduces to
d
dt�TfðtÞ ¼ �
1
��TfðtÞ � �Tc
� �; t > 0: ð8:51Þ
Application of the integrating factor technique described inAppendix A yields a solution of
�TfðtÞ ¼ �Tc þ RfPo expð�t=�Þ: ð8:52Þ
Thus the fuel temperature decays exponentially, causing the fuel tolose half of its stored heat in a time t ¼ 0:693� .
212 Fundamentals of Nuclear Reactor Physics

Next consider the converse situation in which the power suddenlyjumps from zero to Po. The initial condition will now be Tfð0Þ ¼ Tc,and with constant coolant temperature, Eq. (8.49) takes the form
d
dt�TfðtÞ ¼
Po
Mfcf
� 1
��TfðtÞ � �Tc
� �; t > 0: ð8:53Þ
This equation may be solved using the integrating factor, yielding asolution of
�TfðtÞ ¼ �Tc þ RfPo½1� expð�t=�Þ�: ð8:54Þ
At long times the exponential vanishes, causing �Tfð1Þ to obey thesteady state condition given by Eq. (8.32). At short times, measuredas t� � , we may expand the exponential as expð�t=�Þ � 1� t=� ,which reduces the result to
�TfðtÞ � �Tc þ RfPot=� ¼ �Tc þPo t
Mfcf; ð8:55Þ
which is just the adiabatic heat-up rate. Thus we see that on timescales short compared to the thermal time constant, the corebehaves adiabatically; for transients that are slow compared to thetime constant, the core behaves in a quasi-steady state manner.
Coolant Temperature Transients
For simplicity, we have assumed that the coolant temperature remainsconstant in the above equations. This is often a reasonable approxima-tion since if the coolant is a liquid the temperature changes in it aretypically much smaller than in the fuel. Comparing the temperaturedrop between fuel and coolant, given by Eq. (8.32), with the tempera-ture rise of the coolant, given by Eq. (8.37), provides a reference point:
�Tf � �Tc
�To � Ti
¼ RfWcp: ð8:56Þ
Typically, for liquid-cooled reactors with oxide or carbide fuelRfWcp � 1.
For situations in which the time dependence of the averagecoolant temperature may become important, a differential equationapproximating its behavior may be derived as follows. The power Pappearing in Eqs. (8.32) and (8.40) represent, respectively, the heatflowing from the fuel to the coolant, and that being carried away bythe coolant. Under steady state conditions they are equal. However, if
Energy Transport 213

P in Eq. (8.32) is greater than its value in Eq. (8.40), the differencemust appear as the rate at which internal energy is added to thecoolant within the core. If Mc is the coolant mass within the coreand cp is its specific heat, then the rate of internal energy increase is
Mccpd
dt�TcðtÞ ¼
1
Rf
�TfðtÞ � �TcðtÞ� �
� 2Wcp �TcðtÞ � Ti
� �: ð8:57Þ
We may rewrite this equation in terms of two additional time constants
d
dt�TcðtÞ ¼
1
� 0�TfðtÞ � �TcðtÞ� �
� 1
� 00�TcðtÞ � Ti
� �: ð8:58Þ
Here
� 0 ¼Mccp
Mfcf
�; ð8:59Þ
but � 0 � � because even for liquid coolants the heat capacity ofthe coolant in the core typically is much less than the fuel. The remain-ing time constant can be expressed in terms of tc, the time required forthe coolant to pass from core inlet to outlet. Suppose that Aflow is theflow area of the core, and �c and �vc the density and average speed ofthe coolant; then W ¼ �cAflow�vc and Mc ¼ �cAflowH. Thus we have
� 00 ¼ Mccp
2Wcp¼
�cAflowHcp
2�cAflowvccp¼ H
2vc¼ 1
2tc: ð8:60Þ
This time constant also tends to be substantially smaller than thefuel time constant. Thus the coolant follows the fuel surface transi-ent quite rapidly such that the energy storage term on the left ofEq. (8.57) can be ignored in most cases.
To the extent that the foregoing assumptions hold, we canmodel the coolant by setting the left-hand side of Eq. (8.57) tozero. We then have
�TcðtÞ ¼1
1þ 2RfWcp2RfWcpTi þ TfðtÞ� �
: ð8:61Þ
Combining this result with Eq. (8.49) then yields
d
dt�TfðtÞ ¼
1
Mfcf
PðtÞ � 1
~��TfðtÞ � Ti
� �; ð8:62Þ
214 Fundamentals of Nuclear Reactor Physics

where
~� ¼2RfWcp
1þ 2RfWcp�: ð8:63Þ
However, because for most reactors RfWcp � 1, we may often makethe approximations ~� � � and
�TcðtÞ � Ti þ1
2RfWcpTfðtÞ: ð8:64Þ
Equations (8.62) and (8.64) provide a simple thermal model foruse in analyzing reactor transients. In such transients thermal timeconstants—which are often of the order of a few seconds—frequentlyinteract with the effects of the prompt and delayed neutron lifetimes. Neutronic and thermal effects are strongly coupled throughtemperature-induced reactivity feedback. We take up these feedbackeffects in the next chapter.
Bibliography
Bonella, Charles F., Nuclear Engineering, McGraw-Hill, NY, 1957.El-Wakil, M. M., Nuclear Power Engineering, McGraw-Hill, NY, 1962.Glasstone, Samuel, and Alexander Sesonske, Nuclear Reactor Engineering,
3rd ed., Van Nostrand-Reinhold, NY, 1981.Knief, Ronald A., Nuclear Energy Technology: Theory and Practice of
Commercial Nuclear Power, McGraw-Hill, NY, 1981.Lewis, E. E., Nuclear Power Reactor Safety, Wiley, NY, 1977.Raskowsky, A., Ed., Naval Reactors Physics Handbook, U.S. Atomic
Energy Commission, Washington, D.C., 1964.Todreas, M. E., and M. S. Kazimi, Nuclear Systems I & II, Hemisphere,
Washington, D.C., 1990.
Problems
8.1. The leakage probability of a power reactor is 0.08. As a firstapproximation to a new reactor an engineer estimates that thesame power density can be achieved if the power is to beincreased by 20%. Assuming the height to diameter ratio ofthe cylindrical core remains the same,
a. What will the leakage probability be in the new reactor withthe power increased by 20%?
b. If k1 is proportional to the fuel enrichment, by what percentwill the enrichment of the core need to be changed toaccommodate the 20% increase in power?
Energy Transport 215

8.2. A sodium-cooled fast reactor lattice is designed to have a migrationlength of 20 cm and a maximum power density of 500 W/cm3.Three bare cylindrical cores with height to diameter ratios of oneare to be built, with power ratings of 300 MW(t), 1000 MW(t), and3000 MW(t). For each of the three cores determine the following:
a. The core height H.b. The buckling B2.c. The nonleakage probability PNL.
8.3. Consider a nonuniform cylindrical reactor with core radius Rand height H. With control rods partially inserted, the powerdensity distribution is approximated by
P000ðr; zÞ ¼ A½1� ðr=RÞ4� cosð�z=HÞ � 0:25 sinð2�z=HÞ½ �:
Assume the (r, z) origin is at the center of the reactor.
a. Find A in terms of the reactor power P.b. Determine frðrÞ and fzðzÞ.c. Determine Fr, Fz, and Fq (assuming Fl ¼ 1:1).d. Plot frðrÞ and fzðzÞ.
8.4. Consider a nonuniform cylindrical reactor with core radius Rand height H. Two zones of fuel are employed, with a higherenrichment at the radial periphery to decrease the radial peakingfactor. As a result, the power density is given by
P000ðr; zÞ ¼A½1� ðr=RÞ4� cosð�z=HÞ for 0 r 3
4R
1:7A½1� ðr=RÞ4� cosð�z=HÞ for3
4R r R
8><>:
Assume the (r, z) origin is at the center of the reactor.
a. Find A in terms of the reactor power P.b. Determine frðrÞ and fzðzÞ.c. Determine Fr and Fz.
8.5. Beginning with the heat balance WchcpdTcðr; zÞ ¼ q0ðr; zÞdzshow that if the power distribution is axially symmetric,q0ðr;�zÞ ¼ q0ðr; zÞ, then Eq. (8.39) for the average coolanttemperature is exact.
8.6. You are to design a 3000 MW(t) pressurized water reactor. Thereactor is a uniform bare cylinder with a height to diameterratio of one. The coolant to fuel volume ratio is 2:1 in a squarelattice. The volumes occupied by control and structuralmaterials, as well as the extrapolation distances, can be
216 Fundamentals of Nuclear Reactor Physics

neglected. The core inlet temperature is 290 �C. The reactormust operate under three thermal constraints: (1) maximumpower density = 250 W/cm3, (2) maximum cladding surfaceheat flux = 125 W/cm2, and (3) maximum core outlet tempera-ture = 330 �C. Determine the following:
a. The reactor dimensions and volume.b. The fuel element diameter and lattice pitch.c. The approximate number of fuel elements.d. The mass flow rate and average coolant velocity.
8.7. A uniform cylindrical reactor core has a height to diameterratio of one. The reactor is reflected both radially and axiallywith radial and axial reflector savings each being equal to M,the migration length of the core composition.
a. Show that the power peaking factor (with Fl ¼ 1:0) is given by
Fq ¼1:889 1þ R=Mð Þ�2 R=Mð Þ2
J1½2:405 1þ R=Mð Þ�1R=M� sin½ �=2ð Þ 1þ R=Mð Þ�1R=M�:
b. Plot Fq vs R/M between R/M = 5 and R/M = 50 as well as theresults for the same reactor without the reflector.
8.8.*Suppose the reflected reactor in problem 8.7 is a sodium-cooledfast reactor with M = 18.0 cm and a power of 2000 MW(t). If thethermal design limits the maximum allowable power density to450 W/cm3,
a. What is (1) the minimum value that the core radius canhave, (2) the corresponding value of the core volume, and(3) the required value of k1 to maintain criticality?
b. Suppose that, to increase the thermal safety margins, it isdecided to reduce the maximum permissible power densityby 10%. What are the percentage changes for the reflectedreactor in radius, volume, and k1? (Assume that M remainsthe same.)
8.9. Repeat problem 8.8 in the absence of the reflector.
8.10. Consider the PWR design at the end of Section 8.3. Supposethat by varying the enrichment in the fuel assemblies anddistributing the control poisons in a nonuniform pattern thedesigners are able to reduce the radial and axial peaking factorsto Fr ¼ 1:30 and Fz ¼ 1:46. Redesign the reactor by solving partsc through g of the pressurized water reactor example usingthose peaking factors.
Energy Transport 217

8.11. An unachievable ideal would be a reactor with a perfectly flatflux distribution: Fr ¼ 1:00 and Fz ¼ 1:00. Repeat problem 8.10for such an idealized reactor.
8.12. Suppose that the designers of the pressurized water reactortreated in Section 8.3 conclude that the thermal-hydraulicdesign must have larger safety margins by reducing the coolantflow velocity by 10% and the maximum coolant temperature by5�C. The reactor physicists are asked to accommodate thosechanges by reducing the radial peaking factor. What percentagereduction would be required?
8.13. A reactor initially operating at a power Po is put on a period Tsuch that the power can be approximated as PðtÞ ¼ Po expðt=TÞ.Assuming that the coolant temperature is maintained at itsinitial value Tcð0Þ, solve Eq. (8.48) and show that the fueltemperature will be
TfðtÞ ¼ Tcð0Þ þPoRf
1þ �=T expðt=TÞ þ ð�=TÞ expð�t=�Þ½ �:
8.14. In the prismatic block form of the graphite-moderated gas-cooled reactor the heat passes through the moderator beforereaching the coolant. Figures 4.1d and 4.2c show such aconfiguration. Develop a set of three coupled differentialequations in forms similar to Eqs. (8.49) and (8.57) thatdescribe the transient heat transfer in such a reactor. Assumethat the heat transfer between fuel and moderator and betweenmoderator and coolant is described by PðtÞ ¼ ½�TfðtÞ � �TmðtÞ�=R1
and PðtÞ ¼ ½�TmðtÞ � �TcðtÞ�=R2, respectively. Assume that W isthe mass flow rate, and that the masses, specific heats, anddensities of fuel, moderator, and coolant are given by Mi, ci, and�i with i = f, m, and c.
8.15.*A sodium-cooled fast reactor has the following characteristics
P = 2400 MW(t), W = 14,000 kg/s,
� = 4.0 s, cp = 1250 J/(kg �C),
Mfcf = 13.5 � 106 J/�C, Mccp = 1.90 � 106 J/�C.
Ti = 360 �C,
Suppose the reactor undergoes a sudden trip, which may beapproximated by setting the power equal to zero. Assumingthe inlet temperature remains at its initial value, find thecore outlet temperature and plot your results.
218 Fundamentals of Nuclear Reactor Physics

8.16.*Assume that the reactor in the preceding problem suffers a controlfailure and undergoes a power transient PðtÞ ¼ Pð0Þ½1þ 0:25t�,where t is in seconds. The shutdown system trips the reactor ifthe outlet temperature rises by more than 40 �C.
a. Determine the coolant outlet temperature transient and plotyour result until the temperature rises by 40 �C.
b. At what time does the reactor shutdown system terminatethe transient?
Energy Transport 219

CHAPTER 9
Reactivity Feedback
9.1 Introduction
In Chapters 5 through 7, where the time and spatial distributions ofneutrons in reactors are examined, the reader learned that with aspecified set of cross sections the criticality equations allow reactorsto operate at any power, without affecting the multiplication; thepower level simply provides the normalization for the flux solution.The independence of power level from multiplication, however, onlyholds when the neutron flux is small. At higher power levels thetemperatures of the fuel and coolant increase. Thermal expansion andother phenomena, such as Doppler broadening, then bring aboutchanges in the cross sections, and concomitant changes in the valueof k. In Chapter 8 we examined the temperature effects associated withpower level changes. In this chapter we complete the loop by examiningthe reactivity feedback resulting from those changes in temperature.
We begin by defining reactivity coefficients and then look atthose caused specifically by fuel and by moderator temperaturechanges. We proceed by examining the reactivity effects that takeplace under various operating conditions, such as heat up from roomtemperature to operating conditions, changes in power level, transi-ents, and so on. After examining reactivity control and the conceptsof excess reactivity, temperature, and power defects, we concludewith a discussion of reactor transients.
9.2 Reactivity Coefficients
The treatment of reactor kinetics in Chapter 5 indicates that thepower produced by a reactor is determined by the time-dependentmultiplication kðtÞ, or correspondingly the reactivity,
�ðtÞ ¼ kðtÞ � 1
kðtÞ : ð9:1Þ
221

In some situations it is possible to determine a priori the reactivityversus time. Such is often the case, for example, when control rods ofknown properties are moved in a prescribed manner in a reactoroperating at very low neutron flux levels. As soon as a reactor producesenough power to raise the temperatures in the core above their ambi-ent levels, however, the material densities as well as some of themicroscopic cross sections become affected. Because the core multi-plication depends on these densities, a reactivity feedback loop isestablished in which k, and thus �, is dependent on temperatures anddensities that in turn are determined by the reactor power history. Theunderstanding of the nature of mechanisms leading to reactivity feed-back is essential to the analysis of power reactor behavior.
In relating the incremental reactivity changes to reactor multi-plication, the following approximation is nearly universal:
d� ¼ dk=k2 � dk=k ¼ dðln kÞ: ð9:2Þ
Because k rarely differs from one by more than a few percent, littleerror is introduced into �. Moreover, the logarithmic form of Eq. (9.2)facilitates the analysis of reactivity effects: Because k frequently isapproximated with the four factor formula, writing d� ¼ dðln kÞ allowsthe factors to be transformed from multiplicative to additive form. Inaddition, since we make widespread use of Eq. (3.2) for expressing themultiplication as a product of infinite medium and leakage effects,
k ¼ k1PNL; ð9:3Þ
taking the logarithmic differential of k, and utilizing the definition ofthe nonleakage probability given by Eq. (7.49), yields additive termsfor infinite medium and leakage effects:
dk
k¼ dk1
k1� M2B2
1þM2B2
dM2
M2þ dB2
B2
� �: ð9:4Þ
Moreover, since the leakage probability for large power reactorsusually is quite small,
PL ¼M2B2
1þM2B2� 1: ð9:5Þ
In large, loosely coupled cores changes in k1 often dominate, justifyingthe following approximation:
dk
k� dk1
k1: ð9:6Þ
222 Fundamentals of Nuclear Reactor Physics

For thermal reactors Eq. (9.2) combined with the four factor formula,k1 ¼ "pf�T , introduced in Section 4.4, allows further subdivision ofreactivity effects into additive terms:
dk1k1¼ d"
"þ dp
pþ df
fþ d�T
�T: ð9:7Þ
In what follows we examine a simplified model in which themultiplication changes only with the average fuel and coolant tem-peratures, �Tf and �Tc:
k1 ¼ k1ð�Tf ; �TcÞ: ð9:8Þ
We may then use partial derivatives to write
dk1k1¼ 1
k1
@k1
@�Tf
d�Tf þ1
k1
@k1
@�Tc
d�Tc: ð9:9Þ
Assuming the coolant and moderator are one and the same allows usto simply replace �Tc by �Tm, and apply the four factor formula:
1
k1
@k1
@�Tx
¼ 1
"
@"
@�Tx
þ 1
p
@p
@�Tx
þ 1
�T
@�T
@�Tx
þ 1
f
@f
@�Tx
; ð9:10Þ
where x = f and m indicate fuel and moderator, respectively. Forreactors in which the moderator is distinct from the coolant, thefour factor expressions introduced in Chapter 4 can be appropriatelymodified to take into account both moderator and coolant tempera-tures, k1ð�Tf ; �Tc; �TmÞ, and then we apply Eq. (9.10) to all three tem-peratures. If the coolant is a gas, however, it is usually adequate toconsider only fuel and moderator temperature coefficients, since thedensity of the coolant gas is too small for its temperature to have anappreciable effect on reactivity.
Fuel Temperature Coefficient
Doppler broadening of the resonance capture cross sections of thefertile material accounts for the dominant part of the fuel tempera-ture coefficient in low enrichment thermal power reactors and makesa substantial contribution in fast reactors as well. In thermal systemsthe effect appears as a decrease in the resonance escape probabilitywith increased fuel temperature. There is no Doppler effect on ", itscontribution coming from energies well above where fuel resonancecross sections occur. There may be relatively minor changes in �T
and f in situations where substantial plutonium-239 is present, as it
Reactivity Feedback 223

has a resonance only slightly above thermal energies. The lattereffects are neglected in what follows, however, because they tend tobe small compared to the change in the resonance escape probability.
The Doppler effect arises from the dependence of neutron crosssections on the relative speed between neutron and nucleus. Theresonance cross sections are sharply peaked in energy, as shown, forexample, in Fig. 4.6. For a given neutron speed the cross section mustbe averaged over the range of relative speeds resulting from thethermal motions of the fuel atoms, which constitute a Maxwell-Boltzmann distribution discussed in Chapter 2. This averaging hasthe net effect of slightly smearing the resonance in energy, causingthem to appear wider and less peaked. The smearing becomes morepronounced as the fuel temperature rises, as shown in the exagger-ated cross section curves in Fig. 4.6a. Thus we may approximate �f ,the fuel temperature coefficient, as
�f ¼1
k
@k
@�Tf
� 1
p
@p
@�Tf
: ð9:11Þ
In power reactor cores the concentration of resonance absorbersin the fuel is quite large. The effect is then to depress the neutron fluxin the fuel both spatially, making ’fðEÞ=’mðEÞ< 1, and in energy, asFig. 4.6b indicates. The flux depression, known as resonance self-shielding, is most pronounced where the resonance cross section islargest. More rigorous analysis shows that as the fuel temperatureincreases, the flux depression or self-shielding becomes less pro-nounced, as sketched in Fig. 4.6b. The net effect is to increase theabsorption rate and also the resonance integral. By inserting Eq. (4.40)for the resonance escape probability into Eq. (9.11) and performingthe differentiation we obtain
�f ¼ �VfNfe
Vm�m �ms
@I
@�Tf
¼ � ln1
p
� �1
I
@I
@�Tf
: ð9:12Þ
An approximation for the temperature dependence of the reso-nance integral that is useful for thermal reactor analysis is given by
I � IðToÞ½1þ ~�ðffiffiffiffiffiffi�Tf
q�
ffiffiffiffiffiffiTo
pÞ�; ð9:13Þ
where �Tf and To are absolute temperatures in degrees kelvin, withthe reference temperature taken as To = 300 K. The coefficient is afunction of the surface to mass ratio ðS=M ¼ 4=�DÞ of a cylindricalfuel element of diameter D cm:
~� ¼ C1 þC2ð4=�DÞ; ð9:14Þ
224 Fundamentals of Nuclear Reactor Physics

where Table 9.1 displays the constants. Differentiating Eq. (9.13), weobtain
1
I
@I
@�Tf
¼ ~�
2ffiffiffiffiffiffi�Tf
q I Toð ÞIð�TfÞ
: ð9:15Þ
With IðToÞ=Ið�TfÞ � =; inserting this expression into Eq. (9.12) thenyields
�f ¼ �~�
2ffiffiffiffiffiffi�Tf
q ln 1=pðToÞ½ �: ð9:16Þ
Other effects may make smaller contributions to the fuel tem-perature coefficient. Fuel expansion, for example, causes perturba-tions in the four factors; however, these effects tend to be small inlow enrichment reactors relative to that of Doppler broadening.
Moderator Temperature Coefficient
In those thermal reactors in which the moderator is a liquid, con-tributions to the moderator coefficient,
�m ¼1
k
@k
@�Tm
; ð9:17Þ
derive primarily from density changes, with changes in the thermalneutron energy spectrum playing a secondary role. To illustrate, wefirst expand �m in terms of Nm, the moderator atom density:
�m ¼1
k1
@k1@Nm
@Nm
@�Tm
: ð9:18Þ
The atom density change in turn relates to the temperature coeffi-cient through the volumetric coefficient of thermal expansion atconstant pressure:
�m ¼ �1
Nm
@Nm
@�Tm
: ð9:19Þ
TABLE 9.1Constants C1 and C2 for Eq. (9.14)
Fuel C1 C2
Uranium metal 0.0048 0.0064UO2 0.0061 0.0047
Source: Pettus, W. G., and M. N. Baldwin, ‘‘Resonance Absorption in U238 Metal and OxideRods,’’ Babcock and Wilcox Company Report No. BAW-1244, 1962.
Reactivity Feedback 225

Combining the two equations then yields
�m ¼ ��mNm1
k1
@k1@Nm
: ð9:20Þ
Consider next the dependence of the four factors on Nm. The fastfission factor increases somewhat with decreased moderator densitybecause the neutrons are not slowed down as effectively to below theenergy range where fast fission takes place. The effect is small, how-ever, as is the effect on �T , compared to that on the resonance escapeprobability and the thermal utilization. Thus we approximate
1
k1
@k1@Nm
’ 1
p
@p
@Nmþ 1
f
@f
@Nm: ð9:21Þ
Differentiating the expressions for p and f, given by Eqs. (4.54) andEq. (4.55), with respect to Nm yields
1
p
@p
@Nm¼ 1
Nmlnð1=pÞ ð9:22Þ
and
1
f
@f
@Nm¼ � 1
Nmð1� fÞ: ð9:23Þ
Combining Eqs. (9.20) through (9.23), we find
1
k1
@k1@Tm
¼ ��m lnð1=pÞ � ð1� fÞ½ �: ð9:24Þ
A decrease in moderator density decreases the effectiveness bywhich neutrons are slowed down through the resonance region.Hence the resonance absorption increases, causing the resonanceescape probability to decrease. The lower moderator density, how-ever, causes the thermal utilization to increase, resulting in a posi-tive temperature effect from the second term in Eq. (9.24).
Although exceptions may occur under some conditions, gener-ally in liquid-moderated reactors the decreasing moderator density isthe dominant effect and causes the moderator temperature coeffi-cient to be negative. Increases in moderator temperature also causehardening of the thermal neutron spectrum, as indicted in Figure 3.5.In liquid-moderated reactors, the effects of spectral hardening aresmall compared to that of the reduced moderator density. In solid-moderated reactors, however, the thermal expansion has a muchsmaller effect, and spectral hardening dominates the determinationof the temperature coefficient. The spectral effects depend on com-plication interactions to thermal neutron scattering in solid crystalstructures and the non 1/v dependence of some isotopes’ absorption
226 Fundamentals of Nuclear Reactor Physics

cross sections. As a result moderator temperature coefficients insolid-moderated systems may be positive over some temperatureranges. In such situations reactor stability requires that the negativefuel temperature coefficient have a larger magnitude.
Fast Reactor Temperature Coefficients
The temperature coefficients of fast reactors differ in a number ofrespects from those of thermal reactors. First, the sizes of fast reactorsmeasured in migration lengths tend to be substantially smaller thanthose for thermal reactors. This results both from the higher powerdensity designs and from the fact that neutron cross sections aresmaller for fast than for thermal spectrum neutrons. Consequently,the leakage terms in Eq. (9.4) have more substantial effects onreactivity.
In fast as well as in thermal reactors the Doppler broadening ofcapture resonances accounts for the major part of the negative fueltemperature coefficient. It is, however, smaller in magnitudebecause, as indicated by the spectra in Fig. 3.6, only a fraction ofthe neutrons in a fast reactor are slowed to the energy range wherethe large capture resonances in fertile materials occur.
Coolant temperature coefficients in fast reactors are yet moredifficult to predict with elementary models, for they stem from thedifference between two competing effects. With increased tempera-ture, the coolant density decreases. Since in liquid-cooled fast reactorsthe coolant tends to degrade the neutron spectrum to lower energies,removal of coolant atoms hardens the neutron spectrum. As a resultthe larger value of �ðEÞ at higher neutron energies, as indicated inFig. 3.2, causes the increased coolant temperature to increase thevalue of k1. Conversely, the decreased density that results fromincreased coolant temperature lengthens the migration length. Exam-ination of Eq. (9.4) indicates that an increase in M will also increase theneutron leakage, decreasing the nonescape probability and decreasingthe reactivity. Determining which of these effects is larger requirescomputational models that are beyond the level of this text.
9.3 Composite Coefficients
Chapter 8 provides a reactor model in terms of the average tempera-ture of the fuel and coolant, �Tf and �Tc. We can model the reactivityfeedback by expanding it in terms of these temperatures:
d�fb ¼1
k
@k
@�Tf
d�Tf þ1
k
@k
@�Tc
d�Tc; ð9:25Þ
Reactivity Feedback 227

where, for low leakage cores, the coefficients may be modeled solelyin terms of k1 with little loss of accuracy. Reactivity coefficientscouple to these temperatures in three distinctly different sets ofcircumstances. These lead to the definitions of the prompt and iso-thermal temperature coefficients, and to the power coefficient.
Prompt Coefficient
A large reactivity insertion will cause a reactor to go on such a shortperiod that the power changes significantly over time spans that areshort compared to the number of seconds needed to transfer heat fromfuel to coolant. Over such short time spans the amount of heat trans-ferred to the coolant is not enough to increase its temperature appreci-ably. As a result the dominant feedback reactivity comes directly fromthe heating of the fuel. Thus we take d�Tc � 0, reducing Eq. (9.25) to
d�fb ¼1
k
@k
@�Tf
d�Tf : ð9:26Þ
The quantity
�f ¼d�fb
d�Tf
¼ 1
k
@k
@�Tf
ð9:27Þ
is alternately known as the fuel temperature or the prompt coeffi-cient, because it provides prompt feedback in the case of a suddenchange in power. For a reactor to be stable, it must be negative.
A second mechanism does cause some instantaneous coolantheating. The increased number of neutrons colliding elasticallywith coolant atoms transfers some of their kinetic energy to thecoolant atoms. However, this effect is significant compared to theDoppler broadening of the fertile material resonance only for systemsfueled with highly enriched uranium—such as those found in navalpropulsion reactors—where the presence of uranium-238 is greatlydiminished.
Isothermal Temperature Coefficient
In many power reactors the entire core is brought very slowly fromroom temperature to the operating inlet coolant temperature, eitherby operating the reactor at a very low power or by using anothersource of heat such as that generated by the coolant pumps. In suchan operation a reasonable approximation is to assume that the corebehaves isothermally with a temperature �T, that is,
�Tf ¼ �Tc ¼ Ti ¼ �T: ð9:28Þ
228 Fundamentals of Nuclear Reactor Physics

Dividing Eq. (9.25) by d�T yields the isothermal temperaturecoefficient,
�T �d�fb
d�T¼ 1
k
@k
@�Tf
þ 1
k
@k
@�Tc
; ð9:29Þ
or equivalently �T ¼ �f þ �c, which accounts for the reactivity feed-back under such circumstances.
Power Coefficient
Operating a reactor at more than a small percentage of its rated powercauses the fuel temperature to rise significantly above that of thecoolant, and the average coolant temperature to increase above thatat the core inlet. Thus �Tf > �Tc > Ti, and we must replace the isother-mal temperature coefficient with a reactivity coefficient that is applic-able to a reactor operating at power. To obtain the power coefficient wedivide Eq. (9.25) by an incremental power change, dP:
�P �d�fb
dP¼ 1
k
@k
@�Tf
d�Tf
dPþ 1
k
@k
@�Tc
d�Tc
dP: ð9:30Þ
Provided the power changes are executed in a quasi-static man-ner, that is, the power changes are slow compared to the timerequired to remove heat from the fuel to the core outlet, the steadystate heat transfer relationships derived in Chapter 8 are applicable.Differentiating Eqs. (8.41) and (8.40) with respect to power yields
d�Tf
dP¼ Rf þ
1
2Wcpð9:31Þ
and
d�Tc
dP¼ 1
2Wcp: ð9:32Þ
Inserting these expressions into Eq. (9.30) then expresses the powercoefficient as
�P ¼ Rf þ1
2Wcp
� �1
k
@k
@�Tf
þ 1
2Wcp
1
k
@k
@�Tc
; ð9:33Þ
or, equivalently, as �P ¼ Rf�f þ ð2WcpÞ�1ð�f þ �cÞ.
Reactivity Feedback 229

Temperature and Power Defects
The magnitudes as well as the signs of the temperature and powercoefficients strongly affect the control of reactivity in a power reactor.The temperature and power defect concepts make their influence clear.
Suppose we ask how much reactivity the control system mustadd to bring a reactor core from room temperature to the operatinginlet temperature. The control reactivity must just compensate forthe negative feedback reactivity. We find the reactivity decrease byintegrating the isothermal temperature coefficient of Eq. (9.29) fromroom temperature, Tr, to the operating inlet temperature Ti:
DT ¼Z Ti
Tr
�Tð�TÞd�T ð9:34Þ
The temperature defect, as defined here, is negative provided thetemperature coefficient is also negative. To compensate for it anequal amount of reactivity must be added to the reactor through with-drawal of control rods or other means in order to bring the reactor fromroom to operating temperature. These two states normally are referredto as cold critical and hot zero-power critical, respectively.
As the reactor power increases above the hot zero-power state to itsrated level, a negative power coefficient causes the reactivity to decreasefurther by an amount determined by integrating the fuel and coolanttemperature coefficients between inlet and full power conditions:
DP ¼Z �TfðpÞ
Ti
�fð�TfÞd�Tf þZ �TcðpÞ
Ti
�eð�TcÞd�Tc: ð9:35Þ
where �TðPÞ¼ Rfþð2WcpÞ�1h i
PþTi and �TcðPÞ¼ð2WcpÞ�1PþTi: This
quantity is defined as the power defect. Because it is negative if thetemperature coefficients are negative, the control system must addan equal amount of reactivity to bring the reactor from zero to fullpower. If the coefficients are temperature in dependent, then wehave simply DP¼�RD:
9.4 Excess Reactivity and Shutdown Margin
For any well-defined state of a reactor core, we define the excess reactivity�ex as the value that � would take if all movable control poisons wereinstantaneously eliminated from the core. Large excess reactivities areundesirable because they require large amounts of neutron poisons to bepresent in the core to compensate for them. The more control poison that
230 Fundamentals of Nuclear Reactor Physics

is present in a core, the more extreme is the care that must be taken: Thepossibility of events that could lead to rapid ejection of a large enoughfraction of that poison to bring the reactor near to prompt critical must beeliminated. Reactor designs must be shown to survive many hypotheticalaccidents without damage, including the ejection of a control rod, theuncontrolled withdrawal of a control rod bank, rapid dilution of solubleboron poison in water coolant, and so on. As a result, strict limitations areplaced on the maximum amount of reactivity allowed in any one controlrod,andalso inany onebankofcontrol rods.Thus the need for largeexcessreactivities complicates control system design by requiring increasednumbers of control rod banks and/or more rods per bank. Such require-ment, in turn, increase the cost of the core since control rods occupyvaluable space and add electromechanical complexity to the system.
Thus although negative temperature and power coefficients arenecessary to ensure stability while the reactor is operating, inordi-nately large magnitudes of these quantities create problems byincreasing the amount of excess reactivity that the control systemmust be able to overcome. The plots of excess reactivity in Fig. 9.1versus time from beginning to end of core life (from BOL to EOL)illustrate this point by depicting the transitions between four statesof the reactor: cold shutdown, cold critical, hot zero-power critical,and full power from the beginning through the end of core life. Withthis terminology, ‘‘cold’’ means ambient or room temperature, and‘‘hot zero power’’ stipulates that the entire reactor has been heated tothe temperature of the coolant inlet at full power, but essentially nopower is being produced and thus the core is isothermal. As a reactoris taken from cold shutdown to full power, negative temperature
d
BOL time
ρ ex
EOL
cTemperature defect
Power defect
Shutdown marginba
FIGURE 9.1 Excess reactivity vs time for different core states. (a) Coldshutdown, (b) cold critical, (c) hot zero power, (d) full power.
Reactivity Feedback 231

feedback causes excess reactivity to decrease, meaning that controlpoisons must be removed to keep the reactor critical. Conversely,when the reactor is shut down, temperatures decrease, causing excessreactivity to increase, and control poisons must be added.
Bringing the reactor critical from an initial shutdown state atroom temperature decreases the excess reactivity from curve a to b.A minimum shutdown margin is invariably imposed by regulatorybodies and must be incorporated into control poison specifications.The core is then heated from cold critical to hot zero power, reducingthe excess reactivity from curve b to c, with the difference being themagnitude of the temperature defect. Transitions between roomtemperature and hot zero-power temperature are carried out quiteslowly, often limited by such mechanical considerations as excessivethermal stresses that would be induced in pressure vessels or piping iftoo rapid temperature transients were imposed. As the reactor isbrought from zero to full power, more control poison must be with-drawn to compensate for the power defect in moving from curve cto d. Note that at full power, there is still excess reactivity in thecore, and therefore control poison must be present. The shapes of thecurves versus time are determined by fuel depletion and the buildupof fission products during core life. At the end of core life there is noexcess reactivity at full power: All of the movable control poison hasbeen extracted, and hence power must be reduced, or—more likely—the reactor is shut down for refueling. With online refueling, ofcourse, curve d would be roughly horizontal, with very close to zeroexcess reactivity, and no specified end of core life.
In shutting down the reactor, we move back up the excess reactivitycurve. The reactor may be made subcritical—or scrammed as the expres-sion goes—from any power level. At that point all of the control poison isinserted. However, it must always be guaranteed that even as the reactorcools to ambient temperature, enough control poison remains to over-come the excess reactivity and maintain the shutdown margin.
9.5 Reactor Transients
The preceding section assumes implicitly that the transitions betweenroom temperature, hot zero power, and full power take place very slowly.Such quasi-static transitions require the reactor to be on a period that ismuch longer than the time necessary for the heat produced in fission to betransferred to the coolant and convected out of the core. We may thenemploy steady state relationships for heat transfer as the reactor passesthough a series of well-defined states, in which the excess reactivity isvery close to being nullified by the control poisons. There are, however,situations that call for more rapid changes of neutron populations. In thestartup of a reactor from cold critical, for example, the initial power is
232 Fundamentals of Nuclear Reactor Physics

many orders of magnitude smaller than under operating conditions. Thustemperature feedback is insignificant, and a reactor period is chosenaccording to the kinetics equations of Chapter 5. At higher power levelswhere temperature feedback becomes important, changes in operatinglevels to follow power demand or for other reasons frequently must takeplace more rapidly than can be described with a quasi-static model.Finally, the examination of hypothetical reactor mishaps frequentlyinvolves transients that take place over time spans that are comparableto or shorter than those required to transfer heat from fuel to coolant.
Reactor Dynamics Model
To examine reactor transients we adopt a simple model in which apositive reactivity, �iðtÞ, is inserted, and the feedback results fromfuel and coolant temperature coefficients, �f and �c, respectively,which we assume are negative constants. If the reactor is criticaland in steady state operation at the time of transient initialization,the total reactivity becomes
�ðtÞ ¼ �iðtÞ � �f
�� �� �TfðtÞ � �Tfð0Þ� �
� �cj j �TcðtÞ � �Tcð0Þ� �
; ð9:36Þ
where we impose absolute value signs to indicate negative tempera-ture coefficients. To analyze the transient we substitute this expres-sion into the kinetics equations, given by Eqs. (5.47) and (5.48).Written in terms of the reactor power, and with the external sourceset equal to zero, they become
d
dtPðtÞ ¼ ½�ðtÞ � ��
�PðtÞ þ
Xi
�i~CiðtÞ ð9:37Þ
and
d
dt~CiðtÞ ¼
�i
�PðtÞ � �i
~CiðtÞ; i ¼ 1;2;3;4;5;6: ð9:38Þ
We approximate the temperatures using the transient heat transfermodel given by Eqs. (8.62) and (8.64):
d
dt�TfðtÞ ¼
1
MfcfPðtÞ � 1
~�TfðtÞ � Ti
� �ð9:39Þ
and
�TcðtÞ ¼ Ti þ1
2RfWcpTfðtÞ: ð9:40Þ
Reactivity Feedback 233

Provided we approximate the thermal time constant as ~ � ¼MfcfRf ,Eq. (9.40) allows the coolant temperature to be eliminated fromEq. (9.36):
�ðtÞ ¼ �iðtÞ � �j j �TfðtÞ � �Tfð0Þ� �
; ð9:41Þ
where
�j j ¼ �f
�� ��þ 1
2RfWcp�cj j: ð9:42Þ
If a reactor is critical before the transient is initiated, then~Cið0Þ ¼ �i=�i�ð ÞPð0Þ and the initial temperatures are given by thesteady state conditions from Eqs. (8.40) and (8.41):
�Tfð0Þ ¼ Rf þ1
2Wcp
� �Pð0Þ þ Ti ð9:43Þ
and
�Tcð0Þ ¼1
2WcpPð0Þ þ Ti: ð9:44Þ
Transient Analysis
We first apply the foregoing model to very slow transients, that is,ones in which the added reactivity increment �iðtÞ ¼ �o�� is sosmall that the resulting reactor period in the absence of feedbackwould be substantially longer than the fuel time constant, . Insuch situations, we may neglect the temperature derivative on theleft of Eq. (9.39) and employ the resulting quasi-steady state heattransfer equation
�TfðtÞ ¼ Rf þ1
2Wcp
� �PðtÞ þ Ti; ð9:45Þ
which when combined with Eq. (9.40) yields
�TcðtÞ ¼1
2WcpPðtÞ þ Ti: ð9:46Þ
Substituting Eqs. (9.45) and (9.46) into Eq. (9.36) yields an approxi-mate reactivity of
�ðtÞ � �o � Rf �f
�� ��þ 1
2Wcpð �f
�� ��þ �cj jÞ�
PðtÞ � Pð0Þ½ �: ð9:47Þ
234 Fundamentals of Nuclear Reactor Physics

Note, however, that the bracketed term is just equal to the magni-tude of the power coefficient defined by Eq. (9.33). Hence,
�ðtÞ � �o � �Pj j PðtÞ � Pð0Þ½ �: ð9:48ÞIn sufficiently slow transients, there will be a small initial
prompt jump in the power, but then it will come to equilibrium asthe rise in core temperatures compensates for �o, sending �ðtÞ!0.The new equilibrium power will be
Pð1Þ ¼ �o
�Pj jþ Pð0Þ: ð9:49Þ
If small increments of reactivity are added successively at a very slowrate, then we may replace �o with _�t, where _� is referred to as theramp rate, and obtain a reactor power that increases linearly withtime:
PðtÞ ¼ _�t
�Pj jþ Pð0Þ: ð9:50Þ
It cannot be stressed too strongly that the foregoing quasi-staticanalysis is only applicable to very small step reactivity insertions, orto exceedingly small ramp rates of reactivity addition. Otherwise,description of the transient requires the full set of Eqs. (9.36) through(9.42); Eqs. (9.49) and (9.50) only become applicable at long times, andonly in those cases where equilibrium can be reestablished.
We now proceed to results that cannot be predicted with thesimple quasi-static model. They require the full dynamics mode,Eqs. (9.36) through (9.42). Results obtained using parameters represen-tative of a large pressurized water reactor appear in Figs. 9.2 and 9.3.
In Fig. 9.2 step reactivities of 0.20 and 0.95 dollars, that is,�o ¼ 0:2� and �o = 0:95�, are inserted into a reactor operating at fullpower. They demonstrate, respectively, what one might see during anormal operational transient, and a transient—approaching promptcritical—that is typical of those analyzed for hypothetical accidents.Note that curve a, resulting from the 0.20 dollar transient, undergoesa small prompt jump, followed by a slight gradual decrease to anequilibrium value determined by Eq. (9.49). In curve b, for the 0.95dollar insertion, the reactor goes on to a very short period, and itexhibits a large power spike before the fuel gains enough temperaturefor negative feedback to negate the initial reactivity insertion. Oversuch short time spans heat does not have time to escape the fuel.Hence, at short times we may determine the fuel temperature bysetting the last term in Eq. (9.39) to zero, and integrating to obtain
�TfðtÞ �1
Mfcf
Z t
0Pðt0Þdt0 þ �Tfð0Þ; ð9:51Þ
Reactivity Feedback 235

where �TcðtÞ � �Tcð0Þ. Inserting this expression into Eq. (9.36) gives
�ðtÞ � �o ��f
�� ��Mfcf
Z t
0Pðt0Þdt0; ð9:52Þ
where �f is just equal to the prompt temperature coefficient given byEq. (9.27). Thus over time spans that are short relative to the thermaltime constant the feedback is proportional to the energy generated bythe transient. Over the longer term the power will gravitate to a valuedetermined by Eq. (9.49) only if the transient generates no boiling orother disruptions that invalidate the simple model presented here.
In practice, the rate at which reactivity is inserted often is asimportant as the total amount of reactivity available, whether thatrate results from the planned withdrawal of a control rod bank or froma hypothesized accident scenario in which poison is suddenly ejectedfrom the core. Indeed, because it is difficult to hypothesize physicalmechanisms that could inject large amounts of reactivity ‘‘instanta-neously’’ on time scales shorter than a prompt neutron lifetime, morerealistic analysis normally centers on the rate at which reactivitymight increase.
Figure 9.3 illustrates two power transients, both resulting frominserting reactivity at the very rapid rate of _� ¼ �, that is 1.0 dollar/s,but with different initial conditions. We apply the same model, simplyreplacing �o with _�t in the foregoing equations. In the absence of
0 0.5 1 1.5 20
2000
4000
6000
8000
2 ⋅ 104
1.8 ⋅ 104
1.6 ⋅ 104
1.4 ⋅ 104
1.2 ⋅ 104
1 ⋅ 104
time, Sec.
a
bP (t
), M
W
FIGURE 9.2 Power transients vs time initiated from full power for stepreactivity insertions. (a) 0.20 dollars insertion, (b) 0.95 dollars insertion.
236 Fundamentals of Nuclear Reactor Physics

temperature feedback both transients would pass through prompt criti-cal at one second. However, feedback does occur in both, and hence theseverities of the transients depend strongly on the initial conditions. Thedifferences become apparent by modifying short-time approximationgiven by Eq. (9.52) to apply to the ramp insertion of reactivity:
�ðtÞ � _�t��f
�� ��Mfcf
Z t
0Pðt0Þdt0; ð9:53Þ
which is reasonably applicable over the first one or two seconds, becausewe are using a fuel thermal time constant of ¼ 4:5 s. In curve a, thetransient is initiated at full power, with Pð0Þ= 3000 MW(t), allows nega-tive feedback to accumulate rapidly. Thus, �ðtÞ never approaches promptcritical, and consequently the rate of power increase is quite modest.Curve b, however, results from initiating the transient at hot zero power,with Pð0Þ= 1.0 MW(t). Hence the integral on the right of Eq. (9.53) buildsat a much slower rate, allowing the reactivity to exceed prompt criticalbefore being curtailed by negative reactivity feedback. A power spikethus ensues before sufficient energy is deposited in the fuel to bring thereactivity negative and terminate the transient.
The differences between curves a and b in Fig. 9.3 have strongimplications for reactor operations. While at reactor is at full power, areactor trip is normally initiated if the power rises by several percent.As Fig. 9.3 indicates, curve a reaches this point within a small
6 ⋅ 104
5 ⋅ 104
4 ⋅ 104
3 ⋅ 104
2 ⋅ 104
1 ⋅ 104
0 0.5 1 1.5 2
time, Sec.
a
b
P(t
), M
W
0
FIGURE 9.3 Power transients vs time for a reactivity insertion rate of1.0 dollars/s. (a) Initiated from full power, (b) initiated from low power.
Reactivity Feedback 237

fraction of a second. Thus if control rod banks are inserted withinthe next few seconds, the reactor is shut down following only anominal rise in power. At lower powers, however, trip levels can-not be maintained too close to the initial power, for if they were,there would be no room to maneuver power to meet increaseddemand. Even if there were, curve b indicates that there is littlepossibility of generating a trip signal until well after one secondinto the transient. Because the power spike lasts substantially lessthan a second, there is no possibility that control rods can beinserted fast enough to limit its consequences. For this and anumber of other reasons, the manipulation of reactors at very lowpower, where there is little or no negative temperature feedback,requires added care in order to eliminate the possibility of a so-called startup accident.
Bibliography
Bell, George I., and Samuel Glasstone, Nuclear Reactor Theory, VanNostrand-Reinhold, NY, 1970.
Duderstadt, James J., and Louis J. Hamilton, Nuclear Reactor Analysis,Wiley, NY, 1976.
Hetrick, David, Dynamics of Nuclear Systems, American Nuclear Society,1993.
Keepin,G.R.,Physicsof Nuclear Kinetics,Addison-Wesley,Reading, MA, 1965.Lamarsh, John R., Introduction to Nuclear Reactor Theory, Addison-
Wesley, Reading, MA, 1972.Lewis, E. E., Nuclear Power Reactor Safety, Wiley, NY, 1977.Ott, Karl O., and Robert J. Neuhold, Introductory Nuclear Reactor
Dynamics, American Nuclear Society, 1985.Schultz, M. A., Control of Nuclear Reactors and Power Plants, McGraw-
Hill, NY, 1961.Steward, H. B., and M. H. Merril, ‘‘Kinetics of Solid-Moderator Reactors,’’
Technology of Nuclear Reactor Safety, T. J. Thompson and J. G. Beckerley,Eds., Vol. 1, MIT Press, Cambridge, MA, 1966.
Problems
9.1. Table 4.2 displays the four factors for a pressurized water reactorat 300 K. Assume the reactor is fueled with UO2 fuel pins withdiameters of 1.1 cm and a density of 11.0 g/cm3.
a. Determine the fuel temperature coefficient and plot its valuebetween 300 and 1000 K.
b. Estimate the coolant temperature coefficient, assuming thatthe water has a coefficient of thermal expansion given by�m ¼ 0:004 K�1.
238 Fundamentals of Nuclear Reactor Physics

9.2. Consider a hypothetical reactor in which all of the materialshave the same volumetric coefficient of thermal expansion.Thus all of the nuclide densities decrease according to thesame ratio: N 0=N ¼ const:<1.
a. Show that the expansion with increased temperature has noeffect on k1.
b. Using the facts that the core mass, NV, remains constant, andthat M / N�1, show from Eq. (9.4) that the reactivity change
from expansion is negative, with a value ofdk
k¼ � 4
3PL
dV
V.
9.3. Assume a pressurized water reactor has the parameters specifiedin the example at the end of Section 8.3. Assume the core has athermal resistance of Rf = 0.50 �C/MW(t). If the reactor fuel andmoderator temperature coefficients are �f ¼ �3:2 � 10�5 �C�1 and�m ¼ �1:4 � 10�5 �C�1,
a. Determine the isothermal temperature coefficient.b. Determine the power coefficient.
9.4. At full power a 1000 MW(t) sodium-cooled fast reactor has coolantinlet and outlet temperatures of 350 and 500 �C and an average fueltemperature of 1150 �C. The fuel and coolant temperaturecoefficients are�f ¼ �1:8� 10�5=C and�c ¼ þ0:45� 10�5=C.
a. Estimate the core thermal resistance and the mass flow rate,taking for sodium cp = 1250 J/kg �C.
b. Estimate the temperature and power defects, assuming a‘‘cold’’ temperature of 180 �C.
9.5.*A 3000 MW(t) pressurized water reactor has the followingspecifications: core thermal resistance 0.45 �C/MW(t), coolantflow 68� 106 kg/hr, coolant specific heat 6.4� 103 J/kg �C. Thefuel temperature coefficient is
1
k
@k
@�Tf
¼ � 7:2 � 10�4ffiffiffiffiffiffiffiffiffiffiffiffiffiffiffiffiffiffiffiffi273þ �Tf
q ðCÞ�1
and the coolant temperature coefficient is
1
k
@k
@�Tc
¼ 30þ 1:5�Tc � 0:010�T2c
�� 10�6 ðCÞ�1:
a. Over what temperature range is the core overmoderated?b. What is the value of the temperature defect? Assume room
temperature of 21�C and an operating coolant inlet temperatureof 290 �C.
c. What is the value of the power defect?
Reactivity Feedback 239

9.6. A sodium-cooled fast reactor lattice is designed to have thefollowing properties: migration length 18.0 cm and a maximumpower density 450 W/cm3. Fractional sodium voiding results inthe following reactivity effects:
Dk1=k1 ¼ þ0:002; DM=M ¼ þ0:01:
Three bare cylindrical cores with height to diameter ratios of oneare to be built with power ratings of 300 MW(t), 1000 MW(t), and3000 MW(t).
a. Find H, the core height, B2, the buckling, and k1 for each ofthe cores.
b. For each of the three cores, determine the reactivity changecaused by the voiding.
c. Briefly interpret your results from part b.
9.7. For the reactor specified in problem 9.4 the power is maintainedat 1000 MW(t) while the following quasi-static changes are made:
a. The inlet temperature is slowly decreased by 10 �C.b. The flow rate is slowly increased by 10%.
For each of the cases determine by how much the reactivitymust be increased or decreased to keep the reactor running atconstant power.
9.8. In the prismatic block form of the graphite-moderated gas-cooled reactor the heat passes through the moderator beforereaching the coolant. Figure 4.1d shows such a configuration.Assume that R1 and R2 are the thermal resistances betweenfuel and moderator and between moderator and coolant,respectively, and that W and cp are the coolant mass flow rateand specific heat.
a. Develop a set of three coupled equations similar to those inEqs. (8.40) and (8.41) to model the steady state heat transfer.
b. Determine the isothermal temperature coefficient in terms ofthe fuel, moderator, and coolant temperature coefficients.
c. Determine the power coefficient in terms of the sametemperature coefficients.
9.9. Suppose a power reactor has negative values of �f and �c, the fueland coolant temperature coefficients. Using the thermal hydraulicmodel developed in Chapter 8,
a. Show that if very slow changes take place in the coolant inlettemperature and mass flow rate, but no control poisons areadded or subtracted, the power will undergo a quasi-staticchange of
240 Fundamentals of Nuclear Reactor Physics

dP ¼�f þ �c
�� �� P
2W2cpdW � dTi
� �
Rf þ1
2Wcp
� ��f þ
1
2Wcp�c
��������:
b. If the flow rate increases, does the power increase ordecrease? Why?
c. If the inlet temperature increases, does the power increase ordecrease? Why?
9.10.*Apply appropriate software to Eqs. (9.37) through (9.42) for auranium-fueled reactor. Use the following parameters, whichare typical of a large pressurized water reactor: � ¼ 50� 10�6 s,� ¼ �4:2� 10�5=oC, Mfcf ¼ 32� 106J=oC, and ¼ 4:5 s, andRfWcp1. With an initial steady state power of 10 MW,make a plot of the power versus time for the following:
a. A step reactivity increase of 10 cents.b. A step reactivity increase of 20 cents.c. A step reactivity decrease of 10 cents.d. A step reactivity decrease of 20 cents.
9.11.*Using the data and initial conditions from problem 9.10 andapplying appropriate software,
a. Determine what ramp rate of reactivity insertion will causea power spike with a peak power that exceeds 100 MW(t).
b. Determine what ramp rate of reactivity insertion will causea power spike with a peak that exceeds 1000 MW(t).
9.12.*Repeat problem 9.10 for a plutonium-fueled sodium-cooled fastreactor with the following parameters: � ¼ 0:5� 10�6s,� ¼ �1:8� 10�5=C, Mfcf ¼ 5:0� 106 J=C, and ¼ 4:0 s.
9.13.*A 2400 MW(t) plutonium sodium-cooled fast reactor has thefollowing characteristics:
W ¼ 14;000 kg=s; �f ¼ �1:8� 10�5=C;
Mfcf ¼ 13:5� 106 J=C; cp ¼ 1250 J=ðkg CÞ;� ¼ 0:5� 10�6 s; Ti ¼ 360 C; ¼ 4:0 s; �c ¼ þ0:45� 10�5=C:
Mccp ¼ 1:90� 106 J=C;
The reactor undergoes a loss of flow transient with WðtÞ ¼Wð0Þ=ð1þ t=toÞ, where to ¼ 5:0 s. Employ appropriate softwareto Eqs. (9.36) through (9.40) to analyze the transient: Make plotsof the reactor power, fuel, and coolant outlet temperatures for0< t< 20 s. (Hint: Note that ~ cannot be approximated by inthis problem.)
Reactivity Feedback 241

CHAPTER 10
Long-Term Core Behavior
10.1 Introduction
This final chapter addresses the longer term changes that occur overthe lifetime of a power reactor core. These are most directly tied to theevolution of the fuel composition and its by-products as a function oftime. They fall into three categories: (1) the buildup and decay ofradioactive products of fission, (2) fuel depletion, and (3) the buildupof actinides resulting from neutron capture in fissile and fertile mate-rials. For the most part these phenomena take place on time scales thatare substantially longer than those detailed thus far. Whereas fissionproducts have half-lives from seconds to decades, many of the moreimportant, such as xenon and samarium, have half-lives of severalhours or more. The effects of fuel depletion are measured on yet longertime scales, typically weeks, months, or years. These times are muchlonger than those dealt with in earlier chapters. In reactor kinetics wedealt with prompt neutron lifetimes that are small fractions of a secondand delayed neutron lifetimes of minutes of less. In energy transportwe most typically dealt with thermal time constants ranging fromseconds to minutes. These differences in time scale often serve tosimplify the analysis. For example, in reactor kinetics we need notconsider fuel depletion; it is much too slow a process. Conversely, infuel management studies, we can assume reactor kinetics effects to beinstantaneous and also neglect the effects of thermal transients.
10.2 Reactivity Control
As a power reactor operates the multiplication decreases with time asthe fuel is depleted and fission products accumulate. To analyze theseeffects we model a thermal reactor utilizing the four factor formula,given by Eq. (4.24), multiplied by the nonleakage probability toaccount for the core’s finite size:
k ¼ �Tf"pPNL: ð10:1Þ
243

The effects of fuel burnup and fission product buildup appear primar-ily in the thermal cross sections, and therefore affect �T and f. UtilizingEqs. (4.48) and (4.49) we may write these more explicitly to obtain
k ¼��f
f
�fa þ &ðVm=VfÞ�m
�
"pPNL; ð10:2Þ
where we hereafter drop the subscript T that indicates thermal crosssections.
Fuel depletion causes the fission cross section to become time
dependent, �ff ! �f
fðtÞ. Fuel depletion also causes the fuel absorption
cross sections to become time dependent, but in addition fissionproducts generated in the fuel add to the capture cross section. Thus�f
a ! �faðtÞ þ �fp
a ðtÞ. While fuel burns and fission products accumulate,of course, the reactor must be kept critical, that is, with k = 1. Toaccomplish this the control rods or other neutron poisons must bepresent at the beginning of core life; these are then extracted to main-tain criticality as power is produced. These poisons appear as a controlcapture cross section �con
� ðtÞ added to the denominator of Eq. (10.2).Thus as detailed in Chapter 9, to maintain criticality we must have
1 ¼��f
fðtÞ�f
aðtÞ þ �fp� ðtÞ þ &ðVm=VfÞ�m
� þ �con� ðtÞ
"pPNL: ð10:3Þ
Near universal practice, however, is to calculate the multiplicationwith all of the removable control poisons withdrawn from the core:
kðtÞ ¼��f
fðtÞ�f
aðtÞ þ �fp� ðtÞ þ &ðVm=VfÞ�m
�
"pPNL: ð10:4Þ
The excess reactivity is then defined as
�exðtÞ ¼kðtÞ � 1
kðtÞ � kðtÞ � 1; ð10:5Þ
where kðtÞ remains greater than one until the end of core life, atwhich time all of the movable control poison has been extracted.
Substantial amounts of excess reactivity at the time of reactorstartup allow for extended core life before refueling must take place.As indicated in Chapter 9, however, large excess reactivities createchallenges in the design of a reactor’s control system. Control rodsare the most common means for compensating for excess reactivity.However, in large, neutronically loosely coupled cores great caremust be taken to ensure that their presence does not distort the
244 Fundamentals of Nuclear Reactor Physics

flux distribution to the extent that excessive power peaking results.In pressurized water reactors dissolving a soluble neutron absorber inthe coolant and varying the concentration with time serves to com-pensate for excess reactivity. Burnable poisons embedded in the fuelor other core constituents offer an additional means of limitingexcess reactivity as well as mitigating localized power peaking.
Both fission product buildup and fuel depletion contribute to thedeterioration of reactivity, but on different time scales. Fission pro-ducts tend to build to a saturation value and then remain at constantconcentration as indicated in Section 1.7. The two fission productswith the largest capture cross section are xenon-135 and samarium-149, and these have half-lives measured in hours; they thereforecome to equilibrium within days following startup or shut down.Fuel depletion evolves more slowly over time spans typically mea-sured in weeks or months. Thus to great extent we can uncouple thetwo phenomena and treat them separately. We treat fission productsfirst, and then fuel depletion and the buildup of transuranic nuclei;we conclude with a brief treatment of burnable poisons.
Before proceeding we note that we may also analyze fast reactorswith a form similar to Eq. (10.4):
kðtÞ ¼��f
fðtÞ�f
aðtÞ þ ðVc=VfÞ�c�
PNL: ð10:6Þ
Here the factors ", p, and & are removed, and the cross sections areaveraged over all neutron energies, instead of only the thermal energyrange. We have also replaced m with c so the equation is applicable tofast as well as thermal reactors. The effects of the fission productbuildup, however, are much less significant in fast reactors since theyhave substantial capture cross sections only for thermal neutrons.
10.3 Fission Product Buildup and Decay
As Chapter 1 details, fission reactions on average produce two radio-active fission fragments, each undergoing one or more subsequentradioactive decays. Many of the resulting fission products have mea-surable thermal absorption cross sections. Thus their buildup createsneutron poisons. The poisons’ significance depends both on the fis-sion product production and decay rates. For as we saw in Chapter 1equilibrium is eventually reached if a radioisotope is produced at aconstant rate, for after several half-lives the rate of decay will equalthe rate of production. In tracking fission products in an operatingreactor, however, we must also take into account the rate of destruc-tion that results from neutron absorption.
Long-Term Core Behavior 245

Suppose we let NðtÞ be the concentration of a particular fis-sion product isotope at a time t following reactor startup, andspecify the fission rate as ��f�. If some fraction �fp of the fissionsresults in the production of the fission product, then the rate ofproduction will be �fp
��f�. The fission product will decay away ata rate �NðtÞ, where � is the isotope’s decay rate. In addition, if theisotope has a thermal neutron absorption cross section of �a, itwill undergo destruction at a rate of �aNðtÞ�. Thus its inventorywill grow at a net rate of
d
dtNðtÞ ¼ �fp
��f�� �NðtÞ � �aNðtÞ�: ð10:7Þ
Note that both of the loss terms are proportional to NðtÞ:Thus wemay write this equation in the compacted form
d
dtNðtÞ ¼ �fp
��f�� �0NðtÞ; ð10:8Þ
where
�0 ¼ �þ �a�; ð10:9Þ
and refer to the related quantity t01=2 ¼ 0:693=�0 as the effective half-life.Since Eq. (10.8) has the same form as Eq. (1.39), we employ the
same integrating factor technique to obtain
NðtÞ ¼�fp
��f�
�01� expð��0tÞ½ �: ð10:10Þ
The concentration of each fission product depends strongly on thetime t that the reactor has been operating, relative to the values of �0
and �a�. If �0t� 1 then the concentration will increase linearly withtime: NðtÞ � �fp
��f�t. However at longer times, when �0t� 1, theconcentration will reach a saturation value of �fp
��f���0, and increase
no further.Note that a reactor’s inventory of those isotopes that have reached
saturation is proportional to ��f� and therefore to the power at whichthe reactor is operating, whereas the inventory of those for which�0t� 1 is proportional to ��f� t and therefore to the total energy thathas been produced by the reactor. Thus iodine-131 quickly reaches itssaturation value since it has a half-life of 8.0 days; its inventory there-after will be proportional to the reactor power. In contrast, cesium-137,with a half-life of 30.2 years, increases linearly with time over the fewyears that fuel is in the reactor, and its inventory is proportional to thetotal energy that has been produced from the fuel.
246 Fundamentals of Nuclear Reactor Physics

Xenon Poisoning
The most substantial fission product effects on reactor operationcome from the exceedingly large absorption cross section of theisotope xenon-135, which measures 2.65� 106 b. Xenon is producedboth directly and from the decay of other fission products, mostimportantly iodine-135. The sequence of beta decays leading toxenon may be summarized as
135
52Te
fission; �T
#�!�
11s
135
53I
fission; �I
#�!�
6:7hr
135
54Xe
fission; �X
#�!�
9:2hr
135
55Cs �!
�
2:3�106yr
135
56Ba;
ð10:11Þ
where we have included the half-lives. In dealing with time spansmeasured in hours, we may assume the tellurium-135 decay isinstantaneous and combine the yields of tellurium and iodine iso-topes into �I; Table 10.1 gives values of �I and �X. Likewise, we mayneglect the decay of cesium since its half-life is more than a millionyears.
With these simplifications, we need just two rate equations. Let Iand X denote the concentrations of the iodine and xenon isotopes. Wethen have
d
dtIðtÞ ¼ �I
��f���IIðtÞ ð10:12Þ
and
d
dtXðtÞ ¼ �X
��f�þ �IIðtÞ � �XXðtÞ � �aXXðtÞ�: ð10:13Þ
No neutron absorption term, �aIIðtÞ�, appears in the first equationsince even at high flux levels iodine absorption is insignificant com-pared to its decay.
TABLE 10.1Thermal Fission Product Yields in Atoms per Fission
Isotope Uranium-235 Plutonium-239 Uranium-233
135I 0.0639 0.0604 0.0475135Xe 0.00237 0.0105 0.0107149Pm 0.01071 0.0121 0.00795
Source: M. E. Meek and B. F. Rider, ‘‘Compilation of Fission Product Yields,’’ General ElectricCompany Report NEDO-12154, 1972.
Long-Term Core Behavior 247

Following reactor start-up both iodine and xenon concentrationsbuild from zero to equilibrium values over a period of several half-lives. Since the half-lives are in hours, after a few days equilibrium isachieved. The equilibrium concentrations result from setting thederivatives on the left of Eqs. (10.12) and (10.13) to zero:
Ið1Þ ¼ �I��f���I ð10:14Þ
and
Xð1Þ ¼ð�I þ �XÞ��f�
�X þ �aX�: ð10:15Þ
Note that for very high flux levels, where �aX�� �X, neutron absorp-tion dominates over radioactive decay, and the maximum xenonconcentration possible is ð�I þ �XÞ��f
��aX.
Next consider what happens following reactor shutdown. Let Io
and Xo be the concentrations of iodine and xenon at the time ofshutdown. If the reactor is put on a large negative period, to firstapproximation we may assume that the shutdown is instantaneouscompared to the time spans of hours over which the iodine andxenon concentrations evolve. This assumption allows us to deter-mine the isotopes’ concentrations by setting � ¼ 0 in Eqs. (10.12) and(10.13). The solution of Eq. (10.12) yields the exponential decay of theiodine,
IðtÞ ¼ Io expð��ItÞ; ð10:16Þ
where t is now taken as the time elapsed since shutdown. Insertingthis expression into Eq. (10.13), with � ¼ 0, yields
d
dtXðtÞ ¼ �IIo expð��ItÞ � �XXðtÞ: ð10:17Þ
Employing the integrating factor technique detailed in Appendix Awe obtain a solution of
XðtÞ ¼ Xoe��Xt þ �I
�I � �XIo e��Xt � e��It� �
: ð10:18Þ
The first term results from the decay of xenon. The second arisesfrom the production of xenon—caused by iodine decay—followingshutdown and then the subsequent decay of that xenon. If the reactorhas been running for several days—long enough for iodine and xenon
248 Fundamentals of Nuclear Reactor Physics

to reach equilibrium—we may replace Io and Xo by the values of Ið1Þand Xð1Þ given by Eqs. (10.14) and (10.15):
XðtÞ ¼ ��f�ð�
Iþ �
XÞ
�X þ �aX�e��Xt þ �
I
�I � �Xe��Xt � e��It� �� �
: ð10:19Þ
The effect on reactivity appears as a contribution of �aXXðtÞ tothe fission product term in the denominator of Eq. (10.4). It causes anegative reactivity that to a first approximation is proportional to�aXXðtÞ. Figure 10.1 contains plots of the negative reactivity versustime for a representative thermal reactor that has operated at fourdifferent flux levels. The curves provide insight into the challengescaused by xenon following shutdown. For a sufficiently largeoperating flux the xenon concentration actually rises followingshutdown; for uranium-fueled reactors that flux is approximately4�1011 n/cm2/s. The peak concentration occurs at 11.3 hours aftershutdown. Since xenon has a large absorption cross section, this
10ta tb20
Time after shutdown, hr
Maximum reserve reactivity
Dead time
φ T = 5 × 10¹⁴
φ T = 1013
φ T = 1014
Neg
ativ
e re
activ
ity
30 40 50 60 7000
0.1
0.2
0.3
0.4
0.5
0.6
φ T = 5 × 10¹³
FIGURE 10.1 Xenon-135 reactivity transient following shutdown fromfour different flux levels (adapted from Introduction to Nuclear ReactorTheory, 1972, by John R. Lamarsh, Copyright by the American NuclearSociety, La Grange Park, IL).
Long-Term Core Behavior 249

increase causes a loss in reactivity that must be overcome if thereactor is to be restarted. Figure 10.1 also depicts a dead time overwhich the reactor could not be restarted if 0.2 is the reserve of excessreactivity at room temperature provided by the control system.
Xenon poisoning can cause difficulties at other times. If a reac-tor is operated in a periodic manner, for example, at lower power atnight than in the daytime to follow electrical load demand, the timelag in the xenon buildup and decay must be compensated by the useof periodic insertion of control poisons. In large, neutronically looselycoupled cores, where control rod effects are localized, xenon may giverise to space–time oscillations. If these are not adequately damped,they may result in increased power peaking in local areas of the coreand violate thermal limitations on local power density.
Samarium Poisoning
A second fission product with a large thermal absorption cross sec-tion is samarium-149. Although smaller than xenon, its cross sectionof 41,000 b must be taken explicitly into account. Samarium isstable, arising from the fission product chain
149
60Nd
fission; �N
#�!�
1:7hr
149
61Pm �!
�
53hr
149
62Sm: ð10:20Þ
Since the half-life of neodymium is much shorter than that of pro-methium, to a good approximation we can assume that the promethiumis produced directly by fission; Table 10.1 gives the value of �P. Thus
d
dtPðtÞ ¼ �P
��f�� �PPðtÞ ð10:21Þ
and
d
dtSðtÞ ¼ �PPðtÞ � �aSSðtÞ�: ð10:22Þ
The saturation activities reached after several half-lives of reac-tor operations result from setting the derivatives on the left of theseequations to zero: Pð1Þ ¼ �P
��f���P and Sð1Þ ¼ �P
��f
��aS. The solu-
tions of Eqs. (10.21) and (10.22) following shutdown yield
PðtÞ ¼ Po expð��PtÞ ð10:23Þ
250 Fundamentals of Nuclear Reactor Physics

and
SðtÞ ¼ So þ Po 1� e��Pt� �
; ð10:24Þ
where t is the time elapsed since shutdown. Provided the saturationvalues have been reached by the time of shutdown, we can combineequations to obtain
SðtÞ ¼�P
��f
�aSþ�P
��f�
�P1�e��Pt� �
: ð10:25Þ
Analogous to xenon poisoning, samarium causes a reactivity lossthat is approximately proportional to �aSSðtÞ. Figure 10.2 illustratesthe reactivity loss for the same set of reactor parameters used inFig. 10.1. The samarium concentration rises following shutdown,and at long times is greater than the saturation value by an amount
φ T = 5 × 10¹⁴
φ T = 5 × 10¹³
φ T = 1014
φ T = 1013
100 200
Time after shutdown, hr
Neg
ativ
e re
activ
ity
30000
0.01
0.02
0.03
0.04
0.05
FIGURE 10.2 Sumarium-149 reactivity transient following shutdownfrom four different flux levels (adapted from Introduction to NuclearReactor Theory, 1972, by John R. Lamarsh, Copyright by the AmericanNuclear Society, La Grange Park, IL).
Long-Term Core Behavior 251

�P��f���P. Thus to restart the reactor after an extended shutdown
sufficient additional reactivity must be available to overcome theadded samarium that resulted from the promethium decay.
10.4 Fuel Depletion
Heretofore we have written the power density simply as P000 ¼ ��f�.To examine the long-term behavior of a power reactor core, however,we must divide this term into its component parts. Most commonreactor fuels are composed of either natural or partially enricheduranium. In fewer cases the fresh fuel may be a mix of plutoniumand uranium. The contribution of uranium-238 to fission is quitesmall in most reactors and we ignore it for purposes of illustration.From Eq. (1.28) we observe, however, that if fertile material such asuranium-238 is present in substantial amounts, it will capture neu-trons and then undergo radioactive decay to become a fissile material,which may then undergo fission. Thus for a uranium-fueled reactorwe must consider fission in both uranium-235 and plutonium-239(which according to the convention introduced in Section 1.6 we referto as ‘‘25’’ and ‘‘49,’’ respectively). Thus accounting for power produc-tion from the two fissile isotopes, we have
P000 ¼ � �25f N25ðtÞ þ �49
f N49ðtÞh i
�ðtÞ: ð10:26Þ
Note that since the isotopic concentrations change with time as thefissile material is depleted, the flux must also be time dependent,gradually increasing to allow the reactor power to remain constantover long periods of time.
Fissionable Nuclide Concentrations
Rate equations similar to those discussed earlier for the buildup anddecay of fission products govern the evolution of the concentrationsof fissile and fertile materials. For the uranium isotopes,
d
dtN25ðtÞ ¼ �N25ðtÞ�25
a �ðtÞ; ð10:27Þ
and
d
dtN28ðtÞ ¼ �N28ðtÞ�28
a �ðtÞ: ð10:28Þ
252 Fundamentals of Nuclear Reactor Physics

In contrast, the rate equation for plutonium must include a produc-tion as well as a destruction term since it is the product of the decaychain given in Eq. (1.28):
nþ 238
92U!239
92U �!
23m
239
93Np �!
2:36d
239
94Pu: ð10:29Þ
The uranium-238, which constitutes a large fraction of the fuelnuclei in most reactors, captures neutrons and undergoes decay first toneptunium and then to plutonium-239. Since the half-lives of theseprocesses are short compared to the weeks, months, or years over whichfuel depletion studies are made, little accuracy is lost by assuming thatthe plutonium appears instantaneously, following neutron capture byuranium-238. Conversely, although plutonium is radioactive, its half-life is so long that the fraction of plutonium that decays away during thelife of a reactor core is negligible. Thus we assume that plutonium iscreated immediately upon capture of a neutron in uranium-238 and isdestroyed only by neutron absorption, which either causes fission or thecreation of plutonium-240. In either case the rate equation is
d
dtN49ðtÞ ¼ �28
� �ðtÞN28ðtÞ � �49a �ðtÞN49ðtÞ: ð10:30Þ
We solve the three rate equations for uranium and plutonium byfirst integrating Eq. (10.27) directly to obtain
N25ðtÞ ¼ N25ð0Þe��25a �ðtÞ: ð10:31Þ
where the neutron fluence is defined by
�ðtÞ ¼Z t
0�ðt0Þdt0: ð10:32Þ
In the same manner, the solution of Eq. (10.28) is
N28ðtÞ ¼ N28ð0Þe��28a �ðtÞ: ð10:33Þ
Since the absorption cross section of uranium-238 is quite small com-pared to the fission cross sections appearing in these equations, however,we may assume that the change in its concentration can be neglected,
N28ðtÞ�N28ð0Þ; ð10:34Þ
without substantial loss of accuracy. Applying this approximationreduces Eq. (10.30) to
d
dtN49ðtÞ ¼ �28
� �ðtÞN28ð0Þ � �49a �ðtÞN49ðtÞ; ð10:35Þ
Long-Term Core Behavior 253

which is easily solved using the integrating factor technique ofAppendix A. Assuming no plutonium is present at the beginning ofreactor life, so that N49ð0Þ ¼ 0, we obtain
N49ðtÞ ¼ �28� N28ð0Þ e��
49a �ðtÞ
Z t
0e�
49a �ðt0Þ�ðt0Þdt0: ð10:36Þ
Using Eq. (10.32) and the differential transformation d� ¼ �ðt0Þdt0,the integral may be evaluated to yield
N49ðtÞ ¼�28�
�49a
N28ð0Þ 1� e��49a �ðtÞ
� �: ð10:37Þ
Figure 10.3 shows the long-term evolution of the slightlyenriched fuel typical of that in water-cooled reactors. In addition tothe two fissile nuclides treated in our simple model, the figure shows
235U
239Pu
236U
240Pu
241Pu
242Pu
0 1.00.5 1.5 2.0 2.5 × 102110–3
10–2
10–1
1.0
2
4
2
4
6
2
4
6
2
4
6
Fluence, Neutrons/cm2
Ato
mic
per
cent
in fu
el
Fiss
ion products
FIGURE 10.3 Change in fuel composition vs neutron fluence (adaptedfrom ‘‘FUELCYC, a New Computer Code for Fuel Cycle Analysis,’’ Nucl.Sci. Eng., 11, 386 (1961), by M. Benedict et al., Copyright by the AmericanNuclear Society, La Grange Park, IL).
254 Fundamentals of Nuclear Reactor Physics

the buildup of the higher isotopes of plutonium and uranium thatresult from successive neutron captures. A quantity that is often usedto evaluate fuel performance is the conversion ratio, defined as theratio of fissile material created to fissile material destroyed. If theratio is greater than one, it is often referred to as the breeding ratio,for then the reactor is creating more fissile material than it is con-suming. In our simplified model, which includes only uranium andplutonium-239, the conversion ratio is
CRðtÞ ¼�28� N28ð0Þ
�25a N25ðtÞ þ �49
a N49ðtÞ: ð10:38Þ
This equation indicates that increased fuel enrichment results in adecreased value of CR(0), the initial conversion ratio. Thereafter theplutonium isotopes build into the core. As this happens an increasingfraction of the fission comes from plutonium. By the time the right-hand side of Fig. 10.3 is reached more than one-third of the fissilematerial in the core is plutonim-239.
The effect of the depletion of uranium-235 and the buildup ofplutonium on reactivity is illustrated by writing the fuel cross sec-tions in Eq. (10.4) in terms of the nuclide densities:
kðtÞ ¼��25
f N25ðtÞ þ ��49f N49ðtÞ
�25a N25ðtÞ þ �49
a N49ðtÞ þ �28� þ �fp
� ðtÞ þ &ðVm=VfÞ�ma
"pPNL:
ð10:39Þ
Generally, the depletion of uranium-235 and the buildup of fissionproducts will overwhelm the buildup of plutonium-239. Thus thevalue of the multiplication will decrease with time. The net effect ofthese competing phenomena takes the form similar to that shown inthe example labeled ‘‘no burnable poison’’ in Fig. 10.4.
Burnable Poisons
In pressurized water reactors dissolving a soluble neutron absorber inthe coolant and varying the concentration with time compensate formuch of the excess reactivity. Burnable poisons embedded in the fuelor other core constituents offer an additional means of limitingexcess reactivity as well as mitigating localized power peaking.
A burnable poison is an isotope possessing a large neutron capturecross section that is embedded in the fuel or other core constituent tolimit excess reactivity early in core life. Boron and gadolinium are often
Long-Term Core Behavior 255

used for this purpose. A burnable poison’s concentration is limited by arate equation similar to those above:
d
dtNBPðtÞ ¼ �NBPðtÞ�BP
� �ðtÞ; ð10:40Þ
which has a solution of
NBPðtÞ ¼ NBPð0Þe��BP� �ðtÞ: ð10:41Þ
Its effect is apparent by adding its capture cross section to thedenominator of Eq. (10.39):
kðtÞ ¼��25
f N25ðtÞ þ ��49f N49ðtÞ
�25a N25ðtÞ þ �49
a N49ðtÞ þ �28� þ �fp
� ðtÞ þ &ðVm=VfÞ�ma þ �BP
� NBPðtÞ"pPNL:
ð10:42Þ
Because a burnable poison’s capture cross section is large comparedto the others appearing in this expression, the exponential inEq. (10.41) decays rapidly, causing its effect on the multiplication tobe concentrated early in core life. The curve marked ‘‘uniformlydistributed boron’’ in Fig. 10.4 illustrates this point. Burnable poisonsare selected such that the isotope resulting from neutron capture hasa small capture cross section, thus avoiding subsequent poisoning ofthe chain reaction.
2001.00
1.06
1.02
1.10
1.14
0 400
Time at full power, days
Lumped boron
Uniformlydistributedboron
No burnable poison
Mul
tiplic
atio
n fa
ctor
600 800 1000
FIGURE 10.4 Effect of burnable poisons on reactor multiplication (adaptedfrom ‘‘Kinetics of Solid-Moderator Reactors,’’ by H. B. Steward and M. H.Merrill, Technology of Nuclear Reactor Safety, Vol. 1, 1965, T. J. Thompsonand J. G. Beckerley, Eds. Countesy of the MIT Press).
256 Fundamentals of Nuclear Reactor Physics

Further leveling of the excess reactivity curve can be accom-plished by concentrating the burnable poison in lumps instead ofdistributing it uniformly across the fuel. With such lumping of astrong absorber, spatial self-shielding, similar to that discussed forresonance capture in Chapter 4, takes place. Consequently, neutroncapture in the burnable poison is limited early in the fuel life andresults in a smoothing of the poison’s suppression of excess reactivityover a longer time period. As the curve marked ‘‘lumped boron’’ in Fig.10.4 illustrates, lumping the poison further minimizes the maximumexcess reactivity, and therefore facilitates the design of the controlsystem. Clever design of such lumping can also serve to flatten thespatial distribution of the power density over the life of a core.
10.5 Fission Product and Actinide Inventories
Thus far we have considered the production of fission products andactinides as they affect the reactivity of a power reactor core. Theradioactive materials generated during the operation of power reac-tors also are of concern for the potential health hazards that theyrepresent. We briefly allude to the two basic categories of concern:preventing the radioactive materials from reaching the environmentshould a catastrophic accident take place while the reactor is operat-ing, and providing for long-term disposal of the radioactive inventoryfollowing removal of the fuel from the reactor. The inventories, half-lives, chemical characteristics, and other properties of the isotopesthat are most important differ depending on whether reactor safetyduring core lifetime or long-term disposal of radioactive waste fol-lowing shutdown is under consideration.
During the core lifetime fission product concentrations buildand reach saturation levels according to their yields and characteris-tic half-lives. To recapitulate earlier discussions, following severalhalf-lives the inventory of a fission product reaches its saturationvalue. A reactor’s inventory of isotopes with half-lives short com-pared to the operational life of its fuel will be proportional to thereactor’s power after it has been operating for some length of time.Conversely, isotopes with half-lives that are long compared to thereactor core life—say, a decade or more—build linearly with time andresult in an inventory that is proportion to the amount of energy thatthe reactor has produced.
Reactor safety is concerned with preventing the accidental releasefission products or other radioactive materials to the environment.Fission products with short as well as long half-lives must be safe-guarded. Equally important are the quantities in which they are pro-duced, the volatility of the chemical forms that they take, their abilityto penetrate the reactor containment and other engineered barriers
Long-Term Core Behavior 257

against their release to the environment, and finally the mechanismsby which they cause biological damage. Radioiodine, the noble gases,strontium, and cesium are among the most important isotopes to bescrutinized in the analysis of hypothesized reactor accidents.
In contrast, only isotopes with long half-lives are of concern forwaste disposal, for those with half-lives of a few years or less areeasily stored until their radioactivity is exhausted. The more persis-tent fission products have half-lives of several decades, and thesemust be isolated for hundreds of years. The actinides—plutonium,neptunium, americium, and others produced by successive capture ofneutrons in uranium and its by-products during reactor operation—present the truly long-term challenges in waste disposal. Although
Total (actinides)
Total (fission products)
244Cm
241Am
240Pu
243Am
237Np
238Pu
229Th
102
103
5
5
101
5
100
5
10–1
5
10–2
10–3
101 102 103 104 105 106
Time, y
Ris
k fa
ctor
107
5
FIGURE 10.5 Time dependence of the risk factor for wastes from spentfuel, stored without reprocessing, normalized to the uranium ore needed toproduce the PWR fuel from which it came (adapted from ‘‘Formation ofRecycling of Minor Actinides in Nuclear Power Stations,’’ by L. Koch, inHandbook of the Physics of Chemistry of Actinides, Vol. 4, 1986. Courtesyof Elsevier Science, Amsterdam).
258 Fundamentals of Nuclear Reactor Physics

produced in smaller quantities than fission products, actinides havehalf-lives measured in thousands of years or more. Figure 10.5 showsthe radiotoxicity from discharged fuel, relative to that of uraniumore. Note that for time spans of more than a century following reactorshutdown virtually all of the radioactivity results from actinidesrather than from fission products. Increasing attention is being direc-ted toward reprocessing reactor fuel in order to recycle it, fissioningmore of the plutonium created from uranium-238 capture andincreasing greatly the quantity of energy produced relative to themass of long half-life radioactive waste created.
Bibliography
Benedict, M., et al., ‘‘FUELCYC, a New Computer Code for Fuel CycleAnalysis’’, Nucl. Sci. Eng., 11, 386 (1961).
Bonalumi, R. A., ‘‘In-Core Fuel Management in CANDU-PHR Reactors,’’Handbook of Nuclear Reactors Calculations, II, Yigan Ronen, Ed., CRCPress, Boca Raton, FL, 1986.
Cember, H., ‘‘Introduction to Health Physics, 3rd ed., McGraw-Hill, NY, 1996.Cochran, Robert G., and Nicholas Tsoulfanidis, The Nuclear Fuel Cycle:
Analysis and Management, 2nd ed., American Nuclear Society,La Grange Park, IL, 1999.
Koch, L., ‘‘Formation and Recycling of Minor Actinides in Nuclear PowerStations,’’ in Handbook of the Physics and Chemistry of Actinides,Vol. 4, A. J. Freeman and C. Keller, Eds., Elsevier Science Publishers,Amsterdam, 1986.
Lamarsh, John R., Introduction to Nuclear Reactor Theory, Addison-Wesley,Reading, MA, 1972.
Levine, Samuel H., ‘‘In-Core Fuel Management for Four Reactor Types,’’Handbook of Nuclear Reactors Calculations, II, Yigan Ronen, Ed., CRCPress, Boca Raton, FL, 1986.
Lewis, E. E., Nuclear Power Reactor Safety, Wiley, NY, 1977.Salvatores, Max, ‘‘Fast Reactor Calculations,’’ Handbook of Nuclear Reac-
tors Calculations, III, Yigan Ronen, Ed., CRC Press, Boca Raton, FL, 1986.Stacey, Weston M., Nuclear Reactor Physics, Wiley, NY, 2001.Steward, H. B., and M. H. Merril, ‘‘Kinetics of Solid-Moderator Reactors,’’
Technology of Nuclear Reactor Safety, T. J. Thompson and J. G. Beckerley,Eds., Vol. 1, MIT Press, Cambridge, MA, 1966.
Turinsky, Paul J., ‘‘Thermal Reactor Calculations,’’ Handbook of NuclearReactors Calculations, III, Yigan Ronen, Ed., CRC Press, Boca Raton, FL,1986.
Problems
10.1. Prove that for a reactor operating at a very high flux level, themaximum xenon-135 concentration takes place at approximately11.3 hours following shutdown.
Long-Term Core Behavior 259

10.2. Make a logarithmic plot of the effective half-life of xenon-135over the flux range of 1010 � � � 1015n=cm2=s.
10.3. A thermal reactor fueled with uranium has been operating atconstant power for several days. Make a plot of the ratio ofconcentration of xenon-135 to uranium-235 atoms in the reactorversus its average flux. Determine the maximum value that thisratio can take.
10.4. A pressurized water reactor at full power has an average powerdensity of �P000 ¼ 80 MW=m3 and a peaking factor of Fq ¼ 2:0.After the reactor has operated for several days,
a. What is the average xenon concentration?b. What is the maximum xenon concentration?c. What is the average samarium concentration?d. What is the maximum samarium concentration?
(Assume a fission cross section of ��f ¼0.203 cm1.)
10.5. A reactor is started up and operated at constant power. SolveEqs. (10.12) and (10.13) and determine the iodine and xenonconcentration as a function of time.
10.6. Samarium-157 is produced at a rate of 7.0� 105 atoms/fission. Itthen undergoes decay: 157
62 Sm �!0:5 min
15763 Eu �!
15:2 hr
15764 Gd. Although
the absorption cross section of samarium and europium arenegligible, the thermal absorption cross section of gadoliniumis 240,000 b. Suppose that a reactor operates at a power densityof 100 MW/m3 and a flux level of 8.0� 1012 n/cm2/s.
a. Solve the decay equations for GðtÞ, the atom density ofgadolinium, at a time t following reactor startup.
b. Evaluate Gð1Þ.c. If the reactor has been operated for several weeks and then is
shut down, what is the concentration of gadolinium, afterthe reactor has been shut down for several weeks?(Assume that the energy produced per fission is 3.1� 10�11 W s)
10.7. Verify Eqs. (10.18) and (10.19).
10.8. A reactor has operated for several weeks at constant power,reaching the equilibrium concentrations of iodine and xenonIo and Xo given by Eqs. (10.14) and (10.15). At t = 0 the power iscut back, dropping the flux level from � to ~�. Solve Eqs. (10.12)and (10.13) and show that the iodine and xenon concentrationsfollowing the power reduction are
IðtÞ ¼ �I
�I
��f~�þ ð�� ~�Þe��It
260 Fundamentals of Nuclear Reactor Physics

and
XðtÞ ¼ ð�Iþ �
XÞ
�X þ �aX���f�e�ð�Xþ�aX
~�Þt þ ð�Iþ �
XÞ
�X þ �aX~�
��f~� 1� e�ð�Xþ�aX
~�Þth i
þ �I
�X � �1 þ �aX~�
��fð�� ~�Þ e��It � e�ð�Xþ�aX~�Þt
h i:
10.9. Under load following conditions, a reactor operates eachday at full power for 12 hours, followed by a shutdown of12 hours. Calculate the iodine concentration, I(t), over a24 hour time span. Use the periodic boundary conditionI(24 hr) = I(0).
10.10. Under load following conditions, a reactor operates each dayat full power for 12 hours, followed by a shutdown of 12 hours.Calculate the promethium concentration, P(t), over a 24 hourtime span. Use the periodic boundary condition P(24 hr) = P(0).
10.11. Taking into account neutron capture in plutonium-239 andplutonium-240,
a. Write a rate equation for the concentration of plutonium-240.
b. Solve the equation from part a using Eq. (10.37) for theconcentration of plutonium-239.
10.12. Neptunium-238 has a thermal absorption cross section of33 b, which we have neglected in deriving Eq. (10.30). In areactor operating at a flux level of � ¼ 5� 1014 n=cm2=s,what fraction of the neptunium will capture a neutroninstead of decaying to plutonium-239?
10.13. Consider uranium fuel in a thermal reactor with an initialenrichment of 4%.
a. What is the conversion ratio (CR) at the beginning of core life?b. After half of the uranium-235 has been burned, what is the
conversion ratio?c. After half of the uranium-235 has been burned, what
fraction of the power is being produced from plutonium-239?
Hint: Make use of the approximations in Eqs. (10.31) and (10.37).
10.14. Thorium-232 is a fertile material that may be transmutedto fissile uranium-233 through the following reaction:232
90Th �!n 233
90Th �!
22 min
233
91Pa �!
27:4 days
233
92U, where the half-lives
are indicated. Assume that a fresh core is put into operation
Long-Term Core Behavior 261

containing only thorium-232 and uranium-235. Thereafterneutron capture in thorium takes place at a constant rate
of �tha
��.
a. Assuming that the half-life of233
90Th can be ignored,
write down and solve the differential equation for the
concentration of233
91Pa.
b. Write down and solve the differential equation for the
concentration of233
92U:
(Assume N02ðtÞ ¼ N02ð0Þ and �ðtÞ ¼ �ð0Þ:)
262 Fundamentals of Nuclear Reactor Physics

Index
Absorption, 42Actinides, 243, 257–9Albedos, 147Alpha and Beta particles, 5, 10, 11Americium, 258Atom density, 73, 81, 110, 225Atomic enrichment, 35Atomic mass, 7, 15, 18, 20, 49, 50,
51, 92, 94Avogadro’s number, 19, 33Axial buckling, 182Axial distribution:
cosine, 193power, 207
Axial reflector, 181, 184
Bessel functions, 149, 171, 173, 184,204, 269, 270
Billiard ball collision, 37, 41Binding Energy, Curve of, 7Boiling water reactors (BWRs), 88,
90, 91Boltzmann constant, 39Boron and gadolinium, 255Boron poison, concentration
of, 109Boundary condition, 142, 144–7,
149–52, 159, 168, 169, 171, 182,191, 192, 268
Breit-Wigner formula, 44, 45Burnable poisons, 91, 186, 245,
255, 256
CANDU reactors, 92–4Calandria, 92Carbon dioxide-cooled graphite-
moderated systems, 92Cartesian geometries, 149Cesium, 246, 247, 258
decay of, 247
Chain reaction, 12, 13, 15, 17, 18,29, 57–9, 62, 69, 85, 87, 91, 115,121, 124, 129, 133, 256
time-independent, 121Charge, conservation of, 3Circular fuel assembles, 86Coal-fired power plant, 2Composite coefficients, 227Control Poisons, 186Coolant channels, 81, 85, 98Coolant temperature, 90, 93,
205–10, 212, 213, 223, 227–9,233, 234
coefficients, 227transients, 213
Coolant velocity, 209, 210Core power distribution, 199Core-averaged power density, 200,
202, 210Cosmic rays, 18Coulomb repulsion, 8, 9Critical reactor, 160Criticality, definition of, 120, 122Cross section:
calculation, 36energy dependence, 40measurements, 80
Crystal lattices, 80Cylindrical fuel element, 85, 93,
100, 205, 206, 208, 279Cylindrical geometry, 149, 173,
181, 202, 269, 280
Dancoff correction, 105Decay chains, 21Definite integrals, 265Delayed neutrons, kinetic effects
of, 212Derivatives and Integrals, 265Deuterium, 5, 9, 41, 51, 80, 91, 92
287

Differential Equations, 267, 268Diffusion:
approximation, 142, 153, 276coefficient, 142, 183, 277equation, time-independent, 167length, 154theory, 153
Divergence theorem, 187Doppler, 45, 104, 110, 134, 221,
223–5, 227, 228importance of, 45
Eigenvalues and eigenfunctions,168
Elastic collisions, 50, 51, 177Electrical repulsion of the nuclei, 8Electromagnetic radiation, 4Endothermic reactions, 3, 6, 7Energetics, 5Energy averaged reaction rates, 73Energy degradation, 48Energy from nuclear power, 1Energy release and dissipation, 10Energy self-shielding, 68Energy transport, 199
core power distribution, 199–200finite cylindrical core, 200–203uniform cylindrical core, 203–204
heat transport, 204heat source characterization,
204–205pressurized water reactor,
209–211steady state temperatures,
205–208thermal transients, 211–12
coolant temperature transients,213–15
fuel temperature transient,212–13
Escape probability, 100, 102, 104,105, 108–10, 175, 224, 226
Excess reactivity, 230Excitation energy, 37, 41, 42Exothermic reactions, 3, 6, 7
Fast and thermal reactor, 72Fast fission factor, 101Fast neutrons, 65
Fast reactors, 94fuel, 94lattices, 94multiplication, 97temperature coefficients, 227
Fertile isotopes, 16, 17Fick’s law, 140, 142, 155, 277Finite cylindrical core, 170, 200Finite multiplying systems, 119First-order perturbation
approximation, 188Fissile material, 16–18, 47, 59, 60,
63, 90, 252, 255Fission:
energy, 51, 73, 177fragments, 9–11, 13, 14, 20, 245neutrons, 12, 17, 38, 39, 40, 58,
61, 65, 67, 72, 75, 81, 100,101, 106, 115, 118, 119, 123,130, 140, 141, 178
products, 9–11, 13–15, 18,20, 115, 123, 124, 126,127, 232, 243–5, 247, 252,257–9
radioactive products of, 243reactions, 1, 9, 78, 99, 118, 245
Fissionable nuclide concentrations,252
Flux:averaged cross section, 96depression, 69, 224distribution, 75, 78, 79, 95,
139, 150, 167, 169, 172,174, 180, 182, 184–6, 188,190, 193, 245
flattening, 184spectra, 75
Fossil fuel, 1, 2Four factor formula, 99, 100, 107,
174, 222, 223, 243Fuel assembly segments, 92Fuel burnup, 244Fuel coolant:
interface, 209moderator lattice structure, 85
Fuel depletion, 13, 91, 101, 186,232, 243–5, 252, 253
Fuel element heat transfer, 279,281–3
288 Index

Fuel enrichment, 87, 88, 93, 95, 96,102, 108, 168, 180, 181, 184,200, 255
Fuel rod radius, 110Fuel temperatures, 206, 223, 228
coefficient, 212, 223, 228see also Coolant temperature
Fuel thermal conductivity, 206Fusion reactions, 7–9
Gamma rays, 3–6, 9–11, 14–16, 37,42, 52
Gas-cooled fast reactors (GCFRs),94, 178
Geometric buckling, 162, 169Graphite-moderated reactors, 90, 92
Half-life, 4, 14, 17–23, 123, 124, 127,129–32, 245, 246–8, 250, 253,258, 259
Heat source characterization, 204Heat transport, 204Heavy water reactors (PHWRs),
91, 92Helium, 5, 62
coolant, 93Helmholtz equation, 169, 176Hexagonal fuel assemblies, 87Hexagonal lattice cells, 94High temperature gas-cooled
reactor (HTGR), 93, 212‘‘hot zero power’’, 231Hydrogen-2 see DeuteriumHyperbolic:
functions, 266sine, 152
Infinite medium multiplication, 81,117, 118, 177, 191
Inhour equation, 128Integrating factor technique, 121,
132, 212, 246, 248, 254Interface conditions, 148Iodine-131, 20, 21, 246Iodine-135, 247Isothermal temperature coefficient,
228Isotopes, 3, 5, 9, 13, 16, 17, 21, 33,
35, 36, 42, 47, 52, 75, 123, 129,
226, 246, 247, 248, 252, 255,257, 258
decay rate, 246fissionable, 11, 47, 115, 129, 172hydrogen, 5, 9plutonium and uranium, 255radium, 18
Isotopic:concentrations, 252distribution, 153
Kinetic:energy, 6, 8–11, 29, 37–9, 41, 42,
46, 57, 63, 116, 228theory, 39, 70equations, 124–7, 134, 168, 233
Laplace transforms, 133Lattice cell:
compositions, 174pitch, 139
Lattice structure, 81, 85, 88, 204Leakage:
effects, 117, 222probability, 180, 222
Light water reactors (LWRs), 88,90–2
Linear heat rate, 86, 88, 205, 206,208–10, 279
Liquid coolants, 93, 186, 212, 214Liquid cooled reactors, 110, 208,
213, 226, 227Lumped boron, 257
Macroscopic cross section, 29–31,33, 34, 36, 37, 61, 62, 64, 75, 81,96, 108, 133
Maxwell-Boltzmann distribution,39, 45, 58, 71, 73, 79, 80, 134,224
Mean free path, 32Microscopic cross section, 31, 33–6,
38, 73, 97, 108, 109, 222Migration length, 178Moderator, 61–3, 65, 67–9, 72, 73,
81, 85, 87, 88, 90–4, 98–110,139, 168, 177, 179, 204, 209,212, 221, 223, 225–7
temperature coefficient, 225
Index 289

Momentum, conservation of, 41,49, 53
Movable control poison, 230,232, 244
Multigroup methods, 75Multiplying systems behavior, 120
Negative feedback impacts, 134Neptunium, 253, 258Neutrinos, 4, 5, 9–11Neutron:
balance equations, 116beam, 32capture, 47, 104, 109, 243, 253,
255–7chain reactions, 29, 57, 115
see also Chain reactioncolliding/collisions, 61, 97cross sections, 29cycle in thermal reactors, 100density, 74diffusion, 139, 140, 142, 149, 157,
174properties, derivation of, 273,
275–9distributions, 57, 167energy, 29, 48, 49, 51, 53, 58, 64,
74, 95, 97, 98, 100, 115, 174,225, 273
emitting fission products, 123,126, 127
flux, 63, 64, 73, 101, 107, 151,153, 193, 221, 222, 224
leakage, 58, 115, 119, 174, 175,179, 227
lifetime, 12, 116, 117, 120, 122,124, 127, 129, 212, 236, 243
moderators see Moderatormultiplication, 12, 57, 211nonleakage probability, 58, 167,
180poison, 87, 91, 180, 186, 200, 230,
244, 245spectrum, 48, 61, 62, 95, 106, 174,
226, 227Neutron distributions in energy,
57–8energy-averaged reaction rates,
73–5
Fast cross section averages, 75–8Resonance cross section
averages, 78–9Thermal cross section
averages, 79–81infinite medium multiplication,
81–2neutron energy spectra, 63–5
Fast and thermal reactor spec-tra, 72–3
Fast neutrons, 65–6Neutron slowing down, 66–70Thermal neutrons, 70–1
neutron moderators, 61–3nuclear fuel properties, 58–61
Neutron distributions in reactors:control poisons, 186
control rod bank insertion, 190–4control rods, partially inserted,
188–90reactivity worth, 186–8
neutron leakage, 174leakage and design, 179–80migration length, 178–9two group approximation, 174–8
reflected reactors, 180–5time-independent diffusion
equation, 167–8uniform reactors, 169
finite cylindrical core, 170–2reactor power, 172–4
Neutron interactions:cross section energy dependence,
40–1compound nucleus formation,
41–2fissionable materials, 47–8resonance cross sections, 42–6threshold cross sections, 46–7
neutron cross sections, 29–30calculation, 36microscopic and macroscopic,
30–2nuclide densities, 33–4reaction types, 36–8uncollided flux, 32–3uranium, enriched, 35–6
neutron energy range, 38–40neutron scattering, 48
290 Index

elastic scattering, 49–50inelastic scattering, 52–3slowing down decrement, 50–2
Neutron kinetics:equations, 125delayed, 123
Neutrons, spatial diffusion of,139–40
boundary conditions, 145–6interface conditions, 148–9reflected boundaries, 147surface sources and albedos,
147–8vacuum boundaries, 146–7
diffusion approximation validity,153–7
multiplying systems, 157critical reactor, 160–2subcritical assemblies, 157–60
neutron diffusion equation, 140diffusion approximation, 142–3spatial neutron balance, 140–2
nonmultiplying systems, 143–5,149–53
Neutronic and thermal effects,209, 215
Neutronics design, 211Noble gases, 258Nonescape probability, 115, 227Nonleakage probability, 101, 119,
120, 139, 161, 162, 177, 180,222, 243
Nonrelativistic particle, 6Notation, 5Nuclear reactions, 1–3
binding energy, curve of, 7–8energetics, 5–7fissile and fertile materials, 16–18fission reactions, 9–10
energy release and dissipation,10–11
fission products, 13–16neutron multiplication, 12–13
fusion reactions, 8–9notation, 5radioactive decay, 18–20
decay chains, 21–3saturation activity, 20–1
reaction equations, 3–4
Nuclear fuel properties, 58Nuclear proliferation, problems of, 60Nuclear reaction fundamentals, 2Nucleons, conservation of, 3Nuclide densities, 33
On-line refueling machines, 92
Partial currents, 278Partially inserted control rod, 188Plane geometry, 143Plank’s constant, 6Plutonium, 17, 47, 58–60, 78, 223,
252–5, 258, 259Poison specifications, 232Power:
coefficient, 229defects, 230density, 88, 93, 180, 194, 199,
200, 202, 203, 205, 209–11,250, 252, 257
peaking factor, 200reactors, transient behavior of,
134Power reactor core, 85
core composition, 85–8Fast reactors, 94Graphite-moderated reactors,
92–3Heavy water reactors, 91–2Light water reactors, 88–91RBMK reactors, 93–4
fast reactor lattices, 94–7thermal reactor lattices, 98–9
Four factor formula, 99–107Pressurized water reactor
example, 108–10Power reactor core, behaviour:
fission product and actinideinventories, 257–9
fission product buildup anddecay, 245–6
samarium poisoning, 250–2xenon positioning, 247–50
fuel depletion, 252burnable poisons, 255–7fissionable nuclide
concentrations, 252–5reactivity control, 243–5
Index 291

Pressurized water reactor, 88, 108,209
Prompt coefficient, 228Prompt jump approximation, 131
Quasi-static model, 233, 235
Radial and axial peaking factors,202, 204
Radial flux distribution, 182Radial peaking factor, 202, 208Radial reflector, 180, 181, 184Radioactive decay, 4, 5, 9, 10, 15,
16, 18, 37, 116, 245, 248, 252Radioactivity, measure of, 19Radioiodine, 258Radioisotopes, 11
see also IsotopesRadionuclides, 20
decay of, 5Radiostrontium, 11Radiotoxicity, 259Ramp rate, 235RBMK reactors, 93, 94, 110Reaction equations, 3Reactivity:
coefficients, 221, 228control, 243feedback, 221, 222formulation, 126worth, 186
Reactor:dynamics, 133, 233lattices, 81, 90, 92, 98, 108, 139,
154, 180, 199multiplication, 87, 91, 97, 167,
204, 222period, 127power, 172transients, 232
Reactor kinetics, 115delayed neutron kinetics, 123–4
Kinetics equations, 124–5Reactivity formulation, 126
multiplying systems behavior,120–2
neutron balance equations, 116Finite multiplying systems,
119–20
Infinite medium multiplyingsystems, 117–19
Infinite medium nonmultiply-ing systems, 116–17
prologue to reactor dynamics,133–4
step reactivity changes, 126–7Prompt jump approximation,
131–3Reactor period, 127–31
Reflected boundaries, 147Reflector:
diminishing effect, 185savings, 184
Resonance:absorption, 68, 73, 79, 226cross sections, 42, 78escape probability, 102–105, 108,
109, 175, 223, 224, 226self-shielding, 224
Rod bank, 91, 131, 186, 190, 191,193, 203, 231, 236, 238, 244
Rod drop, 132Rod oscillator, 133
Samarium, 243, 245, 250–2concentration, 251poisoning, 250
Saturation activity, 20Scalar flux, 64, 273Scattering:
anisotropic, 277collisions, 12, 29, 37, 48, 57, 63,
65, 66, 148, 180cross section, 37, 41, 44–6, 50, 52,
61, 62, 68, 69, 80, 90, 177, 178elastic, 37, 40, 41, 44, 48–53,
61–4, 67, 68, 72, 94, 177inelastic, 52isotopic, 142, 146, 155, 275, 277neutron, 39, 48, 226
Semi-infinite medium, 144, 148Shutdown margin, 230Slowing down decrement, 50Sodium-cooled fast reactor (SFRs),
72, 94, 178Solid-moderated reactors, 110Source jerk, 131, 133
see also Rod bank
292 Index

Spatial diffusion, 139Spatial neutron balance, 140Spectral hardening, 71, 226Spherical Geometry, 149Startup accident, 238Steady state temperatures, 205Steam generators, 90, 92Step reactivity changes, 126Strontium, 20, 21, 258Subcritical assemblies, 157Surface heat flux, 205, 208, 209Surface sources, 147
see also Albedos
Tellurium-135, 247Temperature drop across, 280Thermal cross section averages, 79Thermal diffusion, 174–8Thermal disadvantage factor, 107Thermal energies, 51, 61, 73, 100,
102, 117, 174, 178, 224Thermal expansion, volumetric
coefficient of, 225Thermal fission, 101, 174Thermal hydraulic considerations,
194, 200Thermal neutrons, 40, 42, 58, 65,
70, 99, 100, 106, 174, 177, 245flux, 107leakage, 175measurments, 39range, 61, 70, 99spectrum, 71, 106, 177, 226
Thermal reactor lattices, 78, 98Thermal time constant, 212, 213,
234, 237, 243, 282Thermal transients, 211Thermal utilization, 101, 106, 108,
109, 226Thermodynamic analysis, 209Thermonuclear reaction, 8, 9
Thorium, 13, 17, 47Threshold cross sections, 46Transient analysis, 234Transport equation, 273, 274Transuranic nuclei, 245Two group theory, 174
Uncollided flux, 32, 33, 153, 155, 156Uniform cylindrical core, 203Uniform source, 144Uranium, 1, 2, 9, 11, 15–17, 35, 36,
42, 44, 45–7, 49, 51, 52, 58–62,65, 73, 78, 81, 90–3, 105, 129,130, 228, 249, 252, 253, 255,258, 259
cross sections, feature of the, 44fueled reactor, 130, 249, 252nuclear fission of, 1
Uranium-235, 9, 11, 15–17, 35, 58,59, 129, 252, 255
depletion of, 255Uranium-238, 16, 17, 35, 42, 44, 46,
47, 49, 51, 58, 60, 61, 105, 228,252, 253, 259
Vacuum boundaries, 146
Waste disposal, 258Water-cooled reactors, 72, 90, 93,
105, 254Wigner-way formula, 15
Xenon, 243, 245, 247–51poisoning, 247, 250, 251
Zero flux boundary condition, 147,176
Zero power:kinetics, 133temperature, 232
Zirconium, 90, 92, 93
Index 293