
TM1 1Summary Travel Time Reliability Memo track changes FINAL
9
Memorandum 1.1 I-5 Medford Viaduct Planning & Environmental Study Page 1 Memorandum 1.1 January 15, 2016 To: Lisa Cornutt and Anna Henson, Oregon Department of Transportation, Region 3 From: Marc Butorac, PE, PTOE, Shaun Quayle, PE, and Patrick Marnell Date: January 15, 2016 Subject: Task 1.1 Travel Time Reliability Memorandum Introduction The objective of this travel time reliability memorandum is to establish the frequency, magnitude, locations, and sources of congestion which lead to drops in travel time reliability within the I-5 Medford Viaduct study area specifically within the elevated viaduct segment and immediately north and south of the viaduct. The analysis also assessed potential contributing factors (weather, time of day, crashes, and other incidents). The HERE TM data set (also commonly called the National Performance Management Research Data Set) contains average vehicle travel times and speeds collected using “probe vehicles”. Probe vehicle data is obtained from sources such as cell phones and portable navigation devices. This data is collected for defined roadway segments know as traffic message channels (TMCs). ODOT provided HERE™ travel time and speed data, as permitted by the “Here Licenses”, from October 2011 to July 2015 (46 months). HERE™ data prior to October 2011 is not available. ODOT provided data for six TMCs in the project vicinity. Figure 1 displays a Map of the TMCs in the project area. This memorandum will focus in particular on the two TMCs which contain (but are not limited to) the Medford Viaduct. These TMCs will subsequently be referred to as the “Viaduct TMCs”. TMC 114P04717 includes northbound traffic between the North and South Medford interchanges which encompasses the Viaduct. TMC 114N04716 includes southbound traffic between the North and South Medford interchanges which encompasses the Viaduct. The following metrics were used to asses travel time reliability in the project area. Planning Time Index (PTI) - The ratio of the 95th percentile travel time to the free-flow travel time. This value can be viewed as the multiplier that one should apply to their “no traffic commute” to insure they will arrive at work, on time, 95 percent of the time. As this value increases, the less reliable the commute becomes, and the more “buffer” time one needs to build into travel. o For example, a 10 minute commute under light traffic conditions and has a planning time index (PTI) of 1.2, then the commuter needs to budget 12 minutes to ensure on-time arrival 95% of the time. The purpose of this memorandum and the other early anchoring activity memorandums in Phase 1A of the project is to inform the Draft Problem Statement and guide further development of the project.
Transcript of TM1 1Summary Travel Time Reliability Memo track changes FINAL
Memorandum 1.1
I-5 Medford Viaduct Planning & Environmental Study Page 1 Memorandum 1.1 January 15, 2016
To: Lisa Cornutt and Anna Henson, Oregon Department of Transportation, Region 3
From: Marc Butorac, PE, PTOE, Shaun Quayle, PE, and Patrick Marnell
Date: January 15, 2016
Subject: Task 1.1 Travel Time Reliability Memorandum
Introduction
The objective of this travel time reliability memorandum is to establish the frequency, magnitude, locations, and sources of congestion which lead to drops in travel time reliability within the I-5 Medford Viaduct study area specifically within the elevated viaduct segment and immediately north and south of the viaduct. The analysis also assessed potential contributing factors (weather, time of day, crashes, and other incidents).
The HERETM data set (also commonly called the National Performance Management Research Data Set) contains average vehicle travel times and speeds collected using “probe vehicles”. Probe vehicle data is obtained from sources such as cell phones and portable navigation devices. This data is collected for defined roadway segments know as traffic message channels (TMCs).
ODOT provided HERE™ travel time and speed data, as permitted by the “Here Licenses”, from October 2011 to July 2015 (46 months). HERE™ data prior to October 2011 is not available. ODOT provided data for six TMCs in the project vicinity. Figure 1 displays a Map of the TMCs in the project area. This memorandum will focus in particular on the two TMCs which contain (but are not limited to) the Medford Viaduct. These TMCs will subsequently be referred to as the “Viaduct TMCs”.
TMC 114P04717 includes northbound traffic between the North and South Medford interchanges which encompasses the Viaduct.
TMC 114N04716 includes southbound traffic between the North and South Medford interchanges which encompasses the Viaduct.
The following metrics were used to asses travel time reliability in the project area.
Planning Time Index (PTI) - The ratio of the 95th percentile travel time to the free-flow travel time. This value can be viewed as the multiplier that one should apply to their “no traffic commute” to insure they will arrive at work, on time, 95 percent of the time. As this value increases, the less reliable the commute becomes, and the more “buffer” time one needs to build into travel.
o For example, a 10 minute commute under light traffic conditions and has a planning time index (PTI) of 1.2, then the commuter needs to budget 12 minutes to ensure on-time arrival 95% of the time.
The purpose of this memorandum and the other early anchoring activity memorandums
in Phase 1A of the project is to inform the Draft Problem Statement and guide further
development of the project.
Memorandum 1.1
I-5 Medford Viaduct Planning & Environmental Study Page 2 Memorandum 1.1 January 15, 2016
Average Speed - The observed average speed of the probe vehicles in a TMC, recorded in 5-minute bins.
Average Travel Time - The observed average travel time that probe vehicles took to traverse a TMC, recorded in 5-minute bins.
Slowing Events – Slowing events were identified as two or more consecutive 5 minute periods with average speeds recorded below 45 miles per hour (MPH).
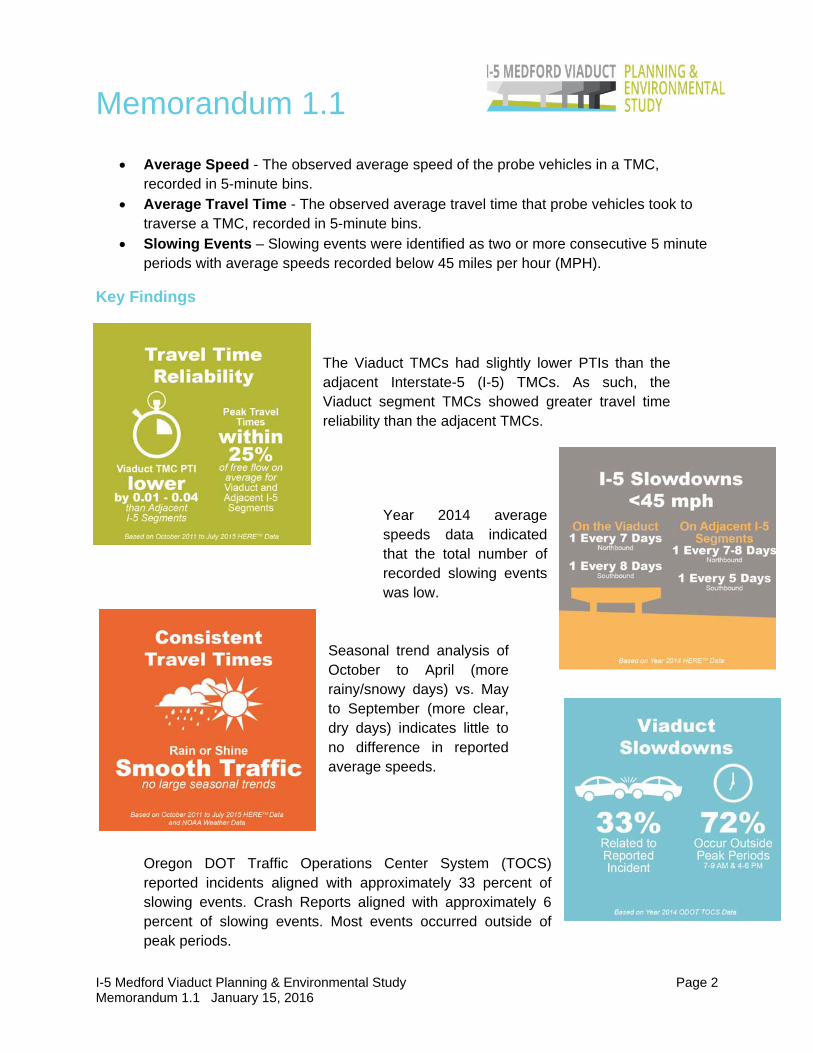
Key Findings
The Viaduct TMCs had slightly lower PTIs than the adjacent Interstate-5 (I-5) TMCs. As such, the Viaduct segment TMCs showed greater travel time reliability than the adjacent TMCs.
Year 2014 average speeds data indicated that the total number of recorded slowing events was low.
Seasonal trend analysis of October to April (more rainy/snowy days) vs. May to September (more clear, dry days) indicates little to no difference in reported average speeds.
Oregon DOT Traffic Operations Center System (TOCS) reported incidents aligned with approximately 33 percent of slowing events. Crash Reports aligned with approximately 6 percent of slowing events. Most events occurred outside of peak periods.

114P04718
114N04715
114N04717
114P04716
114N04716114P04717
Rouge Valley Int'lMedford Airport
E Mcandrews Rd
Kin
gs
Hw
y
Garfield St
Stewart AveN
Foo
thill
Rd
Tab
le R
ock
Rd
W Main StW 8th St
S Front S
t
S R
iverside Ave
NM
ainSt
Owen Dr
N P
acific Hw
y
WM
candr
ews
Rd
N P
hoe
nix
Rd
SC
olum
bus
Av e
NC
entral AveE Main St
Bid
dle
Rd
S Pacific Hw
y
Cra
ter
La
ke A
ve
Sage RdRossanley Dr
E Barnett Rd
Cra
ter
La
keH
wy
Co
urt
St
5
Phoenix
Central Point
Medford
I-5 Medford Viaduct Planning & Environmental Study December 2015
Figure
1Traffic Message Channels MapMedford, Oregon
H:\pr
ojfile
\1820
3 - M
edfor
d I-5
Viadu
ct Stu
dy\gi
s\Tas
k 1.1\
TMC
Map.m
xd - j
somm
erville
- 4:1
0 PM
12/2/
2015
Coordinate System: NAD 1983 StatePlane Oregon South FIPS 3602 Feet
Viaduct
05001,0001,5002,0002,5003,0003,5004,000 Feet0 0.5 1 Miles
Viaduct
Memorandum 1.1
I-5 Medford Viaduct Planning & Environmental Study Page 4 Memorandum 1.1 January 15, 2016
Travel Time/Planning Time Index Analysis
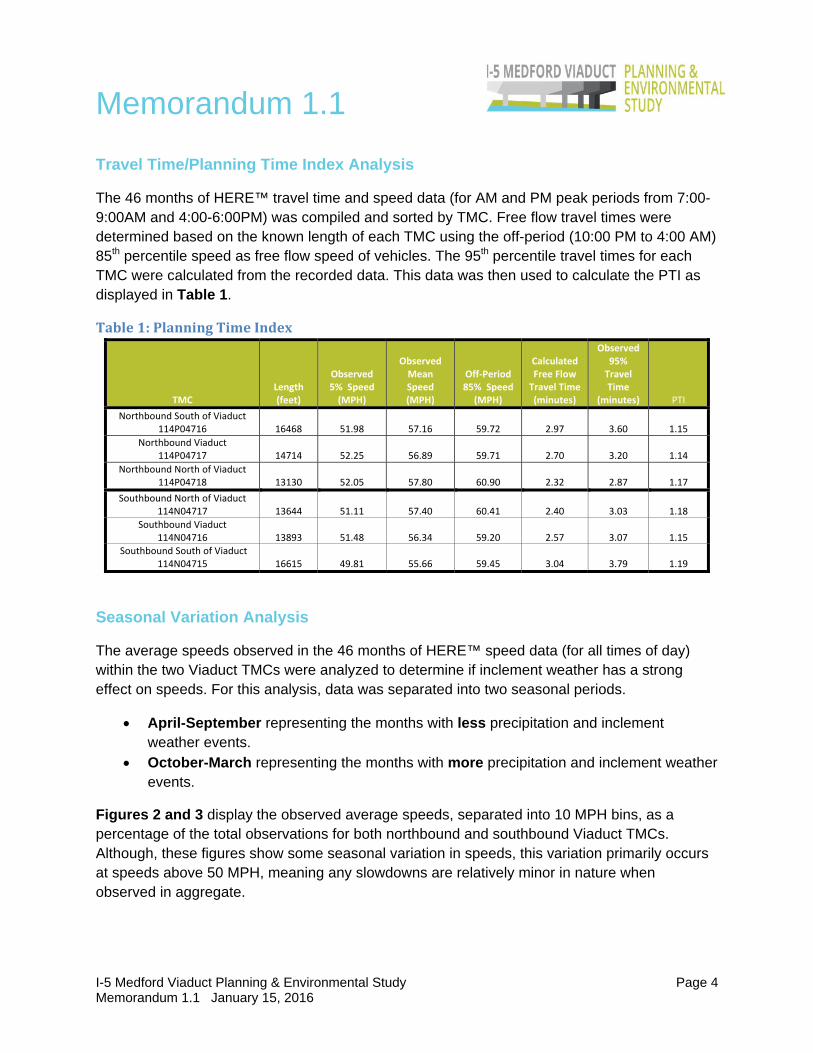
The 46 months of HERE™ travel time and speed data (for AM and PM peak periods from 7:00-9:00AM and 4:00-6:00PM) was compiled and sorted by TMC. Free flow travel times were determined based on the known length of each TMC using the off-period (10:00 PM to 4:00 AM) 85th percentile speed as free flow speed of vehicles. The 95th percentile travel times for each TMC were calculated from the recorded data. This data was then used to calculate the PTI as displayed in Table 1.
Table1:PlanningTimeIndex
TMC Length (feet)
Observed 5% Speed (MPH)
Observed Mean Speed (MPH)
Off‐Period 85% Speed
(MPH)
Calculated Free Flow Travel Time (minutes)
Observed 95% Travel Time
(minutes) PTI
Northbound South of Viaduct 114P04716 16468 51.98 57.16 59.72 2.97 3.60 1.15
Northbound Viaduct 114P04717 14714 52.25 56.89 59.71 2.70 3.20 1.14
Northbound North of Viaduct 114P04718 13130 52.05 57.80 60.90 2.32 2.87 1.17
Southbound North of Viaduct 114N04717 13644 51.11 57.40 60.41 2.40 3.03 1.18
Southbound Viaduct 114N04716 13893 51.48 56.34 59.20 2.57 3.07 1.15
Southbound South of Viaduct 114N04715 16615 49.81 55.66 59.45 3.04 3.79 1.19
Seasonal Variation Analysis
The average speeds observed in the 46 months of HERE™ speed data (for all times of day) within the two Viaduct TMCs were analyzed to determine if inclement weather has a strong effect on speeds. For this analysis, data was separated into two seasonal periods.
April-September representing the months with less precipitation and inclement weather events.
October-March representing the months with more precipitation and inclement weather events.
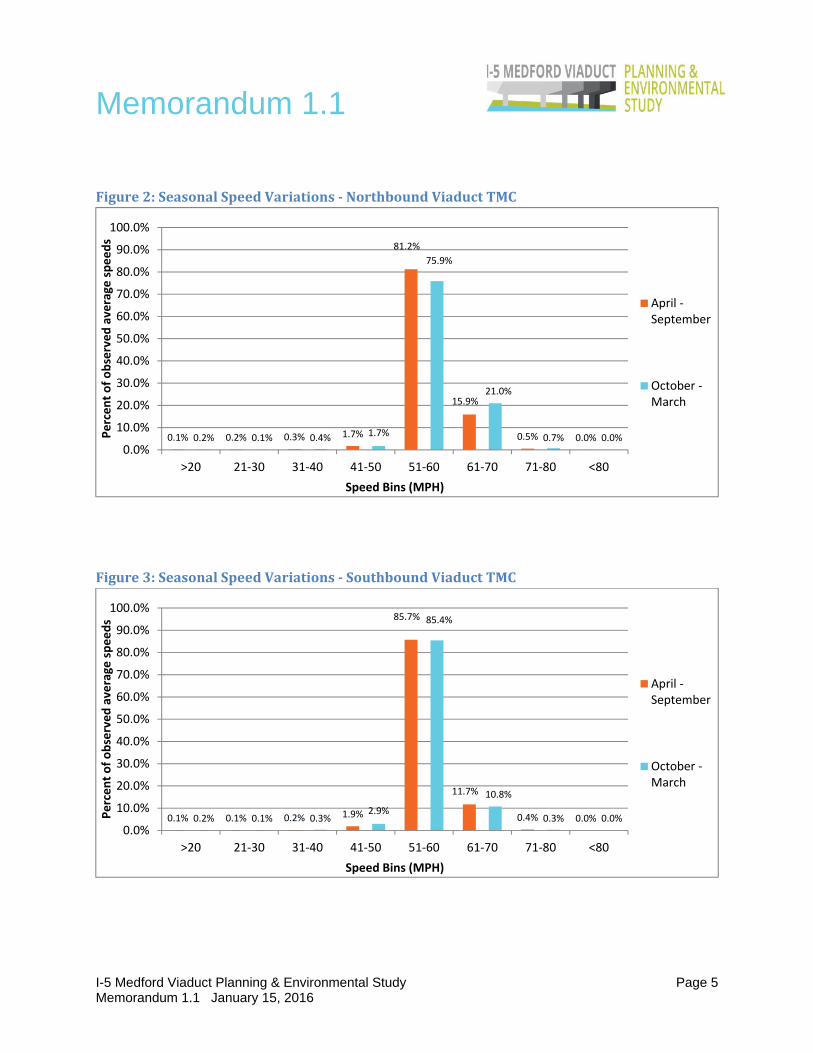
Figures 2 and 3 display the observed average speeds, separated into 10 MPH bins, as a percentage of the total observations for both northbound and southbound Viaduct TMCs. Although, these figures show some seasonal variation in speeds, this variation primarily occurs at speeds above 50 MPH, meaning any slowdowns are relatively minor in nature when observed in aggregate.
Memorandum 1.1
I-5 Medford Viaduct Planning & Environmental Study Page 5 Memorandum 1.1 January 15, 2016
Figure2:SeasonalSpeedVariations‐NorthboundViaductTMC
Figure3:SeasonalSpeedVariations‐SouthboundViaductTMC
0.1% 0.2% 0.3% 1.7%
81.2%
15.9%
0.5% 0.0%0.2% 0.1% 0.4% 1.7%
75.9%
21.0%
0.7% 0.0%0.0%
10.0%
20.0%
30.0%
40.0%
50.0%
60.0%
70.0%
80.0%
90.0%
100.0%
>20 21‐30 31‐40 41‐50 51‐60 61‐70 71‐80 <80
Percent of observed average
speeds
Speed Bins (MPH)
April ‐September
October ‐March
0.1% 0.1% 0.2% 1.9%
85.7%
11.7%
0.4% 0.0%0.2% 0.1% 0.3%2.9%
85.4%
10.8%
0.3% 0.0%0.0%
10.0%
20.0%
30.0%
40.0%
50.0%
60.0%
70.0%
80.0%
90.0%
100.0%
>20 21‐30 31‐40 41‐50 51‐60 61‐70 71‐80 <80
Percent of observed average
speeds
Speed Bins (MPH)
April ‐September
October ‐March

Memorandum 1.1
I-5 Medford Viaduct Planning & Environmental Study Page 6 Memorandum 1.1 January 15, 2016
Time of Day Analysis
To illustrate potential time based changes in average speed, the 95th percentile and 5th percentile average speeds observed within the Viaduct TMCs during year 2014 were plotted by hour. As, shown in Figures 4 and 5 the Viaduct TMCs show only small variations in speed. Further at no time of day was the 5th percentile speed recorded as less than 49 MPH.
Figure4:TimeofDayVariations‐NorthboundViaductTMC
Figure5:TimeofDayVariations‐SouthboundViaductTMC
40
45
50
55
60
65
70
12:00 AM
1:00 AM
2:00 AM
3:00 AM
4:00 AM
5:00 AM
6:00 AM
7:00 AM
8:00 AM
9:00 AM
10:00 AM
11:00 AM
12:00 PM
1:00 PM
2:00 PM
3:00 PM
4:00 PM
5:00 PM
6:00 PM
7:00 PM
8:00 PM
9:00 PM
10:00 PM
11:00 PM
Average
Speed (MPH)
Time of Day
95thPecentile
Mean
5thPercentile
40
45
50
55
60
65
70
12:00 AM
1:00 AM
2:00 AM
3:00 AM
4:00 AM
5:00 AM
6:00 AM
7:00 AM
8:00 AM
9:00 AM
10:00 AM
11:00 AM
12:00 PM
1:00 PM
2:00 PM
3:00 PM
4:00 PM
5:00 PM
6:00 PM
7:00 PM
8:00 PM
9:00 PM
10:00 PM
Average
Speed (MPH)
Time of Day
95th Pecentile
Mean
5th Percentile

Memorandum 1.1
I-5 Medford Viaduct Planning & Environmental Study Page 7 Memorandum 1.1 January 15, 2016
Slowing Events
To better understand the specific instances of slowing, the year 2014 data (all days) for the two Viaduct TMCs was analyzed to identify the frequency of slowing events.
Slowing events were identified as two consecutive 5 minute periods with average speeds recorded below a 45 MPH.
o On several occasions, based on engineering judgment, slowing events were continued though a single 5 minute period that did not meet the 45 MPH threshold.
o Within these slowing events, events that included a 10 minute period (or greater) of slowing to 30 MPH or less were also identified.
o Slowing events that occurred during the weekday AM peak period (7-9:00 AM) and the weekday PM peak period (4-6:00 PM) were also identified.
Table2:2014SlowingEventsunder45MPH
TMC
Slowing Events Slowing Events with 30 MPH periods
Number of
Events
Events During AM Peak
Events During PM Peak
Mean Duration (minutes)
Range of Durations (minutes)
Number of
Events
Events During AM Peak
Events During PM Peak
Mean Duration (minutes)
Range of Durations (minutes)
Northbound North of Viaduct 114P04718
42 6 2 13 10‐55 5 2 1 24 10‐55
Northbound Viaduct 114P04717
52 7 7 25 10‐285 17 4 5 54 10‐285
Northbound South of Viaduct 114P04716
51 3 7 17 10‐145 9 1 3 46 10‐145
Southbound North of Viaduct 114N04717
72 8 5 16 10‐135 17 1 2 33 10‐135
Southbound Viaduct 114N04716 44 4 9 21 10‐130 19 1 5 33 10‐130
Southbound South of Viaduct 114N04715
76 10 20 55 10‐380 32 2 17 112 10‐380
The total number of recorded slowing events is low. o Southbound traffic experienced a greater number of slowing events on average
for all TMCs. o On average 1-2 slowing events were recoded per month during weekday AM or
PM peak periods within the Viaduct TMCs. Southbound traffic in the Viaduct TMC showed fewer slowing events than the adjacent I-
5 TMCs. Northbound traffic showed approximately the same number of slowing events as the adjacent I-5 TMCs.
Southbound traffic in the I-5 TMC south of the Viaduct showed more periods of 30 MPH slowing than the other TMCs.
Memorandum 1.1
I-5 Medford Viaduct Planning & Environmental Study Page 8 Memorandum 1.1 January 15, 2016
For average northbound traffic in the Viaduct TMC: o One slowing event occurred every 7 days. o One slowing event with 30 MPH slowing occurred every 19 days.
For average southbound traffic in the Viaduct TMC: o One slowing event occurred every 8 days. o One slowing event with 30 MPH slowing occurred every 21 days.
Slowing events are likely the result of:
Localized congestion (on-off ramp maneuvers, lane change friction, slow moving vehicles), which is not specified in the source travel time data (HERETM), and/or
Inclement weather and/or Incident events, which may include crashes, stalled vehicles, or debris/animal on
roadway, or shoulder vehicle stoppages. It is believed that the TOCS incident data in the following section is incomplete, as the log is limited to incidents reported to ODOT’s TOC in 2014 by state police and 911 call centers.
Incident and Crash Analysis
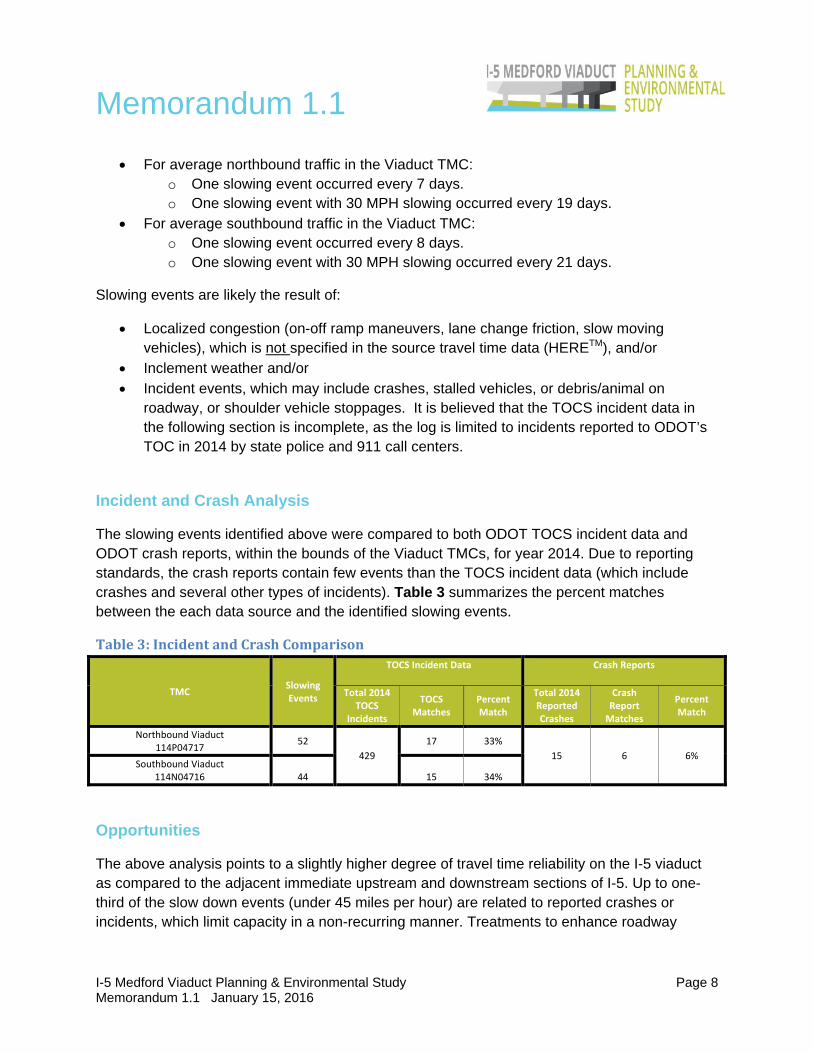
The slowing events identified above were compared to both ODOT TOCS incident data and ODOT crash reports, within the bounds of the Viaduct TMCs, for year 2014. Due to reporting standards, the crash reports contain few events than the TOCS incident data (which include crashes and several other types of incidents). Table 3 summarizes the percent matches between the each data source and the identified slowing events.
Table3:IncidentandCrashComparison
TMC Slowing Events
TOCS Incident Data Crash Reports
Total 2014 TOCS
Incidents
TOCS Matches
Percent Match
Total 2014 Reported Crashes
Crash Report Matches
Percent Match
Northbound Viaduct 114P04717
52
429
17 33%
15 6 6% Southbound Viaduct
114N04716 44 15 34%
Opportunities
The above analysis points to a slightly higher degree of travel time reliability on the I-5 viaduct as compared to the adjacent immediate upstream and downstream sections of I-5. Up to one-third of the slow down events (under 45 miles per hour) are related to reported crashes or incidents, which limit capacity in a non-recurring manner. Treatments to enhance roadway

Memorandum 1.1
I-5 Medford Viaduct Planning & Environmental Study Page 9 Memorandum 1.1 January 15, 2016
safety and emergency responder access would be of benefit to the I-5 viaduct and the surrounding I-5 project area.
These opportunities for safety and access improvements will be investigated as part of future project phases.
Attachments:
HERE Data (electronic document) TOCS Incident Data (electronic document) Reference Technical Memorandum #1.4 for crash data