
TLIC LAH08Q4 - Wilton Re · Kathleen Anne Henkel Susan Ann Buffum Steven Timothy Cates Joseph...
150
*69396200820100100* LIFE AND ACCIDENT AND HEALTH COMPANIES—ASSOCIATION EDITION ANNUAL STATEMENT FOR THE YEAR ENDED DECEMBER 31, 2008 OF THE CONDITION AND AFFAIRS OF THE TEXAS LIFE INSURANCE COMPANY NAIC Group Code 0241 , 0241 NAIC Company Code 69396 Employer’s ID Number 74-0940890 (Current Period) (Prior Period) Organized under the Laws of Texas , State of Domicile or Port of Entry Texas Country of Domicile United States Incorporated/Organized 01/09/1901 Commenced Business 04/01/1901 Statutory Home Office 900 Washington Avenue , Waco, TX 76701 (Street and Number) (City or Town, State and Zip Code) Main Administrative Office 900 Washington Avenue Waco, TX 76701 254-752-6521 (Street and Number) (City or Town, State and Zip Code) (Area Code) (Telephone Number) Mail Address P O Box 830 , Waco, TX 76703-0830 (Street and Number or P.O. Box) (City or Town, State and Zip Code) Primary Location of Books and Records 900 Washington Avenue Waco, TX 76701 254-745-6360 (Street and Number) (City or Town, State and Zip Code) (Area Code) (Telephone Number) Internet Website Address www.texaslife.com Statutory Statement Contact Dalila Noyola Richter 254-745-6360 (Name) (Area Code) (Telephone Number) (Extension) [email protected] 254-754-4880 (E-mail Address) (FAX Number) OFFICERS Name Title Name Title Steven Timothy Cates , President Gwenn Louise Carr , Secretary Francis Henry George , Vice-President, Actuary , OTHER OFFICERS Paul Ellis Anderson , Vice-President Francis Henry George , Vice-President, Actuary George Harold Miller , Vice-President James Michael Steward , Vice-President Steven Ray Worley , Vice-President Jeffrey Neal Altman , Vice-President Roberto Barron , Vice-President Christopher Anthony Kremer , Vice-President Jonathan Lloyd Rosenthal # , Vice-President , DIRECTORS OR TRUSTEES Kathleen Anne Henkel Susan Ann Buffum Steven Timothy Cates Joseph William Jordan Stanley Jeffrey Talbi State of County of Texas McLennan ss The officers of this reporting entity, being duly sworn, each depose and say that they are the described officers of said reporting entity, and that on the reporting period stated above, all of the herein described assets were the absolute property of the said reporting entity, free and clear from any liens or claims thereon, except as herein stated, and that this statement, together with related exhibits, schedules and explanations therein contained, annexed or referred to is a full and true statement of all the assets and liabilities and of the condition and affairs of the said reporting entity as of the reporting period stated above, and of its income and deductions therefrom for the period ended, and have been completed in accordance with the NAIC Annual Statement Instructions and Accounting Practices and Procedures Manual except to the extent that: (1) state law may differ; or, (2) that state rules or regulations require differences in reporting not related to accounting practices and procedures, according to the best of their information, knowledge and belief, respectively. Furthermore, the scope of this attestation by the described officers also includes the related corresponding electronic filing with the NAIC, when required, that is an exact copy (except for formatting differences due to electronic filing) of the enclosed statement. The electronic filing may be requested by various regulators in lieu of or in addition to the enclosed statement. Steven Timothy Cates Francis Henry George President Vice-President, Actuary a. Is this an original filing? Yes [ X ] No [ ] Subscribed and sworn to before me this b. If no, 25th day of February, 2009 1. State the amendment number 2. Date filed 3. Number of pages attached Tammy L Lyons, Sr Associate, Accounting 11/08/2009
Transcript of TLIC LAH08Q4 - Wilton Re · Kathleen Anne Henkel Susan Ann Buffum Steven Timothy Cates Joseph...

*69396200820100100*LIFE AND ACCIDENT AND HEALTH COMPANIES—ASSOCIATION EDITION
ANNUAL STATEMENTFOR THE YEAR ENDED DECEMBER 31, 2008
OF THE CONDITION AND AFFAIRS OF THE
TEXAS LIFE INSURANCE COMPANY NAIC Group Code 0241 , 0241 NAIC Company Code 69396 Employer’s ID Number 74-0940890
(Current Period) (Prior Period)
Organized under the Laws of Texas , State of Domicile or Port of Entry TexasCountry of Domicile United States
Incorporated/Organized 01/09/1901 Commenced Business 04/01/1901
Statutory Home Office 900 Washington Avenue , Waco, TX 76701(Street and Number) (City or Town, State and Zip Code)
Main Administrative Office 900 Washington Avenue Waco, TX 76701 254-752-6521(Street and Number) (City or Town, State and Zip Code) (Area Code) (Telephone Number)
Mail Address P O Box 830 , Waco, TX 76703-0830(Street and Number or P.O. Box) (City or Town, State and Zip Code)
Primary Location of Books and Records 900 Washington Avenue Waco, TX 76701 254-745-6360(Street and Number) (City or Town, State and Zip Code) (Area Code) (Telephone Number)
Internet Website Address www.texaslife.comStatutory Statement Contact Dalila Noyola Richter 254-745-6360
(Name) (Area Code) (Telephone Number) (Extension)[email protected] 254-754-4880
(E-mail Address) (FAX Number)
OFFICERSName Title Name Title
Steven Timothy Cates , President Gwenn Louise Carr , SecretaryFrancis Henry George , Vice-President, Actuary ,
OTHER OFFICERSPaul Ellis Anderson , Vice-President Francis Henry George , Vice-President, ActuaryGeorge Harold Miller , Vice-President James Michael Steward , Vice-PresidentSteven Ray Worley , Vice-President Jeffrey Neal Altman , Vice-President
Roberto Barron , Vice-President Christopher Anthony Kremer , Vice-PresidentJonathan Lloyd Rosenthal # , Vice-President ,
DIRECTORS OR TRUSTEESKathleen Anne Henkel Susan Ann Buffum Steven Timothy Cates Joseph William Jordan Stanley Jeffrey Talbi
State of
County of
Texas
McLennan ss
The officers of this reporting entity, being duly sworn, each depose and say that they are the described officers of said reporting entity, and that on the reporting period stated above, all of the herein described assets were the absolute property of the said reporting entity, free and clear from any liens or claims thereon, except as herein stated, and that this statement, together with related exhibits, schedules and explanations therein contained, annexed or referred to is a full and true statement of all the assets and liabilities and of the condition and affairs of the said reporting entity as of the reporting period stated above, and of its income and deductions therefrom for the period ended, and have been completed in accordance with the NAIC Annual Statement Instructions and Accounting Practices and Procedures Manual except to the extent that: (1) state law may differ; or, (2) that state rules or regulations require differences in reporting not related to accounting practices and procedures, according to the best of their information, knowledge and belief, respectively. Furthermore, the scope of this attestation by the described officers also includes the related corresponding electronic filing with the NAIC, when required, that is an exact copy (except for formatting differences due to electronic filing) of the enclosed statement. The electronic filing may be requested by various regulators in lieu of or in addition to the enclosed statement.
Steven Timothy Cates Francis Henry George President Vice-President, Actuary
a. Is this an original filing? Yes [ X ] No [ ]
Subscribed and sworn to before me this b. If no,25th day of February, 2009 1. State the amendment number
2. Date filed3. Number of pages attached
Tammy L Lyons, Sr Associate, Accounting11/08/2009
ANNUAL STATEMENT FOR THE YEAR 2008 OF THE TEXAS LIFE INSURANCE COMPANY
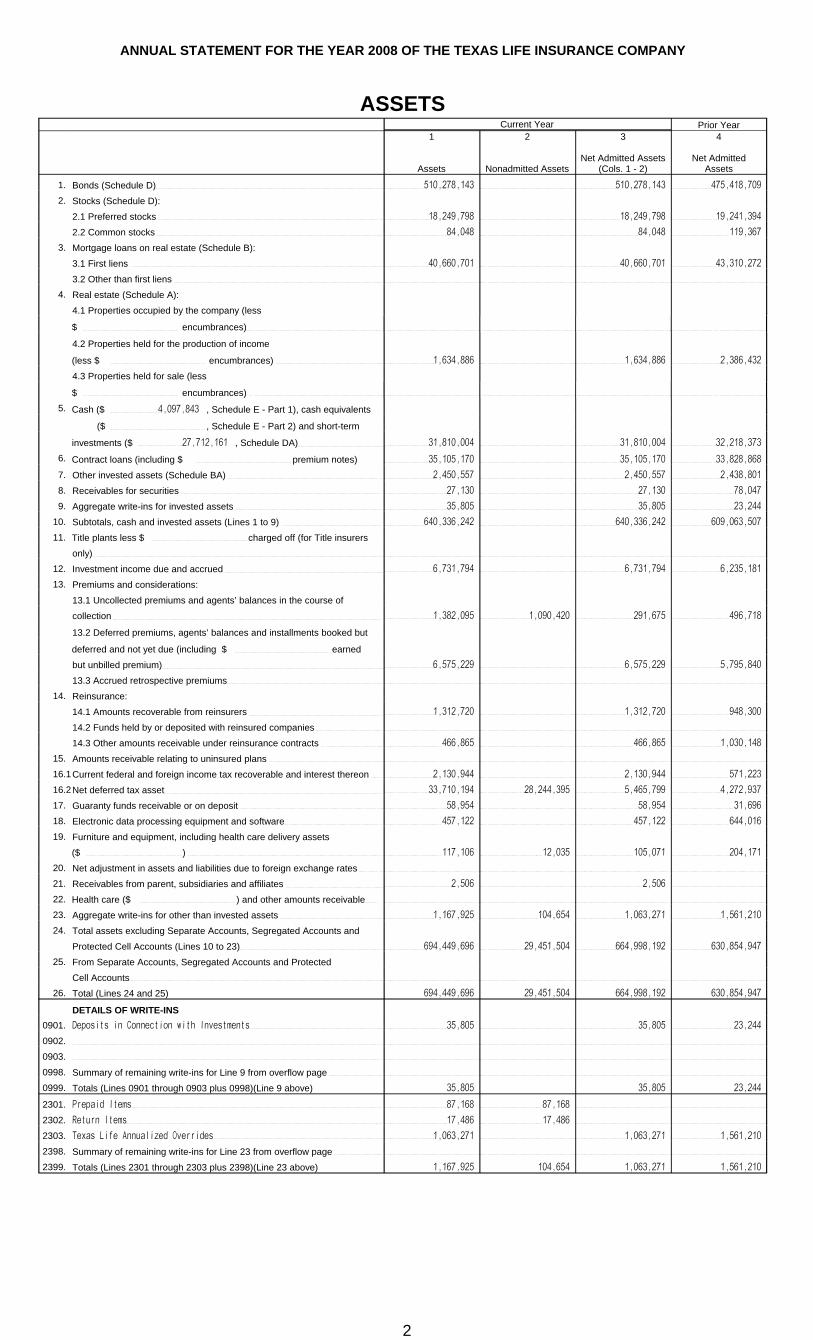
ASSETSCurrent Year Prior Year
1
Assets
2
Nonadmitted Assets
3
Net Admitted Assets(Cols. 1 - 2)
4
Net AdmittedAssets
1. Bonds (Schedule D) 510,278,143 510,278,143 475,418,709
2. Stocks (Schedule D):
2.1 Preferred stocks 18,249,798 18,249,798 19,241,394
2.2 Common stocks 84,048 84,048 119,367
3. Mortgage loans on real estate (Schedule B):
3.1 First liens 40,660,701 40,660,701 43,310,272
3.2 Other than first liens 4. Real estate (Schedule A):
4.1 Properties occupied by the company (less
$ encumbrances)
4.2 Properties held for the production of income
(less $ encumbrances) 1,634,886 1,634,886 2,386,432
4.3 Properties held for sale (less
$ encumbrances) 5. Cash ($ 4,097,843 , Schedule E - Part 1), cash equivalents
($ , Schedule E - Part 2) and short-term
investments ($ 27,712,161 , Schedule DA) 31,810,004 31,810,004 32,218,373
6. Contract loans (including $ premium notes) 35,105,170 35,105,170 33,828,868
7. Other invested assets (Schedule BA) 2,450,557 2,450,557 2,438,801
8. Receivables for securities 27,130 27,130 78,047
9. Aggregate write-ins for invested assets 35,805 35,805 23,244
10. Subtotals, cash and invested assets (Lines 1 to 9) 640,336,242 640,336,242 609,063,507
11. Title plants less $ charged off (for Title insurers
only)12. Investment income due and accrued 6,731,794 6,731,794 6,235,181
13. Premiums and considerations:
13.1 Uncollected premiums and agents’ balances in the course of
collection 1,382,095 1,090,420 291,675 496,718
13.2 Deferred premiums, agents’ balances and installments booked but
deferred and not yet due (including $ earned
but unbilled premium) 6,575,229 6,575,229 5,795,840
13.3 Accrued retrospective premiums14. Reinsurance:
14.1 Amounts recoverable from reinsurers 1,312,720 1,312,720 948,300
14.2 Funds held by or deposited with reinsured companies
14.3 Other amounts receivable under reinsurance contracts 466,865 466,865 1,030,148
15. Amounts receivable relating to uninsured plans 16.1Current federal and foreign income tax recoverable and interest thereon 2,130,944 2,130,944 571,223
16.2Net deferred tax asset 33,710,194 28,244,395 5,465,799 4,272,937
17. Guaranty funds receivable or on deposit 58,954 58,954 31,696
18. Electronic data processing equipment and software 457,122 457,122 644,016
19. Furniture and equipment, including health care delivery assets
($ ) 117,106 12,035 105,071 204,171
20. Net adjustment in assets and liabilities due to foreign exchange rates 21. Receivables from parent, subsidiaries and affiliates 2,506 2,506
22. Health care ($ ) and other amounts receivable23. Aggregate write-ins for other than invested assets 1,167,925 104,654 1,063,271 1,561,210
24. Total assets excluding Separate Accounts, Segregated Accounts and
Protected Cell Accounts (Lines 10 to 23) 694,449,696 29,451,504 664,998,192 630,854,947
25. From Separate Accounts, Segregated Accounts and Protected
Cell Accounts26. Total (Lines 24 and 25) 694,449,696 29,451,504 664,998,192 630,854,947
DETAILS OF WRITE-INS0901. Deposits in Connection with Investments 35,805 35,805 23,244
0902.
0903.
0998. Summary of remaining write-ins for Line 9 from overflow page 0999. Totals (Lines 0901 through 0903 plus 0998)(Line 9 above) 35,805 35,805 23,244
2301. Prepaid Items 87,168 87,168
2302. Return Items 17,486 17,486
2303. Texas Life Annualized Overrides 1,063,271 1,063,271 1,561,210
2398. Summary of remaining write-ins for Line 23 from overflow page 2399. Totals (Lines 2301 through 2303 plus 2398)(Line 23 above) 1,167,925 104,654 1,063,271 1,561,210
2
ANNUAL STATEMENT FOR THE YEAR 2008 OF THE TEXAS LIFE INSURANCE COMPANY
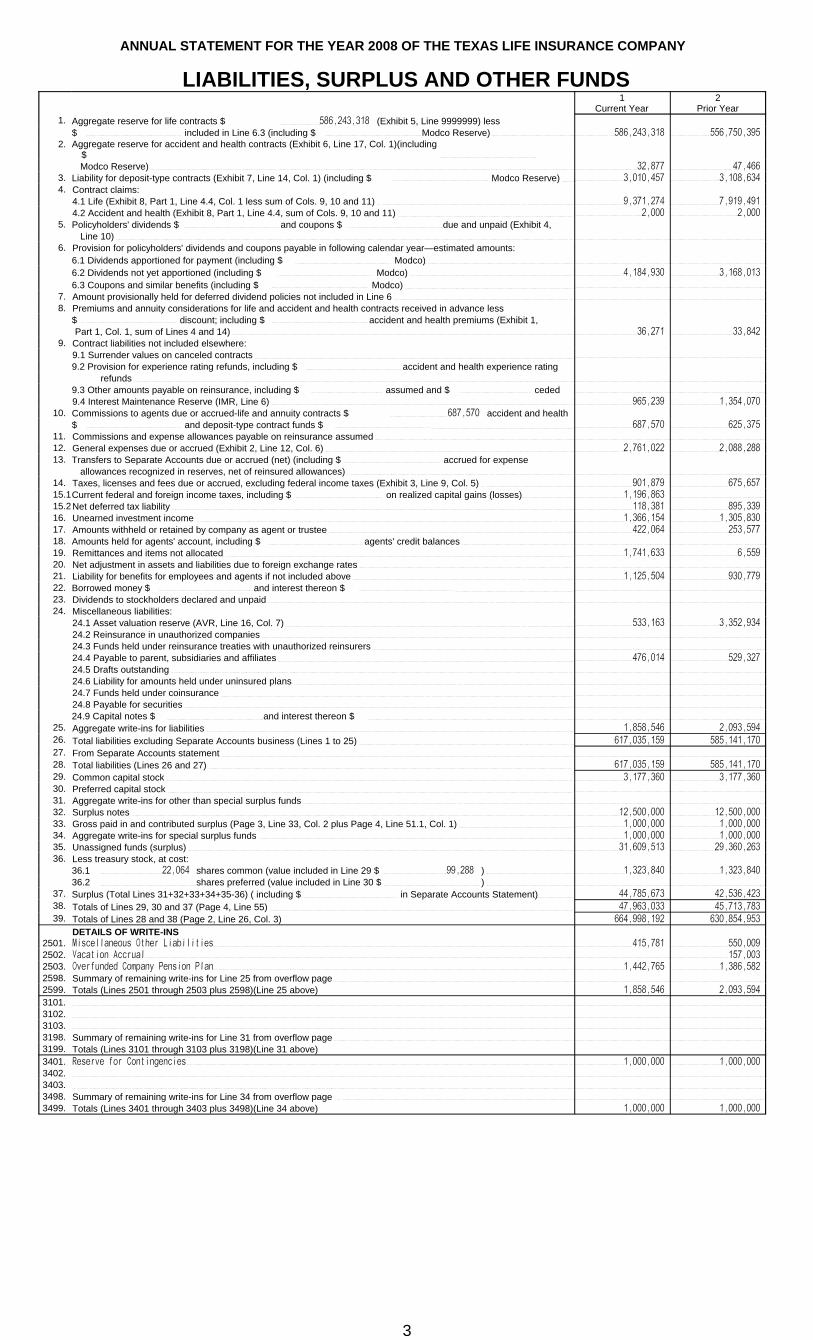
LIABILITIES, SURPLUS AND OTHER FUNDS1
Current Year2
Prior Year1. Aggregate reserve for life contracts $ 586,243,318 (Exhibit 5, Line 9999999) less
$ included in Line 6.3 (including $ Modco Reserve) 586,243,318 556,750,395 2. Aggregate reserve for accident and health contracts (Exhibit 6, Line 17, Col. 1)(including
$ Modco Reserve) 32,877 47,466
3. Liability for deposit-type contracts (Exhibit 7, Line 14, Col. 1) (including $ Modco Reserve) 3,010,457 3,108,634 4. Contract claims:
4.1 Life (Exhibit 8, Part 1, Line 4.4, Col. 1 less sum of Cols. 9, 10 and 11) 9,371,274 7,919,491 4.2 Accident and health (Exhibit 8, Part 1, Line 4.4, sum of Cols. 9, 10 and 11) 2,000 2,000
5. Policyholders' dividends $ and coupons $ due and unpaid (Exhibit 4, Line 10)
6. Provision for policyholders' dividends and coupons payable in following calendar year—estimated amounts:6.1 Dividends apportioned for payment (including $ Modco)6.2 Dividends not yet apportioned (including $ Modco) 4,184,930 3,168,013 6.3 Coupons and similar benefits (including $ Modco)
7. Amount provisionally held for deferred dividend policies not included in Line 6 8. Premiums and annuity considerations for life and accident and health contracts received in advance less
$ discount; including $ accident and health premiums (Exhibit 1, Part 1, Col. 1, sum of Lines 4 and 14) 36,271 33,842
9. Contract liabilities not included elsewhere: 9.1 Surrender values on canceled contracts
9.2 Provision for experience rating refunds, including $ accident and health experience rating refunds
9.3 Other amounts payable on reinsurance, including $ assumed and $ ceded9.4 Interest Maintenance Reserve (IMR, Line 6) 965,239 1,354,070
10. Commissions to agents due or accrued-life and annuity contracts $ 687,570 accident and health$ and deposit-type contract funds $ 687,570 625,375
11. Commissions and expense allowances payable on reinsurance assumed 12. General expenses due or accrued (Exhibit 2, Line 12, Col. 6) 2,761,022 2,088,288 13. Transfers to Separate Accounts due or accrued (net) (including $ accrued for expense
allowances recognized in reserves, net of reinsured allowances) 14. Taxes, licenses and fees due or accrued, excluding federal income taxes (Exhibit 3, Line 9, Col. 5) 901,879 675,657 15.1Current federal and foreign income taxes, including $ on realized capital gains (losses) 1,196,863 15.2Net deferred tax liability 118,381 895,339 16. Unearned investment income 1,366,154 1,305,830 17. Amounts withheld or retained by company as agent or trustee 422,064 253,577 18. Amounts held for agents' account, including $ agents' credit balances 19. Remittances and items not allocated 1,741,633 6,559 20. Net adjustment in assets and liabilities due to foreign exchange rates 21. Liability for benefits for employees and agents if not included above 1,125,504 930,779 22. Borrowed money $ and interest thereon $23. Dividends to stockholders declared and unpaid 24. Miscellaneous liabilities:
24.1 Asset valuation reserve (AVR, Line 16, Col. 7) 533,163 3,352,934 24.2 Reinsurance in unauthorized companies 24.3 Funds held under reinsurance treaties with unauthorized reinsurers 24.4 Payable to parent, subsidiaries and affiliates 476,014 529,327 24.5 Drafts outstanding 24.6 Liability for amounts held under uninsured plans 24.7 Funds held under coinsurance 24.8 Payable for securities 24.9 Capital notes $ and interest thereon $
25. Aggregate write-ins for liabilities 1,858,546 2,093,594 26. Total liabilities excluding Separate Accounts business (Lines 1 to 25) 617,035,159 585,141,170 27. From Separate Accounts statement 28. Total liabilities (Lines 26 and 27) 617,035,159 585,141,170 29. Common capital stock 3,177,360 3,177,360 30. Preferred capital stock 31. Aggregate write-ins for other than special surplus funds 32. Surplus notes 12,500,000 12,500,000 33. Gross paid in and contributed surplus (Page 3, Line 33, Col. 2 plus Page 4, Line 51.1, Col. 1) 1,000,000 1,000,000 34. Aggregate write-ins for special surplus funds 1,000,000 1,000,000 35. Unassigned funds (surplus) 31,609,513 29,360,263 36. Less treasury stock, at cost:
36.1 22,064 shares common (value included in Line 29 $ 99,288 ) 1,323,840 1,323,840 36.2 shares preferred (value included in Line 30 $ )
37. Surplus (Total Lines 31+32+33+34+35-36) ( including $ in Separate Accounts Statement) 44,785,673 42,536,423 38. Totals of Lines 29, 30 and 37 (Page 4, Line 55) 47,963,033 45,713,783 39. Totals of Lines 28 and 38 (Page 2, Line 26, Col. 3) 664,998,192 630,854,953
DETAILS OF WRITE-INS2501. Miscellaneous Other Liabilities 415,781 550,009 2502. Vacation Accrual 157,003 2503. Overfunded Company Pension Plan 1,442,765 1,386,582 2598. Summary of remaining write-ins for Line 25 from overflow page 2599. Totals (Lines 2501 through 2503 plus 2598)(Line 25 above) 1,858,546 2,093,594 3101.3102.3103.3198. Summary of remaining write-ins for Line 31 from overflow page 3199. Totals (Lines 3101 through 3103 plus 3198)(Line 31 above)3401. Reserve for Contingencies 1,000,000 1,000,000 3402.3403.3498. Summary of remaining write-ins for Line 34 from overflow page 3499. Totals (Lines 3401 through 3403 plus 3498)(Line 34 above) 1,000,000 1,000,000
3

ANNUAL STATEMENT FOR THE YEAR 2008 OF THE TEXAS LIFE INSURANCE COMPANY
SUMMARY OF OPERATIONS1
Current Year2
Prior Year1. Premiums and annuity considerations for life and accident and health contracts (Exhibit 1, Part 1, Line 20.4, Col. 1, less
Col. 11) 129,764,274 112,330,046 2. Considerations for supplementary contracts with life contingencies 441,850 898,265 3. Net investment income (Exhibit of Net Investment Income, Line 17) 36,349,007 38,297,764 4. Amortization of Interest Maintenance Reserve (IMR, Line 5) (116,426) (106,368)5. Separate Accounts net gain from operations excluding unrealized gains or losses6. Commissions and expense allowances on reinsurance ceded (Exhibit 1, Part 2, Line 26.1, Col. 1) 7. Reserve adjustments on reinsurance ceded 8. Miscellaneous Income:
8.1 Income from fees associated with investment management, administration and contract guarantees from Separate Accounts
8.2 Charges and fees for deposit-type contracts 8.3 Aggregate write-ins for miscellaneous income 147,640 792,602
9. Totals (Lines 1 to 8.3) 166,586,345 152,212,309 10. Death benefits 52,227,348 39,402,719 11. Matured endowments (excluding guaranteed annual pure endowments) 102,508 62,464 12. Annuity benefits (Exhibit 8, Part 2, Line 6.4, Cols. 4 + 8) 1,852,061 2,571,161 13. Disability benefits and benefits under accident and health contracts 91,294 89,583 14. Coupons, guaranteed annual pure endowments and similar benefits 15. Surrender benefits and withdrawals for life contracts 15,300,173 16,650,922 16. Group conversions 17. Interest and adjustments on contract or deposit-type contract funds 156,985 23,802 18. Payments on supplementary contracts with life contingencies 752,762 766,972 19. Increase in aggregate reserves for life and accident and health contracts 29,420,232 24,334,557 20. Totals (Lines 10 to 19) 99,903,363 83,902,180 21. Commissions on premiums, annuity considerations, and deposit-type contract funds (direct business only) (Exhibit 1, Part
2, Line 31, Col. 1) 31,435,356 26,017,750 22. Commissions and expense allowances on reinsurance assumed (Exhibit 1, Part 2, Line 26.2, Col. 1) 23. General insurance expenses (Exhibit 2, Line 10, Columns 1 , 2, 3 and 4) 15,852,048 15,227,660 24. Insurance taxes, licenses and fees, excluding federal income taxes (Exhibit 3, Line 7, Cols. 1 + 2 + 3) 3,191,110 3,024,000 25. Increase in loading on deferred and uncollected premiums 87,823 445,875 26. Net transfers to or (from) Separate Accounts net of reinsurance 27. Aggregate write-ins for deductions 38,268 (2,111,771)28. Totals (Lines 20 to 27) 150,507,968 126,505,694 29. Net gain from operations before dividends to policyholders and federal income taxes (Line 9 minus Line 28) 16,078,377 25,706,615 30. Dividends to policyholders 3,796,214 3,174,437 31. Net gain from operations after dividends to policyholders and before federal income taxes (Line 29 minus Line 30) 12,282,163 22,532,178 32. Federal and foreign income taxes incurred (excluding tax on capital gains) 5,893,505 8,165,364 33. Net gain from operations after dividends to policyholders and federal income taxes and before realized capital gains or
(losses) (Line 31 minus Line 32) 6,388,658 14,366,814 34. Net realized capital gains (losses) (excluding gains (losses) transferred to the IMR)
less capital gains tax of $ (7,405,556) (excluding taxes of $ 272,060 transferred to the IMR) (9,825,167) (1,119,617)35. Net income (Line 33 plus Line 34) (3,436,509) 13,247,197
CAPITAL AND SURPLUS ACCOUNT36. Capital and surplus, December 31, prior year (Page 3, Line 38, Col. 2) 45,713,783 39,696,084 37. Net income (Line 35) (3,436,509) 13,247,197 38. Change in net unrealized capital gains (losses) less capital gains tax of $ . 581,563 (306,371)39. Change in net unrealized foreign exchange capital gain (loss)40. Change in net deferred income tax 5,050,285 (394,832)41. Change in nonadmitted assets (2,765,851) (138,698)42. Change in liability for reinsurance in unauthorized companies 43. Change in reserve on account of change in valuation basis, (increase) or decrease (Exhibit 5A, Line 9999999, Col. 4) 44. Change in asset valuation reserve 2,819,762 1,725,364 45. Change in treasury stock (Page 3, Lines 36.1 and 36.2 Col. 2 minus Col. 1) 46. Surplus (contributed to) withdrawn from Separate Accounts during period47. Other changes in surplus in Separate Accounts statement 48. Change in surplus notes 49. Cumulative effect of changes in accounting principles 50. Capital changes:
50.1 Paid in 50.2 Transferred from surplus (Stock Dividend) 50.3 Transferred to surplus
51. Surplus adjustment:51.1 Paid in 51.2 Transferred to capital (Stock Dividend) 51.3 Transferred from capital 51.4 Change in surplus as a result of reinsurance
52. Dividends to stockholders (6,500,000)53. Aggregate write-ins for gains and losses in surplus (1,614,961)54. Net change in capital and surplus for the year (Lines 37 through 53) 2,249,250 6,017,699 55. Capital and surplus, December 31, current year (Lines 36 + 54) (Page 3, Line 38) 47,963,033 45,713,783
DETAILS OF WRITE-INS08.301. Other Income 147,640 792,602 08.302.08.303.08.398. Summary of remaining write-ins for Line 8.3 from overflow page 08.399. Totals (Lines 08.301 through 08.303 plus 08.398) (Line 8.3 above) 147,640 792,602 2701. Other Deductions 38,268 23,281 2702. CY IMR Liab Released (2,135,052)2703.2798. Summary of remaining write-ins for Line 27 from overflow page 2799. Totals (Lines 2701 through 2703 plus 2798) (Line 27 above) 38,268 (2,111,771)5301. Structured Settlements on Assumption Reinsurance-AVR (1,614,961)5302.5303.5398. Summary of remaining write-ins for Line 53 from overflow page 5399. Totals (Lines 5301 through 5303 plus 5398) (Line 53 above) (1,614,961)
4

ANNUAL STATEMENT FOR THE YEAR 2008 OF THE TEXAS LIFE INSURANCE COMPANY
CASH FLOW1
Current Year2
Prior Year Cash from Operations1. Premiums collected net of reinsurance 130,167,667 111,967,748 2. Net investment income 35,354,504 44,969,345 3. Miscellaneous income 89,640 785,602 4. Total (Lines 1 through 3) 165,611,811 157,722,695 5. Benefit and loss related payments 69,337,666 60,060,657 6. Net transfers to Separate Accounts, Segregated Accounts and Protected Cell Accounts7. Commissions, expenses paid and aggregate write-ins for deductions 49,224,291 42,774,045 8. Dividends paid to policyholders 2,779,297 2,603,406 9. Federal and foreign income taxes paid (recovered) net of $ (7,677,616) tax on capital gains (losses) (1,421,252) 119,831,784
10. Total (Lines 5 through 9) 119,920,002 225,269,892 11. Net cash from operations (Line 4 minus Line 10) 45,691,809 (67,547,197)
Cash from Investments12. Proceeds from investments sold, matured or repaid:
12.1 Bonds 107,037,677 359,764,114 12.2 Stocks 822,496 32,174,480 12.3 Mortgage loans 6,184,833 5,146,605 12.4 Real estate 12.5 Other invested assets 12.6 Net gains or (losses) on cash, cash equivalents and short-term investments (3)12.7 Miscellaneous proceeds 17,019,307 46,620 12.8 Total investment proceeds (Lines 12.1 to 12.7) 131,064,313 397,131,816
13. Cost of investments acquired (long-term only):13.1 Bonds 158,018,815 95,544,307 13.2 Stocks 25,668 84,214 13.3 Mortgage loans 3,218,525 4,449,998 13.4 Real estate 84,698 199,101 13.5 Other invested assets 9,675 13.6 Miscellaneous applications 16,524,555
13.7 Total investments acquired (Lines 13.1 to 13.6) 177,881,936 100,277,620 14. Net increase (decrease) in contract loans and premium notes 1,276,302 (266,795)15. Net cash from investments (Line 12.8 minus Line 13.7 minus Line 14) (48,093,925) 297,120,991
Cash from Financing and Miscellaneous Sources16. Cash provided (applied):
16.1 Surplus notes, capital notes 16.2 Capital and paid in surplus, less treasury stock16.3 Borrowed funds 16.4 Net deposits on deposit-type contracts and other insurance liabilities (98,177) (1,260,666)16.5 Dividends to stockholders 6,500,000 16.6 Other cash provided (applied) 2,091,919 (229,868,905)
17. Net cash from financing and miscellaneous sources (Lines 16.1 to 16.4 minus Line 16.5 plus Line 16.6) 1,993,742 (237,629,571)
RECONCILIATION OF CASH, CASH EQUIVALENTS AND SHORT-TERM INVESTMENTS18. Net change in cash, cash equivalents and short-term investments (Line 11, plus Lines 15 and 17) (408,374) (8,055,777)19. Cash, cash equivalents and short-term investments:
19.1 Beginning of year 32,218,378 40,274,155 19.2 End of year (Line 18 plus Line 19.1) 31,810,004 32,218,378
5

ANNUAL STATEMENT FOR THE YEAR 2008 OF THE TEXAS LIFE INSURANCE COMPANY
ANALYSIS OF OPERATIONS BY LINES OF BUSINESS1 2 Ordinary 6 Group Accident and Health 12
Total Industrial Life
3
Life Insurance
4
Individual Annuities
5Supplementary
ContractsCredit Life (Group
and Individual)
7Life Insurance
(a)
8
Annuities
9
Group
10Credit (Group and
Individual)
11
Other
Aggregate of All Other Lines of
Business1. Premiums and annuity considerations for life and accident and health contracts 129,764,274 129,487,286 73,464 36,189 161,802 5,533 2. Considerations for supplementary contracts with life contingencies 441,850 441,850 3. Net investment income 36,349,007 34,380,748 674,451 538,568 2,553 749,772 2,915 4. Amortization of Interest Maintenance Reserve (IMR) (116,426) (110,169) (2,144) (1,712) (8) (2,384) (9)5. Separate Accounts net gain from operations excluding unrealized gains or losses 6. Commissions and expense allowances on reinsurance ceded 7. Reserve adjustments on reinsurance ceded 8. Miscellaneous Income:
8.1 Fees associated with income from investment management, administration and contract guarantees from Separate Accounts
8.2 Charges and fees for deposit-type contracts 8.3 Aggregate write-ins for miscellaneous income 147,640 147,640
9. Totals (Lines 1 to 8.3) 166,586,345 163,905,505 745,771 978,706 38,734 909,190 8,439 10. Death benefits 52,227,348 52,091,150 136,198 11. Matured endowments (excluding guaranteed annual pure endowments) 102,508 102,508 12. Annuity benefits 1,852,061 812,876 1,039,185 13. Disability benefits and benefits under accident and health contracts 91,294 86,094 5,200 14. Coupons, guaranteed annual pure endowments and similar benefits 15. Surrender benefits and withdrawals for life contracts 15,300,173 15,300,173 16. Group conversions 17. Interest and adjustments on contract or deposit-type contract funds 156,987 156,987 18. Payments on supplementary contracts with life contingencies 752,762 752,762 19. Increase in aggregate reserves for life and accident and health contracts 29,420,232 29,729,284 (273,515) 266,924 17,988 (305,860) (14,589)20. Totals (Lines 10 to 19) 99,903,365 97,466,196 539,361 1,019,686 154,186 733,325 (9,389)21. Commissions on premiums, annuity considerations and deposit-type contract funds (direct
business only) 31,435,356 31,431,056 2,939 2 1,324 35 22. Commissions and expense allowances on reinsurance assumed 23. General insurance expenses 15,852,048 15,785,130 11,938 4,477 41,784 8,719 24. Insurance taxes, licenses and fees, excluding federal income taxes 3,191,109 3,173,619 1,530 9,212 754 3,373 2,621 25. Increase in loading on deferred and uncollected premiums 87,822 87,822 26. Net transfers to or (from) Separate Accounts net of reinsurance27. Aggregate write-ins for deductions 38,268 38,268 28. Totals (Lines 20 to 27) 150,507,968 147,982,091 555,768 1,028,898 159,419 779,806 1,986 29. Net gain from operations before dividends to policyholders and federal income taxes
(Line 9 minus Line 28) 16,078,377 15,923,414 190,003 (50,192) (120,685) 129,384 6,453 30. Dividends to policyholders 3,796,214 3,796,214 31. Net gain from operations after dividends to policyholders and before federal income taxes
(Line 29 minus Line 30) 12,282,163 12,127,200 190,003 (50,192) (120,685) 129,384 6,453 32. Federal income taxes incurred (excluding tax on capital gains) 5,893,505 5,839,268 66,501 (17,567) (42,240) 45,284 2,259 33. Net gain from operations after dividends to policyholders and federal income taxes and
before realized capital gains or (losses) (Line 31 minus Line 32) 6,388,658 6,287,932 123,502 (32,625) (78,445) 84,100 4,194 DETAILS OF WRITE-INS
08.301. Miscellaneous Income 147,640 147,640 08.302.08.303.08.398. Summary of remaining write-ins for Line 8.3 from overflow page 08.399. Totals (Lines 08.301 through 08.303 plus 08.398) (Line 8.3 above) 147,640 147,640 2701. Other Deductions 38,268 38,268 2702.2703.2798. Summary of remaining write-ins for Line 27 from overflow page 2799. Totals (Lines 2701 through 2703 plus 2798) (Line 27 above) 38,268 38,268
(a) Includes the following amounts for FEGLI/SGLI: Line 1 , Line 10 , Line 16 , Line 23 . Line 24
6

ANNUAL STATEMENT FOR THE YEAR 2008 OF THE TEXAS LIFE INSURANCE COMPANY
ANALYSIS OF INCREASE IN RESERVES DURING THE YEAR1 2 Ordinary 6 Group
Total Industrial Life
3
Life Insurance
4
Individual Annuities
5Supplementary
ContractsCredit Life
(Group and Individual)
7
Life Insurance
8
Annuities
Involving Life or Disability Contingencies (Reserves)
(Net of Reinsurance Ceded)
1. Reserve December 31, prior year 556,750,394 528,837,272 8,873,285 6,918,781 12,121,056
2. Tabular net premiums or considerations 135,629,105 134,915,800 73,464 441,850 36,189 161,802
3. Present value of disability claims incurred 21,452 21,146 XXX 306
4. Tabular interest 31,063,668 29,346,776 637,768 202,947 876,177
5. Tabular less actual reserve released (66,533) 38,260 (171,870) 371,731 (304,654)
6. Increase in reserve on account of change in valuation basis
7. Other increases (net)
8. Totals (Lines 1 to 7) 723,398,086 693,159,254 9,412,647 7,935,309 36,495 12,854,381
9. Tabular cost 104,110,171 104,091,664 XXX 18,507
10. Reserves released by death 9,601,961 9,601,961 XXX XXX XXX
11. Reserves released by other terminations (net) 20,754,876 20,754,876
12. Annuity, supplementary contract, and disability payments involving life contingencies 2,687,760 86,094 812,877 749,604 1,039,185
13. Net transfers to or (from) Separate Accounts
14. Total deductions (Lines 9 to 13) 137,154,768 134,534,595 812,877 749,604 18,507 1,039,185
15. Reserve December 31, current year 586,243,318 558,624,659 8,599,770 7,185,705 17,988 11,815,196
7
ANNUAL STATEMENT FOR THE YEAR 2008 OF THE TEXAS LIFE INSURANCE COMPANY
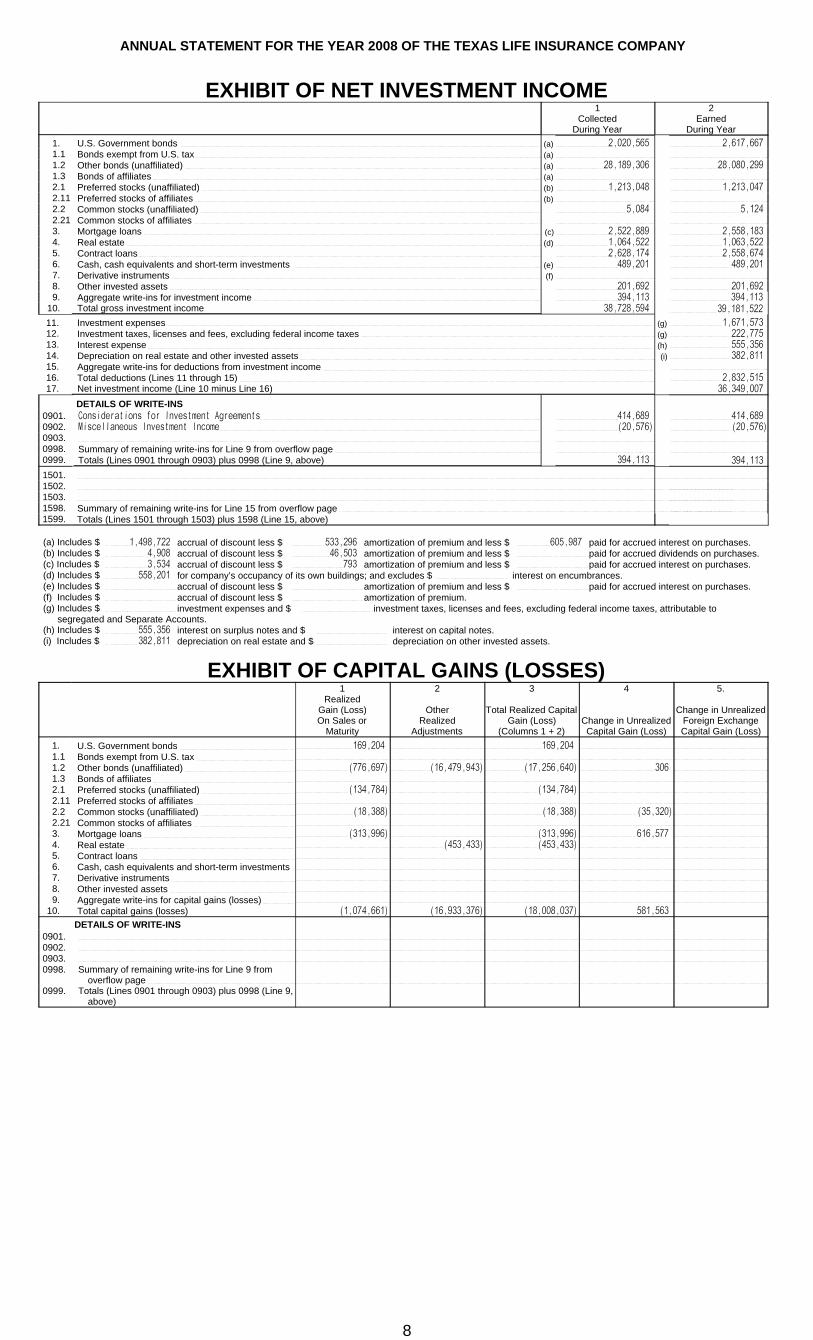
EXHIBIT OF NET INVESTMENT INCOME1
CollectedDuring Year
2Earned
During Year1. U.S. Government bonds (a) 2,020,565 2,617,667 1.1 Bonds exempt from U.S. tax (a)1.2 Other bonds (unaffiliated) (a) 28,189,306 28,080,299 1.3 Bonds of affiliates (a)2.1 Preferred stocks (unaffiliated) (b) 1,213,048 1,213,047 2.11 Preferred stocks of affiliates (b)2.2 Common stocks (unaffiliated) 5,084 5,124 2.21 Common stocks of affiliates 3. Mortgage loans (c) 2,522,889 2,558,183 4. Real estate (d) 1,064,522 1,063,522 5. Contract loans 2,628,174 2,558,674 6. Cash, cash equivalents and short-term investments (e) 489,201 489,201 7. Derivative instruments (f)8. Other invested assets 201,692 201,692 9. Aggregate write-ins for investment income 394,113 394,113
10. Total gross investment income 38,728,594 39,181,522
11. Investment expenses (g) 1,671,573 12. Investment taxes, licenses and fees, excluding federal income taxes (g) 222,775 13. Interest expense (h) 555,356 14. Depreciation on real estate and other invested assets (i) 382,811 15. Aggregate write-ins for deductions from investment income 16. Total deductions (Lines 11 through 15) 2,832,515 17. Net investment income (Line 10 minus Line 16) 36,349,007
DETAILS OF WRITE-INS0901. Considerations for Investment Agreements 414,689 414,689 0902. Miscellaneous Investment Income (20,576) (20,576)0903.0998. Summary of remaining write-ins for Line 9 from overflow page 0999. Totals (Lines 0901 through 0903) plus 0998 (Line 9, above) 394,113 394,113
1501.1502.1503.1598. Summary of remaining write-ins for Line 15 from overflow page 1599. Totals (Lines 1501 through 1503) plus 1598 (Line 15, above)
(a) Includes $ 1,498,722 accrual of discount less $ 533,296 amortization of premium and less $ 605,987 paid for accrued interest on purchases.(b) Includes $ 4,908 accrual of discount less $ 46,503 amortization of premium and less $ paid for accrued dividends on purchases.(c) Includes $ 3,534 accrual of discount less $ 793 amortization of premium and less $ paid for accrued interest on purchases.(d) Includes $ 558,201 for company’s occupancy of its own buildings; and excludes $ interest on encumbrances.(e) Includes $ accrual of discount less $ amortization of premium and less $ paid for accrued interest on purchases.(f) Includes $ accrual of discount less $ amortization of premium.(g) Includes $ investment expenses and $ investment taxes, licenses and fees, excluding federal income taxes, attributable to
segregated and Separate Accounts.(h) Includes $ 555,356 interest on surplus notes and $ interest on capital notes.(i) Includes $ 382,811 depreciation on real estate and $ depreciation on other invested assets.
EXHIBIT OF CAPITAL GAINS (LOSSES)1
RealizedGain (Loss)On Sales or
Maturity
2
OtherRealized
Adjustments
3
Total Realized Capital Gain (Loss)
(Columns 1 + 2)
4
Change in UnrealizedCapital Gain (Loss)
5.
Change in UnrealizedForeign ExchangeCapital Gain (Loss)
1. U.S. Government bonds 169,204 169,204 1.1 Bonds exempt from U.S. tax 1.2 Other bonds (unaffiliated) (776,697) (16,479,943) (17,256,640) 306 1.3 Bonds of affiliates 2.1 Preferred stocks (unaffiliated) (134,784) (134,784)2.11 Preferred stocks of affiliates 2.2 Common stocks (unaffiliated) (18,388) (18,388) (35,320)2.21 Common stocks of affiliates 3. Mortgage loans (313,996) (313,996) 616,577 4. Real estate (453,433) (453,433)5. Contract loans 6. Cash, cash equivalents and short-term investments 7. Derivative instruments 8. Other invested assets 9. Aggregate write-ins for capital gains (losses)
10. Total capital gains (losses) (1,074,661) (16,933,376) (18,008,037) 581,563
DETAILS OF WRITE-INS0901.0902.0903.0998. Summary of remaining write-ins for Line 9 from
overflow page 0999. Totals (Lines 0901 through 0903) plus 0998 (Line 9,
above)
8

ANNUAL STATEMENT FOR THE YEAR 2008 OF THE TEXAS LIFE INSURANCE COMPANY
EXHIBIT 1 - PART 1 - PREMIUMS AND ANNUITY CONSIDERATIONS FOR LIFE AND ACCIDENT AND HEALTH POLICIES AND CONTRACTS1 2 Ordinary 5 Group Accident and Health 11
Total Industrial Life
3
Life Insurance
4
Individual AnnuitiesCredit Life (Group
and Individual)
6
Life Insurance
7
Annuities
8
Group
9Credit (Group and
Individual)
10
OtherAggregate of All Other
Lines of BusinessFIRST YEAR (other than single)
1. Uncollected (106,318) (106,318)2. Deferred and accrued 980,793 980,793 3. Deferred , accrued and uncollected:
3.1 Direct 1,031,638 1,031,638 3.2 Reinsurance assumed 3.3 Reinsurance ceded 157,163 157,163 3.4 Net (Line 1 + Line 2) 874,475 874,475
4. Advance 5,980 5,980 5. Line 3.4 - Line 4 868,495 868,495 6. Collected during year:
6.1 Direct 26,300,643 26,300,643 6.2 Reinsurance assumed 6.3 Reinsurance ceded 546,382 546,382 6.4 Net 25,754,261 25,754,261
7. Line 5 + Line 6.4 26,622,756 26,622,756 8. Prior year (uncollected + deferred and accrued -
advance) 1,191,440 1,191,440 9. First year premiums and considerations:
9.1 Direct 26,109,894 26,109,894 9.2 Reinsurance assumed 9.3 Reinsurance ceded 678,578 678,578 9.4 Net (Line 7 - Line 8) 25,431,316 25,431,316
SINGLE10. Single premiums and considerations:
10.1 Direct 2,189,438 2,189,438 10.2 Reinsurance assumed 10.3 Reinsurance ceded 10.4 Net 2,189,438 2,189,438
RENEWAL11. Uncollected 225,136 225,136 12. Deferred and accrued 6,009,294 6,009,294 13. Deferred, accrued and uncollected:
13.1 Direct 6,802,058 6,802,058 13.2 Reinsurance assumed 13.3 Reinsurance ceded 567,628 567,628 13.4 Net (Line 11 + Line 12) 6,234,430 6,234,430
14. Advance 30,291 30,291 15. Line 13.4 - Line 14 6,204,139 6,204,139 16. Collected during year:
16.1 Direct 105,076,184 104,799,196 73,464 36,189 161,802 5,533 16.2 Reinsurance assumed 16.3 Reinsurance ceded 3,294,064 3,294,064 16.4 Net 101,782,120 101,505,132 73,464 36,189 161,802 5,533
17. Line 15 + Line 16.4 107,986,259 107,709,271 73,464 36,189 161,802 5,533 18. Prior year (uncollected + deferred and accrued -
advance) 5,842,739 5,842,739 19. Renewal premiums and considerations:
19.1 Direct 106,019,031 105,742,043 73,464 36,189 161,802 5,533 19.2 Reinsurance assumed 19.3 Reinsurance ceded 3,875,511 3,875,511 19.4 Net (Line 17 - Line 18) 102,143,520 101,866,532 73,464 36,189 161,802 5,533
TOTAL20. Total premiums and annuity considerations:
20.1 Direct 134,318,363 134,041,375 73,464 36,189 161,802 5,533 20.2 Reinsurance assumed 20.3 Reinsurance ceded 4,554,089 4,554,089 20.4 Net (Lines 9.4 + 10.4 + 19.4) 129,764,274 129,487,286 73,464 36,189 161,802 5,533
9

ANNUAL STATEMENT FOR THE YEAR 2008 OF THE TEXAS LIFE INSURANCE COMPANY
EXHIBIT 1 - PART 2 - DIVIDENDS AND COUPONS APPLIED, REINSURANCE COMMISSIONS AND EXPENSEALLOWANCES AND COMMISSIONS INCURRED (Direct Business Only)
1 2 Ordinary 5 Group Accident and Health 11
Total Industrial Life
3
Life Insurance
4
Individual AnnuitiesCredit Life
(Group and Individual)
6
Life Insurance
7
Annuities
8
Group
9Credit
(Group and Individual)
10
OtherAggregate of All Other
Lines of BusinessDIVIDENDS AND COUPONS APPLIED (included in Part 1)
21. To pay renewal premiums 22. All other 2,764,635 2,764,635
REINSURANCE COMMISSIONS AND EXPENSE ALLOWANCES INCURRED
23. First year (other than single): 23.1 Reinsurance ceded 23.2 Reinsurance assumed 23.3 Net ceded less assumed
24. Single:24.1 Reinsurance ceded 24.2 Reinsurance assumed 24.3 Net ceded less assumed
25. Renewal:25.1 Reinsurance ceded 25.2 Reinsurance assumed 25.3 Net ceded less assumed
26. Totals:26.1 Reinsurance ceded (Page
6, Line 6) 26.2 Reinsurance assumed
(Page 6, Line 22)
26.3 Net ceded less assumed COMMISSIONS INCURRED (direct business only)
27. First year (other than single) 27,105,884 27,105,884 28. Single 9,755 9,755 29. Renewal 4,319,717 4,315,417 2,939 2 1,324 35 30. Deposit-type contract funds 31. Totals (to agree with Page 6,
Line 21) 31,435,356 31,431,056 2,939 2 1,324 35
10

ANNUAL STATEMENT FOR THE YEAR 2008 OF THE TEXAS LIFE INSURANCE COMPANY
EXHIBIT 2 - GENERAL EXPENSESInsurance 5 6
1 Accident and Health 4
Life
2Cost
Containment
3All
OtherAll Other Lines of
Business Investment Total1. Rent 548,130 302 9,769 558,201 2. Salaries and wages 7,771,314 4,277 138,454 7,914,045 3.11 Contributions for benefit plans for employees 1,307,260 719 23,362 1,331,341 3.12 Contributions for benefit plans for agents (104,143) (57) (1,856) (106,056)3.21 Payments to employees under non-funded benefit plans 3.22 Payments to agents under non-funded benefit plans 3.31 Other employee welfare 45,808 25 817 46,650 3.32 Other agent welfare 4.1 Legal fees and expenses 398,427 219 7,101 405,747 4.2 Medical examination fees 36,660 20 653 37,333 4.3 Inspection report fees 52,971 29 944 53,944 4.4 Fees of public accountants and consulting actuaries 271,175 149 4,833 276,157 4.5 Expense of investigation and settlement of policy claims 60,581 33 1,080 61,694 5.1 Traveling expenses 419,534 231 7,477 427,242 5.2 Advertising 202,548 111 3,610 206,269 5.3 Postage, express, telegraph and telephone 817,885 450 14,575 832,910 5.4 Printing and stationery 495,047 272 8,822 504,141 5.5 Cost or depreciation of furniture and equipment 163,997 90 2,923 167,010 5.6 Rental of equipment 158,403 87 2,823 161,313 5.7 Cost or depreciation of EDP equipment and software 278,928 153 4,971 284,052 6.1 Books and periodicals 39,763 22 709 40,494 6.2 Bureau and association fees 39,681 22 706 40,409 6.3 Insurance, except on real estate 93,234 51 1,662 94,947 6.4 Miscellaneous losses 4,696 3 84 4,783 6.5 Collection and bank service charges 57,407 32 1,023 58,462 6.6 Sundry general expenses 2,398,666 1,320 2,082 2,402,068 6.7 Group service and administration fees 6.8 Reimbursements by uninsured plans 7.1 Agency expense allowance 7.2 Agents' balances charged off (less
$ 82 recovered) 81 1 82 7.3 Agency conferences other than local meetings 177,519 100 3,164 180,783 9.1 Real estate expenses 765,317 765,317 9.2 Investment expenses not included elsewhere 664,547 664,547 9.3 Aggregate write-ins for expenses 107,757 59 1,920 109,736
10. General expenses incurred 15,843,329 8,719 1,671,573 (a) 17,523,621 11. General expenses unpaid December 31, prior year 2,082,660 1,146 4,482 2,088,288 12. General expenses unpaid December 31, current year 2,754,830 1,516 4,676 2,761,022 13. Amounts receivable relating to uninsured plans, prior year 14. Amounts receivable relating to uninsured plans, current
year 15. General expenses paid during year (Lines 10+11-12-
13+14) 15,171,159 8,349 1,671,379 16,850,887
DETAILS OF WRITE-INS09.301. Software Upgrades & Maintenance 107,757 59 1,920 109,736 09.302.09.303.09.398. Summary of remaining write-ins for Line 9.3 from overflow
page 09.399. Totals (Lines 09.301 through 09.303 + 09.398) (Line 9.3
above) 107,757 59 1,920 109,736 (a) Includes management fees of $ 512,021 to affiliates and $ to non-affiliates.
EXHIBIT 3 - TAXES, LICENSES AND FEES (EXCLUDING FEDERAL INCOME TAXES)
Insurance 4 51
Life
2
Accident and Health
3All Other Lines of
Business Investment Total1. Real estate taxes 180,707 180,707 2. State insurance department licenses and fees 299,948 265 2,576 302,789 3. State taxes on premiums 2,384,434 1,902 20,482 2,406,818 4. Other state taxes, incl. $
for employee benefits 6,296 1 (79) 6,218 5. U.S. Social Security taxes 499,240 441 4,365 504,046 6. All other taxes (1,429) 12 14,724 13,307 7. Taxes, licenses and fees incurred 3,188,489 2,621 222,775 3,413,885 8. Taxes, licenses and fees unpaid December 31, prior year 624,962 6,695 44,000 675,657 9. Taxes, licenses and fees unpaid December 31, current year 869,684 761 31,434 901,879
10. Taxes, licenses and fees paid during year (Lines 7 + 8 - 9) 2,943,767 8,555 235,341 3,187,663
EXHIBIT 4 - DIVIDENDS OR REFUNDS1
Life2
Accident and Health1. Applied to pay renewal premiums 2. Applied to shorten the endowment or premium-paying period 3. Applied to provide paid-up additions 2,764,635 4. Applied to provide paid-up annuities 5. Total Lines 1 through 4 2,764,635 6. Paid in cash 13,624 7. Left on deposit 1,037 8. Aggregate write-ins for dividend or refund options 9. Total Lines 5 through 8 2,779,296
10. Amount due and unpaid 11. Provision for dividends or refunds payable in the following calendar year 4,184,930 12. Terminal dividends 13. Provision for deferred dividend contracts 14. Amount provisionally held for deferred dividend contracts not included in Line 13 15. Total Lines 10 through 14 4,184,930 16. Total from prior year 3,168,013 17. Total dividends or refunds (Lines 9 + 15 - 16) 3,796,213
DETAILS OF WRITE-INS0801.0802.0803.0898. Summary of remaining write-ins for Line 8 from overflow page 0899. Totals (Lines 0801 through 0803 + 0898) (Line 8 above)
11
ANNUAL STATEMENT FOR THE YEAR 2008 OF THE TEXAS LIFE INSURANCE COMPANY
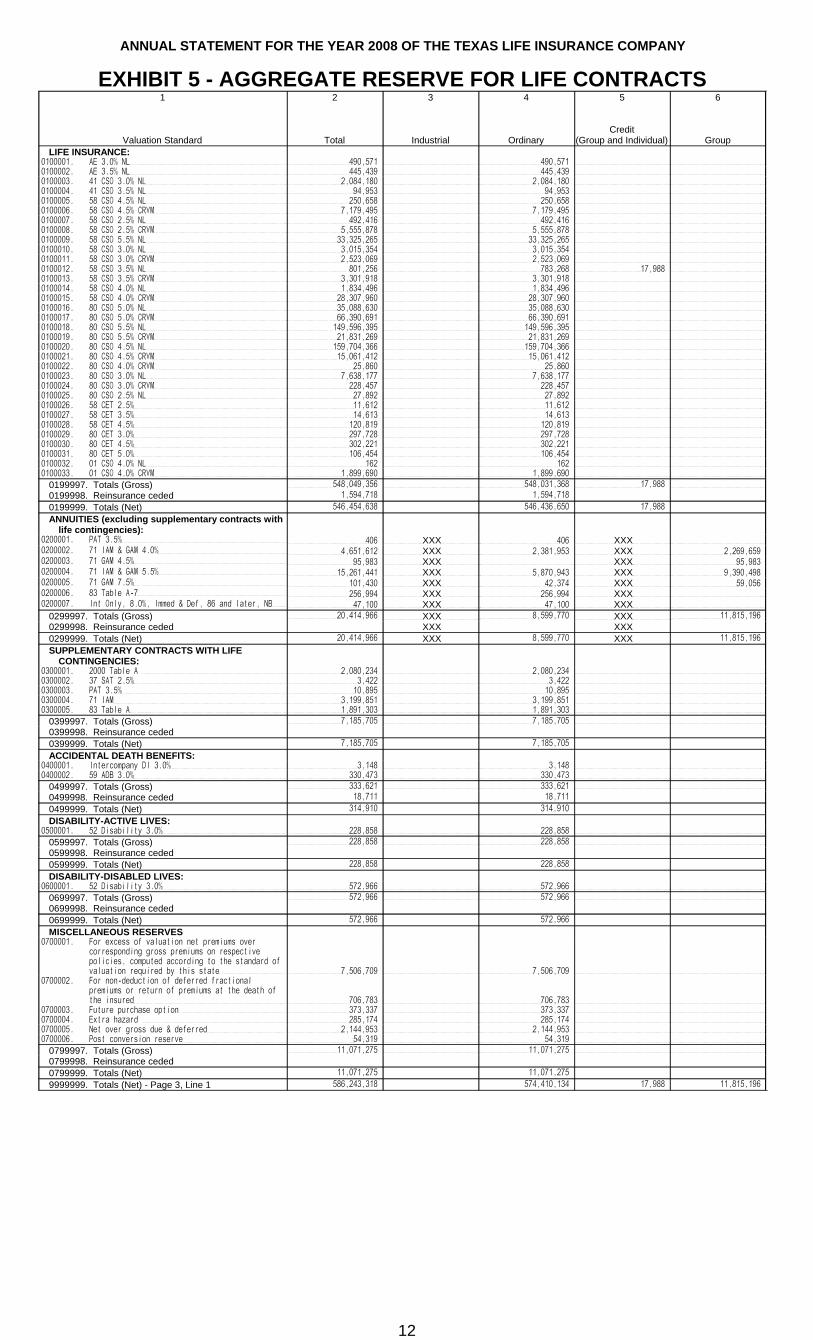
EXHIBIT 5 - AGGREGATE RESERVE FOR LIFE CONTRACTS1
Valuation Standard
2
Total
3
Industrial
4
Ordinary
5
Credit(Group and Individual)
6
GroupLIFE INSURANCE:
0100001. AE 3.0% NL 490,571 490,571 0100002. AE 3.5% NL 445,439 445,439 0100003. 41 CSO 3.0% NL 2,084,180 2,084,180 0100004. 41 CSO 3.5% NL 94,953 94,953 0100005. 58 CSO 4.5% NL 250,658 250,658 0100006. 58 CSO 4.5% CRVM 7,179,495 7,179,495 0100007. 58 CSO 2.5% NL 492,416 492,416 0100008. 58 CSO 2.5% CRVM 5,555,878 5,555,878 0100009. 58 CSO 5.5% NL 33,325,265 33,325,265 0100010. 58 CSO 3.0% NL 3,015,354 3,015,354 0100011. 58 CSO 3.0% CRVM 2,523,069 2,523,069 0100012. 58 CSO 3.5% NL 801,256 783,268 17,988 0100013. 58 CSO 3.5% CRVM 3,301,918 3,301,918 0100014. 58 CSO 4.0% NL 1,834,496 1,834,496 0100015. 58 CSO 4.0% CRVM 28,307,960 28,307,960 0100016. 80 CSO 5.0% NL 35,088,630 35,088,630 0100017. 80 CSO 5.0% CRVM 66,390,691 66,390,691 0100018. 80 CSO 5.5% NL 149,596,395 149,596,395 0100019. 80 CSO 5.5% CRVM 21,831,269 21,831,269 0100020. 80 CSO 4.5% NL 159,704,366 159,704,366 0100021. 80 CSO 4.5% CRVM 15,061,412 15,061,412 0100022. 80 CSO 4.0% CRVM 25,860 25,860 0100023. 80 CSO 3.0% NL 7,638,177 7,638,177 0100024. 80 CSO 3.0% CRVM 228,457 228,457 0100025. 80 CSO 2.5% NL 27,892 27,892 0100026. 58 CET 2.5% 11,612 11,612 0100027. 58 CET 3.5% 14,613 14,613 0100028. 58 CET 4.5% 120,819 120,819 0100029. 80 CET 3.0% 297,728 297,728 0100030. 80 CET 4.5% 302,221 302,221 0100031. 80 CET 5.0% 106,454 106,454 0100032. 01 CSO 4.0% NL 162 162 0100033. 01 CSO 4.0% CRVM 1,899,690 1,899,690
0199997. Totals (Gross) 548,049,356 548,031,368 17,988 0199998. Reinsurance ceded 1,594,718 1,594,718
0199999. Totals (Net) 546,454,638 546,436,650 17,988
ANNUITIES (excluding supplementary contracts with life contingencies):
0200001. PAT 3.5% 406 XXX 406 XXX0200002. 71 IAM & GAM 4.0% 4,651,612 XXX 2,381,953 XXX 2,269,659 0200003. 71 GAM 4.5% 95,983 XXX XXX 95,983 0200004. 71 IAM & GAM 5.5% 15,261,441 XXX 5,870,943 XXX 9,390,498 0200005. 71 GAM 7.5% 101,430 XXX 42,374 XXX 59,056 0200006. 83 Table A-7 256,994 XXX 256,994 XXX0200007. Int Only, 8.0%, Immed & Def, 86 and later, NB 47,100 XXX 47,100 XXX
0299997. Totals (Gross) 20,414,966 XXX 8,599,770 XXX 11,815,196 0299998. Reinsurance ceded XXX XXX0299999. Totals (Net) 20,414,966 XXX 8,599,770 XXX 11,815,196
SUPPLEMENTARY CONTRACTS WITH LIFE CONTINGENCIES:
0300001. 2000 Table A 2,080,234 2,080,234 0300002. 37 SAT 2.5% 3,422 3,422 0300003. PAT 3.5% 10,895 10,895 0300004. 71 IAM 3,199,851 3,199,851 0300005. 83 Table A 1,891,303 1,891,303
0399997. Totals (Gross) 7,185,705 7,185,705 0399998. Reinsurance ceded0399999. Totals (Net) 7,185,705 7,185,705
ACCIDENTAL DEATH BENEFITS:0400001. Intercompany DI 3.0% 3,148 3,148 0400002. 59 ADB 3.0% 330,473 330,473
0499997. Totals (Gross) 333,621 333,621 0499998. Reinsurance ceded 18,711 18,711
0499999. Totals (Net) 314,910 314,910
DISABILITY-ACTIVE LIVES:0500001. 52 Disability 3.0% 228,858 228,858
0599997. Totals (Gross) 228,858 228,858 0599998. Reinsurance ceded0599999. Totals (Net) 228,858 228,858
DISABILITY-DISABLED LIVES:0600001. 52 Disability 3.0% 572,966 572,966
0699997. Totals (Gross) 572,966 572,966 0699998. Reinsurance ceded0699999. Totals (Net) 572,966 572,966
MISCELLANEOUS RESERVES0700001. For excess of valuation net premiums over
corresponding gross premiums on respective policies, computed according to the standard of valuation required by this state 7,506,709 7,506,709
0700002. For non-deduction of deferred fractional premiums or return of premiums at the death of the insured 706,783 706,783
0700003. Future purchase option 373,337 373,337 0700004. Extra hazard 285,174 285,174 0700005. Net over gross due & deferred 2,144,953 2,144,953 0700006. Post conversion reserve 54,319 54,319
0799997. Totals (Gross) 11,071,275 11,071,275 0799998. Reinsurance ceded0799999. Totals (Net) 11,071,275 11,071,275
9999999. Totals (Net) - Page 3, Line 1 586,243,318 574,410,134 17,988 11,815,196
12

*69396200837000100*ANNUAL STATEMENT FOR THE YEAR 2008 OF THE TEXAS LIFE INSURANCE COMPANY
EXHIBIT 5 - INTERROGATORIES1.1. Has the reporting entity ever issued both participating and non-participating contracts? Yes [ X ] No [ ]1.2 If not, state which kind is issued
2.1. Does the reporting entity at present issue both participating and non-participating contracts? Yes [ ] No [ X ]2.2. If not, state which kind is issued
Non-Participating 3. Does the reporting entity at present issue or have in force contracts that contain non-guaranteed elements? Yes [ X ] No [ ]
If so, attach a statement that contains the determination procedures, answers to the interrogatories and an actuarial opinion as described in the instructions.
4. Has the reporting entity any assessment or stipulated premium contracts in force? Yes [ ] No [ X ]
If so, state:4.1 Amount of insurance? $4.2 Amount of reserve? $4.3 Basis of reserve
4.4 Basis of regular assessments
4.5 Basis of special assessments
4.6 Assessments collected during the year $5. If the contract loan interest rate guaranteed in any one or more of its currently issued contracts is less than 5%, not in
advance, state the contract loan rate guarantees on any such contracts.
6. Does the reporting entity hold reserves for any annuity contracts that are less than the reserves that would be held on a standard basis? Yes [ ] No [ X ]
6.1 If so, state the amount of reserve on such contracts on the basis actually held: $6.2 That would have been held (on an exact or approximate basis) using the actual ages of the annuitants; the interest
rate(s) used in 6.1; and the same mortality basis used by the reporting entity for the valuation of comparable annuity benefits issued to standard lives. If the reporting entity has no comparable annuity benefits for standard lives to be valued, the mortality basis shall be the table most recently approved by the state of domicile for valuing individual annuity benefits: $
Attach statement of methods employed in their valuation.7. Does the reporting entity have any Synthetic GIC contracts or agreements in effect as of December 31 of the current year? Yes [ ] No [ X ]
7.1 If yes, state the total dollar amount of assets covered by these contracts or agreements: $7.2 Specify the basis (fair value, amortized cost, etc.) for determining the amount
7.3 State the amount of reserves established for this business: $7.4 Identify where the reserves are reported in the blank
EXHIBIT 5A - CHANGES IN BASES OF VALUATION DURING THE YEAR1 Valuation Basis 4
Description of Valuation Class
2
Changed From
3
Changed To
Increase in Actuarial Reserve Due to
ChangeLIFE CONTRACTS (Including supplementary contracts set upon a basis other than that used to determine benefits) (Exhibit 5)0199999 Subtotal (Page 7, Line 6) XXX XXXACCIDENT AND HEALTH CONTRACTS (Exhibit 6)0299999 Subtotal XXX XXXDEPOSIT-TYPE CONTRACTS (Exhibit 7)
0399999 Subtotal XXX XXX9999999 - Total (Column 4 only)
13
NONE

ANNUAL STATEMENT FOR THE YEAR 2008 OF THE TEXAS LIFE INSURANCE COMPANY
EXHIBIT 6 - AGGREGATE RESERVE FOR ACCIDENT AND HEALTH CONTRACTS1 2 3 4 Other Individual Contracts
TotalGroup Accident
and Health
Credit Accidentand Health
(Group and Individual)Collectively Renewable
5
Non-Cancelable
6Guaranteed Renewable
7Non-Renewable for
Stated Reasons Only
8
Other Accident Only
9
All OtherACTIVE LIFE RESERVE
1. Unearned premium reserves 666 437 229 2. Additional contract reserves (a) 23,622 13,922 9,700 3. Additional actuarial reserves-Asset/Liability analysis 4. Reserve for future contingent benefits 5. Reserve for rate credits 6. Aggregate write-ins for reserves 7. Totals (Gross) 24,288 14,359 9,929 8. Reinsurance ceded 9. Totals (Net) 24,288 14,359 9,929
CLAIM RESERVE10. Present value of amounts not yet due on claims 8,589 8,589 11. Additional actuarial reserves-Asset/Liability analysis 12. Reserve for future contingent benefits 13. Aggregate write-ins for reserves 14. Totals (Gross) 8,589 8,589 15. Reinsurance ceded 16. Totals (Net) 8,589 8,589 17. TOTAL (Net) 32,877 22,948 9,929 18. TABULAR FUND INTEREST 987 689 298
DETAILS OF WRITE-INS0601.0602.0603.0698. Summary of remaining write-ins for Line 6 from overflow page 0699. Totals (Lines 0601 through 0603 plus 0698) (Line 6 above)1301.1302.1303.1398. Summary of remaining write-ins for Line 13 from overflow page 1399. Totals (Lines 1301 through 1303 plus 1398) (Line 13 above)
(a) Attach statement as to valuation standard used in calculating this reserve, specifying reserve bases, interest rates and methods.
14

ANNUAL STATEMENT FOR THE YEAR 2008 OF THE TEXAS LIFE INSURANCE COMPANY
EXHIBIT 7 - DEPOSIT TYPE CONTRACTS1
Total
2Guaranteed Interest
Contracts
3
Annuities Certain
4
SupplementalContracts
5Dividend
Accumulations orRefunds
6Premium and
OtherDeposit Funds
1. Balance at the beginning of the year before reinsurance 15,126,440 2,622,886 105,126 12,398,428
2. Deposits received during the year 11,755,990 265,819 (16,801) 11,506,972
3. Investment earnings credited to the account 477,873 132,521 345,352
4. Other net change in reserves
5. Fees and other charges assessed 663 663
6. Surrender charges
7. Net surrender or withdrawal payments 9,636,636 437,134 9,199,502
8. Other net transfers to or (from) Separate Accounts
9. Balance at the end of current year before reinsurance (Lines 1+2+3+4-5-6-7-8) 17,723,004 2,584,092 88,325 15,050,587
10. Reinsurance balance at the beginning of the year (12,017,806) (12,017,806)
11. Net change in reinsurance assumed
12. Net change in reinsurance ceded 2,694,741 2,694,741
13. Reinsurance balance at the end of the year (Lines 10+11-12) (14,712,547) (14,712,547)
14. Net balance at the end of current year after reinsurance (Lines 9 + 13) 3,010,457 2,584,092 88,325 338,040
15

ANNUAL STATEMENT FOR THE YEAR 2008 OF THE TEXAS LIFE INSURANCE COMPANY
EXHIBIT 8 - CLAIMS FOR LIFE AND ACCIDENT AND HEALTH CONTRACTSPART 1 - Liability End of Current Year
1 2 Ordinary 6 Group Accident and Health
Total Industrial Life
3
Life Insurance
4
Individual Annuities
5Supplementary
ContractsCredit Life (Group
and Individual)
7
Life Insurance
8
Annuities
9
Group
10Credit (Group and
Individual)
11
Other1. Due and unpaid:
1.1 Direct 1.2 Reinsurance assumed 1.3 Reinsurance ceded 1.4 Net
2. In course of settlement: 2.1 Resisted 2.11 Direct
2.12 Reinsurance assumed 2.13 Reinsurance ceded 2.14 Net (b) (b) (b) (b)
2.2 Other 2.21 Direct 7,697,138 7,691,980 3,158 2,000
2.22 Reinsurance assumed 2.23 Reinsurance ceded 223,864 223,864
2.24 Net 7,473,274 (b) 7,468,116 (b) 3,158 (b) (b) (b) (b) (b) 2,000 3. Incurred but unreported:
3.1 Direct 1,900,000 1,900,000
3.2 Reinsurance assumed 3.3 Reinsurance ceded 3.4 Net 1,900,000 (b) 1,900,000 (b) (b) (b) (b) (b) (b)
4. TOTALS 4.1 Direct 9,597,138 9,591,980 3,158 2,000
4.2 Reinsurance assumed 4.3 Reinsurance ceded 223,864 223,864
4.4 Net 9,373,274 (a) (a) 9,368,116 3,158 (a) 2,000
(a) Including matured endowments (but not guaranteed annual pure endowments) unpaid amounting to $ in Column 2, $ in Column 3 and $ in Column 7.(b) Include only portion of disability and accident and health claim liabilities applicable to assumed "accrued" benefits. Reserves (including reinsurance assumed and net of reinsurance ceded) for unaccrued benefits for Ordinary Life Insurance $
Individual Annuities $ , Credit Life (Group and Individual) $ , and Group Life $ , are included in Page 3, Line 1, (See Exhibit 5, Section on Disability Disabled Lives); and for Group Accident and Health $ , Credit (Group and Individual) Accident and Health $ , and Other Accident and Health $ are included in Page 3, Line 2 (See Exhibit 6, Claim Reserve).
16
ANNUAL STATEMENT FOR THE YEAR 2008 OF THE TEXAS LIFE INSURANCE COMPANY
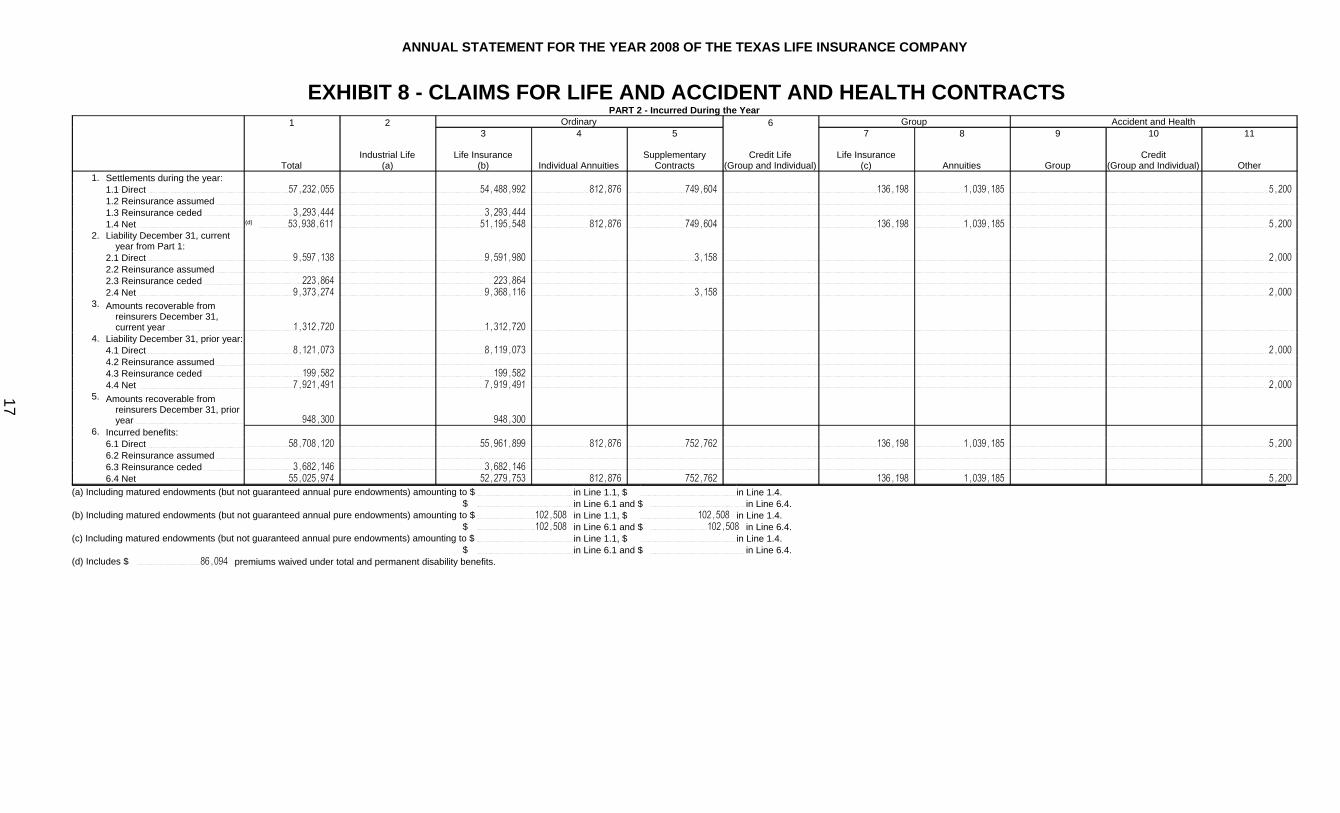
EXHIBIT 8 - CLAIMS FOR LIFE AND ACCIDENT AND HEALTH CONTRACTSPART 2 - Incurred During the Year
1 2 Ordinary 6 Group Accident and Health
TotalIndustrial Life
(a)
3
Life Insurance(b)
4
Individual Annuities
5
Supplementary Contracts
Credit Life (Group and Individual)
7
Life Insurance(c)
8
Annuities
9
Group
10
Credit (Group and Individual)
11
Other1. Settlements during the year:
1.1 Direct 57,232,055 54,488,992 812,876 749,604 136,198 1,039,185 5,200 1.2 Reinsurance assumed 1.3 Reinsurance ceded 3,293,444 3,293,444 1.4 Net (d) 53,938,611 51,195,548 812,876 749,604 136,198 1,039,185 5,200
2. Liability December 31, current year from Part 1:
2.1 Direct 9,597,138 9,591,980 3,158 2,000 2.2 Reinsurance assumed 2.3 Reinsurance ceded 223,864 223,864 2.4 Net 9,373,274 9,368,116 3,158 2,000
3. Amounts recoverable from reinsurers December 31, current year 1,312,720 1,312,720
4. Liability December 31, prior year:4.1 Direct 8,121,073 8,119,073 2,000 4.2 Reinsurance assumed 4.3 Reinsurance ceded 199,582 199,582 4.4 Net 7,921,491 7,919,491 2,000
5. Amounts recoverable from reinsurers December 31, prior year 948,300 948,300
6. Incurred benefits:6.1 Direct 58,708,120 55,961,899 812,876 752,762 136,198 1,039,185 5,200 6.2 Reinsurance assumed 6.3 Reinsurance ceded 3,682,146 3,682,146 6.4 Net 55,025,974 52,279,753 812,876 752,762 136,198 1,039,185 5,200
(a) Including matured endowments (but not guaranteed annual pure endowments) amounting to $ in Line 1.1, $ in Line 1.4.$ in Line 6.1 and $ in Line 6.4.
(b) Including matured endowments (but not guaranteed annual pure endowments) amounting to $ 102,508 in Line 1.1, $ 102,508 in Line 1.4.$ 102,508 in Line 6.1 and $ 102,508 in Line 6.4.
(c) Including matured endowments (but not guaranteed annual pure endowments) amounting to $ in Line 1.1, $ in Line 1.4.$ in Line 6.1 and $ in Line 6.4.
(d) Includes $ 86,094 premiums waived under total and permanent disability benefits.
17

ANNUAL STATEMENT FOR THE YEAR 2008 OF THE TEXAS LIFE INSURANCE COMPANY
EXHIBIT OF NONADMITTED ASSETS1
Current Year TotalNonadmitted Assets
2
Prior YearNonadmitted Assets
3Change in Total
Nonadmitted Assets(Col. 2 - Col. 1)
1. Bonds (Schedule D)2. Stocks (Schedule D):
2.1 Preferred stocks
2.2 Common stocks 3. Mortgage loans on real estate (Schedule B):
3.1 First liens
3.2 Other than first liens 4. Real estate (Schedule A):
4.1 Properties occupied by the company
4.2 Properties held for the production of income
4.3 Properties held for sale 5. Cash (Schedule-E Part 1), cash equivalents (Schedule-E Part 2) and
short-term investments (Schedule DA)6. Contract loans 7. Other invested assets (Schedule BA) 8. Receivables for securities 9. Aggregate write-ins for invested assets
10. Subtotals, cash and invested assets (Lines 1 to 9) 11. Title plants (for Title insurers only)12. Investment income due and accrued 13. Premiums and considerations:
13.1 Uncollected premiums and agents’ balances in the course of
collection 1,090,420 1,498,193 407,773
13.2 Deferred premiums, agents’ balances and installments booked but deferred
and not yet due
13.3 Accrued retrospective premiums14. Reinsurance:
14.1 Amounts recoverable from reinsurers
14.2 Funds held by or deposited with reinsured companies
14.3 Other amounts receivable under reinsurance contracts 15. Amounts receivable relating to uninsured plans 16.1Current federal and foreign income tax recoverable and interest thereon 16.2Net deferred tax asset 28,244,395 25,163,930 (3,080,465)
17. Guaranty funds receivable or on deposit 18. Electronic data processing equipment and software19. Furniture and equipment, including health care delivery assets 12,035 17,750 5,715
20. Net adjustment in assets and liabilities due to foreign exchange rates 21. Receivables from parent, subsidiaries and affiliates 22. Health care and other amounts receivable23. Aggregate write-ins for other than invested assets 104,654 5,780 (98,874)
24. Total assets excluding Separate Accounts, Segregated Accounts and
Protected Cell Accounts (Lines 10 to 23) 29,451,504 26,685,653 (2,765,851)
25. From Separate Accounts, Segregated Accounts and Protected Cell Accounts26. Total (Lines 24 and 25) 29,451,504 26,685,653 (2,765,851)
DETAILS OF WRITE-INS0901.
0902.
0903.
0998. Summary of remaining write-ins for Line 9 from overflow page 0999. Totals (Lines 0901 through 0903 plus 0998)(Line 9 above)
2301. Prepaid Items 87,168 3,048 (84,120)
2302. Return Items 17,486 2,732 (14,754)
2303.
2398. Summary of remaining write-ins for Line 23 from overflow page 2399. Totals (Lines 2301 through 2303 plus 2398)(Line 23 above) 104,654 5,780 (98,874)
18

ANNUAL STATEMENT FOR THE YEAR 2008 OF THE TEXAS LIFE INSURANCE COMPANY
NOTES TO FINANCIAL STATEMENTS1. Nature of Operations and Summary of Significant Statutory Accounting Policies
Nature of Operations -- Texas Life Insurance Company (the “Company”), is incorporated under the laws of the State of Texas (the “State”), is a wholly owned subsidiary of COVA Corporation (“COVA”). The Company was formerly a wholly owned subsidiary of Metropolitan Life Insurance Company (“Metropolitan”) which is a wholly owned subsidiary of MetLife, Inc. (“MetLife”). On December 31, 2002, ownership of the Company was transferred to COVA, a wholly owned subsidiary of MetLife.
The Company offers a wide range of life and annuity products through independent agents and other distribution channels and is subject to competition from other insurers throughout the United States. The Company is authorized to sell life, accident and health and annuity products in 49 states and the District of Columbia. The top geographic locations in the United States for statutory premiums and deposits earned by the Company were Texas, California, Louisiana, Oklahoma and North Carolina for the year ended December 31, 2008.
Summary of Significant Accounting Policies
Basis of Presentation -- The Company’s statutory financial statements are presented on the basis of accounting practices prescribed or permitted by the Texas Department of Insurance (“the Department”). The State has adopted the National Association of Insurance Commissioners’ (NAIC) statutory accounting practices (NAIC SAP) as the basis of its statutory accounting practices, except it has retained the prescribed practices of the Texas Insurance Code and the Administrative Code. For the years ended December 31, 2008 and 2007, there were no significant differences in net income between NAIC SAP and practices prescribed and permitted by the state. A reconciliation of the Company’s capital and surplus between accounting practices prescribed and permitted by the Department and NAIC SAP is shown below:
2008 2007Statutory capital and surplus-as reported 47,963,033$ 45,713,483$
State-prescribed practices: Admitted inTexas and non-admitted in NAIC SAP-furniture & equipment (105,071) (204,171) Statutory capital and surplus-NAIC SAP 47,857,962$ 45,509,312$
Accounting practices as prescribed or permitted by the Department comprise a comprehensive basis of accounting other than accounting principles generally accepted in the United States of America (GAAP). NAIC SAP differs in certain respects from GAAP. The primary interest of insurance regulatory authorities is the ability of the Company to fulfill its obligations to policyholders; therefore, the statutory-basis financial statements are oriented to the insured public. The significant differences that impact net income or surplus are:
Investment in bonds are generally carried at amortized cost, while, under GAAP, they are carried at •either amortized cost or fair value based on their classification as held to maturity, available for sale, or trading.
Investments in common stocks are valued as prescribed by the Securities Valuation Office (SVO) of •the NAIC, while under GAAP, common stocks are reported at fair value.
All single class and multi-class mortgage-backed/asset-backed securities are adjusted for the effects of •changes in prepayment assumptions on the related accretion of discount or amortization of premium of such securities using either the retrospective of prospective method. If it is determined that a decline in fair value is other than temporary, the cost basis of the security is written down to the undiscounted estimated future cash flows. For GAAP purposes, all securities, purchased or retained, that represent beneficial interest in securitized assets other than high-credit-quality securities are adjusted using the prospective method when there is a change in estimated future cash future cash flows. If it is determine that a decline in fair value is other than temporary, the cost basis of the security is written down to the discounted fair value. If high-credit quality securities are adjusted, the retrospective method is used.
Investments in real estate are reported net of related obligations rather than on a gross basis as for •GAAP. Real estate owned and occupied by the Company is included in investments rather than reported as an operating asset under GAAP, and investment income and operating expenses include rent for the Company’s occupancy of those properties.
19

ANNUAL STATEMENT FOR THE YEAR 2008 OF THE TEXAS LIFE INSURANCE COMPANY
NOTES TO FINANCIAL STATEMENTSAcquisition costs, such as commissions and other costs related to acquiring new business, are expensed •as incurred, while under GAAP, they are deferred and amortized to income as premiums are earned or in relation to estimated gross profits.
Statutory policy reserves are based on mortality and interest assumptions prescribed or permitted by •statutes, without consideration of withdrawals. Statutory policy reserves generally differ from policy reserves under GAAP, which are based on the Company's estimates of mortality, interest and withdrawals. The effect, if any, on reserves due to a change in reserve on account of change in valuation basis is recorded directly to unassigned surplus rather than included in the determination of operating income.
Asset valuation reserves (AVR) and interest maintenance reserves (IMR) are established in the •statutory-basis financial statements.
Assets are reported under NAIC SAP at admitted-asset value and nonadmitted assets are excluded •through a charge against surplus, while under GAAP, nonadmitted assets are reported as an asset on the balance sheet, net of any valuation allowance.
Premium receipts and benefits on universal life-type are recorded as revenue and expense for statutory •purposes. Under GAAP, revenues on universal life-type contracts are comprised of contract charges and fees, which are recognized when assessed against the policyholder account balance. Additionally, premium receipts on universal life-type contracts are considered deposits and are recorded as interest-bearing liabilities.
Reinsurance recoverable on unpaid losses is reported as a reduction of policy benefit and other •insurance reserves, while under GAAP, they are reported as an asset.
Comprehensive income and its components are not presented in the statutory-basis financial •statements.
Goodwill under GAAP is calculated as the difference between the cost of acquiring the entity and the •fair value of the assets received and liabilities assumed. Under NAIC SAP, goodwill is calculated as the difference between the cost of acquiring the entity and the reporting entity’s share of the historical book value of the acquired entity for GAAP. However, under NAIC SAP, the amount of goodwill recorded as an admitted asset is subject to limitation.
For purposes of calculating the Company’s pension and postretirement benefit obligations only vested •participants and current retirees are included in the valuation. Under GAAP, active participants not currently eligible also would be included.
Deferred tax assets are limited to (1) the amount of federal income taxes paid in prior years that can be •recovered through loss carrybacks for existing temporary differences that reverse by the end of the subsequent calendar year; plus (2) the lesser of the remaining gross deferred tax assets expected to be realized within one year of the balance sheet date or 10% of capital and surplus, excluding any net deferred tax assets, EDP equipment and operating software, and any net positive goodwill; plus (3) the amount of remaining gross deferred tax assets that can be offset against existing gross deferred tax liabilities. The remaining deferred tax assets are nonadmitted. Deferred taxes do not include amounts for state taxes. The change in deferred tax is recorded directly to surplus. Under GAAP, states income taxes are included in the computation of deferred taxes, a deferred tax asset is recorded for the amount of gross deferred tax assets expected to be realized in future years, and a valuation allowance is established for the deferred tax assets not realizable. Under GAAP, the change in deferred tax is recorded in the income statement.
Cash, cash equivalents, and short-term investments in the statutory-basis statements of cash flow •represent cash balances and investments with initial maturities of one year or less. Under GAAP, the corresponding caption of cash and cash equivalents includes cash balances and investments with initial maturities of three months or less.
Use of Estimates -- The preparation of financial statements in accordance with statutory accounting principles requires management to make estimates and assumptions that affect the reported amounts of assets and liabilities. It also requires disclosure of contingent assets and liabilities at the date of the financial statements and the reported amounts of revenues and expenses during the reporting period. Actual results could differ significantly from those estimates.
Investments -- Bonds and preferred stocks are reported at cost, adjusted for amortization of premium or discount for bonds and sinking fund preferred stocks.
19.1

ANNUAL STATEMENT FOR THE YEAR 2008 OF THE TEXAS LIFE INSURANCE COMPANY
NOTES TO FINANCIAL STATEMENTSCommon stocks are reported at current market value as determined from quoted market prices provided by the NAIC (fair value). The change in the stated value is recorded as a change in net unrealized gains (losses), a component of unassigned surplus.
Mortgage loans on real estate are reported at unpaid balances. The Company records a general reserve for losses on mortgage loans as part of the asset valuation reserve.
Real estate is reported at cost, less allowances for depreciation and encumbrances; foreclosed property is stated at the lower of cost or estimated market value less encumbrances.
Policy loans are reported at unpaid balances. Interest rates on policy loans range from 5.0% to 9.1%. In addition, policy loans have no stated maturity and may be repaid from the proceeds of the related life insurance policy.
Other long-term investments are reported at cost, adjusted for amortization of premium or discount.
Short-term investments are reported at cost.
Investment income consists primarily of interest and dividends. Interest is recognized on an accrual basis and dividends are recorded as earned at the ex-dividend date. Interest income on mortgage-backed and asset-backed securities is determined on the effective yield method based on estimated principal repayments. Accrual of income is suspended for bonds and mortgage loans that are in default or when the receipt of interest payments is in doubt. Realized investment capital gains and losses are determined on a specific identification basis. Unrealized investment gains and losses and nonadmitted investments are treated as adjustments to surplus and are not included in the determination of net income.
Accrued interest more than 180 days past due and deemed uncollectible on mortgage loans in default is nonadmitted. All other investment income due and accrued with amounts over 90 days past due is nonadmitted. There was no investment income due and accrued excluded from surplus at December 31, 2008.
The Company’s review of its bonds and stocks for impairments includes an analysis of the total gross unrealized losses by three categories of securities: (i) securities where the estimated fair value had declined and remained below cost or amortized cost by less than 20%; (ii) securities where the estimated fair value had declined and remained below cost or amortized cost by 20% or more for less that six months and (iii) securities where the estimated fair value had declined and remained below cost of amortized cost by 20% or more for six months or greater. While all of these securities are monitored for potential impairment, the Company’s experience indicated that the first two categories do not present as great a risk of impairment, and often, fair values recover over time as the factors that caused the declines improve.
The assessment of whether impairments have occurred is based on management’s case-by-case evaluation of the underlying reasons for the decline in fair value. Management considers a wide range of factors about the security issuer and uses its best judgment in evaluating the cause of the decline in the estimated fair value of the security and in assessing the prospects for near-term recovery. Inherent in management’s evaluation of the security are assumptions and estimates about the operations of the issuer and its future earnings potential. Considerations used by the Company in the impairment evaluation process include, but are not limited to: (i) the length of time and the extent to which the fair value has been below cost or amortized cost; (ii) the potential for impairments of securities when the issuer is experiencing financial difficulties; (iii) the potential for impairments in an entire industry sector or sub-sector; (iv) the potential for impairments in certain economically depressed geographic locations; (v) the potential for impairments of securities where the issuer, series of issuers or industry has suffered a catastrophic type of loss or has exhausted natural resources; (vi) the Company’s ability and intent to hold the security for a period of time sufficient to allow for the recovery of its value to an amount equal to or greater that cost or amortized cost; (vii) unfavorable changes in forecasted cash flows on asset-back securities and (viii) other subject factors, including concentrations and information obtained from regulators and rating agencies. In addition, the earnings on certain investments are dependent upon market conditions, which could result in prepayments and changes in amounts to be earned due to changing interest rates or equity markets. The determination of fair values in the absence of quoted market values is based on: (i) valuation methodologies; (ii) securities the Company deems to be comparable and (iii) assumptions deemed appropriate given the circumstances. The different methodologies and assumptions may have a material effect on the estimated fair value amounts.
The Company records impairments as investment losses and adjusts the cost basis of the bonds and stocks accordingly. The Company does not change the revised cost basis for subsequent recoveries in value.
Surplus notes payable to affiliates -- surplus notes payable to affiliates are recorded at unpaid balances and are reported as a separate component of capital and surplus.
19.2

ANNUAL STATEMENT FOR THE YEAR 2008 OF THE TEXAS LIFE INSURANCE COMPANY
NOTES TO FINANCIAL STATEMENTSPolicy Accounting -- Life premiums are recognized as income over the premium paying period of the related policies. Annuity considerations are recognized as revenue when received. Health premiums are earned ratably over the terms of the related insurance. Consideration received on deposit-type funds, which do not contain any life contingencies, is recorded directly to the related liability. Expenses incurred in connection with acquiring new insurance business, including acquisition costs such as sales commissions, are charged to operations as incurred.
Dividends on Participating Policies -- The amount of dividends to be paid to policyholders is determined annually by the Company’s Board of Directors. The aggregate amount of policyholders’ dividends is related to actual interest, mortality, morbidity and expense experience for the year and judgment as to the appropriate level of statutory surplus to be retained by the Company. Approximately 2% of the Company’s insurance in force is participating policies.
Future Policy Benefits -- Reserves for future policy benefits provide amounts adequate to discharge estimated future obligations in excess of estimated future premiums on policies in force. Policy reserves for traditional and flexible premium insurance are computed principally by using the Commissioners' Reserve Valuation Method ("CRVM") or the Net Level Premium Method, with assumed interest rates ranging from 2.5% to 5.5% and mortality as prescribed by regulatory authorities. Reserves for annuities are calculated using the Commissioners’ Annuity Reserve Valuation Method (“CARVM”) with appropriate statutory interest and mortality assumptions computed on the basis of interest rates ranging from 3.0% to 8.75%. Tabular interest, tabular less actual reserves released and tabular cost for all life contracts are determined based upon statutory regulations.
Reserves for deposit-type funds are equal to deposits received and interest credited to the benefit of contract holders, less withdrawals that represent a return to the contract holder. Tabular interest on deposit-type funds is calculated as one-hundredth of the product of such valuation rate of interest times the mean of the amount of funds subject to such valuation rate of interest held at the beginning and end of the year of valuation.
Policyholder Claims and Benefits Payable -- The liability for policyholder claims and benefits payable is based on the estimated liability for claims reported and claims incurred but not reported. Changes in estimates are reflected in operating results in the year the change is made.
The Company discontinued writing Accident and Health insurance in 1977. Due to the small volumes of A&H policies in force, the valuation actuary does not use statistical claim development models to determine claim liabilities, but uses estimates for the amounts.
Asset Valuation and Interest Maintenance Reserves -- The Company establishes certain reserves as promulgated by the NAIC. The asset valuation reserve (AVR) is determined by a formula and is based on the Company’s holdings of mortgages, investments in real estate, bonds, stocks and other invested assets. This valuation reserve requires the appropriation of surplus to provide for possible losses on these investments. Realized and unrealized investment gains and losses, other than those resulting from interest rate changes, are added or charged to the AVR.
The interest maintenance reserve (IMR) is used to defer realized investment gains and losses, net of tax, on sales and calls of bonds and certain investments that result from interest rate changes. These gains and losses are then amortized into investment income over the expected remaining life of the investment sold.
Property and equipment -- Property and equipment are carried at cost less accumulated depreciation and reported as admitted assets in accordance with practices prescribe and permitted by the State of Texas. The Company provides for depreciation of property and equipment using straight-line methods over the estimated useful lives of the assets. Furniture and fixtures are generally depreciated over three to ten years. Leasehold improvements are generally depreciated over three to ten years. Depreciation and amortization expense was approximately $729,000 and $663,000 for the years ended December 31, 2008 and 2007, respectively. Maintenance and repairs are charged to expense as incurred.
Electronic data processing equipment -- Electronic data processing (EDP) equipment and operating and non-operating software are carried at cost less accumulated depreciation. Depreciation expense is computed using the straight-line method over the lesser of the estimated useful life of the related asset or three years for EDP equipment and operating system software and five years for nonoperating system software. Nonoperating software is nonadmitted and charged against surplus.
Fair Values of Financial Instruments –In the normal course of business, the Company invests in various financial assets and incurs various financial liabilities. The estimated fair value amounts have been determined by the Company using prices published by the SVO, available market information and appropriate valuation methodologies. However, considerable judgment is necessarily required to interpret market data to develop the estimates of fair value. Accordingly, the estimates presented herein are not necessarily indicative of the amounts the Company could realize in a current market exchange. The use of different market assumptions and/or estimation methodologies may have a material effect on the estimated fair value amounts. The following methods and assumptions were used by the Company in estimating its fair value disclosures for the financial instruments:
19.3

ANNUAL STATEMENT FOR THE YEAR 2008 OF THE TEXAS LIFE INSURANCE COMPANY
NOTES TO FINANCIAL STATEMENTSCash, Short-Term Investments and Other Invested Assets – The carrying amounts for these instruments approximate their fair values.
Bonds – The fair values for bonds are based on values published by the SVO or on quoted market prices, where available. For bonds not listed by the SVO and not actively traded, fair values are estimated using values obtained from independent pricing services and based on expected future cash flows using a current market rate applicable to the yield, credit quality and maturity of the investments.
Preferred Stocks – The fair values for preferred stocks are based on SVO values or quoted market prices, where available. If quoted market prices were unavailable, the fair value of these instruments was determined using discounted cash flow models, based on discount rates of securities of similar matured credit characteristics.
Loan-Backed Securities – The fair values of loan-backed securities are estimated using values obtained from independent pricing services and based on expected future cash flows using a current market rate that reflects the yield, credit quality and maturity of the investments.
Common Stocks – The fair values for unaffiliated common stocks are based on quoted market prices.
Mortgage Loans – The fair values for mortgage loans are estimated using discounted cash flow calculations, which are based on interest rates currently being offered for similar loans to borrowers with similar credit ratings, credit quality, and maturity of the investments.
Policy Loans – The fair values for policy loans is estimated using discounted cash flow analysis at interest rates currently offered for similar loans. Loans on insurance policies with similar characteristics are aggregated for purposes of the calculations.
Surplus Notes – The fair values of surplus notes are estimated using discounted cash flow calculations, which are based on interest rates currently available to the Company for surplus notes of similar amounts and terms. Surplus notes are considered admitted assets for the portion that is currently due and payable. The remaining portion is considered a nonadmitted asset and is charged to surplus in accordance with practices prescribed and permitted by the State.
Policyholder Account Balances – The carrying amount of policyholder account balances approximates their fair value, because the amounts are generally available upon demand.
Funds Left on Deposit – Funds left on deposit with a fixed maturity are values at discounted present value using market interest rates. Funds on deposit, which do not have fixed maturities, are carried at the amount payable on demand at the reporting date.
Investment Contracts – The fair values for liabilities under investment-type insurance contracts are estimated using discounted cash flow calculations, which are based on interest rates currently being offered for similar contracts with maturities consistent with those remaining for the contracts being valued.
Joint Ventures – the Company has no ownership in joint ventures.
Derivative Investments – the Company has no ownership in derivative investments.
Concentrations of Credit Risk -- Financial instruments that potentially subject the Company to concentrations of credit risk are primarily, bonds, equity securities, short-term investments, and cash on deposit. Such investments include investments in commercial paper of companies with high credit ratings, investments in money market securities and securities backed by the U.S. government. The Company limits the amount of credit exposure with any on financial issuer or institution and believes that no significant concentration of credit risk exists with respect to is portfolio.
Vulnerability Due to Market Risks -- The Company monitors economic and regulatory developments that have the potential to impact its business. Federal legislation has allowed banks and other financial organizations to have greater participation in securities and insurance businesses. This legislation may present an increased level of competition for sales of the Company’s products. Furthermore, the market for deferred annuities and interest-sensitive life insurance is enhanced by the tax incentives available under current law. Any legislative changes that lessen these incentives are likely to negatively impact the demand for these products. The demand for life insurance products that are used to address a customer’s estate planning needs may be impacted to the extent any legislative changes occur to the current estate tax laws.
Certain 2008 amounts in the Company’s statutory financial statements have been reclassified to conform to the 2008 financial statement presentation.
19.4

ANNUAL STATEMENT FOR THE YEAR 2008 OF THE TEXAS LIFE INSURANCE COMPANY
NOTES TO FINANCIAL STATEMENTS2. Accounting Changes and Corrections of Errors
Correction of Errors --During the current year, the Company discovered no errors that required the Company to adjust its financial reports.
3. Business Combinations and Goodwill
Statutory Purchase and Statutory Merger -- The Company did not participate in any business combinations during 2008.
Assumption Reinsurance – The Company has no assumption reinsurance during 2008.
Impairment Loss – The Company had no impairment loss during 2008.
4. Discontinued Operations
The Company had no discontinued operations during 2008.
5. Investments
Mortgage LoansThe maximum and minimum lending rates for mortgage loans during 2008 were:•Farms Loans 5.750% to 6.150% (2 loans).During 2008 the Company did not reduce interest rates on any outstanding loans.•The maximum percentage of any one mortgage loan to the value of security at the time of the loan, exclusive of •insured or guaranteed or purchase money mortgages is 58.26%.As of year-end, Texas Life held no mortgages with interest over 180 days past due.•As of December 31, 2008, there were no amounts advanced by the Company on account of mortgage loans but •not repaid and not included in the mortgage loan total.Impaired loans with a related allowance for credit losses—No mortgages were impaired as of December 31, •2008.Impaired mortgages without an allowance for credit losses—Not applicable.•Average recorded investment in impaired loans—Not applicable.•Interest income recognized during the period the loans were impaired—Not applicable.•Amount of interest income recognized on a cash basis during the period the loans were impaired—Not •applicable.Interest income of impaired loans, if applicable, is reported as “collected” when cash is received.•Most of the Company’s first mortgage loans on real estate are located in California, Nebraska, Texas and •Illinois.
Debt Restructuring -- The Company has no invested assets that are restructured debt.
Reverse Mortgages -- The Company has no investment in reverse mortgages.
Loan-Backed SecuritiesThe Company uses the prospective method to value all mortgage-backed securities.•Prepayment assumptions for CMOs were obtained off the Bloomberg Information System; dealer consensus •was used. Prepayment assumptions for mortgage pools were based on the historical generic data and obtained off the Bloomberg Information System.Texas Life used NAIC pricing for the market value of its asset-backed securities.•The Company had no negative yields on its asset-backed securities.•
Impaired Securities --The Company wrote down its Lehman Brothers Holdings and its Station Casinos bonds due to credit concerns and recognized a realized loss of $1,014,666. An additional realized loss of $15,465,277 was recognized on a number of securities that the Company no longer intends to hold to maturity. The decline in the fair value of these securities is considered to be other than temporary impairment. The cost basis of these securities was written down to fair value as a new cost basis and the amount of the write-down was accounted for as a realized loss.
Repurchase Agreements -- The Company had no repurchase agreements in 2008.
Real Estate -- The Company recognized a write-down in the Home Office Building in 2008.
Investments in low-income housing tax credits (LHITC) -- The Company has no investment in low-income housing.
19.5

ANNUAL STATEMENT FOR THE YEAR 2008 OF THE TEXAS LIFE INSURANCE COMPANY
NOTES TO FINANCIAL STATEMENTS
Other Disclosures -- Invested assets in the amount of $4,699,373 and $4,748,599 at December 31, 2008 and 2007, respectively, were on deposit with government authorities as required by state law.
The Company elected to use rounding in reporting amounts in this statement.
Fair Value of Financial Instruments – the statement value and estimated fair value of financial instruments were as follows as of December 31:
Statement Es t. Fair Statement Es t. FairV alue V alue V alue V alue
A dmitted A s s etsInv es tments :
Bonds and pref erred s toc k 528,528 511,930 494,660 507,994 Common Stoc k 84 84 119 119 Firs t mortgage loans on real es tate 40,661 40,834 43,310 44,363 Polic y loans 35,105 54,338 33,829 43,224 Other long- term inv es tments 4,148 4,224 2,439 2,871 Shor t- term inv es tments 27,712 27,712 28,870 28,870 Cas h 4,098 4,098 3,348 3,348
L iabilities and Capital and SurplusSurplus notes pay able to af f ilia tes 12,500 12,521 12,500 14,437 Polic y holder ac c ount balanc es 337,917 337,917 337,491 337,491
2008 2007
(A mounts in Thous ands )
6. Joint Ventures, Partnerships and Limited Liability Companies
The Company has no investments in Partnerships or Limited Liability Companies.•
The Company has no investments in Joint Ventures.•
The Company did not recognize any impairment write-downs in Joint Ventures, Partnerships or Limited •Liability Companies.
Investment Income7.
Due and accrued income was excluded from investment income on the following basis:
Bonds—rated a “6”, in or near default, by the NAIC Security Valuation Office.•
Mortgage Loans—where collection of interest is uncertain.•
Short-Term Investments—income on certificates of deposit.•
There was no bond income, mortgage loan income and short-term investment income excluded from •December 31, 2008 investment income.
8. Derivative Instruments
The Company has no investments in derivative instruments.
9. Income Taxes
Texas Life files its federal income tax return on a consolidated basis with Metropolitan and its includable affiliates. The consolidating companies have a tax allocation agreement, which allocates tax liability in accordance with the Internal Revenue Code, as amended, and provides that members shall receive reimbursement to the extent that the tax benefits result in a reduction in the consolidated tax liability. Effectively, this results in the Company’s annual income tax provision being computed, with adjustments, as if the Company filed a separate return.
Based upon pre-tax income from continuing operations of $12,282,162 and $22,532,175, respectively, the total provision for income tax for the years ended December 31, 2008 and 2007 is as follows:
19.6

ANNUAL STATEMENT FOR THE YEAR 2008 OF THE TEXAS LIFE INSURANCE COMPANY
NOTES TO FINANCIAL STATEMENTS
Current Total Current TotalTax Expense (Benef it):Operations 5,893,505$ 5,893,505$ 8,165,364$ 8,165,364$ Capital Gains (874,216)$ (874,216)$ 6,012,772$ 6,012,772$ Total 5,019,289$ 5,019,289$ 14,178,136$ 14,178,136$
Current Total Current TotalTax Expense Operations 5,893,505$ 5,893,505$ 8,165,364$ 8,165,364$ Tax Allocation Settlement -$ -$ Rounding -- -- -- --Total Taxes Incurred 5,893,505$ 5,893,505$ 8,165,364$ 8,165,364$
2008 2007
2008 2007
The components of the net deferred tax asset/liability at December 31 are as follows:
2008 2007Total of all deferred tax assets 33,710,194$ 29,436,867$ Total of all deferred tax liabilities 118,381$ 895,339$ Total non-admitted deferred tax assets 28,244,395$ 25,163,930$ Change in non-admitted deferred tax asset 3,080,465$ (674,553)$
19.7

ANNUAL STATEMENT FOR THE YEAR 2008 OF THE TEXAS LIFE INSURANCE COMPANY
NOTES TO FINANCIAL STATEMENTSThere are no deferred tax liabilities, which are not recognized.
The main components of the 2008and 2007 deferred tax amounts are as follows:
2008 2007 ChangeDeferred Tax Assets Bonds 927,871$ 907,032$ 20,839$ Reserves 10,323,909$ 9,049,216$ 1,274,693$ Policy Acquisition Costs 19,028,210$ 18,374,337$ 653,873$ Other 3,430,204$ 1,106,282$ 2,323,922$ Total deferred tax asset 33,710,194$ 29,436,867$ 4,273,327$
Deferred tax asset - non-admitted 28,244,395$ 25,163,930$ 3,080,465$ Deferred tax asset - admitted 5,465,799$ 4,272,937$ 1,192,862$
Deferred Tax Liabilities F&E 118,381$ 895,339$ (776,958)$ Agents Balance -$ -$ -$ Total deferred tax liabilities 118,381$ 895,339$ (776,958)$
Ne t De fe rre d Tax Asse t 5,347,418$ 3,377,598$ 1,969,820$
The provision for income taxes differs from the amount of income tax expense determined by applying the 35% U.S. statutory federal income tax rate to pre-tax net income from continuing operations as follows:
2008 2007 % Diff Pre-tax Income from Operations 12,282,162$ 22,532,175$
Income Tax - Statutory Rate 4,298,757$ 35.00% 7,886,261$ 35.00% 0.00% A/S and tax depreciation 70,439$ 0.57% 91,895$ 0.41% 0.17%Capitalized and Amortized DAC 510,017$ 4.15% 252,429$ 1.12% 3.03%Deferred Comp Items (76,638)$ -0.62% (113,045)$ -0.50% -0.12%Reserves and Due & Deferred Prem 499,338$ 4.07% 284,006$ 1.26% 2.81%Other 591,592$ 4.82% (236,182)$ -1.05% 5.86%
Total 5,893,505$ 47.98% 8,165,364$ 36.24% 11.75%
10. Information Concerning Parent, Subsidiaries and Affiliates
Texas Life Insurance Company (“the Company”), is incorporated under the laws of the State of Texas. The Company is a wholly owned subsidiary of COVA Corporation (“COVA”). The Company was formerly a wholly owned subsidiary of Metropolitan Life Insurance Company (“Metropolitan”), which is a wholly owned subsidiary of MetLife, Inc. (“MetLife”). On December 31, 2002 ownership of the Company was transferred to COVA, a wholly owned subsidiary of MetLife.
On June 30, 1989, the Company received $7,000,000 from Metropolitan, in the form of a surplus debenture. The debenture has no specified maturity date and semi-annual principal payments will not begin until the Company’s statutory surplus as calculated under Texas insurance regulations increases to $50,000,000. Interest is payable semi-annually at any time the Company’s statutory surplus is in excess of $12,798,000. Such note bears interest at a rate of 4.633% until June 30, 2009. Interest on the note will be adjusted every five years to a rate equal to .75% over the then five year U.S. Treasury note rate.
On December 31, 1990 the Company received $5,500,000 from MetLife Credit Corporation, a subsidiary of MetLife, in the form of a surplus debenture. The debenture has no specified maturity day and annual principal payments of up to $550,000 will not begin until the Company’s statutory surplus, as calculated under Texas insurance regulations, increases to $40,000,000, plus the amount of accrued interest on the surplus debentures.
19.8
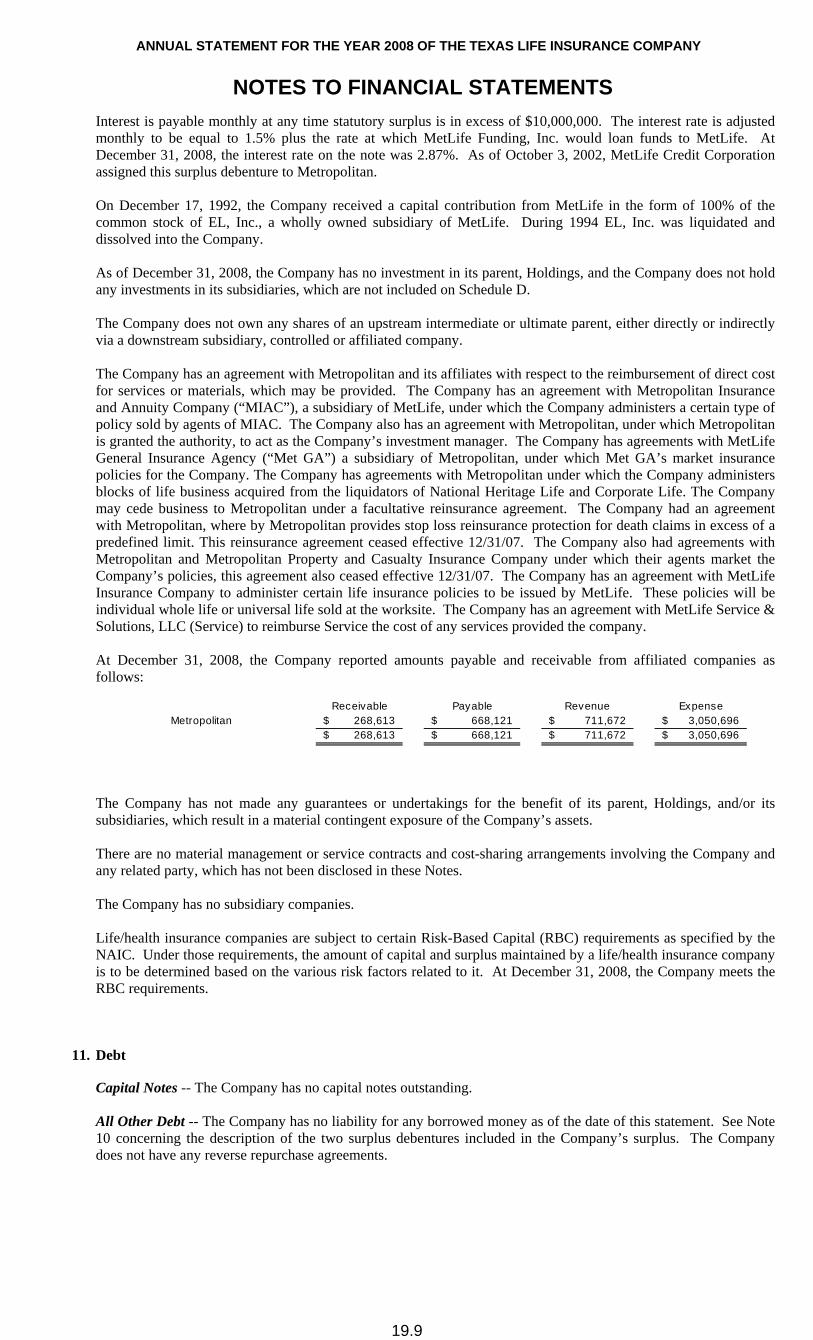
ANNUAL STATEMENT FOR THE YEAR 2008 OF THE TEXAS LIFE INSURANCE COMPANY
NOTES TO FINANCIAL STATEMENTSInterest is payable monthly at any time statutory surplus is in excess of $10,000,000. The interest rate is adjusted monthly to be equal to 1.5% plus the rate at which MetLife Funding, Inc. would loan funds to MetLife. At December 31, 2008, the interest rate on the note was 2.87%. As of October 3, 2002, MetLife Credit Corporation assigned this surplus debenture to Metropolitan.
On December 17, 1992, the Company received a capital contribution from MetLife in the form of 100% of the common stock of EL, Inc., a wholly owned subsidiary of MetLife. During 1994 EL, Inc. was liquidated and dissolved into the Company.
As of December 31, 2008, the Company has no investment in its parent, Holdings, and the Company does not hold any investments in its subsidiaries, which are not included on Schedule D.
The Company does not own any shares of an upstream intermediate or ultimate parent, either directly or indirectly via a downstream subsidiary, controlled or affiliated company.
The Company has an agreement with Metropolitan and its affiliates with respect to the reimbursement of direct cost for services or materials, which may be provided. The Company has an agreement with Metropolitan Insurance and Annuity Company (“MIAC”), a subsidiary of MetLife, under which the Company administers a certain type of policy sold by agents of MIAC. The Company also has an agreement with Metropolitan, under which Metropolitan is granted the authority, to act as the Company’s investment manager. The Company has agreements with MetLife General Insurance Agency (“Met GA”) a subsidiary of Metropolitan, under which Met GA’s market insurance policies for the Company. The Company has agreements with Metropolitan under which the Company administers blocks of life business acquired from the liquidators of National Heritage Life and Corporate Life. The Company may cede business to Metropolitan under a facultative reinsurance agreement. The Company had an agreement with Metropolitan, where by Metropolitan provides stop loss reinsurance protection for death claims in excess of a predefined limit. This reinsurance agreement ceased effective 12/31/07. The Company also had agreements with Metropolitan and Metropolitan Property and Casualty Insurance Company under which their agents market the Company’s policies, this agreement also ceased effective 12/31/07. The Company has an agreement with MetLife Insurance Company to administer certain life insurance policies to be issued by MetLife. These policies will be individual whole life or universal life sold at the worksite. The Company has an agreement with MetLife Service & Solutions, LLC (Service) to reimburse Service the cost of any services provided the company.
At December 31, 2008, the Company reported amounts payable and receivable from affiliated companies as follows:
Receivable Payable Revenue ExpenseMetropolitan 268,613$ 668,121$ 711,672$ 3,050,696$
268,613$ 668,121$ 711,672$ 3,050,696$
The Company has not made any guarantees or undertakings for the benefit of its parent, Holdings, and/or its subsidiaries, which result in a material contingent exposure of the Company’s assets.
There are no material management or service contracts and cost-sharing arrangements involving the Company and any related party, which has not been disclosed in these Notes.
The Company has no subsidiary companies.
Life/health insurance companies are subject to certain Risk-Based Capital (RBC) requirements as specified by the NAIC. Under those requirements, the amount of capital and surplus maintained by a life/health insurance company is to be determined based on the various risk factors related to it. At December 31, 2008, the Company meets the RBC requirements.
11. Debt
Capital Notes -- The Company has no capital notes outstanding.
All Other Debt -- The Company has no liability for any borrowed money as of the date of this statement. See Note 10 concerning the description of the two surplus debentures included in the Company’s surplus. The Company does not have any reverse repurchase agreements.
19.9

ANNUAL STATEMENT FOR THE YEAR 2008 OF THE TEXAS LIFE INSURANCE COMPANY
NOTES TO FINANCIAL STATEMENTS12. Retirement Plans, Deferred Compensation, Postemployment Benefits, Compensated Absences and Other
Postretirement Benefit Plans
Defined Benefit Plan – The Company participates in a noncontributory defined benefit retirement plan offered by MetLife, which covers substantially all full-time employees. The company made a contribution to the plan in the amount of $489,817 for 2008, and no contribution to the plan for 2007. The Company recorded pension expense of $540,000 in 2008, and $505,000 in 2007 related to pension cost allocated by Metropolitan.
In addition, the Company sponsors a unfunded defined benefit health care plan that provides postretirement medical insurance benefits beginning at age 65 to full-time employees who have worked 20 years and attained age 55 while in service with the Company.
A summary of the post-retirement medical benefits plan is as follows at December 31, 2008 and 2007:
2008 2007Change in benef it obligation
a. Benef it obligation at beginning of year 1,165,954$ 1,046,678$ b. Service cost 205,075 176,171 c. Interest cost 70,105 62,791 d. Benef it payment (45,948) (45,948) e. Actuarial gain (loss) 5,975 (73,738) f . Transfer cost - - g. Benef it obligation at end of year 1,401,161$ 1,165,954$
Funding statusa. Unamortized prior service cost at beginning of year 99,782$ 113,422$ b. Amortization of service cost (13,637) (13,640) c. Unamortized prior service cost at end of year 86,145$ 99,782$
d. Unrecognized net gain (loss) at beginning of year 389,651$ 463,389$ e. Actuarial gain (loss) 5,974 (73,738) f . Unrecognized net gain (loss) at end of year 395,625$ 389,651$
The plan premiums are funded by earnings from operations. The benefit plan obligation for nonvested employees as of December 31, 2008 and 2007 was $2,337,417 and $2,034,483, respectively, and is not included in the table above. The discount rate used in the weighted-average assumptions was 6.0% in 2008 and 6.0% in 2007. For measurement purposes, an 8% annual rate of increase in the per capita cost of covered health care benefits was assumed for 2008 and 2007.
Defined Contribution Plan -- The Company has a defined contribution plan for its full-time employees under Section 401(k) of the Code. This plan enables the employees to contribute a percentage of their salary to the plan and the Company will match 100% of the first 3% contributed by the employee. Total expense recognized by the Company relating to this plan for 2008 and 2007 was approximately $143,000 and $128,000, respectively.
The Company does not participate in a multi-employee plan.
The Company does not participate in an employee stock ownership plan.
Postemployment benefits are immaterial and are on a pay as you go method of accounting. Compensated absences/vacation pay is recorded as an accrued liability in salaries and wages general expense.
13. Capital and Surplus, Shareholders’ Dividend Restrictions and Quasi-Reorganizations
The Company has 800,000 shares authorized, 684,016 shares issued and outstanding, and $4.50 par value common stock.
The Company has no preferred stock.
Dividends on Company stock are paid as declared by its Board of Directors. According to State law, the greater of prior year net gains from operations after federal income tax and before capital gains and losses or 10% of statutory capital and surplus can be paid as a dividend to the Company’s stockholder. There was no cash dividend declared or paid for 2008. On December 11th, 2007, a cash dividend of $6,500,000 was declared, and the dividend was paid to COVA on December 21, 2007.
There have been no advances to surplus.
There is no stock held by the Company for special purposes.
19.10

ANNUAL STATEMENT FOR THE YEAR 2008 OF THE TEXAS LIFE INSURANCE COMPANY
NOTES TO FINANCIAL STATEMENTS
There were no changes in the special surplus funds from the prior year.
The portion of unassigned surplus represented or (reduced) by each item below is as follows:
2008 2007Unrealized gains and losses (3,906,915) (4,488,478) Nonadmitted asset value (29,506,118) (26,685,653) Asset valuation reserve (533,171) (3,352,928)
The Company issued the following surplus debentures:
Date Interes t Face Carry ing Interes t Pd Total Int. A ccrued Date of No. Issued Rate A mount V alue Current Y r Paid Inters t Maturity
1 Jun-89 See Below $7 million $7 million 324,310$ 9,565,340$ -$ None2 Dec-90 See Below $5.5 million $5.5 million 231,046$ 5,680,009$ -$ None
Total $12.5 million $12.5 million 555,356$ 15,245,349$ -$
No. 1 On June 30, 1989, the Company received $7,000,000 from Metropolitan, in the form of a surplus debenture and the carrying value of the debenture at December 31, 2008 is $7,000,000. The debenture has no specified maturity date and semi-annual principal payments will not begin until the Company’s statutory surplus as calculated under Texas insurance regulations increases to $50,000,000. Interest is payable semi-annually at any time the Company’s statutory surplus is in excess of $12,798,000. Such note bears interest at a rate of 4.633% until June 30, 2009. Interest on the note will be adjusted every five years to a rate equal to .75% over the then five year U.S. Treasury note rate. During the year ended December 31, 2008, the Company paid $324,310 of interest bringing the total interest paid on this note to $9,565,340. As of December 31, 2008, accrued and unpaid interest was $0.
No. 2 On December 31, 1990, the Company received $5,500,000 from MetLife Credit Corporation, a subsidiary of MetLife, in the form of a surplus debenture and the carrying value of the note at December 31, 2008 is $5,500,000. The debenture has no specified maturity day and annual principal payments of up to $550,000 will not begin until the Company’s statutory surplus, as calculated under Texas insurance regulations, increases to $40,000,000, plus the amount of accrued interest on the surplus debentures. Interest is payable monthly at any time statutory surplus is in excess of $10,000,000. The interest rate is adjusted monthly to be equal to 1.5% plus the rate at which MetLife Funding, Inc. would loan funds to MetLife. At December 31, 2008, the interest rate on the note was 2.87%. During the year ended December 31, 2008, the Company paid $231,046 of interest bringing the total interest paid on this note to $5,680,009. As of December 31, 2008, accrued and unpaid interest was $0. As of October 3, 2002, MetLife Credit Corporation assigned this surplus debenture to Metropolitan.
There has been no restatement of surplus due to quasi-reorganizations.
14. Contingencies
A. Contingent Commitments
The Company had no investment purchase commitments.
B. Assessments
The Company is unaware of any state assessments as of the end of December 31, 2008.
C. Gain Contingencies
The Company is unaware of any gain contingencies as of the end of December 31, 2008.
D. All Other Contingencies
The Company is not aware of any contingent liabilities as of December 31, 2008.
In the normal course of its business operations, the Company is involved in litigation from time to time with claimants, beneficiaries, and others. Three lawsuits, involving claims against the Company, were pending at December 31, 2008. Contingent liabilities arising from litigation are not considered material in relation to the financial position of the Company.
19.11

ANNUAL STATEMENT FOR THE YEAR 2008 OF THE TEXAS LIFE INSURANCE COMPANY
NOTES TO FINANCIAL STATEMENTS
The Company cannot predict the outcome of pending or future litigation. However, management believes that the resolution of pending legal proceedings will not have a material effect on the Company’s financial position or liquidity, but could have a material adverse effect on the results of operations for a specific period.
15. Leases
The Company does not have any material lease obligations as of December 31, 2008
16. Information about Financial Instruments with Off-Balance Sheet Risk and Financial Instruments with Concentrations of Credit Risk
The Company has no off-balance sheet financial instruments and has no financial instruments with concentration of credit risk.
17. Sale, Transfer and Servicing of Financial Assets and Extinguishments of Liabilities
Not Applicable
18. Gain or Loss to the Reporting Entity from Uninsured A&H Plans and the Uninsured Portion of Partially Insured Plans
Not Applicable
19. Direct Premium Written/Produced by Managing General Agents/Third Party Administrators
Texas Life has no direct premiums written through managing general agents or third party administrators as of December 31, 2008.
20. Other Items
The Company had no extraordinary items or troubled debt restructuring during 2008.
The Company had no state transferable tax credits.
The Company had no protective tax deposits on deposit with the Internal Revenue Service under Section 6603 of the Internal Revenue Service Code.
Balance That is Reasonably Possible to be Uncollectible -- At December 31, 2008 and 2007, the Company had nonadmitted assets of $1,090,420 and $1,498,193 respectively in amounts due from agents. The Company routinely assesses the collectivity of these receivables. Based upon the Company’s experience, the potential loss is not material to these financial statements.
Nonmonetary Transactions -- The Company had no nonmonetary transaction recorded in its December 31, 2008 financial statements.
21. Events Subsequent
The Company is not aware of any events occurring subsequent to the close of the books for this statement, which may have a material effect on its financial condition.
22. Reinsurance
Ceded Reinsurance Report
Section 1—General Interrogatories
Are any of the reinsures, listed in Schedule S as nonaffiliated, owned in excess of 10% or controlled, either •directly or indirectly, by the Company or by any representative, officer, trustee, or director of the company? Yes ( ) No (x)
19.12

ANNUAL STATEMENT FOR THE YEAR 2008 OF THE TEXAS LIFE INSURANCE COMPANY
NOTES TO FINANCIAL STATEMENTSHave any policies issued by the Company been reinsured with a company chartered in a country other than the •United States (excluding U.S. Branches of such companies) which is owned in excess of 10% or controlled directly or indirectly by an insured, a beneficiary, a creditor or an insured or any other person not primarily engaged in the insurance business? Yes ( ) No (x)
Section 2—Ceded Reinsurance Report—Part A
Does the Company have any reinsurance agreements in effect under which the reinsurer may unilaterally cancel •any reinsurance for reasons other than for nonpayment of premium or other similar credits? Yes ( ) No (x)
Does the Company have any reinsurance agreements in effect such that the amount of losses paid or accrued •through the statement date may result in a payment to the reinsurer of amounts which, in aggregate and allowing for offset of mutual credits from other reinsurance agreements with the same reinsurer, exceed the total direct premium collected under the reinsured policies? Yes ( ) No (x)
Section 3—Ceded Reinsurance Report—Part B
What is the estimated amount of the aggregate reduction in surplus, for agreements, not reflected in Section 2 •above, of termination of all reinsurance agreements, by either party, as of the date of this statement? Where necessary, the company may consider the current or anticipated experience of the business reinsured in making this estimate. $ None.
Have any new agreements been executed or existing agreements amended, since January 1 of the year of this •statement, to include policies or contracts which were in-force or which had existing reserves established by the company as of the effective date of the agreement? Yes () No (x)
Uncollectible Reinsurance
The Company has not written off any uncollectible reinsurance during the year.
Commutation of Reinsurance Reflected in Income and Expenses
The Company has not commuted any ceded reinsurance during the year.
23. Retrospectively Rated Contracts & Contracts Subject to Redetermination
The Company had no retrospectively rated or redetermined contracts during the year.
24. Change in Incurred Losses and Loss Adjustment Expenses
Reserves on accident and health contracts for incurred losses and loss adjustment expenses attributable to insured events of prior years developed as anticipated during 2008. No significant trends or unanticipated events were noted in 2008. None of the Company’s accident and health contracts is subject to retrospective rating or experience refunds.
25. Intercompany Pooling Arrangements
The Metropolitan Money Market Pool, the “MMMP” is a New York general partnership consisting of the Company and other wholly-owned subsidiaries of MetLife, formed as a private pass-through investment vehicle to enable the Company and other MetLife subsidiaries to invest, on a pooled basis, in U.S. Treasury securities and high quality corporate money market instruments (all commercial being rated A2 of P2 or better by Moody’s or Standard & Poors’ and al certificates of deposit being rated B/C or better by Thompson Bank Watch, Inc.). Although for economic and administration convenience, the pool securities are held in the name of MMMP, each member’s investments, are in fact such member’s pro rata undivided ownership interest in each of the pooled securities. In 2008, the Company had no funds invested in the MMMP.
The Company is a general partner in the MetLife Intermediate Income Pool, along with other wholly-owned subsidiaries of MetLife. The partnership pool can purchase, sell, invest, trade in, and lend securities including options and other derivative instruments. As of yearend 2008, the Company had not participated in any of MetLife Intermediate Income Pool’s pooling arrangements.
19.13

ANNUAL STATEMENT FOR THE YEAR 2008 OF THE TEXAS LIFE INSURANCE COMPANY
NOTES TO FINANCIAL STATEMENTS26. Structured Settlements
The Company has not purchased any structured settlements to fulfill obligations of claimants.
27. Health Care Receivables
Pharmaceutical Rebate ReceivablesA.
None
Risk Sharing ReceivablesB.
None
28. Participating Policies
For the year ended December 31, 2008, life premiums for participating policies were $4,926,862 or 3.8% of total life premiums earned on a direct cash basis. The Company accounts for its policyholder dividends on an accrual basis consistent with SSAP 51 and SSAP 54. The Company paid dividends in the amount of $2,779,297 to life policyholders in 2008.
29. Premium Deficiency Reserves
Not applicable
30. Reserves for Life Contracts and Deposit-Type Contracts
The Company waives deduction of deferred fractional premiums upon death of insured and returns any portion •of the final premium beyond the date of death. Surrender values are not promised in excess of the legally computed reserves.
Extra premium are charges for substandard lives plus the gross premium for a rated age or plus the gross •premium for the true age. Mean reserves are determined by computing the regular mean reserve for the plan at the rated age or for the plan at the true age, whichever is appropriate; and holding, in addition, one-half of the extra premium charged for the month of flexible premium, flexible death benefit product and one-half for the extra premium charge for the year for traditional products.
At December 31, 2008 the Company had no insurance in force for which the gross premiums are less than the •net premiums according to the standards of valuation set by the State of Texas. Thus, no reserves for such insurance are reported in Exhibit 8, Life Insurance section.
The Tabular Interest (Page 7, Line 4) has been determined by formula as described in the instructions for Page •7 (or, alternatively, from the basic data for the calculation of policy reserves).
The Tabular Less Actual Reserves Released (Page 7, Line 5) has been determined by formula as described in the instructions for Page 7 (or, alternatively, from the basic data for the calculation of reserves and the actual reserves released).
The Tabular Cost (Page 7, Part A, Line 9) has been determined by formula as described in the instructions for Page 7 (or alternatively, from the basic data for the calculation of policy reserves).
31. Analysis of Annuity Actuarial Reserves and Deposit Liabilities by Withdrawal Characteristics
Withdrawal Characteristics of Annuity Actuarial Reserves and Deposit-Type Contract Funds and other Liabilities Without Life or Disability Contingencies at December 31, 2008 are as follows:
19.14

ANNUAL STATEMENT FOR THE YEAR 2008 OF THE TEXAS LIFE INSURANCE COMPANY
NOTES TO FINANCIAL STATEMENTSAmount % of Total
A . Subject to discretionary w ithdraw al:(1) With market value adjustment -$ (2) A t book value less current surrender charge of 5% or more 12,122,845$ 40%(3) At fair value -$ (4) Total w ith adjustment or at market value (total 1-3) 12,122,845 40%(5) At book value w ithout adjustment 8,179,526 27%
B. Not subject to discretionary w ithdraw al 10,308,757 33%C. Total (gross) 30,611,128 D. Reinsurance ceded - E. Total (net)* (c-d) 30,611,128$ 100%
* Reconciliation of total annuity actuarial reserves and deposit fund liabilties.
F. Life & Annuity & Health Annual Statement: Amount(1) Exhibit 8, Annuities Section, Total (net) 20,414,966$ (2) Exhibit 8, Supplemental Contracts w ith Life Contingencies
Section, Total (net) 7,185,705 (3) Exhibit of Deposit-Type Contracts, Line 14, Column 1 3,010,457 (4) Subtotal 30,611,128$
Separate Accounts Annual Statement:(5) Exhibit 6, Line 0299999, Column 2 - (6) Exhibit 6, Line 0399999, Column 2 - (7) Page 3, Line 2, Column 3 - (8) Page 3, Line 3.1, Column 3 - (9) Page 3, Line 3.2, Column 3 - (10) Page 3, Line 3.3, Column 3 - (11) Subtotal - (12) Combined Total 30,611,128$
32. Premium and Annuity Considerations Deferred and Uncollected
A. Deferred and uncollected life insurance premiums and annuity considerations as of December 31, 2008, were as follows:
Gross Loading Net of Loading
Ordinary First Year 1,031,638$ (887,329)$ 144,309$ Ordinary Renew al 6,802,058$ 1,038,192$ 7,840,250$ Totals 7,833,696$ 150,863$ 7,984,559$
33. Separate Accounts
The Company has no separate accounts.
34. Loss/Claim Adjustment Expenses
The Company has no loss/claim adjustment expenses.
19.15
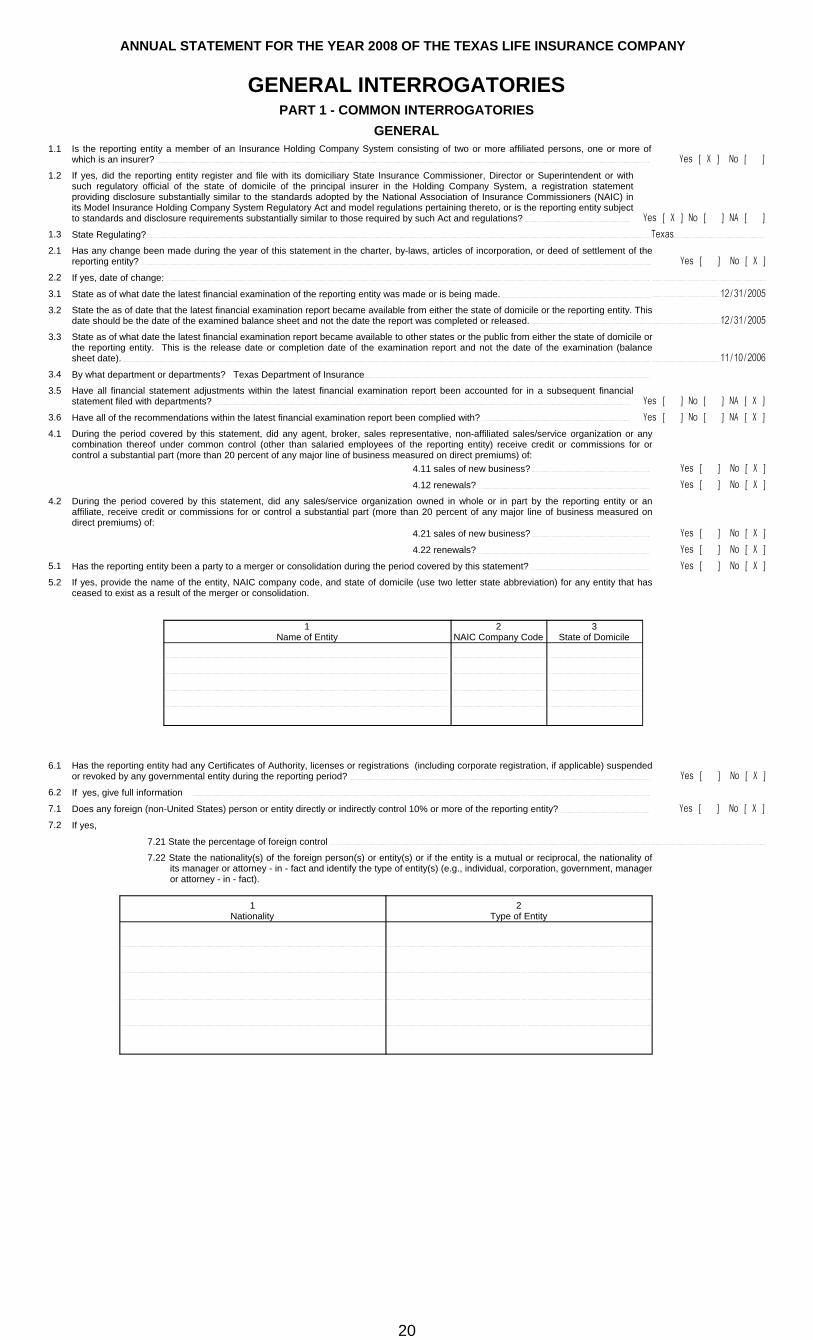
ANNUAL STATEMENT FOR THE YEAR 2008 OF THE TEXAS LIFE INSURANCE COMPANY
GENERAL INTERROGATORIESPART 1 - COMMON INTERROGATORIES
GENERAL1.1 Is the reporting entity a member of an Insurance Holding Company System consisting of two or more affiliated persons, one or more of
which is an insurer? Yes [ X ] No [ ]
1.2 If yes, did the reporting entity register and file with its domiciliary State Insurance Commissioner, Director or Superintendent or with such regulatory official of the state of domicile of the principal insurer in the Holding Company System, a registration statement providing disclosure substantially similar to the standards adopted by the National Association of Insurance Commissioners (NAIC) in its Model Insurance Holding Company System Regulatory Act and model regulations pertaining thereto, or is the reporting entity subject to standards and disclosure requirements substantially similar to those required by such Act and regulations? Yes [ X ] No [ ] NA [ ]
1.3 State Regulating? Texas
2.1 Has any change been made during the year of this statement in the charter, by-laws, articles of incorporation, or deed of settlement of the reporting entity? Yes [ ] No [ X ]
2.2 If yes, date of change:
3.1 State as of what date the latest financial examination of the reporting entity was made or is being made. 12/31/2005
3.2 State the as of date that the latest financial examination report became available from either the state of domicile or the reporting entity. This date should be the date of the examined balance sheet and not the date the report was completed or released. 12/31/2005
3.3 State as of what date the latest financial examination report became available to other states or the public from either the state of domicile or the reporting entity. This is the release date or completion date of the examination report and not the date of the examination (balance sheet date). 11/10/2006
3.4 By what department or departments? Texas Department of Insurance
3.5 Have all financial statement adjustments within the latest financial examination report been accounted for in a subsequent financial statement filed with departments? Yes [ ] No [ ] NA [ X ]
3.6 Have all of the recommendations within the latest financial examination report been complied with? Yes [ ] No [ ] NA [ X ]
4.1 During the period covered by this statement, did any agent, broker, sales representative, non-affiliated sales/service organization or any combination thereof under common control (other than salaried employees of the reporting entity) receive credit or commissions for or control a substantial part (more than 20 percent of any major line of business measured on direct premiums) of:
4.11 sales of new business? Yes [ ] No [ X ]
4.12 renewals? Yes [ ] No [ X ]
4.2 During the period covered by this statement, did any sales/service organization owned in whole or in part by the reporting entity or an affiliate, receive credit or commissions for or control a substantial part (more than 20 percent of any major line of business measured on direct premiums) of:
4.21 sales of new business? Yes [ ] No [ X ]
4.22 renewals? Yes [ ] No [ X ]
5.1 Has the reporting entity been a party to a merger or consolidation during the period covered by this statement? Yes [ ] No [ X ]
5.2 If yes, provide the name of the entity, NAIC company code, and state of domicile (use two letter state abbreviation) for any entity that has ceased to exist as a result of the merger or consolidation.
1Name of Entity
2NAIC Company Code
3State of Domicile
6.1 Has the reporting entity had any Certificates of Authority, licenses or registrations (including corporate registration, if applicable) suspended or revoked by any governmental entity during the reporting period? Yes [ ] No [ X ]
6.2 If yes, give full information
7.1 Does any foreign (non-United States) person or entity directly or indirectly control 10% or more of the reporting entity? Yes [ ] No [ X ]
7.2 If yes,
7.21 State the percentage of foreign control
7.22 State the nationality(s) of the foreign person(s) or entity(s) or if the entity is a mutual or reciprocal, the nationality of its manager or attorney - in - fact and identify the type of entity(s) (e.g., individual, corporation, government, manager or attorney - in - fact).
1Nationality
2Type of Entity
20
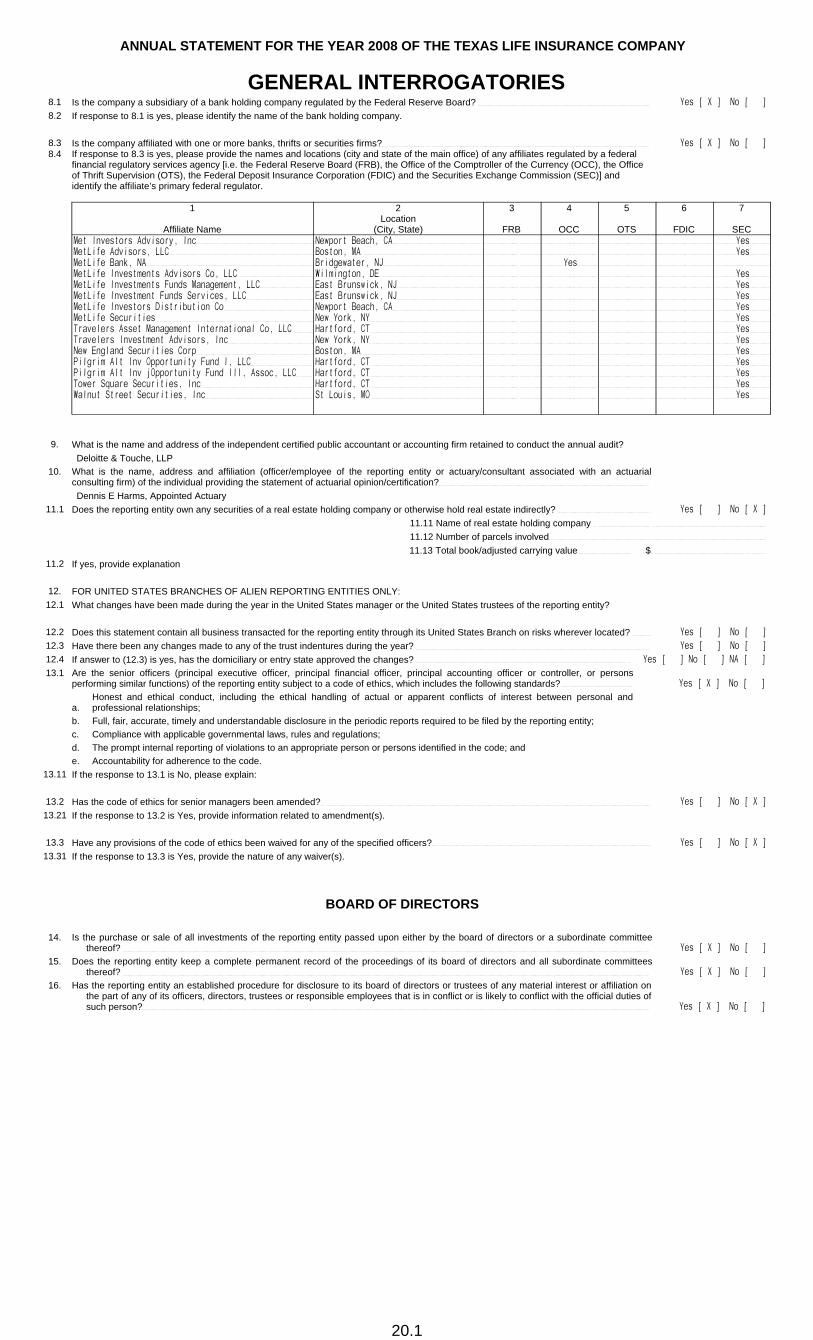
ANNUAL STATEMENT FOR THE YEAR 2008 OF THE TEXAS LIFE INSURANCE COMPANY
GENERAL INTERROGATORIES8.1 Is the company a subsidiary of a bank holding company regulated by the Federal Reserve Board? Yes [ X ] No [ ]8.2 If response to 8.1 is yes, please identify the name of the bank holding company.
8.3 Is the company affiliated with one or more banks, thrifts or securities firms? Yes [ X ] No [ ]8.4 If response to 8.3 is yes, please provide the names and locations (city and state of the main office) of any affiliates regulated by a federal
financial regulatory services agency [i.e. the Federal Reserve Board (FRB), the Office of the Comptroller of the Currency (OCC), the Office of Thrift Supervision (OTS), the Federal Deposit Insurance Corporation (FDIC) and the Securities Exchange Commission (SEC)] and identify the affiliate’s primary federal regulator.
1
Affiliate Name
2Location
(City, State)
3
FRB
4
OCC
5
OTS
6
FDIC
7
SECMet Investors Advisory, Inc Newport Beach, CA YesMetLife Advisors, LLC Boston, MA YesMetLife Bank, NA Bridgewater, NJ YesMetLife Investments Advisors Co, LLC Wilmington, DE YesMetLife Investments Funds Management, LLC East Brunswick, NJ YesMetLife Investment Funds Services, LLC East Brunswick, NJ YesMetLife Investors Distribution Co Newport Beach, CA YesMetLife Securities New York, NY YesTravelers Asset Management International Co, LLC Hartford, CT YesTravelers Investment Advisors, Inc New York, NY YesNew England Securities Corp Boston, MA YesPilgrim Alt Inv Opportunity Fund I, LLC Hartford, CT YesPilgrim Alt Inv jOpportunity Fund III, Assoc, LLC Hartford, CT YesTower Square Securities, Inc Hartford, CT YesWalnut Street Securities, Inc St Louis, MO Yes
9. What is the name and address of the independent certified public accountant or accounting firm retained to conduct the annual audit?Deloitte & Touche, LLP
10. What is the name, address and affiliation (officer/employee of the reporting entity or actuary/consultant associated with an actuarial consulting firm) of the individual providing the statement of actuarial opinion/certification?Dennis E Harms, Appointed Actuary
11.1 Does the reporting entity own any securities of a real estate holding company or otherwise hold real estate indirectly? Yes [ ] No [ X ]
11.11 Name of real estate holding company 11.12 Number of parcels involved
11.13 Total book/adjusted carrying value $11.2 If yes, provide explanation
12. FOR UNITED STATES BRANCHES OF ALIEN REPORTING ENTITIES ONLY:12.1 What changes have been made during the year in the United States manager or the United States trustees of the reporting entity?
12.2 Does this statement contain all business transacted for the reporting entity through its United States Branch on risks wherever located? Yes [ ] No [ ]12.3 Have there been any changes made to any of the trust indentures during the year? Yes [ ] No [ ]12.4 If answer to (12.3) is yes, has the domiciliary or entry state approved the changes? Yes [ ] No [ ] NA [ ]13.1 Are the senior officers (principal executive officer, principal financial officer, principal accounting officer or controller, or persons
performing similar functions) of the reporting entity subject to a code of ethics, which includes the following standards? Yes [ X ] No [ ]
a.Honest and ethical conduct, including the ethical handling of actual or apparent conflicts of interest between personal and professional relationships;
b. Full, fair, accurate, timely and understandable disclosure in the periodic reports required to be filed by the reporting entity;c. Compliance with applicable governmental laws, rules and regulations;d. The prompt internal reporting of violations to an appropriate person or persons identified in the code; ande. Accountability for adherence to the code.
13.11 If the response to 13.1 is No, please explain:
13.2 Has the code of ethics for senior managers been amended? Yes [ ] No [ X ]13.21 If the response to 13.2 is Yes, provide information related to amendment(s).
13.3 Have any provisions of the code of ethics been waived for any of the specified officers? Yes [ ] No [ X ]13.31 If the response to 13.3 is Yes, provide the nature of any waiver(s).
BOARD OF DIRECTORS
14. Is the purchase or sale of all investments of the reporting entity passed upon either by the board of directors or a subordinate committee thereof? Yes [ X ] No [ ]
15. Does the reporting entity keep a complete permanent record of the proceedings of its board of directors and all subordinate committees thereof? Yes [ X ] No [ ]
16. Has the reporting entity an established procedure for disclosure to its board of directors or trustees of any material interest or affiliation on the part of any of its officers, directors, trustees or responsible employees that is in conflict or is likely to conflict with the official duties of such person? Yes [ X ] No [ ]
20.1

ANNUAL STATEMENT FOR THE YEAR 2008 OF THE TEXAS LIFE INSURANCE COMPANY
GENERAL INTERROGATORIESFINANCIAL
17. Has this statement been prepared using a basis of accounting other than Statutory Accounting Principles (e.g., Generally Accepted Accounting Principles)? Yes [ ] No [ X ]
18.1 Total amount loaned during the year (inclusive of Separate Accounts, exclusive of policy loans): 18.11 To directors or other officers $
18.12 To stockholders not officers $
18.13 Trustees, supreme or grand (Fraternal only) $
18.2 Total amount of loans outstanding at end of year (inclusive of Separate Accounts, exclusive of policy loans): 18.21 To directors or other officers $
18.22 To stockholders not officers $
18.23 Trustees, supreme or grand (Fraternal only) $
19.1 Were any assets reported in the statement subject to a contractual obligation to transfer to another party without the liability for such obligation being reported in the statement? Yes [ ] No [ X ]
19.2 If yes, state the amount thereof at December 31 of the current year: 19.21 Rented from others $
19.22 Borrowed from others $
19.23 Leased from others $
19.24 Other $
20.1 Does this statement include payments for assessments as described in the Annual Statement Instructions other than guaranty fund or guaranty association assessments? Yes [ ] No [ X ]
20.2 If answer is yes: 20.21 Amount paid as losses or risk adjustment $
20.22 Amount paid as expenses $
20.23 Other amounts paid $
21.1 Does the reporting entity report any amounts due from the parent, subsidiaries or affiliates on Page 2 of this statement? Yes [ X ] No [ ]
21.2 If yes, indicate any amounts receivable from parent included in the Page 2 amount: $ 2,506
INVESTMENT
22.1 Were all the stocks, bonds and other securities owned December 31 of current year, over which the reporting entity has exclusive control, in the actual possession of the reporting entity on said date? (other than securities lending programs addressed in 22.3) Yes [ X ] No [ ]
22.2 If no, give full and complete information relating thereto:
22.3 For security lending programs, provide a description of the program including value for collateral and amount of loaned securities, and whether collateral is carried on or off-balance sheet. (an alternative is to reference Note 16 where this information is also provide)
The Company, as a general partner in the MetLife Intermediate Income Pool, can participate in the Pool's security lending program. However, as of yearend 2008, the Company had not participated in any of the Pool's pooling arrangements. Also reference notes 16 and 25.
22.4 Does the company’s security lending program meet the requirements for a conforming program as outlined in the Risk-Based Capital Instructions? Yes [ ] No [ ]
22.5 If answer to 22.4 is YES, report amount of collateral $
22.6 If answer to 22.4 is NO, report amount of collateral $
23.1 Were any of the stocks, bonds or other assets of the reporting entity owned at December 31 of the current year not exclusively under the control of the reporting entity or has the reporting entity sold or transferred any assets subject to a put option contract that is currently in force? (Exclude securities subject to Interrogatory 19.1 and 22.3) Yes [ X ] No [ ]
23.2 If yes, state the amount thereof at December 31 of the current year: 23.21 Subject to repurchase agreements $
23.22 Subject to reverse repurchase agreements $
23.23 Subject to dollar repurchase agreements $
23.24 Subject to reverse dollar repurchase agreements $
23.25 Pledged as collateral $
23.26 Placed under option agreements $
23.27 Letter stock or securities restricted as to sale $
23.28 On deposit with state or other regulatory body $ 4,699,373
23.29 Other $
23.3 For category (23.27) provide the following:
1Nature of Restriction
2Description
3Amount
24.1 Does the reporting entity have any hedging transactions reported on Schedule DB? Yes [ ] No [ X ]
24.2 If yes, has a comprehensive description of the hedging program been made available to the domiciliary state? Yes [ ] No [ ] NA [ X ]If no, attach a description with this statement.
25.1 Were any preferred stocks or bonds owned as of December 31 of the current year mandatorily convertible into equity, or, at the option of the issuer, convertible into equity? Yes [ ] No [ X ]
25.2 If yes, state the amount thereof at December 31 of the current year. $
20.2

ANNUAL STATEMENT FOR THE YEAR 2008 OF THE TEXAS LIFE INSURANCE COMPANY
GENERAL INTERROGATORIES 26. Excluding items in Schedule E-Part 3-Special Deposits, real estate, mortgage loans and investments held physically in the reporting
entity’s offices, vaults or safety deposit boxes, were all stocks, bonds and other securities, owned throughout the current year held pursuant to a custodial agreement with a qualified bank or trust company in accordance with Section 3, III Conducting Examinations, F - Custodial or Safekeeping agreements of the NAIC Financial Condition Examiners Handbook? Yes [ X ] No [ ]
26.01 For agreements that comply with the requirements of the NAIC Financial Condition Examiners Handbook, complete the following:
1Name of Custodian(s)
2Custodian’s Address
JPMorgan Chase Bank4 New York Plaza, 15th Flr, New York, NY 10004-2413
26.02 For all agreements that do not comply with the requirements of the NAIC Financial Condition Examiners Handbook, provide the name, location and a complete explanation:
1Name(s)
2Location(s)
2Complete Explanation(s)
26.03 Have there been any changes, including name changes, in the custodian(s) identified in 26.01 during the current year? Yes [ ] No [ X ]26.04 If yes, give full and complete information relating thereto:
1
Old Custodian
2
New Custodian
3Date of Change
4
Reason
26.05 Identify all investment advisors, brokers/dealers or individuals acting on behalf of broker/dealers that have access to the investment accounts, handle securities and have authority to make investments on behalf of the reporting entity:
1Central Registration Depository Number(s)
2Name
2Address
04095 Metropolitan Life Insurance Compnay 10 Park Avenue, Morristown, NJ 07962
27.1 Does the reporting entity have any diversified mutual funds reported in Schedule D, Part 2 (diversified according to the Securities and Exchange Commission (SEC) in the Investment Company Act of 1940 [Section 5 (b) (1)])? Yes [ ] No [ X ]
27.2 If yes, complete the following schedule:
1CUSIP #
2Name of Mutual Fund
3Book/Adjusted Carrying Value
27.2999 TOTAL
27.3 For each mutual fund listed in the table above, complete the following schedule:
1
Name of Mutual Fund(from above table)
2
Name of Significant HoldingOf the Mutual Fund
3Amount of Mutual Fund’s
Book/Adjusted Carrying ValueAttributable to the Holding
4
Date of Valuation
20.3

ANNUAL STATEMENT FOR THE YEAR 2008 OF THE TEXAS LIFE INSURANCE COMPANY
GENERAL INTERROGATORIES
28. Provide the following information for all short-term and long-term bonds and all preferred stocks. Do not substitute amortized value or statement value for fair value.
1
Statement (Admitted)Value
2
Fair Value
3Excess of Statement
over Fair Value (-)or Fair Value
over Statement (+)
28.1 Bonds 537,990,307 501,675,731 (36,314,576)
28.2 Preferred stocks 18,249,798 10,254,327 (7,995,471)
28.3 Totals 556,240,105 511,930,058 (44,310,047)
28.4 Describe the sources or methods utilized in determining the fair values:
Per NAIC SVO procedures, TL has elected not to use NAIC prices. Instead, external prices are sought, but if they are unavailable, fair value is estimated per present value/other techniques. Factors considered: coupon, maturity, duration, calls, sink funds, credit rating, & industry.
29.1 Have all the filing requirements of the Purposes and Procedures Manual of the NAIC Securities Valuation Office been followed? Yes [ X ] No [ ]
29.2 If no, list exceptions:
OTHER30.1 Amount of payments to trade associations, service organizations and statistical or rating bureaus, if any? $ 91,277
30.2 List the name of the organization and the amount paid if any such payment represented 25% or more of the total payments to trade associations, service organizations and statistical or rating bureaus during the period covered by this statement.
1Name
2Amount Paid
Examination Management Services, Inc 44,553
31.1 Amount of payments for legal expenses, if any? $ 443,080
31.2 List the name of the firm and the amount paid if any such payment represented 25% or more of the total payments for legal expenses during the period covered by this statement.
1Name
2Amount Paid
Wyatt, Tarrant & Combs 34,924
32.1 Amount of payments for expenditures in connection with matters before legislative bodies, officers or departments of government, if any? $
32.2 List the name of the firm and the amount paid if any such payment represented 25% or more of the total payment expenditures in connection with matters before legislative bodies, officers or departments of government during the period covered by this statement.
1Name
2Amount Paid
20.4

ANNUAL STATEMENT FOR THE YEAR 2008 OF THE TEXAS LIFE INSURANCE COMPANY
GENERAL INTERROGATORIESPART 2 - LIFE INTERROGATORIES
1.1 Does the reporting entity have any direct Medicare Supplement Insurance in force? Yes [ ] No [ X ]
1.2 If yes, indicate premium earned on U. S. business only $
1.3 What portion of Item (1.2) is not reported on the Medicare Supplement Insurance Experience Exhibit? $
1.31 Reason for excluding
1.4 Indicate amount of earned premium attributable to Canadian and/or Other Alien not included in Item (1.2) above. $
1.5 Indicate total incurred claims on all Medicare Supplement insurance. $
1.6 Individual policies:
Most current three years:
1.61 Total premium earned $
1.62 Total incurred claims $
1.63 Number of covered lives
All years prior to most current three years:
1.64 Total premium earned $
1.65 Total incurred claims $
1.66 Number of covered lives
1.7 Group policies:
Most current three years:
1.71 Total premium earned $
1.72 Total incurred claims $
1.73 Number of covered lives
All years prior to most current three years:
1.74 Total premium earned $
1.75 Total incurred claims $
1.76 Number of covered lives
2. Health Test:
1Current Year
2Prior Year
2.1 Premium Numerator $ $
2.2 Premium Denominator $ 129,764,274 $ 112,330,046
2.3 Premium Ratio (2.1/2.2)
2.4 Reserve Numerator $ 2,666 $ 2,734
2.5 Reserve Denominator $ 584,578,194 $ 554,340,438
2.6 Reserve Ratio (2.4/2.5)
3.1 Does this reporting entity have Separate Accounts? Yes [ ] No [ X ]
3.2 If yes, has a Separate Accounts statement been filed with this Department? Yes [ ] No [ ] NA [ X ]
3.3 What portion of capital and surplus funds of the reporting entity covered by assets in the Separate Accounts statement, is not currently distributable from the Separate Accounts to the general account for use by the general account? $
3.4 State the authority under which Separate Accounts are maintained:
3.5 Was any of the reporting entity’s Separate Accounts business reinsured as of December 31? Yes [ ] No [ ]
3.6 Has the reporting entity assumed by reinsurance any Separate Accounts business as of December 31? Yes [ ] No [ ]
3.7 If the reporting entity has assumed Separate Accounts business, how much, if any, reinsurance assumed receivable for reinsurance of Separate Accounts reserve expense allowances is included as a negative amount in the liability for “Transfers to Separate Accounts due or accrued (net)? $
4.1 Are personnel or facilities of this reporting entity used by another entity or entities or are personnel or facilities of another entity or entities used by this reporting entity (except for activities such as administration of jointly underwritten group contracts and joint mortality or morbidity studies)? Yes [ ] No [ X ]
4.2 Net reimbursement of such expenses between reporting entities:
4.21 Paid: $
4.22 Received: $
5.1 Does the reporting entity write any guaranteed interest contracts? Yes [ ] No [ X ]
5.2 If yes, what amount pertaining to these items is included in: 5.21 Page 3, Line 1 $
5.22 Page 4, Line 1 $
6. For stock reporting entities only:
6.1 Total amount paid in by stockholders as surplus funds since organization of the reporting entity: $
7. Total dividends paid stockholders since organization of the reporting entity: 7.11 Cash: $
7.12 Stock: $
21

ANNUAL STATEMENT FOR THE YEAR 2008 OF THE TEXAS LIFE INSURANCE COMPANY
GENERAL INTERROGATORIES8.1 Does the company reinsure any Workers’ Compensation Carve-Out business defined as: Yes [ ] No [ X ]
Reinsurance (including retrocessional reinsurance) assumed by life and health insurers of medical, wage loss and death benefits of the occupational illness and accident exposures, but not the employers liability exposures, of business originally written as workers’ compensation insurance.
8.2 If yes, has the reporting entity completed the Workers Compensation Carve-Out Supplement to the Annual Statement? Yes [ ] No [ ]
8.3 If 8.1 is yes, the amounts of earned premiums and claims incurred in this statement are:
1Reinsurance
Assumed
2Reinsurance
Ceded
3Net
Retained
8.31 Earned premium
8.32 Paid claims
8.33 Claim liability and reserve (beginning of year)
8.34 Claim liability and reserve (end of year)
8.35 Incurred Claims
8.4 If reinsurance assumed included amounts with attachment points below $1,000,000, the distribution of the amounts reported in Lines 8.31 and 8.34 for Column 1 are:
AttachmentPoint
1Earned
Premium
2Claim LiabilityAnd Reserve
8.41 <$25,000
8.42 $25,000 – 99,999
8.43 $100,000 – 249,999
8.44 $250,000 – 999,999
8.45 $1,000,000 or more
8.5 What portion of earned premium reported in 8.31, Column 1 was assumed from pools? $
9.1 Does the company have variable annuities with guaranteed benefits? Yes [ ] No [ X ]
9.2 If 9.1 is yes, complete the following table for each type of guaranteed benefit.
Type 3 4 5 6 7 8 91
GuaranteedDeath Benefits
2Guaranteed
Living BenefitsWaiting Period
RemainingAccount Value
Related to Col.3Total Related
Account ValuesGross Amount
of ReserveLocation of
ReservePortion
ReinsuredReinsurance
Reserved Credit
21.1

ANNUAL STATEMENT FOR THE YEAR 2008 OF THE TEXAS LIFE INSURANCE COMPANY
FIVE-YEAR HISTORICAL DATAShow amounts in whole dollars only, no cents; show percentages to one decimal place, i.e., 17.6.
Show amounts of life insurance in this exhibit in thousands (OMIT $000)1
20082
20073
20064
20055
2004
Life Insurance in Force (Exhibit of Life Insurance)
1. Ordinary - whole life and endowment (Line 34, Col. 4) 16,077,472 14,607,760 13,222,823 12,026,050 10,977,123
2. Ordinary - term (Line 21, Col. 4, less Line 34, Col. 4) 384,709 412,829 437,309 463,288 497,877
3. Credit life (Line 21, Col. 6) 4. Group, excluding FEGLI/SGLI (Line 21, Col. 9 less
Lines 43 & 44, Col. 4) 10,099 37,933 33,455 29,142
5. Industrial (Line 21, Col. 2) 6. FEGLI/SGLI (Lines 43 & 44, Col. 4) 7. Total (Line 21, Col. 10) 16,472,280 15,020,589 13,698,065 12,522,793 11,504,142
New Business Issued (Exhibit of Life Insurance)
8. Ordinary - whole life and endowment (Line 34, Col. 2) 3,021,554 2,858,725 2,574,810 2,345,527 2,526,087
9. Ordinary - term (Line 2, Col. 4, less Line 34, Col. 2) 91 3,998 3,976 3,917
10. Credit life (Line 2, Col. 6) 11. Group (Line 2, Col. 9) 12. Industrial (Line 2, Col. 2) 13. Total (Line 2, Col. 10) 3,021,554 2,858,816 2,578,808 2,349,503 2,530,004
Premium Income - Lines of Business(Exhibit 1 – Part 1)
14. Industrial life (Line 20.4, Col. 2) 15.1Ordinary life insurance (Line 20.4, Col. 3) 129,487,286 111,876,196 99,488,080 89,873,362 78,769,192
15.2Ordinary individual annuities (Line 20.4, Col. 4) 73,464 92,016 70,995 110,470 222,595
16. Credit life, (group and individual) (Line 20.4, Col. 5)
17.1Group life insurance (Line 20.4, Col. 6) 36,189 34,070 179,137 175,169 154,999
17.2Group annuities (Line 20.4, Col. 7) 161,802 321,376 321,290 146,417 346,865
18.1A & H-group (Line 20.4, Col. 8) 18.2A & H-credit (group and individual) (Line 20.4, Col.
9) 18.3A & H-other (Line 20.4, Col. 10) 5,533 6,388 7,145 8,641 9,851
19. Aggregate of all other lines of business (Line 20.4,Col. 11)
20. Total 129,764,274 112,330,046 100,066,647 90,314,059 79,503,502
Balance Sheet(Pages 2 and 3)
21. Total admitted assets excluding Separate Accounts business (Page 2, Line 24, Col. 3) 664,998,192 630,854,947 1,910,465,484 896,350,457 874,171,202
22. Total liabilities excluding Separate Accounts business (Page 3, Line 26) 617,035,159 585,141,170 1,870,769,400 862,165,475 841,955,699
23. Aggregate life reserves (Page 3, Line 1) 586,243,318 556,750,395 532,419,596 830,458,153 807,574,794
24. Aggregate A & H reserves (Page 3, Line 2) 32,877 47,466 43,708 37,696 43,706
25. Deposit-type contract funds (Page 3, Line 3) 3,010,457 3,108,634 4,369,300 4,364,658 4,442,783
26. Asset valuation reserve (Page 3, Line 24.1) 533,163 3,352,934 5,078,297 5,996,319 5,268,978
27. Capital (Page 3, Lines 29 & 30) 3,177,360 3,177,360 3,177,360 3,177,360 3,177,360
28. Surplus (Page 3, Line 37) 44,785,673 42,536,423 36,518,724 31,007,623 29,038,144
Cash Flow (Page 5)29. Net cash from operations (Line 11) 45,691,809 (67,547,197) 31,643,203 26,932,123 29,897,574
Risk-Based Capital Analysis30. Total adjusted capital 50,588,661 50,650,724 46,072,872 41,245,496 38,362,202
31. Authorized control level risk - based capital 9,378,396 8,691,832 9,320,453 9,807,002 9,257,122
Percentage Distribution of Cash, Cash Equivalents and Invested Assets (Page 2, Col. 3) (Line No. / Page 2, Line 10, Col. 3) x 100.0
32. Bonds (Line 1) 79.7 78.1 80.2 88.3 87.1
33. Stocks (Lines 2.1 and 2.2) 2.9 3.2 5.5 0.3 0.0
34. Mortgage loans on real estate (Lines 3.1 and 3.2 ) 6.3 7.1 5.2 5.9 6.4
35. Real estate (Lines 4.1, 4.2 and 4.3) 0.3 0.4 0.5 0.5 0.6
36. Cash, cash equivalents and short - term investments (Line 5) 5.0 5.3 4.5 1.0 1.7
37. Contract loans (Line 6) 5.5 5.6 3.8 3.9 4.1
38. Other invested assets (Line 7) 0.4 0.4 0.3 0.2
39. Receivables for securities (Line 8) 0.0 0.0 0.0 0.0 0.0
40. Aggregate write-ins for invested assets (Line 9) 0.0 0.0 0.0
41. Cash, cash equivalents and invested assets (Line 10) 100.0 100.0 100.0 100.0 100.0
22
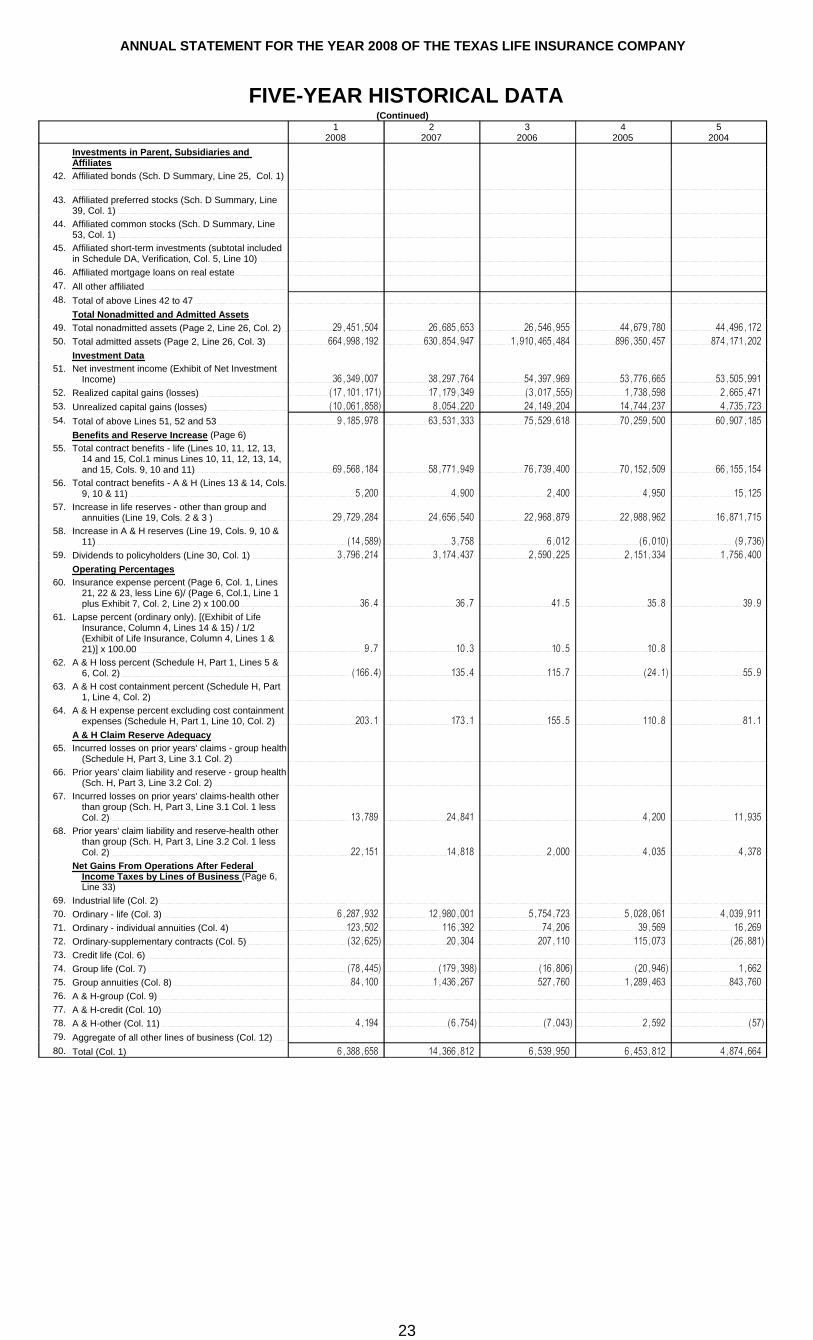
ANNUAL STATEMENT FOR THE YEAR 2008 OF THE TEXAS LIFE INSURANCE COMPANY
FIVE-YEAR HISTORICAL DATA(Continued)
12008
22007
32006
42005
52004
Investments in Parent, Subsidiaries and Affiliates
42. Affiliated bonds (Sch. D Summary, Line 25, Col. 1)
43. Affiliated preferred stocks (Sch. D Summary, Line 39, Col. 1)
44. Affiliated common stocks (Sch. D Summary, Line 53, Col. 1)
45. Affiliated short-term investments (subtotal included in Schedule DA, Verification, Col. 5, Line 10)
46. Affiliated mortgage loans on real estate 47. All other affiliated 48. Total of above Lines 42 to 47
Total Nonadmitted and Admitted Assets49. Total nonadmitted assets (Page 2, Line 26, Col. 2) 29,451,504 26,685,653 26,546,955 44,679,780 44,496,172 50. Total admitted assets (Page 2, Line 26, Col. 3) 664,998,192 630,854,947 1,910,465,484 896,350,457 874,171,202
Investment Data51. Net investment income (Exhibit of Net Investment
Income) 36,349,007 38,297,764 54,397,969 53,776,665 53,505,991 52. Realized capital gains (losses) (17,101,171) 17,179,349 (3,017,555) 1,738,598 2,665,471 53. Unrealized capital gains (losses) (10,061,858) 8,054,220 24,149,204 14,744,237 4,735,723
54. Total of above Lines 51, 52 and 53 9,185,978 63,531,333 75,529,618 70,259,500 60,907,185
Benefits and Reserve Increase (Page 6)55. Total contract benefits - life (Lines 10, 11, 12, 13,
14 and 15, Col.1 minus Lines 10, 11, 12, 13, 14, and 15, Cols. 9, 10 and 11) 69,568,184 58,771,949 76,739,400 70,152,509 66,155,154
56. Total contract benefits - A & H (Lines 13 & 14, Cols. 9, 10 & 11) 5,200 4,900 2,400 4,950 15,125
57. Increase in life reserves - other than group and annuities (Line 19, Cols. 2 & 3 ) 29,729,284 24,656,540 22,968,879 22,988,962 16,871,715
58. Increase in A & H reserves (Line 19, Cols. 9, 10 & 11) (14,589) 3,758 6,012 (6,010) (9,736)
59. Dividends to policyholders (Line 30, Col. 1) 3,796,214 3,174,437 2,590,225 2,151,334 1,756,400
Operating Percentages60. Insurance expense percent (Page 6, Col. 1, Lines
21, 22 & 23, less Line 6)/ (Page 6, Col.1, Line 1 plus Exhibit 7, Col. 2, Line 2) x 100.00 36.4 36.7 41.5 35.8 39.9
61. Lapse percent (ordinary only). [(Exhibit of Life Insurance, Column 4, Lines 14 & 15) / 1/2 (Exhibit of Life Insurance, Column 4, Lines 1 & 21)] x 100.00 9.7 10.3 10.5 10.8
62. A & H loss percent (Schedule H, Part 1, Lines 5 & 6, Col. 2) (166.4) 135.4 115.7 (24.1) 55.9
63. A & H cost containment percent (Schedule H, Part 1, Line 4, Col. 2)
64. A & H expense percent excluding cost containment expenses (Schedule H, Part 1, Line 10, Col. 2) 203.1 173.1 155.5 110.8 81.1
A & H Claim Reserve Adequacy 65. Incurred losses on prior years' claims - group health
(Schedule H, Part 3, Line 3.1 Col. 2) 66. Prior years' claim liability and reserve - group health
(Sch. H, Part 3, Line 3.2 Col. 2) 67. Incurred losses on prior years' claims-health other
than group (Sch. H, Part 3, Line 3.1 Col. 1 less Col. 2) 13,789 24,841 4,200 11,935
68. Prior years' claim liability and reserve-health other than group (Sch. H, Part 3, Line 3.2 Col. 1 less Col. 2) 22,151 14,818 2,000 4,035 4,378
Net Gains From Operations After Federal Income Taxes by Lines of Business (Page 6, Line 33)
69. Industrial life (Col. 2) 70. Ordinary - life (Col. 3) 6,287,932 12,980,001 5,754,723 5,028,061 4,039,911 71. Ordinary - individual annuities (Col. 4) 123,502 116,392 74,206 39,569 16,269 72. Ordinary-supplementary contracts (Col. 5) (32,625) 20,304 207,110 115,073 (26,881)73. Credit life (Col. 6) 74. Group life (Col. 7) (78,445) (179,398) (16,806) (20,946) 1,662 75. Group annuities (Col. 8) 84,100 1,436,267 527,760 1,289,463 843,760 76. A & H-group (Col. 9) 77. A & H-credit (Col. 10) 78. A & H-other (Col. 11) 4,194 (6,754) (7,043) 2,592 (57)79. Aggregate of all other lines of business (Col. 12) 80. Total (Col. 1) 6,388,658 14,366,812 6,539,950 6,453,812 4,874,664
23

*69396200843059100*ANNUAL STATEMENT FOR THE YEAR 2008 OF THE TEXAS LIFE INSURANCE COMPANY
DIRECT BUSINESS IN THE STATE OF Consolidated DURING THE YEAR 2008
NAIC Group Code 0241 LIFE INSURANCE NAIC Company Code 69396
DIRECT PREMIUMSAND ANNUITY CONSIDERATIONS
1
Ordinary
2Credit Life (Group
and Individual)
3
Group
4
Industrial
5
Total1. Life insurance 133,366,545 36,189 133,402,734 2. Annuity considerations 73,463 161,802 235,265 3. Deposit-type contract funds XXX XXX4. Other considerations 5. Totals (Sum of Lines 1 to 4) 133,440,008 197,991 133,637,999
DIRECT DIVIDENDS TO POLICYHOLDERSLife insurance:6.1 Paid in cash or left on deposit 14,662 14,662 6.2 Applied to pay renewal premiums 575,198 575,198 6.3 Applied to provide paid-up additions or shorten the
endowment or premium-paying period 2,189,438 2,189,438 6.4 Other 6.5 Totals (Sum of 6.1 to 6.4) 2,779,298 2,779,298 Annuities:7.1 Paid in cash or left on deposit 7.2 Applied to provide paid-up annuities 7.3 Other 7.4 Totals (Sum of Lines 7.1 to 7.3)
8. Grand Totals (Lines 6.5 plus 7.4) 2,779,298 2,779,298 DIRECT CLAIMS AND BENEFITS PAID
9. Death benefits 54,300,389 136,198 54,436,587 10. Matured endowments 102,508 102,508 11. Annuity benefits 812,877 1,039,187 1,852,064 12. Surrender values and withdrawals for life contracts 15,300,172 15,300,172 13. Aggregate write-ins for miscellaneous direct claims and
benefits paid 1,186,738 1,186,738 14. All other benefits, except accident and health 15. Totals 71,702,684 1,175,385 72,878,069
DETAILS OF WRITE-INS1301. Supplemental Contracts With Life Contingencies 749,604 749,604 1302. Supplemantal Contracts Without LIfe Contingencies 437,134 437,134 1303.1398. Summary of Line 13 from overflow page 1399. Totals (Lines 1301 thru 1303 plus 1398) (Line 13 above) 1,186,738 1,186,738
OrdinaryCredit Life
(Group and Individual) Group Industrial Total
DIRECT DEATHBENEFITS AND MATURED
ENDOWMENTSINCURRED
1
No.
2
Amount
3No. of
Ind. Pols.&
Gr. Certifs.
4
Amount
5
No. of Certifs.
6
Amount
7
No.
8
Amount
9
No.
10
Amount16. Unpaid December 31,
prior year 259 6,419,073 259 6,419,073 17. Incurred during current
year 1,446 56,690,143 17 136,198 1,463 56,826,341 Settled during current
year:18.1 By payment in full 1,393 54,402,897 17 136,198 1,410 54,539,095 18.2 By payment on
compromised claims 31 12,766 31 12,766
18.3 Totals paid 1,424 54,415,663 17 136,198 1,441 54,551,861 18.4 Reduction by
compromise 1,001,570 1,001,570 18.5 Amount rejected18.6 Total settlements 1,424 55,417,233 17 136,198 1,441 55,553,431
19. Unpaid Dec. 31, current year (16+17-18.6) 281 7,691,983 281 7,691,983
POLICY EXHIBITNo. of
Policies20. In force December 31, (a)
prior year 346,483 15,020,584,625 1 10,099,000 346,484 15,030,683,625 21. Issued during year 77,097 3,021,553,708 77,097 3,021,553,708 22. Other changes to in
force (Net) (37,471) (1,579,961,056) (37,471) (1,579,961,056)23. In force December 31 (a)
of current year 386,109 16,462,177,277 1 10,099,000 386,110 16,472,276,277 (a) Includes Individual Credit Life Insurance: prior year $ current year $
Includes Group Credit Life Insurance: Loans less than or equal to 60 months at issue, prior year $ current year $Loans greater than 60 months at issue BUT NOT GREATER THAN 120 MONTHS, prior year $ current year $
ACCIDENT AND HEALTH INSURANCE1
Direct Premiums
2
Direct Premiums Earned
3Dividends Paid Or Credited On Direct
Business
4
Direct Losses Paid
5
Direct LossesIncurred
24. Group Policies (b)24.1Federal Employees Health Benefits Program premium (b) 24.2Credit (Group and Individual) 24.3Collectively Renewable Policies (b)24.4Medicare Title XVIII exempt from state taxes or fees
Other Individual Policies:25.1Non-cancelable (b) 3,526 3,526 3,446 3,446 25.2Guaranteed renewable (b) 2,007 2,007 1,754 1,754 25.3Non-renewable for stated reasons only (b)25.4Other accident only 25.5All other (b)25.6Totals (Sum of Lines 25.1 to 25.5) 5,533 5,533 5,200 5,200 26. Totals (Lines 24 + 24.1 + 24.2 + 24.3 + 24.4 + 25.6) 5,533 5,533 5,200 5,200
(b) For health business on indicated lines report: Number of persons insured under PPO managed care products and number of persons insured under Indemnity only products
24.GT

ANNUAL STATEMENT FOR THE YEAR 2008 OF THE TEXAS LIFE INSURANCE COMPANY
EXHIBIT OF LIFE INSURANCEIndustrial Ordinary Credit Life (Group and Individual) Group 10
1 2 3 4 5 6 Number of 9
Number of PoliciesAmount of Insurance
(a) Number of PoliciesAmount of Insurance
(a)
Number of IndividualPolicies and Group
CertificatesAmount of Insurance
(a)
7
Policies
8
CertificatesAmount of Insurance
(a)
TotalAmount of Insurance
(a)1. In force end of prior year 346,483 15,020,589 15,020,589 2. Issued during year 77,097 3,021,554 3,021,554 3. Reinsurance assumed 4. Revived during year 612 26,457 26,457 5. Increased during year (net) 6,343 1 126 10,117 16,460 6. Subtotals, Lines 2 to 5 77,709 3,054,354 1 126 10,117 3,064,471 7. Additions by dividends during year XXX XXX 5,037 XXX XXX XXX 5,037 8. Aggregate write-ins for increases 9. Totals (Lines 1 and 6 to 8) 424,192 18,079,980 1 126 10,117 18,090,097
Deductions during year: 10. Death 1,258 52,638 XXX 1 18 52,656 11. Maturity 51 286 XXX 286 12. Disability XXX13. Expiry 263 15,339 15,339 14. Surrender 3,042 171,603 171,603 15. Lapse 33,300 1,356,769 1,356,769 16. Conversion 169 6,150 XXX XXX XXX 6,150 17. Decreased (net) 15,014 15,014 18. Reinsurance 19. Aggregate write-ins for decreases 20. Totals (Lines 10 to 19) 38,083 1,617,799 1 18 1,617,817 21. In force end of year, (Line 9 minus Line 20) 386,109 16,462,181 1 125 10,099 16,472,280 22. Reinsurance ceded end of year XXX XXX 229,602 XXX XXX XXX 229,602 23. Line 21 minus Line 22 XXX XXX 16,232,579 XXX (b) XXX XXX 10,099 16,242,678
DETAILS OF WRITE-INS0801.0802.0803.0898. Summary of remaining write-ins for Line 8 from overflow
page 0899. Totals (Lines 0801 through 0803 plus 0898) (Line 8
above) 1901.1902.1903.1998. Summary of remaining write-ins for Line 19 from
overflow page 1999. Totals (Lines 1901 through 1903 plus 1998) (Line 19
above) (a) Amounts of life insurance in this exhibit shall be shown in thousands (omit 000)(b) Group $ ; Individual $
25
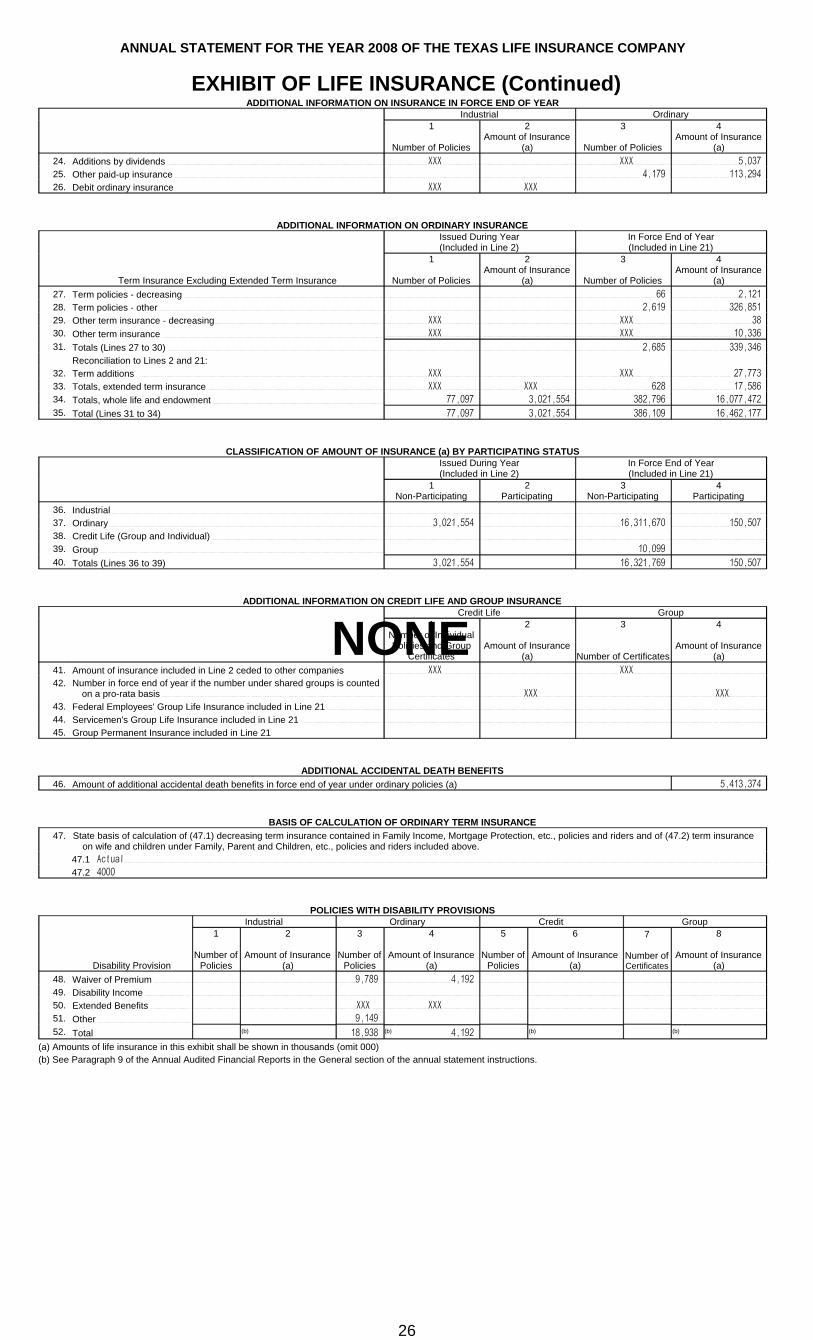
ANNUAL STATEMENT FOR THE YEAR 2008 OF THE TEXAS LIFE INSURANCE COMPANY
EXHIBIT OF LIFE INSURANCE (Continued)ADDITIONAL INFORMATION ON INSURANCE IN FORCE END OF YEAR
Industrial Ordinary1
Number of Policies
2Amount of Insurance
(a)
3
Number of Policies
4Amount of Insurance
(a)24. Additions by dividends XXX XXX 5,037 25. Other paid-up insurance 4,179 113,294 26. Debit ordinary insurance XXX XXX
ADDITIONAL INFORMATION ON ORDINARY INSURANCEIssued During Year (Included in Line 2)
In Force End of Year (Included in Line 21)
Term Insurance Excluding Extended Term Insurance
1
Number of Policies
2Amount of Insurance
(a)
3
Number of Policies
4Amount of Insurance
(a)27. Term policies - decreasing 66 2,121 28. Term policies - other 2,619 326,851 29. Other term insurance - decreasing XXX XXX 38 30. Other term insurance XXX XXX 10,336 31. Totals (Lines 27 to 30) 2,685 339,346
Reconciliation to Lines 2 and 21:32. Term additions XXX XXX 27,773 33. Totals, extended term insurance XXX XXX 628 17,586 34. Totals, whole life and endowment 77,097 3,021,554 382,796 16,077,472 35. Total (Lines 31 to 34) 77,097 3,021,554 386,109 16,462,177
CLASSIFICATION OF AMOUNT OF INSURANCE (a) BY PARTICIPATING STATUSIssued During Year (Included in Line 2)
In Force End of Year (Included in Line 21)
1Non-Participating
2Participating
3Non-Participating
4Participating
36. Industrial 37. Ordinary 3,021,554 16,311,670 150,507 38. Credit Life (Group and Individual) 39. Group 10,099 40. Totals (Lines 36 to 39) 3,021,554 16,321,769 150,507
ADDITIONAL INFORMATION ON CREDIT LIFE AND GROUP INSURANCECredit Life Group
1Number of Individual Policies and Group
Certificates
2
Amount of Insurance(a)
3
Number of Certificates
4
Amount of Insurance(a)
41. Amount of insurance included in Line 2 ceded to other companies XXX XXX42. Number in force end of year if the number under shared groups is counted
on a pro-rata basis XXX XXX43. Federal Employees' Group Life Insurance included in Line 21 44. Servicemen's Group Life Insurance included in Line 21 45. Group Permanent Insurance included in Line 21
ADDITIONAL ACCIDENTAL DEATH BENEFITS46. Amount of additional accidental death benefits in force end of year under ordinary policies (a) 5,413,374
BASIS OF CALCULATION OF ORDINARY TERM INSURANCE47. State basis of calculation of (47.1) decreasing term insurance contained in Family Income, Mortgage Protection, etc., policies and riders and of (47.2) term insurance
on wife and children under Family, Parent and Children, etc., policies and riders included above. 47.1 Actual47.2 4000
POLICIES WITH DISABILITY PROVISIONSIndustrial Ordinary Credit Group
Disability Provision
1
Number of Policies
2
Amount of Insurance (a)
3
Number of Policies
4
Amount of Insurance (a)
5
Number of Policies
6
Amount of Insurance (a)
7
Number of Certificates
8
Amount of Insurance (a)
48. Waiver of Premium 9,789 4,192 49. Disability Income 50. Extended Benefits XXX XXX51. Other 9,149 52. Total (b) 18,938 (b) 4,192 (b) (b)
(a) Amounts of life insurance in this exhibit shall be shown in thousands (omit 000)(b) See Paragraph 9 of the Annual Audited Financial Reports in the General section of the annual statement instructions.
26
NONE

ANNUAL STATEMENT FOR THE YEAR 2008 OF THE TEXAS LIFE INSURANCE COMPANY
EXHIBIT OF NUMBER OF POLICIES, CONTRACTS, CERTIFICATES, INCOME PAYABLE AND ACCOUNT VALUES IN FORCE FOR
SUPPLEMENTARY CONTRACTS, ANNUITIES, ACCIDENT & HEALTH AND OTHER POLICIES
SUPPLEMENTARY CONTRACTS Ordinary Group
1Involving Life Contingencies
2Not Involving Life
Contingencies
3Involving Life Contingencies
4Not Involving Life
Contingencies1. In force end of prior year 174 95 2. Issued during year 3. Reinsurance assumed 4. Increased during year (net) 5. Totals (Lines 1 to 4) 174 95
Deductions during year: 6. Decreased (net) 9 6 7. Reinsurance ceded8. Totals (Lines 6 and 7) 9 6 9. In force end of year 165 89
10. Amount on deposit (a) 1,502,747 (a)
11. Income now payable 12. Amount of income payable (a) 659,725 (a) 228,331 (a) (a)
ANNUITIESOrdinary Group
1Immediate
2Deferred
3Contracts
4Certificates
1. In force end of prior year 8 416 61 410 2. Issued during year 3. Reinsurance assumed 4. Increased during year (net) 5. Totals (Lines 1 to 4) 8 416 61 410
Deductions during year: 6. Decreased (net) 25 4 23 7. Reinsurance ceded8. Totals (Lines 6 and 7) 25 4 23 9. In force end of year 8 391 57 387
Income now payable: 10. Amount of income payable (a) 74,325 XXX XXX (a) 14,755
Deferred fully paid:11. Account balance XXX (a) 3,240,853 XXX (a) 112,595
Deferred not fully paid: 12. Account balance XXX (a) 5,359,323 XXX (a) 11,643,545
ACCIDENT AND HEALTH INSURANCEGroup Credit Other
1Certificates
2Premiums in Force
3Policies
4Premiums in Force
5Policies
6Premiums in Force
1. In force end of prior year 82 6,388 2. Issued during year 3. Reinsurance assumed 4. Increased during year (net) XXX XXX XXX5. Totals (Lines 1 to 4) XXX XXX 82 XXX
Deductions during year: 6. Conversions XXX XXX XXX XXX XXX7. Decreased (net) XXX XXX 14 XXX8. Reinsurance ceded XXX XXX XXX9. Total (Lines 6 to 8) XXX XXX 14 XXX
10. In force end of year (a) (a) 68 (a) 5,533
DEPOSIT FUNDS AND DIVIDEND ACCUMULATIONS1
Deposit Funds
2Dividend
AccumulationsContracts Contracts
1. In force end of prior year 80 487 2. Issued during year 3. Reinsurance assumed 4. Increased during year (net) 5. Totals (Lines 1 to 4) 80 487
Deductions during year: 6. Decreased (net) 3 44 7. Reinsurance ceded 8. Totals (Lines 6 and 7) 3 44 9. In force end of year 77 443
10. Amount of account balance (a) 374,311 (a) 88,325 (a) See Paragraph 9 of the Annual Audited Financial Reports in the General section of the annual statement instructions.
27

ANNUAL STATEMENT FOR THE YEAR 2008 OF THE TEXAS LIFE INSURANCE COMPANY
FORM FOR CALCULATING THE INTEREST MAINTENANCE RESERVEInterest Maintenance Reserve
1Amount
1. Reserve as of December 31, prior year 1,354,070
2. Current year’s realized pre-tax capital gains/(losses) of $ (777,314) transferred into the Reserve Net of Taxes of
$ (272,060) (505,254)
3. Adjustment for current year's liability gains/(losses) released from the reserve
4. Balance before reduction for amount transferred to Summary of Operations (Line 1 + Line 2 + Line 3) 848,816
5. Current year's amortization released to Summary of Operations (Amortization, Line 1, Column 4) (116,426)
6. Reserve as of December 31, current year (Line 4 minus Line 5) 965,239
AMORTIZATION
Year of Amortization
1
Reserve as of December 31,
Prior Year
2
Current Year’s Realized Capital Gains/(Losses)
Transferred into the Reserve Net of Taxes
3
Adjustment for Current Year’s
Liability Gains/(Losses)
Released From the Reserve
4
Balance Before Reduction for Current Year’s Amortization
(Cols. 1+2+3)
1. 2008 (101,252) (15,174) (116,426)
2. 2009 (9,862) (22,336) (32,198)
3. 2010 (17,030) (15,554) (32,584)
4. 2011 16,965 (19,742) (2,777)
5. 2012 53,427 (23,717) 29,710
6. 2013 58,351 (28,449) 29,902
7. 2014 70,216 (29,084) 41,132
8. 2015 59,940 (26,027) 33,913
9. 2016 93,905 (22,401) 71,504
10. 2017 108,690 (18,710) 89,980
11. 2018 117,253 (14,758) 102,495
12. 2019 130,007 (14,109) 115,898
13. 2020 154,168 (16,534) 137,634
14. 2021 157,104 (20,030) 137,074
15. 2022 142,877 (22,899) 119,978
16. 2023 84,190 (26,111) 58,079
17. 2024 35,462 (25,992) 9,470
18. 2025 25,500 (22,460) 3,040
19. 2026 13,975 (18,826) (4,851)
20. 2027 7,828 (14,740) (6,912)
21. 2028 (2,147) (10,551) (12,698)
22. 2029 13,103 (8,405) 4,698
23. 2030 3,371 (9,106) (5,735)
24. 2031 11,209 (9,456) 1,753
25. 2032 10,074 (10,157) (83)
26. 2033 92,429 (10,857) 81,572
27. 2034 27,314 (10,157) 17,157
28. 2035 (1,896) (8,055) (9,951)
29. 2036 (1,164) (5,954) (7,118)
30. 2037 63 (3,677) (3,614)
31. 2038 and Later (1,226) (1,226)
32. Total (Lines 1 to 31) 1,354,070 (505,254) 848,816
28

ANNUAL STATEMENT FOR THE YEAR 2008 OF THE TEXAS LIFE INSURANCE COMPANY
ASSET VALUATION RESERVEDefault Component Equity Component
1Other Than Mortgage
Loans
2
Mortgage Loans
3Total
(Cols. 1+2)
4
Common Stock
5Real Estate and Other
Invested Assets
6Total
(Cols. 4+5)
7Total Amount(Cols. 3+6)
1. Reserve as of December 31, prior year 2,731,574 411,448 3,143,022 23,612 186,299 209,912 3,352,934
2. Realized capital gains/(losses) net of taxes - General Account (10,702,190) (204,097) (10,906,287) (11,952) (11,952) (10,918,239)
3. Realized capital gains/(losses) net of taxes - Separate Accounts
4. Unrealized capital gains/(losses) net of deferred taxes - General Account 2,646 400,775 403,421 (26,590) (26,590) 376,831
5. Unrealized capital gains/(losses) net of deferred taxes - Separate Accounts
6. Capital gains credited/(losses charged) to contract benefits, payments or reserves
7. Basic contribution 569,699 130,114 699,814 976 976 700,790
8. Accumulated balances (Lines 1 through 5 - 6 + 7) (7,398,271) 738,240 (6,660,030) (14,930) 187,276 172,346 (6,487,684)
9. Maximum reserve 2,815,578 386,277 3,201,855 15,692 131,197 146,889 3,348,744
10. Reserve objective 1,967,006 243,964 2,210,970 15,692 129,488 145,180 2,356,150
11. 20% of (Line 10 - Line 8) 1,873,055 (98,855) 1,774,200 6,124 (11,558) (5,433) 1,768,767
12. Balance before transfers (Lines 8 + 11) (5,525,215) 639,385 (4,885,830) (8,805) 175,718 166,913 (4,718,917)
13. Transfers 273,132 (253,108) 20,024 24,497 (44,521) (20,024) XXX
14. Voluntary contribution
15. Adjustment down to maximum/up to zero 5,252,080 5,252,080 5,252,080
16. Reserve as of December 31, current year (Lines 12 + 13 + 14 + 15) (3) 386,277 386,274 15,692 131,197 146,889 533,163
29
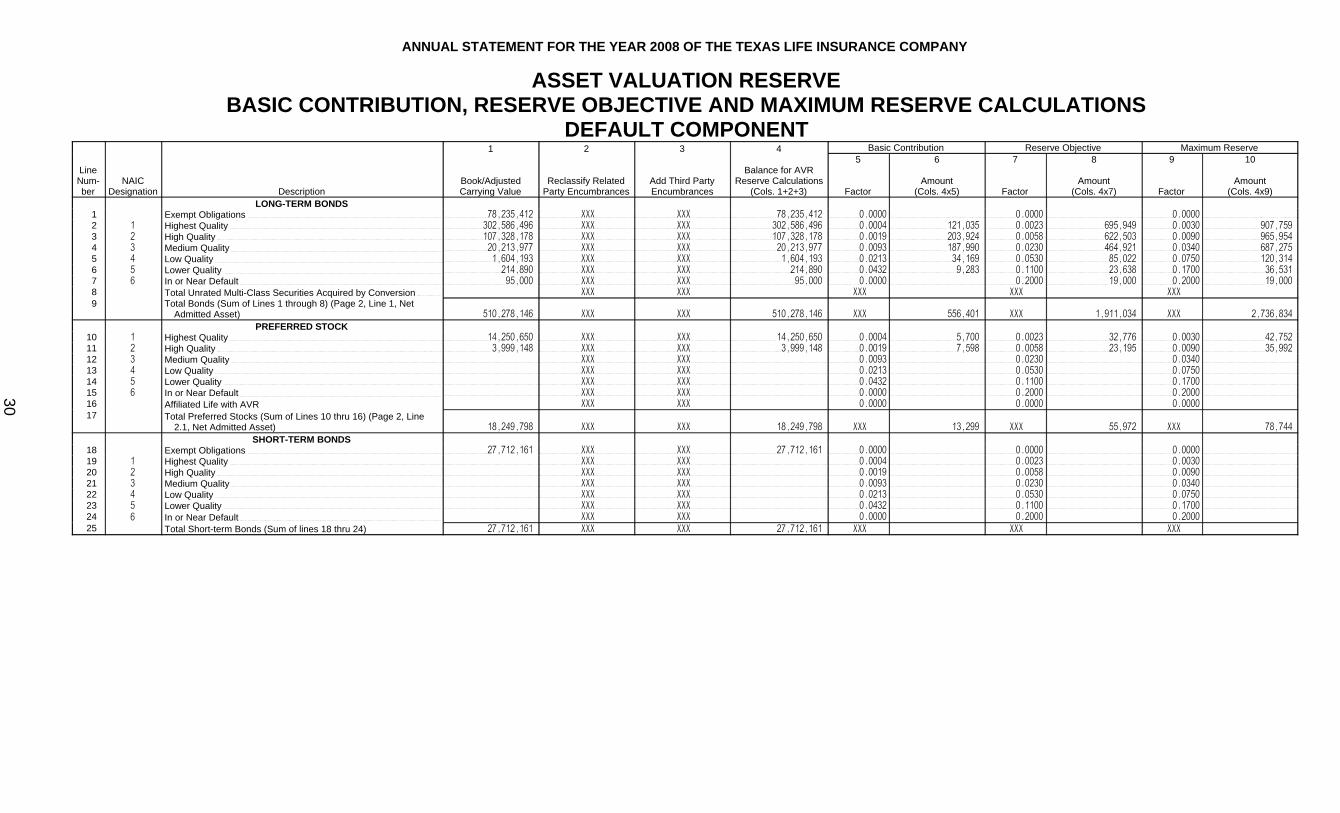
ANNUAL STATEMENT FOR THE YEAR 2008 OF THE TEXAS LIFE INSURANCE COMPANY
ASSET VALUATION RESERVEBASIC CONTRIBUTION, RESERVE OBJECTIVE AND MAXIMUM RESERVE CALCULATIONS
DEFAULT COMPONENT1 2 3 4 Basic Contribution Reserve Objective Maximum Reserve
Line Num-ber
NAIC Designation Description
Book/Adjusted Carrying Value
Reclassify Related Party Encumbrances
Add Third Party Encumbrances
Balance for AVR Reserve Calculations
(Cols. 1+2+3)
5
Factor
6
Amount(Cols. 4x5)
7
Factor
8
Amount(Cols. 4x7)
9
Factor
10
Amount(Cols. 4x9)
LONG-TERM BONDS1 Exempt Obligations 78,235,412 XXX XXX 78,235,412 0.0000 0.0000 0.00002 1 Highest Quality 302,586,496 XXX XXX 302,586,496 0.0004 121,035 0.0023 695,949 0.0030 907,759 3 2 High Quality 107,328,178 XXX XXX 107,328,178 0.0019 203,924 0.0058 622,503 0.0090 965,954 4 3 Medium Quality 20,213,977 XXX XXX 20,213,977 0.0093 187,990 0.0230 464,921 0.0340 687,275 5 4 Low Quality 1,604,193 XXX XXX 1,604,193 0.0213 34,169 0.0530 85,022 0.0750 120,314 6 5 Lower Quality 214,890 XXX XXX 214,890 0.0432 9,283 0.1100 23,638 0.1700 36,531 7 6 In or Near Default 95,000 XXX XXX 95,000 0.0000 0.2000 19,000 0.2000 19,000 8 Total Unrated Multi-Class Securities Acquired by Conversion XXX XXX XXX XXX XXX9 Total Bonds (Sum of Lines 1 through 8) (Page 2, Line 1, Net
Admitted Asset) 510,278,146 XXX XXX 510,278,146 XXX 556,401 XXX 1,911,034 XXX 2,736,834 PREFERRED STOCK
10 1 Highest Quality 14,250,650 XXX XXX 14,250,650 0.0004 5,700 0.0023 32,776 0.0030 42,752 11 2 High Quality 3,999,148 XXX XXX 3,999,148 0.0019 7,598 0.0058 23,195 0.0090 35,992 12 3 Medium Quality XXX XXX 0.0093 0.0230 0.034013 4 Low Quality XXX XXX 0.0213 0.0530 0.075014 5 Lower Quality XXX XXX 0.0432 0.1100 0.170015 6 In or Near Default XXX XXX 0.0000 0.2000 0.200016 Affiliated Life with AVR XXX XXX 0.0000 0.0000 0.000017 Total Preferred Stocks (Sum of Lines 10 thru 16) (Page 2, Line
2.1, Net Admitted Asset) 18,249,798 XXX XXX 18,249,798 XXX 13,299 XXX 55,972 XXX 78,744 SHORT-TERM BONDS
18 Exempt Obligations 27,712,161 XXX XXX 27,712,161 0.0000 0.0000 0.000019 1 Highest Quality XXX XXX 0.0004 0.0023 0.003020 2 High Quality XXX XXX 0.0019 0.0058 0.009021 3 Medium Quality XXX XXX 0.0093 0.0230 0.034022 4 Low Quality XXX XXX 0.0213 0.0530 0.075023 5 Lower Quality XXX XXX 0.0432 0.1100 0.170024 6 In or Near Default XXX XXX 0.0000 0.2000 0.200025 Total Short-term Bonds (Sum of lines 18 thru 24) 27,712,161 XXX XXX 27,712,161 XXX XXX XXX
30

ANNUAL STATEMENT FOR THE YEAR 2008 OF THE TEXAS LIFE INSURANCE COMPANY
ASSET VALUATION RESERVE (Continued)BASIC CONTRIBUTION, RESERVE OBJECTIVE AND MAXIMUM RESERVE CALCULATIONS
DEFAULT COMPONENT1 2 3 4 Basic Contribution Reserve Objective Maximum Reserve
Line Num-ber
NAIC Designation Description
Book/Adjusted Carrying Value
Reclassify Related Party Encumbrances
Add Third Party Encumbrances
Balance for AVR Reserve Calculations
(Cols. 1+2+3)
5
Factor
6
Amount(Cols. 4x5)
7
Factor
8
Amount(Cols. 4x7)
9
Factor
10
Amount(Cols. 4x9)
DERIVATIVE INSTRUMENTS26 Exchange Traded XXX XXX 0.0004 0.0023 0.003027 1 Highest Quality XXX XXX 0.0004 0.0023 0.003028 2 High Quality XXX XXX 0.0019 0.0058 0.009029 3 Medium Quality XXX XXX 0.0093 0.0230 0.034030 4 Low Quality XXX XXX 0.0213 0.0530 0.075031 5 Lower Quality XXX XXX 0.0432 0.1100 0.170032 6 In or Near Default XXX XXX 0.0000 0.2000 0.200033 Total Derivative Instruments XXX XXX XXX XXX XXX34 TOTAL (Line 9 + 17 + 25 + 33) 556,240,105 XXX XXX 556,240,105 XXX 569,699 XXX 1,967,006 XXX 2,815,578
MORTGAGE LOANSIn Good Standing:
35 Farm Mortgages 30,227,535 XXX 30,227,535 0.0032 (a) 96,728 0.0060 (a) 181,365 0.0095 (a) 287,162 36 Residential Mortgages - Insured or Guaranteed XXX 0.0003 0.0006 0.001037 Residential Mortgages - All Other XXX 0.0013 0.0030 0.004038 Commercial Mortgages - Insured or Guaranteed XXX 0.0003 0.0006 0.001039 Commercial Mortgages - All Other 10,433,167 XXX 10,433,167 0.0032 (a) 33,386 0.0060 (a) 62,599 0.0095 (a) 99,115 40 In Good Standing With Restructured Terms XXX 0.2800 (b) 0.6200 (b) 1.0000 (b)
Overdue, Not in Process:41 Farm Mortgages XXX 0.0420 0.0760 0.120042 Residential Mortgages - Insured of Guaranteed XXX 0.0005 0.0012 0.002043 Residential Mortgages - All Other XXX 0.0025 0.0058 0.009044 Commercial Mortgages - Insured or Guaranteed XXX 0.0005 0.0012 0.002045 Commercial Mortgages - All Other XXX 0.0420 0.0760 0.1200
In Process of Foreclosure:46 Farm Mortgages XXX 0.0000 0.1700 0.170047 Residential Mortgages - Insured or Guaranteed XXX 0.0000 0.0040 0.004048 Residential Mortgages - All Other XXX 0.0000 0.0130 0.013049 Commercial Mortgages - Insured or Guaranteed XXX 0.0000 0.0040 0.004050 Commercial Mortgages - All Other XXX 0.0000 0.1700 0.170051 Total Schedule B Mortgages (Sum of Lines 35 thru 50) (Page 2,
Line 3, Net Admitted Asset) 40,660,702 XXX 40,660,702 XXX 130,114 XXX 243,964 XXX 386,277 52 Total Schedule DA Mortgages XXX (c) (c) (c)
53 Total Mortgage Loans on Real Estate (Line 51 + 52) 40,660,702 XXX 40,660,702 XXX 130,114 XXX 243,964 XXX 386,277 (a) Times the Company’s Experience Adjustment Factor (EAF).(b) Column 9 is the greater of 6.4% without any EAF adjustments or a Company’s EAF adjusted In Good Standing (IGS) factor plus 150 basis points. Columns 5 and 7 are 28% and 62% respectively of Column 9.(c) Determined using the same factors and breakdowns used for directly owned mortgage loans.
31
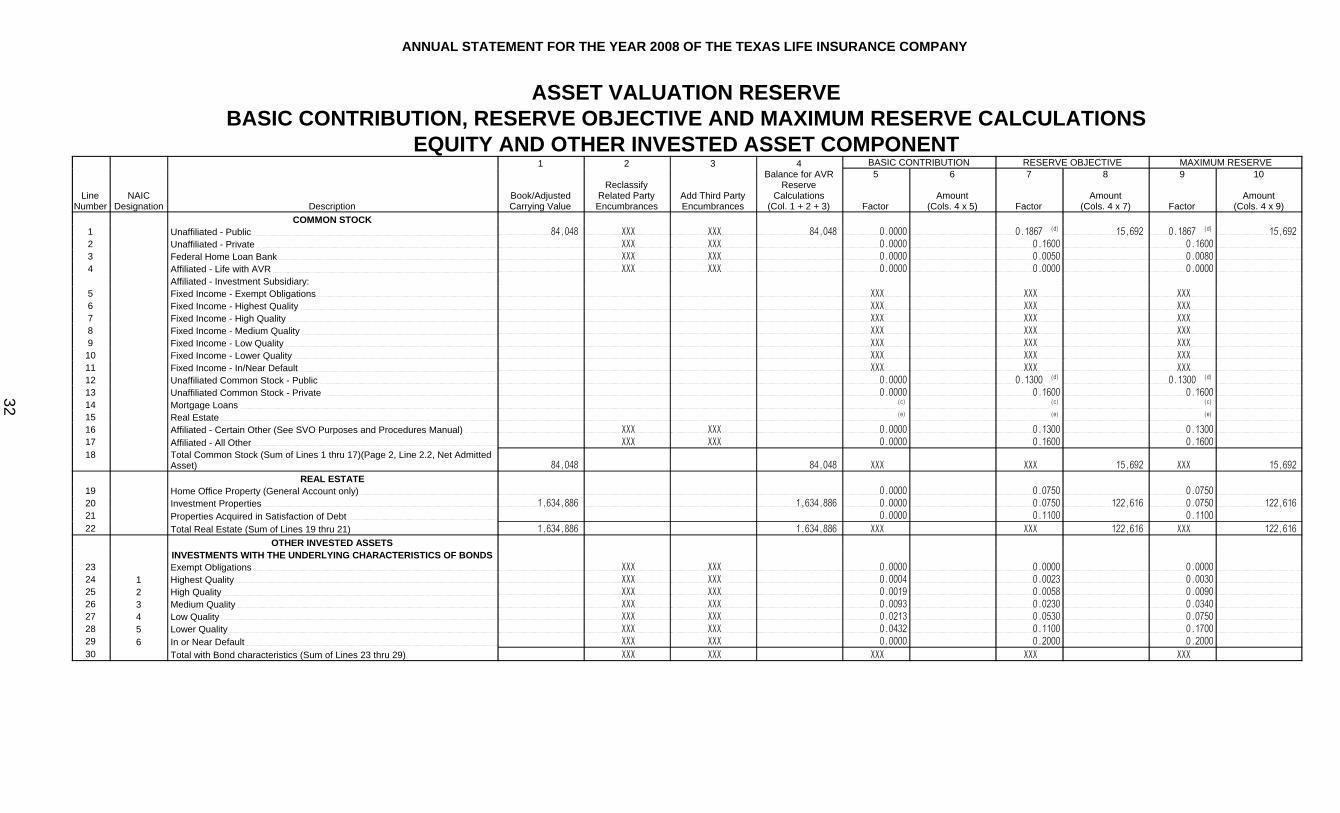
ANNUAL STATEMENT FOR THE YEAR 2008 OF THE TEXAS LIFE INSURANCE COMPANY
ASSET VALUATION RESERVEBASIC CONTRIBUTION, RESERVE OBJECTIVE AND MAXIMUM RESERVE CALCULATIONS
EQUITY AND OTHER INVESTED ASSET COMPONENT1 2 3 4 BASIC CONTRIBUTION RESERVE OBJECTIVE MAXIMUM RESERVE
Line Number
NAICDesignation Description
Book/Adjusted Carrying Value
ReclassifyRelated PartyEncumbrances
Add Third Party Encumbrances
Balance for AVR Reserve
Calculations(Col. 1 + 2 + 3)
5
Factor
6
Amount(Cols. 4 x 5)
7
Factor
8
Amount(Cols. 4 x 7)
9
Factor
10
Amount(Cols. 4 x 9)
COMMON STOCK1 Unaffiliated - Public 84,048 XXX XXX 84,048 0.0000 0.1867 (d) 15,692 0.1867 (d) 15,692 2 Unaffiliated - Private XXX XXX 0.0000 0.1600 0.16003 Federal Home Loan Bank XXX XXX 0.0000 0.0050 0.00804 Affiliated - Life with AVR XXX XXX 0.0000 0.0000 0.0000
Affiliated - Investment Subsidiary:5 Fixed Income - Exempt Obligations XXX XXX XXX6 Fixed Income - Highest Quality XXX XXX XXX7 Fixed Income - High Quality XXX XXX XXX8 Fixed Income - Medium Quality XXX XXX XXX9 Fixed Income - Low Quality XXX XXX XXX10 Fixed Income - Lower Quality XXX XXX XXX11 Fixed Income - In/Near Default XXX XXX XXX12 Unaffiliated Common Stock - Public 0.0000 0.1300 (d) 0.1300 (d)
13 Unaffiliated Common Stock - Private 0.0000 0.1600 0.160014 Mortgage Loans (c) (c) (c)
15 Real Estate (e) (e) (e)
16 Affiliated - Certain Other (See SVO Purposes and Procedures Manual) XXX XXX 0.0000 0.1300 0.130017 Affiliated - All Other XXX XXX 0.0000 0.1600 0.160018 Total Common Stock (Sum of Lines 1 thru 17)(Page 2, Line 2.2, Net Admitted
Asset) 84,048 84,048 XXX XXX 15,692 XXX 15,692
REAL ESTATE 19 Home Office Property (General Account only) 0.0000 0.0750 0.075020 Investment Properties 1,634,886 1,634,886 0.0000 0.0750 122,616 0.0750 122,616 21 Properties Acquired in Satisfaction of Debt 0.0000 0.1100 0.110022 Total Real Estate (Sum of Lines 19 thru 21) 1,634,886 1,634,886 XXX XXX 122,616 XXX 122,616
OTHER INVESTED ASSETSINVESTMENTS WITH THE UNDERLYING CHARACTERISTICS OF BONDS
23 Exempt Obligations XXX XXX 0.0000 0.0000 0.000024 1 Highest Quality XXX XXX 0.0004 0.0023 0.003025 2 High Quality XXX XXX 0.0019 0.0058 0.009026 3 Medium Quality XXX XXX 0.0093 0.0230 0.034027 4 Low Quality XXX XXX 0.0213 0.0530 0.075028 5 Lower Quality XXX XXX 0.0432 0.1100 0.170029 6 In or Near Default XXX XXX 0.0000 0.2000 0.200030 Total with Bond characteristics (Sum of Lines 23 thru 29) XXX XXX XXX XXX XXX
32
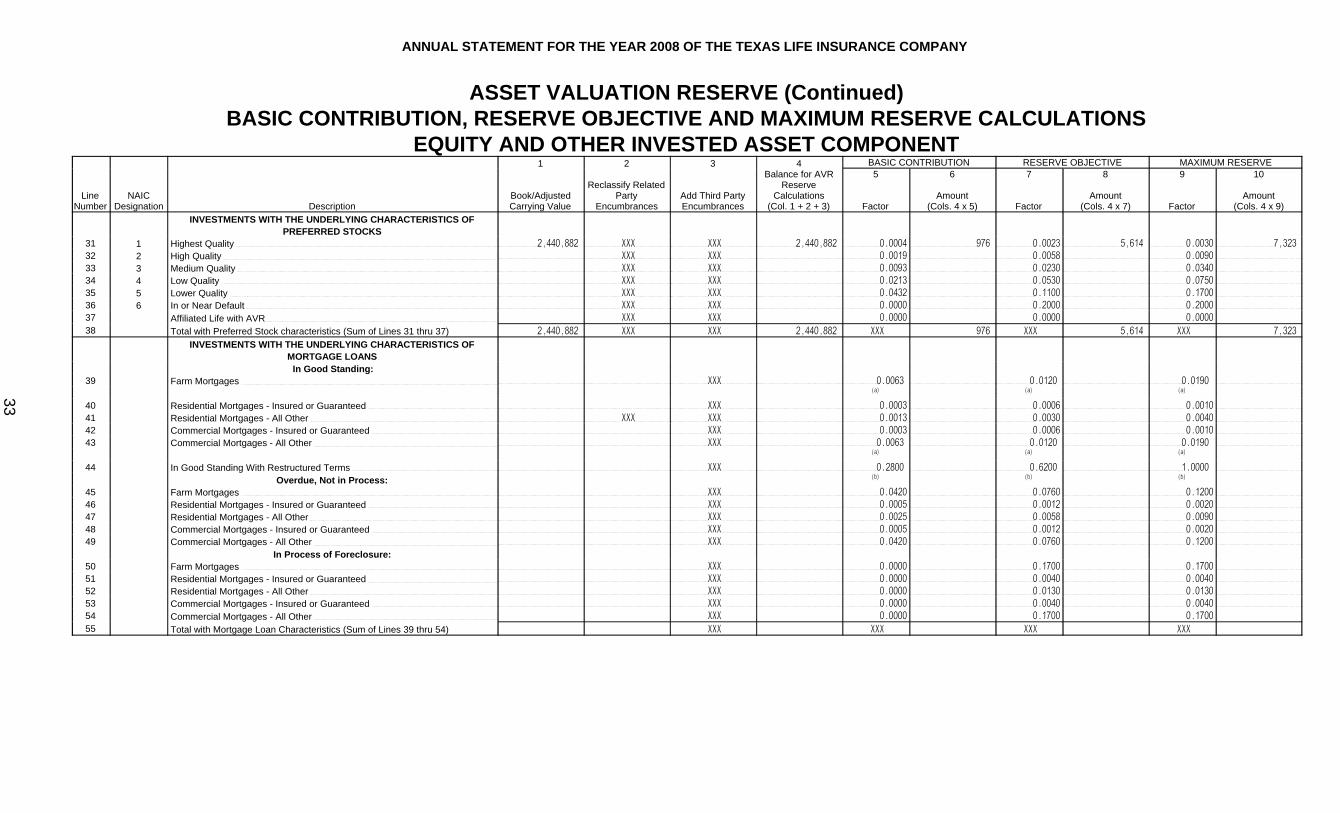
ANNUAL STATEMENT FOR THE YEAR 2008 OF THE TEXAS LIFE INSURANCE COMPANY
ASSET VALUATION RESERVE (Continued)BASIC CONTRIBUTION, RESERVE OBJECTIVE AND MAXIMUM RESERVE CALCULATIONS
EQUITY AND OTHER INVESTED ASSET COMPONENT1 2 3 4 BASIC CONTRIBUTION RESERVE OBJECTIVE MAXIMUM RESERVE
Line Number
NAICDesignation Description
Book/Adjusted Carrying Value
Reclassify Related Party
EncumbrancesAdd Third Party Encumbrances
Balance for AVR Reserve
Calculations(Col. 1 + 2 + 3)
5
Factor
6
Amount(Cols. 4 x 5)
7
Factor
8
Amount(Cols. 4 x 7)
9
Factor
10
Amount(Cols. 4 x 9)
INVESTMENTS WITH THE UNDERLYING CHARACTERISTICS OFPREFERRED STOCKS
31 1 Highest Quality 2,440,882 XXX XXX 2,440,882 0.0004 976 0.0023 5,614 0.0030 7,323 32 2 High Quality XXX XXX 0.0019 0.0058 0.009033 3 Medium Quality XXX XXX 0.0093 0.0230 0.034034 4 Low Quality XXX XXX 0.0213 0.0530 0.075035 5 Lower Quality XXX XXX 0.0432 0.1100 0.170036 6 In or Near Default XXX XXX 0.0000 0.2000 0.200037 Affiliated Life with AVR XXX XXX 0.0000 0.0000 0.000038 Total with Preferred Stock characteristics (Sum of Lines 31 thru 37) 2,440,882 XXX XXX 2,440,882 XXX 976 XXX 5,614 XXX 7,323
INVESTMENTS WITH THE UNDERLYING CHARACTERISTICS OFMORTGAGE LOANS
In Good Standing:39 Farm Mortgages XXX 0.0063 0.0120 0.0190
(a) (a) (a)
40 Residential Mortgages - Insured or Guaranteed XXX 0.0003 0.0006 0.001041 Residential Mortgages - All Other XXX XXX 0.0013 0.0030 0.004042 Commercial Mortgages - Insured or Guaranteed XXX 0.0003 0.0006 0.001043 Commercial Mortgages - All Other XXX 0.0063 0.0120 0.0190
(a) (a) (a)
44 In Good Standing With Restructured Terms XXX 0.2800 0.6200 1.0000 Overdue, Not in Process: (b) (b) (b)
45 Farm Mortgages XXX 0.0420 0.0760 0.120046 Residential Mortgages - Insured or Guaranteed XXX 0.0005 0.0012 0.002047 Residential Mortgages - All Other XXX 0.0025 0.0058 0.009048 Commercial Mortgages - Insured or Guaranteed XXX 0.0005 0.0012 0.002049 Commercial Mortgages - All Other XXX 0.0420 0.0760 0.1200
In Process of Foreclosure:50 Farm Mortgages XXX 0.0000 0.1700 0.170051 Residential Mortgages - Insured or Guaranteed XXX 0.0000 0.0040 0.004052 Residential Mortgages - All Other XXX 0.0000 0.0130 0.013053 Commercial Mortgages - Insured or Guaranteed XXX 0.0000 0.0040 0.004054 Commercial Mortgages - All Other XXX 0.0000 0.1700 0.170055 Total with Mortgage Loan Characteristics (Sum of Lines 39 thru 54) XXX XXX XXX XXX
33

ANNUAL STATEMENT FOR THE YEAR 2008 OF THE TEXAS LIFE INSURANCE COMPANY
ASSET VALUATION RESERVE (Continued)BASIC CONTRIBUTION, RESERVE OBJECTIVE AND MAXIMUM RESERVE CALCULATIONS
EQUITY AND OTHER INVESTED ASSET COMPONENT1 2 3 4 BASIC CONTRIBUTION RESERVE OBJECTIVE MAXIMUM RESERVE
Line Number
NAICDesignation Description
Book/Adjusted Carrying Value
Reclassify Related Party
EncumbrancesAdd Third Party Encumbrances
Balance for AVR Reserve
Calculations(Col. 1 + 2 + 3)
5
Factor
6
Amount(Cols. 4 x 5)
7
Factor
8
Amount(Cols. 4 x 7)
9
Factor
10
Amount(Cols. 4 x 9)
INVESTMENTS WITH THE UNDERLYING CHARACTERISTICS OFCOMMON STOCKS
56 Unaffiliated Public XXX XXX 0.0000 0.1300 (d) 0.1300 (d)
57 Unaffiliated Private XXX XXX 0.0000 0.1600 0.160058 Affiliated Life with AVR XXX XXX 0.0000 0.0000 0.000059 Affiliated Certain Other (See SVO Purposes & Procedures Manual) XXX XXX 0.0000 0.1300 0.130060 Affiliated Other - All Other XXX XXX 0.0000 0.1600 0.160061 Total with Common Stock characteristics (Sum of Lines 56 thru 60) XXX XXX XXX XXX XXX
INVESTMENTS WITH THE UNDERLYING CHARACTERISTICS OFREAL ESTATE
62 Home Office Property (General Account only) 0.0000 0.0750 0.075063 Investment Properties 0.0000 0.0750 0.075064 Properties Acquired in Satisfaction of Debt 0.0000 0.1100 0.110065 Total with Real Estate Characteristics (Lines 62 thru 64) XXX XXX XXX
LOW INCOME HOUSING TAX CREDIT INVESTMENTS66 Guaranteed Federal Low Income Housing Tax Credit 0.0003 0.0006 0.001067 Non-guaranteed Federal Low Income Housing Tax Credit 0.0063 0.0120 0.019068 State Low Income Housing Tax Credit 0.0273 0.0600 0.097569 All Other Low Income Housing Tax Credit 0.0273 0.0600 0.097570 Total LIHTC XXX XXX XXX
ALL OTHER INVESTMENTS71 Other Invested Assets - Schedule BA 9,675 XXX 9,675 0.0000 0.1300 1,258 0.1300 1,258 72 Other Short Term Invested Assets - Schedule DA XXX 0.0000 0.1300 0.130073 Total All Other (Sum of Lines 71 + 72) 9,675 XXX 9,675 XXX XXX 1,258 XXX 1,258 74 Total Other Invested Assets - Schedules BA & DA (Sum of Lines 30, 38, 55,
61, 65, 70 and 73) 2,450,557 2,450,557 XXX 976 XXX 6,872 XXX 8,580 (a) Times the Company’s Experience Adjustment Factor (EAF).(b) Column 9 is the greater of 6.4% without any EAF adjustments or a Company’s EAF adjusted In Good Standing (IGS) factor plus 150 basis points. Columns 5 and 7 are 28% and 62% respectively of Column 9.(c) Determined using the same factors and breakdowns used for directly owned mortgage loans.(d) Times the company’s weighted average portfolio beta (Minimum .10, Maximum .20).(e) Determined using same factors and breakdowns used for directly owned real estate.
34
ANNUAL STATEMENT FOR THE YEAR 2008 OF THE TEXAS LIFE INSURANCE COMPANY
Asset Valuation Reserve (Continued)Basic Contribution, Reserve Objective and Maximum Reserve Calculations Replications (Synthetic) Assets
1
RSAT Number
2
Type
3
CUSIP
4
Description of Asset(s)
5NAIC Designation or
Other Description of Asset
6
Value of Asset
7AVR
Basic Contribution
8AVR
Reserve Objective
9AVR
Maximum Reserve
0599999 - Totals
35
NONE

ANNUAL STATEMENT FOR THE YEAR 2008 OF THE TEXAS LIFE INSURANCE COMPANY
SCHEDULE FShowing all claims for death losses and all other contract claims resisted or compromised during the year, and
all claims for death losses and all other contract claims resisted December 31 of current year1
Contract Numbers
2
Claim Numbers
3State of
Residenceof
Claimant
4Year
of Claimfor Death or
Disability
5
Amount Claimed
6
Amount Paid During the Year
7
Amount ResistedDec. 31 of Current
Year
8
Why Compromised or Resisted001400057 26268B AL 2008 25,000 167 24,833 Misrepresentation001408960 28409B AL 2008 25,000 13 24,987 Suicide001434978 29342B AL 2008 30,000 630 29,370 Misrepresentation001405543 28567B AR 2008 50,000 1,079 48,921 Misrepresentation001258479 28865B AR 2008 10,000 945 9,055 Misrepresentation001335233 28089B CA 2008 25,000 643 24,357 Suicide001423515 28483B CA 2008 15,000 35 14,965 Misrepresentation001313335 28947B CA 2008 20,000 746 19,254 Misrepresentation001394786 29103B CA 2008 25,000 616 24,384 Misrepresentation001317347 29228B CA 2008 100,000 1,212 98,788 Misrepresentation001459717 28795B FL 2008 25,000 142 24,858 Misrepresentation001374711 28896B FL 2008 25,000 114 24,886 Misrepresentation001465988 29266B FL 2008 100,000 111 99,889 Misrepresentation001213941 25974B GA 2008 25,000 779 24,221 Misrepresentation001253901 28544B IN 2008 20,000 20,000 Misrepresentation001339635 28749B IN 2008 10,000 277 9,723 Misrepresentation001301628 27909B LA 2008 14,336 339 13,997 Misrepresentation001356016 27972B LA 2008 10,000 254 9,746 Misrepresentation001419453 28524B LA 2008 10,000 19 9,981 Misrepresentation001436153 19139B LA 2008 25,000 63 24,937 Suicide001424674 29191B LA 2008 50,000 221 49,779 Suicide001229842 28209B MD 2008 30,000 922 29,078 Misrepresentation001326303 28347B MD 2008 25,000 654 24,346 Misrepresentation000974465 27030B MS 2008 25,000 419 24,581 Suicide001386796 28038B OK 2008 20,000 20,000 Misrepresentation001268889 28008B TX 2008 25,000 302 24,698 Misrepresentation001347922 28369B TX 2008 50,000 550 49,450 Misrepresentation001399046 28398B TX 2008 10,000 109 9,891 Misrepresentation001397037 28585B TX 2008 15,000 126 14,874 Misrepresentation001414897 28980B TX 2008 75,000 1,071 73,929 Misrepresentation001396766 28686B VA 2008 100,000 208 99,792 Misrepresentation0199999 - Disposed of: Death Claims - Ordinary 1,014,336 12,766 1,001,570 XXX0599999 - Death Claims - Disposed Of 1,014,336 12,766 1,001,570 XXX2699999 - Claims Disposed of During Current Year 1,014,336 12,766 1,001,570 XXX
5399999 Totals 1,014,336 12,766 1,001,570 XXX
36
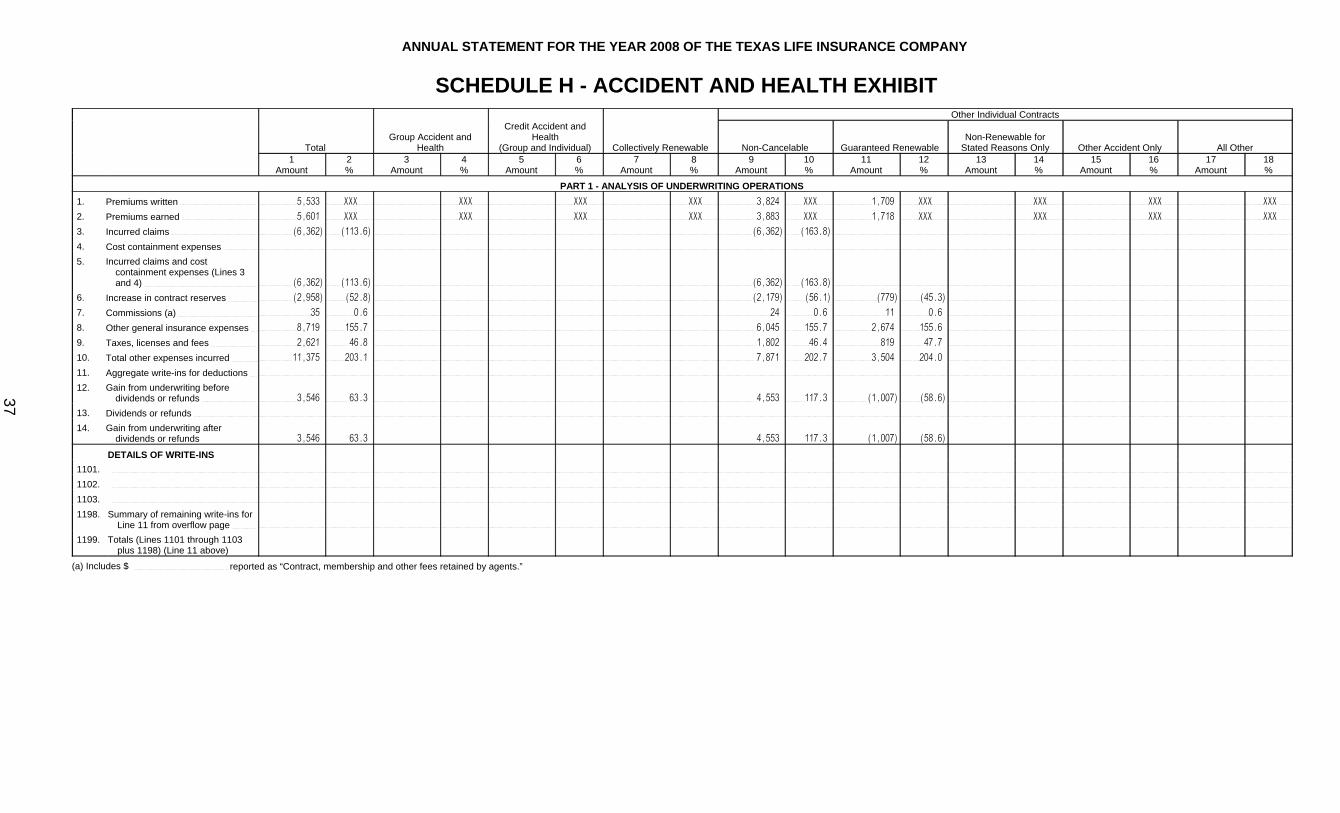
ANNUAL STATEMENT FOR THE YEAR 2008 OF THE TEXAS LIFE INSURANCE COMPANY
SCHEDULE H - ACCIDENT AND HEALTH EXHIBITOther Individual Contracts
TotalGroup Accident and
Health
Credit Accident andHealth
(Group and Individual) Collectively Renewable Non-Cancelable Guaranteed RenewableNon-Renewable for
Stated Reasons Only Other Accident Only All Other1
Amount2%
3Amount
4%
5Amount
6%
7Amount
8%
9Amount
10%
11Amount
12%
13Amount
14%
15Amount
16%
17Amount
18%
PART 1 - ANALYSIS OF UNDERWRITING OPERATIONS1. Premiums written 5,533 XXX XXX XXX XXX 3,824 XXX 1,709 XXX XXX XXX XXX
2. Premiums earned 5,601 XXX XXX XXX XXX 3,883 XXX 1,718 XXX XXX XXX XXX
3. Incurred claims (6,362) (113.6) (6,362) (163.8)
4. Cost containment expenses 5. Incurred claims and cost
containment expenses (Lines 3 and 4) (6,362) (113.6) (6,362) (163.8)
6. Increase in contract reserves (2,958) (52.8) (2,179) (56.1) (779) (45.3)
7. Commissions (a) 35 0.6 24 0.6 11 0.6
8. Other general insurance expenses 8,719 155.7 6,045 155.7 2,674 155.6
9. Taxes, licenses and fees 2,621 46.8 1,802 46.4 819 47.7
10. Total other expenses incurred 11,375 203.1 7,871 202.7 3,504 204.0
11. Aggregate write-ins for deductions 12. Gain from underwriting before
dividends or refunds 3,546 63.3 4,553 117.3 (1,007) (58.6)
13. Dividends or refunds 14. Gain from underwriting after
dividends or refunds 3,546 63.3 4,553 117.3 (1,007) (58.6)
DETAILS OF WRITE-INS1101.
1102.
1103.
1198. Summary of remaining write-ins for Line 11 from overflow page
1199. Totals (Lines 1101 through 1103 plus 1198) (Line 11 above)
(a) Includes $ reported as “Contract, membership and other fees retained by agents.”
37

ANNUAL STATEMENT FOR THE YEAR 2008 OF THE TEXAS LIFE INSURANCE COMPANY
SCHEDULE H - ACCIDENT AND HEALTH EXHIBIT (Continued)1 2 3 4 Other Individual Contracts
TotalGroup Accident and
Health
Credit Accident and Health
(Group and Individual)CollectivelyRenewable
5
Non-Cancelable
6
Guaranteed Renewable
7
Non-Renewable forStated Reasons Only
8
Other Accident Only
9
All OtherPART 2 - RESERVES AND LIABILITIES
A. Premium Reserves:1. Unearned premiums 666 437 229 2. Advance premiums 3. Reserve for rate credits 4. Total premium reserves, current year 666 437 229 5. Total premium reserves, prior year 734 496 238 6. Increase in total premium reserves (68) (59) (9)B. Contract Reserves:1. Additional reserves (a) 23,623 13,922 9,701 2. Reserve for future contingent benefits 3. Total contract reserves, current year 23,623 13,922 9,701 4. Total contract reserves, prior year. 26,581 16,101 10,480 5. Increase in contract reserves (2,958) (2,179) (779)C. Claim Reserves and Liabilities:1. Total current year 10,589 10,589 2. Total prior year 22,151 22,151 3. Increase (11,562) (11,562)
PART 3 - TEST OF PRIOR YEAR'S CLAIM RESERVES AND LIABILITIES1. Claims paid during the year:
1.1 On claims incurred prior to current year 5,200 5,200 1.2 On claims incurred during current year
2. Claim reserves and liabilities, December 31, current year:2.1 On claims incurred prior to current year 8,589 8,589 2.2 On claims incurred during current year 2,000 2,000
3. Test:3.1 Line 1.1 and 2.1 13,789 13,789 3.2 Claim reserves and liabilities, December 31, prior year 22,151 22,151 3.3 Line 3.1 minus Line 3.2 (8,362) (8,362)
PART 4 - REINSURANCEA. Reinsurance Assumed:1. Premiums written 2. Premiums earned 3. Incurred claims 4. Commissions B. Reinsurance Ceded:1. Premiums written 2. Premiums earned 3. Incurred claims 4. Commissions
(a) Includes $ premium deficiency reserve
38
NONE

ANNUAL STATEMENT FOR THE YEAR 2008 OF THE TEXAS LIFE INSURANCE COMPANY
SCHEDULE H - PART 5 - HEALTH CLAIMS1
Medical2
Dental3
Other4
Total
A. Direct:
1. Incurred Claims (6,362) (6,362)
2. Beginning claim reserves and liabilities 22,151 22,151
3. Ending claim reserves and liabilities 10,589 10,589
4. Claims paid 5,200 5,200
B. Assumed Reinsurance:
5. Incurred Claims
6. Beginning claim reserves and liabilities
7. Ending claim reserves and liabilities
8. Claims paid
C. Ceded Reinsurance:
9. Incurred Claims
10. Beginning claim reserves and liabilities
11. Ending claim reserves and liabilities
12. Claims paid
D. Net:
13. Incurred Claims (6,362) (6,362)
14. Beginning claim reserves and liabilities 22,151 22,151
15. Ending claim reserves and liabilities 10,589 10,589
16. Claims paid 5,200 5,200
E. Net Incurred Claims and Containment Expenses:
17. Incurred claims and containment expenses (6,362) (6,362)
18. Beginning reserves and liabilities 22,151 22,151
19. Ending reserves and liabilities 10,589 10,589
20. Paid claims and cost containment expenses 5,200 5,200
39

ANNUAL STATEMENT FOR THE YEAR 2008 OF THE TEXAS LIFE INSURANCE COMPANY
Schedule S - Part 1 - Section 1
NONESchedule S - Part 1 - Section 2
NONE
40, 41
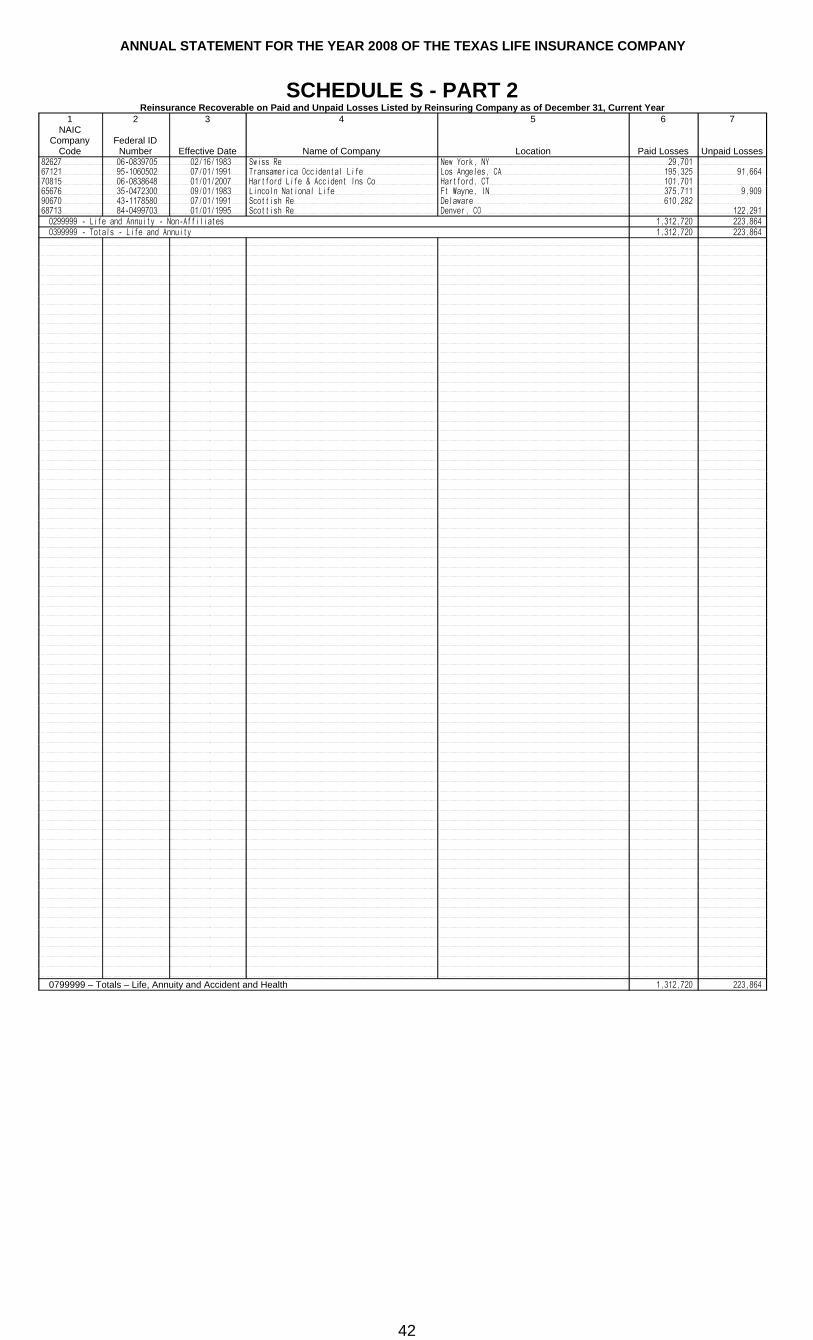
ANNUAL STATEMENT FOR THE YEAR 2008 OF THE TEXAS LIFE INSURANCE COMPANY
SCHEDULE S - PART 2Reinsurance Recoverable on Paid and Unpaid Losses Listed by Reinsuring Company as of December 31, Current Year
1NAIC
Company Code
2
Federal ID Number
3
Effective Date
4
Name of Company
5
Location
6
Paid Losses
7
Unpaid Losses82627 06-0839705 02/16/1983 Swiss Re New York, NY 29,701 67121 95-1060502 07/01/1991 Transamerica Occidental Life Los Angeles, CA 195,325 91,664 70815 06-0838648 01/01/2007 Hartford Life & Accident Ins Co Hartford, CT 101,701 65676 35-0472300 09/01/1983 Lincoln National Life Ft Wayne, IN 375,711 9,909 90670 43-1178580 07/01/1991 Scottish Re Delaware 610,282 68713 84-0499703 01/01/1995 Scottish Re Denver, CO 122,291 0299999 - Life and Annuity - Non-Affiliates 1,312,720 223,864 0399999 - Totals - Life and Annuity 1,312,720 223,864
0799999 – Totals – Life, Annuity and Accident and Health 1,312,720 223,864
42

ANNUAL STATEMENT FOR THE YEAR 2008 OF THE TEXAS LIFE INSURANCE COMPANY
SCHEDULE S - PART 3 - SECTION 1Reinsurance Ceded Life Insurance, Annuities, Deposit Funds and Other Liabilities without Life or Disability Contingencies, and Related Benefits Listed by Reinsuring Company as of December 31, Current Year
1 2 3 4 5 6 7 Reserve Credit Taken 10 Outstanding Surplus Relief 13 14
NAIC Company
CodeFederal ID
NumberEffective
Date Name of Company Location
Type of Re-
insurance Ceded
Amount in Force at End of Year
8
Current Year
9
Previous Year Premiums
11
Current Year
12
Prior Year
Modified Coinsurance
Reserve
Funds Withheld Under
Coinsurance65978 13-5581829 01/01/2002 Metropolitan Life Insurance Company New York, NY OTH/I 14,712,547 12,017,806 93572 43-1235868 07/01/1991 RGA Reinsurance St Louis, MO YRT/I 461,978 48,411 93572 43-1235868 07/01/1995 RGA Reinsurance St Louis, MO YRT/I 1,500 238 93572 43-1235868 06/01/1983 RGA Reinsurance St Louis, MO YRT/I 175 49 0199999 - Total Authorized General Account – Affiliates 14,712,547 12,481,459 48,698
68276 48-1024691 09/01/1945 ERAC KS YRT/I68276 48-1024691 03/01/1992 ERAC KS YRT/I 3,850,958 32,015 29,599 35,859 97071 13-3126819 10/01/1979 Generali USA Kansas City, MO YRT/I 67,287 6,661 6,418 9,147 62413 36-0947200 01/01/1988 Continental Assurance Chicago, IL YRT/I 3,889,651 67,096 63,491 82,371 62413 36-0947200 01/01/1988 Continental Assurance Chicago, IL YRT/I 3,230,808 8,641 8,541 41,688 82627 06-0839705 12/01/1982 Swiss Re Greenwich, CT YRT/I 1,382,359 3,500 3,372 45,974 82627 06-0839705 09/01/1983 Swiss Re Greenwich, CT YRT/I82627 06-0839705 03/31/1976 Swiss Re Greenwich, CT YRT/I 60,849 720 3,735 1,843 65676 35-0472300 09/01/1983 Lincoln National Life Ft Wayne, IN YRT/I 250,000 1,075 985 5,078 65676 35-0472300 09/17/1984 Lincoln National Life Ft Wayne, IN YRT/I 13,034,511 164,347 158,869 232,985 65676 35-0472300 07/01/1991 Lincoln National Life Ft Wayne, IN YRT/I 60,000 342 317 315 65676 35-0472300 07/01/1991 Lincoln National Life Ft Wayne, IN YRT/I 277,879 10,387 9,848 9,021 65676 35-0472300 04/01/1982 Lincoln National Life Ft Wayne, IN YRT/I 2,937,877 8,520 7,934 72,788 65676 35-0472300 10/29/1963 Lincoln National Life Ft Wayne, IN YRT/I 509,026 11,901 16,212 16,397 65676 35-0472300 09/01/1978 Lincoln National Life Ft Wayne, IN YRT/I 20,000 75 68 96 65676 35-0472300 10/01/1987 Lincoln National Life Ft Wayne, IN YRT/I 700,000 8,740 9,612 14,377 82627 06-0839705 04/01/1977 Swiss Re Toronto, Ontario, CN YRT/I 674,059 27,645 26,533 43,752 90611 41-1366075 01/01/1985 Allianz Minneapolis, MN YRT/I82627 06-0839705 02/16/1983 Swiss Re New York, NY YRT/I 1,325,674 1,860 1,948 19,645 82627 06-0839705 11/21/1962 Swiss Re New York, NY YRT/I 177,261 2,144 2,019 8,796 88340 59-2859797 01/01/2002 Hannover Life Reassurance Co of America Orlando, FL ADB/I90670 43-1178580 07/01/1991 Scottish Re DE YRT/I 18,548,330 51,378 55,981 204,046 90670 43-1178580 07/01/1991 Scottish Re DE YRT/I 7,927,558 8,812 9,776 89,894 90670 43-1178580 12/01/1993 Scottish Re Delaware YRT/I 50,000 78 71 443 88099 75-1608507 10/01/1980 Optimum Reassurance Dallas, TX YRT/I 27,835 262 135 199 88099 75-1608507 06/01/1990 Optimum Reassurance Dallas, TX YRT/I 482,464 4,581 4,262 3,140 88099 75-1608507 04/15/1985 Optimum Reassurance Dallas, TX YRT/I 4,009,951 26,254 23,978 60,038 88099 75-1608507 11/01/1990 Optimum Reassurance Dallas, TX ADB/I 18,711 21,265 23,726 67121 95-1060502 07/01/1991 Transamerica Occidental Life Los Angeles, CA YRT/I 58,115,300 552,334 547,062 744,818 67121 95-1060502 01/01/1995 Transamerica Occidental Life Los Angeles, CA YRT/I 11,884,750 4,640 3,914 29,319 67121 95-1060502 06/01/1980 Transamerica Occidental Life Los Angeles, CA YRT/I67121 95-1060502 01/01/1997 Transamerica Occidental Life Los Angeles, CA ADB/I68713 84-0499703 01/01/1995 Scottish Re Denver, CO YRT/I 6,208,666 1,893 1,598 13,847 68713 84-0499703 01/01/1992 Scottish Re Denver, CO YRT/I 30,504,467 89,183 93,159 162,133 70815 06-0838648 01/01/2007 Hartford Life & Accident Ins Co Hartford, CT ADB/I 246,956 1,770,057 93572 43-1235868 07/01/1991 RGA Reinsurance St Louis, MO YRT/I 55,036,512 497,649 747,175 93572 43-1235868 07/01/1995 RGA Reinsurance St Louis, MO YRT/I 4,130,007 1,787 16,299 93572 43-1235868 06/01/1983 RGA Reinsurance St Louis, MO YRT/I 228,371 199 124 0299999 - Total Authorized General Account – Non-Affiliates 229,602,410 1,613,430 1,357,658 4,505,390 0399999 - Total Authorized General Account 229,602,410 16,325,977 13,839,117 4,554,088 0799999 - Total Authorized and Unauthorized General Account 229,602,410 16,325,977 13,839,117 4,554,088 1599999 Totals 229,602,410 16,325,977 13,839,117 4,554,088
43
ANNUAL STATEMENT FOR THE YEAR 2008 OF THE TEXAS LIFE INSURANCE COMPANY
Schedule S - Part 3 - Section 2
NONESchedule S - Part 4
NONE
44, 45

ANNUAL STATEMENT FOR THE YEAR 2008 OF THE TEXAS LIFE INSURANCE COMPANY
SCHEDULE S - PART 5Five Year Exhibit of Reinsurance Ceded Business (000 Omitted)
12008
22007
32006
42005
52004
A. OPERATIONS ITEMS
1. Premiums and annuity considerations for life and accident and health contracts 4,554 4,343 4,779 4,261 3,970
2. Commissions and reinsurance expense allowances
3. Contract claims 3,682 5,127 44,099 58,389 53,964
4. Surrender benefits and withdrawals for life contracts
5. Dividends to policyholders
6. Reserve adjustments on reinsurance ceded
7. Increase in aggregate reserve for life and accident and health contracts 2,487 236 (738,934) (833) 1,900
B. BALANCE SHEET ITEMS
8. Premiums and annuity considerations for life and accident and health contracts deferred and uncollected 725 11 287 23 298
9. Aggregate reserves for life and accident and health contracts 16,326 1,821 1,585 740,512 741,345
10. Liability for deposit-type contracts
11. Contract claims unpaid 224 200 757 199 358
12. Amounts recoverable on reinsurance 1,313 948 152 1,729 650
13. Experience rating refunds due or unpaid 393 1,014 901 1,729 775
14. Policyholders' dividends (not included in Line 10)
15. Commissions and reinsurance expense allowances unpaid
16. Unauthorized reinsurance offset
C. UNAUTHORIZED REINSURANCE (DEPOSITS BY AND FUNDS WITHHELD FROM)
17. Funds deposited by and withheld from (F)
18. Letters of credit (L)
19. Trust agreements (T)
20. Other (O)
46

ANNUAL STATEMENT FOR THE YEAR 2008 OF THE TEXAS LIFE INSURANCE COMPANY
SCHEDULE S - PART 6Restatement of Balance Sheet to Identify Net Credit For Ceded Reinsurance
1As Reported
(net of ceded)
2Restatement Adjustments
3Restated
(gross of ceded)
ASSETS (Page 2, Col. 3)
1. Cash and invested assets (Line 10) 640,336,242 640,336,242
2. Reinsurance (Line 14) 1,779,585 (1,779,585)
3. Premiums and considerations (Line 13) 6,866,904 724,791 7,591,695
4. Net credit for ceded reinsurance XXX 2,892,087 2,892,087
5. All other admitted assets (balance) 16,015,461 16,015,461
6. Total assets excluding Separate Accounts (Line 24) 664,998,192 1,837,293 666,835,485
7. Separate Account assets (Line 25)
8. Total assets (Line 26) 664,998,192 1,837,293 666,835,485
LIABILITIES, CAPITAL AND SURPLUS (PAGE 3)
9. Contract reserves (Lines 1 and 2) 586,276,195 1,613,429 587,889,624
10. Liability for deposit-type contracts (Line 3) 3,010,457 3,010,457
11. Claim reserves (Line 4) 9,373,274 223,864 9,597,138
12. Policyholder dividends/reserves (Lines 5 through 7) 4,184,930 4,184,930
13. Premium & annuity considerations received in advance (Line 8) 36,271 36,271
14. Other contract liabilities (Line 9) 965,239 965,239
15. Reinsurance in unauthorized companies (Line 24.2)
16. Funds held under reinsurance treaties with unauthorized reinsurers (Line 24.3)
17. All other liabilities (balance) 13,188,793 13,188,793
18. Total liabilities excluding Separate Accounts (Line 26) 617,035,159 1,837,293 618,872,452
19. Separate Account liabilities (Line 27)
20. Total liabilities (Line 28) 617,035,159 1,837,293 618,872,452
21. Capital & surplus (Line 38) 47,963,033 XXX 47,963,033
22. Total liabilities, capital & surplus (Line 39) 664,998,192 1,837,293 666,835,485
NET CREDIT FOR CEDED REINSURANCE
23. Contract reserves 1,613,429
24. Claim reserves 223,864
25. Policyholder dividends/reserves
26. Premium and annuity considerations received in advance
27. Liability for deposit-type contracts
28. Other contract liabilities
29. Reinsurance ceded assets 1,779,585
30. Other ceded reinsurance recoverables
31. Total ceded reinsurance recoverables 3,616,878
32. Premiums and considerations 724,791
33. Reinsurance in unauthorized companies
34. Funds held under reinsurance treaties with unauthorized reinsurers
35. Other ceded reinsurance payables/offsets
36. Total ceded reinsurance payable/offsets 724,791
37. Total net credit for ceded reinsurance 2,892,087
47

ANNUAL STATEMENT FOR THE YEAR 2008 OF THE TEXAS LIFE INSURANCE COMPANY
SCHEDULE T—PREMIUMS AND ANNUITY CONSIDERATIONSAllocated by States and Territories
Direct Business OnlyLife Contracts 4 5 6 7
States, Etc.
1
Active Status
2
Life InsurancePremiums
3
AnnuityConsiderations
Accident and Health Insurance Premiums,
Including Policy,Membership and
Other FeesOther
Considerations
TotalColumns
2 Through 5Deposit-Type
Contracts1. Alabama AL L 3,219,103 3,219,103 2. Alaska AK L 119,100 119,100 3. Arizona AZ L 846,461 846,461 4. Arkansas AR L 2,561,341 5,000 2,566,341 5. California CA L 8,315,732 8,315,732 6. Colorado CO L 1,734,134 1,734,134 7. Connecticut CT L 51,950 51,950 8. Delaware DE L 131,117 131,117 9. District of Columbia DC L 121,239 121,239
10. Florida FL L 4,292,978 224 4,293,202 11. Georgia GA L 3,026,449 360 87 3,026,896 12. Hawaii HI L 32,457 32,457 13. Idaho ID L 448,230 120 448,350 14. Illinois IL L 3,854,689 3,854,689 15. Indiana IN L 4,537,114 4,537,114 16. Iowa IA L 225,548 225,548 17. Kansas KS L 2,118,592 4,000 2,122,592 18. Kentucky KY L 3,416,054 3,416,054 19. Louisiana LA L 7,229,952 8,189 7,238,141 20. Maine ME L 18,449 18,449 21. Maryland MD L 1,360,050 1,360,050 22. Massachusetts MA L 399,829 399,829 23. Michigan MI L 88,250 88,250 24. Minnesota MN L 222,931 222,931 25. Mississippi MS L 3,202,149 3,202,149 26. Missouri MO L 2,051,043 (596) 2,050,447 27. Montana MT L 33,878 33,878 28. Nebraska NE L 146,826 146,826 29. Nevada NV L 492,741 492,741 30. New Hampshire NH L 71,232 71,232 31. New Jersey NJ L 182,259 10 182,269 32. New Mexico NM L 3,194,646 7,150 3,201,796 33. New York NY N 100,900 391 101,291 34. North Carolina NC L 7,831,608 7,831,608 35. North Dakota ND L 23,532 23,532 36. Ohio OH L 1,075,030 1,075,030 37. Oklahoma OK L 6,513,636 240 230 6,514,106 38. Oregon OR L 332,699 332,699 39. Pennsylvania PA L 917,744 419 918,163 40. Rhode Island RI L 28,429 28,429 41. South Carolina SC L 838,626 838,626 42. South Dakota SD L 12,173 12,173 43. Tennessee TN L 1,469,192 1,469,192 44. Texas TX L 53,179,423 209,756 5,216 53,394,395 45. Utah UT L 473,284 473,284 46. Vermont VT L 147,952 147,952 47. Virginia VA L 1,470,772 2 1,470,774 48. Washington WA L 452,935 452,935 49. West Virginia WV L 353,377 353,377 50. Wisconsin WI L 331,138 331,138 51. Wyoming WY L 27,627 27,627 52. American Samoa AS N53. Guam GU N54. Puerto Rico PR N55. US Virgin Islands VI N56. Northern Mariana Islands MP N57. Canada CN N58. Aggregate Other Alien OT XXX 76,134 76,134 59. Subtotal (a) 50 133,402,734 235,265 5,533 133,643,532 90. Reporting entity contributions for employee
benefits plans XXX91. Dividends or refunds applied to purchase paid-up
additions and annuities XXX 2,189,438 2,189,438 92. Dividends or refunds applied to shorten
endowment or premium paying period XXX93. Premium or annuity considerations waived under
disability or other contract provisions XXX 86,094 86,094 94. Aggregate of other amounts not allocable by State XXX95. Totals (Direct Business) XXX 135,678,266 235,265 5,533 135,919,064 96. Plus Reinsurance Assumed XXX97. Totals (All Business) XXX 135,678,266 235,265 5,533 135,919,064 98. Less Reinsurance Ceded XXX 3,840,445 3,840,445 99. Totals (All Business) less Reinsurance Ceded XXX 131,837,821 235,265 (b) 5,533 132,078,619
DETAILS OF WRITE-INS5801. Other Foreign XXX 76,134 76,134 5802. XXX5803. XXX5898. Summary of remaining write-ins for Line 58 from
overflow page XXX5899. Totals (Lines 5801 through 5803 plus 5898)(Line
58 above) XXX 76,134 76,134 9401. XXX9402. XXX9403. XXX9498. Summary of remaining write-ins for Line 94 from
overflow page XXX9499. Totals (Lines 9401 through 9403 plus 9498)(Line
94 above) XXXExplanation of basis of allocation by states, etc., of premiums and annuity considerations
Premiums for all types of business are allocated according to residence of payor at the time the premiums are paid.(a) Insert the number of L responses except for Canada and Other Alien.(b) Column 4 should balance with Exhibit 1, Lines 6.4, 10.4, and 16.4, Cols. 8, 9 and 10, or with Schedule H, Part 1, Line 1, indicate which: Exhibit 1, Lines 6.4, 10.4 and 16.4, Cols. 8, 9 and 10.
48

ANNUAL STATEMENT FOR THE YEAR 2008 OF THE TEXAS LIFE INSURANCE COMPANY
SCHEDULE T – PART 2INTERSTATE COMPACT – EXHIBIT OF PREMIUMS WRITTEN
Allocated by States and TerritoriesDirect Business Only
States, Etc.
1
Life(Group andIndividual)
2
Annuities (Group and Individual)
3DisabilityIncome
(Group and Individual)
4
Long-Term Care(Group and Individual)
5
Deposit-TypeContracts
6
Totals1. Alabama AL 3,219,103 3,219,103 2. Alaska AK 119,100 119,100 3. Arizona AZ 846,461 846,461 4. Arkansas AR 2,561,341 5,000 2,566,341 5. California CA 8,315,732 8,315,732 6. Colorado CO 1,734,134 1,734,134 7. Connecticut CT 51,950 51,950 8. Delaware DE 131,117 131,117 9. District of Columbia DC 121,239 121,239
10. Florida FL 4,292,978 224 4,293,202 11. Georgia GA 3,026,449 360 3,026,809 12. Hawaii HI 32,457 32,457 13. Idaho ID 448,230 120 448,350 14. Illinois IL 3,854,689 3,854,689 15. Indiana IN 4,537,114 4,537,114 16. Iowa IA 225,548 225,548 17. Kansas KS 2,118,592 4,000 2,122,592 18. Kentucky KY 3,416,054 3,416,054 19. Louisiana LA 7,229,952 8,189 7,238,141 20. Maine ME 18,449 18,449 21. Maryland MD 1,360,050 1,360,050 22. Massachusetts MA 399,829 399,829 23. Michigan MI 88,250 88,250 24. Minnesota MN 222,931 222,931 25. Mississippi MS 3,202,149 3,202,149 26. Missouri MO 2,051,043 (596) 2,050,447 27. Montana MT 33,878 33,878 28. Nebraska NE 146,826 146,826 29. Nevada NV 492,741 492,741 30. New Hampshire NH 71,232 71,232 31. New Jersey NJ 182,259 10 182,269 32. New Mexico NM 3,194,646 7,150 3,201,796 33. New York NY 100,900 391 101,291 34. North Carolina NC 7,831,608 7,831,608 35. North Dakota ND 23,532 23,532 36. Ohio OH 1,075,030 1,075,030 37. Oklahoma OK 6,513,636 240 6,513,876 38. Oregon OR 332,699 332,699 39. Pennsylvania PA 917,744 419 918,163 40. Rhode Island RI 28,429 28,429 41. South Carolina SC 838,626 838,626 42. South Dakota SD 12,173 12,173 43. Tennessee TN 1,469,192 1,469,192 44. Texas TX 53,179,423 209,756 53,389,179 45. Utah UT 473,284 473,284 46. Vermont VT 147,952 147,952 47. Virginia VA 1,470,772 2 1,470,774 48. Washington WA 452,935 452,935 49. West Virginia WV 353,377 353,377 50. Wisconsin WI 331,138 331,138 51. Wyoming WY 27,627 27,627 52. American Samoa AS 53. Guam GU 54. Puerto Rico PR 55. U.S. Virgin Islands VI 56. Northern Mariana Islands MP 57. Canada CN 58. Aggregate Other Alien OT 76,134 76,134 59. Totals 133,402,734 235,265 133,637,999
49
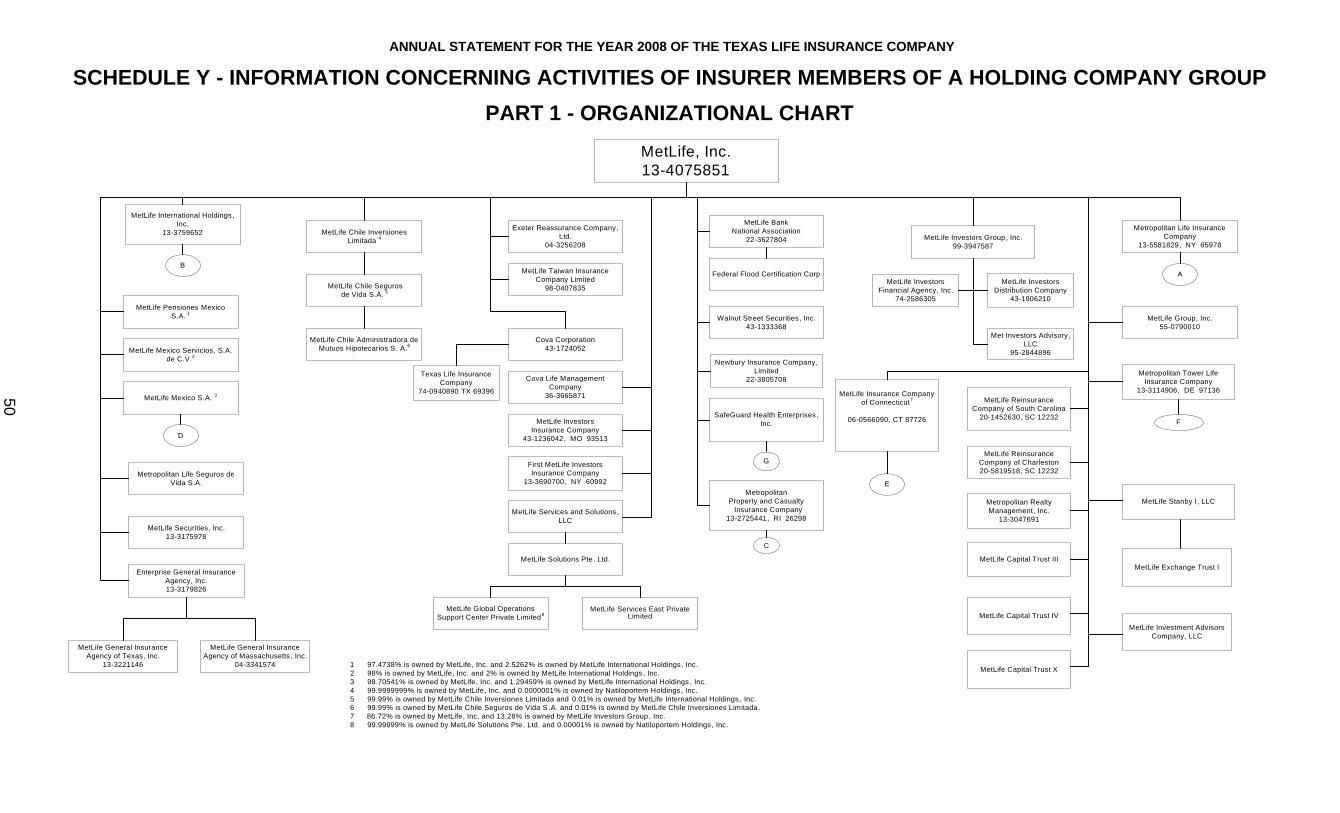
ANNUAL STATEMENT FOR THE YEAR 2008 OF THE TEXAS LIFE INSURANCE COMPANY
SCHEDULE Y - INFORMATION CONCERNING ACTIVITIES OF INSURER MEMBERS OF A HOLDING COMPANY GROUPPART 1 - ORGANIZATIONAL CHART
MetLife, Inc.13-4075851
MetLife Chile InversionesLimitada 4
MetLife International Holdings, Inc.
13-3759652
MetLife Pensiones Mexico S.A. 1
MetLife Mexico S.A. 3
Metropolitan Life Seguros de Vida S.A.
B
MetLife Securities, Inc.13-3175978
Enterprise General Insurance Agency, Inc.13-3179826
MetLife General Insurance Agency of Texas, Inc.
13-3221146
Exeter Reassurance Company, Ltd.
04-3256208
MetLife Taiwan Insurance Company Limited
98-0407835
Cova Corporation43-1724052
Texas Life Insurance Company
74-0940890 TX 69396
Cova Life Management Company
36-3665871
MetLife InvestorsInsurance Company
43-1236042, MO 93513
First MetLife Investors Insurance Company
13-3690700, NY 60992
MetLife BankNational Association
22-3627804
Walnut Street Securities, Inc.43-1333368
Newbury Insurance Company, Limited
22-3805708
MetLife Investors Group, Inc.99-3947587
MetLife Investors Financial Agency, Inc.
74-2586305
MetLife Investors Distribution Company
43-1906210
Met Investors Advisory, LLC
95-2844896
Metropolitan Life Insurance Company
13-5581829, NY 65978
MetLife Group, Inc.55-0790010
A
1 97.4738% is owned by MetLife, Inc. and 2.5262% is owned by MetLife International Holdings, Inc.2 98% is owned by MetLife, Inc. and 2% is owned by MetLife International Holdings , Inc. 3 98.70541% is owned by MetLife, Inc. and 1.29459% is owned by MetLife International Holdings , Inc.4 99.9999999% is owned by MetLife, Inc. and 0.0000001% is owned by Natiloportem Holdings, Inc.5 99.99% is owned by MetLife Chile Inversiones Limitada and 0.01% is owned by MetLife International Holdings , Inc.6 99.99% is owned by MetLife Chile Seguros de Vida S .A. and 0.01% is owned by MetLife Chile Inversiones Limitada .7 86.72% is owned by MetLife, Inc. and 13.28% is owned by MetLife Investors Group, Inc.8 99.99999% is owned by MetLife Solutions Pte . Ltd. and 0.00001% is owned by Natiloportem Holdings, Inc.
MetropolitanProperty and Casualty Insurance Company
13-2725441, RI 26298
C
MetLife General Insurance Agency of Massachusetts , Inc.
04-3341574
MetLife Insurance Company of Connecticut7
06-0566090, CT 87726
MetLife Mexico Servicios, S.A. de C.V.2
MetLife Chile Administradora de Mutuos Hipotecarios S. A.6
MetLife Chile Seguros de Vida S.A. 5
D
Metropolitan Tower Life Insurance Company
13-3114906, DE 97136
Metropolitan Realty Management, Inc.
13-3047691
MetLife Capital Trust III
MetLife Reinsurance Company of South Carolina
20-1452630, SC 12232F
E
MetLife Stanby I, LLC
MetLife Exchange Trust I
MetLife Investment Advisors Company, LLC
MetLife Services and Solutions , LLC
MetLife Solutions Pte. Ltd.
MetLife Services East Private Limited
SafeGuard Health Enterprises, Inc.
MetLife Capital Trust IV
G
MetLife Capital Trust X
MetLife Global Operations Support Center Private Limited8
MetLife Reinsurance Company of Charleston20-5819518, SC 12232
Federal Flood Certification Corp
50

ANNUAL STATEMENT FOR THE YEAR 2008 OF THE TEXAS LIFE INSURANCE COMPANY
SCHEDULE Y - INFORMATION CONCERNING ACTIVITIES OF INSURER MEMBERS OF A HOLDING COMPANY GROUPPART 1 - ORGANIZATIONAL CHART
Metropolitan Life Insurance Company
(NY)13-5581829 NY 65978
Alternative Fuel I, LLC
Missouri Reinsurance (Barbados), Inc.
43-1822723
MetLife Holdings, Inc. 13-3237278
MetLife Credit Corp.13-3237275
MetLife Funding, Inc.13-3237277
CRB Co., Inc.1
04-3171930334 Madison Euro Investments, Inc.
13-4078322
New England Life Insurance Company
04-2708937, MA 91626
A-1
Transmountain Land & Livestock Company
22-2375428
MetPark Funding, Inc.13-3751851
Hyatt Legal Plans, Inc.34-1650967
Hyatt Legal Plans of Florida, Inc.
34-1631590
G.A. Holding Corporation04-3245793
GenAmerica Financial, LLC41-1779470
A-2
Park Twenty Three Investments Company2
Convent Station Euro Investments Four Company 3
St. James Fleet Investments Two Limited
One Madison Investments (Cayco) Limited 4
99%
1%
99%
34%
89.9%
1 AEW Real Estate Advisors, Inc. holds 49,000 preferred non-voting shares and AEW Advisors , Inc. holds 1,000 preferred non-voting shares of CRB Co., Inc. 2 1% voting control of Park Twenty Three Investments Company is held by St . James Fleet Investments Two Limited.3 1% voting control of Convent Station Euro Investments Four Company is held by 334 Madison Euro Investments, Inc. as nominee for Park Twenty Three Investments Company . 4 10.1% voting control of One Madison Investments (Cayco) Limited is held by Convent Station Euro Investments Four Company .5 1% voting control of Ten Park SPC is held by 23rd Street Investments, Inc.6 99% of 500 Grant Street Associates Limited Partnership is held by Metropolitan Life Insurance Company and 1% by 500 Grant Street GP LLC. 7 4% of MSV Irvine Property, LLC is owned by Metropolitan Tower Realty Company , Inc. and 96% is owned by Metropolitan Life Insurance Company .
Metropolitan Tower Realty Company, Inc.
13-3170235
Thorngate, LLC
MetLife Private Equity Holdings, LLC
A
Bond Trust Account A
Special Multi-Asset Receivables Trust
20-1731629
MetLife Canada/MetVie Canada
Corporate Real Estate Holdings, LLC
White Oak Royalty Company43-6026902
Headland Properties Associates95-4146440
Headland-Pacific Palisades, LLC
95-4656835
MetLife Tower Resources Group, Inc.13-4047186
Ten Park SPC 5
98-0445386
500 Grant Street GP LLC20-2985998
500 Grant Street Associates Limited Partnership 6
Metropolitan Marine Way Investments Limited
Krisman, Inc.43-0999428
Midtown Heights, LLC
99%
1%
Euro CL Investments LLCMSV Irvine Property, LLC7
Mex DF Properties, LLC
96%
MetLife Retirement Services LLC
MetLife Investment Funds Services LLC
MetLife Investment Funds Management LLC
MetLife Associates LLC
MetLife Real Estate Cayman Company
Housing Fund Manager, LLC
MTC Fund I, LLC11
.01%
MetLife Properties Ventures, LLC
Citypoint Holdings II Limited
.01%
MetLife Investments Asia Limited
MetLife Investments Limited8
MetLife Latin America Asesorias e Inversiones
Limitada9
23rd Street Investments, Inc.13-3619870
HPZ Assets LLC
MetLife Capital Limited Partnership10
Mezzanine Investment Limited Partnership- LG10
Mezzanine Investment Limited Partnership- BDR10
MetLife Capital Credit L.P.10
1% GP
1% GP
MTC Fund II, LLC11
8. 23rd Street Investments, Inc. holds one share of MetLife Investments Limited . 9. 23rd Street Investments, Inc holds .01% of MetLife Latin America Asesorias e Inversiones Limitada .10. 1% General Partnership interest is held by 23rd Street Investments, Inc. and 99% Limited Partnership interest is held by Metropolitan Life Insurance Company .11. Housing Fund Manager, LLC is the managing member LLC and the remaining interests are held by a third party member .
MTC Fund III, LLC11
.01%
MLIC Asset Holdings, LLC
1% GP
1% GP
85 Broad Street LLC
The Building at 575 LLC
50.1
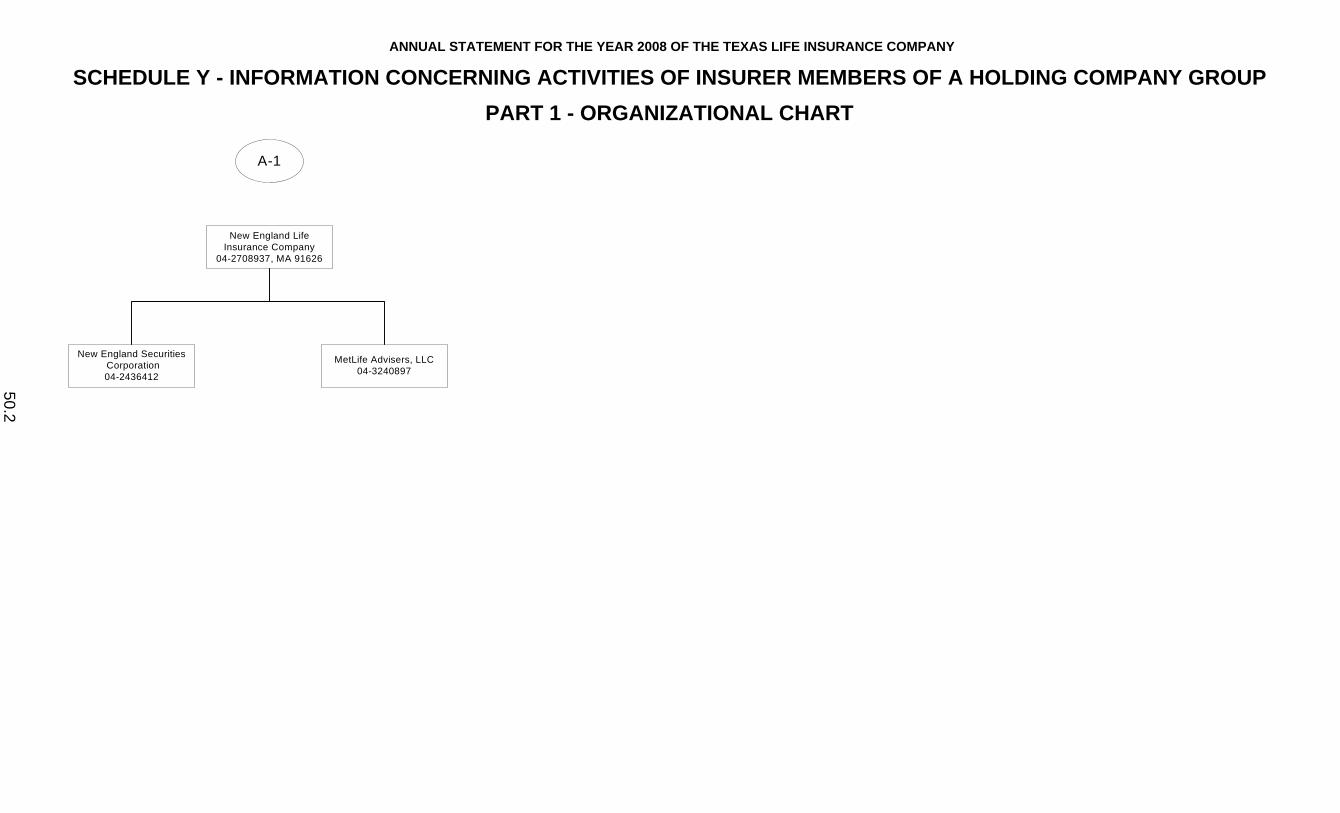
ANNUAL STATEMENT FOR THE YEAR 2008 OF THE TEXAS LIFE INSURANCE COMPANY
SCHEDULE Y - INFORMATION CONCERNING ACTIVITIES OF INSURER MEMBERS OF A HOLDING COMPANY GROUPPART 1 - ORGANIZATIONAL CHART
New England LifeInsurance Company
04-2708937, MA 91626
New England Securities Corporation04-2436412
MetLife Advisers, LLC04-3240897
A-1
50.2

ANNUAL STATEMENT FOR THE YEAR 2008 OF THE TEXAS LIFE INSURANCE COMPANY
SCHEDULE Y - INFORMATION CONCERNING ACTIVITIES OF INSURER MEMBERS OF A HOLDING COMPANY GROUPPART 1 - ORGANIZATIONAL CHART
GenAmerica Capital I43-1782907
General American Life Insurance Company
43-0285930, MO 63665
GenAmerica Financial, LLC
43-1779470
A-2
GenAmerica Management Corporation43-1833362
50.3

ANNUAL STATEMENT FOR THE YEAR 2008 OF THE TEXAS LIFE INSURANCE COMPANY
SCHEDULE Y - INFORMATION CONCERNING ACTIVITIES OF INSURER MEMBERS OF A HOLDING COMPANY GROUPPART 1 - ORGANIZATIONAL CHART
Natiloportem Holdings, Inc.
13-3953333
Servicios Administrativos Gen,
S.A. de C.V.
Metropolitan Life Insurance Company of Hong Kong Limited 2
MetLifeSeguros de Vida
S.A. 4
MetLife International Holdings, Inc.
13-359652
75.4088%
Met AFJP S.A. 5
1 26% is owned by MetLife International Holdings, Inc. and 74% is owned by third parties.2 99.99924% is owned by MetLife International Holdings, Inc. and 0.00076% is owned by Natiloportem Holdings, Inc.3 99.999% is owned by MetLife International Holdings, Inc. and .001% is owned by Natiloportem Holdings, Inc.4 95.2499% is owned by MetLife International Holdings, Inc. and 4.7473% is owned by Natiloportem Holdings, Inc.5 75.4088% of the shares of Met AFJP S.A. are held by Compania Previsional MetLife SA, 19.5912% is owned by MetLife Seguros de Vida SA, 3.9689% is held by Natiloportem Holdings, Inc., and 1.0310% is held by MetLife Seguros de Retiro S.A.6 66.6617540% is owned by MetLife International Holdings, Inc., 33.3382457% is owned by MetLife Worldwide Holdings, Inc., and 0.0000003% is owned by Natiloportem Holdings, Inc.7 99% is owned by Servicios Administrativos Gen, S.A. de C.V and 1% is owned by MetLife Mexico Cares, S.A. de C.V.8 95.4635% is owned by MetLife International Holdings, Inc. and 4.5364% is owned by Natiloportem Holdings, Inc.9 5% of the shares are held by Natiloportem Holdings, Inc., and 94.9999% is owned by MetLife International Holdings Inc.10 96.8819% is owned by MetLife International Holdings, Inc. and 3.1180% is owned by Natiloportem Holdings, Inc.11 14.64% of MetLife Insurance Company of Korea Limited is owned by MetLife Mexico, S.A. and 85.36% is owned by MetLife International Holdings, Inc.12 MetLife Insurance and Investment Trust is a trust vehicle, the trustee of which is MetLife Investments Pty Limited (“MIPL”). MIPL is wholly owned subsidiary of MetLife Insurance Limited.
Metropolitan LifeSeguros e
PrevidenciaPrivada S.A. 6MetLife India Insurance
Company Limited1
26%
B
MLA Comercial, S.A. de C.V.7
MLA Servicios, S.A. de C.V.7
MetLife Global, Inc.20-5894439
MetLife Administradora de Fundos
MultipatrocinadosLtda. 8
MetLife Planos Odontologicos Ltda.3
MetLife InsuranceCompany of Korea
Limited11
MetLife General Insurance Limited
MetLife Insurance S.A./NV
MetLife Insurance Limited
Compania Previsional MetLife S.A. 8
MetLife Insurance Limited
MetLife Limited
MetLife Services Limited
MetLife Seguros de Retiro S.A.10
Best Market S.A. 9
MetLife Worldwide Holdings, Inc.06-1597037
B-1
MetLife Insurance and Investment
Trust12
MetLife Mexico Cares, S.A. de C.V.
Fundacion MetLifeMexico, A.C.
MetLife Investment Pty Limited
MetLife Services (Singapore) PTE
Limited
50.4

ANNUAL STATEMENT FOR THE YEAR 2008 OF THE TEXAS LIFE INSURANCE COMPANY
SCHEDULE Y - INFORMATION CONCERNING ACTIVITIES OF INSURER MEMBERS OF A HOLDING COMPANY GROUPPART 1 - ORGANIZATIONAL CHART
MetLife Worldwide Holdings, Inc.06-1597037
MetLife Towarzystwo Ubezpieczen na Zcycie
Spolka Akcyjna
MetLife Limited (Hong Kong)
B-1
MetLife Direct Co.,Ltd
50.5
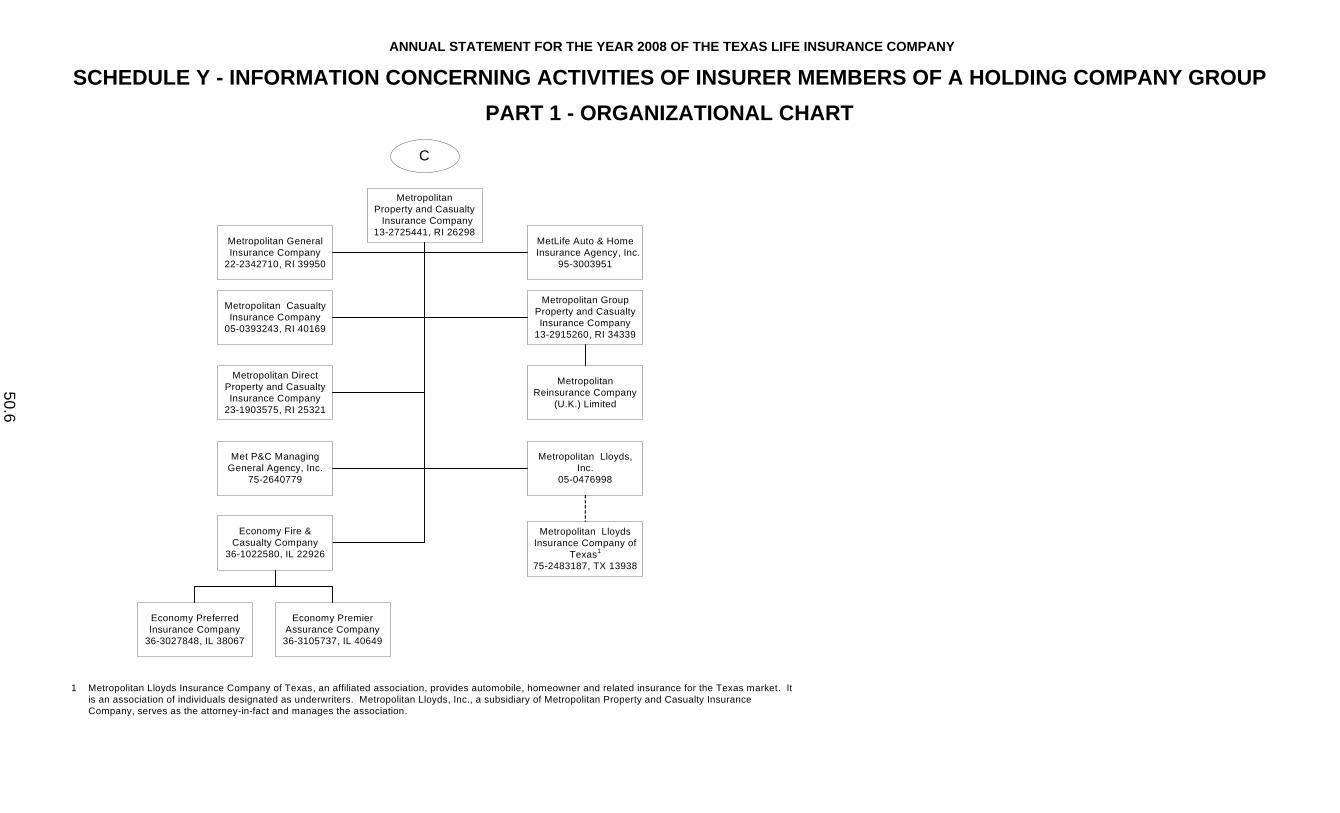
ANNUAL STATEMENT FOR THE YEAR 2008 OF THE TEXAS LIFE INSURANCE COMPANY
SCHEDULE Y - INFORMATION CONCERNING ACTIVITIES OF INSURER MEMBERS OF A HOLDING COMPANY GROUPPART 1 - ORGANIZATIONAL CHART
MetropolitanProperty and Casualty Insurance Company13-2725441, RI 26298
Metropolitan GeneralInsurance Company
22-2342710, RI 39950
Metropolitan CasualtyInsurance Company
05-0393243, RI 40169
Metropolitan DirectProperty and CasualtyInsurance Company
23-1903575, RI 25321
MetLife Auto & Home Insurance Agency, Inc.
95-3003951
Metropolitan Group Property and Casualty Insurance Company
13-2915260, RI 34339
Metropolitan Reinsurance Company
(U.K.) Limited
Met P&C Managing General Agency, Inc.
75-2640779
Metropolitan Lloyds Insurance Company of
Texas1
75-2483187, TX 13938
C
1 Metropolitan Lloyds Insurance Company of Texas, an affiliated association, provides automobile, homeowner and related insurance for the Texas market. It is an association of individuals designated as underwriters. Metropolitan Lloyds, Inc., a subsidiary of Metropolitan Property and Casualty Insurance Company, serves as the attorney-in-fact and manages the association.
Economy Fire & Casualty Company
36-1022580, IL 22926
Economy Preferred Insurance Company
36-3027848, IL 38067
Economy Premier Assurance Company36-3105737, IL 40649
Metropolitan Lloyds, Inc.
05-0476998
50.6

ANNUAL STATEMENT FOR THE YEAR 2008 OF THE TEXAS LIFE INSURANCE COMPANY
SCHEDULE Y - INFORMATION CONCERNING ACTIVITIES OF INSURER MEMBERS OF A HOLDING COMPANY GROUPPART 1 - ORGANIZATIONAL CHART
MetLife Mexico S.A.
Met1 SIEFORE, S.A. de C.V.2
MetLife Afore, S.A. de C.V.1
D
Met2 SIEFORE, S.A. de C.V.2
1 99.99% is owned by MetLife Mexico S.A. (Mexico) and .01% is owned by MetLife Pensiones S.A.
2 99.99% is owned by MetLife Afore, S.A. de C.V. and .01% is owned by MetLife Mexico S.A. (Mexico).
3 99% is owned by MetLife Mexico S.A. and 1% is owned by MetLife Mexico Cares, S.A. de C.V.
MetA SIEFORE Adicional, S.A. de C.V.2
ML Capacitacion Comercial S.A. de C.V.3
Met5 SIEFORE, S.A. de C.V.2
Met4 SIEFORE, S.A. de C.V.2
Met3 SIEFORE, Basica, S.A. de C.V.2
50.7

ANNUAL STATEMENT FOR THE YEAR 2008 OF THE TEXAS LIFE INSURANCE COMPANY
SCHEDULE Y - INFORMATION CONCERNING ACTIVITIES OF INSURER MEMBERS OF A HOLDING COMPANY GROUPPART 1 - ORGANIZATIONAL CHART
Pilgrim Investments Highland Park, LLC
E
Plaza LLC
Tower Square Securities, Inc.06-0843577
Pilgrim Alternative Investments Opportunity Fund I, LLC 2
One Financial Place Corporation 1
06-1576470
Pilgrim Alternative Investments Opportunity Fund III Associates ,
LLC 2
MetLife Insurance Company of Connecticut
06-0566090, CT 87726
Metropolitan Connecticut Properties Ventures, LLC
Euro TI Investments, LLC
Greenwich Street Investments, LLC
Greenwich Street Capital Offshore Fund, Ltd.
TIC European Real Estate LP, LLC
Travelers International Investments Ltd.
98-0187886
TLA Holdings LLC
The Prospect Company
Panther Valley, Inc.
TRAL & Co.3
Euro TL Investments LLC
Corrigan TLP LLC67%
1 100% is owned in the aggregate by MetLife Insurance Company of Connecticut .
2 67% is owned by MetLife Insurance Company of Connecticut and 33% is owned by a third party.
3 TRAL & Co. is a General Partnership. Its partners are MetLife Insurance Company of Connecticut and Metropolitan Life Insurance Company .
Greenwich Street Investments, L.P.
MetLife Europe Limited
MetLife Pension Trustees Limited
MetLife European Holdings , Inc.
MetLife Investors USA Insurance Company
54-0696644, DE 61050
67%
MetLife Assurance Limited
MetLife Canadian Property Ventures LLC
MetLife Property Ventures Canada ULC
Tribeca Distressed Securities, L.L.C.
50.8

ANNUAL STATEMENT FOR THE YEAR 2008 OF THE TEXAS LIFE INSURANCE COMPANY
SCHEDULE Y - INFORMATION CONCERNING ACTIVITIES OF INSURER MEMBERS OF A HOLDING COMPANY GROUPPART 1 - ORGANIZATIONAL CHART
Metropolitan Tower Life Insurance Company
13-3114906, DE 97136
F
TH Tower NGP, LLC
Partners Tower, L.P.
1% GP99% LP
TH Tower Leasing, LLC
Plaza Drive Properties, LLC
EntreCap Real Estate II, LLC
PREFCO Dix-Huit LLC PREFCO X Holdings LLC PREFCO Vingt LLC
PREFCO Ten Limited Partnership
PREFCO Twenty Limited Partnership
0.1% GP99.9% LP
99% LP
1% GP
MTL Leasing, LLC
PREFCO IX Realty LLC PREFCO XIV Holdings LLC
PREFCO Fourteen Limited Partnership
99.9% LP 0.1% GP
MetLife Reinsurance Company of Vermont
26-1511401, VT 13092
50.9

ANNUAL STATEMENT FOR THE YEAR 2008 OF THE TEXAS LIFE INSURANCE COMPANY
SCHEDULE Y - INFORMATION CONCERNING ACTIVITIES OF INSURER MEMBERS OF A HOLDING COMPANY GROUPPART 1 - ORGANIZATIONAL CHART
SafeGuard Health Enterprises, Inc. (DE)
SafeGuard Health Plans, Inc. 95-2879515, CA 933-0034
SafeHealth Life Insurance Company
33-0515751, CA 79014
G
SafeGuard Health Plans, Inc.
65-0073323, FL 52009
SafeGuard Dental Services, Inc. (DE)
SafeGuard Health Plans, Inc.93-0864866, NV 95747
SafeGuard Health Plans, Inc. 75-2046497, TX 95051
50.10

ANNUAL STATEMENT FOR THE YEAR 2008 OF THE TEXAS LIFE INSURANCE COMPANY
SCHEDULE Y - INFORMATION CONCERNING ACTIVITIES OF INSURER MEMBERS OF A HOLDING COMPANY GROUPPART 1 - ORGANIZATIONAL CHART
The voting securities (excluding directors' qualifying shares, if any) of each subsidiary shown on the organizational chart are 100% owned by their respective parent corporation, unless otherwise indicated.
In addition to the entities shown on the organizational chart, MetLife, Inc. (or where indicated, a subsidiary) also owns interests in the following entities:
1) Metropolitan Life Insurance Company owns varying interests in certain mutual funds distributed by its affiliates. These ownership interests are generally expected to decrease as shares of the funds are purchased by unaffiliated investors.
2) Mezzanine Investment Limited Partnerships ("MILPs"), Delaware limited partnerships, are investment vehicles through which investments in certain entities are held. A wholly owned subsidiary of Metropolitan Life Insurance Company serves as the general partner of the limited partnerships and Metropolitan Life Insurance Company directly owns a 99% limited partnership interest in each MILP. The MILPs have various ownership and/or debt interests in certain companies.
3) The Metropolitan Money Market Pool and MetLife Intermediate Income Pool are pass-through investments pools, of which Metropolitan Life Insurance Company and/or its subsidiaries and/or affiliates are general partners.
NOTE: THE METLIFE, INC. ORGANIZATIONAL CHART DOES NOT INCLUDE REAL ESTATE JOINT VENTURES AND PARTNERSHIPS OF WHICH METLIFE, INC. AND/OR ITS SUBSIDIARIES IS AN INVESTMENT PARTNER. IN ADDITION, CERTAIN INACTIVE SUBSIDIARIES HAVE ALSO BEEN OMITTED.
50.11
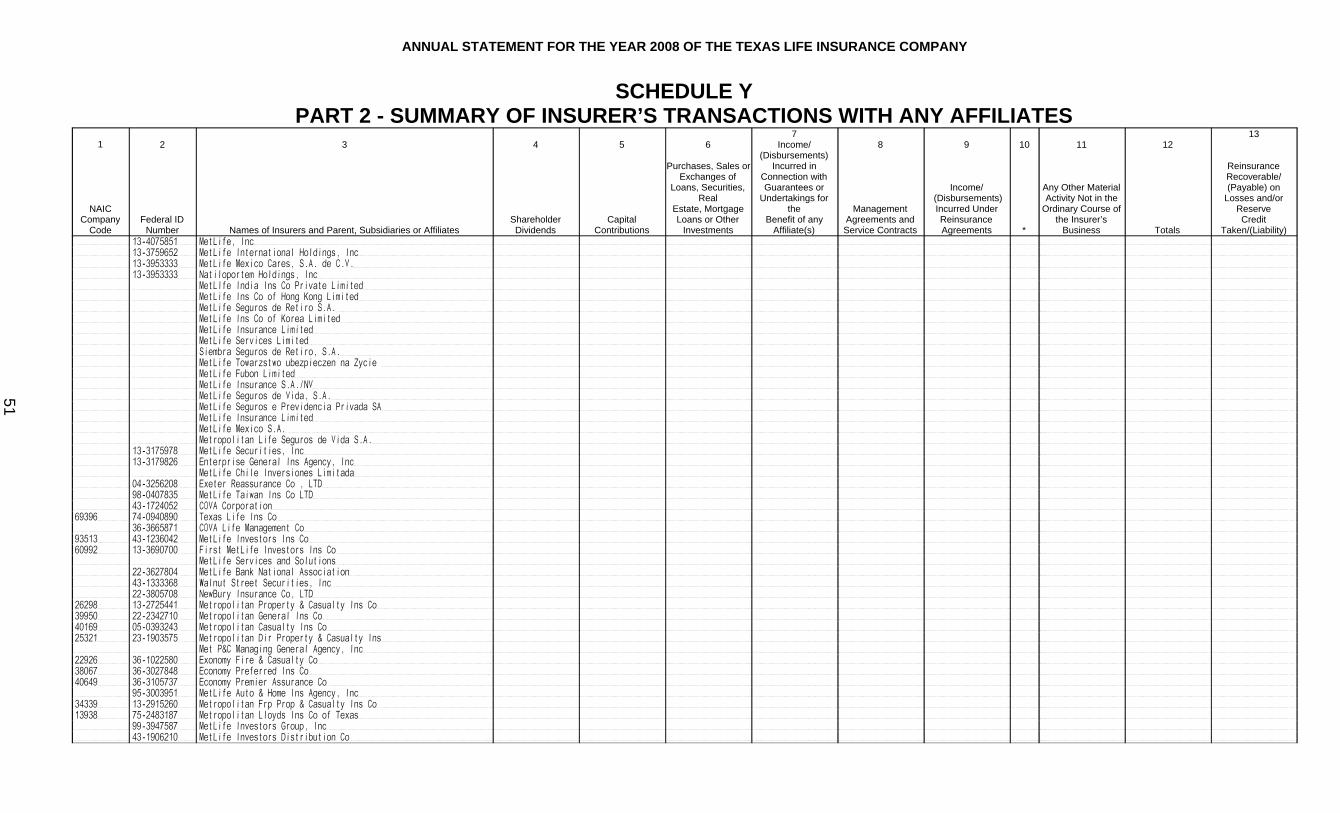
ANNUAL STATEMENT FOR THE YEAR 2008 OF THE TEXAS LIFE INSURANCE COMPANY
SCHEDULE Y PART 2 - SUMMARY OF INSURER’S TRANSACTIONS WITH ANY AFFILIATES
1
NAIC Company
Code
2
Federal ID Number
3
Names of Insurers and Parent, Subsidiaries or Affiliates
4
ShareholderDividends
5
CapitalContributions
6
Purchases, Sales orExchanges of
Loans, Securities,Real
Estate, MortgageLoans or Other
Investments
7Income/
(Disbursements)Incurred in
Connection withGuarantees or
Undertakings for the
Benefit of anyAffiliate(s)
8
Management Agreements and Service Contracts
9
Income/ (Disbursements) Incurred Under Reinsurance Agreements
10
*
11
Any Other Material Activity Not in the
Ordinary Course ofthe Insurer’s
Business
12
Totals
13
Reinsurance Recoverable/(Payable) on
Losses and/or ReserveCredit
Taken/(Liability)13-4075851 MetLife, Inc13-3759652 MetLife International Holdings, Inc13-3953333 MetLife Mexico Cares, S.A. de C.V.13-3953333 Natiloportem Holdings, Inc
MetLIfe India Ins Co Private LimitedMetLife Ins Co of Hong Kong LimitedMetLife Seguros de Retiro S.A.MetLife Ins Co of Korea LimitedMetLife Insurance LimitedMetLife Services LimitedSiembra Seguros de Retiro, S.A.MetLife Towarzstwo ubezpieczen na Zycie MetLife Fubon LimitedMetLife Insurance S.A./NVMetLife Seguros de Vida, S.A.MetLife Seguros e Previdencia Privada SAMetLife Insurance LimitedMetLife Mexico S.A.Metropolitan Life Seguros de Vida S.A.
13-3175978 MetLife Securities, Inc13-3179826 Enterprise General Ins Agency, Inc
MetLife Chile Inversiones Limitada04-3256208 Exeter Reassurance Co , LTD98-0407835 MetLife Taiwan Ins Co LTD43-1724052 COVA Corporation
69396 74-0940890 Texas Life Ins Co36-3665871 COVA Life Management Co
93513 43-1236042 MetLife Investors Ins Co60992 13-3690700 First MetLife Investors Ins Co
MetLife Services and Solutions22-3627804 MetLife Bank National Association43-1333368 Walnut Street Securities, Inc22-3805708 NewBury Insurance Co, LTD
26298 13-2725441 Metropolitan Property & Casualty Ins Co39950 22-2342710 Metropolitan General Ins Co40169 05-0393243 Metropolitan Casualty Ins Co25321 23-1903575 Metropolitan Dir Property & Casualty Ins
Met P&C Managing General Agency, Inc22926 36-1022580 Exonomy Fire & Casualty Co38067 36-3027848 Economy Preferred Ins Co40649 36-3105737 Economy Premier Assurance Co
95-3003951 MetLife Auto & Home Ins Agency, Inc34339 13-2915260 Metropolitan Frp Prop & Casualty Ins Co13938 75-2483187 Metropolitan Lloyds Ins Co of Texas
99-3947587 MetLife Investors Group, Inc43-1906210 MetLife Investors Distribution Co
51
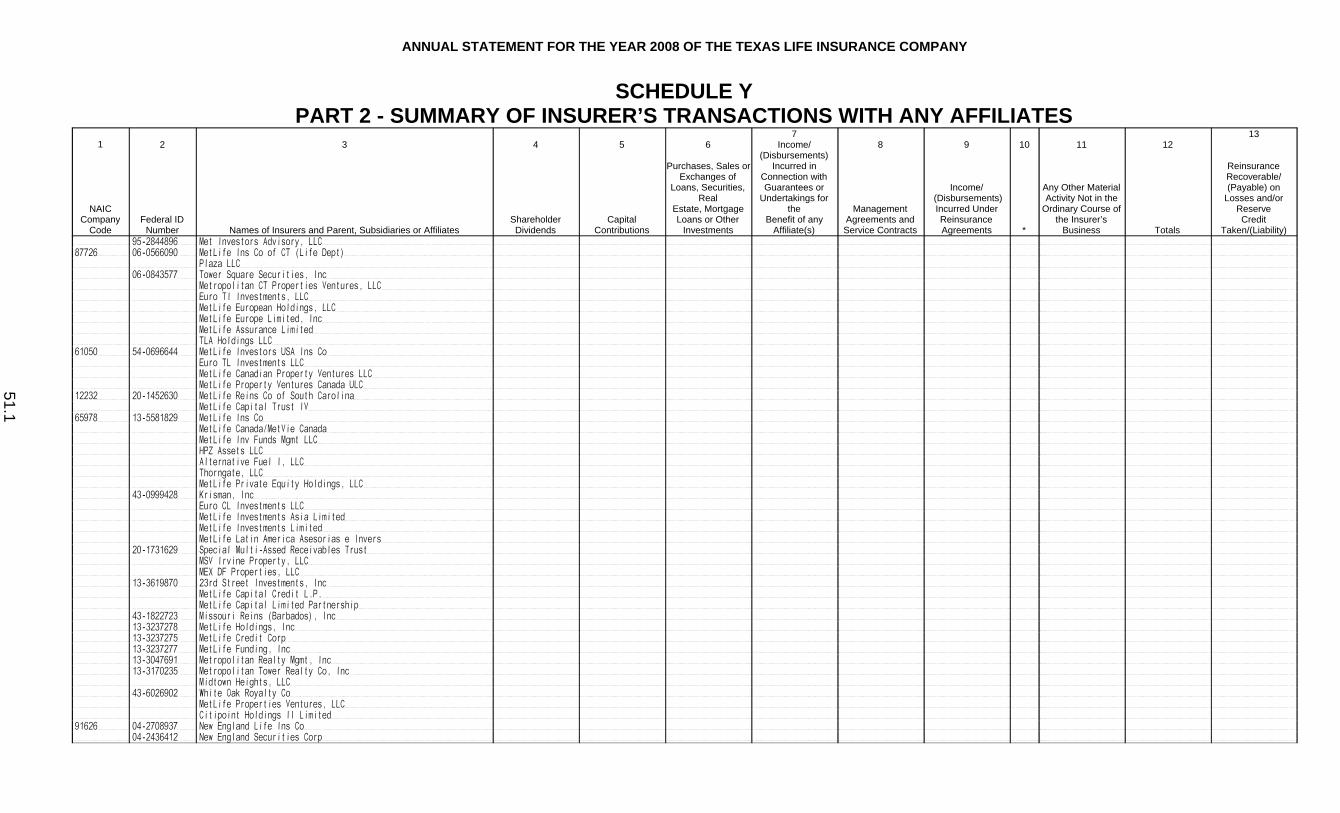
ANNUAL STATEMENT FOR THE YEAR 2008 OF THE TEXAS LIFE INSURANCE COMPANY
SCHEDULE Y PART 2 - SUMMARY OF INSURER’S TRANSACTIONS WITH ANY AFFILIATES
1
NAIC Company
Code
2
Federal ID Number
3
Names of Insurers and Parent, Subsidiaries or Affiliates
4
ShareholderDividends
5
CapitalContributions
6
Purchases, Sales orExchanges of
Loans, Securities,Real
Estate, MortgageLoans or Other
Investments
7Income/
(Disbursements)Incurred in
Connection withGuarantees or
Undertakings for the
Benefit of anyAffiliate(s)
8
Management Agreements and Service Contracts
9
Income/ (Disbursements) Incurred Under Reinsurance Agreements
10
*
11
Any Other Material Activity Not in the
Ordinary Course ofthe Insurer’s
Business
12
Totals
13
Reinsurance Recoverable/(Payable) on
Losses and/or ReserveCredit
Taken/(Liability)95-2844896 Met Investors Advisory, LLC
87726 06-0566090 MetLife Ins Co of CT (Life Dept)Plaza LLC
06-0843577 Tower Square Securities, IncMetropolitan CT Properties Ventures, LLCEuro TI Investments, LLCMetLife European Holdings, LLCMetLife Europe Limited, IncMetLife Assurance LimitedTLA Holdings LLC
61050 54-0696644 MetLife Investors USA Ins CoEuro TL Investments LLCMetLife Canadian Property Ventures LLCMetLife Property Ventures Canada ULC
12232 20-1452630 MetLife Reins Co of South CarolinaMetLife Capital Trust IV
65978 13-5581829 MetLife Ins CoMetLife Canada/MetVie CanadaMetLife Inv Funds Mgmt LLCHPZ Assets LLCAlternative Fuel I, LLCThorngate, LLCMetLife Private Equity Holdings, LLC
43-0999428 Krisman, IncEuro CL Investments LLCMetLife Investments Asia LimitedMetLife Investments LimitedMetLife Latin America Asesorias e Invers
20-1731629 Special Multi-Assed Receivables TrustMSV Irvine Property, LLCMEX DF Properties, LLC
13-3619870 23rd Street Investments, IncMetLife Capital Credit L.P.MetLife Capital Limited Partnership
43-1822723 Missouri Reins (Barbados), Inc13-3237278 MetLife Holdings, Inc13-3237275 MetLife Credit Corp13-3237277 MetLife Funding, Inc13-3047691 Metropolitan Realty Mgmt, Inc13-3170235 Metropolitan Tower Realty Co, Inc
Midtown Heights, LLC43-6026902 White Oak Royalty Co
MetLife Properties Ventures, LLCCitipoint Holdings II Limited
91626 04-2708937 New England Life Ins Co04-2436412 New England Securities Corp
51.1

ANNUAL STATEMENT FOR THE YEAR 2008 OF THE TEXAS LIFE INSURANCE COMPANY
SCHEDULE Y PART 2 - SUMMARY OF INSURER’S TRANSACTIONS WITH ANY AFFILIATES
1
NAIC Company
Code
2
Federal ID Number
3
Names of Insurers and Parent, Subsidiaries or Affiliates
4
ShareholderDividends
5
CapitalContributions
6
Purchases, Sales orExchanges of
Loans, Securities,Real
Estate, MortgageLoans or Other
Investments
7Income/
(Disbursements)Incurred in
Connection withGuarantees or
Undertakings for the
Benefit of anyAffiliate(s)
8
Management Agreements and Service Contracts
9
Income/ (Disbursements) Incurred Under Reinsurance Agreements
10
*
11
Any Other Material Activity Not in the
Ordinary Course ofthe Insurer’s
Business
12
Totals
13
Reinsurance Recoverable/(Payable) on
Losses and/or ReserveCredit
Taken/(Liability)04-3240897 MetLife Advisors, LLC22-2375428 Transmountain Land & Livestock Co13-3751851 MetPark Funding, Inc34-1650967 Hyatt Legal Plans, Inc04-3171930 CRB Co, Inc13-4047186 MetLife Tower Resources Grp, Inc41-1779470 GenAmerica Financial, LLC
63665 43-0285930 General American Life Ins Co43-1627032 Reins Group of America, Inc
89004 43-1831519 Reins Co of Missouri, Inc93572 43-1235868 RGA Reinsurance Co
43-1065365 Reinsurance Partners, IncParkway Reinsurance CoTimberlake Financial, LLC
12596 42-1697911 Timberlake Reins Co IIRGA Global Reins Co, LTDRGA Americas Reins Co, LTDRGA Reins Co (Barbados)RGA Financial Group, LLC (De)RGA Life Reins Co of CanadaRGA Technology Partners, IncRGA International Reins Co LTDRGA Atlantic Reins Co LTDRGA International CorpRGA Holdings LTDRGA UK Services LTDRGA Reins (UK) LTDRGA Services India Private LTDRGA Reins Co of South Africa LTDRGA Australian Holdings PTY LTDRGA Reins Co of Australia LTDRGA Asis Pacific PTY LTDGenAmerican Argentina Seguros de Vida SAGen America Capital I
13-4078322 334 Madison Euro Investments, IncSt James Fleet Investments Two LTDOne Madison Inv (Cayco) LTD
98-0445386 Ten Park SPCMetLife Real Estate Cayman CoMetLife Group, Inc
97136 13-3114906 Metropolitan Tower Life Ins Co20-5819518 MetLife Reins Co of Charleston26-1511401 MetLife Reins Co of Vermont
MetLife Invesmtne Advisors Co, LLC
9999999 Control Totals XXX
51.2

ANNUAL STATEMENT FOR THE YEAR 2008 OF THE TEXAS LIFE INSURANCE COMPANY
SUPPLEMENTAL EXHIBITS AND SCHEDULES INTERROGATORIES
The following supplemental reports are required to be filed as part of your statement filing unless specifically waived by the domiciliary state. However, in the event that your domiciliary state waives the filing requirement, your response of WAIVED to the specific interrogatory will be accepted in lieu of filing a "NONE" report and a bar code will be printed below. If the supplement is required of your company but is not being filed for whatever reason enter SEE EXPLANATION and provide an explanation following the interrogatory questions.
MARCH FILING
Responses
1. Will the Supplemental Compensation Exhibit be filed with the state of domicile by March 1? YES
2. Will the confidential Risk-based Capital Report be filed with the NAIC by March 1? YES
3. Will the confidential Risk-based Capital Report be filed with the state of domicile, if required, by March 1? YES
4. Will an actuarial opinion be filed by March 1? YES
APRIL FILING
5. Will Management’s Discussion and Analysis be filed by April 1? YES
6. Will the Life, Health & Annuity Guaranty Association Model Act Assessment Base Reconciliation Exhibit be filed with the state of domicile and the NAIC by April 1? YES
7. Will the Adjustment Form (if required) be filed with the state of domicile and the NAIC by April 1? YES
8. Will the Supplemental Investment Risks Interrogatories be filed by April 1? YES
JUNE FILING
9. Will an audited financial report be filed by June 1? YES
The following supplemental reports are required to be filed as part of your annual statement filing. However, in the event that your company does not transact the type of business for which the special report must be filed, your response of NO to the specific interrogatory will be accepted in lieu of filing a "NONE" report and a bar code will be printed below. If the supplement is required of your company but is not being filed for whatever reason enter SEE EXPLANATION and provide an explanation following the interrogatory questions.
MARCH FILING
10. Will Schedule SIS (Stockholder Information Supplement) be filed with the state of domicile by March 1? NO
11. Will the Medicare Supplement Insurance Experience Exhibit be filed with the state of domicile and the NAIC by March 1? NO
12. Will the Trusteed Surplus Statement be filed with the state of domicile and the NAIC by March 1? NO
13. Will the actuarial opinion on participating and non-participating policies as required in Interrogatories 1 and 2 to Exhibit 5 be filed by March 1? YES
14. Will the actuarial opinion on non-guaranteed elements as required in interrogatory #3 to Exhibit 5 be filed by March 1? YES
15. Will the actuarial opinion on X-Factors be filed with the state of domicile and electronically with the NAIC by March 1? YES
16. Will the actuarial opinion on Separate Accounts Funding Guaranteed Minimum Benefit be filed with the state of domicile and electronically with the NAIC by March 1? NO
17. Will the actuarial opinion on Synthetic Guaranteed Investment Contracts be filed with the state of domicile and electronically with the NAIC by March 1? NO
18. Will the Reasonableness of Assumptions Certification required by Actuarial Guideline XXXV be filed with the state of domicile and electronically with the NAIC by March 1? NO
19. Will the Reasonableness and Consistency of Assumptions Certification required by Actuarial Guideline XXXV be filed with the state of domicile and electronically with the NAIC by March 1? NO
20. Will the Reasonableness of Assumptions Certification for Implied Guaranteed Rate Method required by Actuarial Guideline XXXVI be filed with the state of domicile and electronically with the NAIC by March 1? NO
21. Will the Reasonableness and Consistency of Assumptions Certification required by Actuarial Guideline XXXVI (Updated Average Market Value) be filed with the state of domicile and electronically with the NAIC by March 1? NO
22. Will the Reasonableness and Consistency of Assumptions Certification required by Actuarial Guideline XXXVI (Updated Market Value) be filed with the state of domicile and electronically with the NAIC by March 1? NO
23. Will the C-3 RBC Certifications required under C-3 Phase I be filed with the state of domicile and electronically with the NAIC by March 1? YES
24. Will the C-3 RBC Certifications required under C-3 Phase II be filed with the state of domicile and electronically with the NAIC by March 1? NO
25. Will the Actuarial Certifications Related to Annuity Nonforfeiture Ongoing Compliance for Equity Indexed Annuities be filed with the state of domicile and electronically with the NAIC by March 1? NO
52

ANNUAL STATEMENT FOR THE YEAR 2008 OF THE TEXAS LIFE INSURANCE COMPANY
SUPPLEMENTAL EXHIBITS AND SCHEDULES INTERROGATORIES26. Will the Workers’ Compensation Carve-Out Supplement be filed by March 1? NO
27. Will Supplemental Schedule O be filed with the state of domicile and the NAIC by March 1? NO
28. Will the Medicare Part D Coverage Supplement be filed with the state of domicile and the NAIC by March 1? NO
APRIL FILING
29. Will the Long-Term Care Experience Reporting Forms be filed with the state of domicile and the NAIC by April 1? NO
30. Will the Interest-Sensitive Life Insurance Products Report Forms be filed with the state of domicile and the NAIC by April 1? YES
31. Will the Credit Insurance Experience Exhibit be filed with the state of domicile and the NAIC by April 1? NO
32. Will the Accident and Health Policy Experience Exhibit be filed by April 1? YES
EXPLANATIONS:
10.
11.
12.
16.
17.
18.
19.
20.
21.
22.
24.
25.
26.
27.
28.
29.
31.
BAR CODE:
10. *69396200842000000*
11. *69396200836059000*
12. *69396200849000000*
16. *69396200844300000*
52.1

ANNUAL STATEMENT FOR THE YEAR 2008 OF THE TEXAS LIFE INSURANCE COMPANY
SUPPLEMENTAL EXHIBITS AND SCHEDULES INTERROGATORIES
17. *69396200844459000*
18. *69396200844559000*
19. *69396200844600000*
20. *69396200844759000*
21. *69396200844800000*
22. *69396200844900000*
24. *69396200845100000*
25. *69396200845200000*
26. *69396200849500000*
27. *69396200846500000*
28. *69396200836500000*
29. *69396200833000000*
31. *69396200823000000*
52.2

ALPHABETICAL INDEX(http://www.naic.org/committees_e_app_blanks.htm)
ANNUAL STATEMENT BLANK
Analysis of Increase in Reserves During The Year 7Analysis of Operations By Lines of Business 6Asset Valuation Reserve Default Component 30Asset Valuation Reserve Equity 32Asset Valuation Reserve Replications (Synthetic) Assets 35Asset Valuation Reserve 29Assets 2Cash Flow 5Exhibit 1 – Part 1 – Premiums and Annuity Considerations for Life and Accident and Health Contracts 9Exhibit 1 – Part 2 – Dividends and Coupons Applied, Reinsurance Commissions and Expense 10Exhibit 2 – General Expenses 11Exhibit 3 – Taxes, Licenses and Fees (Excluding Federal Income Taxes) 11Exhibit 4 – Dividends or Refunds 11Exhibit 5 – Aggregate Reserve for Life Contracts 12Exhibit 5 – Interrogatories 13Exhibit 5A – Changes in Bases of Valuation During The Year 13Exhibit 6 – Aggregate Reserves for Accident and Health Contracts 14Exhibit 7 – Deposit-Type Contracts 15Exhibit 8 – Claims for Life and Accident and Health Contracts – Part 1 16Exhibit 8 – Claims for Life and Accident and Health Contracts – Part 2 17Exhibit of Capital Gains (Losses) 8Exhibit of Life Insurance 25Exhibit of Net Investment Income 8Exhibit of Nonadmitted Assets 18Exhibit of Number of Policies, Contracts, Certificates, Income Payable and Account Values 27Five-Year Historical Data 22Form for Calculating the Interest Maintenance Reserve (IMR) 28General Interrogatories 20Jurat Page 1Liabilities, Surplus and Other Funds 3Life Insurance (State Page) 24Notes To Financial Statements 19Overflow Page For Write-ins 53Schedule A – Part 1 E01Schedule A – Part 2 E02
INDEX1
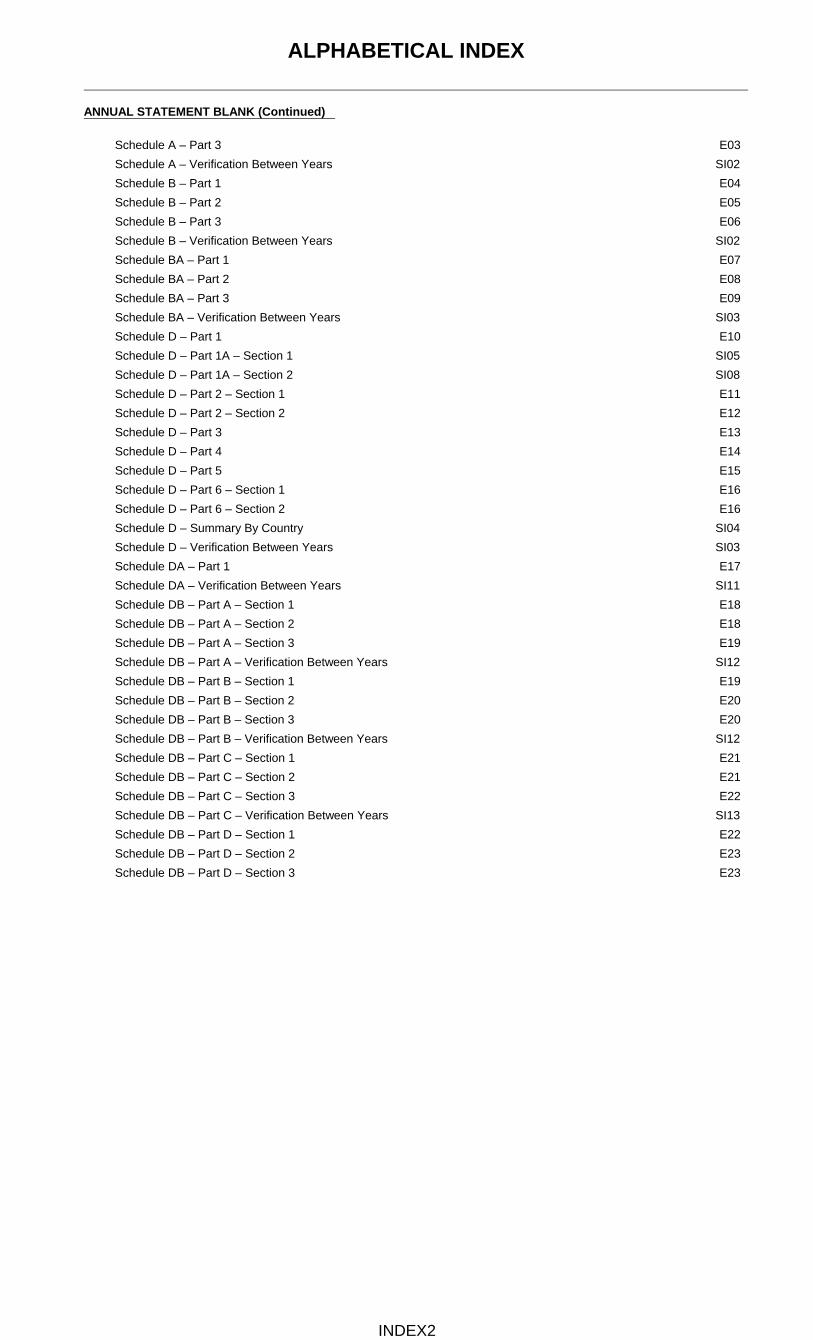
ALPHABETICAL INDEX
ANNUAL STATEMENT BLANK (Continued)
Schedule A – Part 3 E03Schedule A – Verification Between Years SI02Schedule B – Part 1 E04Schedule B – Part 2 E05Schedule B – Part 3 E06Schedule B – Verification Between Years SI02Schedule BA – Part 1 E07Schedule BA – Part 2 E08Schedule BA – Part 3 E09Schedule BA – Verification Between Years SI03Schedule D – Part 1 E10Schedule D – Part 1A – Section 1 SI05Schedule D – Part 1A – Section 2 SI08Schedule D – Part 2 – Section 1 E11Schedule D – Part 2 – Section 2 E12Schedule D – Part 3 E13Schedule D – Part 4 E14Schedule D – Part 5 E15Schedule D – Part 6 – Section 1 E16Schedule D – Part 6 – Section 2 E16Schedule D – Summary By Country SI04Schedule D – Verification Between Years SI03Schedule DA – Part 1 E17Schedule DA – Verification Between Years SI11Schedule DB – Part A – Section 1 E18Schedule DB – Part A – Section 2 E18Schedule DB – Part A – Section 3 E19Schedule DB – Part A – Verification Between Years SI12Schedule DB – Part B – Section 1 E19Schedule DB – Part B – Section 2 E20Schedule DB – Part B – Section 3 E20Schedule DB – Part B – Verification Between Years SI12Schedule DB – Part C – Section 1 E21Schedule DB – Part C – Section 2 E21Schedule DB – Part C – Section 3 E22Schedule DB – Part C – Verification Between Years SI13Schedule DB – Part D – Section 1 E22Schedule DB – Part D – Section 2 E23Schedule DB – Part D – Section 3 E23
INDEX2

ALPHABETICAL INDEX
ANNUAL STATEMENT BLANK (Continued)
Schedule DB – Part D – Verification Between Years SI13Schedule DB – Part E – Section 1 E24Schedule DB – Part E – Verification Between Years SI13Schedule DB – Part F – Section 1 SI14Schedule DB – Part F – Section 2 SI15Schedule E – Part 1 – Cash E25Schedule E – Part 2 – Cash Equivalents E26Schedule E – Part 3 – Special Deposits E27Schedule E – Verification Between Years SI16Schedule F 36Schedule H – Accident and Health Exhibit – Part 1 37Schedule H – Part 5 – Health Claims 39Schedule H – Parts – 2, 3, and 4 38Schedule S – Part 1 – Section 1 40Schedule S – Part 1 – Section 2 41Schedule S – Part 2 42Schedule S – Part 3 – Section 1 43Schedule S – Part 3 – Section 2 44Schedule S – Part 4 45Schedule S – Part 5 46Schedule S – Part 6 47Schedule T – Part 2 Interstate Compact 49Schedule T – Premiums and Annuity Considerations 48Schedule Y – Information Concerning Activities of Insurer Members of a Holding Company Group 50Schedule Y – Part 2 – Summary of Insurer’s Transactions With Any Affiliates 51Summary Investment Schedule SI011Summary of Operations 4Supplemental Exhibits and Schedules Interrogatories 52
INDEX3
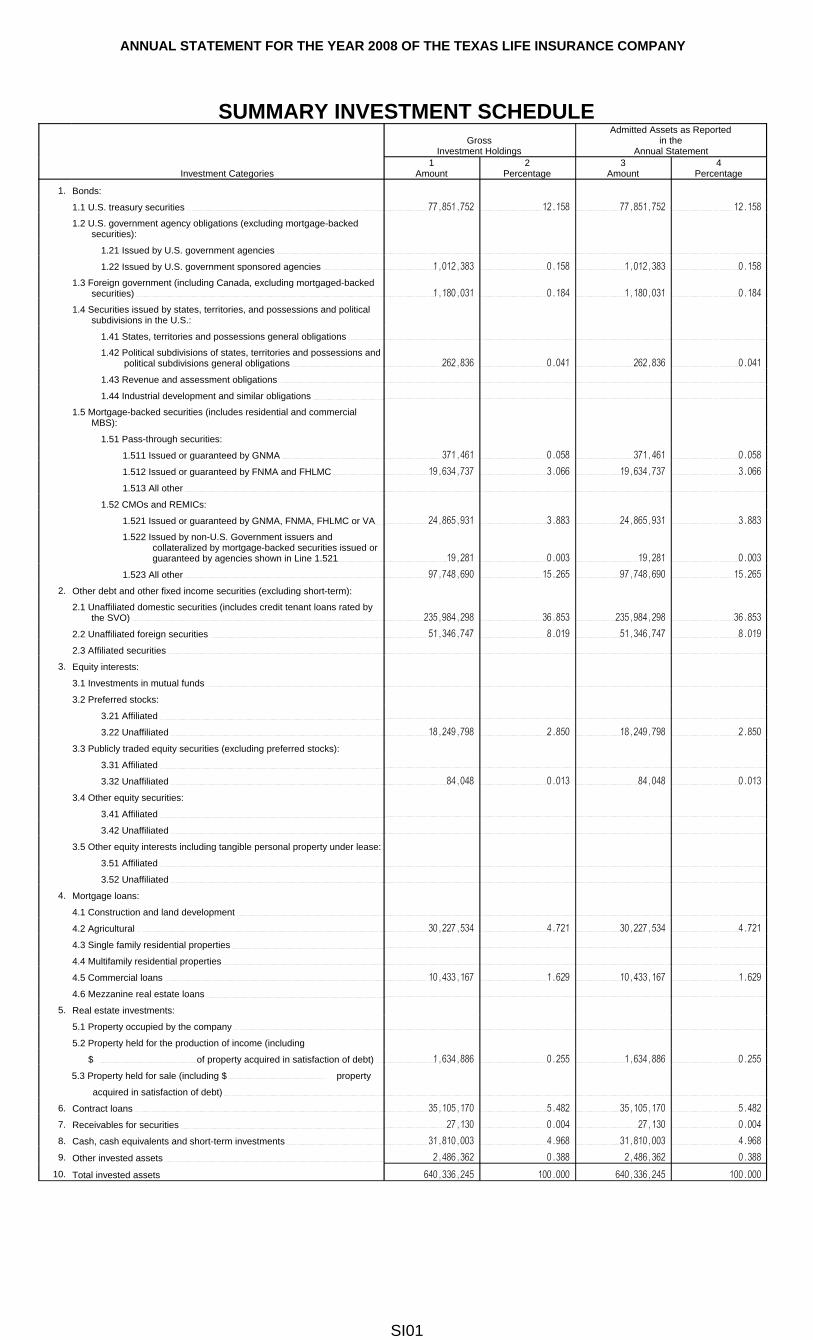
ANNUAL STATEMENT FOR THE YEAR 2008 OF THE TEXAS LIFE INSURANCE COMPANY
SUMMARY INVESTMENT SCHEDULEGross
Investment Holdings
Admitted Assets as Reportedin the
Annual Statement
Investment Categories1
Amount2
Percentage3
Amount4
Percentage
1. Bonds:
1.1 U.S. treasury securities 77,851,752 12.158 77,851,752 12.158
1.2 U.S. government agency obligations (excluding mortgage-backed securities):
1.21 Issued by U.S. government agencies
1.22 Issued by U.S. government sponsored agencies 1,012,383 0.158 1,012,383 0.158
1.3 Foreign government (including Canada, excluding mortgaged-backed securities) 1,180,031 0.184 1,180,031 0.184
1.4 Securities issued by states, territories, and possessions and political subdivisions in the U.S.:
1.41 States, territories and possessions general obligations
1.42 Political subdivisions of states, territories and possessions and political subdivisions general obligations 262,836 0.041 262,836 0.041
1.43 Revenue and assessment obligations
1.44 Industrial development and similar obligations
1.5 Mortgage-backed securities (includes residential and commercial MBS):
1.51 Pass-through securities:
1.511 Issued or guaranteed by GNMA 371,461 0.058 371,461 0.058
1.512 Issued or guaranteed by FNMA and FHLMC 19,634,737 3.066 19,634,737 3.066
1.513 All other
1.52 CMOs and REMICs:
1.521 Issued or guaranteed by GNMA, FNMA, FHLMC or VA 24,865,931 3.883 24,865,931 3.883
1.522 Issued by non-U.S. Government issuers and collateralized by mortgage-backed securities issued or guaranteed by agencies shown in Line 1.521 19,281 0.003 19,281 0.003
1.523 All other 97,748,690 15.265 97,748,690 15.265
2. Other debt and other fixed income securities (excluding short-term):
2.1 Unaffiliated domestic securities (includes credit tenant loans rated by the SVO) 235,984,298 36.853 235,984,298 36.853
2.2 Unaffiliated foreign securities 51,346,747 8.019 51,346,747 8.019
2.3 Affiliated securities
3. Equity interests:
3.1 Investments in mutual funds
3.2 Preferred stocks:
3.21 Affiliated
3.22 Unaffiliated 18,249,798 2.850 18,249,798 2.850
3.3 Publicly traded equity securities (excluding preferred stocks):
3.31 Affiliated
3.32 Unaffiliated 84,048 0.013 84,048 0.013
3.4 Other equity securities:
3.41 Affiliated
3.42 Unaffiliated
3.5 Other equity interests including tangible personal property under lease:
3.51 Affiliated
3.52 Unaffiliated
4. Mortgage loans:
4.1 Construction and land development
4.2 Agricultural 30,227,534 4.721 30,227,534 4.721
4.3 Single family residential properties
4.4 Multifamily residential properties
4.5 Commercial loans 10,433,167 1.629 10,433,167 1.629
4.6 Mezzanine real estate loans
5. Real estate investments:
5.1 Property occupied by the company
5.2 Property held for the production of income (including
$ of property acquired in satisfaction of debt) 1,634,886 0.255 1,634,886 0.255
5.3 Property held for sale (including $ property
acquired in satisfaction of debt)
6. Contract loans 35,105,170 5.482 35,105,170 5.482
7. Receivables for securities 27,130 0.004 27,130 0.004
8. Cash, cash equivalents and short-term investments 31,810,003 4.968 31,810,003 4.968
9. Other invested assets 2,486,362 0.388 2,486,362 0.388
10. Total invested assets 640,336,245 100.000 640,336,245 100.000
SI01

ANNUAL STATEMENT FOR THE YEAR 2008 OF THE TEXAS LIFE INSURANCE COMPANY
SCHEDULE A - VERIFICATION BETWEEN YEARSReal Estate
1. Book/adjusted carrying value, December 31 of prior year 2,386,432
2. Cost of acquired:2.1 Actual cost at time of acquisition (Part 2, Column 6)2.2 Additional investment made after acquisition (Part 2, Column 9) 84,697 84,697
3. Current year change in encumbrances:3.1 Totals, Part 1, Column 133.2 Totals, Part 3, Column 11
4. Total gain (loss) on disposals, Part 3, Column 185. Deduct amounts received on disposals, Part 3, Column 156. Total foreign exchange change in book/adjusted carrying value:
6.1 Totals, Part 1, Column 156.2 Totals, Part 3, Column 13
7. Deduct current year’s other than temporary impairment recognized:7.1 Totals, Part 1, Column 12 453,433
7.2 Totals, Part 3, Column 10 453,433
8. Deduct current year’s depreciation:8.1 Totals, Part 1, Column 11 382,811
8.2 Totals, Part 3, Column 9 382,811
9. Book/adjusted carrying value at the end of current period (Lines 1+2+3+4-5+6-7-8) 1,634,885
10. Deduct total nonadmitted amounts11. Statement value at end of current period (Line 9 minus Line 10) 1,634,885
SCHEDULE B - VERIFICATION BETWEEN YEARSMortgage Loans
1. Book value/recorded investment excluding accrued interest, December 31 of prior year 43,310,271
2. Cost of acquired:2.1 Actual cost at time of acquisition (Part 2, Column 7) 3,218,525
2.2 Additional investment made after acquisition (Part 2, Column 8) 3,218,525
3. Capitalized deferred interest and other:3.1 Totals, Part 1, Column 123.2 Totals, Part 3, Column 11
4. Accrual of discount 3,534
5. Unrealized valuation increase (decrease):5.1 Totals, Part 1, Column 95.2 Totals, Part 3, Column 8 616,577 616,577
6. Total gain (loss) on disposals, Part 3, Column 18 (313,996)
7. Deduct amounts received on disposals, Part 3, Column 15 6,184,270
8. Deduct amortization of premium and mortgage interest points and commitment fees 793
9. Total foreign exchange change in book value/recorded investment excluding accrued interest:9.1 Totals, Part 1, Column 139.2 Totals, Part 3, Column 13
10. Deduct current year’s other than temporary impairment recognized:10.1 Totals, Part 1, Column 1110.2 Totals, Part 3, Column 10
11. Book value/recorded investment excluding accrued interest at end of current period (Lines 1+2+3+4+5+6-7-8+9-10) 40,649,848
12. Total valuation allowance 10,853
13. Subtotal (Line 11 plus Line 12) 40,660,701
14. Deduct total nonadmitted amounts15. Statement value at end of current period (Line 13 minus Line 14) 40,660,701
SI02

ANNUAL STATEMENT FOR THE YEAR 2008 OF THE TEXAS LIFE INSURANCE COMPANY
SCHEDULE BA - VERIFICATION BETWEEN YEARSOther Long-Term Invested Assets
1. Book/adjusted carrying value, December 31 of prior year 2,438,801
2. Cost of acquired:2.1 Actual cost at time of acquisition (Part 2, Column 8) 9,675
2.2 Additional investment made after acquisition (Part 2, Column 9) 9,675
3. Capitalized deferred interest and other:3.1 Totals, Part 1, Column 163.2 Totals, Part 3, Column 12
4. Accrual of discount 2,081
5. Unrealized valuation increase (decrease):5.1 Totals, Part 1, Column 135.2 Totals, Part 3, Column 9
6. Total gain (loss) on disposals, Part 3, Column 197. Deduct amounts received on disposals, Part 3, Column 168. Deduct amortization of premium and depreciation9. Total foreign exchange change in book/adjusted carrying value:
9.1 Totals, Part 1, Column 179.2 Totals, Part 3, Column 14
10. Deduct current year’s other than temporary impairment recognized:10.1 Totals, Part 1, Column 1510.2 Totals, Part 3, Column 11
11. Book/adjusted carrying value at end of current period (Lines 1+2+3+4+5+6-7-8+9-10) 2,450,557
12. Deduct total nonadmitted amounts13. Statement value at end of current period (Line 11 minus Line 12) 2,450,557
SCHEDULE D - VERIFICATION BETWEEN YEARSBonds and Stocks
1. Book /adjusted carrying value, December 31 of prior year 494,779,468
2. Cost of bonds and stocks acquired, Column 7, Part 3 158,044,483
3. Accrual of discount 1,503,630
4. Unrealized valuation increase (decrease):4.1 Column 12, Part 14.2 Column 15, Part 2, Section 14.3 Column 13, Part 2, Section 2 (35,320)
4.4 Column 11, Part 4 306 (35,014)
5. Total gain (loss) on disposals, Column 19, Part 4 (760,665)
6. Deduction consideration for bonds and stocks disposed of, Column 7, Part 4 107,860,164
7. Deduct amortization of premium 579,799
8. Total foreign exchange change in book/adjusted carrying value:8.1 Column 15, Part 18.2 Column 19, Part 2, Section 18.3 Column 16, Part 2, Section 28.4 Column 15, Part 4
9. Deduct current year’s other than temporary impairment recognized:9.1 Column 14, Part 1 16,389,151
9.2 Column 17, Part 2, Section 19.3 Column 14, Part 2, Section 29.4 Column 13, Part 4 90,792 16,479,943
10. Book/adjusted carrying value at end of current period (Lines 1+2+3+4+5-6-7+8-9) 528,611,996
11. Deduct total nonadmitted amounts12. Statement value at end of current period (Line 10 minus Line 11) 528,611,996
SI03
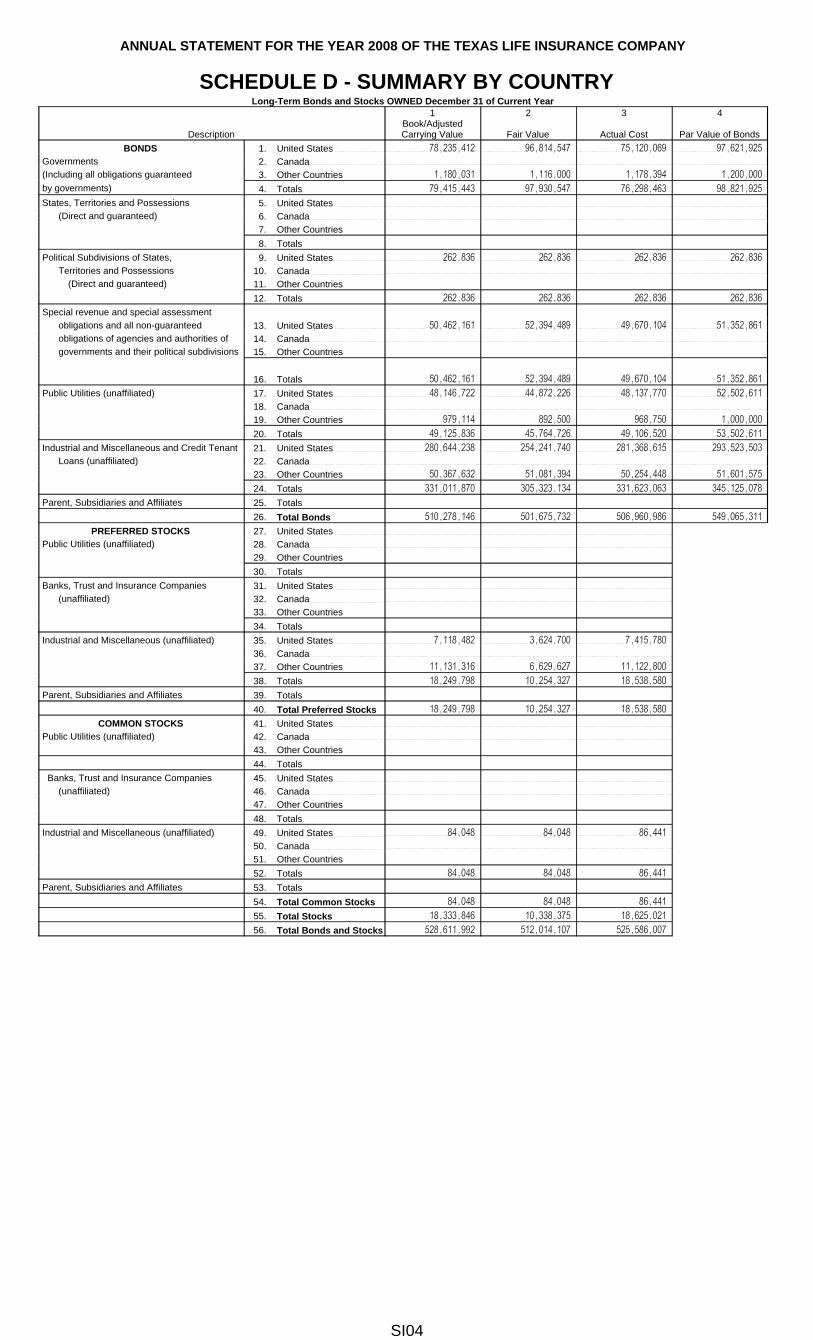
ANNUAL STATEMENT FOR THE YEAR 2008 OF THE TEXAS LIFE INSURANCE COMPANY
SCHEDULE D - SUMMARY BY COUNTRYLong-Term Bonds and Stocks OWNED December 31 of Current Year
Description
1Book/Adjusted Carrying Value
2
Fair Value
3
Actual Cost
4
Par Value of BondsBONDS 1. United States 78,235,412 96,814,547 75,120,069 97,621,925
Governments 2. Canada (Including all obligations guaranteed 3. Other Countries 1,180,031 1,116,000 1,178,394 1,200,000 by governments) 4. Totals 79,415,443 97,930,547 76,298,463 98,821,925
States, Territories and Possessions 5. United States (Direct and guaranteed) 6. Canada
7. Other Countries 8. Totals
Political Subdivisions of States, 9. United States 262,836 262,836 262,836 262,836 Territories and Possessions 10. Canada
(Direct and guaranteed) 11. Other Countries 12. Totals 262,836 262,836 262,836 262,836
Special revenue and special assessmentobligations and all non-guaranteed 13. United States 50,462,161 52,394,489 49,670,104 51,352,861 obligations of agencies and authorities of 14. Canada governments and their political subdivisions 15. Other Countries
16. Totals 50,462,161 52,394,489 49,670,104 51,352,861
Public Utilities (unaffiliated) 17. United States 48,146,722 44,872,226 48,137,770 52,502,611 18. Canada 19. Other Countries 979,114 892,500 968,750 1,000,000
20. Totals 49,125,836 45,764,726 49,106,520 53,502,611
Industrial and Miscellaneous and Credit Tenant 21. United States 280,644,238 254,241,740 281,368,615 293,523,503 Loans (unaffiliated) 22. Canada
23. Other Countries 50,367,632 51,081,394 50,254,448 51,601,575
24. Totals 331,011,870 305,323,134 331,623,063 345,125,078
Parent, Subsidiaries and Affiliates 25. Totals 26. Total Bonds 510,278,146 501,675,732 506,960,986 549,065,311
PREFERRED STOCKS 27. United States Public Utilities (unaffiliated) 28. Canada
29. Other Countries 30. Totals
Banks, Trust and Insurance Companies 31. United States (unaffiliated) 32. Canada
33. Other Countries 34. Totals
Industrial and Miscellaneous (unaffiliated) 35. United States 7,118,482 3,624,700 7,415,780 36. Canada
37. Other Countries 11,131,316 6,629,627 11,122,800
38. Totals 18,249,798 10,254,327 18,538,580
Parent, Subsidiaries and Affiliates 39. Totals 40. Total Preferred Stocks 18,249,798 10,254,327 18,538,580
COMMON STOCKS 41. United States Public Utilities (unaffiliated) 42. Canada
43. Other Countries 44. Totals
Banks, Trust and Insurance Companies 45. United States (unaffiliated) 46. Canada
47. Other Countries 48. Totals
Industrial and Miscellaneous (unaffiliated) 49. United States 84,048 84,048 86,441 50. Canada 51. Other Countries 52. Totals 84,048 84,048 86,441
Parent, Subsidiaries and Affiliates 53. Totals 54. Total Common Stocks 84,048 84,048 86,441
55. Total Stocks 18,333,846 10,338,375 18,625,021
56. Total Bonds and Stocks 528,611,992 512,014,107 525,586,007
SI04

ANNUAL STATEMENT FOR THE YEAR 2008 OF THE TEXAS LIFE INSURANCE COMPANY
SCHEDULE D - PART 1A - SECTION 1Quality and Maturity Distribution of All Bonds Owned December 31, at Book/Adjusted Carrying Values by Major Types of Issues and NAIC Designations
Quality Rating per the NAIC Designation
1
1 Year or Less
2Over 1 Year Through
5 Years
3Over 5 Years Through
10 Years
4Over 10 Years
Through 20 Years
5
Over 20 Years
6
Total Current Year
7Col. 6 as a
% of Line 10.7
8Total from Col. 6
Prior Year
9% From Col. 7
Prior Year
10Total Publicly
Traded
11Total Privately Placed
(a)1. U.S. Governments, (Group 1)
1.1 Class 1 4,278 21,723,075 15,604,613 7,769,865 33,133,581 78,235,412 14.5 39,077,534 7.7 78,235,412 1.2 Class 2 1.3 Class 3 1.4 Class 4 1.5 Class 5 1.6 Class 6 1.7 Totals 4,278 21,723,075 15,604,613 7,769,865 33,133,581 78,235,412 14.5 39,077,534 7.7 78,235,412
2. All Other Governments, (Group 2)2.1 Class 1 2.2 Class 2 2.3 Class 3 1,180,031 1,180,031 0.2 1,835,023 0.4 1,180,031 2.4 Class 4 32,279 0.0 2.5 Class 5 2.6 Class 6 2.7 Totals 1,180,031 1,180,031 0.2 1,867,302 0.4 1,180,031
3. States, Territories and Possessions etc., Guaranteed, (Group 3)3.1 Class 1 3.2 Class 2 3.3 Class 3 3.4 Class 4 3.5 Class 5 3.6 Class 6 3.7 Totals
4. Political Subdivisions of States, Territories and Possessions, Guaranteed, (Group 4)4.1 Class 1 4.2 Class 2 28,470 142,350 92,015 262,835 0.0 286,963 0.1 262,836 4.3 Class 3 4.4 Class 4 4.5 Class 5 4.6 Class 6 4.7 Totals 28,470 142,350 92,015 262,835 0.0 286,963 0.1 262,836
5. Special Revenue & Special Assessment Obligations etc., Non-Guaranteed, (Group 5)5.1 Class 1 4,261,104 10,767,430 11,352,412 11,188,590 12,892,625 50,462,161 9.4 65,560,980 13.0 50,462,161 5.2 Class 2 5.3 Class 3 5.4 Class 4 5.5 Class 5 5.6 Class 6 5.7 Totals 4,261,104 10,767,430 11,352,412 11,188,590 12,892,625 50,462,161 9.4 65,560,980 13.0 50,462,161
SI05

ANNUAL STATEMENT FOR THE YEAR 2008 OF THE TEXAS LIFE INSURANCE COMPANY
SCHEDULE D - PART 1A - SECTION 1 (continued)Quality and Maturity Distribution of All Bonds Owned December 31, at Book/Adjusted Carrying Values by Major Types of Issues and NAIC Designations
Quality Rating per the NAIC Designation
1
1 Year or Less
2Over 1 Year Through
5 Years
3Over 5 Years Through
10 Years
4Over 10 Years
Through 20 Years
5
Over 20 Years
6
Total Current Year
7Col. 6 as a
% of Line 10.7
8Total from Col. 6
Prior Year
9% From Col. 7
Prior Year
10Total Publicly
Traded
11Total Privately Placed
(a)6. Public Utilities (Unaffiliated), (Group 6)
6.1 Class 1 3,793,825 8,343,862 12,137,687 2.3 11,134,410 2.2 12,137,687 6.2 Class 2 192,087 938,939 23,407,530 4,486,096 4,507,111 33,531,763 6.2 28,411,228 5.6 32,013,103 1,518,660 6.3 Class 3 291,147 2,502,432 662,806 3,456,385 0.6 3,392,686 0.7 3,456,385 6.4 Class 4 6.5 Class 5 6.6 Class 6 6.7 Totals 483,234 3,441,371 27,864,161 4,486,096 12,850,973 49,125,835 9.1 42,938,324 8.5 47,607,175 1,518,660
7. Industrial & Miscellaneous (Unaffiliated), (Group 7)7.1 Class 1 39,124,083 100,385,401 79,413,310 24,996,160 23,779,856 267,698,810 49.8 256,987,859 51.0 247,618,142 20,080,667 7.2 Class 2 141,843 25,670,724 30,098,356 7,969,820 9,652,837 73,533,580 13.7 85,849,769 17.0 47,875,285 25,658,294 7.3 Class 3 2,647,771 12,929,789 15,577,560 2.9 9,121,724 1.8 8,512,360 7,065,200 7.4 Class 4 1,604,193 1,604,193 0.3 2,395,541 0.5 1,604,193 7.5 Class 5 214,890 214,890 0.0 203,063 0.0 214,890 7.6 Class 6 95,000 95,000 0.0 95,000 7.7 Totals 39,265,926 128,798,896 124,260,538 32,965,980 33,432,693 358,724,033 66.7 354,557,956 70.3 305,919,870 52,804,161
8. Credit Tenant Loans, (Group 8)8.1 Class 1 8.2 Class 2 8.3 Class 3 8.4 Class 4 8.5 Class 5 8.6 Class 6 8.7 Totals
9. Parent, Subsidiaries and Affiliates, (Group 9)9.1 Class 1 9.2 Class 2 9.3 Class 3 9.4 Class 4 9.5 Class 59.6 Class 6 9.7 Totals
SI06

ANNUAL STATEMENT FOR THE YEAR 2008 OF THE TEXAS LIFE INSURANCE COMPANY
SCHEDULE D - PART 1A - SECTION 1 (continued)Quality and Maturity Distribution of All Bonds Owned December 31, at Book/Adjusted Carrying Values by Major Types of Issues and NAIC Designations
Quality Rating per the NAIC Designation
1
1 Year or Less
2Over 1 Year Through
5 Years
3Over 5 Years Through
10 Years
4Over 10 Years
Through 20 Years
5
Over 20 Years
6
Total Current Year
7Col. 6 as a
% of Line 10.7
8Total from Col. 6
Prior Year
9% From Col. 7
Prior Year
10Total Publicly
Traded
11Total Privately Placed
(a) 10. Total Bonds Current Year10.1 Class 1 (d) 43,389,465 132,875,906 110,164,160 43,954,615 78,149,924 408,534,070 75.9 XXX XXX 388,453,402 20,080,667 10.2 Class 2 (d) 362,400 26,752,013 53,597,901 12,455,916 14,159,948 107,328,178 19.9 XXX XXX 80,151,224 27,176,954 10.3 Class 3 (d) 291,147 5,150,203 13,592,595 1,180,031 20,213,976 3.8 XXX XXX 13,148,776 7,065,200 10.4 Class 4 (d) 1,604,193 1,604,193 0.3 XXX XXX 1,604,193 10.5 Class 5 (d) 214,890 (c) 214,890 0.0 XXX XXX 214,890 10.6 Class 6 (d) 95,000 (c) 95,000 0.0 XXX XXX 95,000 10.7 Totals 44,043,012 164,873,122 179,173,739 57,590,562 92,309,872 (b) 537,990,307 100.0 XXX XXX 483,667,485 54,322,821 10.8 Line 10.7 as a % of Col. 6 8.2 30.6 33.3 10.7 17.2 100.0 XXX XXX XXX 89.9 10.1 11. Total Bonds Prior Year11.1 Class 1 61,173,401 73,166,280 98,889,319 61,814,608 77,717,175 XXX XXX 372,760,783 73.9 355,192,366 17,568,417 11.2 Class 2 6,796,734 18,429,463 60,871,492 9,342,774 19,107,497 XXX XXX 114,547,960 22.7 77,703,752 36,844,209 11.3 Class 3 363,888 3,015,833 9,134,689 1,297,249 537,774 XXX XXX 14,349,433 2.8 11,349,435 3,000,000 11.4 Class 4 847,420 1,577,172 3,228 XXX XXX 2,427,820 0.5 2,427,821 11.5 Class 5 203,063 XXX XXX (c) 203,063 0.0 203,063 11.6 Class 6 XXX XXX (c)
11.7 Totals 68,334,023 95,662,059 170,472,672 72,457,859 97,362,446 XXX XXX (b) 504,289,059 100.0 446,876,437 57,412,626 11.8 Line 11.7 as a % of Col. 8 13.6 19.0 33.8 14.4 19.3 XXX XXX 100.0 XXX 88.6 11.4 12. Total Publicly Traded Bonds12.1 Class 1 40,300,241 123,425,490 106,340,786 40,236,961 78,149,925 388,453,403 72.2 355,192,365 70.4 388,453,403 XXX12.2 Class 2 261,469 13,726,403 42,306,245 11,215,820 12,641,288 80,151,225 14.9 77,703,752 15.4 80,151,225 XXX12.3 Class 3 291,147 3,305,183 8,372,415 1,180,031 13,148,776 2.4 11,349,434 2.3 13,148,776 XXX12.4 Class 4 1,604,193 1,604,193 0.3 2,427,820 0.5 1,604,193 XXX12.5 Class 5 214,890 214,890 0.0 203,063 0.0 214,890 XXX12.6 Class 6 95,000 95,000 0.0 95,000 XXX12.7 Totals 40,852,857 140,552,076 158,838,529 52,632,812 90,791,213 483,667,487 89.9 446,876,434 88.6 483,667,487 XXX12.8 Line 12.7 as a % of Col. 6 8.4 29.1 32.8 10.9 18.8 100.0 XXX XXX XXX 100.0 XXX12.9 Line 12.7 as a % of Line 10.7,
Col. 6, Section 10 7.6 26.1 29.5 9.8 16.9 89.9 XXX XXX XXX 89.9 XXX 13. Total Privately Placed Bonds13.1 Class 1 3,089,223 9,450,416 3,823,375 3,717,653 20,080,667 3.7 17,568,417 3.5 XXX 20,080,667 13.2 Class 2 100,931 13,025,610 11,291,656 1,240,097 1,518,660 27,176,954 5.1 36,844,208 7.3 XXX 27,176,954 13.3 Class 3 1,845,020 5,220,180 7,065,200 1.3 3,000,000 0.6 XXX 7,065,200 13.4 Class 4 XXX13.5 Class 5 XXX13.6 Class 6 XXX13.7 Totals 3,190,154 24,321,046 20,335,211 4,957,750 1,518,660 54,322,821 10.1 57,412,625 11.4 XXX 54,322,821 13.8 Line 13.7 as a % of Col. 6 5.9 44.8 37.4 9.1 2.8 100.0 XXX XXX XXX XXX 100.0 13.9 Line 13.7 as a % of Line 10.7,
Col. 6, Section 10 0.6 4.5 3.8 0.9 0.3 10.1 XXX XXX XXX XXX 10.1 (a) Includes $ freely tradable under SEC Rule 144 or qualified for resale under SEC Rule 144A. (b) Includes $
2,865,690 current year, $ 3,577,064 prior year of bonds with Z designations and $ , current year, $
prior year of bonds with Z* designations. The letter “Z” means the NAIC designation was not assigned by the
Securities Valuation Office (SVO) at the date of the statement. “Z*” means the SVO could not evaluate the obligation because valuation procedures for the security class is under regulatory review. (c) Includes $
current year, $ prior year of bonds with 5* designations and $
, current year, $ prior year of bonds with 6* designations. “5*” means the NAIC designation was assigned by the SVO in
reliance on the insurer’s certification that the issuer is current in all principal and interest payments. “6*” means the NAIC designation was assigned by the SVO due to inadequate certification of principal and interest payments. (d) Includes the following amount of non-rated short-term and cash equivalent bonds by NAIC designation: NAIC 1 $ ; NAIC 2 $ ; NAIC 3 $ ; NAIC 4 $ ; NAIC 5 $ ; NAIC 6 $ .
SI07
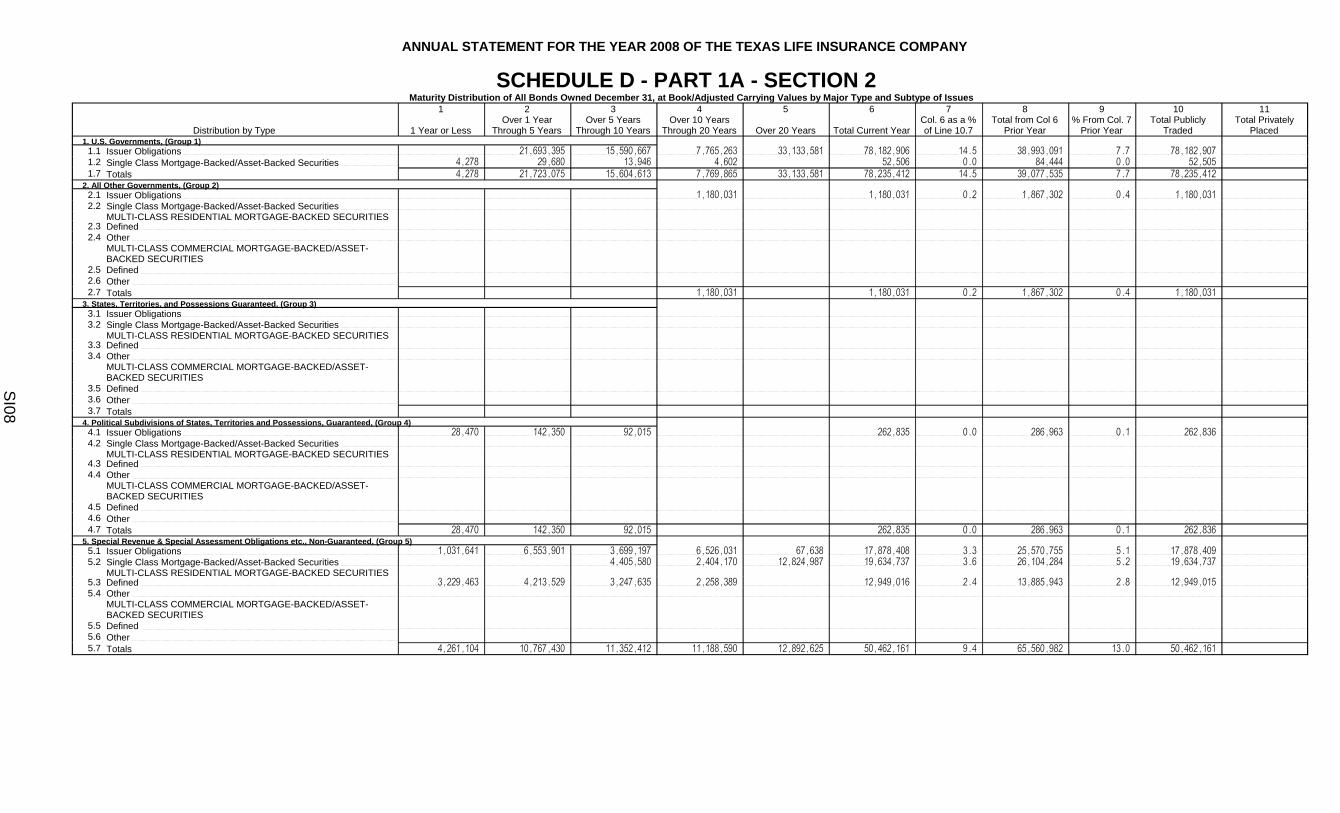
ANNUAL STATEMENT FOR THE YEAR 2008 OF THE TEXAS LIFE INSURANCE COMPANY
SCHEDULE D - PART 1A - SECTION 2Maturity Distribution of All Bonds Owned December 31, at Book/Adjusted Carrying Values by Major Type and Subtype of Issues
Distribution by Type
1
1 Year or Less
2Over 1 Year
Through 5 Years
3Over 5 Years
Through 10 Years
4Over 10 Years
Through 20 Years
5
Over 20 Years
6
Total Current Year
7Col. 6 as a %of Line 10.7
8Total from Col 6
Prior Year
9% From Col. 7
Prior Year
10Total Publicly
Traded
11Total Privately
Placed1. U.S. Governments, (Group 1)
1.1 Issuer Obligations 21,693,395 15,590,667 7,765,263 33,133,581 78,182,906 14.5 38,993,091 7.7 78,182,907 1.2 Single Class Mortgage-Backed/Asset-Backed Securities 4,278 29,680 13,946 4,602 52,506 0.0 84,444 0.0 52,505 1.7 Totals 4,278 21,723,075 15,604,613 7,769,865 33,133,581 78,235,412 14.5 39,077,535 7.7 78,235,412
2. All Other Governments, (Group 2)2.1 Issuer Obligations 1,180,031 1,180,031 0.2 1,867,302 0.4 1,180,031 2.2 Single Class Mortgage-Backed/Asset-Backed Securities
MULTI-CLASS RESIDENTIAL MORTGAGE-BACKED SECURITIES2.3 Defined 2.4 Other
MULTI-CLASS COMMERCIAL MORTGAGE-BACKED/ASSET-BACKED SECURITIES
2.5 Defined 2.6 Other 2.7 Totals 1,180,031 1,180,031 0.2 1,867,302 0.4 1,180,031
3. States, Territories, and Possessions Guaranteed, (Group 3)3.1 Issuer Obligations 3.2 Single Class Mortgage-Backed/Asset-Backed Securities
MULTI-CLASS RESIDENTIAL MORTGAGE-BACKED SECURITIES3.3 Defined 3.4 Other
MULTI-CLASS COMMERCIAL MORTGAGE-BACKED/ASSET-BACKED SECURITIES
3.5 Defined 3.6 Other 3.7 Totals
4. Political Subdivisions of States, Territories and Possessions, Guaranteed, (Group 4)4.1 Issuer Obligations 28,470 142,350 92,015 262,835 0.0 286,963 0.1 262,836 4.2 Single Class Mortgage-Backed/Asset-Backed Securities
MULTI-CLASS RESIDENTIAL MORTGAGE-BACKED SECURITIES4.3 Defined 4.4 Other
MULTI-CLASS COMMERCIAL MORTGAGE-BACKED/ASSET-BACKED SECURITIES
4.5 Defined 4.6 Other 4.7 Totals 28,470 142,350 92,015 262,835 0.0 286,963 0.1 262,836
5. Special Revenue & Special Assessment Obligations etc., Non-Guaranteed, (Group 5)5.1 Issuer Obligations 1,031,641 6,553,901 3,699,197 6,526,031 67,638 17,878,408 3.3 25,570,755 5.1 17,878,409 5.2 Single Class Mortgage-Backed/Asset-Backed Securities 4,405,580 2,404,170 12,824,987 19,634,737 3.6 26,104,284 5.2 19,634,737
MULTI-CLASS RESIDENTIAL MORTGAGE-BACKED SECURITIES5.3 Defined 3,229,463 4,213,529 3,247,635 2,258,389 12,949,016 2.4 13,885,943 2.8 12,949,015 5.4 Other
MULTI-CLASS COMMERCIAL MORTGAGE-BACKED/ASSET-BACKED SECURITIES
5.5 Defined 5.6 Other 5.7 Totals 4,261,104 10,767,430 11,352,412 11,188,590 12,892,625 50,462,161 9.4 65,560,982 13.0 50,462,161
SI08

ANNUAL STATEMENT FOR THE YEAR 2008 OF THE TEXAS LIFE INSURANCE COMPANY
SCHEDULE D - PART 1A - SECTION 2 (continued)Maturity Distribution of All Bonds Owned December 31, at Book/Adjusted Carrying Values by Major Type and Subtype of Issues
Distribution by Type
1
1 Year or Less
2Over 1 Year Through
5 Years
3Over 5 Years
Through 10 Years
4Over 10 Years
Through 20 Years
5
Over 20 Years
6
Total Current Year
7Col. 6 as a
% of Line 10.7
8Total from Col. 6
Prior Year
9% From Col. 7
Prior Year
10Total Publicly
Traded
11Total Privately
Placed6. Public Utilities (Unaffiliated), (Group 6)
6.1 Issuer Obligations 483,235 3,441,371 27,864,161 4,486,096 12,850,974 49,125,837 9.1 42,938,325 8.5 47,607,176 1,518,660 6.2 Single Class Mortgage-Backed/Asset-Based
Securities MULTI-CLASS RESIDENTIAL MORTGAGE-BACKED SECURITIES
6.3 Defined 6.4 Other
MULTI-CLASS COMMERCIAL MORTGAGE-BACKED/ASSET-BACKED SECURITIES
6.5 Defined 6.6 Other 6.7 Totals 483,235 3,441,371 27,864,161 4,486,096 12,850,974 49,125,837 9.1 42,938,325 8.5 47,607,176 1,518,660
7. Industrial & Miscellaneous (Unaffiliated), (Group 7)7.1 Issuer Obligations 32,883,703 64,386,125 73,935,383 26,463,381 31,209,825 228,878,417 42.5 233,126,010 46.2 177,869,880 51,008,536 7.2 Single Class Mortgage-Backed/Asset-Based
Securities 8,350 17,725,182 1,803 17,735,335 3.3 2,019,695 0.4 17,735,335 MULTI-CLASS RESIDENTIAL MORTGAGE-BACKED SECURITIES
7.3 Defined 961,337 7,525,761 40,127,584 5,601,872 2,222,869 56,439,423 10.5 59,315,561 11.8 56,439,423 7.4 Other 200,923 15,369,942 15,570,865 2.9 12,047,151 2.4 15,570,865
MULTI-CLASS COMMERCIAL MORTGAGE-BACKED/ASSET-BACKED SECURITIES
7.5 Defined 4,253,353 10,794,677 5,253,689 900,727 21,202,446 3.9 24,168,507 4.8 21,202,446 7.6 Other 958,259 12,997,209 4,942,077 18,897,545 3.5 23,881,032 4.7 17,101,920 1,795,625 7.7 Totals 39,265,925 128,798,896 124,260,536 32,965,980 33,432,694 358,724,031 66.7 354,557,956 70.3 305,919,869 52,804,161
8. Credit Tenant Loans, (Group 8)8.1 Issuer Obligations 8.7 Totals
9. Parents, Subsidiaries and Affiliates, (Group 9) 9.1 Issuer Obligations 9.2 Single Class Mortgage-Backed/Asset-Based
Securities MULTI-CLASS RESIDENTIAL MORTGAGE-BACKED SECURITIES
9.3 Defined 9.4 Other
MULTI-CLASS COMMERCIAL MORTGAGE-BACKED/ASSET-BACKED SECURITIES
9.5 Defined 9.6 Other 9.7 Totals
SI09

ANNUAL STATEMENT FOR THE YEAR 2008 OF THE TEXAS LIFE INSURANCE COMPANY
SCHEDULE D - PART 1A - SECTION 2 (continued)Maturity Distribution of All Bonds Owned December 31, at Book/Adjusted Carrying Values by Major Type and Subtype of Issues
Distribution by Type
1
1 Year or Less
2Over 1 Year
Through 5 Years
3Over 5 Years
Through 10 Years
4Over 10 Years
Through 20 Years
5
Over 20 Years
6Total
Current Year
7Col. 6 as a %of Line 10.7
8Total From Col. 6
Prior Year
9% From Col. 7
Prior Year
10Total Publicly
Traded
11Total Privately
Placed10. Total Bonds Current Year10.1 Issuer Obligations 34,427,049 96,217,142 121,181,423 46,420,802 77,262,018 375,508,434 69.8 XXX XXX 322,981,239 52,527,196 10.2 Single Class Mortgage-Backed/Asset-Backed Securities 12,628 17,754,862 4,421,329 2,408,772 12,824,987 37,422,578 7.0 XXX XXX 37,422,577
MULTI-CLASS RESIDENTIAL MORTGAGE-BACKED SECURITIES10.3 Defined 4,190,800 11,739,290 43,375,219 7,860,261 2,222,869 69,388,439 12.9 XXX XXX 69,388,438 10.4 Other 200,923 15,369,942 15,570,865 2.9 XXX XXX 15,570,865
MULTI-CLASS COMMERCIAL MORTGAGE-BACKED/ASSET-BACKED SECURITIES10.5 Defined 4,253,353 10,794,677 5,253,689 900,727 21,202,446 3.9 XXX XXX 21,202,446 10.6 Other 958,259 12,997,209 4,942,077 18,897,545 3.5 XXX XXX 17,101,920 1,795,625 10.7 Totals 44,043,012 164,873,122 179,173,737 57,590,562 92,309,874 537,990,307 100.0 XXX XXX 483,667,485 54,322,821 10.8 Line 10.7 as a % of Col. 6 8.2 30.6 33.3 10.7 17.2 100.0 XXX XXX XXX 89.9 10.1
11. Total Bonds Prior Year11.1 Issuer Obligations 42,533,438 64,339,471 112,681,037 46,410,905 76,817,595 XXX XXX 342,782,446 68.0 285,369,819 57,412,626 11.2 Single Class Mortgage-Backed/Asset-Backed Securities 5,668 20,976 2,025,180 10,610,155 15,546,444 XXX XXX 28,208,423 5.6 28,208,422
MULTI-CLASS RESIDENTIAL MORTGAGE-BACKED SECURITIES11.3 Defined 3,502,818 10,757,004 39,965,385 13,977,890 4,998,407 XXX XXX 73,201,504 14.5 73,201,504 11.4 Other 307,953 2,752,043 8,987,155 XXX XXX 12,047,151 2.4 12,047,151
MULTI-CLASS COMMERCIAL MORTGAGE-BACKED/ASSET-BACKED SECURITIES11.5 Defined 10,251,648 6,124,788 6,333,160 1,458,911 XXX XXX 24,168,507 4.8 24,168,507 11.6 Other 11,732,497 11,667,779 480,756 XXX XXX 23,881,032 4.7 23,881,031 11.7 Totals 68,334,022 95,662,061 170,472,673 72,457,861 97,362,446 XXX XXX 504,289,063 100.0 446,876,434 57,412,626 11.8 Line 11.7 as a % of Col. 8 13.6 19.0 33.8 14.4 19.3 XXX XXX 100.0 XXX 88.6 11.4
12. Total Publicly Traded Bonds12.1 Issuer Obligations 31,793,208 73,135,407 100,846,213 41,463,052 75,743,358 322,981,238 60.0 285,369,820 56.6 322,981,238 XXX12.2 Single Class Mortgage-Backed/Asset-Backed Securities 12,628 17,754,861 4,421,330 2,408,772 12,824,987 37,422,578 7.0 28,208,422 5.6 37,422,578 XXX
MULTI-CLASS RESIDENTIAL MORTGAGE-BACKED SECURITIES12.3 Defined 4,190,800 11,739,290 43,375,218 7,860,261 2,222,869 69,388,438 12.9 73,201,504 14.5 69,388,438 XXX12.4 Other 200,923 15,369,942 15,570,865 2.9 12,047,151 2.4 15,570,865 XXX
MULTI-CLASS COMMERCIAL MORTGAGE-BACKED/ASSET-BACKED SECURITIES12.5 Defined 4,253,353 10,794,677 5,253,689 900,727 21,202,446 3.9 24,168,507 4.8 21,202,446 XXX12.6 Other 401,945 11,757,899 4,942,077 17,101,921 3.2 23,881,032 4.7 17,101,921 XXX12.7 Totals 40,852,857 140,552,076 158,838,527 52,632,812 90,791,214 483,667,486 89.9 446,876,436 88.6 483,667,486 XXX12.8 Line 12.7 as a % of Col. 6 8.4 29.1 32.8 10.9 18.8 100.0 XXX XXX XXX 100.0 XXX12.9 Line 12.7 as a % of Line 10.7, Col. 6, Section 10 7.6 26.1 29.5 9.8 16.9 89.9 XXX XXX XXX 89.9 XXX
13. Total Privately Placed Bonds13.1 Issuer Obligations 2,633,840 23,081,736 20,335,211 4,957,750 1,518,660 52,527,197 9.8 57,412,625 11.4 XXX 52,527,197 13.2 Single Class Mortgage-Backed/Asset-Backed Securities XXX
MULTI-CLASS RESIDENTIAL MORTGAGE-BACKED SECURITIES13.3 Defined XXX13.4 Other XXX
MULTI-CLASS COMMERCIAL MORTGAGE-BACKED/ASSET-BACKED SECURITIES13.5 Defined XXX13.6 Other 556,314 1,239,310 1,795,624 0.3 XXX 1,795,624 13.7 Totals 3,190,154 24,321,046 20,335,211 4,957,750 1,518,660 54,322,821 10.1 57,412,625 11.4 XXX 54,322,821 13.8 Line 13.7 as a % of Col. 6 5.9 44.8 37.4 9.1 2.8 100.0 XXX XXX XXX XXX 100.0 13.9 Line 13.7 as a % of Line 10.7, Col. 6, Section 10 0.6 4.5 3.8 0.9 0.3 10.1 XXX XXX XXX XXX 10.1
SI10

ANNUAL STATEMENT FOR THE YEAR 2008 OF THE TEXAS LIFE INSURANCE COMPANY
SCHEDULE DA - VERIFICATION BETWEEN YEARSShort-Term Investments
1
Total
2
Bonds
3
Mortgage Loans
4
Other Short-term Investment Assets(a)
5
Investments in Parent, Subsidiaries and Affiliates
1. Book/adjusted carrying value, December 31 of prior year 28,870,352 28,870,352
2. Cost of short-term investments acquired 116,858,213 116,858,213
3. Accrual of discount
4. Unrealized valuation increase (decrease)
5. Total gain (loss) on disposals
6. Deduct consideration received on disposals 118,016,404 118,016,404
7. Deduct amortization of premium
8. Total foreign exchange change in book/adjusted carrying value
9. Deduct current year’s other than temporary impairment recognized
10. Book adjusted carrying value at end of current period (Lines 1+2+3+4+5-6-7+8-9) 27,712,161 27,712,161
11. Deduct total nonadmitted amounts
12. Statement value at end of current period (Line 10 minus Line 11) 27,712,161 27,712,161
(a) Indicate the category of such assets, for example, joint ventures, transportation equipment:
SI11

ANNUAL STATEMENT FOR THE YEAR 2008 OF THE TEXAS LIFE INSURANCE COMPANY
Schedule DB - Part A - VBY
NONESchedule DB - Part B - VBY
NONESchedule DB - Part C - VBY
NONESchedule DB - Part D - VBY
NONESchedule DB - Part E - VBY
NONESchedule DB - Part F - Section 1
NONESchedule DB - Part F - Section 2
NONESchedule E - Verification
NONE
SI12, SI13, SI14, SI15, SI16

ANNUAL STATEMENT FOR THE YEAR 2008 OF THE TEXAS LIFE INSURANCE COMPANY
SCHEDULE A - PART 1Showing All Real Estate OWNED December 31 of Current Year
1 2 Location 5 6 7 8 9 10 Change in Book/Adjusted Carrying Value Less Encumbrances 16 17
DescriptionOf
Property Code
3
City
4
StateDate
Acquired
Dateof
LastAppraisal
ActualCost
Amountof
Encumbrances
Book/Adjusted Carrying Value
LessEncumbrances
Fair ValueLess
Encumbrances
11
Current Year’sDepreciation
12Current Year’s
Other ThanTemporaryImpairmentRecognized
13
Current Year’sChanges in
Encumbrances
14
TotalChange inB./A. C. V.
(13 - 11 - 12)
15
Total ForeignExchangeChange inB./A. C. V.
Gross Income Earned Less
InterestIncurred on
Encumbrances
Taxes,Repairs,
andExpensesIncurred
Home Office Bldg & Adjacent Properties Waco TX 01/01/1972 11/15/2007 8,944,224 1,634,886 1,634,886 382,811 453,433 (836,244) 1,063,522 942,642 0499999 - Properties held for the production of income 8,944,224 1,634,886 1,634,886 382,811 453,433 (836,244) 1,063,522 942,642
0699999 Totals 8,944,224 1,634,886 1,634,886 382,811 453,433 (836,244) 1,063,522 942,642
E01

ANNUAL STATEMENT FOR THE YEAR 2008 OF THE TEXAS LIFE INSURANCE COMPANY
SCHEDULE A - PART 2Showing All Real Estate ACQUIRED and Additions Made During the Year
1Location
4 5 6 7 8 9
Description of Property
2
City
3
StateDate
Acquired Name of Vendor
Actual Costat
Time of Acquisition Amount of EncumbrancesBook/Adjusted Carrying
Value Less Encumbrances
Additional InvestmentMade AfterAcquisition
Home Office Bldg & Adjacent Properties Waco TX 01/01/1972 Various 84,697 0199999 - Acquired by purchase 84,697
0399999 - Totals 84,697
E02

ANNUAL STATEMENT FOR THE YEAR 2008 OF THE TEXAS LIFE INSURANCE COMPANY
SCHEDULE A - PART 3Showing All Real Estate DISPOSED During the Year, Including Payments During the Final Year on “Sales Under Contract”
1 Location 4 5 6 7 8 Change in Book/Adjusted Carrying Value Less Encumbrances 14 15 16 17 18 19 20
DescriptionOf
Property
2
City
3
StateDisposal
Date
Nameof
PurchaserActualCost
Expendedfor Additions, Permanent
Improvements and Changes in Encumbrances
Book/AdjustedCarrying Value
Less Encumbrances
Prior Year
9
Current Year’s Depreciation
10Current Year’s
Other Than Temporary Impairment Recognized
11
Current Year’s Change in
Encumbrances
12
Total Change in B./A.C.V.(11-9-10)
13
Total Foreign Exchange Change in B./A.C.V.
Book/Adjusted Carrying Value
LessEncumbrances
Amounts Received
DuringYear
Foreign Exchange
Gain(Loss)
OnDisposal
RealizedGain
(Loss)On
Disposal
TotalGain
(Loss)On
Disposal
Gross IncomeEarned
Less InterestIncurred on
Encumbrances
Taxes,Repairs
AndExpenses Incurred
0399999 Total
E03
NONE

ANNUAL STATEMENT FOR THE YEAR 2008 OF THE TEXAS LIFE INSURANCE COMPANY
SCHEDULE B - PART 1Showing All Mortgage Loans OWNED December 31 of Current Year
1 2 Location 5 6 7 8 Change in Book Value/Recorded Investment 14 15
LoanNumber Code
3
City
4
StateLoanType
DateAcquired
RateOf
Interest
Book Value/RecordedInvestmentExcluding
Accrued Interest
9
UnrealizedValuationIncrease
(Decrease)
10
Current Year’s(Amortization)/
Accretion
11
Current Year’sOther thanTemporaryImpairmentRecognized
12
CapitalizedDeferred
Interest andOther
13Total
ForeignExchangeChange
inBook Value
ValueOf
LandAnd
Buildings
Date ofLast
AppraisalOr
Valuation110 McLean County IL 02/05/1993 5.400 195,900 659,200 08/16/2000113 Fresno County CA 04/30/1993 5.058 217,750 1,077,000 07/28/1998124 Tazewell County IL 11/24/1993 6.350 122,500 198,200 04/04/2003126 Benton County IA 12/23/1993 6.500 155,500 609,800 09/14/2000133 Fresno County CA 02/14/1994 5.700 242,000 1,017,000 07/14/1999138 Stanislaus County CA 01/31/1994 5.950 91,111 1,184,250 12/15/1993143 Fresno County CA 05/10/1994 5.700 179,145 960,000 01/07/2000148 Iroquois County IL 02/06/1998 7.550 397,800 1,053,500 07/20/2004152 Finney County KS 05/01/1998 8.000 240,321 786,714 09/04/2004151 Iroquois County IL 04/30/1998 7.400 242,000 1,484,700 07/20/2004153 Kane County IL 05/05/1998 7.250 488,000 1,228,664 12/10/2004156 Kings County CA 06/15/1997 5.100 665,000 2,149,000 07/22/2001159 Jackson/Cottonwood MN 07/23/1998 7.500 235,200 936,550 03/22/2004158 Kings County CA 07/23/1998 7.460 455,000 1,070,100 01/17/1998161 Logan County IL 10/23/1998 6.750 210,000 520,800 09/10/1998164 Macoupin County IL 11/10/1998 6.500 224,500 505,200 07/15/2004166 Tulare County CA 11/12/1998 5.360 325,000 2,377,500 09/03/1999168 Adams County NE 12/30/1998 6.900 70,000 850,875 08/16/2002172 Humphreys County MS 02/23/1999 6.900 206,500 358,750 06/27/2007178 Mississipi County AR 04/20/1999 7.650 209,000 472,500 03/12/1999177 Fresno County CA 04/15/1999 6.800 358,400 1,269,000 09/19/2003180 Marshall County IL 06/08/1999 5.800 142,964 448,800 11/17/2005181 Polk County NE 06/16/1999 7.375 218,928 527,750 07/25/2002183 Cottonwood County MN 07/16/1999 7.100 318,000 809,200 03/08/2005186 Fresno County CA 01/10/2000 5.150 578,323 1,920,000 09/16/2003191 Clay County NE 07/10/2000 6.250 266,107 655,500 05/15/2000197 Daviess County IN 02/09/2001 7.750 208,000 613,400 12/18/2000198 Kossuth; Palo Alto IA 03/05/2001 5.550 282,500 638,800 01/19/2004200 San Joaquin & Sacr CA 03/22/2001 6.300 516,000 1,984,050 07/06/2005199 Fresno County CA 03/19/2001 8.070 724,800 2,012,800 04/04/2007204 Chase County NE 05/23/2001 7.000 373,127 861,250 07/09/2008140 Floyd County IA 04/14/1994 6.700 676,000 1,683,100 02/07/2003209 LaSalle County IL 05/24/2003 6.400 65,536 1,036,900 10/08/2002210 Holt County MO 08/18/2003 6.625 305,000 1,003,250 06/18/2003211 Buffalo County NE 09/17/2003 6.250 616,310 1,498,300 06/17/2003212 Poinsett County AR 09/19/2003 5.050 383,042 1,839,600 05/20/2003213 Poinsett County AR 09/19/2003 5.050 1,204,910 3,195,000 09/15/2003207 Madison and Platte NE 08/25/2003 5.750 540,638 1,163,875 06/26/2003217 Clay County AR 01/01/2004 5.350 234,505 630,300 09/25/2006218 Franklin County WA 06/15/2004 5.422 1,162,500 2,331,998 09/25/2006219 Woodruff County AR 09/08/2004 6.500 270,366 679,250 07/19/2004220 Logan County CO 09/29/2004 5.850 1,120,414 2,219,100 05/18/2005221 Washington County MS 10/01/2004 5.550 387,011 1,785,100 08/19/2004222 Clay County NE 12/07/2004 5.900 580,384 1,273,000 10/15/2004224 Blue Earth County MN 12/09/2004 5.500 300,000 806,350 08/18/2004225 Twin Falls County ID 12/09/2004 6.900 493,862 1,427,500 05/18/2004228 Fresno County CA 12/17/2004 5.410 1,544,791 3,815,000 06/26/2007229 Fresno County CA 12/23/2004 5.410 966,619 1,790,313 09/29/2006227 Dunklin County MO 12/31/2004 5.900 721,756 1,477,500 08/20/2004230 Sharkey County MS 02/11/2005 5.650 506,655 1,529,800 09/07/2004234 Christian County IL 01/13/2006 5.750 560,000 1,110,500 12/14/2005235 Montgomery County IL 01/17/2006 5.500 790,890 1,344,200 09/30/2005236 Clay County NE 04/19/2006 6.750 1,127,400 2,657,270 03/09/2006237 Livingston County IL 03/13/2006 5.850 1,421,536 2,854,850 02/01/2006238 Yuma County CO 06/14/2007 6.750 1,934,542 3,465,400 03/06/2007239 Macoupin County IL 04/03/2008 6.150 1,424,570 2,445,200 03/05/2008240 Cass County NE 07/03/2008 5.750 1,768,166 4,396,325 04/23/2008
E04

ANNUAL STATEMENT FOR THE YEAR 2008 OF THE TEXAS LIFE INSURANCE COMPANY
SCHEDULE B - PART 1Showing All Mortgage Loans OWNED December 31 of Current Year
1 2 Location 5 6 7 8 Change in Book Value/Recorded Investment 14 15
LoanNumber Code
3
City
4
StateLoanType
DateAcquired
RateOf
Interest
Book Value/RecordedInvestmentExcluding
Accrued Interest
9
UnrealizedValuationIncrease
(Decrease)
10
Current Year’s(Amortization)/
Accretion
11
Current Year’sOther thanTemporaryImpairmentRecognized
12
CapitalizedDeferred
Interest andOther
13Total
ForeignExchangeChange
inBook Value
ValueOf
LandAnd
Buildings
Date ofLast
AppraisalOr
Valuation 0199999 - Mortgages in good standing - Farm Mortgages 30,266,780 80,699,834 XXX
2000 New York NY 05/24/2004 5.691 1,000,000 2,007,629 12/15/20082001 Dallas TX 06/10/2004 5.120 2,000,019 2,855,946 07/01/20082004 Fremont CA 07/08/2004 6.090 793,092 1,649,868 12/16/20082005 Houston TX 08/27/2004 5.520 2,989,928 6,265,835 11/01/20072008 Los Angeles CA 10/04/2007 6.010 833,332 1,256,154 10/01/20072009 Los Angeles CA 10/04/2007 6.010 833,332 1,256,154 10/01/20072010 Los Angeles CA 10/04/2007 6.010 833,332 1,256,154 10/01/20079016 Austin TX 12/31/1998 8.000 1,150,131 3,472,000 08/01/2003 0599999 - Mortgages in good standing - Commercial Mortgages - All Other 10,433,166 20,019,739 XXX 0899999 - Total - Mortgages in Good Standing 40,699,946 100,719,573 XXX 1099999 - Restructured mortgages - Residential Mortgages - Insured or Guaranteed XXX 1199999 - Restructured mortgages - Residential Mortgages - All Other XXX 1299999 - Restructured mortgages - Commercial Mortgages - Insured or Guaranteed XXX 1399999 - Restructured mortgages - Commercial Mortgages - All Other XXX 1499999 - Restructured mortgages - Mezzainie Loans XXX 1599999 - Restructured mortgages not shown in Lines 0999999 thru 1499999 XXX 1699999 - Total - Restructured Mortgages XXX 1799999 - Mortgages with overdue interest over 90 days - Farm Mortgages XXX 1899999 - Mortgages with overdue interest over 90 days - Residential Mortgages - Insured or Guaranteed XXX 1999999 - Mortgages with overdue interest over 90 days - Residential Mortgages - All Other XXX 2099999 - Mortgages with overdue interest over 90 days - Commercial Mortgages - Insured or Guaranteed XXX 2199999 - Mortgages with overdue interest over 90 days - Commercial Mortgages - All Other XXX 2299999 - Mortgages with overdue interest over 90 days - Mezzanine Loans XXX 2399999 - Mortgages with overdue interest over 90 days not shown in Lines 1799999 thru 2299999 XXX 2499999 - Total - Mortgages w/overdue interest over 90 days, not in the process of foreclosure XXX 2599999 - Mortgages in the process of foreclosure - Farm Mortgages XXX 2699999 - Mortgages in the process of foreclosure - Residential - Insured or Guaranteed XXX 2799999 - Mortgages in the process of foreclosure - Residential - All Other XXX 2899999 - Mortgages in the process of foreclosure - Commercial Mortgages - Insured or Guaranteed XXX 2999999 - Mortgages in the process of foreclosure - Commercial Mortgages - All Other XXX 3099999 - Mortgages in the process of foreclosure -Mezzanine Loans XXX 3199999 - Mortgages in the process of foreclosure not shown on Lines 2599999 thru 3099999 XXX 3299999 - Total - Mortgages in the process of foreclosure XXX3399999 Totals 40,699,946 100,719,573 XXX
General Interrogatory:1. Mortgages in good standing $ unpaid taxes $ interest due and unpaid.2. Restructured mortgages $ unpaid taxes $ interest due and unpaid.3. Mortgages with overdue interest over 90 days not in process of foreclosure $ unpaid taxes $ interest due and unpaid.4. Mortgages in process of foreclosure $ unpaid taxes $ interest due and unpaid.
E04.1

ANNUAL STATEMENT FOR THE YEAR 2008 OF THE TEXAS LIFE INSURANCE COMPANY
SCHEDULE B - PART 2Showing All Mortgage Loans ACQUIRED During the Current Year
1 Location 4 5 6 7 8 9
Loan Number
2
City
3
State Loan Type Date Acquired Rate of InterestActual Cost at Time of
AcquisitionAdditional Investment Made
after Acquisitions Value of Land and Buildings239 Macoupin County IL 04/03/2008 6.150 1,433,000 2,445,200 240 Cass County NE 07/03/2008 5.750 1,785,525 4,396,325 0199999 - Mortgages in good standing - Farm Mortgages 3,218,525 6,841,525 0899999 - Total - Mortgages in Good Standing 3,218,525 6,841,525 1099999 - Restructured mortgages - Residential Mortgages - Insured or Guaranteed1199999 - Restructured mortgages - Residential Mortgages - All Other1299999 - Restructured mortgages - Commercial Mortgages - Insured or Guaranteed1399999 - Restructured mortgages - Commercial Mortgages - All Other1499999 - Restructured mortgages - Mezzanine Loans1599999 - Restructured mortgages not shown in Lines 0999999 thru 14999991699999 - Total - Restructured Mortgages1799999 - Mortgages with overdue interest over 90 days - Farm Mortgages1899999 - Mortgages with overdue interest over 90 days - Residential Mortgages - Insured or Guaranteed1999999 - Mortgages with overdue interest over 90 days - Residential Mortgages - All Other2099999 - Mortgages with overdue interest over 90 days - Commercial Mortgages - Insured or Guaranteed2199999 - Mortgages with overdue interest over 90 days - Commercial Mortgages - All Other2299999 - Mortgages with overdue interest over 90 days - Mezzanine Loans2399999 - Mortgages with overdue interest over 90 days not shown in Lines 1799999 thru 22999992499999 - Total - Mortgages w/overdue interest over 90 days, not in the process of foreclosure2599999 - Mortgages in the process of foreclosure - Farm Mortgages2699999 - Mortgages in the process of foreclosure - Residential - Insured or Guaranteed2799999 - Mortgages in the process of foreclosure - Residential - All Other2899999 - Mortgages in the process of foreclosure - Commercial Mortgages - Insured or Guaranteed2999999 - Mortgages in the process of foreclosure - Commercial Mortgages - All Other3099999 - Mortgages in the process of foreclosure -Mezzanine Loans3199999 - Mortgages in the process of foreclosure not shown on Lines 2299999 thru 26999993299999 - Total - Mortgages in the process of foreclosure3399999 Totals 3,218,525 6,841,525
E05

ANNUAL STATEMENT FOR THE YEAR 2008 OF THE TEXAS LIFE INSURANCE COMPANY
SCHEDULE B - PART 3Showing All Mortgage Loans DISPOSED, Transferred or Repaid During the Current Year
1 Location 4 5 6 7 Change in Book Value/Recorded Investment 14 15 16 17 18
LoanNumber
2
City
3
StateLoanType
DateAcquired
Disposal Date
Book Value/Recorded
Investment Excluding Accrued Interest Prior Year
8
UnrealizedValuationIncrease
(Decrease)
9
Current Year’s (Amortization)/
Accretion
10
Current Year’s Other Than Temporary Impairment Recognized
11
Capitalized Deferred Interest
and Other
12
Total Change in Book Value (8+9-10+11)
13
Total Foreign Exchange Change
in Book Value
Book Value/Recorded
InvestmentExcludingAccruedInterest
on Disposal Consideration
ForeignExchange
Gain(Loss) onDisposal
Realized Gain(Loss) onDisposal
TotalGain
(Loss) onDisposal
109 Duplin County NC 01/31/1993 03/31/2008 116,800 116,800 116,800 174 Macoupin County IL 03/15/1999 04/04/2008 240,581 240,581 240,581 2006 Southfield MI 09/14/2004 05/12/2008 1,312,006 616,577 616,577 1,652,617 1,652,617 (313,996) (313,996)114 Fresno County CA 04/30/1993 05/09/2005 239,750 217,750 217,750 109 Christian County IL 01/25/2002 05/15/2008 116,800 110,992 110,992 223 Cass County NE 12/15/2004 07/03/2008 1,535,981 1,524,173 1,524,173 215 Chase County NE 09/03/2003 09/04/2008 409,084 409,084 409,084
0199999 - Mortgages closed by repayment3,971,002 616,577 616,577 4,271,997 4,271,997 (313,996) (313,996)
110 McLean County IL 02/05/1993 195,900 22,900 113 Fresno County CA 04/30/1993 217,750 22,000 114 Fresno County CA 04/30/1993 239,750 22,000 124 Tazewell County IL 11/24/1993 122,500 4,000 126 Benton County IA 12/23/1993 155,500 11,794 133 Fresno County CA 02/14/1994 242,000 22,000 138 Stanislaus County CA 01/31/1994 91,111 65,819 140 Floyd County IA 04/14/1994 676,000 10,000 148 Iroquois County IL 02/06/1998 397,800 14,000 151 Iroquois County IL 04/30/1998 242,000 15,978 152 Finney County KS 05/01/1998 240,321 14,260 156 Kings County CA 06/15/1998 665,000 35,000
159Jackson/Cottonwood Counties MN 07/23/1998 235,200 158,400
161 Logan County IL 10/23/1998 210,000 9,000 166 Tulare County CA 11/12/1998 325,000 32,500 168 Adams County NE 12/30/1998 70,000 133,000 172 Humphreys County MS 02/23/1999 206,500 6,500 178 Mississippi County AR 04/20/1999 209,000 9,000 180 Marshall County IL 06/08/1999 142,964 6,036 181 Polk County NE 06/16/1999 218,928 12,556 191 Clay County NE 07/10/2000 266,107 16,179 197 Daviess County IN 02/09/2001 208,000 66,940
198Kossuth/Palo Alto Counties IA 03/05/2001 282,500 198,847
199 Fresno County CA 03/19/2001 724,800 101,695
200San Joaquin/Sacr Counties CA 03/22/2001 516,000 73,000
204 Chase County NE 05/23/2001 373,127 119,982 207 Madison/Platte Counties NE 08/25/2003 540,638 62,131 209 LaSalle County IL 05/24/2003 65,536 16,384 210 Holt County MO 08/18/2003 305,000 9,000 212 Poinsett County AR 09/19/2003 383,042 128,242 213 Poinsett County AR 09/19/2003 1,204,910 22,059 217 Clay County AR 01/01/2004 234,505 26,808 219 Woodruff County AR 09/08/2004 270,366 94,000 220 Logan County CO 09/29/2004 1,120,414 63,296 222 Clay County NE 12/07/2004 580,384 35,308 234 Christian County IL 01/13/2006 560,000 15,000 235 Montgomery County IL 01/17/2006 790,890 6,142 236 Clay County NE 04/19/2006 1,127,400 45,580 237 Livingston County IL 03/13/2006 1,421,536 19,787 238 Yuma County CO 06/14/2007 1,934,542 54,847 239 Macoupin County IL 04/03/2008 1,424,570 8,566 2004 Fremont CA 07/08/2004 793,092 51,822 2006 Southfield MI 09/14/2004 1,312,006 12,068 9016 Austin TX 12/31/1998 1,150,131 37,847
0299999 - Mortgages with partial repayments22,692,720 1,912,273
0599999 Totals26,663,722 616,577 616,577 4,271,997 6,184,270 (313,996) (313,996)
E06

ANNUAL STATEMENT FOR THE YEAR 2008 OF THE TEXAS LIFE INSURANCE COMPANY
SCHEDULE BA - PART 1Showing Other Long-Term Invested Assets OWNED December 31 of Current Year
1 2 3 Location 6 7 8 9 10 11 12 18 19 20
CUSIPIdentification Name or Description Code
4
City
5
State
Name of Vendor or
General Partner
NAICDesig-nation
DateOriginallyAcquired
Typeand
StrategyActualCost
FairValue
Book/Adjusted Carrying
ValueLess
Encumbrances
13UnrealizedValuationIncrease
(Decrease)
14Current Year’s(Depreciation)
or(Amortization)/
Accretion
15Current Year’s
Other thanTemporaryImpairmentRecognized
16
CapitalizedDeferred
Interest andOther
17Total
ForeignExchangeChange inB. / A.C.V.
InvestmentIncome
Commitmentfor
AdditionalInvestment
Percentageof
Ownership
000000-00-0UAL Depreciation Precentage Receipts Chicago IL Exchange (unlike) 05/30/2008 9,675 9,675 9,675 13,361 0.200
1999999 - Joint Venture Interests - Other - Unaffiliated 9,675 9,675 9,675 13,361 XXX41020V-AA-9 John Hancock, 1,000,000 par Boston MA Lehman Brothers 1 03/26/1996 955,320 1,161,730 965,385 1,173 73,750 575767-AD-0 Mass Mutual, 1,000,000 par Springfield MA Lehman Brothers 1 03/26/1996 1,467,645 1,354,335 1,475,496 908 112,500
2199999 - Surplus Debentures, etc. - Unaffiliated 2,422,965 2,516,065 2,440,881 2,081 186,250 XXX
3999999 - Total Unaffiliated 2,432,640 2,525,740 2,450,556 2,081 199,611 XXX4099999 - Total Affiliated XXX4199999 Totals 2,432,640 2,525,740 2,450,556 2,081 199,611 XXX
E07

ANNUAL STATEMENT FOR THE YEAR 2008 OF THE TEXAS LIFE INSURANCE COMPANY
SCHEDULE BA - PART 2Showing Other Long-Term Invested Assets ACQUIRED December 31 of Current Year
1 2 Location 5 6 7 8 9 10 11
CUSIPIdentification Name or Description
3
City
4
State
Name ofVendor orGeneralPartner
Date OriginallyAcquired Type and Strategy
ActualCost at Timeof Acquisition
Additional InvestmentMade After Acquisition
Amount ofEncumbrances
Percentageof
Ownership000000-00-0 UAL Depreciation Precentage Receipts Chicago IL Exchange (unlike) 05/30/2008 9,675 0.200
1999999 - Joint Venture Interests - Other - Unaffiliated 9,675 XXX
3999999 – Total Unaffiliated 9,675 XXX4099999 – Total Affiliated XXX4199999 Totals 9,675 XXXE08

ANNUAL STATEMENT FOR THE YEAR 2008 OF THE TEXAS LIFE INSURANCE COMPANY
SCHEDULE BA - PART 3Showing Other Long-Term Invested Assets DISPOSED, Transferred or Repaid During the Current Year
1 2 Location 5 6 7 8 Change in Book/Adjusted Carrying Value 15 16 17 18 19 20
CUSIPIdentification
Name orDescription
3
City
4
StateName of Purchaser or
Nature of Disposal
DateOriginallyAcquired
Disposal Date
Book/Adjusted Carrying Value
Less Encumbrances,
Prior Year
9
Unrealized ValuationIncrease
(Decrease)
10Current Year’s (Depreciation)
or (Amortization)/
Accretion
11Current Year’s
Other Than Temporary Impairment Recognized
12
Capitalized Deferred
Interest and Other
13
Total Change in B./A.C.V.
(9+10-11+12)
14
Total Foreign Exchange Change in B./A.C.V.
Book/Adjusted Carrying Value
Less Encumbrances
on Disposal Consideration
Foreign Exchange
Gain (Loss) on Disposal
Realized Gain (Loss) on Disposal
Total Gain (Loss) on Disposal
Investment Income
3999999 – Total Unaffiliated4099999 – Total Affiliated4199999 Totals
E09
NONE

ANNUAL STATEMENT FOR THE YEAR 2008 OF THE TEXAS LIFE INSURANCE COMPANY
SCHEDULE D - PART 1Showing all Long-Term BONDS Owned December 31 of Current Year
1 2 Codes 6 7 Fair Value 10 11 Change in Book Adjusted Carrying Value Interest Dates3 4 5 8 9 12 13 14 15 16 17 18 19 20 21 22
CUSIPIdentification Description Code
Foreign
BondCHAR
NAIC Designation
ActualCost
RateUsed
ToObtain
FairValue
FairValue
ParValue
Book /AdjustedCarrying
Value
Unrealized Valuation Increase/
(Decrease)
CurrentYear’s
(Amortization)/Accretion
CurrentYear’sOtherThan
TemporaryImpairmentRecognized
TotalForeign
ExchangeChange
inB./A.C.V.
Rateof
EffectiveRate
ofWhenPaid
Admitted Amount
Due&
Accrued
AmountRec.
DuringYear Acquired Maturity
36202D-LU-3 GNMA II 6.500% 003039 2 1 45,519 105.3060 48,561 46,114 45,554 130 6.500 6.680 MON 250 2,997 09/19/2002 02/01/203136202D-NL-1 GNMA II 6.500% 003095 2 1 20,009 105.3060 21,347 20,271 20,027 43 6.500 6.680 MON 110 1,318 08/12/2002 06/01/203136202D-PS-4 GNMA II 6.500% 003133 2 1 55,630 105.3060 59,302 56,314 55,674 143 6.500 6.670 MON 305 3,660 11/15/2002 09/01/203136205S-CN-3 GNMA I 8.000% 398877 2 1 90,395 106.4410 95,311 89,543 90,154 (747) 8.000 7.740 MON 597 7,163 09/25/1996 09/01/202636225B-QQ-4 GNMA I 8.000% 781363 2 1 103,192 106.3380 107,274 100,880 102,640 (321) 8.000 7.480 MON 673 8,070 11/19/2001 12/01/202536225B-QX-9 GNMA I 9.000% 781370 2 1 17,489 106.9530 17,357 16,228 17,106 (172) 9.000 7.350 MON 122 1,461 11/19/2001 05/01/2023912803-BA-0 SP 0 11/15/22 1 5,000,000 62.7870 11,247,492 17,913,442 7,555,363 456,233 6.320 N/A 05/14/2002 11/15/2022912803-CG-6 SP 0 08/15/29 1 5,084,643 52.9320 9,157,236 17,300,000 5,854,007 299,652 5.320 N/A 04/26/2006 08/15/2029912810-DX-3 T 7 1/2 11/15/16 1 4,706,870 136.6190 5,703,843 4,175,000 4,610,084 (43,947) 7.500 5.780 MN 61,279 313,183 07/07/2006 11/15/2016912810-FP-8 T 5 3/8 02/15/31 1 15,869,928 137.5670 19,741,007 14,350,000 15,764,042 (36,131) 5.375 4.650 FA 291,338 771,313 01/19/2006 02/15/2031912810-PX-0 T 4 1/2 05/15/38 1 11,395,357 136.5000 15,015,000 11,000,000 11,394,278 (1,079) 4.500 4.280 MN 64,268 247,500 10/14/2008 05/15/2038912828-CT-5 T 4 1/4 08/15/14 1 997,852 114.8300 1,148,300 1,000,000 998,690 202 4.250 4.270 FA 16,053 42,500 09/03/2004 08/15/2014912828-JA-9 T 2 5/8 05/31/10 1 1,491,328 102.9810 1,544,730 1,500,000 1,493,686 2,357 2.625 2.930 MN 3,462 19,688 06/17/2008 05/31/2010912828-JH-4 T 4 08/15/18 1 9,981,290 115.4940 11,549,400 10,000,000 9,981,893 603 4.000 4.020 FA 151,087 10/14/2008 08/15/2018912828-JL-5 T 2 09/30/10 1 5,027,734 102.4980 5,124,950 5,000,000 5,024,953 (2,781) 2.000 1.700 MS 25,549 10/20/2008 09/30/2010912828-JM-3 T 3 1/8 09/30/13 1 15,183,449 107.8600 16,179,001 15,000,000 15,174,756 (8,693) 3.125 2.860 MS 119,763 09/30/2008 09/30/2013
0199999 - Total Bonds - U.S. Government - Issuer Obligations 75,070,685 XXX 96,760,111 97,567,792 78,182,907 665,492 XXX XXX XXX 734,856 1,418,853 XXX XXX
161990-6A-9 FHA/VA CHASE LINCOLN MANHATTEN 2 1 9,778 100.0000 10,894 10,894 10,611 284 7.331 8.320 MON 67 1,279 02/21/1986 10/01/2013338994-AA-4 FHA/VA FLEET 88-10 1ST UNION 2 1 4,702 100.0000 4,970 4,970 4,939 69 9.495 10.260 MON 39 440 07/18/1988 08/01/2010493915-AB-8 KPAC A A1 2 1 10,325 102.3670 13,102 12,799 12,198 247 6.500 8.390 MON 69 832 02/16/1989 02/22/2017632990-9A-7 FHA/VA HORIZON 90-4 NATIONSBK 2 1 24,579 100.0000 25,470 25,470 24,757 1,253 8.964 9.480 MON 190 (11,981) 07/31/1990 05/01/20200299999 - Total Bonds - U.S. Government - Single Class Mortgage-Backed/Asset-Backed
Securities 49,384 XXX 54,436 54,133 52,505 1,853 XXX XXX XXX 365 (9,430) XXX XXX
0399999 - Total - U.S. Government Bonds 75,120,069 XXX 96,814,547 97,621,925 78,235,412 667,345 XXX XXX XXX 735,221 1,409,423 XXX XXX
698299-AV-6 PANAMA, REPUBLIC OF F 3FE 981,920 93.0000 930,000 1,000,000 983,172 485 7.125 7.290 JJ 30,083 71,250 11/18/2005 01/29/2026917288-BC-5 URUGUAY, REPUBLIC OF F 2 3FE 196,474 93.0000 186,000 200,000 196,859 134 8.000 8.190 MN 1,911 16,000 11/15/2005 11/18/2022
0499999 - Total Bonds - All Other Government - Issuer Obligations 1,178,394 XXX 1,116,000 1,200,000 1,180,031 619 XXX XXX XXX 31,994 87,250 XXX XXX
1099999 - Total - All Other Government Bonds 1,178,394 XXX 1,116,000 1,200,000 1,180,031 619 XXX XXX XXX 31,994 87,250 XXX XXX
586120-BK-2MEMPHIS-SHELBY CNTY TENN INDL DEV REV BD 2 2 262,836 100.0000 262,836 262,836 262,836 10.360 10.360 FMAN 4,538 27,806 07/11/1990 08/01/2015
1899999 - Total Bonds - Political Subdivisions - Issuer Obligations 262,836 XXX 262,836 262,836 262,836 XXX XXX XXX 4,538 27,806 XXX XXX
2499999 - Total - Political Subdivisions Bonds 262,836 XXX 262,836 262,836 262,836 XXX XXX XXX 4,538 27,806 XXX XXX
233244-AD-4DEPARTMENT OF TRANSPORTATION 6.210% 12/0 1FE 4,258,050 102.4100 5,120,500 5,000,000 4,942,028 2,853 6.001 6.130 MON 20,003 300,050 07/07/2004 12/07/2021
3133MC-LA-1 FHLB 6 5/8 11/15/10 1 1,052,190 108.8670 1,088,680 1,000,000 1,012,383 (6,086) 6.625 5.910 MN 8,465 66,250 01/18/2001 11/15/201031393M-YM-7 FHR 2583 MD 2 1 2,477,734 102.4560 2,561,400 2,500,000 2,487,265 7,762 5.500 5.710 MON 11,458 137,500 12/12/2006 05/15/203231395U-4N-8 FHR 2972 WG 1 2,492,110 101.2640 2,577,270 2,545,100 2,495,926 2,092 5.500 5.780 MON 11,665 139,980 01/05/2007 05/15/203531396G-L7-4 FHR 3101 PD 1 3,657,794 102.6350 3,782,100 3,685,000 3,661,213 1,950 5.500 5.680 MON 16,890 202,675 01/04/2007 05/15/203431396P-B2-6 FNR 2007-14 QE 1 3,255,000 101.0330 3,536,155 3,500,000 3,279,594 20,522 5.500 6.350 MON 16,042 192,500 06/11/2007 03/25/2037
2599999 - Total Bonds - Special Revenue - Issuer Obligations 17,192,878 XXX 18,666,105 18,230,100 17,878,409 29,093 XXX XXX XXX 84,523 1,038,955 XXX XXX
31283H-2T-1 FHLMC 7.500% G01686 2 1 258,668 105.4570 273,381 259,235 258,668 84 7.500 7.480 MON 1,620 19,443 04/14/2004 08/01/203131283K-WE-4 FHLMC 4.500% G11545 2 1 927,332 102.8880 962,372 935,359 929,251 1,409 4.500 4.640 MON 3,508 42,091 04/13/2004 11/01/20183128JR-G2-6 FHLMC 4.740% 847417 (HYBRID 3/1) 1 1,390,071 100.4150 1,397,368 1,391,593 1,391,593 4.740 3.970 MON 11,054 66,255 07/19/2007 06/01/20353128M1-RP-6 FHLMC 5.000% G12394 2 1 2,074,465 102.9200 2,184,707 2,122,724 2,082,845 10,196 5.000 5.490 MON 8,845 106,136 10/11/2006 05/01/202131335G-HW-8 FHLMC 7.500% C80245 2 1 33,383 105.7240 36,885 34,888 33,783 194 7.500 8.320 MON 218 2,617 09/16/1994 10/01/202431348H-LY-2 FHLMC 3.686% 605743 (ARM 1/1) 2 1 16,078 99.9500 15,574 15,582 15,632 (288) 7.165 2.900 MON 187 1,009 02/12/1991 06/01/201831349S-VX-8 FHLMC 4.262% 781530 (HYBRID 3/1) 1 1,160,326 98.0230 1,140,416 1,163,416 1,163,416 4.262 2.760 MON 8,313 52,389 07/19/2007 05/01/203431365D-L9-4 FNMA 8.500% 124652 2 1 3,278 107.2530 3,465 3,231 3,258 (28) 8.500 8.010 MON 23 275 10/14/1994 07/01/202231371E-2L-8 FNMA 7.500% 250179 2 1 28,507 106.1920 31,782 29,929 28,874 346 7.500 8.320 MON 187 2,245 09/16/1994 12/01/202431402W-S7-4 FNMA 4.000% 740442 2 1 1,497,144 102.6070 1,563,661 1,523,932 1,503,720 4,219 4.000 4.300 MON 5,080 60,957 12/19/2003 09/01/201831403E-CF-2 FNMA 4.000% 746270 2 1 1,938,027 102.6070 2,048,073 1,996,037 1,953,720 8,401 4.000 4.530 MON 6,653 79,841 10/31/2003 10/01/201831404Q-L8-0 FNMA 5.000% 775351 2 1 2,849,063 102.3010 3,023,759 2,955,747 2,864,107 8,142 5.000 5.600 MON 12,316 147,787 05/05/2004 05/01/203431404Q-MK-2 FNMA 5.000% 775362 2 1 2,240,185 102.3010 2,377,547 2,324,070 2,251,977 6,826 5.000 5.600 MON 9,684 116,203 05/05/2004 05/01/203431404Q-TB-5 FNMA 5.000% 775546 2 1 2,132,584 102.3010 2,263,347 2,212,439 2,143,135 7,869 5.000 5.560 MON 9,219 110,622 05/05/2004 05/01/203431407L-GT-8 FNMA 4.985% 833710 (HYBRID 7/1) 2 1 3,001,017 100.5450 3,061,986 3,045,389 3,010,758 5,947 4.985 4.930 MON 12,651 151,937 02/14/2006 09/01/2035
E10
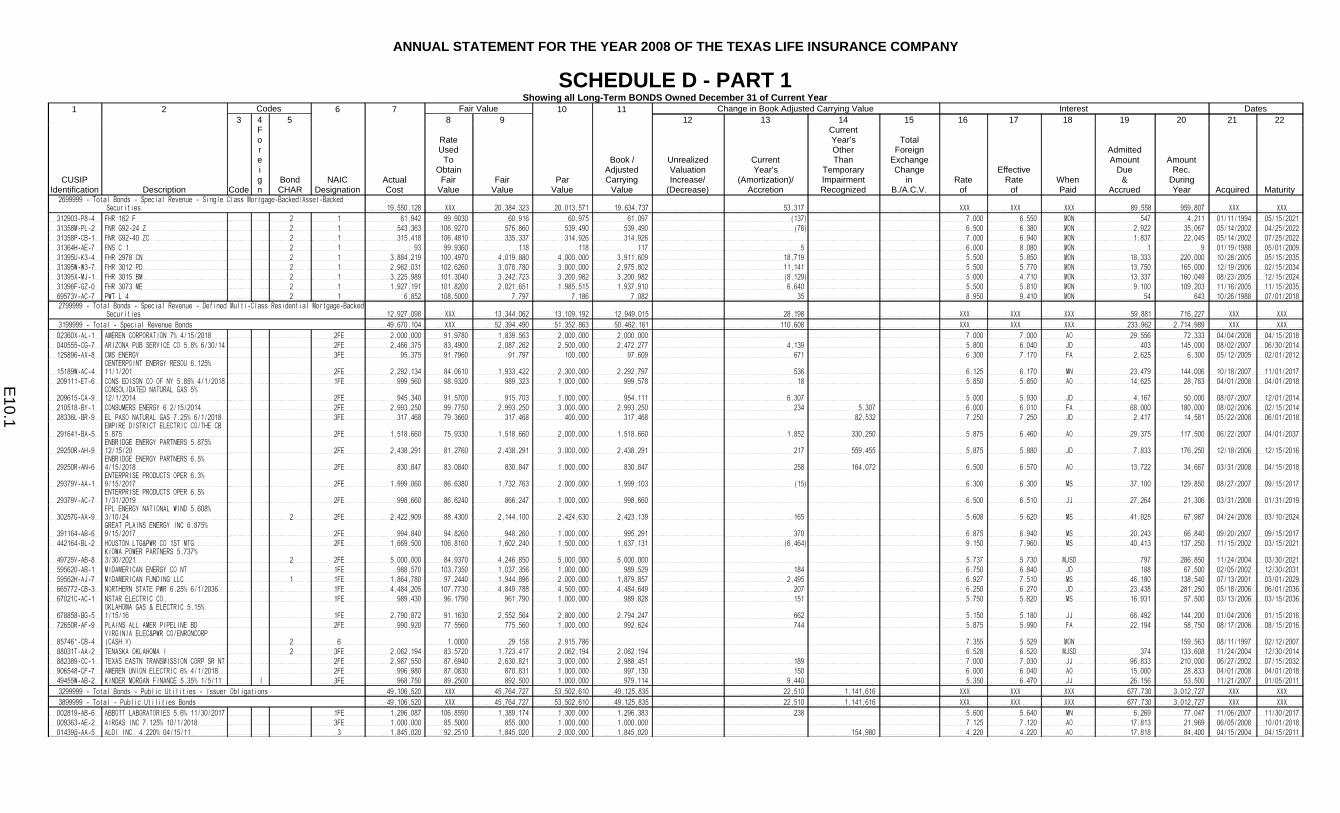
ANNUAL STATEMENT FOR THE YEAR 2008 OF THE TEXAS LIFE INSURANCE COMPANY
SCHEDULE D - PART 1Showing all Long-Term BONDS Owned December 31 of Current Year
1 2 Codes 6 7 Fair Value 10 11 Change in Book Adjusted Carrying Value Interest Dates3 4 5 8 9 12 13 14 15 16 17 18 19 20 21 22
CUSIPIdentification Description Code
Foreign
BondCHAR
NAIC Designation
ActualCost
RateUsed
ToObtain
FairValue
FairValue
ParValue
Book /AdjustedCarrying
Value
Unrealized Valuation Increase/
(Decrease)
CurrentYear’s
(Amortization)/Accretion
CurrentYear’sOtherThan
TemporaryImpairmentRecognized
TotalForeign
ExchangeChange
inB./A.C.V.
Rateof
EffectiveRate
ofWhenPaid
Admitted Amount
Due&
Accrued
AmountRec.
DuringYear Acquired Maturity
2699999 - Total Bonds - Special Revenue - Single Class Mortgage-Backed/Asset-Backed Securities 19,550,128 XXX 20,384,323 20,013,571 19,634,737 53,317 XXX XXX XXX 89,558 959,807 XXX XXX
312903-P8-4 FHR 162 F 2 1 61,942 99.9030 60,916 60,975 61,097 (137) 7.000 6.550 MON 547 4,211 01/11/1994 05/15/202131358M-PL-2 FNR G92-24 Z 2 1 543,363 106.9270 576,860 539,490 539,490 (76) 6.500 6.380 MON 2,922 35,067 05/14/2002 04/25/202231358P-CB-1 FNR G92-40 ZC 2 1 315,418 106.4810 335,337 314,926 314,926 7.000 6.940 MON 1,837 22,045 05/14/2002 07/25/202231364H-AE-7 FNS C 1 2 1 93 99.9360 118 118 117 5 6.000 8.080 MON 1 9 01/19/1988 05/01/200931395U-K3-4 FHR 2978 CN 2 1 3,884,219 100.4970 4,019,880 4,000,000 3,911,609 18,719 5.500 5.850 MON 18,333 220,000 10/28/2005 05/15/203531395W-W3-7 FHR 3012 PD 2 1 2,962,031 102.6260 3,078,780 3,000,000 2,975,802 11,141 5.500 5.770 MON 13,750 165,000 12/19/2006 02/15/203431395X-MJ-1 FHR 3015 BM 2 1 3,225,989 101.3040 3,242,723 3,200,982 3,200,982 (8,129) 5.000 4.710 MON 13,337 160,049 08/23/2005 12/15/202431396F-GZ-0 FHR 3073 ME 2 1 1,927,191 101.8200 2,021,651 1,985,515 1,937,910 6,640 5.500 5.810 MON 9,100 109,203 11/16/2005 11/15/203569573V-AC-7 PWT L 4 2 1 6,852 108.5000 7,797 7,186 7,082 35 8.950 9.410 MON 54 643 10/26/1988 07/01/20182799999 - Total Bonds - Special Revenue - Defined Multi-Class Residential Mortgage-Backed
Securities 12,927,098 XXX 13,344,062 13,109,192 12,949,015 28,198 XXX XXX XXX 59,881 716,227 XXX XXX
3199999 - Total - Special Revenue Bonds 49,670,104 XXX 52,394,490 51,352,863 50,462,161 110,608 XXX XXX XXX 233,962 2,714,989 XXX XXX
02360X-AL-1 AMEREN CORPORATION 7% 4/15/2018 2FE 2,000,000 91.9780 1,839,563 2,000,000 2,000,000 7.000 7.000 AO 29,556 72,333 04/04/2008 04/15/2018040555-CG-7 ARIZONA PUB SERVICE CO 5.8% 6/30/14 2FE 2,466,375 83.4900 2,087,262 2,500,000 2,472,277 4,139 5.800 6.040 JD 403 145,000 08/02/2007 06/30/2014125896-AX-8 CMS ENERGY 3FE 95,375 91.7960 91,797 100,000 97,609 671 6.300 7.170 FA 2,625 6,300 05/12/2005 02/01/2012
15189W-AC-4CENTERPOINT ENERGY RESOU 6.125% 11/1/201 2FE 2,292,134 84.0610 1,933,422 2,300,000 2,292,797 536 6.125 6.170 MN 23,479 144,006 10/18/2007 11/01/2017
209111-ET-6 CONS EDISON CO OF NY 5.85% 4/1/2018 1FE 999,560 98.9320 989,323 1,000,000 999,578 18 5.850 5.850 AO 14,625 28,763 04/01/2008 04/01/2018
209615-CA-9CONSOLIDATED NATURAL GAS 5% 12/1/2014 2FE 945,340 91.5700 915,703 1,000,000 954,111 6,307 5.000 5.930 JD 4,167 50,000 08/07/2007 12/01/2014
210518-BY-1 CONSUMERS ENERGY 6 2/15/2014 2FE 2,993,250 99.7750 2,993,250 3,000,000 2,993,250 234 5,307 6.000 6.010 FA 68,000 180,000 08/02/2006 02/15/201428336L-BR-9 EL PASO NATURAL GAS 7.25% 6/1/2018 3FE 317,468 79.3660 317,468 400,000 317,468 82,532 7.250 7.250 JD 2,417 14,581 05/22/2008 06/01/2018
291641-BA-5EMPIRE DISTRICT ELECTRIC CO/THE CB 5.875 2FE 1,518,660 75.9330 1,518,660 2,000,000 1,518,660 1,852 330,250 5.875 6.460 AO 29,375 117,500 06/22/2007 04/01/2037
29250R-AH-9ENBRIDGE ENERGY PARTNERS 5.875% 12/15/20 2FE 2,438,291 81.2760 2,438,291 3,000,000 2,438,291 217 559,455 5.875 5.880 JD 7,833 176,250 12/18/2006 12/15/2016
29250R-AN-6ENBRIDGE ENERGY PARTNERS 6.5% 4/15/2018 2FE 830,847 83.0840 830,847 1,000,000 830,847 258 164,072 6.500 6.570 AO 13,722 34,667 03/31/2008 04/15/2018
29379V-AA-1ENTERPRISE PRODUCTS OPER 6.3% 9/15/2017 2FE 1,999,060 86.6380 1,732,763 2,000,000 1,999,103 (15) 6.300 6.300 MS 37,100 129,850 08/27/2007 09/15/2017
29379V-AC-7ENTERPRISE PRODUCTS OPER 6.5% 1/31/2019 2FE 998,660 86.6240 866,247 1,000,000 998,660 6.500 6.510 JJ 27,264 21,306 03/31/2008 01/31/2019
30257G-AA-9FPL ENERGY NATIONAL WIND 5.608% 3/10/24 2 2FE 2,422,909 88.4300 2,144,100 2,424,630 2,423,139 165 5.608 5.620 MS 41,925 67,987 04/24/2008 03/10/2024
391164-AB-6GREAT PLAINS ENERGY INC 6.875% 9/15/2017 2FE 994,840 94.8260 948,260 1,000,000 995,291 370 6.875 6.940 MS 20,243 66,840 09/20/2007 09/15/2017
442164-BL-2 HOUSTON LTG&PWR CO 1ST MTG 2FE 1,669,500 106.8160 1,602,240 1,500,000 1,637,131 (6,464) 9.150 7.960 MS 40,413 137,250 11/15/2002 03/15/2021
49725V-AB-8KIOWA POWER PARTNERS 5.737% 3/30/2021 2 2FE 5,000,000 84.9370 4,246,850 5,000,000 5,000,000 5.737 5.730 MJSD 797 286,850 11/24/2004 03/30/2021
595620-AB-1 MIDAMERICAN ENERGY CO NT 1FE 988,570 103.7350 1,037,356 1,000,000 989,529 184 6.750 6.840 JD 188 67,500 02/05/2002 12/30/203159562H-AJ-7 MIDAMERICAN FUNDING LLC 1 1FE 1,864,780 97.2440 1,944,896 2,000,000 1,879,857 2,495 6.927 7.510 MS 46,180 138,540 07/13/2001 03/01/2029665772-CB-3 NORTHERN STATE PWR 6.25% 6/1/2036 1FE 4,484,205 107.7730 4,849,788 4,500,000 4,484,649 207 6.250 6.270 JD 23,438 281,250 05/18/2006 06/01/203667021C-AC-1 NSTAR ELECTRIC CO. 1FE 989,430 96.1790 961,790 1,000,000 989,828 151 5.750 5.820 MS 16,931 57,500 03/13/2006 03/15/2036
678858-BG-5OKLAHOMA GAS & ELECTRIC 5.15% 1/15/16 1FE 2,790,872 91.1630 2,552,564 2,800,000 2,794,247 662 5.150 5.180 JJ 66,492 144,200 01/04/2006 01/15/2016
72650R-AF-9 PLAINS ALL AMER PIPELINE BD 2FE 990,920 77.5560 775,560 1,000,000 992,624 744 5.875 5.990 FA 22,194 58,750 08/17/2006 08/15/2016
85746*-CB-4VIRGINIA ELEC&PWR CO/ENRONCORP (CASH V) 2 6 1.0000 29,158 2,915,786 7.355 5.529 MON 159,563 08/11/1997 02/12/2007
88031T-AA-2 TENASKA OKLAHOMA I 2 3FE 2,062,194 83.5720 1,723,417 2,062,194 2,062,194 6.528 6.520 MJSD 374 133,608 11/24/2004 12/30/2014882389-CC-1 TEXAS EASTN TRANSMISSION CORP SR NT 2FE 2,987,550 87.6940 2,630,821 3,000,000 2,988,451 189 7.000 7.030 JJ 96,833 210,000 06/27/2002 07/15/2032906548-CF-7 AMEREN UNION ELECTRIC 6% 4/1/2018 2FE 996,980 87.0830 870,831 1,000,000 997,130 150 6.000 6.040 AO 15,000 28,833 04/01/2008 04/01/201849455W-AB-2 KINDER MORGAN FINANCE 5.35% 1/5/11 I 3FE 968,750 89.2500 892,500 1,000,000 979,114 9,440 5.350 6.470 JJ 26,156 53,500 11/21/2007 01/05/2011
3299999 - Total Bonds - Public Utilities - Issuer Obligations 49,106,520 XXX 45,764,727 53,502,610 49,125,835 22,510 1,141,616 XXX XXX XXX 677,730 3,012,727 XXX XXX
3899999 - Total - Public Utilities Bonds 49,106,520 XXX 45,764,727 53,502,610 49,125,835 22,510 1,141,616 XXX XXX XXX 677,730 3,012,727 XXX XXX
002819-AB-6 ABBOTT LABORATORIES 5.6% 11/30/2017 1FE 1,296,087 106.8590 1,389,174 1,300,000 1,296,383 238 5.600 5.640 MN 6,269 77,047 11/06/2007 11/30/2017009363-AE-2 AIRGAS INC 7.125% 10/1/2018 3FE 1,000,000 85.5000 855,000 1,000,000 1,000,000 7.125 7.120 AO 17,813 21,969 06/05/2008 10/01/201801439@-AA-5 ALDI INC. 4.220% 04/15/11 3 1,845,020 92.2510 1,845,020 2,000,000 1,845,020 154,980 4.220 4.220 AO 17,818 84,400 04/15/2004 04/15/2011
E10.1
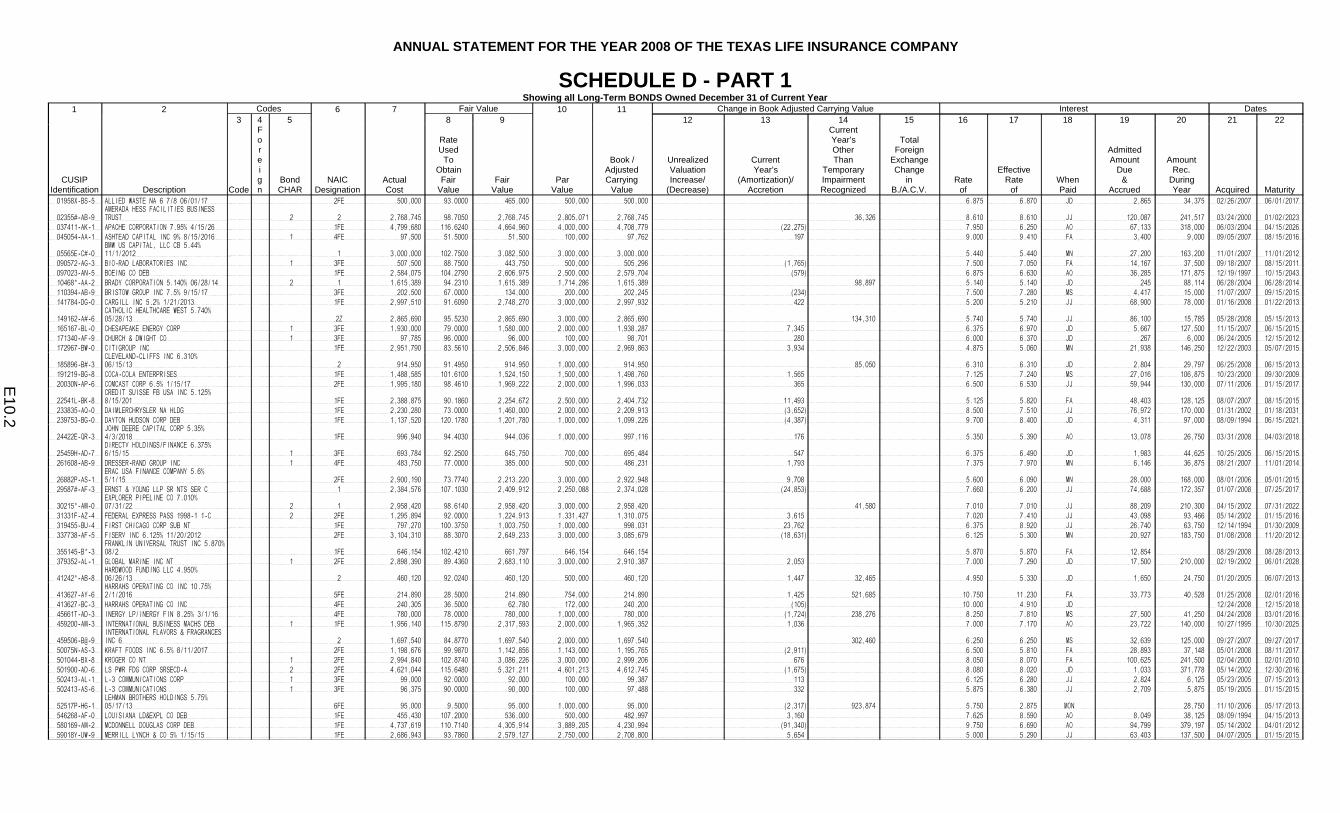
ANNUAL STATEMENT FOR THE YEAR 2008 OF THE TEXAS LIFE INSURANCE COMPANY
SCHEDULE D - PART 1Showing all Long-Term BONDS Owned December 31 of Current Year
1 2 Codes 6 7 Fair Value 10 11 Change in Book Adjusted Carrying Value Interest Dates3 4 5 8 9 12 13 14 15 16 17 18 19 20 21 22
CUSIPIdentification Description Code
Foreign
BondCHAR
NAIC Designation
ActualCost
RateUsed
ToObtain
FairValue
FairValue
ParValue
Book /AdjustedCarrying
Value
Unrealized Valuation Increase/
(Decrease)
CurrentYear’s
(Amortization)/Accretion
CurrentYear’sOtherThan
TemporaryImpairmentRecognized
TotalForeign
ExchangeChange
inB./A.C.V.
Rateof
EffectiveRate
ofWhenPaid
Admitted Amount
Due&
Accrued
AmountRec.
DuringYear Acquired Maturity
01958X-BS-5 ALLIED WASTE NA 6 7/8 06/01/17 2FE 500,000 93.0000 465,000 500,000 500,000 6.875 6.870 JD 2,865 34,375 02/26/2007 06/01/2017
02355#-AB-9AMERADA HESS FACILITIES BUSINESS TRUST 2 2 2,768,745 98.7050 2,768,745 2,805,071 2,768,745 36,326 8.610 8.610 JJ 120,087 241,517 03/24/2000 01/02/2023
037411-AK-1 APACHE CORPORATION 7.95% 4/15/26 1FE 4,799,680 116.6240 4,664,960 4,000,000 4,708,779 (22,275) 7.950 6.250 AO 67,133 318,000 06/03/2004 04/15/2026045054-AA-1 ASHTEAD CAPITAL INC 9% 8/15/2016 1 4FE 97,500 51.5000 51,500 100,000 97,762 197 9.000 9.410 FA 3,400 9,000 09/05/2007 08/15/2016
05565E-C#-0BMW US CAPITAL, LLC CB 5.44% 11/1/2012 1 3,000,000 102.7500 3,082,500 3,000,000 3,000,000 5.440 5.440 MN 27,200 163,200 11/01/2007 11/01/2012
090572-AG-3 BIO-RAD LABORATORIES INC 1 3FE 507,500 88.7500 443,750 500,000 505,296 (1,765) 7.500 7.050 FA 14,167 37,500 09/18/2007 08/15/2011097023-AN-5 BOEING CO DEB 1FE 2,584,075 104.2790 2,606,975 2,500,000 2,579,704 (579) 6.875 6.630 AO 36,285 171,875 12/19/1997 10/15/204310468*-AA-2 BRADY CORPORATION 5.140% 06/28/14 2 1 1,615,389 94.2310 1,615,389 1,714,286 1,615,389 98,897 5.140 5.140 JD 245 88,114 06/28/2004 06/28/2014110394-AB-9 BRISTOW GROUP INC 7.5% 9/15/17 3FE 202,500 67.0000 134,000 200,000 202,245 (234) 7.500 7.280 MS 4,417 15,000 11/07/2007 09/15/2015141784-DG-0 CARGILL INC 5.2% 1/21/2013 1FE 2,997,510 91.6090 2,748,270 3,000,000 2,997,932 422 5.200 5.210 JJ 68,900 78,000 01/16/2008 01/22/2013
149162-A#-6CATHOLIC HEALTHCARE WEST 5.740% 05/28/13 2Z 2,865,690 95.5230 2,865,690 3,000,000 2,865,690 134,310 5.740 5.740 JJ 86,100 15,785 05/28/2008 05/15/2013
165167-BL-0 CHESAPEAKE ENERGY CORP 1 3FE 1,930,000 79.0000 1,580,000 2,000,000 1,938,287 7,345 6.375 6.970 JD 5,667 127,500 11/15/2007 06/15/2015171340-AF-9 CHURCH & DWIGHT CO 1 3FE 97,785 96.0000 96,000 100,000 98,701 280 6.000 6.370 JD 267 6,000 06/24/2005 12/15/2012172967-BW-0 CITIGROUP INC 1FE 2,951,790 83.5610 2,506,846 3,000,000 2,969,863 3,934 4.875 5.060 MN 21,938 146,250 12/22/2003 05/07/2015
185896-B#-3CLEVELAND-CLIFFS INC 6.310% 06/15/13 2 914,950 91.4950 914,950 1,000,000 914,950 85,050 6.310 6.310 JD 2,804 29,797 06/25/2008 06/15/2013
191219-BG-8 COCA-COLA ENTERPRISES 1FE 1,488,585 101.6100 1,524,150 1,500,000 1,498,760 1,565 7.125 7.240 MS 27,016 106,875 10/23/2000 09/30/200920030N-AP-6 COMCAST CORP 6.5% 1/15/17 2FE 1,995,180 98.4610 1,969,222 2,000,000 1,996,033 365 6.500 6.530 JJ 59,944 130,000 07/11/2006 01/15/2017
22541L-BK-8CREDIT SUISSE FB USA INC 5.125% 8/15/201 1FE 2,388,875 90.1860 2,254,672 2,500,000 2,404,732 11,493 5.125 5.820 FA 48,403 128,125 08/07/2007 08/15/2015
233835-AQ-0 DAIMLERCHRYSLER NA HLDG 1FE 2,230,280 73.0000 1,460,000 2,000,000 2,209,913 (3,652) 8.500 7.510 JJ 76,972 170,000 01/31/2002 01/18/2031239753-BG-0 DAYTON HUDSON CORP DEB 1FE 1,137,520 120.1780 1,201,780 1,000,000 1,099,226 (4,387) 9.700 8.400 JD 4,311 97,000 08/09/1994 06/15/2021
24422E-QR-3JOHN DEERE CAPITAL CORP 5.35% 4/3/2018 1FE 996,940 94.4030 944,036 1,000,000 997,116 176 5.350 5.390 AO 13,078 26,750 03/31/2008 04/03/2018
25459H-AD-7DIRECTV HOLDINGS/FINANCE 6.375% 6/15/15 1 3FE 693,784 92.2500 645,750 700,000 695,484 547 6.375 6.490 JD 1,983 44,625 10/25/2005 06/15/2015
261608-AB-9 DRESSER-RAND GROUP INC 1 4FE 483,750 77.0000 385,000 500,000 486,231 1,793 7.375 7.970 MN 6,146 36,875 08/21/2007 11/01/2014
26882P-AS-1ERAC USA FINANCE COMPANY 5.6% 5/1/15 2FE 2,900,190 73.7740 2,213,220 3,000,000 2,922,948 9,708 5.600 6.090 MN 28,000 168,000 08/01/2006 05/01/2015
29587#-AF-3 ERNST & YOUNG LLP SR NTS SER C 1 2,384,576 107.1030 2,409,912 2,250,088 2,374,028 (24,853) 7.660 6.200 JJ 74,688 172,357 01/07/2008 07/25/2017
30215*-AM-0EXPLORER PIPELINE CO 7.010% 07/31/22 2 1 2,958,420 98.6140 2,958,420 3,000,000 2,958,420 41,580 7.010 7.010 JJ 88,209 210,300 04/15/2002 07/31/2022
31331F-AZ-4 FEDERAL EXPRESS PASS 1998-1 1-C 2 2FE 1,295,894 92.0000 1,224,913 1,331,427 1,310,075 3,615 7.020 7.410 JJ 43,098 93,466 05/14/2002 01/15/2016319455-BU-4 FIRST CHICAGO CORP SUB NT 1FE 797,270 100.3750 1,003,750 1,000,000 998,031 23,762 6.375 8.920 JJ 26,740 63,750 12/14/1994 01/30/2009337738-AF-5 FISERV INC 6.125% 11/20/2012 2FE 3,104,310 88.3070 2,649,233 3,000,000 3,085,679 (18,631) 6.125 5.300 MN 20,927 183,750 01/08/2008 11/20/2012
355145-B*-3FRANKLIN UNIVERSAL TRUST INC 5.870% 08/2 1FE 646,154 102.4210 661,797 646,154 646,154 5.870 5.870 FA 12,854 08/29/2008 08/28/2013
379352-AL-1 GLOBAL MARINE INC NT 1 2FE 2,898,390 89.4360 2,683,110 3,000,000 2,910,387 2,053 7.000 7.290 JD 17,500 210,000 02/19/2002 06/01/2028
41242*-AB-8HARDWOOD FUNDING LLC 4.950% 06/26/13 2 460,120 92.0240 460,120 500,000 460,120 1,447 32,465 4.950 5.330 JD 1,650 24,750 01/20/2005 06/07/2013
413627-AY-6HARRAHS OPERATING CO INC 10.75% 2/1/2016 5FE 214,890 28.5000 214,890 754,000 214,890 1,425 521,685 10.750 11.230 FA 33,773 40,528 01/25/2008 02/01/2016
413627-BC-3 HARRAHS OPERATING CO INC 4FE 240,305 36.5000 62,780 172,000 240,200 (105) 10.000 4.910 JD 12/24/2008 12/15/201845661T-AD-3 INERGY LP/INERGY FIN 8.25% 3/1/16 4FE 780,000 78.0000 780,000 1,000,000 780,000 (1,724) 238,276 8.250 7.810 MS 27,500 41,250 04/24/2008 03/01/2016459200-AM-3 INTERNATIONAL BUSINESS MACHS DEB 1 1FE 1,956,140 115.8790 2,317,593 2,000,000 1,965,352 1,036 7.000 7.170 AO 23,722 140,000 10/27/1995 10/30/2025
459506-B@-9INTERNATIONAL FLAVORS & FRAGRANCES INC 6 2 1,697,540 84.8770 1,697,540 2,000,000 1,697,540 302,460 6.250 6.250 MS 32,639 125,000 09/27/2007 09/27/2017
50075N-AS-3 KRAFT FOODS INC 6.5% 8/11/2017 2FE 1,198,676 99.9870 1,142,856 1,143,000 1,195,765 (2,911) 6.500 5.810 FA 28,893 37,148 05/01/2008 08/11/2017501044-BX-8 KROGER CO NT 1 2FE 2,994,840 102.8740 3,086,226 3,000,000 2,999,206 676 8.050 8.070 FA 100,625 241,500 02/04/2000 02/01/2010501900-AD-6 LS PWR FDG CORP SRSECD-A 2 2FE 4,621,044 115.6480 5,321,211 4,601,213 4,612,745 (1,675) 8.080 8.020 JD 1,033 371,778 05/14/2002 12/30/2016502413-AL-1 L-3 COMMUNICATIONS CORP 1 3FE 99,000 92.0000 92,000 100,000 99,387 113 6.125 6.280 JJ 2,824 6,125 05/23/2005 07/15/2013502413-AS-6 L-3 COMMUNICATIONS 1 3FE 96,375 90.0000 90,000 100,000 97,488 332 5.875 6.380 JJ 2,709 5,875 05/19/2005 01/15/2015
52517P-H6-1LEHMAN BROTHERS HOLDINGS 5.75% 05/17/13 6FE 95,000 9.5000 95,000 1,000,000 95,000 (2,317) 923,874 5.750 2.875 MON 28,750 11/10/2006 05/17/2013
546268-AF-0 LOUISIANA LD&EXPL CO DEB 1FE 455,430 107.2000 536,000 500,000 482,997 3,160 7.625 8.590 AO 8,049 38,125 08/09/1994 04/15/2013580169-AM-2 MCDONNELL DOUGLAS CORP DEB 1FE 4,737,619 110.7140 4,305,914 3,889,205 4,230,994 (91,340) 9.750 6.690 AO 94,799 379,197 05/14/2002 04/01/201259018Y-UW-9 MERRILL LYNCH & CO 5% 1/15/15 1FE 2,686,943 93.7860 2,579,127 2,750,000 2,708,800 5,654 5.000 5.290 JJ 63,403 137,500 04/07/2005 01/15/2015
E10.2
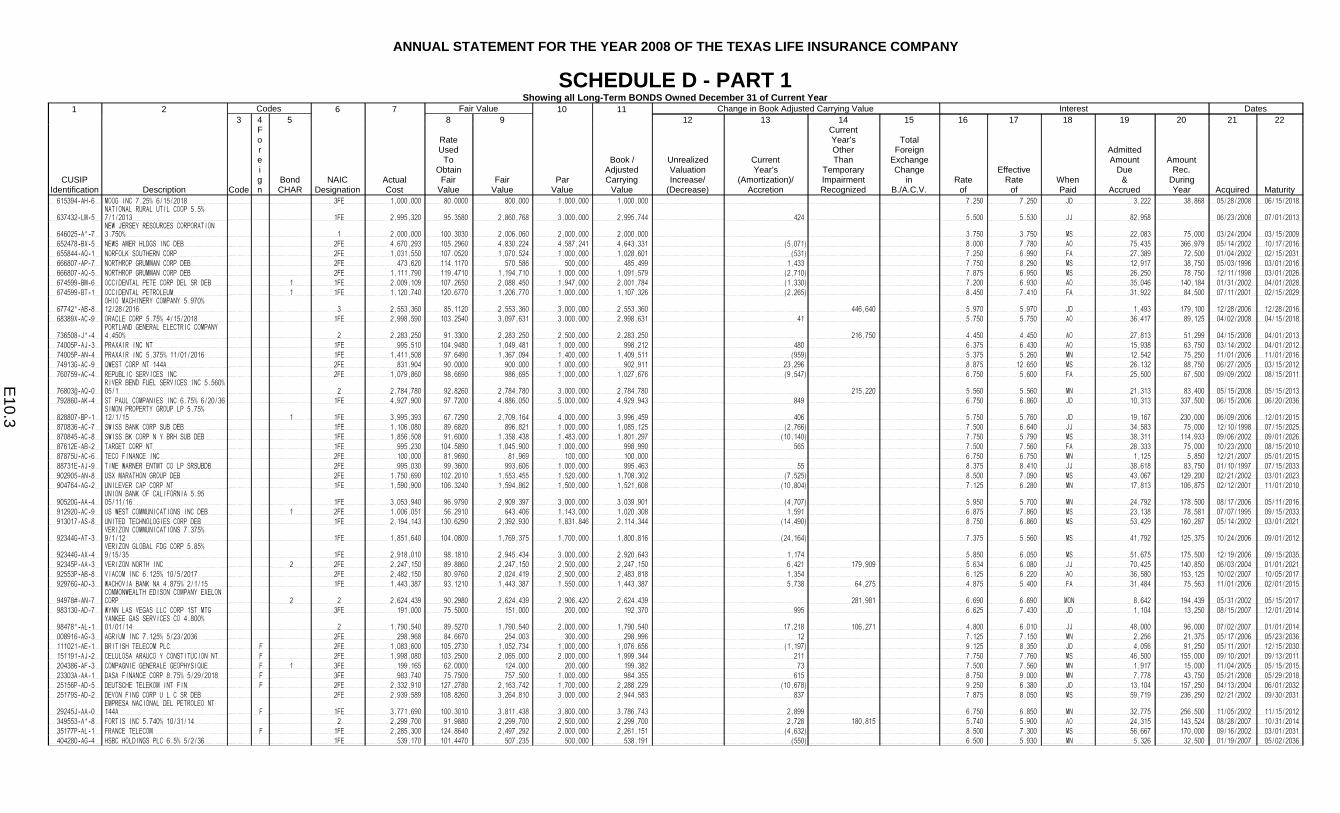
ANNUAL STATEMENT FOR THE YEAR 2008 OF THE TEXAS LIFE INSURANCE COMPANY
SCHEDULE D - PART 1Showing all Long-Term BONDS Owned December 31 of Current Year
1 2 Codes 6 7 Fair Value 10 11 Change in Book Adjusted Carrying Value Interest Dates3 4 5 8 9 12 13 14 15 16 17 18 19 20 21 22
CUSIPIdentification Description Code
Foreign
BondCHAR
NAIC Designation
ActualCost
RateUsed
ToObtain
FairValue
FairValue
ParValue
Book /AdjustedCarrying
Value
Unrealized Valuation Increase/
(Decrease)
CurrentYear’s
(Amortization)/Accretion
CurrentYear’sOtherThan
TemporaryImpairmentRecognized
TotalForeign
ExchangeChange
inB./A.C.V.
Rateof
EffectiveRate
ofWhenPaid
Admitted Amount
Due&
Accrued
AmountRec.
DuringYear Acquired Maturity
615394-AH-6 MOOG INC 7.25% 6/15/2018 3FE 1,000,000 80.0000 800,000 1,000,000 1,000,000 7.250 7.250 JD 3,222 38,868 05/28/2008 06/15/2018
637432-LM-5NATIONAL RURAL UTIL COOP 5.5% 7/1/2013 1FE 2,995,320 95.3580 2,860,768 3,000,000 2,995,744 424 5.500 5.530 JJ 82,958 06/23/2008 07/01/2013
646025-A*-7NEW JERSEY RESOURCES CORPORATION 3.750% 1 2,000,000 100.3030 2,006,060 2,000,000 2,000,000 3.750 3.750 MS 22,083 75,000 03/24/2004 03/15/2009
652478-BX-5 NEWS AMER HLDGS INC DEB 2FE 4,670,293 105.2960 4,830,224 4,587,241 4,643,331 (5,071) 8.000 7.780 AO 75,435 366,979 05/14/2002 10/17/2016655844-AQ-1 NORFOLK SOUTHERN CORP 2FE 1,031,550 107.0520 1,070,524 1,000,000 1,028,601 (531) 7.250 6.990 FA 27,389 72,500 01/04/2002 02/15/2031666807-AP-7 NORTHROP GRUMMAN CORP DEB 2FE 473,620 114.1170 570,586 500,000 485,499 1,433 7.750 8.290 MS 12,917 38,750 05/03/1996 03/01/2016666807-AQ-5 NORTHROP GRUMMAN CORP DEB 2FE 1,111,790 119.4710 1,194,710 1,000,000 1,091,579 (2,710) 7.875 6.950 MS 26,250 78,750 12/11/1998 03/01/2026674599-BM-6 OCCIDENTAL PETE CORP DEL SR DEB 1 1FE 2,009,109 107.2650 2,088,450 1,947,000 2,001,784 (1,330) 7.200 6.930 AO 35,046 140,184 01/31/2002 04/01/2028674599-BT-1 OCCIDENTAL PETROLEUM 1 1FE 1,120,740 120.6770 1,206,770 1,000,000 1,107,326 (2,265) 8.450 7.410 FA 31,922 84,500 07/11/2001 02/15/2029
67742*-AB-8OHIO MACHINERY COMPANY 5.970% 12/28/2016 3 2,553,360 85.1120 2,553,360 3,000,000 2,553,360 446,640 5.970 5.970 JD 1,493 179,100 12/28/2006 12/28/2016
68389X-AC-9 ORACLE CORP 5.75% 4/15/2018 1FE 2,998,590 103.2540 3,097,631 3,000,000 2,998,631 41 5.750 5.750 AO 36,417 89,125 04/02/2008 04/15/2018
736508-J*-4PORTLAND GENERAL ELECTRIC COMPANY 4.450% 2 2,283,250 91.3300 2,283,250 2,500,000 2,283,250 216,750 4.450 4.450 AO 27,813 51,299 04/15/2008 04/01/2013
74005P-AJ-3 PRAXAIR INC NT 1FE 995,510 104.9480 1,049,481 1,000,000 998,212 480 6.375 6.430 AO 15,938 63,750 03/14/2002 04/01/201274005P-AN-4 PRAXAIR INC 5.375% 11/01/2016 1FE 1,411,508 97.6490 1,367,094 1,400,000 1,409,511 (959) 5.375 5.260 MN 12,542 75,250 11/01/2006 11/01/201674913G-AC-9 QWEST CORP NT 144A 2FE 831,904 90.0000 900,000 1,000,000 902,911 23,296 8.875 12.650 MS 26,132 88,750 06/27/2005 03/15/2012760759-AC-4 REPUBLIC SERVICES INC 2FE 1,079,860 98.6690 986,695 1,000,000 1,027,676 (9,547) 6.750 5.600 FA 25,500 67,500 09/09/2002 08/15/2011
76803@-AQ-0RIVER BEND FUEL SERVICES INC 5.560% 05/1 2 2,784,780 92.8260 2,784,780 3,000,000 2,784,780 215,220 5.560 5.560 MN 21,313 83,400 05/15/2008 05/15/2013
792860-AK-4 ST PAUL COMPANIES INC 6.75% 6/20/36 1FE 4,927,900 97.7200 4,886,050 5,000,000 4,929,943 849 6.750 6.860 JD 10,313 337,500 06/15/2006 06/20/2036
828807-BP-1SIMON PROPERTY GROUP LP 5.75% 12/1/15 1 1FE 3,995,393 67.7290 2,709,164 4,000,000 3,996,459 406 5.750 5.760 JD 19,167 230,000 06/09/2006 12/01/2015
870836-AC-7 SWISS BANK CORP SUB DEB 1FE 1,106,080 89.6820 896,821 1,000,000 1,085,125 (2,766) 7.500 6.640 JJ 34,583 75,000 12/10/1998 07/15/2025870845-AC-8 SWISS BK CORP N Y BRH SUB DEB 1FE 1,856,508 91.6000 1,358,438 1,483,000 1,801,297 (10,140) 7.750 5.790 MS 38,311 114,933 09/06/2002 09/01/202687612E-AB-2 TARGET CORP NT 1FE 995,230 104.5890 1,045,900 1,000,000 998,990 565 7.500 7.560 FA 28,333 75,000 10/23/2000 08/15/201087875U-AC-6 TECO FINANCE INC 2FE 100,000 81.9690 81,969 100,000 100,000 6.750 6.750 MN 1,125 5,850 12/21/2007 05/01/201588731E-AJ-9 TIME WARNER ENTMT CO LP SRSUBDB 2FE 995,030 99.3600 993,606 1,000,000 995,463 55 8.375 8.410 JJ 38,618 83,750 01/10/1997 07/15/2033902905-AN-8 USX MARATHON GROUP DEB 2FE 1,750,690 102.2010 1,553,455 1,520,000 1,708,302 (7,525) 8.500 7.090 MS 43,067 129,200 02/21/2002 03/01/2023904764-AG-2 UNILEVER CAP CORP NT 1FE 1,590,900 106.3240 1,594,862 1,500,000 1,521,608 (10,804) 7.125 6.280 MN 17,813 106,875 02/12/2001 11/01/2010
90520G-AA-4UNION BANK OF CALIFORNIA 5.95 05/11/16 1FE 3,053,940 96.9790 2,909,397 3,000,000 3,039,901 (4,707) 5.950 5.700 MN 24,792 178,500 08/17/2006 05/11/2016
912920-AC-9 US WEST COMMUNICATIONS INC DEB 1 2FE 1,006,051 56.2910 643,406 1,143,000 1,020,308 1,591 6.875 7.860 MS 23,138 78,581 07/07/1995 09/15/2033913017-AS-8 UNITED TECHNOLOGIES CORP DEB 1FE 2,194,143 130.6290 2,392,930 1,831,846 2,114,344 (14,490) 8.750 6.860 MS 53,429 160,287 05/14/2002 03/01/2021
92344G-AT-3VERIZON COMMUNICATIONS 7.375% 9/1/12 1FE 1,851,640 104.0800 1,769,375 1,700,000 1,800,816 (24,164) 7.375 5.560 MS 41,792 125,375 10/24/2006 09/01/2012
92344G-AX-4VERIZON GLOBAL FDG CORP 5.85% 9/15/35 1FE 2,918,010 98.1810 2,945,434 3,000,000 2,920,643 1,174 5.850 6.050 MS 51,675 175,500 12/19/2006 09/15/2035
92345P-AA-3 VERIZON NORTH INC 2 2FE 2,247,150 89.8860 2,247,150 2,500,000 2,247,150 6,421 179,909 5.634 6.080 JJ 70,425 140,850 06/03/2004 01/01/202192553P-AB-8 VIACOM INC 6.125% 10/5/2017 2FE 2,482,150 80.9760 2,024,419 2,500,000 2,483,818 1,354 6.125 6.220 AO 36,580 153,125 10/02/2007 10/05/201792976G-AD-3 WACHOVIA BANK NA 4.875% 2/1/15 1FE 1,443,387 93.1210 1,443,387 1,550,000 1,443,387 5,738 64,275 4.875 5.400 FA 31,484 75,563 11/01/2006 02/01/2015
94978#-AN-7COMMONWEALTH EDISON COMPANY EXELON CORP 2 2 2,624,439 90.2980 2,624,439 2,906,420 2,624,439 281,981 6.690 6.690 MON 8,642 194,439 05/31/2002 05/15/2017
983130-AD-7 WYNN LAS VEGAS LLC CORP 1ST MTG 3FE 191,000 75.5000 151,000 200,000 192,370 995 6.625 7.430 JD 1,104 13,250 08/15/2007 12/01/2014
98478*-AL-1YANKEE GAS SERVICES CO 4.800% 01/01/14 2 1,790,540 89.5270 1,790,540 2,000,000 1,790,540 17,218 106,271 4.800 6.010 JJ 48,000 96,000 07/02/2007 01/01/2014
008916-AG-3 AGRIUM INC 7.125% 5/23/2036 2FE 298,968 84.6670 254,003 300,000 298,996 12 7.125 7.150 MN 2,256 21,375 05/17/2006 05/23/2036111021-AE-1 BRITISH TELECOM PLC F 2FE 1,083,600 105.2730 1,052,734 1,000,000 1,076,656 (1,197) 9.125 8.350 JD 4,056 91,250 05/11/2001 12/15/2030151191-AJ-2 CELULOSA ARAUCO Y CONSTITUCION NT F 2FE 1,998,080 103.2500 2,065,000 2,000,000 1,999,344 211 7.750 7.760 MS 46,500 155,000 09/10/2001 09/13/2011204386-AF-3 COMPAGNIE GENERALE GEOPHYSIQUE F 1 3FE 199,165 62.0000 124,000 200,000 199,382 73 7.500 7.560 MN 1,917 15,000 11/04/2005 05/15/201523303A-AA-1 DASA FINANCE CORP 8.75% 5/29/2018 F 3FE 983,740 75.7500 757,500 1,000,000 984,355 615 8.750 9.000 MN 7,778 43,750 05/21/2008 05/29/201825156P-AD-5 DEUTSCHE TELEKOM INT FIN F 2FE 2,332,910 127.2780 2,163,742 1,700,000 2,288,229 (10,678) 9.250 6.380 JD 13,104 157,250 04/13/2004 06/01/203225179S-AD-2 DEVON FING CORP U L C SR DEB 2FE 2,939,589 108.8260 3,264,810 3,000,000 2,944,583 837 7.875 8.050 MS 59,719 236,250 02/21/2002 09/30/2031
29245J-AA-0EMPRESA NACIONAL DEL PETROLEO NT 144A F 1FE 3,771,690 100.3010 3,811,438 3,800,000 3,786,743 2,899 6.750 6.850 MN 32,775 256,500 11/05/2002 11/15/2012
349553-A*-8 FORTIS INC 5.740% 10/31/14 2 2,299,700 91.9880 2,299,700 2,500,000 2,299,700 2,728 180,815 5.740 5.900 AO 24,315 143,524 08/28/2007 10/31/201435177P-AL-1 FRANCE TELECOM F 1FE 2,285,300 124.8640 2,497,292 2,000,000 2,261,151 (4,632) 8.500 7.300 MS 56,667 170,000 09/16/2002 03/01/2031404280-AG-4 HSBC HOLDINGS PLC 6.5% 5/2/36 1FE 539,170 101.4470 507,235 500,000 538,191 (550) 6.500 5.930 MN 5,326 32,500 01/19/2007 05/02/2036
E10.3

ANNUAL STATEMENT FOR THE YEAR 2008 OF THE TEXAS LIFE INSURANCE COMPANY
SCHEDULE D - PART 1Showing all Long-Term BONDS Owned December 31 of Current Year
1 2 Codes 6 7 Fair Value 10 11 Change in Book Adjusted Carrying Value Interest Dates3 4 5 8 9 12 13 14 15 16 17 18 19 20 21 22
CUSIPIdentification Description Code
Foreign
BondCHAR
NAIC Designation
ActualCost
RateUsed
ToObtain
FairValue
FairValue
ParValue
Book /AdjustedCarrying
Value
Unrealized Valuation Increase/
(Decrease)
CurrentYear’s
(Amortization)/Accretion
CurrentYear’sOtherThan
TemporaryImpairmentRecognized
TotalForeign
ExchangeChange
inB./A.C.V.
Rateof
EffectiveRate
ofWhenPaid
Admitted Amount
Due&
Accrued
AmountRec.
DuringYear Acquired Maturity
500748-AA-6 KOWLOON-CANTON RY CORP NT F 1FE 1,993,220 105.6330 2,112,660 2,000,000 1,998,873 859 8.000 8.050 MS 47,111 160,000 03/10/2000 03/15/201052605#-AB-2 LEND LEASE CORP LTD 5.680% 10/12/15 2FE 2,270,010 75.6670 2,270,010 3,000,000 2,270,010 729,990 5.680 5.670 AO 37,393 170,400 10/12/2005 10/12/2015564905-A#-4 MAPLE LEAF FOODS 5.210% 12/08/11 2 454,705 90.9410 454,705 500,000 454,705 45,295 5.210 5.210 JD 1,664 26,050 12/08/2004 12/08/2011656531-AE-0 NORSK HYDRO A S DEB F 1FE 2,000,000 111.1220 2,222,440 2,000,000 2,000,000 7.500 7.500 AO 37,500 150,000 10/01/1996 10/01/201666977W-AF-6 NOVA CHEMICALS 3FE 98,750 41.5000 41,500 100,000 99,367 182 6.500 6.730 JJ 2,997 6,500 05/12/2005 01/15/2012699490-AA-6 PARIBAS NEW YORK BRH SUB NT F 1FE 1,988,080 99.9470 1,998,952 2,000,000 1,994,463 999 6.950 7.020 JJ 61,392 139,000 05/18/2001 07/22/2013
802813-AE-5SANTANDER FINCL ISSUANCES LTD GTDSBNT F 1FE 1,817,660 95.8240 1,916,485 2,000,000 1,960,702 16,535 6.375 7.390 FA 48,167 127,500 03/08/1996 02/15/2011
82929R-AC-0 SING TELECOMMUNICATIONS F 1FE 1,011,050 112.5780 1,125,780 1,000,000 1,010,115 (168) 7.375 7.280 JD 6,146 73,750 12/05/2001 12/01/2031871965-AA-7 TGI INTERNATIONAL 9.5% 10/03/17 F 3FE 1,400,000 91.0000 1,274,000 1,400,000 1,400,000 9.500 9.500 AO 32,511 133,000 09/26/2007 10/03/2017
87938W-AC-7TELEFONICA EMISIONES SAU 7.045% 6/20/36 F 1FE 4,000,000 109.8580 4,394,348 4,000,000 4,000,000 7.045 7.040 JD 8,611 281,800 06/09/2006 06/20/2036
884903-AN-5 THOMSON CORP NT 1FE 1,982,260 97.6960 1,953,938 2,000,000 1,993,450 1,918 6.200 6.320 JJ 60,622 124,000 11/15/2001 01/05/2012980888-A#-8 WOOLWORTHS LTD 5.160% 04/26/17 F 1FE 178,802 89.4010 178,802 200,000 178,802 21,198 5.160 5.160 AO 1,863 10,320 04/26/2005 04/26/2017980888-B*-1 WOOLWORTHS LTD 5.410% 04/26/20 F 1FE 85,174 85.1740 85,174 100,000 85,174 14,826 5.410 5.410 AO 977 5,410 04/26/2005 04/26/2020
G2978#-AC-7ELECTRICITY SUPPLY BOARD SER 5.190% 12/1 F 1 973,150 98.5470 985,470 1,000,000 974,965 1,815 5.190 5.630 JD 2,307 51,900 05/21/2008 12/15/2015
G4146*-AB-6 GROUP 4 SECURICOR 5.860% 03/01/17 F 3 2,666,820 88.8940 2,666,820 3,000,000 2,666,820 333,180 5.860 5.860 MS 58,600 175,800 03/01/2007 03/01/2017N2272#-AA-6 CORIO N.V. 5.130% 08/24/11 F 1 1,895,420 94.7710 1,895,420 2,000,000 1,895,420 1,680 99,693 5.130 5.230 FA 36,195 102,600 12/13/2006 08/24/2011Q2107#-AA-4 CONTACT ENERGY LTD 6.940% 02/26/13 F 2 2,443,825 97.7530 2,443,825 2,500,000 2,443,825 (19,907) 152,534 6.940 5.880 FA 60,243 173,500 09/18/2007 02/26/2013
Q9194#-AC-9TRANSURBAN FINANCE COMPANY PTY LIMITED 5 F 1FE 2,556,690 85.2230 2,556,690 3,000,000 2,556,690 14,215 286,049 5.470 6.130 JD 10,940 161,916 11/02/2007 12/17/2019
3999999 - Total Bonds - Industrial, Misc. - Issuer Obligations 201,727,154 XXX 196,690,589 204,324,951 201,166,256 (121,635) 5,944,529 XXX XXX XXX 3,351,276 12,663,856 XXX XXX
02582J-DN-7 AMXCA 2005-4 A 1FE 2,912,813 79.4450 2,383,350 3,000,000 2,940,258 27,446 1.265 1.870 MON 1,792 35,692 07/10/2008 01/15/2015161571-CP-7 CHAIT 2008-A4 A4 1FE 3,910,625 88.4770 3,539,120 4,000,000 3,918,584 7,959 4.650 5.180 MON 8,267 90,804 07/29/2008 03/15/2015161571-DA-9 CHAIT 2008-A11 A11 1FE 2,999,895 90.5310 2,715,939 3,000,000 2,999,902 7 5.400 5.400 MON 7,200 60,750 07/23/2008 07/15/201517305E-CM-5 CCCIT 2005-A3 A3 1FE 2,908,594 82.1990 2,466,000 3,000,000 2,933,727 25,133 0.531 1.210 MON 354 39,913 07/11/2008 04/24/201417305E-CV-5 CCCIT 2005-A8 A8 1FE 2,897,344 79.8390 2,395,200 3,000,000 2,927,889 30,546 0.651 1.300 MON 651 42,791 07/11/2008 10/20/201423321P-AC-2 DLJMA 1990-2 A 2 1FE 8,124 97.8950 7,894 8,064 8,064 5.051 7.250 MON 36 473 02/05/1991 01/25/202236228C-PX-5 GSMS 2003-C1 E 23 1FE 2,009,898 46.0760 921,534 2,000,000 2,003,476 (1,295) 4.822 4.740 MON 8,037 96,440 03/13/2003 01/10/2040453083-LR-6 ISA 1988-1 A 2 1FE 3,403 94.9160 3,233 3,406 3,403 6.502 6.470 MON 18 221 03/22/1988 02/25/2018795483-AG-1 SALOMON MTG IV 86-4 2 1FE 32 100.0000 32 32 32 10.250 10.440 MON 38 11/30/1987 05/15/20164099999 - Total Bonds - Industrial, Misc. - Single Class Mortgage-Backed/Asset-Backed
Securities 17,650,728 XXX 14,432,302 18,011,502 17,735,335 89,796 XXX XXX XXX 26,355 367,122 XXX XXX
05947U-PS-1 BACM 2004-1 A4 2 1FE 3,046,375 86.2490 2,759,993 3,200,000 3,056,466 10,091 4.760 5.800 MON 12,693 50,773 07/31/2008 11/10/203905949Q-AA-3 BAFC 2006-2 1A1 1FE 1,317,722 64.0940 1,317,722 2,055,921 1,317,722 11,299 618,828 5.000 5.740 MON 8,566 102,796 08/28/2007 03/25/203605950F-AL-9 BAFC 2006-4 A11 1FE 1,818,372 79.5750 1,818,372 2,285,105 1,818,372 394 462,984 6.000 5.940 MON 11,426 136,922 06/22/2007 07/25/203607383F-U7-1 BSCMS 2004-T16 A6 23 1FE 3,890,000 81.1440 3,245,785 4,000,000 3,925,318 10,176 4.750 5.090 MON 15,833 190,000 04/12/2005 02/13/204607383F-X5-2 BSCMS 2004-PWR6 A6 2 1FE 2,335,709 81.2130 2,012,465 2,478,000 2,343,403 7,694 4.825 5.910 MON 9,964 39,854 07/31/2008 11/11/204107387J-AG-1 BSCMS 2006-PW12 AM 2 1FE 4,021,657 54.4850 2,179,408 4,000,000 4,015,931 (2,376) 5.756 5.660 MON 19,190 233,890 06/08/2006 09/11/203812668B-SQ-7 CWALT 2006-6CB 2A10 1FE 2,368,236 65.5440 1,546,558 2,359,572 2,364,493 (2,815) 6.000 5.850 MON 11,798 141,571 04/06/2007 05/25/203620047E-AE-2 COMM 2006-C8 A4 1FE 2,381,836 74.6540 1,866,375 2,500,000 2,395,660 9,916 5.306 5.950 MON 11,054 132,650 07/31/2007 12/10/204630251T-AA-7 FNBC 1993-A PASS THRU TR PSTH 93A 2 1FE 1,705,968 130.1850 2,166,619 1,664,261 1,697,064 (3,940) 8.080 7.620 JJ 65,742 134,472 09/20/1996 01/05/201832051G-C9-4 FHASI 2005-7 A11 2 1FE 3,094,450 61.8890 3,094,450 5,000,000 3,094,450 9,744 1,509,820 5.500 6.270 MON 22,917 275,000 06/09/2006 12/25/203532051G-ZS-7 FHAMS 2005-FA9 A4A 2 1FE 1,334,580 66.7290 1,334,580 2,000,000 1,334,580 2,432 625,183 5.500 5.720 MON 9,167 110,000 11/17/2005 12/25/2035361849-F5-6 GMACC 2004-C2 A4 23 1FE 3,937,509 84.3450 3,226,222 3,825,000 3,897,681 (12,359) 5.301 4.870 MON 16,897 202,763 07/28/2005 08/10/2038362332-AE-8 GSMS 2006-GG8 A4 2 1FE 2,490,039 76.3480 1,908,710 2,500,000 2,490,941 579 5.560 5.590 MON 11,583 139,000 05/29/2007 11/10/203945661E-BP-8 RAST 2006-A2 A3 1FE 2,701,348 63.1200 1,697,664 2,689,581 2,696,883 (1,188) 6.000 5.850 MON 13,448 161,369 04/06/2007 01/25/204652108H-P7-3 LBUBS 2004-C7 A6 23 1FE 3,954,375 81.5760 3,263,080 4,000,000 3,969,660 4,283 4.786 4.930 MON 10,636 191,440 03/02/2005 10/15/202959023N-AQ-1 MLMI 2006-AF2 AF2 1FE 1,678,072 78.5860 1,678,072 2,135,332 1,678,072 (1,530) 466,786 6.250 6.060 MON 11,122 133,458 04/06/2007 10/25/2036929766-C3-5 WBCMT 2005-C17 A4 23 1FE 4,066,250 80.9550 3,238,219 4,000,000 4,042,132 (7,018) 5.083 4.840 MON 16,943 203,320 04/28/2005 03/15/2042929766-R5-4 WBCMT 2005-C18 A4 2 1FE 4,019,700 79.6890 3,187,595 4,000,000 4,011,040 (2,558) 4.935 4.840 MON 16,450 197,400 05/04/2005 04/15/204292978Y-AD-2 WBCMT 2007-C32 A3 1FE 2,957,406 70.5050 2,115,167 3,000,000 2,961,693 2,862 5.740 5.900 MON 14,352 175,047 06/22/2007 06/15/204993934F-FB-3 WMALT 2005-9 5A1 2 1FE 1,229,520 61.4760 1,229,520 2,000,000 1,229,520 2,407 724,412 5.500 5.760 MON 9,167 110,000 11/17/2005 11/25/203594983H-AL-0 WFMBS 2005-11 2A7 2 1FE 2,098,343 44.0910 2,098,343 4,759,119 2,098,343 87,080 2,431,706 5.500 6.540 MON 21,813 254,116 10/19/2005 11/25/20354199999 - Total Bonds - Industrial, Misc. - Defined Multi-Class Residential Mortgage-
Backed Securities 56,447,467 XXX 46,984,919 64,451,891 56,439,424 125,173 6,839,719 XXX XXX XXX 340,761 3,315,841 XXX XXX
E10.4

ANNUAL STATEMENT FOR THE YEAR 2008 OF THE TEXAS LIFE INSURANCE COMPANY
SCHEDULE D - PART 1Showing all Long-Term BONDS Owned December 31 of Current Year
1 2 Codes 6 7 Fair Value 10 11 Change in Book Adjusted Carrying Value Interest Dates3 4 5 8 9 12 13 14 15 16 17 18 19 20 21 22
CUSIPIdentification Description Code
Foreign
BondCHAR
NAIC Designation
ActualCost
RateUsed
ToObtain
FairValue
FairValue
ParValue
Book /AdjustedCarrying
Value
Unrealized Valuation Increase/
(Decrease)
CurrentYear’s
(Amortization)/Accretion
CurrentYear’sOtherThan
TemporaryImpairmentRecognized
TotalForeign
ExchangeChange
inB./A.C.V.
Rateof
EffectiveRate
ofWhenPaid
Admitted Amount
Due&
Accrued
AmountRec.
DuringYear Acquired Maturity
04542B-NC-2 ABFC 2005-AQ1W A5W 2 1FE 1,632,400 40.8100 1,632,400 4,000,000 1,632,400 2,361,248 5.220 5.160 MON 17,400 208,800 06/20/2005 06/25/203517305E-DF-9 CCCIT 2006-A4 A4 2 1FE 3,105,117 96.1130 2,883,420 3,000,000 3,078,951 (26,166) 5.450 4.260 MN 23,163 163,500 02/25/2008 05/10/201322541N-MR-7 CSFB 2002-CKS4 A2 2 1FE 2,917,500 90.2940 2,708,841 3,000,000 2,924,037 6,537 5.183 5.930 MON 12,958 51,830 08/19/2008 11/15/203646625M-RC-5 JPMCC 2002-C3 B 2 1FE 2,743,555 88.4770 2,433,131 2,750,000 2,744,216 328 5.146 5.160 MON 11,793 141,515 12/21/2006 07/12/203546625M-UA-5 JPMCC 2003-C1 D 2 1FE 2,985,320 63.4640 1,903,926 3,000,000 2,986,613 1,804 5.192 5.260 MON 12,980 155,760 04/05/2006 01/12/203774432G-AD-9 PCMT 2003-PWR1 C 2 1FE 2,010,913 62.0520 1,241,049 2,000,000 2,003,724 (1,367) 4.706 4.620 MON 7,843 94,120 03/07/2003 02/11/203676110V-GF-9 RFMS2 2001-HS2 A5 2 1FE 200,923 96.4550 200,923 208,307 200,923 7,384 7.420 3.830 MON 1,288 15,456 06/05/2001 04/25/20314299999 - Total Bonds - Industrial, Misc. - Other Multi-Class Residential Mortgage-
Backed Securities 15,595,728 XXX 13,003,690 17,958,307 15,570,864 (18,864) 2,368,632 XXX XXX XXX 87,425 830,981 XXX XXX
07383F-A7-3 BSCMS 2004-T14 A4 1FE 2,328,656 88.5860 2,126,084 2,400,000 2,333,070 4,414 5.200 5.810 MON 10,400 41,600 07/31/2008 01/12/2041161571-CH-5 CHAIT 2007-A17 A 1FE 2,988,281 92.1780 2,765,340 3,000,000 2,989,374 1,093 5.120 5.220 MON 6,827 64,000 07/22/2008 10/15/201436161R-AE-9 GFCM 2003-1 A5 2 1FE 2,512,480 74.5330 1,863,338 2,500,000 2,507,981 (989) 5.742 5.670 MON 11,964 143,565 09/23/2003 05/12/203536828Q-BY-1 GECMC 2003-C2 E 2 1FE 3,000,970 41.8100 1,254,327 3,000,000 3,000,000 5.326 5.290 MON 13,315 159,776 07/29/2003 07/10/203746625M-5J-4 JPMCC 2004-PNC1 A4 1FE 1,971,172 85.1250 1,702,506 2,000,000 1,975,747 3,282 5.368 5.590 MON 8,947 109,097 08/01/2007 06/12/2041501773-CS-2 LBCMT 1999-C1 A2 2 1FE 2,140,113 99.3320 2,078,086 2,092,061 2,092,061 (3,265) 6.780 6.360 MON 11,820 141,946 12/20/2000 06/15/2031501773-DG-7 LBCMT 1999-C2 A2 2 1FE 2,048,229 98.7170 2,012,642 2,038,798 2,038,798 7.325 7.210 MON 12,445 149,342 09/29/1999 10/15/203255262T-GA-5 MBNAM 2001-B A 1FE 1,969,531 88.5940 1,771,880 2,000,000 1,982,226 12,695 1.455 1.880 MON 1,374 25,460 07/11/2008 08/15/201361746W-ET-3 MSDWC 2001-PPM A3 2 1FE 277,573 96.3700 266,099 276,122 276,122 (104) 6.540 6.380 MON 1,505 18,467 01/24/2001 02/15/203187246A-AB-4 TIAAS 2007-C4 A2 1FE 2,009,996 77.0160 1,540,328 2,000,000 2,007,066 (2,130) 5.805 5.670 MON 6,773 116,244 08/02/2007 08/15/20394399999 - Total Bonds - Industrial, Misc. - Defined Multi-Class Commercial Mortgage-
Backed Securities 21,247,001 XXX 17,380,630 21,306,981 21,202,445 14,996 XXX XXX XXX 85,370 969,497 XXX XXX
07383F-AB-4 BSCMS 1998-C1 A2 2 1FE 83,415 96.0000 79,274 82,577 82,577 6.440 6.260 MON 443 5,318 06/03/1998 06/16/203033736X-BZ-1 FUNBC 2001-C2 A2 2 1FE 2,959,296 96.0580 2,828,349 2,944,417 2,944,417 (1,793) 6.663 6.560 MON 16,349 196,187 05/31/2001 01/12/2043339464-AN-9 FLINT 1A B 26 1FE 3,000,000 83.0000 2,490,000 3,000,000 3,000,000 8.083 8.180 MN 28,291 242,490 11/14/2000 11/20/201344440*-AC-0 HUGHES AIRCRAFT 2 1 88,704 113.8620 101,000 88,704 88,704 10.360 10.360 MS 2,323 8,402 09/28/1988 09/30/201246625M-NT-2 JPMCC 2002-CIB5 B 2 1FE 3,022,031 89.5420 2,686,277 3,000,000 3,013,599 (4,312) 5.308 5.120 MON 13,270 159,240 12/21/2006 10/12/203746625M-TX-7 JPMCC 2003-C1 A2 2 1FE 1,942,188 88.2400 1,764,808 2,000,000 1,955,219 9,390 4.985 5.580 MON 8,308 99,700 08/01/2007 01/12/203761745M-W4-1 MSC 2005-T17 A5 2 1FE 4,934,961 81.0340 4,051,738 5,000,000 4,942,077 7,116 4.780 4.980 MON 19,917 219,083 01/10/2008 12/13/204161746W-DZ-0 MSDWC 2000-LIF2 A2 2 1FE 1,217,471 97.2670 1,122,638 1,154,172 1,164,031 (8,494) 7.200 6.320 MON 6,925 83,100 02/12/2001 10/15/2033060340-A*-7 BANCO DEL ISTMO 5.930% 12/15/11 F 2 1 1,706,920 94.7460 1,706,920 1,801,575 1,706,920 94,655 5.858 5.850 MON 4,691 105,535 12/09/2004 12/15/20114499999 - Total Bonds - Industrial, Misc. - Other Multi-Class Commercial Mortgage-
Backed/Asset-Backed Securities 18,954,986 XXX 16,831,004 19,071,445 18,897,544 1,907 94,655 XXX XXX XXX 100,517 1,119,055 XXX XXX
4599999 - Total - Industrial and Miscellaneous Bonds 331,623,064 XXX 305,323,134 345,125,077 331,011,868 91,373 15,247,535 XXX XXX XXX 3,991,704 19,266,352 XXX XXX
5499999 - Total - Issuer Obligations 344,538,467 XXX 359,260,368 375,088,289 347,796,274 596,079 7,086,145 XXX XXX XXX 4,884,917 18,249,447 XXX XXX
5599999 - Total - Single Class Mortgage-Backed/Asset-Backed Securities 37,250,240 XXX 34,871,061 38,079,206 37,422,577 144,966 XXX XXX XXX 116,278 1,317,499 XXX XXX
5699999 - Total - Defined Multi-Class Residential Mortgage-Backed Securities 69,374,565 XXX 60,328,981 77,561,083 69,388,439 153,371 6,839,719 XXX XXX XXX 400,642 4,032,068 XXX XXX
5799999 - Total - Other Multi-Class Residential Mortgage-Backed Securities 15,595,728 XXX 13,003,690 17,958,307 15,570,864 (18,864) 2,368,632 XXX XXX XXX 87,425 830,981 XXX XXX
5899999 - Total - Defined Multi-Class Commercial Mortgage-Backed Securities 21,247,001 XXX 17,380,630 21,306,981 21,202,445 14,996 XXX XXX XXX 85,370 969,497 XXX XXX
5999999 - Total - Other Multi-Class Commercial Mortgage-Backed Securities 18,954,986 XXX 16,831,004 19,071,445 18,897,544 1,907 94,655 XXX XXX XXX 100,517 1,119,055 XXX XXX
6099999 Totals 506,960,987 XXX 501,675,734 549,065,311 510,278,143 892,455 16,389,151 XXX XXX XXX 5,675,149 26,518,547 XXX XXX
E10.5

ANNUAL STATEMENT FOR THE YEAR 2008 OF THE TEXAS LIFE INSURANCE COMPANY
SCHEDULE D - PART 2 - SECTION 1Showing ALL PREFERRED STOCKS Owned December 31 of Current Year
1 2 Codes 5 6 7 8 Fair Value 11 Dividends Change in Book/ Adjusted Carrying Value 20 21
CUSIP Identification Description
3
Code
4
Foreign
Numberof
Shares
ParValue
PerShare
RatePer
Share
Book/AdjustedCarrying
Value
9Rate Per
ShareUsed toObtain
FairValue
10
FairValue
ActualCost
12
DeclaredBut
Unpaid
13
AmountReceived
DuringYear
14
NonadmittedDeclared
ButUnpaid
15
UnrealizedValuationIncrease/
(Decrease)
16
CurrentYear’s
(Amortization)Accretion
17
Current Year’sOther ThanTemporaryImpairmentRecognized
18
TotalChange
InB./A.C.V.
(15 + 16 - 17)
19Total
ForeignExchangeChange
InB./A.C.V.
NAICDesig-nation
DateAcquired
25153R-AA-0 DEUTSCHE BANK CAPITAL FUNDING TRUST 2,000,000.000 1,980,559 42.735 854,700 1,974,520 50,652 112,560 2,177 2,177 RP1UFE 02/14/200644978N-AA-3 ING CAP FDG TR III PERP GTDING CAP 3,000,000.000 3,089,163 50.000 1,500,000 3,323,910 703 253,170 (40,352) (40,352) RP1UFE 11/29/200156063F-AC-6 MAINSTREET CAP TR I CAP SECS 1,000,000.000 1,046,228 77.000 770,000 1,106,850 7,417 89,000 (4,858) (4,858) RP1U 02/07/200290262P-AA-6 UBS PFD FUNDING TRUST I 1,000,000.000 1,002,533 50.000 500,000 1,010,500 21,555 86,220 (1,293) (1,293) P1U 10/24/2000007924-30-1 AEGON NV F 82,000.000 25.00 2,050,000 9.830 806,060 2,050,000 130,688 P1LFE 05/25/2005236363-AA-5 DANSKE BANK A/S 5.914% 12/15/49 F 3,000,000.000 3,000,000 52.814 1,584,420 3,000,000 7,393 177,420 RP1UFE 06/07/200478454A-AA-2 SMFG PREFERRED CAPITAL 6.078% 1/25/ F 3,000,000.000 3,000,000 67.463 2,023,890 3,000,000 79,014 182,340 RP2UFE 12/13/2006865622-AB-0 SUMITOMO MITSUI BANKING F 2,100,000.000 2,082,168 74.057 1,555,197 2,077,740 24,938 118,104 2,092 2,092 RP1UFE 11/14/200687019X-AA-1 SWEDBANK F 1,000,000.000 999,148 66.006 660,060 995,060 26,000 90,000 639 639 RP2UFE 03/15/2000
6399999 - Total - Preferred Stock - Industrial, Misc. 18,249,798 XXX 10,254,327 18,538,580 217,671 1,239,502 (41,595) (41,595) XXX XXX
6599999 Total - Preferred Stocks 18,249,798 XXX 10,254,327 18,538,580 217,671 1,239,502 (41,595) (41,595) XXX XXX
E11

ANNUAL STATEMENT FOR THE YEAR 2008 OF THE TEXAS LIFE INSURANCE COMPANY
SCHEDULE D - PART 2 - SECTION 2Showing all COMMON STOCKS Owned December 31 of Current Year
1 2 Codes 5 6 Fair Value 9 Dividends Change in Book / Adjusted Carrying Value 17 18
CUSIP Identification Description
3
Code
4
ForeignNumber of
Shares
Book / AdjustedCarrying
Value
7Rate per
Share UsedTo Obtain
FairValue
8
FairValue
ActualCost
10
DeclaredBut Unpaid
11
AmountReceived
During Year
12
NonadmittedDeclared
But Unpaid
13
UnrealizedValuationIncrease /
(Decrease)
14Current Year’s
Other ThanTemporaryImpairmentRecognized
15
TotalChange inB./A.C.V.(13 - 14)
16
Total ForeignExchangeChange inB. /A.C.V.
NAICMarket
Indicator(a)
DateAcquired
001765-10-6 AMR CORP 463.000 4,940 10.670 4,940 2,227 (1,556) (1,556) L 08/27/2004736508-84-7 PORTLAND GEN ELEC CO 4,063.000 79,107 19.470 79,107 84,214 995 3,901 (33,764) (33,764) L 06/01/2007811804-98-8 SEAGATE ESCROW 979.000 1 0.001 1 V 03/31/2003
6899999 - Total - Common Stock - Industrial, Misc. 84,048 XXX 84,048 86,441 995 3,901 (35,320) (35,320) XXX XXX
7299999 Total - Common Stocks 84,048 XXX 84,048 86,441 995 3,901 (35,320) (35,320) XXX XXX
7399999 Total - Preferred and Common Stocks 18,333,846 XXX 10,338,375 18,625,021 218,666 1,243,403 (35,320) (76,915) XXX XXX(a) For all common stocks bearing the NAIC market indicator “U” provide: the number of such issues , the total $ value (included in Column 8) of all such issues $
E12

ANNUAL STATEMENT FOR THE YEAR 2008 OF THE TEXAS LIFE INSURANCE COMPANY
SCHEDULE D - PART 3Showing All Long-Term Bonds and Stocks ACQUIRED During Current Year
1 2 3 4 5 6 7 8 9
CUSIPIdentification Description Foreign Date Acquired Name of Vendor
Number of Shares of Stock
ActualCost Par Value
Paid for AccruedInterest and Dividends
161990-6A-9 FHA/VA CHASE LINCOLN MANHATTEN 7.331 10/ 02/22/2008 CAPITALIZED INTEREST 7 912810-PX-0 T 4 1/2 05/15/38 4.500 05/15/2038 10/14/2008 CITICORP SECURITIES INC 11,395,357 11,000,000 205,802 912828-JA-9 T 2 5/8 05/31/10 2.625 05/31/2010 06/17/2008 MERRILL LYNCH 4,473,984 4,500,000 5,809 912828-JH-4 T 4 08/15/18 4.000 08/15/2018 10/14/2008 CITICORP SECURITIES INC 9,981,290 10,000,000 66,304 912828-JL-5 T 2 09/30/10 2.000 09/30/2010 10/20/2008 FIRST BOSTON CORPORATION 5,027,734 5,000,000 5,769 912828-JM-3 T 3 1/8 09/30/13 3.125 09/30/2013 09/30/2008 GOLDMAN, SACHS & CO. (DOMESTIC) 15,183,449 15,000,000 1,288 0399999 - Total - Bonds - U.S. Government 46,061,814 45,500,007 284,972 02360X-AL-1 AMEREN CORPORATION 7% 4/15/2018 7.000 04 04/04/2008 Exchanged 2,000,000 2,000,000 209111-ET-6 CONS EDISON CO OF NY 5.85% 4/1/2018 5.85 04/01/2008 MERRILL LYNCH 999,560 1,000,000 28336L-BR-9 EL PASO NATURAL GAS 7.25% 6/1/2018 7.250 05/22/2008 DEUTSCHE BANK (U K) 400,000 400,000 29250R-AN-6 ENBRIDGE ENERGY PARTNERS 6.5% 4/15/2018 03/31/2008 Exchanged 994,660 1,000,000 29379V-AC-7 ENTERPRISE PRODUCTS OPER 6.5% 1/31/2019 03/31/2008 LEHMAN BROTHERS KUHN LOEB INC. 1270 998,660 1,000,000 30257G-AA-9 FPL ENERGY NATIONAL WIND 5.608% 3/10/24 04/24/2008 KEYBANC PRIVATE PLACEMENTS 2,511,615 2,513,400 19,185 906548-CF-7 AMEREN UNION ELECTRIC 6% 4/1/2018 6.000 04/01/2008 GOLDMAN, SACHS & CO. (DOMESTIC) 996,980 1,000,000 3899999 - Total - Bonds - Public Utilities 8,901,475 8,913,400 19,185 009363-AE-2 AIRGAS INC 7.125% 10/1/2018 7.125 10/01/ 06/05/2008 BANK OF AMERICA 1,000,000 1,000,000 02582J-DN-7 AMXCA 2005-4 A 1.265 06/15/2012 07/10/2008 FIRST BOSTON CORPORATION 2,912,813 3,000,000 05947U-PS-1 BACM 2004-1 A4 4.760 01/01/2014 07/31/2008 GOLDMAN, SACHS & CO. (DOMESTIC) 3,046,375 3,200,000 1,692 07383F-A7-3 BSCMS 2004-T14 A4 5.200 03/01/2014 07/31/2008 BARCLAYS BANK OF N Y 2,328,656 2,400,000 1,387 07383F-X5-2 BSCMS 2004-PWR6 A6 4.825 11/01/2014 07/31/2008 BARCLAYS BANK OF N Y 2,335,709 2,478,000 1,328 141784-DG-0 CARGILL INC 5.2% 1/21/2013 5.200 01/22/2 01/16/2008 BANK OF AMERICA 2,997,510 3,000,000 149162-A#-6 CATHOLIC HEALTHCARE WEST 5.740% 05/28/1 05/28/2008 BANK OF AMERICA 3,000,000 3,000,000 161571-CH-5 CHAIT 2007-A17 A 5.120 10/15/2012 07/22/2008 MORGAN J P SEC INC. 2,988,281 3,000,000 4,267 161571-CP-7 CHAIT 2008-A4 A4 4.650 03/15/2013 07/29/2008 MORGAN J P SEC INC. 5,878,125 6,000,000 13,950 161571-DA-9 CHAIT 2008-A11 A11 5.400 07/15/2013 07/23/2008 MORGAN J P SEC INC. 2,999,895 3,000,000 17305E-CM-5 CCCIT 2005-A3 A3 04/24/2012 07/11/2008 FIRST BOSTON CORPORATION 2,908,594 3,000,000 4,677 17305E-CV-5 CCCIT 2005-A8 A8 10/20/2012 07/11/2008 MORGAN J P SEC INC. 2,897,344 3,000,000 5,529 17305E-DF-9 CCCIT 2006-A4 A4 5.450 05/10/2011 02/25/2008 CITICORP SECURITIES INC 3,105,117 3,000,000 49,050 185896-B#-3 CLEVELAND-CLIFFS INC 6.310% 06/15/13 6.3 06/25/2008 BANK OF AMERICA 1,000,000 1,000,000 22541N-MR-7 CSFB 2002-CKS4 A2 5.183 08/01/2012 08/19/2008 GREENWICH CAPITAL MARKETS, INC 2,917,500 3,000,000 9,070 24422E-QR-3 JOHN DEERE CAPITAL CORP 5.35% 4/3/2018 5 03/31/2008 DEUTSCHE BANK (U K) 996,940 1,000,000 29587#-AF-3 ERNST & YOUNG LLP SR NTS SER C 7.660 07/ 01/07/2008 LEHMAN BROTHERS KUHN LOEB INC. 1270 2,649,425 2,500,000 86,175 337738-AF-5 FISERV INC 6.125% 11/20/2012 6.125 11/20 01/08/2008 FIRST BOSTON CORPORATION 3,104,310 3,000,000 26,031 355145-B*-3 FRANKLIN UNIVERSAL TRUST INC 5.870% 08/ 08/29/2008 MERRILL LYNCH 1,000,000 1,000,000 413627-AY-6 HARRAHS OPERATING CO INC 10.75% 2/1/201 01/25/2008 CITICORP SECURITIES INC 975,000 1,000,000 413627-BC-3 HARRAHS OPERATING CO INC 10.000 12/15/20 12/24/2008 EXCHANGES (UNLIKE) 240,305 172,000 45661T-AD-3 INERGY LP/INERGY FIN 8.25% 3/1/16 8.250 04/24/2008 Exchanged 1,020,000 1,000,000 13,292 50075N-AS-3 KRAFT FOODS INC 6.5% 8/11/2017 6.500 08/ 05/01/2008 MORGAN J P SEC INC. 1,198,676 1,143,000 17,542 55262T-GA-5 MBNAM 2001-B A 1.455 03/15/2011 07/11/2008 LEHMAN BROTHERS KUHN LOEB INC. 1270 1,969,531 2,000,000 152 615394-AH-6 MOOG INC 7.25% 6/15/2018 7.250 06/15/201 05/28/2008 BANK OF AMERICA 1,000,000 1,000,000 61745M-W4-1 MSC 2005-T17 A5 4.780 12/01/2014 01/10/2008 MORGAN STANLEY & CO. INC 4,934,961 5,000,000 9,294 637432-LM-5 NATIONAL RURAL UTIL COOP 5.5% 7/1/2013 5 06/23/2008 MERRILL LYNCH 2,995,320 3,000,000 68389X-AC-9 ORACLE CORP 5.75% 4/15/2018 5.750 04/15/ 04/02/2008 MORGAN STANLEY & CO. INC 2,998,590 3,000,000 736508-J*-4 PORTLAND GENERAL ELECTRIC COMPANY 4.450 04/15/2008 MORGAN J P SEC INC. 2,500,000 2,500,000 76803@-AQ-0 RIVER BEND FUEL SERVICES INC 5.560% 05/ 05/15/2008 FIRST UNION SECURITIES INC 3,000,000 3,000,000 94978#-AN-7 COMMONWEALTH EDISON COMPANY EXELON CORP 10/17/2008 CAPITALIZED INTEREST94983H-AL-0 WFMBS 2005-11 2A7 5.500 10/01/2035 12/01/2008 CAPITALIZED INTEREST 254,116 254,116 060340-A*-7 BANCO DEL ISTMO 5.930% 12/15/11 5.858 12 F 01/29/2008 CAPITALIZED INTEREST 1 1 23303A-AA-1 DASA FINANCE CORP 8.75% 5/29/2018 8.750 F 05/21/2008 FIRST BOSTON CORPORATION 983,740 1,000,000 G2978#-AC-7 ELECTRICITY SUPPLY BOARD SER 5.190% 12/ F 05/21/2008 BARCLAYS BANK OF N Y 973,150 1,000,000 22,490 4599999 - Total - Bonds - Industrial, Misc. 75,109,984 75,647,117 265,926 6099997 - Total - Bonds - Part 3 130,073,273 130,060,524 570,083 6099998 - Total - Bonds - Part 5 27,945,542 27,951,648 35,904 6099999 - Total - Bonds 158,018,815 158,012,172 605,987 6599998 - Total - Preferred Stocks - Part 5 XXX6599999 - Total - Preferred Stocks XXX902549-80-7 UNITED AIRLINES 03/22/2006 EXCHANGES (UNLIKE) 613.000 25,668 6899999 - Total - Common Stocks - Industrial, Misc. 25,668 XXX
E13
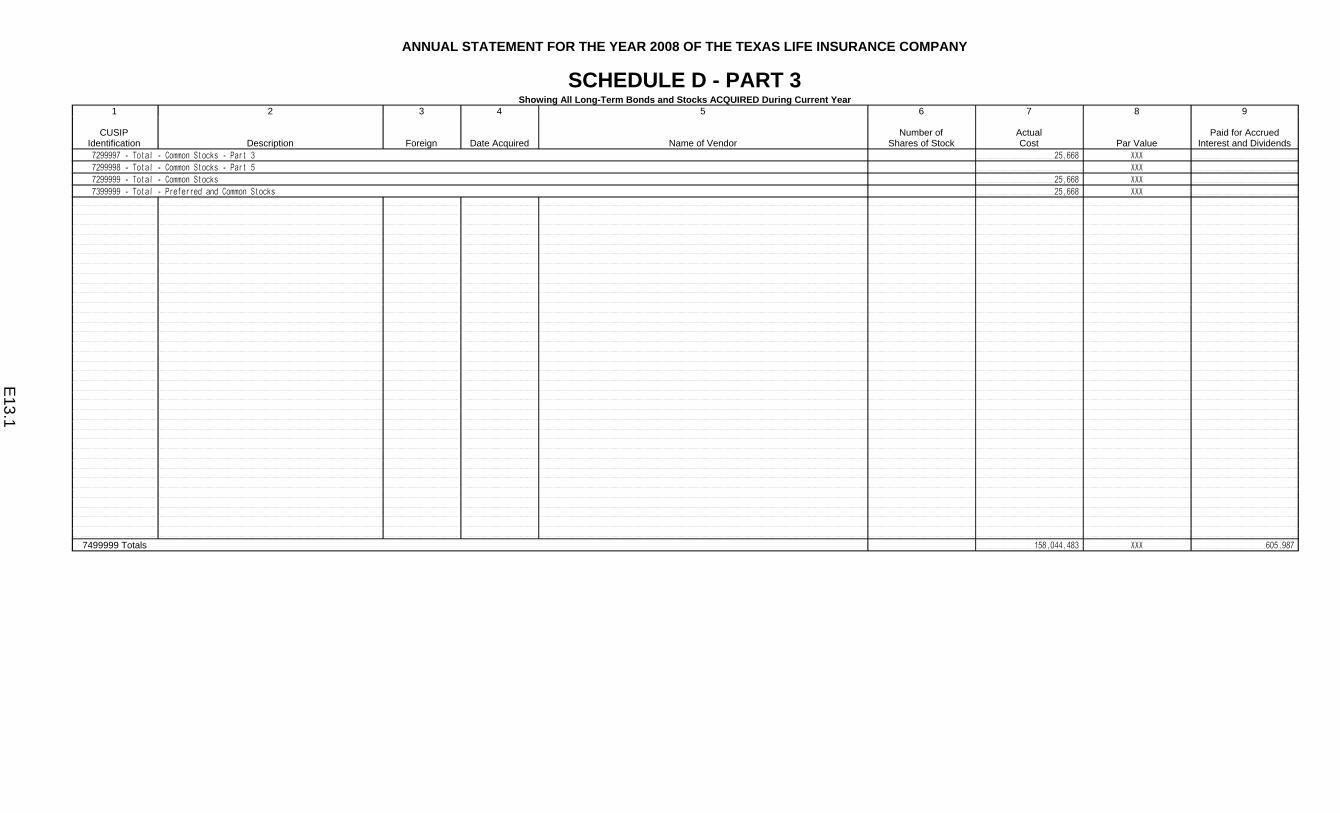
ANNUAL STATEMENT FOR THE YEAR 2008 OF THE TEXAS LIFE INSURANCE COMPANY
SCHEDULE D - PART 3Showing All Long-Term Bonds and Stocks ACQUIRED During Current Year
1 2 3 4 5 6 7 8 9
CUSIPIdentification Description Foreign Date Acquired Name of Vendor
Number of Shares of Stock
ActualCost Par Value
Paid for AccruedInterest and Dividends
7299997 - Total - Common Stocks - Part 3 25,668 XXX7299998 - Total - Common Stocks - Part 5 XXX7299999 - Total - Common Stocks 25,668 XXX7399999 - Total - Preferred and Common Stocks 25,668 XXX
7499999 Totals 158,044,483 XXX 605,987
E13.1

ANNUAL STATEMENT FOR THE YEAR 2008 OF THE TEXAS LIFE INSURANCE COMPANY
SCHEDULE D - PART 4Showing all Long-Term Bonds and Stocks SOLD, REDEEMED or Otherwise DISPOSED OF During Current Year
1 2 3 4 5 6 7 8 9 10 Change in Book/Adjusted Carrying Value 16 17 18 19 20 21
CUSIPIdenti-fication Description
Foreign
DisposalDate Name of Purchaser
Number ofShares of
Stock Consideration Par Value Actual Cost
Prior Year Book/Adjusted
Carrying Value
11
Unrealized Valuation Increase/
(Decrease)
12
Current Year (Amortization)/
Accretion
13
Current Year’s Other Than Temporary Impairment Recognized
14
Total Change inB/A. C.V.
(11 + 12 - 13)
15
Total Foreign Exchange Change inB/A. C.V.
Book/Adjusted
Carrying Value at
Disposal Date
Foreign Exchange Gain
(Loss) on Disposal
Realized Gain (Loss) on Disposal
Total Gain (Loss) on Disposal
Bond Interest/Stock
Dividends Received
During YearMaturity
Date161990-6A-9 FHA/VA CHASE LINCOLN MANHATTEN 12/18/2008 MBS PAYDOWN 1,611 1,611 1,446 1,589 22 22 1,611 104 10/01/2013338994-AA-4 FHA/VA FLEET 88-10 1ST UNION 12/18/2008 VARIOUS 5,002 5,002 4,733 4,959 44 44 5,002 255 08/01/201036202D-LU-3 GNMA II 6.500% 003039 12/01/2008 MBS PAYDOWN 10,767 10,767 10,628 10,754 13 13 10,767 343 01/01/203036202D-NL-1 GNMA II 6.500% 003095 12/01/2008 MBS PAYDOWN 3,564 3,564 3,518 3,561 3 3 3,564 113 05/01/203036202D-PS-4 GNMA II 6.500% 003133 12/01/2008 MBS PAYDOWN 13,045 13,045 12,886 13,030 14 14 13,045 429 10/01/203036205S-CN-3 GNMA I 8.000% 398877 12/01/2008 MBS PAYDOWN 167,073 167,073 168,662 167,512 (439) (439) 167,073 5,562 01/01/202536225B-QQ-4 GNMA I 8.000% 781363 12/01/2008 MBS PAYDOWN 15,758 15,758 16,120 15,782 (24) (24) 15,758 605 08/01/202236225B-QX-9 GNMA I 9.000% 781370 12/01/2008 MBS PAYDOWN 2,485 2,485 2,677 2,497 (12) (12) 2,485 133 12/01/2019374990-9A-9 FHA/VA GIBRALTAR CHASE-TROY 06/30/2008 VARIOUS 5,668 5,668 4,436 5,661 7 7 5,668 27 07/01/2008493915-AB-8 KPAC A A1 12/01/2008 MBS PAYDOWN 2,918 2,918 2,354 2,892 26 26 2,918 93 01/01/2017632990-9A-7 FHA/VA HORIZON 90-4 NATIONSBK 12/18/2008 MBS PAYDOWN 33,662 33,662 32,485 33,526 136 136 33,662 (17,657) 05/01/2020912810-FT-0 T 4 1/2 02/15/36 06/17/2008 CITICORP SECURITIES INC 4,300,664 4,500,000 4,336,875 4,341,701 1,273 1,273 4,342,974 (42,310) (42,310) 170,234 02/15/2036912828-JA-9 T 2 5/8 05/31/10 06/24/2008 DEUTSCHE BANK (U K) 2,988,047 3,000,000 2,982,656 166 166 2,982,822 5,224 5,224 5,379 05/31/2010
0399999 - Bonds - U.S. Governments 7,550,264 7,761,553 7,579,476 4,603,464 1,229 1,229 7,587,349 (37,086) (37,086) 165,620 XXX221597-AF-4 COSTA RICA, REPUBLIC OF F 09/24/2008 ABN AMRO 126,000 100,000 119,750 117,836 (649) (649) 117,188 8,812 8,812 11,605 08/01/202025714P-AF-5 DOMINICAN REPUBLIC 08/05/2008 MORGAN J P SEC INC. 33,117 32,789 32,134 32,279 67 67 32,346 772 772 3,088 01/23/2018401494-AD-1 GUATEMALA, REPUBLIC OF F 12/19/2008 MORGAN J P SEC INC. 445,000 500,000 538,750 537,774 (460) (460) 537,314 (92,314) (92,314) 49,427 10/06/2034
1099999 - Bonds - All Other Governments 604,117 632,789 690,634 687,889 (1,042) (1,042) 686,848 (82,730) (82,730) 64,120 XXX
586120-BK-2MEMPHIS-SHELBY CNTY TENN INDL DEV REV BD 08/01/2008 SINKING FUND REDEMPTION 24,128 24,128 24,128 24,128 24,128 1,299 08/01/2015
2499999 - Bonds - Political Subdivisions 24,128 24,128 24,128 24,128 24,128 1,299 XXX31283H-2T-1 FHLMC 7.500% G01686 12/01/2008 MBS PAYDOWN 41,090 41,090 41,000 41,084 6 6 41,090 1,585 10/01/202831283K-WE-4 FHLMC 4.500% G11545 12/01/2008 MBS PAYDOWN 173,735 173,735 172,244 173,619 116 116 173,735 4,123 12/01/20173128JR-G2-6 FHLMC 4.740% 847417 (HYBRID 3/1) 12/15/2008 VARIOUS 720,260 720,260 719,472 720,260 720,260 16,604 04/01/20353128M1-AB-5 FHLMC 5.000% G11902 07/15/2008 VARIOUS 2,988,855 3,002,030 2,926,042 2,936,363 7,221 7,221 2,943,583 45,272 45,272 90,118 12/01/20193128M1-RP-6 FHLMC 5.000% G12394 12/01/2008 MBS PAYDOWN 385,523 385,523 376,758 384,746 777 777 385,523 9,931 02/01/2020312903-P8-4 FHR 162 F 12/15/2008 VARIOUS 9,742 9,742 9,897 9,745 (3) (3) 9,742 340 07/15/201731335G-HW-8 FHLMC 7.500% C80245 12/01/2008 MBS PAYDOWN 5,615 5,615 5,373 5,607 7 7 5,615 164 01/01/202331348H-LY-2 FHLMC 3.686% 605743 (ARM 1/1) 12/15/2008 VARIOUS 1,110 1,110 1,146 1,123 (12) (12) 1,110 52 06/01/201831349S-VX-8 FHLMC 4.262% 781530 (HYBRID 3/1) 12/15/2008 VARIOUS 829,855 829,855 827,650 829,855 829,855 17,183 05/01/2034
3134A4-QD-9 FHLMC 5 1/8 07/15/12 06/26/2008GOLDMAN, SACHS & CO. (DOMESTIC) 5,208,990 5,000,000 4,933,955 4,950,688 4,761 4,761 4,955,449 253,541 253,541 243,438 07/15/2012
31358M-PL-2 FNR G92-24 Z 12/01/2008 MBS PAYDOWN 96,656 96,656 97,350 96,668 (12) (12) 96,656 3,136 03/01/202231358P-CB-1 FNR G92-40 ZC 12/01/2008 MBS PAYDOWN 54,684 54,684 54,769 54,684 54,684 1,973 07/01/202231364H-AE-7 FNS C 1 12/01/2008 MBS PAYDOWN 2,377 2,377 1,866 2,345 32 32 2,377 71 03/01/200931365D-L9-4 FNMA 8.500% 124652 12/01/2008 MBS PAYDOWN 5,083 5,083 5,158 5,095 (12) (12) 5,083 213 03/01/201831371E-2L-8 FNMA 7.500% 250179 12/01/2008 MBS PAYDOWN 9,102 9,102 8,670 9,085 17 17 9,102 439 11/01/202231395X-MJ-1 FHR 3015 BM 12/01/2008 MBS PAYDOWN 799,018 799,018 805,261 800,147 (1,129) (1,129) 799,018 31,716 11/01/200931396V-R6-7 FNR 2007-42 A 10/27/2008 VARIOUS 2,780,465 2,760,114 2,774,993 2,770,751 (830) (830) 2,769,921 10,544 10,544 131,184 07/01/201831402W-S7-4 FNMA 4.000% 740442 12/01/2008 MBS PAYDOWN 236,133 236,133 231,983 235,839 295 295 236,133 5,081 04/01/201831403E-CF-2 FNMA 4.000% 746270 12/01/2008 MBS PAYDOWN 280,261 280,261 272,116 279,730 532 532 280,261 6,032 04/01/201831404Q-L8-0 FNMA 5.000% 775351 12/01/2008 MBS PAYDOWN 179,235 179,235 172,766 179,106 129 129 179,235 4,745 10/01/203331404Q-MK-2 FNMA 5.000% 775362 12/01/2008 MBS PAYDOWN 157,916 157,916 152,217 157,794 122 122 157,916 4,403 09/01/203331404Q-TB-5 FNMA 5.000% 775546 12/01/2008 MBS PAYDOWN 229,794 229,794 221,499 229,505 288 288 229,794 7,704 08/01/203331407L-GT-8 FNMA 4.985% 833710 (HYBRID 7/1) 12/01/2008 MBS PAYDOWN 334,335 334,335 329,464 334,054 282 282 334,335 9,002 08/01/203569573V-AC-7 PWT L 4 12/01/2008 MBS PAYDOWN 1,537 1,537 1,466 1,535 3 3 1,537 72 03/01/2013
3199999 - Bonds - Special Revenues 15,531,371 15,315,205 15,143,115 15,209,428 12,590 12,590 15,222,014 309,357 309,357 589,309 XXX233331-AE-7 DTE ENERGY CO NT 09/23/2008 MORGAN J P SEC INC. 514,155 500,000 498,690 499,447 109 109 499,555 14,600 14,600 28,885 06/01/201126439R-AR-7 DUKE CAPITAL LLC 10/07/2008 CANTOR FITZGERALD & CO 1,970,000 2,000,000 1,968,480 1,991,433 5,643 5,643 1,997,076 (27,076) (27,076) 96,868 03/01/2009
29271@-AA-7ENERGY NETWORK INC. - SR. SECURED NOTES 10/23/2008 VARIOUS 666,667 666,667 666,667 666,667 666,667 39,998 11/01/2009
30257G-AA-9FPL ENERGY NATIONAL WIND 5.608% 3/10/24 09/10/2008 SINKING FUND REDEMPTION 88,770 88,770 88,707 128 128 88,770 2,489 03/10/2024
81487*-AS-1VIRGINIA ELECTRIC AND POWER CO 9.100% 09 10/02/2008 VARIOUS 83,909 83,909 83,909 83,909 83,909 4,875 09/13/2009
85746*-CB-4VIRGINIA ELEC&PWR CO/ENRONCORP (CASH V) 11/17/2008 PRIOR YEAR INCOME 1,637 02/12/2007
88031T-AA-2 TENASKA OKLAHOMA I 12/30/2008 VARIOUS 263,880 263,880 263,880 263,880 263,880 11,778 12/30/20143899999 - Bonds - Public Utilities 3,587,381 3,603,226 3,570,333 3,505,336 5,880 5,880 3,599,857 (12,476) (12,476) 186,530 XXX
02355#-AB-9AMERADA HESS FACILITIES BUSINESS TRUST 01/02/2008 SINKING FUND REDEMPTION 14,455 14,455 14,455 14,455 14,455 622 01/02/2023
05949Q-AA-3 BAFC 2006-2 1A1 12/01/2008 MBS PAYDOWN 37,465 37,465 35,100 37,385 79 79 37,465 1,108 10/01/203205950F-AL-9 BAFC 2006-4 A11 12/01/2008 VARIOUS 251,691 251,691 251,278 251,672 19 19 251,691 8,265 10/01/201507383F-AB-4 BSCMS 1998-C1 A2 12/01/2008 MBS PAYDOWN 2,639,793 2,639,793 2,666,567 2,639,793 2,639,793 65,227 06/01/200910468*-AA-2 BRADY CORPORATION 5.140% 06/28/14 06/30/2008 SINKING FUND REDEMPTION 285,714 285,714 285,714 285,714 285,714 7,343 06/28/2014126408-BL-6 CSX CORP 06/19/2008 BANK OF AMERICA 1,888,092 1,790,000 1,993,971 1,938,163 (5,612) (5,612) 1,932,551 (44,459) (44,459) 91,524 05/01/2017
E14

ANNUAL STATEMENT FOR THE YEAR 2008 OF THE TEXAS LIFE INSURANCE COMPANY
SCHEDULE D - PART 4Showing all Long-Term Bonds and Stocks SOLD, REDEEMED or Otherwise DISPOSED OF During Current Year
1 2 3 4 5 6 7 8 9 10 Change in Book/Adjusted Carrying Value 16 17 18 19 20 21
CUSIPIdenti-fication Description
Foreign
DisposalDate Name of Purchaser
Number ofShares of
Stock Consideration Par Value Actual Cost
Prior Year Book/Adjusted
Carrying Value
11
Unrealized Valuation Increase/
(Decrease)
12
Current Year (Amortization)/
Accretion
13
Current Year’s Other Than Temporary Impairment Recognized
14
Total Change inB/A. C.V.
(11 + 12 - 13)
15
Total Foreign Exchange Change inB/A. C.V.
Book/Adjusted
Carrying Value at
Disposal Date
Foreign Exchange Gain
(Loss) on Disposal
Realized Gain (Loss) on Disposal
Total Gain (Loss) on Disposal
Bond Interest/Stock
Dividends Received
During YearMaturity
Date12668B-SQ-7 CWALT 2006-6CB 2A10 12/01/2008 MBS PAYDOWN 231,726 231,726 232,577 231,783 (57) (57) 231,726 7,453 11/01/2019161505-CW-0 CCMSC 1998-2 A2 10/01/2008 MBS PAYDOWN 2,641,167 2,641,167 2,670,734 2,641,167 2,641,167 96,626 11/01/2008161571-CP-7 CHAIT 2008-A4 A4 08/04/2008 MORGAN J P SEC INC. 1,951,563 2,000,000 1,967,500 1,723 1,723 1,969,223 (17,661) (17,661) 32,292 03/15/2013200466-AB-6 COMM 1999-1 A2 07/01/2008 MBS PAYDOWN 2,376,331 2,376,331 2,388,952 2,376,331 2,376,331 59,252 08/01/2008201728-CU-4 CMAC 1998-C1 A2 03/01/2008 MBS PAYDOWN 303,388 303,388 307,916 303,388 303,388 4,062 03/01/2008201728-DL-3 CMAC 1998-C2 A3 05/01/2008 MBS PAYDOWN 2,323,003 2,323,003 2,360,026 2,323,003 2,323,003 28,980 06/01/200820763#-AL-5 GOODRICH CORP 9.340% 06/15/08 06/15/2008 VARIOUS 59,917 59,917 59,917 59,917 59,917 1,627 06/15/200820763#-AL-5 GOODRICH CORP 9.340% 06/15/08 06/15/2008 MATURITY 45,668 45,668 45,668 45,668 45,668 2,138 06/15/200820903H-AB-4 CONSOLIDATED COMMUNICATION HOLDINGS 04/01/2008 Called 649,000 649,000 649,000 649,000 649,000 31,815 04/01/201223321P-AC-2 DLJMA 1990-2 A 12/01/2008 MBS PAYDOWN 3,083 3,083 3,106 3,083 3,083 107 09/01/200723322B-CJ-5 DLJCM 1998-CG1 A1B 04/01/2008 MBS PAYDOWN 845,795 845,795 881,345 845,795 845,795 9,718 04/01/2008
247361-K*-8DELTA AIRLINES 1987-1 11.600% 07/02/08 01/15/2008 PRIOR YEAR INCOME 07/02/2008
26441Y-AL-1 DUKE REALTY LP 5.625 8/15/2011 02/08/2008 BEAR, STEARNS & CO., INC. 1,171,128 1,200,000 1,198,620 1,199,334 19 19 1,199,353 (28,225) (28,225) 33,375 08/15/201126441Y-AM-9 DUKE REALTY LP 5.95% 2/15/2017 02/28/2008 VARIOUS 1,327,000 1,500,000 1,544,880 1,541,521 (565) (565) 1,540,956 (213,956) (213,956) 48,096 02/15/201729587#-AF-3 ERNST & YOUNG LLP SR NTS SER C 07/25/2008 SINKING FUND REDEMPTION 249,912 249,912 264,849 (632) (632) 249,912 19,143 07/25/201730251T-AA-7 FNBC 1993-A PASS THRU TR PSTH 93A 01/05/2008 SINKING FUND REDEMPTION 101,149 101,149 103,683 101,149 101,149 4,086 01/05/201831331F-AZ-4 FEDERAL EXPRESS PASS 1998-1 1-C 07/15/2008 SINKING FUND REDEMPTION 63,107 63,107 61,423 62,909 198 198 63,107 2,672 01/15/2016337367-AB-2 FULBA 1998-C2 A2 06/19/2008 VARIOUS 1,685,060 1,685,060 1,767,734 1,685,060 1,685,060 22,831 05/01/200833736L-AS-4 FULB 1997-C2 B 03/01/2008 MBS PAYDOWN 57,785 57,785 59,443 57,959 (174) (174) 57,785 4,402 07/01/200833736X-BZ-1 FUNBC 2001-C2 A2 12/01/2008 MBS PAYDOWN 55,583 55,583 55,864 55,614 (31) (31) 55,583 2,945 02/01/2011
355145-B*-3FRANKLIN UNIVERSAL TRUST INC 5.870% 08/2 10/30/2008 Prepaid 353,846 353,846 353,846 353,846 3,181 08/28/2013
413627-AY-6HARRAHS OPERATING CO INC 10.75% 2/1/2016 12/24/2008 EXCHANGES (UNLIKE) 240,305 246,000 239,850 455 455 240,305 23,727 02/01/2016
416515-AC-8 HARTFORD FINL SVCS GROUP INC SR NT 11/01/2008 MATURITY 1,000,000 1,000,000 1,029,440 1,003,199 (3,199) (3,199) 1,000,000 63,750 11/01/2008436429-A#-1 HOLNAM INC 6.800% 12/21/08 12/21/2008 MATURITY 3,000,000 3,000,000 3,000,000 3,000,000 3,000,000 204,000 12/21/200844440*-AB-2 HUGHES AIRCRAFT 09/30/2008 SINKING FUND REDEMPTION 35,558 35,558 35,558 35,558 35,558 3,684 09/30/201244440*-AC-0 HUGHES AIRCRAFT 10/02/2008 VARIOUS 18,343 18,343 18,343 18,343 18,343 2,688 09/30/2012453083-LR-6 ISA 1988-1 A 12/01/2008 MBS PAYDOWN 264 264 264 264 264 9 02/01/201845661E-BP-8 RAST 2006-A2 A3 12/01/2008 MBS PAYDOWN 206,339 206,339 207,241 206,340 (1) (1) 206,339 6,365 11/01/2020501773-CS-2 LBCMT 1999-C1 A2 12/01/2008 MBS PAYDOWN 676,637 676,637 692,178 677,525 (888) (888) 676,637 29,486 04/01/2009501773-DG-7 LBCMT 1999-C2 A2 12/01/2008 MBS PAYDOWN 894,782 894,782 898,921 894,782 894,782 38,558 09/01/200958983*-BE-8 GE CAP POLARIS 10.550% 12/30/08 06/30/2008 Prepaid 29,334 29,334 29,334 29,334 29,334 3,095 12/30/200859023N-AQ-1 MLMI 2006-AF2 AF2 12/01/2008 MBS PAYDOWN 252,577 252,577 254,176 252,753 (176) (176) 252,577 8,268 06/01/2021
608328-AM-2 MOHEGAN TRIBAL 04/28/2008LEHMAN BROTHERS KUHN LOEB INC. 1270 99,625 100,000 100,000 100,000 100,000 (375) (375) 5,065 07/15/2009
617059-FB-1 JPMC 1999-C7 A2 07/01/2008 MBS PAYDOWN 1,210,937 1,210,937 1,143,579 1,201,871 9,067 9,067 1,210,937 35,814 07/01/200861745M-JF-1 MSC 1998-XL2 A2 10/07/2008 MBS PAYDOWN 2,979,339 2,979,339 2,713,642 2,951,701 27,638 27,638 2,979,339 129,646 10/01/200861745M-KZ-5 MSC 1999-RM1 B 09/01/2008 MBS PAYDOWN 3,000,000 3,000,000 2,892,539 2,975,544 24,456 24,456 3,000,000 153,225 09/01/200861746W-DZ-0 MSDWC 2000-LIF2 A2 12/01/2008 MBS PAYDOWN 196,144 196,144 206,902 196,512 (367) (367) 196,144 4,621 08/01/201061746W-ET-3 MSDWC 2001-PPM A3 12/01/2008 MBS PAYDOWN 157,444 157,444 158,271 157,460 (16) (16) 157,444 3,386 10/01/201161750C-AF-4 MSC 2006-HQ9 A4 10/09/2008 MORGAN STANLEY & CO. INC 2,090,527 2,500,000 2,520,117 2,518,863 (1,730) (1,730) 2,517,133 (426,606) (426,606) 122,978 06/01/2016695629-CD-5 PAINE WEBBER GROUP INC SR NT 04/15/2008 MATURITY 1,953,000 1,953,000 1,833,008 1,947,569 5,431 5,431 1,953,000 63,961 04/15/2008697933-AL-3 PANAMSAT CORP 01/15/2008 MATURITY 100,000 100,000 100,500 100,008 (8) (8) 100,000 3,188 01/15/200876110V-GF-9 RFMS2 2001-HS2 A5 12/01/2008 MBS PAYDOWN 96,563 96,563 96,527 96,563 96,563 3,981 12/01/2008795483-AG-1 SALOMON MTG IV 86-4 12/31/2008 MBS PAYDOWN 80 80 80 79 1 1 80 44 05/15/2016857689-AT-0 STATION CASINOS 07/14/2008 VARIOUS 92,000 200,000 204,418 203,063 (271) 90,792 (91,063) 112,000 (20,000) (20,000) 12,069 03/01/2016913017-BD-0 UNITED TECHNOLOGIES CORP NT 09/25/2008 MORGAN STANLEY & CO. INC 1,565,745 1,500,000 1,496,460 1,498,625 300 300 1,498,925 66,820 66,820 102,923 03/01/2011
94978#-AN-7COMMONWEALTH EDISON COMPANY EXELON CORP 12/15/2008 SINKING FUND REDEMPTION 48,559 48,559 48,559 48,559 48,559 1,778 05/15/2017
95648*-AL-2 WEST VIRGINIA-AMERICAN WATER C 12/01/2008 MATURITY 3,000,000 3,000,000 3,000,000 3,000,000 3,000,000 189,300 12/01/200897180*-BF-4 UNITED AIRLINES WILMINGTON TR 03/26/2003 EXCHANGES (UNLIKE) 35,343 124,889 306 306 306 306 35,037 35,037 03/27/200397180*-FB-9 GATX FINANCIAL 10.070% 03/31/10 04/07/2008 Prepaid 259,095 259,095 259,095 259,095 259,095 13,045 03/31/2010976592-AA-3 WISCONSIN CENT TRANSN CORP NT 04/15/2008 MATURITY 1,500,000 1,500,000 1,473,975 1,498,710 1,290 1,290 1,500,000 49,688 04/15/2008060340-A*-7 BANCO DEL ISTMO 5.930% 12/15/11 F 12/18/2008 SINKING FUND REDEMPTION 533,677 533,677 533,677 533,677 533,677 17,085 12/15/201121988J-AA-8 CORP INTERAMER DE ENTRET F 02/15/2008 Tender offer 496,699 500,000 495,935 496,659 39 39 496,699 7,519 06/14/201574819R-AK-2 QUEBECOR MEDIA 7.75% 3/15/16 08/12/2008 BANK OF AMERICA 463,750 500,000 468,750 469,459 1,085 1,085 470,544 (6,794) (6,794) 25,833 03/15/2016Q2593#-AA-5 COATES HIRE 4.760% 12/15/11 F 01/18/2008 Prepaid 2,000,000 2,000,000 2,000,000 2,000,000 2,000,000 8,727 12/15/2011Q2593#-AB-3 COATES HIRE 5.140% 12/15/14 F 01/18/2008 Prepaid 2,000,000 2,000,000 2,000,000 2,000,000 2,000,000 9,423 12/15/2014
Q9194#-AC-9TRANSURBAN FINANCE COMPANY PTY LIMITED 5 F 12/07/2007 SINKING FUND REDEMPTION 82,050 82,050 77,555 81,872 178 178 82,050 2,184 12/17/2019
4599999 - Bonds - Industrial and Miscellaneous 51,927,137 52,666,249 52,453,368 49,803,850 306 58,251 90,792 (32,235) 52,583,355 (656,219) (656,219) 1,938,003 XXX6099997 - Bonds - Part 4 79,224,398 80,003,150 79,461,054 73,834,095 306 76,908 90,792 (13,578) 79,703,551 (479,154) (479,154) 2,944,881 XXX6099998 - Bonds - Part 5 27,813,270 27,951,648 27,945,542 (3,932) (3,932) 27,941,609 (128,339) (128,339) 387,003 XXX6099999 - Total - Bonds 107,037,668 107,954,798 107,406,596 73,834,095 306 72,976 90,792 (17,510) 107,645,160 (607,493) (607,493) 3,331,884 XXX
007924-30-1 AEGON NV F 03/18/2008 MERRILL LYNCH 38,000.000 815,216 75.00 950,000 950,000 950,000 (134,784) (134,784) 15,141
E14.1

ANNUAL STATEMENT FOR THE YEAR 2008 OF THE TEXAS LIFE INSURANCE COMPANY
SCHEDULE D - PART 4Showing all Long-Term Bonds and Stocks SOLD, REDEEMED or Otherwise DISPOSED OF During Current Year
1 2 3 4 5 6 7 8 9 10 Change in Book/Adjusted Carrying Value 16 17 18 19 20 21
CUSIPIdenti-fication Description
Foreign
DisposalDate Name of Purchaser
Number ofShares of
Stock Consideration Par Value Actual Cost
Prior Year Book/Adjusted
Carrying Value
11
Unrealized Valuation Increase/
(Decrease)
12
Current Year (Amortization)/
Accretion
13
Current Year’s Other Than Temporary Impairment Recognized
14
Total Change inB/A. C.V.
(11 + 12 - 13)
15
Total Foreign Exchange Change inB/A. C.V.
Book/Adjusted
Carrying Value at
Disposal Date
Foreign Exchange Gain
(Loss) on Disposal
Realized Gain (Loss) on Disposal
Total Gain (Loss) on Disposal
Bond Interest/Stock
Dividends Received
During YearMaturity
Date6399999 - Preferred Stocks - Industrial and Miscellaneous 815,216 XXX 950,000 950,000 950,000 (134,784) (134,784) 15,141 XXX6599997 - Preferred Stocks - Part 4 815,216 XXX 950,000 950,000 950,000 (134,784) (134,784) 15,141 XXX6599998 - Preferred Stocks - Part 5 XXX XXX6599999 - Total - Preferred Stocks 815,216 XXX 950,000 950,000 950,000 (134,784) (134,784) 15,141 XXX
902549-80-7 UNITED AIRLINES 09/23/2008 UBS SECURITIES 613.000 7,280 25,668 25,668 25,668 (18,388) (18,388) 1,183 XXX6899999 - Common Stocks - Industrial and Miscellaneous 7,280 XXX 25,668 25,668 25,668 (18,388) (18,388) 1,183 XXX7299997 - Common Stocks - Part 4 7,280 XXX 25,668 25,668 25,668 (18,388) (18,388) 1,183 XXX7299998 - Common Stocks - Part 5 XXX XXX7299999 - Total - Common Stocks 7,280 XXX 25,668 25,668 25,668 (18,388) (18,388) 1,183 XXX7399999 - Total - Preferred and Common Stocks 822,496 XXX 975,668 975,668 975,668 (153,172) (153,172) 16,324 XXX
7499999 Totals 107,860,164 XXX 108,382,264 74,809,763 306 72,976 90,792 (17,510) 108,620,828 (760,665) (760,665) 3,348,208 XXX
E14.2
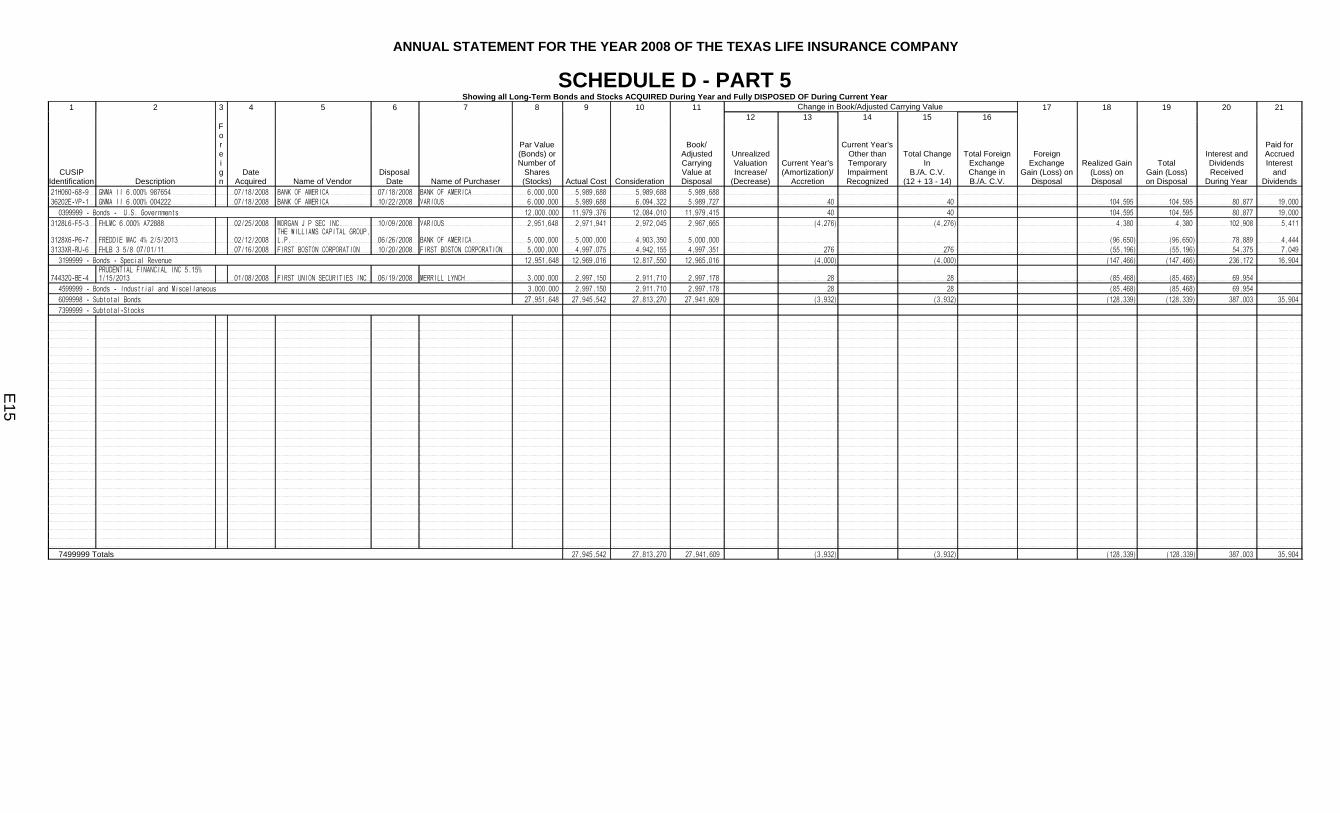
ANNUAL STATEMENT FOR THE YEAR 2008 OF THE TEXAS LIFE INSURANCE COMPANY
SCHEDULE D - PART 5Showing all Long-Term Bonds and Stocks ACQUIRED During Year and Fully DISPOSED OF During Current Year
1 2 3 4 5 6 7 8 9 10 11 Change in Book/Adjusted Carrying Value 17 18 19 20 2112 13 14 15 16
CUSIPIdentification Description
Foreign
DateAcquired Name of Vendor
DisposalDate Name of Purchaser
Par Value(Bonds) orNumber of
Shares(Stocks) Actual Cost Consideration
Book/AdjustedCarryingValue atDisposal
UnrealizedValuationIncrease/
(Decrease)
Current Year’s(Amortization)/
Accretion
Current Year’sOther thanTemporaryImpairmentRecognized
Total ChangeIn
B./A. C.V.(12 + 13 - 14)
Total ForeignExchangeChange inB./A. C.V.
ForeignExchange
Gain (Loss) onDisposal
Realized Gain(Loss) onDisposal
TotalGain (Loss)on Disposal
Interest andDividendsReceived
During Year
Paid forAccruedInterest
andDividends
21H060-68-9 GNMA II 6.000% 987654 07/18/2008 BANK OF AMERICA 07/18/2008 BANK OF AMERICA 6,000,000 5,989,688 5,989,688 5,989,688 36202E-VP-1 GNMA II 6.000% 004222 07/18/2008 BANK OF AMERICA 10/22/2008 VARIOUS 6,000,000 5,989,688 6,094,322 5,989,727 40 40 104,595 104,595 80,877 19,000
0399999 - Bonds - U.S. Governments 12,000,000 11,979,376 12,084,010 11,979,415 40 40 104,595 104,595 80,877 19,000
3128L6-F5-3 FHLMC 6.000% A72888 02/25/2008 MORGAN J P SEC INC. 10/09/2008 VARIOUS 2,951,648 2,971,941 2,972,045 2,967,665 (4,276) (4,276) 4,380 4,380 102,908 5,411
3128X6-P6-7 FREDDIE MAC 4% 2/5/2013 02/12/2008THE WILLIAMS CAPITAL GROUP, L.P. 06/26/2008 BANK OF AMERICA 5,000,000 5,000,000 4,903,350 5,000,000 (96,650) (96,650) 78,889 4,444
3133XR-RU-6 FHLB 3 5/8 07/01/11 07/16/2008 FIRST BOSTON CORPORATION 10/20/2008 FIRST BOSTON CORPORATION 5,000,000 4,997,075 4,942,155 4,997,351 276 276 (55,196) (55,196) 54,375 7,049
3199999 - Bonds - Special Revenue 12,951,648 12,969,016 12,817,550 12,965,016 (4,000) (4,000) (147,466) (147,466) 236,172 16,904
74432Q-BE-4PRUDENTIAL FINANCIAL INC 5.15% 1/15/2013 01/08/2008 FIRST UNION SECURITIES INC 06/19/2008 MERRILL LYNCH 3,000,000 2,997,150 2,911,710 2,997,178 28 28 (85,468) (85,468) 69,954
4599999 - Bonds - Industrial and Miscellaneous 3,000,000 2,997,150 2,911,710 2,997,178 28 28 (85,468) (85,468) 69,954
6099998 - Subtotal Bonds 27,951,648 27,945,542 27,813,270 27,941,609 (3,932) (3,932) (128,339) (128,339) 387,003 35,904
7399999 - Subtotal-Stocks
7499999 Totals 27,945,542 27,813,270 27,941,609 (3,932) (3,932) (128,339) (128,339) 387,003 35,904
E15

ANNUAL STATEMENT FOR THE YEAR 2008 OF THE TEXAS LIFE INSURANCE COMPANY
SCHEDULE D - PART 6 - SECTION 1Valuation of Shares of Subsidiary, Controlled or Affiliated Companies
1
2 3 4 5 6 7 8 Stock of Such Company Owned by Insurer on Statement Date
CUSIPIdentification
DescriptionName of Subsidiary, Controlled or
Affiliated Company Foreign
NAIC Company Code or
AlienInsurer
Identification Number
NAIC Valuation Method
(See SVO Purposes
and Procedures
Manual)
Do Insurer’s Admitted Assets Include
Intangible Assets
Connected with Holding
of Such Company’s
Stock?
Total Amount of Such Intangible
AssetsBook / Adjusted Carrying Value
9
Number of Shares
10
% of Outstanding
1999999 Totals XXX XXX1. Amount of insurer's capital and surplus from the prior period’s statutory statement reduced by any admitted EDP, goodwill and net deferred tax
assets included therein: $2. Total amount of intangible assets nonadmitted $
SCHEDULE D - PART 6 - SECTION 21 2 3 4
Total Amount of Intangible Assets
Stock in Lower-Tier Company Owned Indirectly by Insurer on
Statement Date
CUSIPIdentification Name of Lower-Tier Company
Name of Company Listed in Section 1 Which Controls Lower-Tier Company
Included in Amount Shown in Column 7,
Section 1
5
Number of Shares
6% of
Outstanding
0399999 Total XXX XXX
E16
NONE
NONE
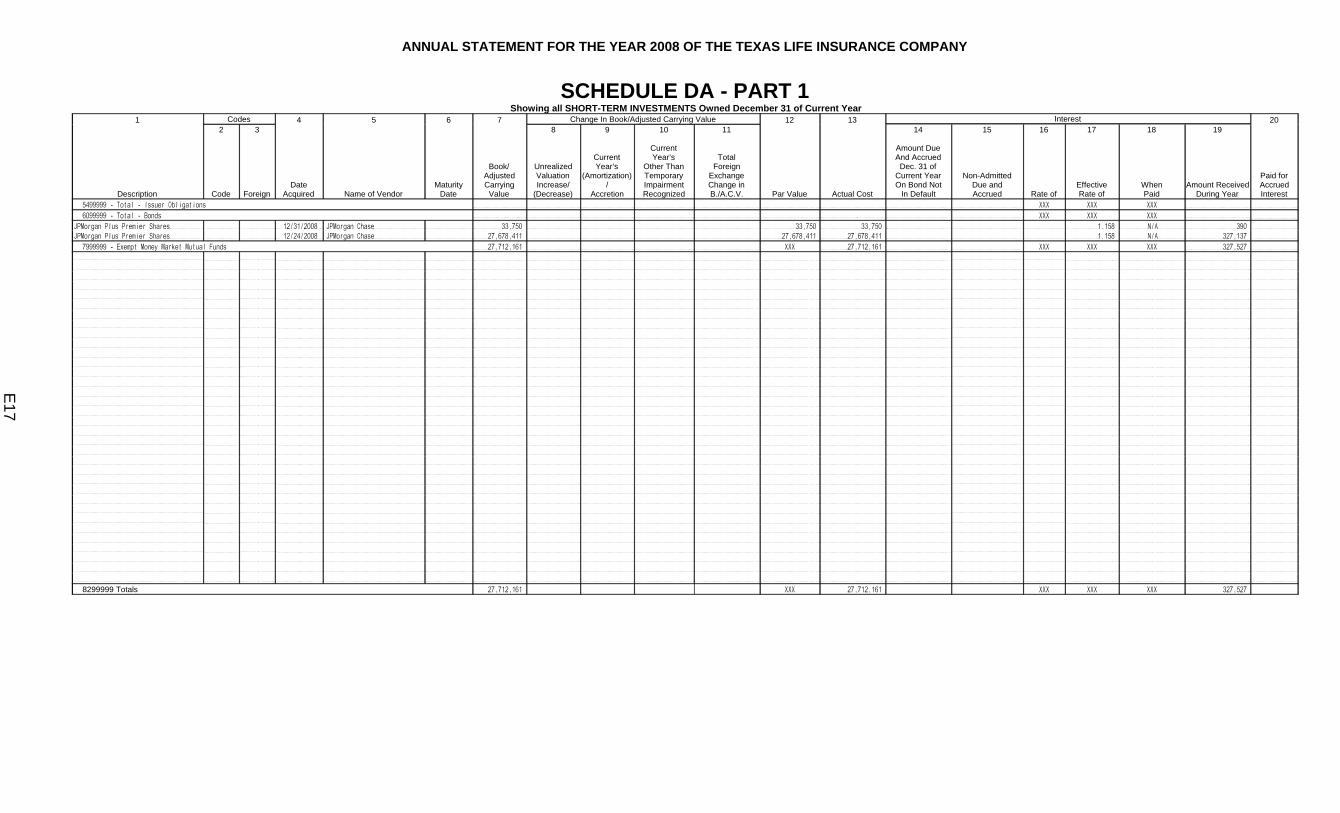
ANNUAL STATEMENT FOR THE YEAR 2008 OF THE TEXAS LIFE INSURANCE COMPANY
SCHEDULE DA - PART 1 Showing all SHORT-TERM INVESTMENTS Owned December 31 of Current Year
1 Codes 4 5 6 7 Change In Book/Adjusted Carrying Value 12 13 Interest 20
Description
2
Code
3
ForeignDate
Acquired Name of VendorMaturity
Date
Book/AdjustedCarrying
Value
8
UnrealizedValuationIncrease/
(Decrease)
9
CurrentYear’s
(Amortization)/
Accretion
10
CurrentYear’s
Other ThanTemporaryImpairmentRecognized
11
TotalForeign
ExchangeChange inB./A.C.V. Par Value Actual Cost
14
Amount DueAnd Accrued
Dec. 31 ofCurrent YearOn Bond Not
In Default
15
Non-AdmittedDue andAccrued
16
Rate of
17
EffectiveRate of
18
WhenPaid
19
Amount ReceivedDuring Year
Paid forAccruedInterest
5499999 - Total - Issuer Obligations XXX XXX XXX
6099999 - Total - Bonds XXX XXX XXX
JPMorgan Plus Premier Shares 12/31/2008 JPMorgan Chase 33,750 33,750 33,750 1.158 N/A 390 JPMorgan Plus Premier Shares 12/24/2008 JPMorgan Chase 27,678,411 27,678,411 27,678,411 1.158 N/A 327,137
7999999 - Exempt Money Market Mutual Funds 27,712,161 XXX 27,712,161 XXX XXX XXX 327,527
8299999 Totals 27,712,161 XXX 27,712,161 XXX XXX XXX 327,527
E17

ANNUAL STATEMENT FOR THE YEAR 2008 OF THE TEXAS LIFE INSURANCE COMPANY
Schedule DB - Part A - Section 1
NONESchedule DB - Part A - Section 2
NONESchedule DB - Part A - Section 3
NONESchedule DB - Part B - Section 1
NONESchedule DB - Part B - Section 2
NONESchedule DB - Part B - Section 3
NONESchedule DB - Part C - Section 1
NONESchedule DB - Part C - Section 2
NONESchedule DB - Part C - Section 3
NONESchedule DB - Part D - Section 1
NONESchedule DB - Part D - Section 2
NONE
E18, E19, E20, E21, E22, E23

ANNUAL STATEMENT FOR THE YEAR 2008 OF THE TEXAS LIFE INSURANCE COMPANY
Schedule DB - Part D - Section 3
NONESchedule DB - Part E - Section 1
NONE
E23, E24

ANNUAL STATEMENT FOR THE YEAR 2008 OF THE TEXAS LIFE INSURANCE COMPANY
SCHEDULE E - PART 1 - CASH1
Depository
2
Code
3
Rate ofInterest
4
Amount of InterestReceived
DuringYear
5
Amount of InterestAccrued
December 31 of Current Year
6
Balance
7
*Compass Bank, Regular Operations Waco, TX 1,640,575 XXXCompass Bank, Money Market Account Waco, TX 161,674 1,819,473 XXXCompass Bank, Property Management Waco, TX 1,300 XXXCompass Bank, Property Management Disbursements Waco, TX 65,601 XXXCompass Bank, Property Management Deposits Waco, TX 566,140 XXX 0199998 Deposits in 2 depositories which do not exceed the
allowable limit in any one depository (See Instructions) - open depositories XXX XXX 4,754 XXX0199999 Totals - Open Depositories XXX XXX 161,674 4,097,843 XXX
XXXXXXXXXXXXXXXXXXXXXXXXXXXXXXXXXXXXXXXXXXXXXXXXXXXXXXXXXXXXXXXXXXXXXXXXXXXXXXXXXXXXXXXXXXXXXXXXXXXXXXXXXXXXXXXXXXXXXXXXXXXXXXXXXXXXXXXXXXXXXXXXXXXXXXXXXXXXXXXXXXXXXXXXXXXXXXXXXXXXXXX
0399999 Total Cash on Deposit XXX XXX 161,674 4,097,843 XXX0499999 Cash in Company’s Office XXX XXX XXX XXX XXX0599999 Total Cash XXX XXX 161,674 4,097,843 XXX
TOTALS OF DEPOSITORY BALANCES ON THE LAST DAY OF EACH MONTH DURING THE CURRENT YEAR1. January 6,307,926 4. April 8,001,599 7. July 4,516,480 10. October 4,694,528 2. February 6,555,897 5. May 11,141,437 8. August 5,127,281 11. November 6,521,791 3. March 9,135,994 6. June 10,418,475 9. September 8,981,776 12. December 4,097,843
E25

ANNUAL STATEMENT FOR THE YEAR 2008 OF THE TEXAS LIFE INSURANCE COMPANY
SCHEDULE E - PART 2 - CASH EQUIVALENTS Show Investments Owned December 31 of Current Year
1 2 3 4 5 6 7 8
Description CodeDate
AcquiredRate ofInterest
MaturityDate
Book/AdjustedCarrying Value
Amount of Interest Due& Accrued
Amount ReceivedDuring Year
8799999 Totals
E26
NONE
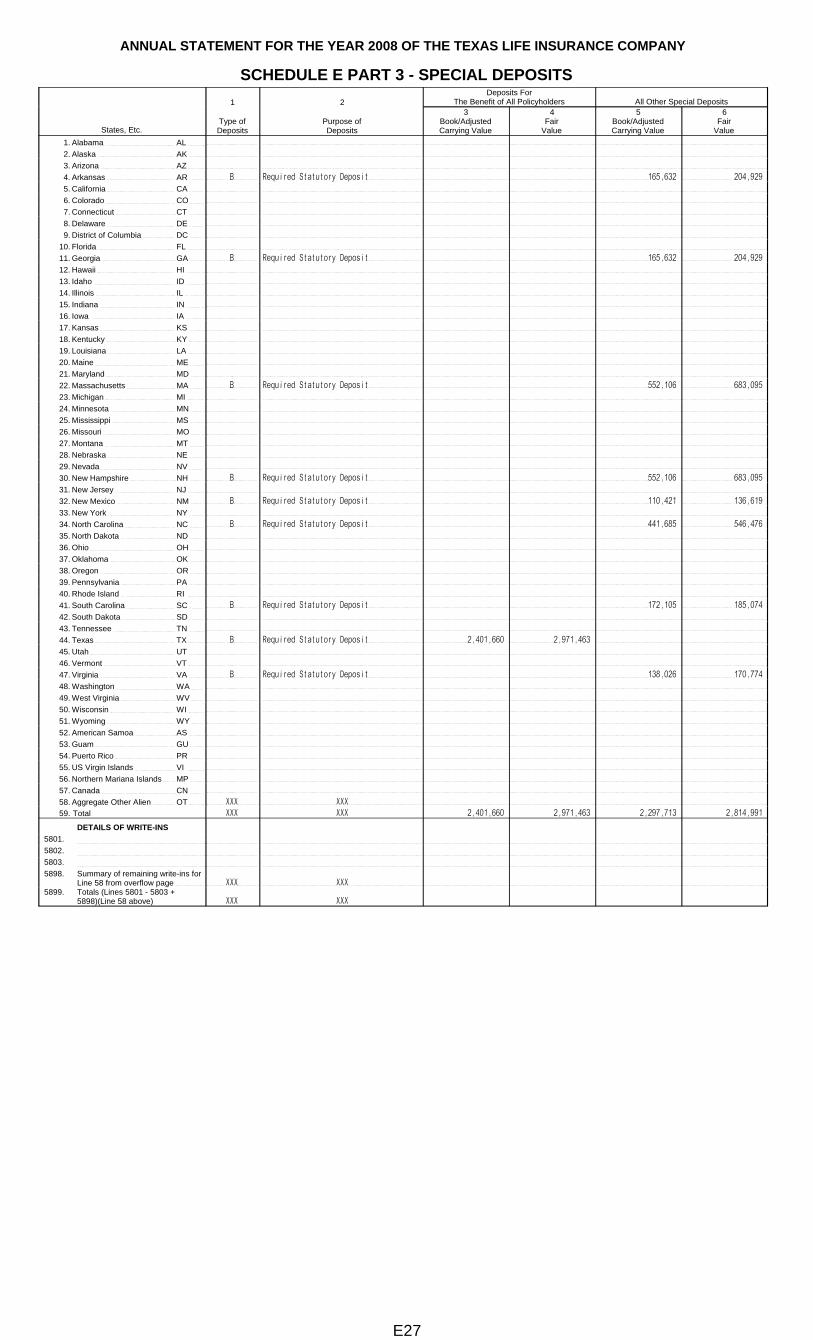
ANNUAL STATEMENT FOR THE YEAR 2008 OF THE TEXAS LIFE INSURANCE COMPANY
SCHEDULE E PART 3 - SPECIAL DEPOSITS1 2
Deposits ForThe Benefit of All Policyholders All Other Special Deposits
States, Etc.Type ofDeposits
Purpose ofDeposits
3Book/AdjustedCarrying Value
4Fair
Value
5Book/AdjustedCarrying Value
6Fair
Value1. Alabama AL 2. Alaska AK 3. Arizona AZ 4. Arkansas AR B Required Statutory Deposit 165,632 204,929 5. California CA 6. Colorado CO 7. Connecticut CT 8. Delaware DE 9. District of Columbia DC
10. Florida FL 11. Georgia GA B Required Statutory Deposit 165,632 204,929 12. Hawaii HI 13. Idaho ID 14. Illinois IL 15. Indiana IN 16. Iowa IA 17. Kansas KS 18. Kentucky KY 19. Louisiana LA 20. Maine ME 21. Maryland MD 22. Massachusetts MA B Required Statutory Deposit 552,106 683,095 23. Michigan MI 24. Minnesota MN 25. Mississippi MS 26. Missouri MO 27. Montana MT 28. Nebraska NE 29. Nevada NV 30. New Hampshire NH B Required Statutory Deposit 552,106 683,095 31. New Jersey NJ 32. New Mexico NM B Required Statutory Deposit 110,421 136,619 33. New York NY 34. North Carolina NC B Required Statutory Deposit 441,685 546,476 35. North Dakota ND 36. Ohio OH 37. Oklahoma OK 38. Oregon OR 39. Pennsylvania PA 40. Rhode Island RI 41. South Carolina SC B Required Statutory Deposit 172,105 185,074 42. South Dakota SD 43. Tennessee TN 44. Texas TX B Required Statutory Deposit 2,401,660 2,971,463 45. Utah UT 46. Vermont VT 47. Virginia VA B Required Statutory Deposit 138,026 170,774 48. Washington WA 49. West Virginia WV 50. Wisconsin WI 51. Wyoming WY 52. American Samoa AS 53. Guam GU 54. Puerto Rico PR 55. US Virgin Islands VI 56. Northern Mariana Islands MP 57. Canada CN 58. Aggregate Other Alien OT XXX XXX59. Total XXX XXX 2,401,660 2,971,463 2,297,713 2,814,991
DETAILS OF WRITE-INS5801.5802.5803.5898. Summary of remaining write-ins for
Line 58 from overflow page XXX XXX5899. Totals (Lines 5801 - 5803 +
5898)(Line 58 above) XXX XXX
E27
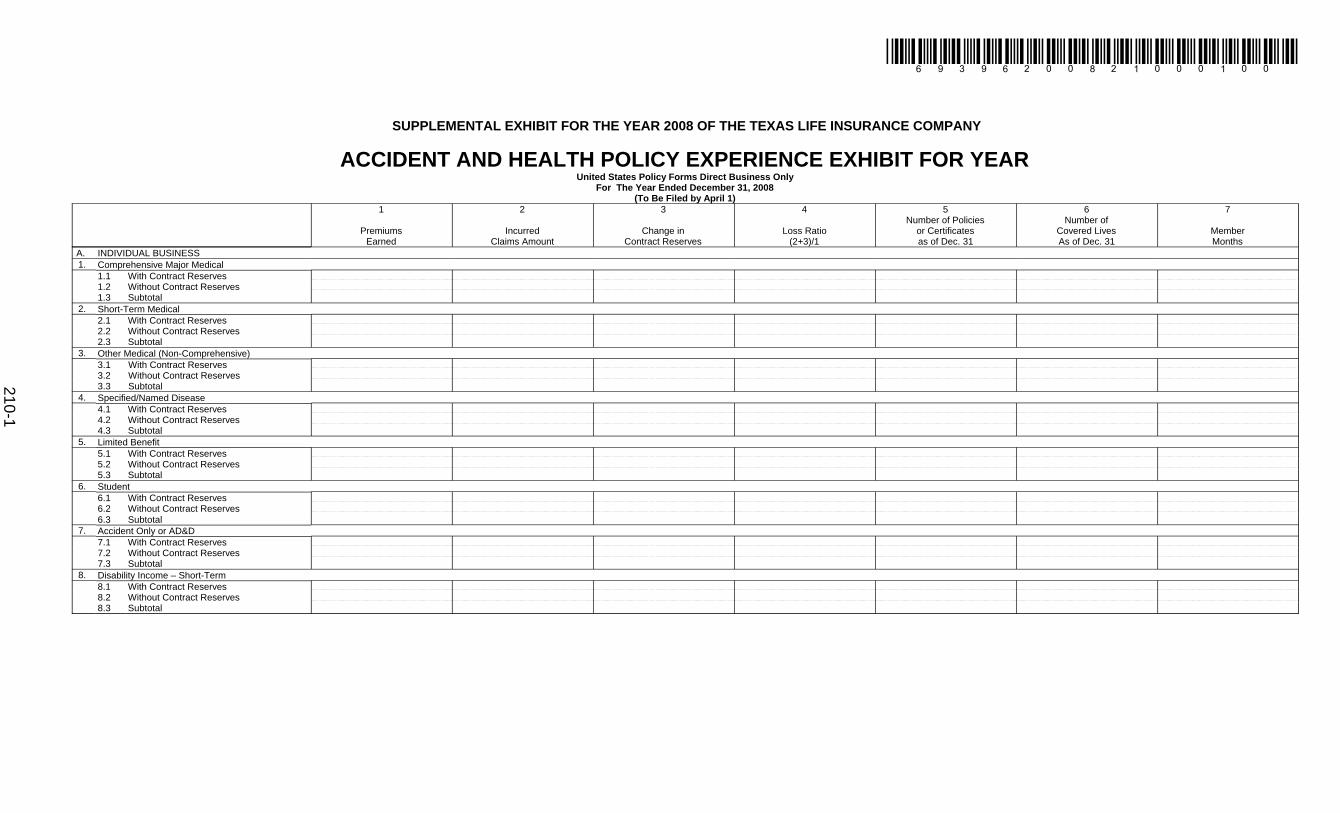
*69396200821000100*
SUPPLEMENTAL EXHIBIT FOR THE YEAR 2008 OF THE TEXAS LIFE INSURANCE COMPANY
ACCIDENT AND HEALTH POLICY EXPERIENCE EXHIBIT FOR YEARUnited States Policy Forms Direct Business Only
For The Year Ended December 31, 2008(To Be Filed by April 1)
1
PremiumsEarned
2
IncurredClaims Amount
3
Change inContract Reserves
4
Loss Ratio(2+3)/1
5Number of Policies
or Certificatesas of Dec. 31
6Number of
Covered LivesAs of Dec. 31
7
MemberMonths
A. INDIVIDUAL BUSINESS1. Comprehensive Major Medical
1.1 With Contract Reserves1.2 Without Contract Reserves1.3 Subtotal
2. Short-Term Medical2.1 With Contract Reserves2.2 Without Contract Reserves2.3 Subtotal
3. Other Medical (Non-Comprehensive)3.1 With Contract Reserves3.2 Without Contract Reserves3.3 Subtotal
4. Specified/Named Disease4.1 With Contract Reserves4.2 Without Contract Reserves4.3 Subtotal
5. Limited Benefit5.1 With Contract Reserves5.2 Without Contract Reserves5.3 Subtotal
6. Student6.1 With Contract Reserves6.2 Without Contract Reserves6.3 Subtotal
7. Accident Only or AD&D7.1 With Contract Reserves7.2 Without Contract Reserves7.3 Subtotal
8. Disability Income – Short-Term8.1 With Contract Reserves8.2 Without Contract Reserves8.3 Subtotal
210-1

SUPPLEMENTAL EXHIBIT FOR THE YEAR 2008 OF THE TEXAS LIFE INSURANCE COMPANY
ACCIDENT AND HEALTH POLICY EXPERIENCE EXHIBIT FOR YEARUnited States Policy Forms Direct Business Only
For The Year Ended December 31, 2008(To Be Filed by April 1)
1
PremiumsEarned
2
IncurredClaims Amount
3
Change inContract Reserves
4
Loss Ratio(2+3)/1
5Number of Policies
or Certificatesas of Dec. 31
6Number of
Covered LivesAs of Dec. 31
7
MemberMonths
A. INDIVIDUAL BUSINESS (Continued)9. Disability Income – Long-Term
9.1 With Contract Reserves9.2 Without Contract Reserves9.3 Subtotal
10. Long-Term Care10.1 With Contract Reserves10.2 Without Contract Reserves10.3 Subtotal
11. Medicare Supplement (Medigap)11.1 With Contract Reserves11.2 Without Contract Reserves11.3 Subtotal
12. Dental12.1 With Contract Reserves12.2 Without Contract Reserves12.3 Subtotal
13. State Children’s Health Insurance Program13.1 With Contract Reserves13.2 Without Contract Reserves13.3 Subtotal
14. Medicare14.1 With Contract Reserves14.2 Without Contract Reserves14.3 Subtotal
15. Medicaid15.1 With Contract Reserves15.2 Without Contract Reserves15.3 Subtotal
16. Other Individual Business16.1 With Contract Reserves 5,601 (6,362) (2,598) (159.971) 68 68 68 16.2 Without Contract Reserves16.3 Subtotal 5,601 (6,362) (2,598) (159.971) 68 68 68
17. Total Individual Business17.1 With Contract Reserves 5,601 (6,362) (2,598) (159.971) 68 68 68 17.2 Without Contract Reserves
18 Grand Total Individual 5,601 (6,362) (2,598) (159.971) 68 68 68
210-1.1
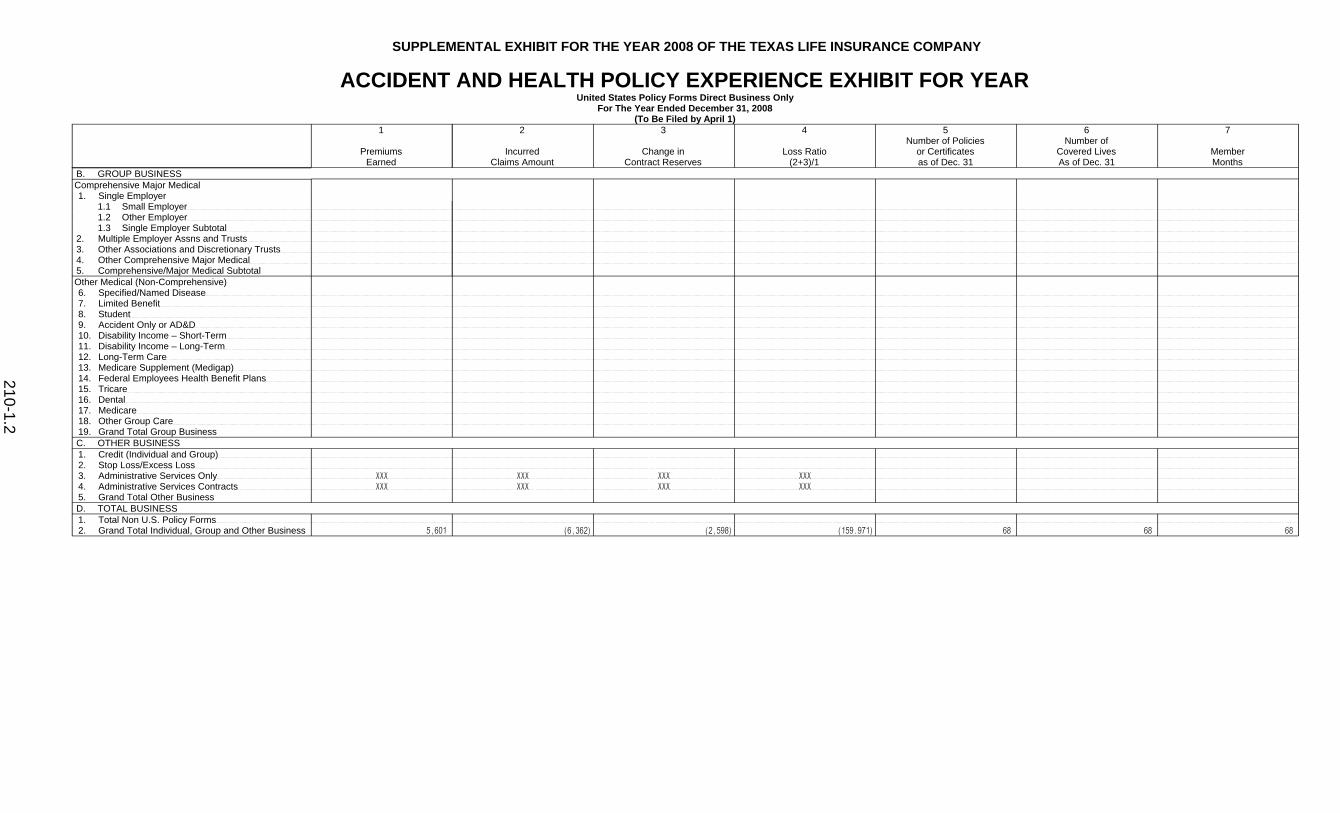
SUPPLEMENTAL EXHIBIT FOR THE YEAR 2008 OF THE TEXAS LIFE INSURANCE COMPANY
ACCIDENT AND HEALTH POLICY EXPERIENCE EXHIBIT FOR YEARUnited States Policy Forms Direct Business Only
For The Year Ended December 31, 2008(To Be Filed by April 1)
1
PremiumsEarned
2
IncurredClaims Amount
3
Change inContract Reserves
4
Loss Ratio(2+3)/1
5Number of Policies
or Certificatesas of Dec. 31
6Number of
Covered LivesAs of Dec. 31
7
MemberMonths
B. GROUP BUSINESSComprehensive Major Medical1. Single Employer
1.1 Small Employer1.2 Other Employer1.3 Single Employer Subtotal
2. Multiple Employer Assns and Trusts3. Other Associations and Discretionary Trusts4. Other Comprehensive Major Medical5. Comprehensive/Major Medical SubtotalOther Medical (Non-Comprehensive)6. Specified/Named Disease7. Limited Benefit8. Student9. Accident Only or AD&D10. Disability Income – Short-Term11. Disability Income – Long-Term12. Long-Term Care13. Medicare Supplement (Medigap)14. Federal Employees Health Benefit Plans15. Tricare16. Dental17. Medicare18. Other Group Care19. Grand Total Group BusinessC. OTHER BUSINESS1. Credit (Individual and Group)2. Stop Loss/Excess Loss3. Administrative Services Only XXX XXX XXX XXX4. Administrative Services Contracts XXX XXX XXX XXX5. Grand Total Other BusinessD. TOTAL BUSINESS1. Total Non U.S. Policy Forms2. Grand Total Individual, Group and Other Business 5,601 (6,362) (2,598) (159.971) 68 68 68
210-1.2

SUPPLEMENTAL EXHIBIT FOR THE YEAR 2008 OF THE TEXAS LIFE INSURANCE COMPANY
ACCIDENT AND HEALTH POLICY EXPERIENCE EXHIBIT FOR YEARPART 1 - INDIVIDUAL POLICIES
SUMMARY
Description
1
Premiums Earned
2
Incurred Claims Amount
3
Change in Contract Reserves
4Loss Ratio
(2+3)/11. U.S. Forms Direct Business 5,601 (6,362) (2,958) (166.399)2. Other Forms Direct Business3. Total Direct Business 5,601 (6,362) (2,958) (166.399)4. Reinsurance Assumed5. Less Reinsurance Ceded6. Total 5,601 (6,362) (2,958) (166.399)
PART 2 - GROUP POLICIESSUMMARY
Description
1
Premiums Earned
2
Incurred Claims Amount
3
Change in Contract Reserves
4Loss Ratio
(2+3)/11. U.S. Forms Direct Business2. Other Forms Direct Business3. Total Direct Business 4. Reinsurance Assumed5. Less Reinsurance Ceded6. Total
PART 3 - CREDIT POLICIES (Individual and Group)SUMMARY
Description
1
Premiums Earned
2
Incurred Claims Amount
3
Change in Contract Reserves
4Loss Ratio
(2+3)/11. U.S. Forms Direct Business2. Other Forms Direct Business3. Total Direct Business 4. Reinsurance Assumed5. Less Reinsurance Ceded6. Total
PART 4 – ALL INDIVIDUAL,GROUP AND CREDIT POLICIESSUMMARY
Description
1
Premiums Earned
2
Incurred Claims Amount
3
Change in Contract Reserves
4Loss Ratio
(2+3)/11. U.S. Forms Direct Business 5,601 (6,362) (2,958) (166.399)2. Other Forms Direct Business3. Total Direct Business 5,601 (6,362) (2,958) (166.399)4. Reinsurance Assumed5. Less Reinsurance Ceded6. Total 5,601 (6,362) (2,958) (166.399)
210-2
NONE
NONE

*69396200828000100*SUPPLEMENTAL EXHIBIT FOR THE YEAR 2008 OF THE TEXAS LIFE INSURANCE COMPANY
INTEREST SENSITIVE LIFE INSURANCE PRODUCTS REPORT
For The Year Ended December 31, 2008
(To Be Filed by April 1)
Address (City, State and Zip Code) Waco, TX 76701
NAIC Group Code 0241 NAIC Company Code 69396 Employer’s I.D. Number 74-0940890
280-1

SUPPLEMENTAL EXHIBIT FOR THE YEAR 2008 OF THE TEXAS LIFE INSURANCE COMPANY
ANALYSIS OF OPERATIONS BY LINES OF BUSINESSOrdinary Life Insurance Group Life Insurance
1Interest Sensitive
2Non-Interest Sensitive
3Total (Columns 1&2)
4Interest Sensitive
5Non-Interest Sensitive
6Total (Columns 4&5)
1. Premiums and annuity considerations for life and accident and health contracts 112,041,410 17,445,876 129,487,286 36,189 36,189 2. Considerations for supplementary contracts with life contingencies 3. Net investment income 27,073,890 7,306,858 34,380,748 2,553 2,553 4. Amortization of Interest Maintenance Reserve (IMR) (86,072) (24,097) (110,169) (8) (8)5. Separate Accounts net gain from operations excluding unrealized gains or losses 6. Commissions and expense allowances on reinsurance ceded 7. Reserve adjustments on reinsurance ceded 8. Miscellaneous Income:
8.1. Fees associated with income from investment management, administration, and contract guarantees from Separate Accounts
8.2. Charges and fees for deposit-type contracts 8.3. Aggregate write-ins for miscellaneous income 92,588 55,052 147,640
9. Totals (Lines 1 to 8.3) 139,121,816 24,783,689 163,905,505 38,734 38,734 10. Death benefits 44,722,515 7,368,635 52,091,150 136,198 136,198 11. Matured endowments (excluding guaranteed annual pure endowments) 102,508 102,508 12. Annuity benefits 13. Disability benefits and benefits under accident and health contracts 86,094 86,094 14. Coupons, guaranteed annual pure endowments and similar benefits 15. Surrender benefits and withdrawals for life contracts 13,173,664 2,126,509 15,300,173 16. Group conversions 17. Interest and adjustments on policy or deposit-type contract funds 156,987 156,987 18. Payments on supplementary contracts with life contingencies 19. Increase in aggregate reserves for life and accident and health contracts 20,578,089 9,151,195 29,729,284 17,988 17,988 20. Totals (Lines 10 through 19) 78,474,268 18,991,928 97,466,196 154,186 154,186 21. Commissions on premiums, annuity considerations, and deposit-type contract funds (direct business only) 28,733,891 2,697,165 31,431,056 2 2 22. Commissions and expense allowances on reinsurance assumed 23. General insurance expenses 13,065,579 2,719,551 15,785,130 4,477 4,477 24. Insurance taxes, licenses and fees, excluding federal income taxes 2,835,439 338,180 3,173,619 754 754 25. Increase in loading on deferred and uncollected premiums 87,822 87,822 26. Net transfers to or (from) Separate Accounts net of reinsurance27. Aggregate write-ins for deductions 38,268 38,268
28. Totals (Lines 20 to 27) 123,109,177 24,872,914 147,982,091 159,419 159,419 29. Net gain from operations before dividends to policyholders and federal income taxes (Line 9 minus Line 28) 16,012,639 (89,225) 15,923,414 (120,685) (120,685)30. Dividends to policyholders 3,796,214 3,796,214 31. Net gain from operations after dividends to policyholders and before federal income taxes (Line 29 minus Line 30) 16,012,639 (3,885,439) 12,127,200 (120,685) (120,685)32. Federal income taxes incurred (excluding tax on capital gains) 7,199,172 (1,359,904) 5,839,268 (42,240) (42,240)33. Net gain from operations after dividends to policyholders and FIT and before realized capital gains or (losses) (Line 31
minus Line 32) 8,813,467 (2,525,535) 6,287,932 (78,445) (78,445)
DETAILS OF WRITE-INS08.301. Other Income 92,588 55,052 147,640 08.302.08.303.08.398. Summary of remaining write-ins for Line 8.3 from overflow page 08.399. Totals (Lines 08.301 through 08.303 plus 08.398) (Line 8.3 above) 92,588 55,052 147,640 2701. Other Deductions 38,268 38,268 2702.2703.2798. Summary of remaining write-ins for Line 27 from overflow page2799. Totals (Lines 2701 through 2703 plus 2798) (Line 27 above) 38,268 38,268
280-2

SUPPLEMENTAL EXHIBIT FOR THE YEAR 2008 OF THE TEXAS LIFE INSURANCE COMPANY
ANALYSIS OF INCREASE IN RESERVES AND DEPOSIT FUNDS DURING THE YEAROrdinary Life Insurance Group Life Insurance
1Interest Sensitive
2Non-Interest Sensitive
3Total (Columns 1&2)
4Interest Sensitive
5Non-Interest Sensitive
6Total (Columns 4&5)
INVOLVING LIFE OR DISABILITY CONTINGENCIES (RESERVES)
(Net of Reinsurance Ceded)
1. Reserve December 31, prior year 393,408,017 135,429,255 528,837,272
2. Tabular net premiums or considerations 115,556,648 19,359,152 134,915,800 36,189 36,189
3. Present value of disability claims incurred 18,217 2,929 21,146 306 306
4. Tabular interest 21,788,960 7,557,816 29,346,776
5. Tabular less actual reserve released 26,321 11,939 38,260
6. Increase in reserve on account of change in valuation basis
7. Other increases (Net)
8. Totals (Lines 1 through 7) 530,798,163 162,361,091 693,159,254 36,495 36,495
9. Tabular cost 91,886,741 12,204,923 104,091,664 18,507 18,507
10. Reserves released by death 7,629,569 1,972,392 9,601,961
11. Reserves released by other terminations (net) 17,241,339 3,513,537 20,754,876
12. Annuity, supplementary contract, and disability payments involving life contingencies 54,408 31,686 86,094
13. Net transfers to or (from) Separate Accounts
14. Total deductions (Lines 9 through 13) 116,812,057 17,722,538 134,534,595 18,507 18,507
15. Reserve December 31, current year 413,986,106 144,638,553 558,624,659 17,988 17,988
280-3

SUPPLEMENTAL EXHIBIT FOR THE YEAR 2008 OF THE TEXAS LIFE INSURANCE COMPANY
OVERFLOW PAGE FOR WRITE-INS
280-4

*69396200828500100*SUPPLEMENTAL EXHIBIT FOR THE YEAR 2008 OF THE TEXAS LIFE INSURANCE COMPANY
SUPPLEMENTAL INVESTMENT RISKS INTERROGATORIESFor The Year Ended December 31, 2008
(To Be Filed by April 1)
OF The TEXAS LIFE INSURANCE COMPANY
Address (City, State and Zip Code) Waco, TX 76701
NAIC Group Code 0241 NAIC Company Code 69396 Employer’s ID Number 74-0940890
The Investment Risks Interrogatories are to be filed by April 1. They are also to be included with the Audited Statutory Financial Statements.
Answer the following interrogatories by reporting the applicable U. S. dollar amounts and percentages of the reporting entity’s total admitted assets held in that category of investments.
1. Reporting entity’s total admitted assets as reported on Page 2 of this annual statement. $ 664,998,192
2. Ten largest exposures to a single issuer/borrower/investment.
1
Issuer
2
Description of Exposure
3
Amount
4Percentage of Total
Admitted Assets
2.01 Kiowa Power Partners Bond $ 5,000,000 0.8 %
2.02 MSC 2005-T17 A5 Bond $ 4,942,077 0.7 %
2.03 JPMCC 2003-C1 Bond $ 4,941,832 0.7 %
2.04 St Paul Companies, Inc Bond $ 4,929,943 0.7 %
2.05 Verizon Bond $ 4,721,460 0.7 %
2.06 Apache Corporation Bond $ 4,708,779 0.7 %
2.07 News America Hldgs, Inc Bond $ 4,643,331 0.7 %
2.08 LS Pwr Fdg Corp Bond $ 4,612,745 0.7 %
2.09 Northern State Power Bond $ 4,484,649 0.7 %
2.10 McDonnell Couglas Corp Bond $ 4,230,994 0.6 %
3. Amounts and percentages of the reporting entity’s total admitted assets held in bonds and preferred stocks by NAIC rating.
Bonds 1 2 Preferred Stocks 3 4
3.01 NAIC-1 $ 408,534,070 61.4 % 3.07 P/RP-1 $ 14,250,650 2.1 %
3.02 NAIC-2 $ 107,328,178 16.1 % 3.08 P/RP-2 $ 3,999,148 0.6 %
3.03 NAIC-3 $ 20,213,976 3.0 % 3.09 P/RP-3 $ %
3.04 NAIC-4 $ 1,604,193 0.2 % 3.10 P/RP-4 $ %
3.05 NAIC-5 $ 214,890 0.0 % 3.11 P/RP-5 $ %
3.06 NAIC-6 $ 95,000 0.0 % 3.12 P/RP-6 $ %
4. Assets held in foreign investments:
4.01 Are assets held in foreign investments less than 2.5% of the reporting entity’s total admitted assets? Yes [ ] No [X]
4.02 Total admitted assets held in foreign investments $ 54,588,178 8.2 %
4.03 Foreign-currency-denominated investments $ %
4.04 Insurance liabilities denominated in that same foreign currency $ %
If response to 4.01 above is yes, responses are not required for interrogatories 5 – 10.
285

SUPPLEMENTAL EXHIBIT FOR THE YEAR 2008 OF THE TEXAS LIFE INSURANCE COMPANY
SUPPLEMENTAL INVESTMENT RISKS INTERROGATORIES (cont.)5. Aggregate foreign investment exposure categorized by NAIC sovereign rating:
1 2
5.01 Countries rated NAIC-1 $ 51,701,227 7.8 %
5.02 Countries rated NAIC-2 $ %
5.03 Countries rated NAIC-3 or below $ 2,886,952 0.4 %
6. Largest foreign investment exposures by country, categorized by NAIC sovereign rating:
1 2
Countries rated NAIC-1:
6.01 Country 1: Cayman Islands $ 7,345,057 1.1 %
6.02 Country 2: Netherlands $ 6,233,649 0.9 %
Countries rated NAIC-2:
6.03 Country 1: $ %
6.04 Country 2 $ %
Countries rated NAIC-3 or below:
6.05 Country 1: Panama $ 2,690,093 0.4 %
6.06 Country 2: Uruguay $ 196,859 0.0 %
1 2
7. Aggregate unhedged foreign currency exposure $ %
8. Aggregate unhedged foreign currency exposure categorized by the country’s NAIC sovereign rating:
1 2
8.01 Countries rated NAIC-1 $ %
8.02 Countries rated NAIC-2 $ %
8.03 Countries rated NAIC-3 or below $ %
9. Largest unhedged foreign currency exposures by country, categorized by the country’s NAIC sovereign rating:
Countries rated NAIC-1: 1 2
9.01 Country: $ %
9.02 Country: $ %
Countries rated NAIC-2:
9.03 Country: $ %
9.04 Country: $ %
Countries rated NAIC-3 or below:
9.05 Country: $ %
9.06 Country: $ %
10. Ten largest non-sovereign (i.e. non-governmental) foreign issues:
1Issuer
2NAIC Rating
3 4
10.01 Telefonica Emisiones SAU 1FE $ 4,000,000 0.6 %
10.02 Empresa nacional Del Petroleo 1FE $ 3,786,743 0.6 %
10.03 SMFG Preferred Capital 1FE $ 3,000,000 0.5 %
10.04 Danske Bank 1FE $ 3,000,000 0.5 %
10.05 Group 4 Securicor 3 $ 2,666,820 0.4 %
10.06 Transurban Finance Company Pty Lmimted 1FE $ 2,556,690 0.4 %
10.07 Contact Energy LTD 2 $ 2,443,825 0.4 %
10.08 Deutsche Telekom Int Fin 2FE $ 2,288,229 0.3 %
10.09 Lend Lease Corp Ltd 2FE $ 2,270,010 0.3 %
10.10 France Telecom 1FE $ 2,261,151 0.3 %
285.1

SUPPLEMENTAL EXHIBIT FOR THE YEAR 2008 OF THE TEXAS LIFE INSURANCE COMPANY
SUPPLEMENTAL INVESTMENT RISKS INTERROGATORIES (cont.)11. Amounts and percentages of the reporting entity’s total admitted assets held in Canadian investments and unhedged Canadian currency exposure:
11.01 Are assets held in Canadian investments less than 2.5% of the reporting entity’s total admitted assets? Yes [X] No [ ]
If response to 11.01 is yes, detail is not required for the remainder of Interrogatory 11
12. Report aggregate amounts and percentages of the reporting entity’s total admitted assets held in investments with contractual sales restrictions.
12.01 Are assets held in investments with contractual sales restrictions less than 2.5% of the reporting entity’s total admitted assets? Yes [X] No [ ]
If response to 12.01 is yes, responses are not required for the remainder of Interrogatory 12.
13. Amounts and percentages of admitted assets held in the ten largest equity interests:
13.01 Are assets held in equity interest less than 2.5% of the reporting entity’s total admitted assets Yes [ ] No [X]
If response to 13.01 above is yes, responses are not required for the remainder of Interrogatory 13.
1Name of Issuer
2 3
13.02 ING Cap Fdg Tr III Perp $ 3,089,163 0.5 %
13.03 Danske Bank A/S $ 3,000,000 0.5 %
13.04 SMFG Preferred Capital $ 3,000,000 0.5 %
13.05 Sumitomo Mitsui Banking $ 2,082,168 0.3 %
13.06 Aegon NV $ 2,050,000 0.3 %
13.07 Deutsche Bank Cap Fdg Tr 7 $ 1,980,559 0.3 %
13.08 Mainstreet Cap Tr 1 Cap Secs $ 1,046,228 0.2 %
13.09 UBS Pfd Funding Tr 1 $ 1,002,533 0.2 %
13.10 Swedbank $ 999,148 0.2 %
13.11 Portland Gen Elec Co $ 79,107 0.0 %
285.2

SUPPLEMENTAL EXHIBIT FOR THE YEAR 2008 OF THE TEXAS LIFE INSURANCE COMPANY
SUPPLEMENTAL INVESTMENT RISKS INTERROGATORIES (cont.)
14. Amounts and percentages of the reporting entity’s total admitted assets held in nonaffiliated, privately placed equities:
14.01 Are assets held in nonaffiliated, privately placed equities less than 2.5% of the reporting entity’s total admitted assets? Yes [X] No [ ]
If response to 14.01 above is yes, responses are not required for the remainder of Interrogatory 14.
15. Amounts and percentages of the reporting entity’s total admitted assets held in general partnership interests:
15.01 Are assets held in general partnership interests less than 2.5% of the reporting entity’s total admitted assets? Yes [X] No [ ]
If response to 15.01 is yes, responses are not required for the remainder of Interrogatory 15.
16. Amounts and percentages of the reporting entity’s total admitted assets held in mortgage loans:
16.01 Are mortgage loans reported in Schedule B less than 2.5% of the reporting entity’s total admitted assets? Yes [ ] No [X]
If response to 16.01 above is yes, responses are not required for the remainder of Interrogatory 16 and Interrogatory 17.
1Type (Residential, Commercial, Agricultural)
2 3
16.02 Commercial $ 2,989,928 0.4 %
16.03 Commercial $ 2,000,019 0.3 %
16.04 Agricultural $ 1,934,542 0.3 %
16.05 Agricultural $ 1,768,166 0.3 %
16.06 Agricultural $ 1,544,791 0.2 %
16.07 Agricultural $ 1,424,570 0.2 %
16.08 Agricultural $ 1,421,536 0.2 %
16.09 Agricultural $ 1,204,910 0.2 %
16.10 Agricultural $ 1,162,500 0.2 %
16.11 Agricultural $ 1,150,131 0.2 %
285.3

SUPPLEMENTAL EXHIBIT FOR THE YEAR 2008 OF THE TEXAS LIFE INSURANCE COMPANY
SUPPLEMENTAL INVESTMENT RISKS INTERROGATORIES (cont.)
Amount and percentage of the reporting entity’s total admitted assets held in the following categories of mortgage loans:
Loans
16.12 Construction Loans $ %
16.13 Mortgage loans over 90 days past due $ %
16.14 Mortgage loans in the process of foreclosure $ %
16.15 Mortgage loans foreclosed $ %
16.16 Restructured mortgage loans $ %
17. Aggregate mortgage loans having the following loan-to-value ratios as determined from the most current appraisal as of the annual statement date:
Residential Commercial AgriculturalLoan-to-Value 1 2 3 4 5 6
17.01 above 95% $ % $ % $ %
17.02 91% to 95% $ % $ % $ %
17.03 81% to 90% $ % $ % $ %
17.04 71% to 80% $ % $ 2,000,019 0.3 % $ %
17.05 below 70% $ % $ 8,433,148 1.3 % $ 30,266,780 4.6 %
18. Amounts and percentages of the reporting entity’s total admitted assets held in each of the five largest investments in real estate:
18.01Are assets held in real estate reported less than 2.5% of the reporting entity’s total admitted assets? Yes [X] No [ ]
If response to 18.01 above is yes, responses are not required for the remainder of Interrogatory 18.
19. Report aggregate amounts and percentages of the reporting entity’s total admitted assets held in investments held in mezzanine real estate loans:
19.01Are assets held in investments held in mezzanine real estate loans less than 2.5% of the reporting entity’s total admitted assets? Yes [X] No [ ]
If response to 19.01 above is yes, responses are not required for the remainder of Interrogatory 19.
285.4

SUPPLEMENTAL EXHIBIT FOR THE YEAR 2008 OF THE TEXAS LIFE INSURANCE COMPANY
SUPPLEMENTAL INVESTMENT RISKS INTERROGATORIES (cont.)
20. Amounts and percentages of the reporting entity’s total admitted assets subject to the following types of agreements:At Year-end At End of Each Quarter
1st Quarter 2nd Quarter 3rd Quarter1 2 3 4 5
20.01 Securities lending agreements (do not include assets held as collateral for such transactions) $ % $ $ $
20.02 Repurchase agreements $ % $ $ $20.03 Reverse repurchase agreements $ % $ $ $20.04 Dollar repurchase agreements $ % $ $ $20.05 Dollar reverse repurchase
agreements $ % $ $ $
21. Amounts and percentages of the reporting entity’s total admitted assets for warrants not attached to other financial instruments, options, caps, and floors:Owned Written
1 2 3 421.01 Hedging $ % $ %21.02
Income generation $ % $ %21.03
Other $ % $ %
22. Amounts and percentages of the reporting entity’s total admitted assets of potential exposure for collars, swaps, and forwards:
At Year-end At End of Each Quarter1st Quarter 2nd Quarter 3rd Quarter
1 2 3 4 522.01 Hedging $ % $ $ $22.02 Income generation $ % $ $ $22.03 Replications $ % $ $ $22.04 Other $ % $ $ $
23. Amounts and percentages of the reporting entity’s total admitted assets of potential exposure for futures contracts:
At Year-end At End of Each Quarter
1 21st Qtr
32nd Qtr
43rd Qtr
5
23.01 Hedging $ % $ $ $
23.02 Income generation $ % $ $ $
23.03 Replications $ % $ $ $
23.04 Other $ % $ $ $
285.5
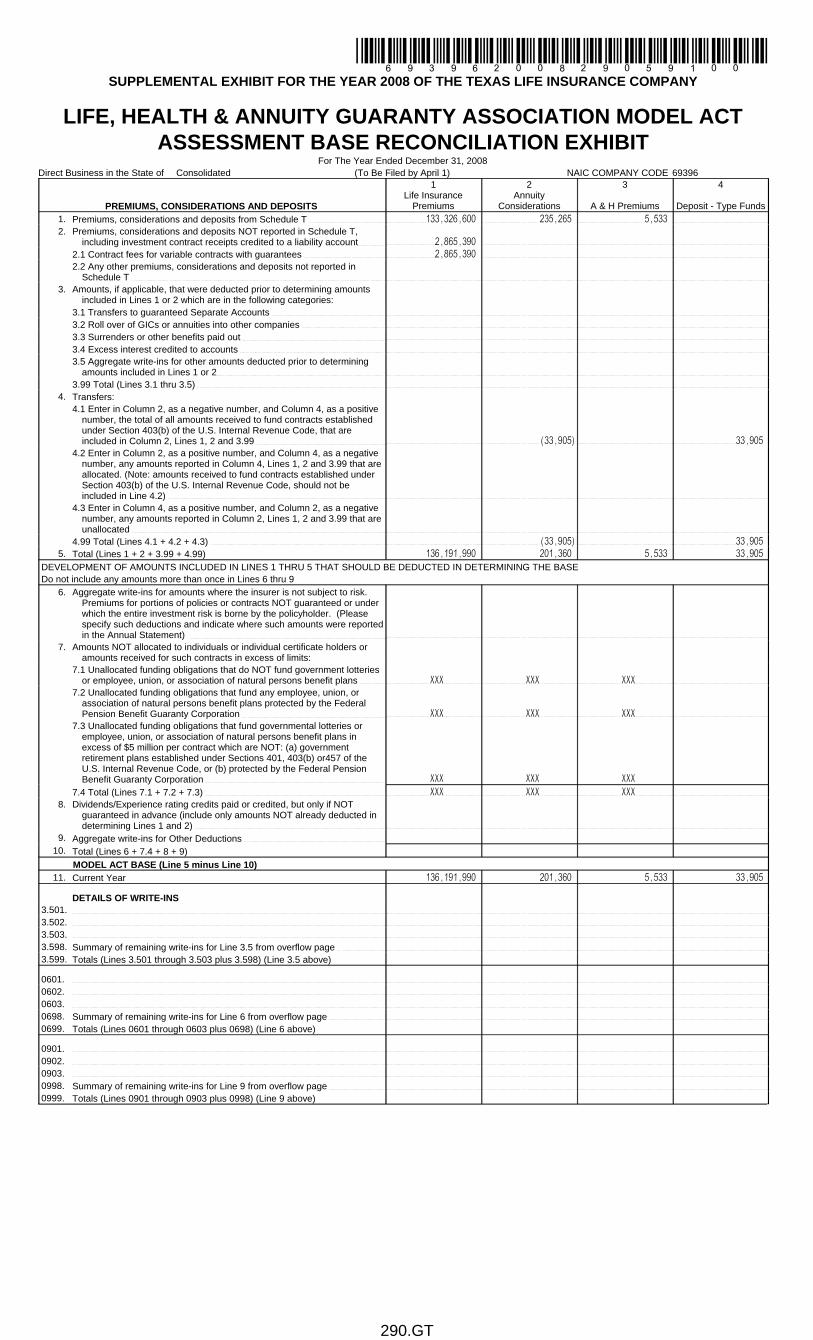
*69396200829059100*SUPPLEMENTAL EXHIBIT FOR THE YEAR 2008 OF THE TEXAS LIFE INSURANCE COMPANY
LIFE, HEALTH & ANNUITY GUARANTY ASSOCIATION MODEL ACTASSESSMENT BASE RECONCILIATION EXHIBIT
For The Year Ended December 31, 2008Direct Business in the State of Consolidated (To Be Filed by April 1) NAIC COMPANY CODE 69396
PREMIUMS, CONSIDERATIONS AND DEPOSITS
1Life Insurance
Premiums
2Annuity
Considerations
3
A & H Premiums
4
Deposit - Type Funds1. Premiums, considerations and deposits from Schedule T 133,326,600 235,265 5,533 2. Premiums, considerations and deposits NOT reported in Schedule T,
including investment contract receipts credited to a liability account 2,865,390 2.1 Contract fees for variable contracts with guarantees 2,865,390 2.2 Any other premiums, considerations and deposits not reported in
Schedule T 3. Amounts, if applicable, that were deducted prior to determining amounts
included in Lines 1 or 2 which are in the following categories:3.1 Transfers to guaranteed Separate Accounts 3.2 Roll over of GICs or annuities into other companies 3.3 Surrenders or other benefits paid out 3.4 Excess interest credited to accounts 3.5 Aggregate write-ins for other amounts deducted prior to determining
amounts included in Lines 1 or 23.99 Total (Lines 3.1 thru 3.5)
4. Transfers:4.1 Enter in Column 2, as a negative number, and Column 4, as a positive
number, the total of all amounts received to fund contracts established under Section 403(b) of the U.S. Internal Revenue Code, that are included in Column 2, Lines 1, 2 and 3.99 (33,905) 33,905
4.2 Enter in Column 2, as a positive number, and Column 4, as a negative number, any amounts reported in Column 4, Lines 1, 2 and 3.99 that are allocated. (Note: amounts received to fund contracts established under Section 403(b) of the U.S. Internal Revenue Code, should not be included in Line 4.2)
4.3 Enter in Column 4, as a positive number, and Column 2, as a negative number, any amounts reported in Column 2, Lines 1, 2 and 3.99 that are unallocated
4.99 Total (Lines 4.1 + 4.2 + 4.3) (33,905) 33,905 5. Total (Lines 1 + 2 + 3.99 + 4.99) 136,191,990 201,360 5,533 33,905
DEVELOPMENT OF AMOUNTS INCLUDED IN LINES 1 THRU 5 THAT SHOULD BE DEDUCTED IN DETERMINING THE BASEDo not include any amounts more than once in Lines 6 thru 9
6. Aggregate write-ins for amounts where the insurer is not subject to risk. Premiums for portions of policies or contracts NOT guaranteed or under which the entire investment risk is borne by the policyholder. (Please specify such deductions and indicate where such amounts were reported in the Annual Statement)
7. Amounts NOT allocated to individuals or individual certificate holders or amounts received for such contracts in excess of limits:
7.1 Unallocated funding obligations that do NOT fund government lotteries or employee, union, or association of natural persons benefit plans XXX XXX XXX
7.2 Unallocated funding obligations that fund any employee, union, or association of natural persons benefit plans protected by the Federal Pension Benefit Guaranty Corporation XXX XXX XXX
7.3 Unallocated funding obligations that fund governmental lotteries or employee, union, or association of natural persons benefit plans in excess of $5 million per contract which are NOT: (a) government retirement plans established under Sections 401, 403(b) or457 of the U.S. Internal Revenue Code, or (b) protected by the Federal Pension Benefit Guaranty Corporation XXX XXX XXX
7.4 Total (Lines 7.1 + 7.2 + 7.3) XXX XXX XXX8. Dividends/Experience rating credits paid or credited, but only if NOT
guaranteed in advance (include only amounts NOT already deducted in determining Lines 1 and 2)
9. Aggregate write-ins for Other Deductions 10. Total (Lines 6 + 7.4 + 8 + 9)
MODEL ACT BASE (Line 5 minus Line 10)11. Current Year 136,191,990 201,360 5,533 33,905
DETAILS OF WRITE-INS3.501.3.502.3.503.3.598. Summary of remaining write-ins for Line 3.5 from overflow page 3.599. Totals (Lines 3.501 through 3.503 plus 3.598) (Line 3.5 above)
0601.0602.0603.0698. Summary of remaining write-ins for Line 6 from overflow page 0699. Totals (Lines 0601 through 0603 plus 0698) (Line 6 above)
0901.0902.0903.0998. Summary of remaining write-ins for Line 9 from overflow page 0999. Totals (Lines 0901 through 0903 plus 0998) (Line 9 above)
290.GT

*69396200846500000*ANNUAL STATEMENT FOR THE YEAR 2008 OF THE TEXAS LIFE INSURANCE COMPANY
SCHEDULE O SUPPLEMENTFOR THE YEAR ENDED DECEMBER 31, 2008
(To Be Filed By March 1)
Of The TEXAS LIFE INSURANCE COMPANY
Address (City, State and Zip Code) Waco, TX 76701
NAIC Group Code 0241 NAIC Company Code 69396 Employer’s ID Number 74-0940890
SUPPLEMENTAL SCHEDULE O – PART 1Development of Incurred Losses
($000 OMITTED)Section A - Group Accident and Health
Net Amounts Paid Policyholders
Year in Which Losses Were Incurred1
20042
20053
20064
20075
2008(a)1. Prior 2. 20043. 2005 XXX4. 2006 XXX XXX5. 2007 XXX XXX XXX6. 2008 XXX XXX XXX XXX
Section B - Other Accident and Health1. Prior 10 4 2. 2004 5 3. 2005 XXX 1 4. 2006 XXX XXX 2 5. 2007 XXX XXX XXX 5 6. 2008 XXX XXX XXX XXX 5
Section C - Credit Accident and Health1. Prior 2. 20043. 2005 XXX4. 2006 XXX XXX5. 2007 XXX XXX XXX6. 2008 XXX XXX XXX XXX
Section D - 1. Prior 2. 20043. 2005 XXX4. 2006 XXX XXX5. 2007 XXX XXX XXX6. 2008 XXX XXX XXX XXX
Section E - 1. Prior 2. 20043. 2005 XXX4. 2006 XXX XXX5. 2007 XXX XXX XXX6. 2008 XXX XXX XXX XXX
Section F- 1. Prior 2. 20043. 2005 XXX4. 2006 XXX XXX5. 2007 XXX XXX XXX6. 2008 XXX XXX XXX XXX
Section G- 1. Prior 2. 20043. 2005 XXX4. 2006 XXX XXX5. 2007 XXX XXX XXX6. 2008 XXX XXX XXX XXX
(a) See Paragraph 9 of the Annual Audited Financial Reports in the General section of the annual statement instructions.
465-1
NONE
NONE
NONE
NONE
NONE
NONE
ANNUAL STATEMENT FOR THE YEAR 2008 OF THE TEXAS LIFE INSURANCE COMPANY
SCHEDULE O SUPPLEMENTSUPPLEMENTAL SCHEDULE O – PART 2
Development of Incurred Losses($000 OMITTED)
Section A - Group Accident and HealthNet Amounts Paid for Cost Containment Expenses
Year in Which Losses Were Incurred1
20042
20053
20064
20075
20081. Prior XXX2. 20043. 2005 XXX4. 2006 XXX XXX5. 2007 XXX XXX XXX6. 2008 XXX XXX XXX XXX
Section B - Other Accident and Health1. Prior XXX2. 20043. 2005 XXX4. 2006 XXX XXX5. 2007 XXX XXX XXX6. 2008 XXX XXX XXX XXX
Section C - Credit Accident and Health1. Prior XXX2. 20043. 2005 XXX4. 2006 XXX XXX5. 2007 XXX XXX XXX6. 2008 XXX XXX XXX XXX
Section D- 1. Prior XXX2. 20043. 2005 XXX4. 2006 XXX XXX5. 2007 XXX XXX XXX6. 2008 XXX XXX XXX XXX
C
Section E- 1. Prior XXX2. 20043. 2005 XXX4. 2006 XXX XXX5. 2007 XXX XXX XXX6. 2008 XXX XXX XXX XXX
Section F- 1. Prior XXX2. 20043. 2005 XXX4. 2006 XXX XXX5. 2007 XXX XXX XXX6. 2008 XXX XXX XXX XXX
Section G- 1. Prior XXX2. 20043. 2005 XXX4. 2006 XXX XXX5. 2007 XXX XXX XXX6. 2008 XXX XXX XXX XXX
465-2
NONE
NONE
NONE
NONE
NONE
NONE
NONE
ANNUAL STATEMENT FOR THE YEAR 2008 OF THE TEXAS LIFE INSURANCE COMPANY
SCHEDULE O SUPPLEMENTSUPPLEMENTAL SCHEDULE O – PART 3
Development of Incurred Losses($000 OMITTED)
Section A - Group Accident and HealthSum of Cumulative Net Amount Paid Policyholders and Claim Liability and Reserve Outstanding at End of Year
Year in Which Losses Were Incurred1
20042
20053
20064
20075
20081. 2004 XXX XXX2. 2005 XXX XXX3. 2006 XXX XXX4. 2007 XXX XXX XXX5. 2008 XXX XXX XXX XXX
Section B - Other Accident and Health1. 2004 7 XXX XXX2. 2005 XXX 1 XXX3. 2006 XXX XXX 15 25 14 4. 2007 XXX XXX XXX 2 5. 2008 XXX XXX XXX XXX 2
Section C - Credit Accident and Health1. 2004 XXX XXX2. 2005 XXX XXX3. 2006 XXX XXX4. 2007 XXX XXX XXX5. 2008 XXX XXX XXX XXX
Section D- 1. 2004 XXX XXX2. 2005 XXX XXX3. 2006 XXX XXX4. 2007 XXX XXX XXX5. 2008 XXX XXX XXX XXX
Section E- 1. 2004 XXX XXX2. 2005 XXX XXX3. 2006 XXX XXX4. 2007 XXX XXX XXX5. 2008 XXX XXX XXX XXX
Section F- 1. 2004 XXX XXX2. 2005 XXX XXX3. 2006 XXX XXX4. 2007 XXX XXX XXX5. 2008 XXX XXX XXX XXX
Section G- 1. 2004 XXX XXX2. 2005 XXX XXX3. 2006 XXX XXX4. 2007 XXX XXX XXX5. 2008 XXX XXX XXX XXX
465-3
NONE
NONE
NONE
NONE
NONE
NONE

ANNUAL STATEMENT FOR THE YEAR 2008 OF THE TEXAS LIFE INSURANCE COMPANY
SCHEDULE O SUPPLEMENTSUPPLEMENTAL SCHEDULE O – PART 4
Development of Incurred Losses($000 OMITTED)
Section A - Group Accident and HealthSum of Net Cumulative Amount Paid Policyholders, Cost Containment Expenses,
and Claim and Cost Containment Liability and Reserve Outstanding at the End of Year
Year in Which Losses Were Incurred1
20042
20053
20064
20075
20081. 20042. 2005 XXX3. 2006 XXX XXX4. 2007 XXX XXX XXX5. 2008 XXX XXX XXX XXX
Section B – Other Accident and Health1. 2004 7 2. 2005 XXX 6 3. 2006 XXX XXX 15 25 14 4. 2007 XXX XXX XXX 2 5. 2008 XXX XXX XXX XXX 2
Section C - Credit Accident and Health1. 20042. 2005 XXX3. 2006 XXX XXX4. 2007 XXX XXX XXX5. 2008 XXX XXX XXX XXX
Section D- 1. 20042. 2005 XXX3. 2006 XXX XXX4. 2007 XXX XXX XXX5. 2008 XXX XXX XXX XXX
Section E- 1. 20042 2005 XXX3. 2006 XXX XXX4. 2007 XXX XXX XXX5. 2008 XXX XXX XXX XXX
Section F- 1. 20042. 2005 XXX3. 2006 XXX XXX4. 2007 XXX XXX XXX5. 2008 XXX XXX XXX XXX
Section G- 1. 20042. 2005 XXX3. 2006 XXX XXX4. 2007 XXX XXX XXX5. 2008 XXX XXX XXX XXX
SUPPLEMENTAL SCHEDULE O - PART 5($000 OMITTED)
Reserve and Liability Methodology - Exhibits 6 and 8
Line of Business1
Methodology2
Amount1. Industrial Life 2. Ordinary Life 9,368 3. Individual Annuity 4. Supplementary Contracts 3 5. Credit Life 6. Group Life 7. Group Annuities8. Group Accident and Health 9. Credit Accident and Health
10. Other Accident and Health 10 11. Total 9,381
465-4
NONE
NONE
NONE
NONE
NONE
NONE


![South Buffalo Walking Route - Explore Buffalo · Buffum House Seneca Street Cazenovia Park Shea Stop 1— [49 Buffum] ... South Buffalo Walking Route Supported By Stop 4— • Starts](https://static.fdocuments.us/doc/165x107/5f071df47e708231d41b63de/south-buffalo-walking-route-explore-buffalo-buffum-house-seneca-street-cazenovia.jpg)
