Title: Using STELLA Simulation Models to Teach Natural ...sahan.org/files/working_papers/STELLA for...
14
Using STELLA Simulation Models to Teach Natural Resource Economics Sahan T. M. Dissanayake* Department of Agricultural and Consumer Economics, University of Illinois **Work in progress – do not cite without permission** Abstract: Undergraduate students without a mathematical background struggle to develop an intuitive understanding of natural resource economics. I discuss how graphical simulation models created using STELLA software can be used present natural resource systems in an intuitive way in undergraduate natural resource economics classes. I provide a small introduction to STELLA and then explain two models I used in detail. I discuss informal feedback by students and end the paper by presenting how STELLA models can be incorporated in to the natural resource economics curriculum. The models allow students to develop an intuitive understanding of the economic aspects of natural resource systems. Keywords: Simulation models, teaching economics, natural resource economics, STELLA, natural resource systems JEL Codes: A20, Q20, Q30 Acknowledgments The author expresses his gratitude to Hayri Önal, and students from ACE/NRES/ENVS 310 at the University of Illinois. *Corresponding author: Sahan T. M. Dissanayake, Department of Agricultural and Consumer Economics, University of Illinois, 326 Mumford Hall, MC-710, 1301 West Gregory Drive, Urbana, IL 61801-3605. Email: [email protected]
Transcript of Title: Using STELLA Simulation Models to Teach Natural ...sahan.org/files/working_papers/STELLA for...

Using STELLA Simulation Models to Teach Natural Resource Economics
Sahan T. M. Dissanayake*
Department of Agricultural and Consumer Economics, University of Illinois
**Work in progress – do not cite without permission**
Abstract: Undergraduate students without a mathematical background struggle to develop an
intuitive understanding of natural resource economics. I discuss how graphical simulation
models created using STELLA software can be used present natural resource systems in an
intuitive way in undergraduate natural resource economics classes. I provide a small
introduction to STELLA and then explain two models I used in detail. I discuss informal feedback
by students and end the paper by presenting how STELLA models can be incorporated in to the
natural resource economics curriculum. The models allow students to develop an intuitive
understanding of the economic aspects of natural resource systems.
Keywords: Simulation models, teaching economics, natural resource economics, STELLA,
natural resource systems
JEL Codes: A20, Q20, Q30
Acknowledgments
The author expresses his gratitude to Hayri Önal, and students from ACE/NRES/ENVS 310 at the
University of Illinois.
*Corresponding author: Sahan T. M. Dissanayake, Department of Agricultural and Consumer
Economics, University of Illinois, 326 Mumford Hall, MC-710, 1301 West Gregory Drive,
Urbana, IL 61801-3605. Email: [email protected]

1 Introduction
Undergraduate students without advanced calculus and optimization knowledge struggle to
develop an intuitive understanding of natural resource economics. The difficulty partly stems
from the mathematical framework used to model natural resource systems such as optimal
harvesting models for forestry or population growth models in fisheries economics. I use
graphical simulation models created using the STELLA (Structural Thinking Experimental
Learning Laboratory with Animation) software in my undergraduate natural resource
economics class at a leading research university to allow undergraduate students to develop an
intuitive understanding of the economic aspects of natural resource systems. The class is
typically taken by juniors and seniors and the models help the students develop an intuitive
idea about complex natural resource systems. Since I create the models, the students are not
required to learn STELLA and they can use the free trial version to experiment with the models
to gain an understanding of the critical connections and parameters. The graphical nature of
STELLA allows the students to change parameter values, draw graphs and measure and observe
changes easily without any advanced programming knowledge.
In this paper I present my experiences with using STELLA models to enhance learning in
a natural resource economics class. In section two of the paper, I present a basic introduction
to STELLA. In section three, I describe two models I used in detail. In section four, I present
student feedback and responses from students in class. The first model presents a basic fishery
model based on a logistic growth function. The students are able to easily change the carrying
capacity and growth rates to understand the impact of these parameters on the fishery. I then
extend this model to a cohort fishery model and the students are able to test the impact of
various fishery regulations on the sustainability of the fishery. The second model presents novel
use of the STELLA to analyze the revenue maximizing entrance fee for a national park. I use the
dynamic aspects of STELLA to generate a demand function and the students are able to use this
to study how the shape of the demand function changes the revenue maximizing entrance fee.
This paper highlights how simple simulation models can be easily integrated into a natural
resource economics class to enhance learning without additional burden on the students and
very little burden on the instructor.

2 Use of STELLA in Economics
STELLA software and similar dynamic simulation software such as SimApp, Simile, and VenSim
allow complex systems to be modeled without requiring a high level of mathematical
knowledge. Over the last decade STELLA has been used to conduct research in environmental
and natural resource economics (Costanza et. al. 1998, Costanza and Gottlieb 1998, Costanza
and Voinov 2001) and text Modeling Dynamic Economic Systems by Ruth and Hannon has been
used at the graduate and advanced undergraduate level to teach modeling of economic
systems. There is an untapped potential to use STELLA model as an interactive learning
environment for undergraduate economics classes because of its ability to represent dynamic
systems graphically and to allow the user to change parameters to perform sensitivity analysis.
Therefore the use of STELLA complements the active learning paradigm, the belief that learning
occurs when students engage with the material being taught by practicing and actually using
the material.
I have not been able to find any previous instances where STELLA models have been
used to teach natural resource economics and the only previous example of STELLA models
being used in undergraduate in an undergraduate economics class are the macro models by
Wheat (2004). Wheat (2004) conducts an experiment to test the effect of using the graphical
features of STELLA on students by conducting a split sample study and the preliminary results
indicate a significant improvement in scores for the split sample group of students.
3 Introduction to STELLA
STELLA models consist of four basic components. (ISEE, 2004)
Component Icon Meaning
Stock Represents amount or populations
Flow The in-flows and out-flows to and from a stock
Converter Parameters, contains equations or constants
Connector
Connects stocks, flows and converters, passes information
Table 1: Basic Components of STELLA

Stocks within STELLA act as reservoirs and accumulate a population or an amount such as
pollution, a population, etc. They can be initialized to any value and the value of a stock over
time is determined by the flows coming in and the flows leaving the stock
Flows within STELLA act as conduits and effectively carry physical matter (fish, pollution etc)
from one part of the models to another.
Converters within STELLA act as parameters and provide information for the stocks and the
flows such as interest rates, harvest rates, etc. The converters can also be represented as
graphical function, which allows is to simulate demand function as illustrated in the second
STELLA model described below.
Connectors within STELLA link the information with the stocks and the flows.
STELLA models are created by clicking on icons and placing the icons on a blank canvass and
then creating the links between the components. The user is then able to insert initial values
and equations (for the flows) that describe the system. The most basic model, a dynamic
population, can be represented by the following model.
Figure 1: Basic Population Growth Model
The stock represents the population size and is affected by births and deaths which are flows.
The value of the births and deaths is determined by the population size and the respective rates
provided in the birth rate and death rate converters. The connectors ensure that the proper
information is passed on to the relevant parts of the system.
population sizebirths deaths
birth rate death rate

When a model is running, the state of the system can be depicted both visually and numerically
using tables and graphs. The system also allows the user to view different runs on the same
graph and this assists students visually see the impact of changing parameters and policies.
With creative use of these four components it is possible to represent many natural resource
systems used over time.
The students encountered seven STELLA models during the semester. I used four STELLA
models for the class: Simple Difference Equation (with just the harvest and growth rates),
Multiple Cohort Fisheries, Timber Harvest Model, Revenue Max Number of Visitors (A model
about the number of visits to a park at different entrance fees) and two of the models are
described below. In addition three guest lecturers presented STELLA models about managing
Asian Carp, Deforestation in the Amazon, and Climate Change and the Polar Bear Population.
4 Two STELLA Models
4.1 Model 1: Fishery Model
The standard undergraduate natural resource economics class described the basic difference
equation and expands on the equation by applying it to different natural systems such as
fisheries and timber. I created the basic difference equation in STELLA and this allowed the
students to understand the relationships between the death rates, growth rates and the
increase and decrease in stock size. When teaching the section on fisheries I introduced the
basic one-stock fishery model using the logistic growth equation and discussed it both
mathematically and by using a STELLA simulation model. I then expanded the one-stock
simulation model to a basic multiple cohort fishery model.
The basic logistic fishery model (without harvest) is represented as1
x(t+1) = x(t) + mx(t) – mx(t)2/K (1)
1 K - carrying capacity for stock, m - natural rate of increase - (with no crowding), mx(t)2/K - crowding effect, x(t) -
stock size at time t
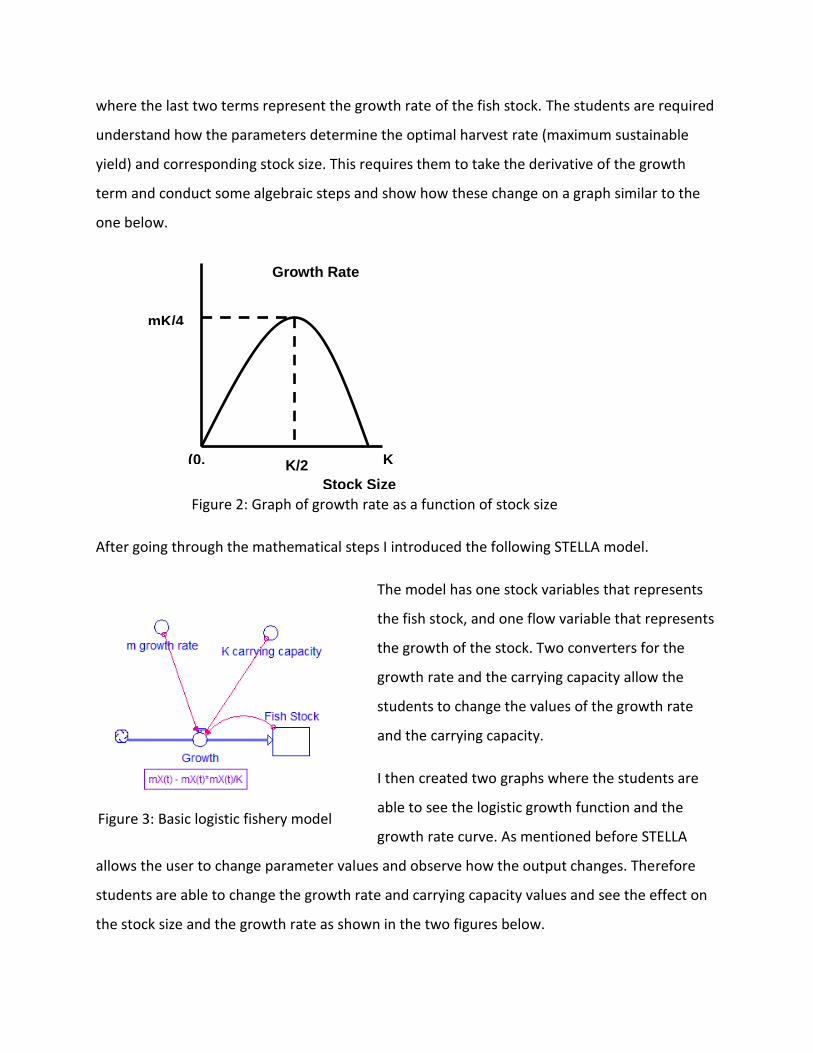
where the last two terms represent the growth rate of the fish stock. The students are required
understand how the parameters determine the optimal harvest rate (maximum sustainable
yield) and corresponding stock size. This requires them to take the derivative of the growth
term and conduct some algebraic steps and show how these change on a graph similar to the
one below.
Figure 2: Graph of growth rate as a function of stock size
After going through the mathematical steps I introduced the following STELLA model.
The model has one stock variables that represents
the fish stock, and one flow variable that represents
the growth of the stock. Two converters for the
growth rate and the carrying capacity allow the
students to change the values of the growth rate
and the carrying capacity.
I then created two graphs where the students are
able to see the logistic growth function and the
growth rate curve. As mentioned before STELLA
allows the user to change parameter values and observe how the output changes. Therefore
students are able to change the growth rate and carrying capacity values and see the effect on
the stock size and the growth rate as shown in the two figures below.
Growth Rate
K (0,0)
Stock Size
mK/4
K/2
Figure 3: Basic logistic fishery model

Figure 4: Logistic Growth Function
Figure 5: Graph of growth rate as a function of stock size
Next I introduce harvesting with corresponding prices and costs into the model and provide the
students another version that they can experiment with. The students are able to learn the
impact of different harvesting amounts on the stock and they can then identify the maximum
sustainable yield and the impact of the growth rate and the carrying capacity.
Finally I introduce a multiple cohort-fishery model, I create three different age cohorts based on
the above simple model and include death rates and growth rates and birth rates for each
cohort. I introduce a policy component to the model where a social planner decides on the
harvest rate for each cohort. To make the model realistic while keeping it simple I introduce a
human population that solely depends on the fishery for survival. I then let the students study
the impact of having different fishing quotas based on multiple-cohort fisheries. This model is
too complicated to illustrate mathematically for an undergraduate class of students, many of
whom have not taken calculus. Therefore the STELLA model allows the students to gain an
intuitive understanding of the value of both accounting for disaggregated cohort based fisheries
and also of various policy alternatives.
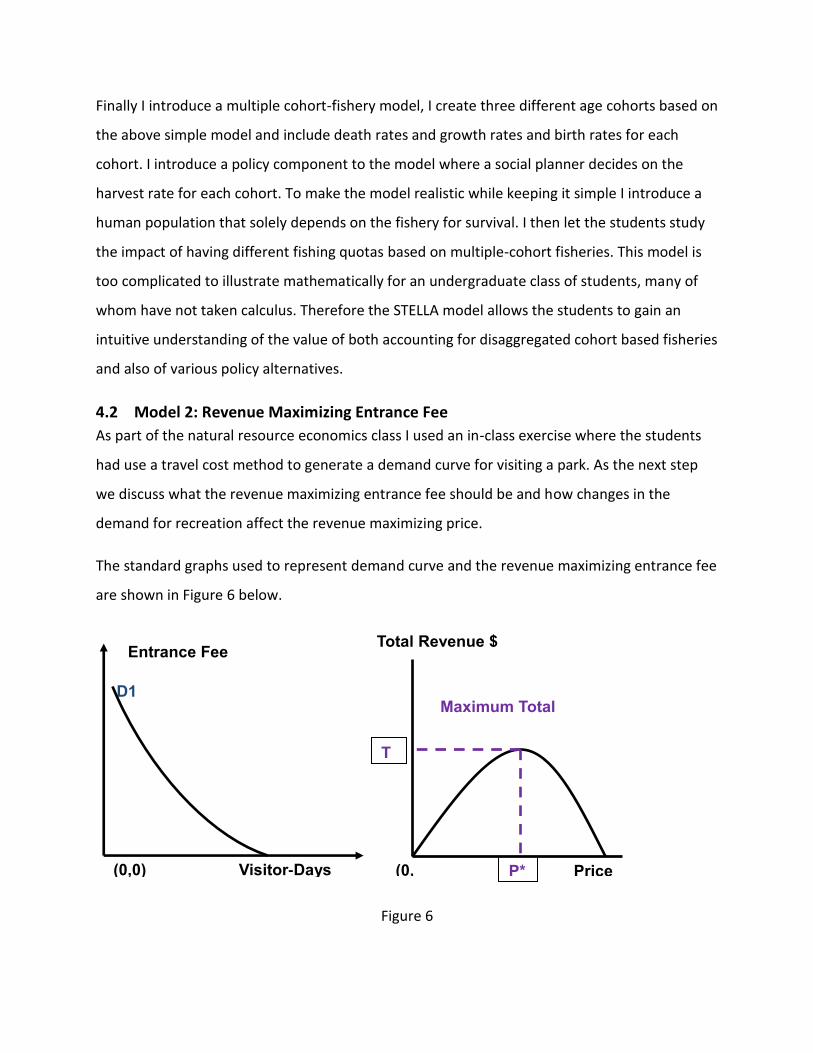
4.2 Model 2: Revenue Maximizing Entrance Fee
As part of the natural resource economics class I used an in-class exercise where the students
had use a travel cost method to generate a demand curve for visiting a park. As the next step
we discuss what the revenue maximizing entrance fee should be and how changes in the
demand for recreation affect the revenue maximizing price.
The standard graphs used to represent demand curve and the revenue maximizing entrance fee
are shown in Figure 6 below.
Figure 6
Entrance Fee
Visitor-Days (0,0)
D1
Total Revenue $
Price ($)
(0,0)
Maximum Total Revenue
P*
TR

I use a the simple STELLA model below to allow students to gain an understating of how the
demand curve for recreation and the revenue maximizing entrance fee and the socially optimal
number of visits are related.
Figure 7
The above model is designed to generate the total revenue graph and display the entrance fee
as a function of the total number of visitors. I present the model here because it is not as
intuitive from the sense of modeling a system, but it highlights how STELLA models can be
tweaked to generate different outputs.2 The model has one stock, the total number of visitors,
and one in-flow to the stock, the number of individual visitors.
The number of visitors increases by one over time (the value of the Visits flow equals one) and
allows us to generate the total quantities for drawing the demand and total revenue graphs.
The Entrance Fee converter represents the demand function for recreation and is used to
identify the entrance fee as a function of the number of total visitors. Clicking on the Entrance
Fee converter opens up the graphs as shown in Figure 8 and the students are able to
manipulate this demand function by dragging and the mouse to change the shape of the
demand function.3
2 I am referring to the fact that the stocks and the flows don’t necessarily represent a real world system, but rather
in some sense a “trick” to generate the real world graphs. 3 The values for the demand function can also be entered as an equation or as a table, but I believe the graphical
demand function makes it easier for the students to visually see how the demand function changes.
Aggregate Visits Q
Visits
~
Entrance Fee
Total Revenue
Graph 1 Graph 4
STELLA Models for ACE/NRES/ENVS 310
Fall 2010
Prepared by Sahan T. M. Dissanayake
Model Title: Revenue Maximizing No of Visitors
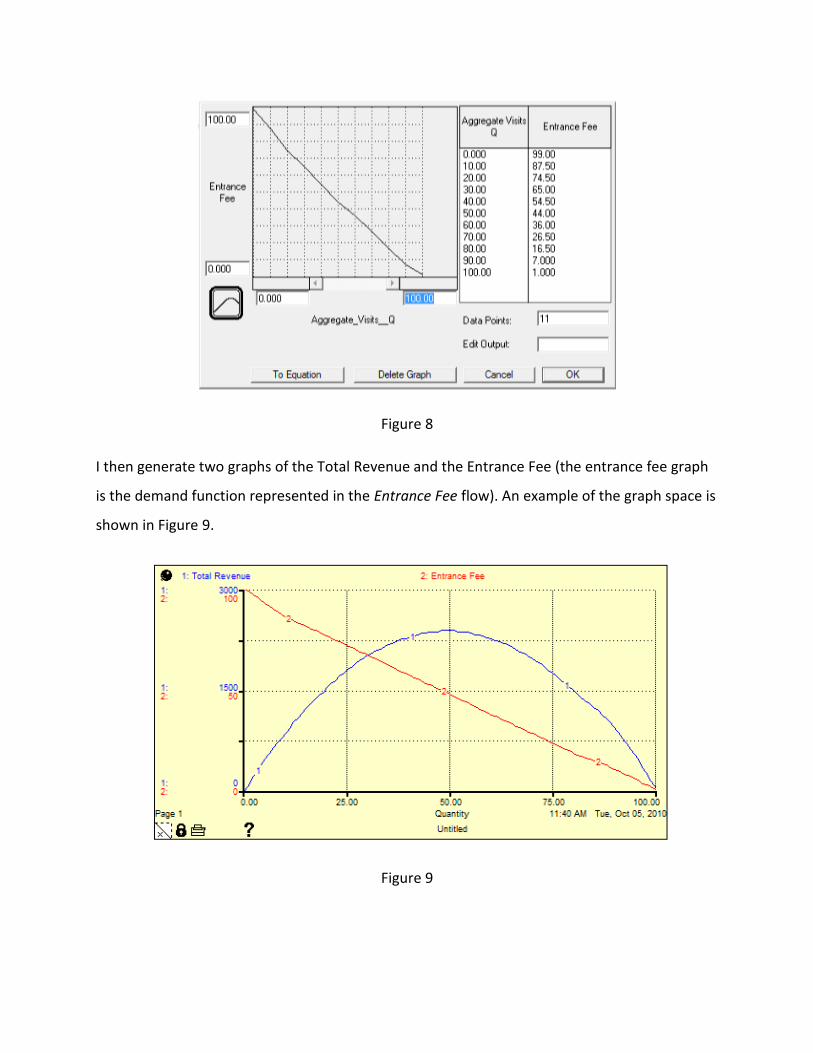
Figure 8
I then generate two graphs of the Total Revenue and the Entrance Fee (the entrance fee graph
is the demand function represented in the Entrance Fee flow). An example of the graph space is
shown in Figure 9.
Figure 9
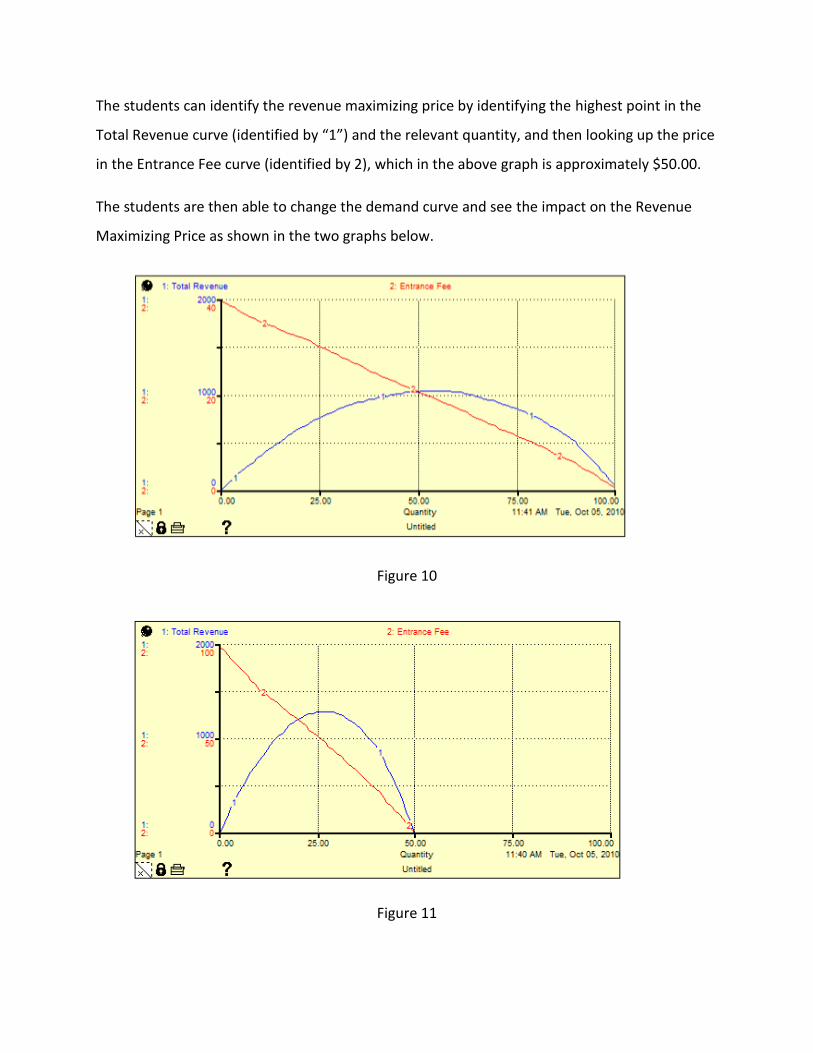
The students can identify the revenue maximizing price by identifying the highest point in the
Total Revenue curve (identified by “1”) and the relevant quantity, and then looking up the price
in the Entrance Fee curve (identified by 2), which in the above graph is approximately $50.00.
The students are then able to change the demand curve and see the impact on the Revenue
Maximizing Price as shown in the two graphs below.
Figure 10
Figure 11
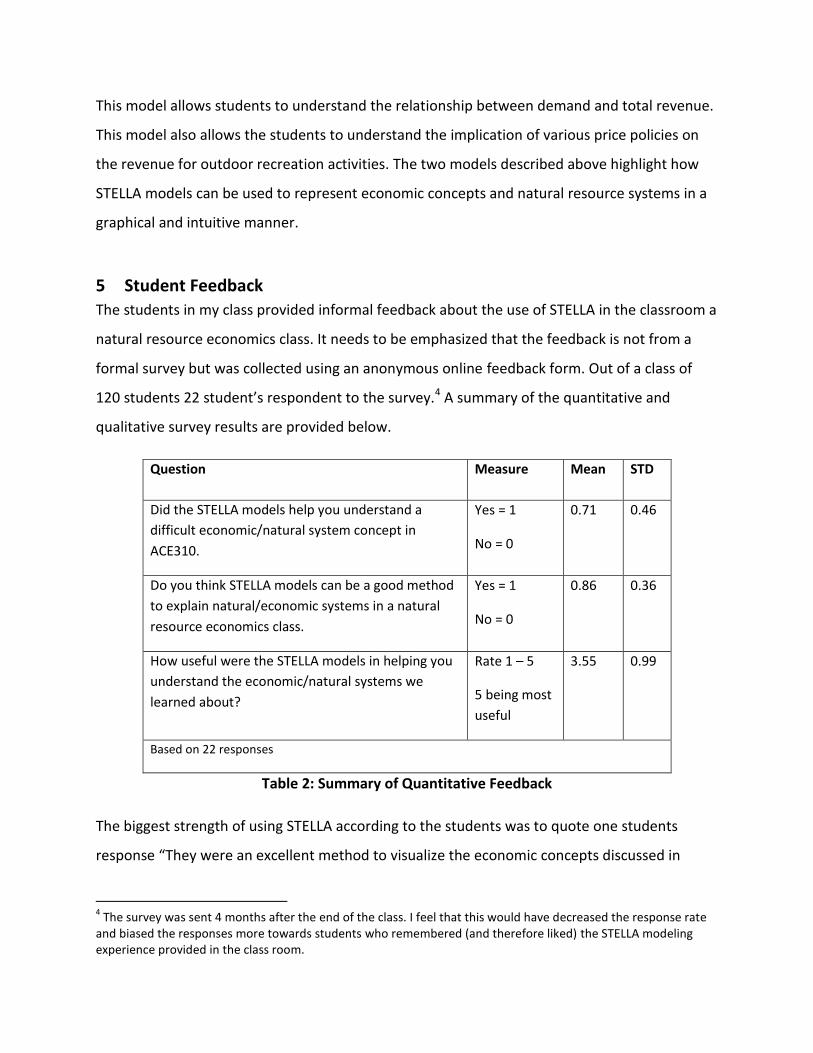
This model allows students to understand the relationship between demand and total revenue.
This model also allows the students to understand the implication of various price policies on
the revenue for outdoor recreation activities. The two models described above highlight how
STELLA models can be used to represent economic concepts and natural resource systems in a
graphical and intuitive manner.
5 Student Feedback
The students in my class provided informal feedback about the use of STELLA in the classroom a
natural resource economics class. It needs to be emphasized that the feedback is not from a
formal survey but was collected using an anonymous online feedback form. Out of a class of
120 students 22 student’s respondent to the survey.4 A summary of the quantitative and
qualitative survey results are provided below.
Question Measure Mean STD
Did the STELLA models help you understand a
difficult economic/natural system concept in
ACE310.
Yes = 1
No = 0
0.71 0.46
Do you think STELLA models can be a good method
to explain natural/economic systems in a natural
resource economics class.
Yes = 1
No = 0
0.86 0.36
How useful were the STELLA models in helping you
understand the economic/natural systems we
learned about?
Rate 1 – 5
5 being most
useful
3.55 0.99
Based on 22 responses
Table 2: Summary of Quantitative Feedback
The biggest strength of using STELLA according to the students was to quote one students
response “They were an excellent method to visualize the economic concepts discussed in
4 The survey was sent 4 months after the end of the class. I feel that this would have decreased the response rate
and biased the responses more towards students who remembered (and therefore liked) the STELLA modeling experience provided in the class room.

class”, a viewpoint echoed by other students. The students also stressed that the ability to
change parameters and visually see the effect helped them understand the system and the
impact of policies.
The two biggest criticisms that the students had was that they were not able to download a
free version and save changes (University of Illinois does have STELLA installed on some public
access computer labs), and since the models did not appear on exams there was no incentive to
spend time to learn and understand the model, specially the more complex models.5 The
students also stressed that they felt that there wasn’t enough time spent on teaching STELLA
and if more time had been spent teaching STELLA they would use the model more. This is
something of a concern since my desire to use STELLA is partly driven by its user friendliness
and ease of use that would imply students can use and play with it without having to spend
much class time to teach STELLA.
6 Conclusion
This paper presents my experiences in using STELLA models to complement the material taught
in an undergraduate natural economics course. I have provided a brief introduction to STELLA,
discussed two models that I used and summarized informal student feedback. I believe that
STELLA models can play a large role in making the presentation of complex and mathematical
natural resource systems intuitive and easy to understand for students in undergraduate
natural resource economics classes.
5 Given that this was a new addition to the class and since the class was a class on Natural Resource Economics I
did not test the students on anything directly related to STELLA models. I believe this should be the case whenever a simulation model such as STELLA gets used in a natural resource (or any other) class. The purpose is to assist student understand the systems used in the class and not become proficient in modeling or using the simulation software.

7 References Costanza, R., Duplisea, D., Kautsky, U. (Eds.), 1998. Modeling ecological and economic
systems with STELLA. Special issue of Ecol. Model. 110(1), 1–103. (special issue).
Costanza, R., Gottlieb, S. (Eds.), 1998. Modeling ecological and economic systems with
STELLA: Part II. Special Issue of Ecol. Model. Vol 112(2,3), 81–247. (special issue).
Costanza, R., Voinov, A., 2001. Modeling ecological and economic systems with Stella: part III.
Ecol. Model. 143, 1 _/143. (special issue).
ISEE Ssystems. 2004. Getting Started with the STELLA Software, A Hands-On Experience.
http://www.iseesystems.com/
Wheat D. 2004. Using STELLA to Teach Macroeconomics.
http://www.iseesystems.com/community/connector/zine/SepOct04/wheat.html