Title ---- Reconstruction Calibration a Grating
42
AN ABSTRACT OF HE THESIS 0F - for the-- -jn__ (Name) (Degree) (Major) Date Thesis presented- Reconstruction and Calibration of a na1l Grating Title ---- -------------------------- - ------------ Abstract Approvelda0rPti'Y (Major Professor) The object of this investigation was to redesign and put into workable shape a certain grating spectrometer. A new grating holder was designed and constructed that permits of making all of the necessary adjustments step by step. An aaxiliary telescope mounting was designed and built to permit all preliminary adjustrents to be made visually and rapidly. A safe method of supplying sources with high tension current was designed and constructed. Tests were made to establish the limits of the usable first order spectrum and to determine the fact that the de- partures from a normal spectrum are practically negligible. A spectral calIbration chart was obtained by ue of six different sources. A study was made of the absorption curves of six differ- ent ssmples of dyed cellophane. The spectrometer has been converted into a usable instru- ment convenient to use.
Transcript of Title ---- Reconstruction Calibration a Grating

AN ABSTRACT OF HE THESIS 0F
- for the-- -jn__ (Name) (Degree) (Major)
Date Thesis presented-
Reconstruction and Calibration of a na1l Grating Title ----
-------------------------- - ------------
Abstract Approvelda0rPti'Y (Major Professor)
The object of this investigation was to redesign and put into workable shape a certain grating spectrometer. A new grating holder was designed and constructed that permits of making all of the necessary adjustments step by step. An aaxiliary telescope mounting was designed and built to permit all preliminary adjustrents to be made visually and rapidly. A safe method of supplying sources with high tension current was designed and constructed.
Tests were made to establish the limits of the usable first order spectrum and to determine the fact that the de- partures from a normal spectrum are practically negligible.
A spectral calIbration chart was obtained by ue of six different sources.
A study was made of the absorption curves of six differ- ent ssmples of dyed cellophane.
The spectrometer has been converted into a usable instru- ment convenient to use.

REO ON.TRUCTION AND CALIBRATION OF A SMALL GRATING SPECTROGRAPH
si;
in part the req

APPROVED:
Redacted for privacy
Professor of Physies
In Charge of Major
Redacted for privacy
Head of Department otPhys les
Redacted for privacy
Chairman of School Grate Corrmlttee
___Redacted for privacy______ Chalrimn of State Col1e Graduate Council

ACKNOWLEDGEÌ!ENT
To . W. R. Varner and Dr. W. Weniger, I wish
to express deep appreciation for their assistance
and constructive criticism during this Investigation.
To Professor J. C. Garman, I wish to express my
thanks for suggesting the determination of absorption
of dyed cellophane as one of the problems considered.

TABLE OF C ONTENTS
Page
Introduction . . . . . . . . . . . . . , j.
Theory of the Grating Spectrograph . . . . . . . . 3
Coris truc t ion . . . . . . . . . . . 8
Operation. . . . . . . . . . . . . . . . . . . . 13
Test Data. . . . . . . . . . . . . . . . . . . . . 16
Suirnnary. . . . . . . . . . . . . . . . . . . . . . 18

LIST OF FIGTJRES
Figure Page
i. I . . . . . . . . . . . . . . . . . 3A 2 . . . . . . . . . e S
3 . I . . . . . . I I 4A 4 . . . t e . . e . . e 4A 5GratirgHo1der. . . . . . . . . . . . . BA 6 Spectrograph Set-up . . . . . . . . . . lOA 7 &rating Holder. . . . . . . . . . . . . lOA 8 Horizontal Track arid Grating Holder Bed . . . . lOB 9 Grating Holder and Track Mount. . . . . . . . . bC
lo Cut-Away View of Film Washer. . . . . . . . . . liA bi Dark Room . . . . . . . . . . . . . . . 12A 12 Slit Ad3ustments . . . . . . . . . . . . . . lA l Operation Details . . . . . . . . . . . . . . . 13A 14 Plate i Calibration Chart. . . . . . . . . 17A
Plate 2 Track Adjustment Spectra . . . . . . . 17A Plate 3 Upper and Lower Wavelength Limits. . . ViA
15 Plate i Black and Yellow Cellophane Absorption Spectra . . . . . . . . . 17E
Plate 2 Blue and Yellow Orange Cellophane Absorption Spectra . . . . . . . . . 173
Plate 3 Green and Red Cellophane Absorption Spectra . . . . . . . . 17B
16 Black Celloohane Transmission Curves. . . . 170 17 Yellow Cellophane Transmission Curves . . . . . 17D 16 Blue Cellophane Transmission Curves . . . . . . 17E 19 Yellow Orange Cellophane Transmission Curves. 17F 20 Green Cellophane Traiìsmission Curves. . . . . 17G 21 Red Cellophane Transmission Curves. . . . . . . 17H

RECONSTRUCTION AND CALIBRATION OF A SMALL GRATING SPECTROGRAPH
Introduction
The present thesis problem had its origin in the
failure of a conimercial grating holder to function properly.
It was impossible in a reasonable time to place the grating
in a recently purchased spectrograph so as to obtain a
sharply focused spectrogram.
An attempt was made, during the sunner of 1939, to
mount the grating permanently in a usable position. All
attempts, however, were futile, as the holder could not
be shifted gradually from one position to another and
since, further, its position was shifted by the act of
tightening the clp screw.
In order to make the necessary adjustments, the
holder must be capable of independent rotation about three
mutually perpendicular axes. With the grating perpendicu-
lar to the floor of the spectrograph, let us consider the
X axis perpendicular to the face of the grating at its
central point, the Y axis vertical and the Z axis hori-
zontal.
The design of the new grating holder pernits inde-
pendent rotation by means of spring controlled set screws.
The holder is movable along a track on the floor of the

spectrograph, the track being in
ter of the photographic film. B:
a perfect adjusthient can be made
holder has made the spectrograph
apparatus.
Tests viere made to show the
the direction of the cen-
the use of this holder,
in a few minutes. This
a very useful piece of
upper and lower usable
wave-length limits. Test photographs were taken with the
holder at different distances from the film to check the
sharpness of focus. The dispersion was measured for dif-
ferent positions of the grating with respect to the Y axis.
For calibration purposes, a film was exposed giving known
lines of mercury, helium, argon, neon, sodium and fron.

3
Theory of the Grating Spectrograph
As is well known, if the source of radiation of a
grating spectrograph is placed on the Rowland circle,
whose diameter is equal to the radius of curvature of the
grating, the spectra of the various orders will be in
focus on an arc of the same circle.
In Fig. 1, let PQ be a grating with C as its center
of curvature. For a first approximation, (5) let the
width of the grating be so small compared to its radius
of curvature that its surface may be considered to deviate
a negligible amount from the Rowland circle. 1ith a mono-
chromatic source at A, let one ray, AP, strike the grating
at an angle of incidence i. This gives rise to a du-
fracted ray, PB, in the first order at angle e. Siilarly,
let A be another ray incident at angle i at another point
on the grating. Its first order diffraction image will
also leave at an angle e and therefore reinforce ray PB
at B. This is true because angles APB and AQß, being
subtended by the same arc, must be equal. Vthat is true
for points P and will also be true for all other points
of the grating. If the source is not monochromatic, lines
corresponding to other wave-lengths will be formed on the
arc of the circle in the neighborhood of B.

Figure (i)
Figure (2)
3A

4
The Cenco Concave Grating Spectrograph used in this
investigation is designed to focus the first order spectrum
(range 4000 A) with its central line at 4800 A. In other
words, angle e is zero at this wave-length so that points
B and C will coincide. The points P, A, and BC will le
at the vertices of a right triangle as shown in Fig. 2.
Since the grating face does not actually lie In the
Rowland circle, it will be necessary to determine more
closely the location of the lines of the spectrin. The
position of the lines and orders of the spectra can be
shown in the following manner. From a very elementary
point of view, (1) let A, B, C and D in Fig. 3 represent
the smooth parts of the grating from which reflection
takes place. If a parallel beam Is incident at angle i,
consider the radiation diffracted at angle 8. The two
rays striking the smooth parts A and B are in phase at
A and F and at B and G. if the lines AF and BG are per-
pendicular respectively to the incident and diffracted
beams. If two crests of a wave front start from B and
G simultaneously, they will arrive at the same time at
the focus of a lens whose axis makes an angle e with the
normal to the grating and will, therefore, reinforce one
another. Hence the path difference between the rays
falling on successive smooth parts of the grating is

A B C
Figure (3)
Figure (4)
4A
AG - AB
FB
AB
- FB-AG AB

5
AG - EF. If AB, the grating space, is denoted by m, and
if the case under consideration is that in which the dif-
ference AG - EF is an integral niunber n of wave-lengths X,
the equation (1) is readily derived from Fig. 3:
m(sin 8 - sin i) = nX (1)
It is of interest to calculate the angle i for the
present spectrograph when n = 1, e = 0, ?... = 4800 x 10-8,
and m 2.54/15160 = 1.675 x 10 eIn.
4300 x 10- 1.675 x 1.675 x 1O(s1n i) (2)
16° 22' = i (3)
The dispersion may be obtained by differentiating
equation (i) considering i constant:
_d_ n (4)
The values of G for first order lines at extreme
positions on the film are obtained by making G 0, and
giving the value 16° 22' to i, and respectively 2800 x
108 and 6800 x 10 to X. The two values of 9 are found
to be ± 6° 34'; that is, the shortest and longest wave-
lengths photographed lie 6° 34' to either side of the
4800 A position. Equation (4) shows that the dispersion
depends on cos 9; as cos 50 34? 0.9934, which is nearly
unity, the dispersion is seen to be approximately constant
throughout the entire spectrum, deviating only sixty-six
parts in a thousand at each extreme.

Although there is apt to be a slight variation in the
number of lines per inch on a grating replica, the disper-
sian of the grating may be calculated from (4). The radius
of curvature of the grating is 106 cm. Hence:
- i - to c1 dX 106 - 1.675 x 104cm i. 1.675 (5)
where dx is the distance in centimeters on the film at
4800 A corresponding to a spectral width of dx.
Since it is customary to express the dispersion of a
spectrograph in Angstrorns per millimeter, the result may
be written:
1.675 157.5 A/cm or 15.8 A/mm. (6) dx 106 x i0
This is very nearly 400 Angstroms per inch, so that a scale
divided into fortieths of an inch may be used as an approxi-
mate wave-length scale. Such a scale enables measurements
to be made to within a few Angstroms. For more accurate
measurements, comparison spectra must be exposed on the
s arne f i. 1m a s the unlm own.
The limit of resolution of an optical instrument is
LxA, and the resolving power is the reciprocal of this
quantity:
R (7)
where X is the wave-length difference which is just detect-
able. Under these conditions, the diffraction pattern of

7
two lines X, and X where (x - x = AX) is such that the
central maximwn of one falls on the first mininmmi of the
other:
But A8 = k/a
(8)
(9)
where a is the effective aperture, S cos e, Fig. 4, S
being the grating width. Hence:
Scose (10)
Substituting equations (10) and (4) in equation (8):
n cos = (ii)
n S cos 8 nx
Substituting equation (ii) (7):
- x ns = nfl (12) R
niX m
where N is the total number of lines on the grating.
This shows that the resolving power is directly
proportional to the total number of lines of the grating.
In general, therefore, the wider the grating, ti-e better
the resolution of the spectral lines. However, as it is
extremely difficult to transfer a large replica film
without damage or distortion, the grating used in this
instrument is masked down to a nall portion of its total
surface. Longer exposures are of course necessary, but
the spectra obtained are of a better quality than those
that would be given by the entire grating.

Cons true tion
The main part of the newly designed grating holder
was constructed of brass.
discussion refer to Fig. 5.
The letters in the following
The base-plate A was cut from a three-inch piece of
quarter-inch sheet brass. One end was drilled for the Y
axis pivot screw W while the other end was cut to a
3 3/16 inch arc; scale was affixed by two machine screws.
The turntable C for the Y axis pivot was cut from three-
sixteenths inch stock. It was drilled for the pivot screw
w and shaped to the saine arc as the base-plate A. The
turntable was provided with an index mark to locate its
position with respect to scale B. The turntable may be
rotated by means of the rack and pinion D, actuated by
turnthg knob E. The knurled knob and spr±ng at F control
the friction between the turntable and the base-plate.
The rack used at D has twelve teeth per inch; the pinion
has ten teeth and was the nallest coercially stocked
one available.
The Z axis pivot support G was made of three-sixteenths
sheet brass. The end supports H were made of the same
material and were festened to G by six machine screws.
The Z axis pivot pins I were made by tapering the ends
of machine screws, leaving enough thread to permit the

SPECTROGRAPH GRAT!NG HOLDER

use of a lock nut to hold them in position in H. The set
screw J is used to tilt the holder about the Z axis against
the pressure produced by spring K. The scale on the head
L is divided into fifty divisions, the pitch of the thread
being one millimeter. The supports at M and N were made
respectively of three-eighths and half Inch square stock.
The X axis base-plate O and turntable P were formed
from eighth inch brass stock. The base-plate was drilled
for both the Z axis and X axis pivot screws. The set
screw Q and spring R are used to rotate the turntable P
about the X axis. The brass shelf S is the suport for
the grating and enables accurate replacement if the grating
is removed for any reason. The clamp ring T was made from
a piece of one-sixteenth inch sheet brass; it is secured
by tightening the nuts at U. A scale was placed at V so
that changes of rotation about the X axis can be noted.
The pivot screw Y? is placed so that its projection passes
through the pole of the grating.
Two more motions are necessary to focus the grating.
One Is a sliding motion of the grating in the direction
of the center of the film. The other is a rotation of
the optical bench that carries the source of light and
other equinent so as to keep the grating in the center
of the cone of light admitted by the slit. The first of
these motIons is accomplished by fastening the grating

lo
holder to an iron sled that can slide along a cast iron
track, Fig. 8, bolted to the floor of the spectrograph
case. The sled is held against the track by a spring A,
Fig. 8, and is moved along the track by the micrometer
screw B, similar to the screw J, Fig. 5. The entire mount-
Ing is also shown in Fig. 7.
For visual observation of the spectrum and for testing
whether the curvature of the film holder as made by the
manufacturer is correct or not, a track, Fig. 6, consisting
of two quarter-inch brass rods bent into arcs of concentric
circles was mounted beyond the film holder; a short focus
telescope mounted on a cart could be moved fr place to
place along the track to determine the sharpness of focus
in all parts of the spectrum. Tipping of the telescope
was prevented by a spring friction clamp on the cart
applied to the track. This device saved both time and
film. Fortunately the film holder was found to be con-
structed accurately.
One type of source used with the spectrograph Is a
gas discharge tube operated from a neon sign lamp trans-
former. To eliminate the chance of a shock, a high tension
safety feed system A, Fig. 6, was designed. Brass rods E,
serving as bus bars, are supported by insulators in a
U shaped channel so that they cannot be touched acciden-
tally. The channels are attached to the wall by means of

Fugite (6)
Figure (7)

HORIZONTAL TRACK AND GRATING
HOLDER BED
The sìidnq oose plate A s iapped
tu rt the trockB. The grating holder
proper is bolted securely to A.
o
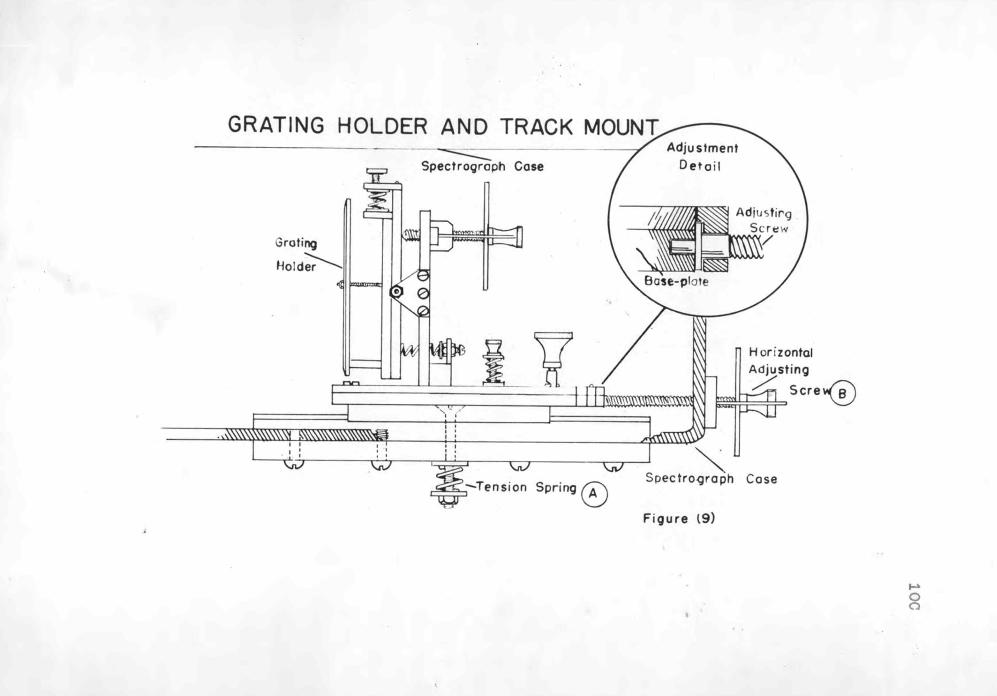
GRATING HOLDER AND TRACK MOUNT
Sroting
Spectrogroph Case
LI
Adju stmerit D et o I
IIll9
A4
H ohzontal
Adjusting Sc r e
i____________ ____________
Tension Spring Soectroçroph Cose
Figure (9)

11
stand-off rods. The transformer is mounted on the wall at
such a height that contact with its terminals is impossible.
The high tension leads for the transformer run dov to the
brass rods; the leads consist of insulated wires which are
surrounded by rubber tubing. As the U channels are mounted
just above and to the rear of the opt±cal bench, a tube
holder can be operated in any position along the bench,
the connection to the high tension leads being made by
short wires with spring clips at each end.
A carbon arc mounted near the end of the optical bench
serves as an alternate light source.
For convenience, a photographic dark room was equipped
adjacent to the spectrometer room. As the films were of
two by ten-inch non-standard dimensIons and as the cost
of the developer had to be considered, a specIal film
tank 3 by 5 by 10.5 inches of one-half gallon capacity
was constructed from three-ply fir veneer. It was lined
with celluloid and rendered leak proof at the joints by
celluloid dissolved In acetone.
A ten-inch pjrex baking dish serves as a very good
hypo tank.
The film washer, Fig. 10, was desIgned so as to
afford maxim'i water circulation. It was constructed of
one-sixteenth galvanized iron. Overflow Is allowed to

Inlet
Ho se
CUT-AWAY VIEW OF FILM WASHER
1-igure UU)

12
escape over the sides as the entire unit is placed In the
sink.
FIIIII hangers were specially made; each is ten and
one-half inches long and is provided with three film clips.
The dark room arrangements are shown in Fig. 11.

Figure (ii)

13
Operation
The grating spectrograph, as it is now set up, is a
very simple instrument to operate and yields excellent
results with moderate care.
Before taking a spectrogram it is well to make a
preliminary calibration to see that everything is in
adjustment. This is most easily done visually by setting
the telescope on the mark indicating the proper position
of the 5461 A line and seeing that the cross hair actually
locates the position of the green line given by a mercury
discharge tube. If it is necessary to make adjustments,
bring the green line on the cross hair, center the spec-
trum on the slit in the film mask and then brIng the
spectrum into the sharpest focus by moving the grating
holder along the track. The slit must be parallel to the
grating lines and has an adjustment for this purpose as
well as for width. (Fig. 12)
The film holder must of course be loaded in the dark
room. It is advisable to back the film with black paper
as an additional precaution agaInst halation. Do not
withdraw the slide from the film holder without making
sure that the spectrograph shutter is in the closed posi-
tion. This shutter is operated by an easily accessible
knob (Fig. 13).

Slit Adjustment Kno
(Width)
Slit Adjustment. Rn
C R otot ion )
S 17'S up porti ng /5 crews
Figure (12)
i 3A
Light Slit

14
Two masks are provided, one allowing 7 exposures
vertically above each other and the other 13. The former
is to be used when comparison spectra are taken. Expos-
ures vary from one second with the carbon arc to several
minutes with some of the gas-filled tubes.
The best developer is the popular Eastman DK-76.
In fresh developer the film should be developed for about
twelve minutes.
The spectrogram can be viewed by transmitted light
and a low power magnifier. Contact prints or enlarge-
ments can of course be made "if desired". Lines can be
identified roughly as already indicated by an engineer's
scale divided into fortieths of an inch. More accurate
wave length measurement requires the use of a comparison
spectrum or a "standard" filin viewed by the aid of a
traveling microscope or a traveling film carrier.
For quantitative data upon the relative intensities
of lines the spectrogram can be measured by a d.ensitomcter.
The film used should be of a good color response type.
Triax Pan was found satisfactory, but any fairly fast
panchromatic or panatoinic film can be used.
It is wise to make several exposures with slightly
different settings of the grating holder on the track
(Fig. 9) in order to obtain a sharper film than is usually
obtained by visual focusing. The scale along the track
15
ma1es it possible to return to the exact position that
gave the sharpest image.
Plate 2, Fig. 14, shows the results of moving the
horizontal adjusting screw to obtain perfect focus of
the instrument. The film itself shows a little more
definitely that the fourth spectrum from the top is in
most perfect focas.

16
Test Data
A number of spectra were taken, largely to test the
adjustment of the apparatus.
îiission Spectra. Plate 1, Fig. 14, shows from bot-
tom to top various types of emission spectra using as
soui'ces, carbon arc; iron arc; arc with one electrode
carbon and one electrode iron; discharge tubes containing
mercury, argon, helium, and neon and argon combined. This
film has been calibrated for use as a calibration standard.
Spectral Limits. Plate 3, Fig. 14, shows the upper
and lower limits of the spectrum as obtained by rotating
the grating about the Y axis. The lower limit is deter-
mined by the response of the film and occurs at approxi-
mately 3300 A. The upper limit is approximately 6800 A
and is established by the appearance of the second order
spec trum.
Dispersion. The films taken to determine the spec-
tral limits were also used to detect deviations from
normal dispersion. These deviations were found to be too
small to measure accurately with the apparatus available.
Absorption Spectra. Plates 1, 2, 3, Fig. 15, show
several absorption spectra of samples of dyed cellophane.
For these films the mask was omitted, the cellophane
being placed in a jig covering the upper half of the slit.

l'7
The films were examined in a specially built photo-
electric densitometer. Light from a 500 watt mazda pro-
jection lamp was passed through the spectrogram. The
beam was then limited by a slit 1/4 mm x 4 nnn and allowed
to impinge on the Weston photronic cell. Deflectons of
a wall galvanometer were recorded for successive shifts
of the film corresponding to loo A. At each of these
wave lengths) readings were taken on the spectra formed by
the upper and lower parts of the slit. The ratio of
these readings yields the absorption factor directly.
The data are shown in the form of curves in Figs.
16 to 21.

0
o

Block
Plate I Yellow
Blue
P'ate 3
Green
Red Figure (15)
w

C)

HI E 1IUhIUNNHflhIi!i UA1fl DI1IIIIIIUINII1IIUIIUINIIUHN IiIII1::E;1uuI!!!!;;u!!!!AI;;IAnii R. . __
__
__ uu . ..u:ni .. __ iiiui:n-- ; i
Ul!U!!!!!IlU!!____- . _______________ -------- __ .IIIIflEiIUH!!'rniiEíiIIuuu'm

.-- ____ __ LURN
__ ----.Í._ .
__ __ r___ ---- - .:,.. __ __u-
1w ---- - . __
..
1u11_:uNn;:uu.ii________________
i.r--- _ -- __
_ iuiiuuu__ 'i--;;-- -
1IIIIUIIIINIXPUIIHL

II1/JjP;;IUuhiiIIN UI !iflh1N--UM u. mINIr=I _.. __ ______ ;EI__ _ --
.
MII- __ u. __ -- I!!!IIIIUU__. 1II1ÍII1IUNIR . I! __ ,__________ __
FI!_Tu1!:nm:IflhIP:III!!iE;4I!! I1IIA Hill IIIIIlEI!!!IIIlllh!__ _LViNUIii!!
JUUNhlllllUlllHI!!UhII liflhlilE 111111!! !!!!ìiiiIflhI.. IUI1IIIIINIIIIII!!!!IIIIIIIIIUUII

.----- -1:uiIluuimL -
_iaauIuuu1uflgU:: iIUINI!!!!I1liu1;;IÏUMflh1:!»N__ uI;IIIIE1IUI!!!!IHIU!nhu1..0 _________-- --------- - ____ iiiìiiiî1IiiiiìiiUí.ì..-- niiiuiuu:nuiunuiiwu-
. a IUHUIIU!!_-UIIIU!I1ikS I
n -------_..u_... I1Ïi ______ --î-'-____ _____ __ _____
I __ __
::II5II5I'...UIUUU 11M Q

-...iiii.!uiiuini= ta iiiir--- ii iu 71U 1 __ __ _IIu--.__. iiiIiIIIIfli4I __ -
- ______ UIU!#UIIII1U ____________ u iTT NiiI= UiIII"II ;; Uil!! ____
H! FI.iIIIÌI________
__
-- I a __
-_uuuutauu-- __ ,-a-------p .
. II.Ï..ii_:I g ..I!....__u.-- __
uiu!!::nhIIIII __ __ __ __ __
:ui1NIIiiIuIi!!!!unhInRiuiu F

Summary
The object of this investigation was to redesign
and put into workable shape a certain grating spectrom-
eter. A new grating holder was designed and constructed
that permits of making all of the necessary adjustments
step by step. An auxiliary telescope mounting was
designed and built to permit all preliminary adjustments
to be made visually and rapidly. A safe method of sup-
plying sources with high tension current was designed
and constructed.
Tests were made to establish the limits of the
usable first order spectrum and to determine the fact
that the departures from a normal spectrum are practically
negligible.
A spectral calibration chart was obtained by use of
six different sources.
A study was made of the absorption curves of six
different samples of dyed cellophane.
The spectrometer has been converted into a usable
instrument convenient to use.

Bibliography
(1) Barton, A. Vi. A textbook on light. London, Loriginans, Green and Company, 1939.
(2) Edser, Edwin. Light for students. London, Macmillan and Company Limited, 1925.
(3) Hardy, A. C., and Perrin, Fred H. Principles of optics, New York and London, McGraw-Hill Book Company, Inc., 1932.
(4) Preston, Thomas. The theory of light. New York, Macmillan and Company Limited, 1901.
(5) Robertson, John K. Introduction to physical optics. Norwood Massachusetts, Plmpton Press, D. Van Nostrand Company, Inc., 1931.
(6) Wood, Robert W. Physical optics. New York, The Macmillan Company, 1914.