Title Polyphenols from Lonicera caerulea L. berry ...
21
www.mnf-journal.com Page 1 Molecular Nutrition & Food Research Received: 29/09/2016; Revised: 17/11/2016; Accepted: 24/11/2016 This article has been accepted for publication and undergone full peer review but has not been through the copyediting, typesetting, pagination and proofreading process, which may lead to differences between this version and the Version of Record. Please cite this article as doi: 10.1002/mnfr.201600858. This article is protected by copyright. All rights reserved. Title Polyphenols from Lonicera caerulea L. berry attenuate experimental nonalcoholic steatohepatitis by inhibiting proinflammatory cytokines productions and lipid peroxidation Authors Shusong Wu 1 , Satoshi Yano 1 , Ayami Hisanaga 1 , Xi He 2 , Jianhua He 2 , Kozue Sakao 1,3 , De-Xing Hou 1,2,3* Affiliations: 1 The United Graduate School of Agricultural Sciences, Kagoshima University, Korimoto 1-21-24, Kagoshima 890-0065, Japan 2 Core Research Program 1515, Hunan Collaborative Innovation Center for Utilization of Botanical Functional Ingredients, Hunan Agricultural University, Changsha, Hunan 410128, P.R. China 3 Department of Food Science and Biotechnology, Faculty of Agriculture, Kagoshima University, Korimoto 1-21-24, Kagoshima 890-0065, Japan
Transcript of Title Polyphenols from Lonicera caerulea L. berry ...

www.mnf-journal.com Page 1 Molecular Nutrition & Food Research
Received: 29/09/2016; Revised: 17/11/2016; Accepted: 24/11/2016
This article has been accepted for publication and undergone full peer review but has not been through
the copyediting, typesetting, pagination and proofreading process, which may lead to differences
between this version and the Version of Record. Please cite this article as doi:
10.1002/mnfr.201600858.
This article is protected by copyright. All rights reserved.
Title Polyphenols from Lonicera caerulea L. berry attenuate experimental nonalcoholic
steatohepatitis by inhibiting proinflammatory cytokines productions and lipid
peroxidation
Authors Shusong Wu1, Satoshi Yano
1, Ayami Hisanaga
1, Xi He
2, Jianhua He
2, Kozue
Sakao1,3
, De-Xing Hou1,2,3*
Affiliations: 1 The United Graduate School of Agricultural Sciences, Kagoshima University,
Korimoto 1-21-24, Kagoshima 890-0065, Japan
2 Core Research Program 1515, Hunan Collaborative Innovation Center for
Utilization of Botanical Functional Ingredients, Hunan Agricultural University,
Changsha, Hunan 410128, P.R. China
3 Department of Food Science and Biotechnology, Faculty of Agriculture,
Kagoshima University, Korimoto 1-21-24, Kagoshima 890-0065, Japan

www.mnf-journal.com Page 2 Molecular Nutrition & Food Research
This article is protected by copyright. All rights reserved.
Corresponding author: Professor De-Xing Hou, Faculty of Agriculture, Kagoshima University,
Korimoto 1-21-24, Kagoshima 890-0065, Japan
E-mail: [email protected] (DX. Hou). Tel/Fax: +81-99-285-8649.
Abbreviations: α-SMA, alpha-smooth muscle actin; FoxO1, forkhead box protein O1; G-CSF,
granulocyte colony-stimulating factor; GGT, gamma-glutamyl transferase; GM-CSF,
granulocyte-macrophage colony-stimulating factor; GOT, glutamic oxaloacetic transaminases; GPT,
glutamate-pyruvate transaminases; HFD, high fat diet; HO-1, heme oxygenase-1; KC,
keratinocyte-derived cytokine; LCP, Lonicera caerulea L. polyphenols; MCP-1, monocytes
chemotactic protein-1; MIP, macrophage inflammatory protein; MnSOD, manganese-dependent
superoxide dismutase; NASH, Nonalcoholic steatohepatitis; ND, Normal diet; Nrf2, nuclear factor
(erythroid-derived 2)-like 2, TBARS, thiobarbituric acid reactive substances; T-cho, total cholesterol,
TG, total triacylglycerol; TNF-α, tumor necrosis factor-alpha
Abstract:
Scope: Nonalcoholic steatohepatitis (NASH) is a common disease that closely associated with
inflammation and oxidative stress, and Lonicera caerulea L. polyphenols (LCP) are reported to
possess both antioxidant and anti-inflammatory properties. This study aimed to study the protective
effects and mechanisms of LCP on NASH in a high fat diet (HFD) plus carbon tetrachloride
(CCL4)-induced mouse model.
Methods and results: Mice were fed with HFD containing LCP (0.5-1%) or not, and then
administrated with CCL4 to induce NASH. Liver sections were stained by hematoxylin-eosin stain,

www.mnf-journal.com Page 3 Molecular Nutrition & Food Research
This article is protected by copyright. All rights reserved.
serum transaminases and lipids were measured by clinical analyzer, insulin was examined by ELISA,
cytokines were determined by multiplex technology, and hepatic proteins were detected by western
blotting. LCP improved histopathological features of NASH with lower levels of lipid peroxidation
and cytokines including G-CSF, IL-3, IL-4, MIP-1β, IL-6, IL-5, KC, TNF-α, IL-2, IL-1β, MCP-1,
IL-13, IFN-γ, IL-10, IL-12(p70), IL-1α, eotaxin, GM-CSF, MIP-1α, IL-17, and RANTES. Further
molecular analysis revealed that LCP increased the expression of Nrf2 and MnSOD, but decreased
FoxO1 and HO-1 in the liver of NASH mice.
Conclusion: Dietary supplementation of LCP ameliorated inflammation and lipid peroxidation by
up-regulating Nrf2 and MnSOD, and down-regulating FoxO1 and HO-1 in NASH.
www.mnf-journal.com Page 4 Molecular Nutrition & Food Research
This article is protected by copyright. All rights reserved.
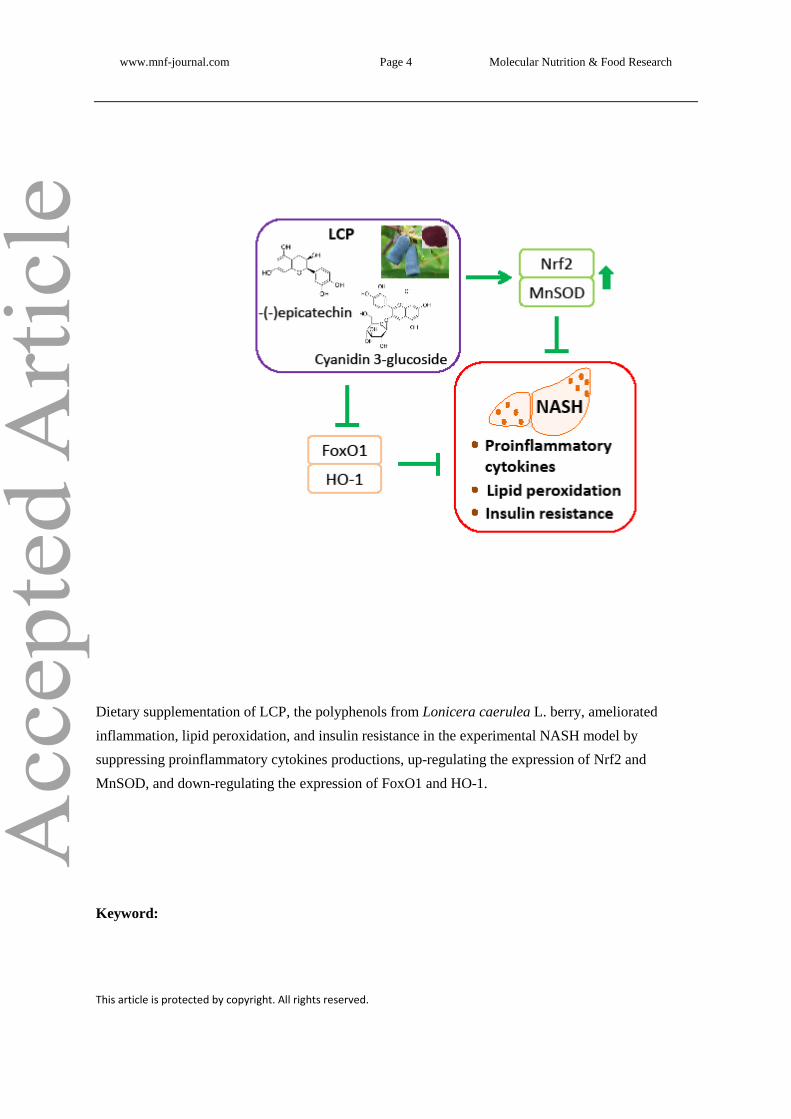
Dietary supplementation of LCP, the polyphenols from Lonicera caerulea L. berry, ameliorated
inflammation, lipid peroxidation, and insulin resistance in the experimental NASH model by
suppressing proinflammatory cytokines productions, up-regulating the expression of Nrf2 and
MnSOD, and down-regulating the expression of FoxO1 and HO-1.
Keyword:

www.mnf-journal.com Page 5 Molecular Nutrition & Food Research
This article is protected by copyright. All rights reserved.
Lonicera caerulea L.; polyphenols; nonalcoholic steatohepatitis; cytokines; lipid peroxidation; Nrf2;
HO-1
1. Introduction
Nonalcoholic steatohepatitis (NASH) is a common liver disease in the modern society, and the
pathogenesis is unclear yet. Although obesity is correlated with an increased risk of NASH [1], it is
not the decisive factor since NASH can be developed in lean people [2]. Recent studies suggested that
inflammatory and metabolic disorders caused by the dysbiosis of gut microbiota potentially accelerate
the progression of NASH [3, 4], and proinflammatory cytokines and oxidative stress play an
important role in promoting hepatic inflammation, lipid peroxidation, and fibrosis [5, 6].
Natural phytochemicals such as polyphenols contribute to the attenuation of both oxidative stress
and inflammation. Lonicera caerulea L. berry, commonly called as blue honeysuckle or haskap, is
native to Siberia, China and Japan, and recently accepted as a healthy berry in Western countries such
as United States [7], Canada [8], and Czech Republic [9]. Lonicera caerulea L. berry has been
reported to possess anti-microbial [10], antioxidant [11, 12], and anti-inflammatory activities [8, 9,
13], and the major bioactive components have been identified as cyanidin 3-glucoside and
-(-)epicatechin [13].
Based on the above information, this study aimed to investigate the protective effects and
mechanisms of Lonicera caerulea L. polyphenols (LCP) on NASH. As NASH is a long-term disease
that with few or no symptoms in the early stages, and previous study revealed that mice fed with high
fat diet (HFD) exhibit typical features of NASH after more than 60 weeks [14], the progressive NASH
models are commonly used in laboratory studies. The “two-hit” hypothesis [15], in which first hit
causes fat accumulation in hepatocytes, and second hit induces inflammation and fibrosis, is widely
accepted for building NASH model. Carbon tetrachloride (CCL4) is a well-known hepatotoxicant used
in experimental models to induce hepatic inflammation and fibrosis [16], and a recently study
www.mnf-journal.com Page 6 Molecular Nutrition & Food Research
This article is protected by copyright. All rights reserved.
indicated that HFD with multiple administration of CCL4 successfully induced pathological features
of NASH in a mouse model [17]. Thus, we attempted to use a HFD plus CCL4-induced mouse model
to explore the protective effects of LCP on NASH, and further clarify the mechanisms by
investigating the expressions of both cytokines and oxidative stress response proteins.
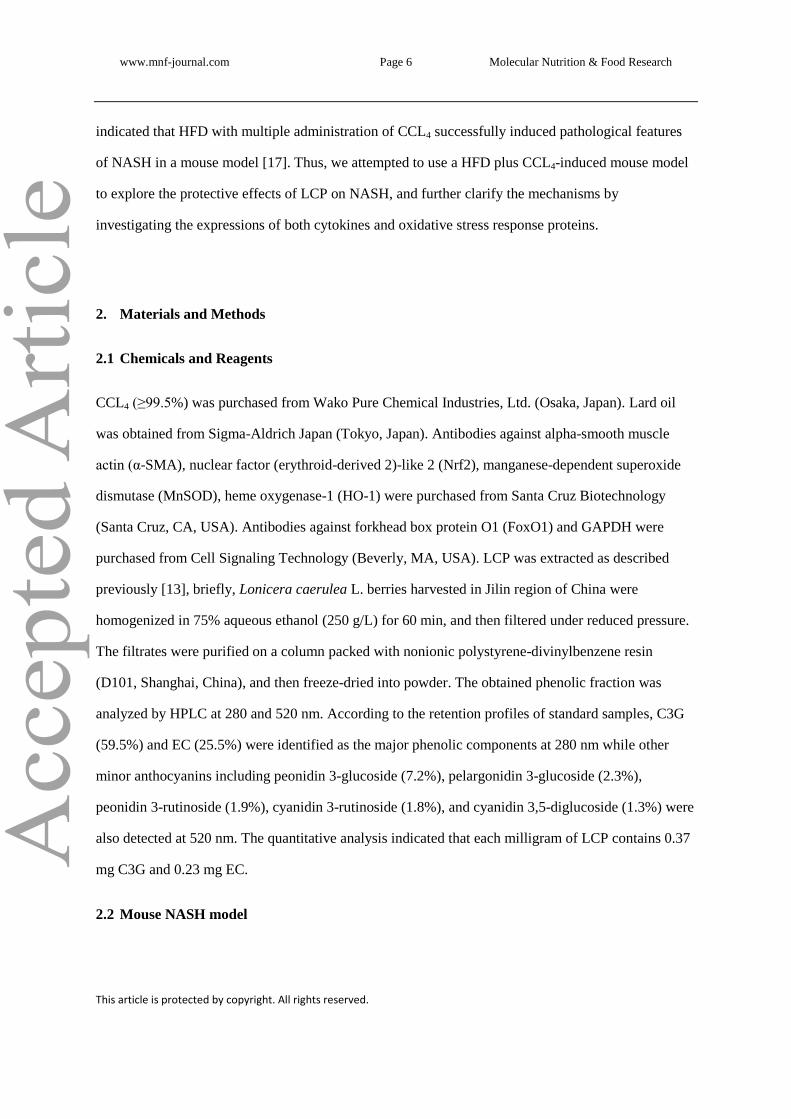
2. Materials and Methods
2.1 Chemicals and Reagents
CCL4 (≥99.5%) was purchased from Wako Pure Chemical Industries, Ltd. (Osaka, Japan). Lard oil
was obtained from Sigma-Aldrich Japan (Tokyo, Japan). Antibodies against alpha-smooth muscle
actin (α-SMA), nuclear factor (erythroid-derived 2)-like 2 (Nrf2), manganese-dependent superoxide
dismutase (MnSOD), heme oxygenase-1 (HO-1) were purchased from Santa Cruz Biotechnology
(Santa Cruz, CA, USA). Antibodies against forkhead box protein O1 (FoxO1) and GAPDH were
purchased from Cell Signaling Technology (Beverly, MA, USA). LCP was extracted as described
previously [13], briefly, Lonicera caerulea L. berries harvested in Jilin region of China were
homogenized in 75% aqueous ethanol (250 g/L) for 60 min, and then filtered under reduced pressure.
The filtrates were purified on a column packed with nonionic polystyrene-divinylbenzene resin
(D101, Shanghai, China), and then freeze-dried into powder. The obtained phenolic fraction was
analyzed by HPLC at 280 and 520 nm. According to the retention profiles of standard samples, C3G
(59.5%) and EC (25.5%) were identified as the major phenolic components at 280 nm while other
minor anthocyanins including peonidin 3-glucoside (7.2%), pelargonidin 3-glucoside (2.3%),
peonidin 3-rutinoside (1.9%), cyanidin 3-rutinoside (1.8%), and cyanidin 3,5-diglucoside (1.3%) were
also detected at 520 nm. The quantitative analysis indicated that each milligram of LCP contains 0.37
mg C3G and 0.23 mg EC.
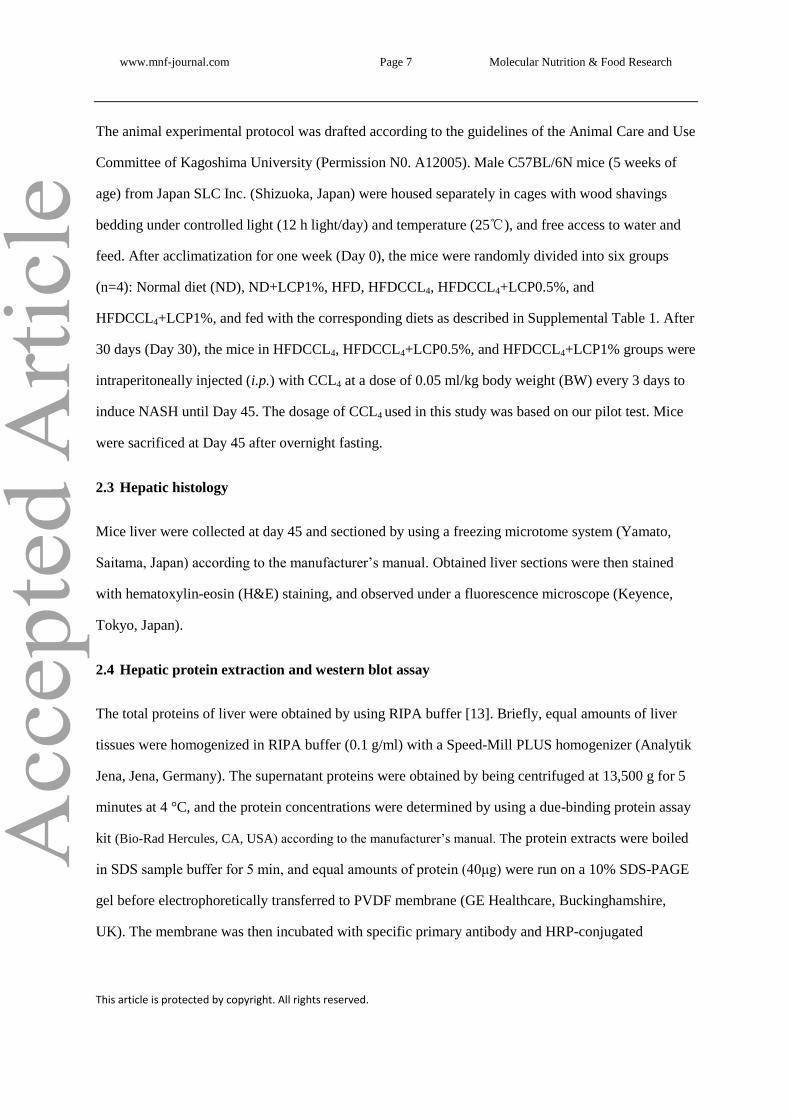
2.2 Mouse NASH model
www.mnf-journal.com Page 7 Molecular Nutrition & Food Research
This article is protected by copyright. All rights reserved.
The animal experimental protocol was drafted according to the guidelines of the Animal Care and Use
Committee of Kagoshima University (Permission N0. A12005). Male C57BL/6N mice (5 weeks of
age) from Japan SLC Inc. (Shizuoka, Japan) were housed separately in cages with wood shavings
bedding under controlled light (12 h light/day) and temperature (25℃), and free access to water and
feed. After acclimatization for one week (Day 0), the mice were randomly divided into six groups
(n=4): Normal diet (ND), ND+LCP1%, HFD, HFDCCL4, HFDCCL4+LCP0.5%, and
HFDCCL4+LCP1%, and fed with the corresponding diets as described in Supplemental Table 1. After
30 days (Day 30), the mice in HFDCCL4, HFDCCL4+LCP0.5%, and HFDCCL4+LCP1% groups were
intraperitoneally injected (i.p.) with CCL4 at a dose of 0.05 ml/kg body weight (BW) every 3 days to
induce NASH until Day 45. The dosage of CCL4 used in this study was based on our pilot test. Mice
were sacrificed at Day 45 after overnight fasting.
2.3 Hepatic histology
Mice liver were collected at day 45 and sectioned by using a freezing microtome system (Yamato,
Saitama, Japan) according to the manufacturer’s manual. Obtained liver sections were then stained
with hematoxylin-eosin (H&E) staining, and observed under a fluorescence microscope (Keyence,
Tokyo, Japan).
2.4 Hepatic protein extraction and western blot assay
The total proteins of liver were obtained by using RIPA buffer [13]. Briefly, equal amounts of liver
tissues were homogenized in RIPA buffer (0.1 g/ml) with a Speed-Mill PLUS homogenizer (Analytik
Jena, Jena, Germany). The supernatant proteins were obtained by being centrifuged at 13,500 g for 5
minutes at 4 °C, and the protein concentrations were determined by using a due-binding protein assay
kit (Bio-Rad Hercules, CA, USA) according to the manufacturer’s manual. The protein extracts were boiled
in SDS sample buffer for 5 min, and equal amounts of protein (40μg) were run on a 10% SDS-PAGE
gel before electrophoretically transferred to PVDF membrane (GE Healthcare, Buckinghamshire,
UK). The membrane was then incubated with specific primary antibody and HRP-conjugated

www.mnf-journal.com Page 8 Molecular Nutrition & Food Research
This article is protected by copyright. All rights reserved.
secondary antibody, following by detection with a LumiVision PRO system (TAITEC Co., Saitama,
Japan).
2.5 Measurement of SOD activity and TBARS level in liver
The activity of superoxide dismutase (SOD) and the level of thiobarbituric acid reactive substances
(TBARS) in the liver were measured with their respective assay kit (BioAssay Systems, Hayward,
CA, USA) according to the manufacturer’s manual.
2.6 Measurement of transaminases, lipids, glucose, and insulin in serum
Blood sera were obtained by centrifuging at 1500 g for 10 min after coagulation at day 45. The levels
of glutamic oxaloacetic transaminase (GOT), glutamate-pyruvate transaminase (GPT), and
gamma-glutamyl transferase (GGT), total cholesterol (T-cho), HDL cholesterol (HDL-c), total
triacylglycerol (TG), and glucose were measured with an automated analyzer for clinical chemistry
(Arkray, Kyoto, Japan). The insulin concentration was measured with an ELISA kit (Thermo Fisher
Scientific Inc., Rockford, IL, USA), according to the manufacturer’s manual.
2.7 Determination of cytokines by multiplex technology in serum
Serum levels of cytokines including IL-1α, IL-1β, IL-2, IL-3, IL-4, IL-5, IL-6, IL-9, IL-10,
IL-12(p40), IL-12(p70), IL-13, IL-17, eotaxin, granulocyte colony-stimulating factor (G-CSF),
granulocyte-macrophage colony-stimulating factor (GM-CSF), IFN-γ, keratinocyte-derived cytokine
(KC), monocytes chemotactic protein 1 (MCP-1), macrophage inflammatory protein (MIP)-1α,
MIP-1β, RANTES, and tumor necrosis factor-alpha (TNF-α) were measured with a Bio-Plex Pro
Mouse Cytokine 23-Plex Panel kit (Bio-Rad Hercules, CA, USA) by using a Bio-Plex 200 System
according to the manufacturer’s manual.
2.8 Statistical analysis

www.mnf-journal.com Page 9 Molecular Nutrition & Food Research
This article is protected by copyright. All rights reserved.
Results were expressed as mean ± SD. The significant differences between groups were analyzed by
one way ANOVA tests, followed by Fisher's LSD and Duncan's multiple range tests with the SPSS
statistical program (version 19.0, IBM Corp., Armonk, NY, USA). *p < 0.05 and
**p < 0.01.
3. Results
3.1 LCP improved histopathological features of NASH
To evaluate the fat deposition in mice, the intra-abdominal fat/BW and liver/BW ratios were first
measured. As shown in Fig. 1A&B, HFD caused significant increase in the intra-abdominal fat/BW
ratio but not liver/BW ratio, while HFD plus CCL4 caused significant increase in both, as CCL4
caused a decline in intra-abdominal fat and BW (Supplemental Fig. 1), but increased liver weight.
Liver section then showed that HFD caused accumulation of lipid droplets and inflammatory cells
(arrow) in liver, while HFD plus CCL4 caused not only accumulation of more lipid droplets and
inflammatory cells, but also severe necrosis (arrow) (Fig. 1C). Supplement with 0.5-1% of LCP in the
diet reduced intra-abdominal fat/BW (p < 0.01) and liver/BW (p < 0.05) ratios, and markedly
ameliorated hepatic fat accumulation, inflammatory cell infiltration, and necrosis. To investigate the
degree of fibrosis, the expression of α-SMA, an indicator of fibrosis, was further detected in mice
liver. Fig. 1D showed that the expression of α-SMA was raised to 1.5 (p < 0.01 vs ND) and 3.1 (p <
0.01 vs ND) folds in HFD and HFDCCL4 group, but decreased to 1.7 (p < 0.01 vs HFDCCL4) and 1.4
(p < 0.01 vs HFDCCL4) folds by supplementing with 0.5% and 1% of LCP, respectively. As a sample
control, 1% of LCP showed no significant influence on the normal mice.
3.2 LCP decreased serum transaminases and lipids
Serum transaminases and lipids are useful indicators of liver damage. As shown in Fig. 2, serum
levels of GOT (A), GPT (B), and GGT (C) were increased (p < 0.01) in HFDCCL4 group but not

www.mnf-journal.com Page 10 Molecular Nutrition & Food Research
This article is protected by copyright. All rights reserved.
HFD group, and dose-dependently reduced by supplementing with 0.5-1% of LCP. Analysis on serum
lipids then revealed that the level of TG (Fig. 2D) was increased (p < 0.01) in both HFD and
HFDCCL4 group, while the T-cho/HDL-c ratio (Supplemental Fig. 2A), an index of insulin resistance
syndrome [18], was increased (p < 0.05) in HFDCCL4 group only. Supplement with LCP decreased
both the TG level (p < 0.01) and T-cho/HDL-c ratio (p < 0.05). Further analysis on serum levels of
insulin and glucose revealed that the serum insulin/glucose ratio, an indicator of insulin sensitivity
[19], was significantly increased (p < 0.01) in both HFD and HFDCCL4 group, and decreased (p <
0.01) by LCP (Supplemental Fig. 2B).
3.3 LCP decreased serum levels of multiple cytokines
As cytokines play a significant role in inflammation, twenty-three kinds of cytokines were determined
in serum to understand the modulation of cytokine network by LCP. As shown in Fig.3, serum levels
of all the analyzed cytokines except IL-9 and IL-12(p40) were increased in HFDCCL4 group, while
only KC, TNF-α, and IL-2 (p < 0.05) were increased in HFD group. Especially, the levels of G-CSF,
IL-3, IL-4, MIP-1β, IL-6, IL-5, KC, TNF-α, IL-2, IL-1β, MCP-1, IL-13 and IFN-γ were raised to over
two folds in HFDCCL4 group. Supplement with 0.5-1% of LCP in diet decreased the serum levels of
G-CSF, IL-3, IL-4, MIP-1β, IL-6, IL-5, KC, TNF-α, IL-2, IL-1β, MCP-1, IL-13, IFN-γ, IL-10,
IL-12(p70), IL-1α, eotaxin, GM-CSF and MIP-1α (p < 0.01), as well as IL-17 and RANTES (p <
0.05), but showed no significant influence on IL-9 and IL-12(p40) (data not shown).
3.4 LCP improved hepatic antioxidant capacity
Oxidative stress is another critical factor in the pathogenesis of NASH [6]. To evaluate the oxidative
status in liver, the activity of SOD and the level of TBARS were measured. As shown in Fig. 4A,
SOD activity was decreased (p < 0.01) in HFDCCL4 group, but recovered by supplementing with 1%

www.mnf-journal.com Page 11 Molecular Nutrition & Food Research
This article is protected by copyright. All rights reserved.
of LCP. On the contrary, the level of TBARS, the product of lipid peroxidation, was increased in both
HFD (p < 0.05) and HFDCCL4 (p < 0.01) group, and dose-dependently decreased by 0.5-1% of LCP
(Fig. 4B). Further determination of the oxidative stress response proteins in liver showed that the
expression of Nrf2, a key transcription factor that regulates the expression of antioxidant proteins, was
decreased to 0.6 (p < 0.01 vs ND) and 0.5 (p < 0.01 vs ND) folds in HFD and HFDCCL4 group, but
recovered to 0.7 (p < 0.01 vs HFDCCL4) and 0.9 (p < 0.01 vs HFDCCL4) folds in the group treated
with 0.5% and 1% of LCP, respectively (Fig. 4C, 1st band). Potential downstream targets including
MnSOD and HO-1 were then detected, and the expression of MnSOD (Fig. 4C, 2nd
band) showed
similar trend as Nrf2. On the other hand, the expression of HO-1 was reduced to 0.6 (p < 0.01 vs ND)
folds in HFD group, but increased to 1.8 (p < 0.01 vs ND) folds in HFDCCL4 group (Fig. 4C, 3rd
band). Thus, we investigated the expression of FoxO1, another transcription factor that regulates
HO-1 [20]. The results revealed that the level of FoxO1 was also increased to 1.8 (p < 0.01 vs ND)
folds in HFDCCL4 group (Fig. 4C, 4th band). Supplement with 0.5-1% of LCP recovered the
expression of Nrf2 and MnSOD, but decreased the expression of HO-1 and FoxO1 significantly (p <
0.01).
4. Discussion
An appropriate model is important in order to study the pathogenesis and prevention of NASH. In this
study, HFD-fed mice became obese with fatty liver but no steatohepatitis, while the mice received
two-hit by HFD plus CCL4 administration showed histopathological features of NASH including
fatty liver, hepatocyte injury, inflammation, and fibrosis.
In the progression of NASH, cytokines not only provoke the local inflammatory response in the
liver, but also induce inflammatory cells infiltration to promote fibrosis. In this study, HFD plus CCL4
increased the production of twenty-one kinds of cytokines, and the levels of G-CSF, IL-3, IL-4,
MIP-1β, IL-6, IL-5, KC, TNF-α, IL-2, IL-1β, MCP-1, IL-13 and IFN-γ were increased to over two
www.mnf-journal.com Page 12 Molecular Nutrition & Food Research
This article is protected by copyright. All rights reserved.
folds. Among the cytokines, G-CSF and IL-3 promote proliferation and differentiation of
hematopoietic stem cells in response to liver injury [21, 22], and IL-4, IL-5, and IL-13 are considered
as the anti-inflammatory cytokines against excessive inflammation and self-immunity [23]. IL-6,
TNF-α, IL-2, IL-1β, and IFN-γ might be the potential primary proinflammatory cytokines in the
pathogenesis of NASH, as chemokines including MIP-1β, KC, and MCP-1 were potentially mediated
by IL-1β [24], TNF-α [25], and IL-6 [26], respectively. Dietary supplementation of LCP decreased
both pro- and anti-inflammatory cytokines, which suggesting that LCP ameliorated NASH by
decreasing the production of proinflammatory cytokines, rather than promoting the production of
anti-inflammatory cytokines.
Oxidative stress is considered as another important factor in the pathogenesis of NASH [6]. In
this study, HFD and CCL4 decreased the expression of antioxidant proteins (SOD, Nrf2, and MnSOD)
and enhanced lipid peroxidation (TBARS) in the liver. Interestingly, HO-1, one of the downstream
antioxidant defense proteins of Nrf2, was decreased in HFD-fed mice but increased in the mice
administrated with HFD plus CCL4. Although HO-1 has been reported to contribute to ameliorate
obesity and fatty liver [27], a recent study suggested that HO-1 actually drives metaflammation and
insulin resistance in metabolic disease [28]. FoxO1 is proved as another regulator of HO-1 [20], and it
is activated in insulin receptor substrate-knockout mice [29]. The overexpression of FoxO1 and HO-1
can further aggravate insulin resistance and promote the production of proinflammatory cytokines [28,
30]. Our data in this study revealed that FoxO1 was increased markedly in the mice administrated
with HFD plus CCL4, but not HFD only. These results suggested that HO-1 was possibly reduced due
to the low level of Nrf2 in the early stage of obesity, but increased with the overexpression of FoxO1
induced by metabolic dysfunction in NASH. LCP increased the expression of Nrf2 and MnSOD, but
decreased the expression of FoxO1 and HO-1, and further ameliorated the lipid peroxidation and
insulin resistance in NASH mice.
In conclusion, dietary supplementation of LCP ameliorated inflammation, lipid peroxidation, and
insulin resistance in the experimental NASH model by suppressing proinflammatory cytokines

www.mnf-journal.com Page 13 Molecular Nutrition & Food Research
This article is protected by copyright. All rights reserved.
production, up-regulating the expression of Nrf2 and MnSOD, and down-regulating the expression of
FoxO1 and HO-1.
Mr. Shusong Wu is the primary investigator in this study. Mr. Satoshi Yano and Dr. Ayami Hisanaga
participated in the animal experiments. Dr. Xi He and Dr. Jianhua He participated in the sample
extraction and purification. Dr. Kozue Sakao participated in sample analysis. Dr. De-Xing Hou
designed this study and wrote the manuscript as corresponding author.
This work was partially supported by grant-in-aid for scientific research of the Ministry of Education,
Culture, Sports, Science and Technology (MEXT) of Japan (18580125) and Core Research Program
1515 of Hunan Agricultural University. Mr. Shusong Wu received a studentship supported by China
Scholarship Council (CSC).
The authors have declared no conflict of interest.
References
[1] Fabbrini, E., Sullivan, S., Klein, S., Obesity and nonalcoholic fatty liver disease: biochemical, metabolic, and
clinical implications. Hepatology 2010, 51, 679-689.
[2] Younossi, Z. M., Stepanova, M., Negro, F., Hallaji, S., et al., Nonalcoholic fatty liver disease in lean
individuals in the United States. Medicine (Baltim.) 2012, 91, 319-327.
[3] Henao-Mejia, J., Elinav, E., Jin, C., Hao, L., et al., Inflammasome-mediated dysbiosis regulates progression of
NAFLD and obesity. Nature 2012, 482, 179-185.

www.mnf-journal.com Page 14 Molecular Nutrition & Food Research
This article is protected by copyright. All rights reserved.
[4] Qin, N., Yang, F., Li, A., Prifti, E., et al., Alterations of the human gut microbiome in liver cirrhosis. Nature
2014, 513, 59-64.
[5] Tilg, H., Diehl, A. M., Cytokines in Alcoholic and Nonalcoholic Steatohepatitis. N. Engl. J. Med. 2000, 343,
1467-1476.
[6] Rolo, A. P., Teodoro, J. S., Palmeira, C. M., Role of oxidative stress in the pathogenesis of nonalcoholic
steatohepatitis. Free Radic. Biol. Med. 2012, 52, 59-69.
[7] Chaovanalikit, A., Thompson, M. M., Wrolstad, R. E., Characterization and quantification of anthocyanins
and polyphenolics in bluehHoneysuckle (Lonicera caerulea L.). J. Agric. Food Chem. 2004, 52, 848-852.
[8] Rupasinghe, H. P., Boehm, M. M., Sekhon-Loodu, S., Parmar, I., et al., Anti-Inflammatory Activity of Haskap
Cultivars is Polyphenols-Dependent. Biomolecules 2015, 5, 1079-1098.
[9] Zdarilova, A., Rajnochova Svobodova, A., Chytilova, K., Simanek, V., Ulrichova, J., Polyphenolic fraction of
Lonicera caerulea L. fruits reduces oxidative stress and inflammatory markers induced by lipopolysaccharide in
gingival fibroblasts. Food Chem. Toxicol. 2010, 48, 1555-1561.
[10] Palikova, I., Heinrich, J., Bednar, P., Marhol, P., et al., Constituents and antimicrobial properties of blue
honeysuckle: a novel source for phenolic antioxidants. J. Agric. Food Chem. 2008, 56, 11883-11889.
[11] Palikova, I., Valentova, K., Oborna, I., Ulrichova, J., Protectivity of blue honeysuckle extract against
oxidative human endothelial cells and rat hepatocyte damage. J. Agric. Food Chem. 2009, 57, 6584-6589.
[12] Rupasinghe, H. P. V., Yu, L. J., Bhullar, K. S., Bors, B., Short Communication: Haskap (Lonicera caerulea):
A new berry crop with high antioxidant capacity. Can. J. Plant Sci. 2012, 92, 1311-1317.
[13] Wu, S., He, X., Wu, X., Qin, S., et al., Inhibitory effects of blue honeysuckle (Lonicera caerulea L) on
adjuvant-induced arthritis in rats: Crosstalk of anti-inflammatory and antioxidant effects. J. Funct. Foods 2015,
17, 514-523.
[14] Nakamura, A., Terauchi, Y., Lessons from mouse models of high-fat diet-induced NAFLD. Int. J. Mol. Sci.
2013, 14, 21240-21257.
[15] Day, C. P., James, O. F., Steatohepatitis: a tale of two "hits"? Gastroenterology 1998, 114, 842-845.
[16] Kamada, Y., Tamura, S., Kiso, S., Matsumoto, H., et al., Enhanced carbon tetrachloride-induced liver
fibrosis in mice lacking adiponectin. Gastroenterology 2003, 125, 1796-1807.
www.mnf-journal.com Page 15 Molecular Nutrition & Food Research
This article is protected by copyright. All rights reserved.
[17] Kubota, N., Kado, S., Kano, M., Masuoka, N., et al., A high-fat diet and multiple administration of carbon
tetrachloride induces liver injury and pathological features associated with non-alcoholic steatohepatitis in mice.
Clin. Exp. Pharmacol. Physiol. 2013, 40, 422-430.
[18] Lemieux, I., Lamarche, B., Couillard, C., Pascot, A., et al., Total cholesterol/HDL cholesterol ratio vs LDL
cholesterol/HDL cholesterol ratio as indices of ischemic heart disease risk in men: the Quebec Cardiovascular
Study. Arch. Intern. Med. 2001, 161, 2685-2692.
[19] Legro, R. S., Finegood, D., Dunaif, A., A fasting glucose to insulin ratio is a useful measure of insulin
sensitivity in women with polycystic ovary syndrome. J. Clin. Endocrinol. Metab. 1998, 83, 2694-2698.
[20] Kang, J., Jeong, M. G., Oh, S., Jang, E. J., et al., A FoxO1-dependent, but NRF2-independent induction of
heme oxygenase-1 during muscle atrophy. FEBS Lett. 2014, 588, 79-85.
[21] Spahr, L., Lambert, J. F., Rubbia-Brandt, L., Chalandon, Y., et al., Granulocyte-colony stimulating factor
induces proliferation of hepatic progenitors in alcoholic steatohepatitis: a randomized trial. Hepatology 2008, 48,
221-229.
[22] Nitsche, A., Junghahn, I., Thulke, S., Aumann, J., et al., Interleukin‐3 Promotes Proliferation and
Differentiation of Human Hematopoietic Stem Cells but Reduces Their Repopulation Potential in NOD/SCID
Mice. Stem Cells 2003, 21, 236-244.
[23] Fort, M. M., Cheung, J., Yen, D., Li, J., et al., IL-25 Induces IL-4, IL-5, and IL-13 and Th2-Associated
Pathologies In Vivo. Immunity 2001, 15, 985-995.
[24] Zhang, T., Guo, C.-J., Li, Y., Douglas, S. D., et al., Interleukin-1β induces macrophage inflammatory
protein-1β expression in human hepatocytes. Cell. Immunol. 2003, 226, 45-53.
[25] Lo, H. M., Lai, T. H., Li, C. H., Wu, W. B., TNF-alpha induces CXCL1 chemokine expression and release in
human vascular endothelial cells in vitro via two distinct signaling pathways. Acta Pharmacol. Sin. 2014, 35,
339-350.
[26] Tieu, B. C., Lee, C., Sun, H., Lejeune, W., et al., An adventitial IL-6/MCP1 amplification loop accelerates
macrophage-mediated vascular inflammation leading to aortic dissection in mice. J. Clin. Invest. 2009, 119,
3637-3651.
[27] Hinds, T. D., Jr., Sodhi, K., Meadows, C., Fedorova, L., et al., Increased HO-1 levels ameliorate fatty liver
development through a reduction of heme and recruitment of FGF21. Obesity (Silver Spring) 2014, 22, 705-712.
www.mnf-journal.com Page 16 Molecular Nutrition & Food Research
This article is protected by copyright. All rights reserved.
[28] Jais, A., Einwallner, E., Sharif, O., Gossens, K., et al., Heme oxygenase-1 drives metaflammation and insulin
resistance in mouse and man. Cell 2014, 158, 25-40.
[29] Qi, Y., Xu, Z., Zhu, Q., Thomas, C., et al., Myocardial Loss of IRS1 and IRS2 Causes Heart Failure and Is
Controlled by p38α MAPK During Insulin Resistance. Diabetes 2013, 62, 3887-3900.
[30] Su, D., Coudriet, G. M., Hyun Kim, D., Lu, Y., et al., FoxO1 links insulin resistance to proinflammatory
cytokine IL-1beta production in macrophages. Diabetes 2009, 58, 2624-2633.

www.mnf-journal.com Page 17 Molecular Nutrition & Food Research
This article is protected by copyright. All rights reserved.
Legends to Figures
Figure 1 LCP improved histopathological features of NASH. (A) The weight percentage of fat to
BW. (B) The weight percentage of liver to BW. (C) Representative liver sections from each group
(H&E stain, original magnification ×200). (D) The representative blot of α-SMA protein in liver by
western blotting. The induction fold of α-SMA was calculated as the intensity of the treatment relative
to that of control normalized to GAPDH by densitometry. The data represent mean ± SD of four mice.
*p < 0.05 and
**p < 0.01.

www.mnf-journal.com Page 18 Molecular Nutrition & Food Research
This article is protected by copyright. All rights reserved.
Figure 2 LCP decreased serum transaminases and lipids. (A) Serum GOT level. (B) Serum GPT
level. (C) Serum GGT level. (D) Serum TG level. The data represent mean ± SD of four mice. *p <
0.05 and **
p < 0.01.

www.mnf-journal.com Page 19 Molecular Nutrition & Food Research
This article is protected by copyright. All rights reserved.
Figure 3 LCP decreased serum levels of multiple cytokines. The levels of 23 kinds of cytokines
were measured by multiplex technology, and arranged in an order from high to low change in the
experimental NASH model. The data represent mean ± SD of four mice. *p < 0.05 and
**p < 0.01.

www.mnf-journal.com Page 20 Molecular Nutrition & Food Research
This article is protected by copyright. All rights reserved.
Figure 4 LCP improved hepatic antioxidant capacity. (A) SOD activity in liver. (B) The level of
TBARS in liver. (C) The representative blots of Nrf2, MnSOD, HO-1, and FoxO1 protein in liver by
western blotting. The induction folds of the proteins were calculated as the intensity of the treatment
relative to that of control normalized to GAPDH by densitometry. The data represent mean ± SD of
four mice. *p < 0.05 and
**p < 0.01.

本文献由“学霸图书馆-文献云下载”收集自网络,仅供学习交流使用。
学霸图书馆(www.xuebalib.com)是一个“整合众多图书馆数据库资源,
提供一站式文献检索和下载服务”的24 小时在线不限IP
图书馆。
图书馆致力于便利、促进学习与科研,提供最强文献下载服务。
图书馆导航:
图书馆首页 文献云下载 图书馆入口 外文数据库大全 疑难文献辅助工具