Title On the Effect of Atmospheric Pressure upon Ground ...
15
Title On the Effect of Atmospheric Pressure upon Ground Tilt Author(s) TANAKA, Torao Citation Bulletin of the Disaster Prevention Research Institute (1968), 18(2): 23-36 Issue Date 1968-12 URL http://hdl.handle.net/2433/124753 Right Type Departmental Bulletin Paper Textversion publisher Kyoto University brought to you by CORE View metadata, citation and similar papers at core.ac.uk provided by Kyoto University Research Information Repository
Transcript of Title On the Effect of Atmospheric Pressure upon Ground ...

Title On the Effect of Atmospheric Pressure upon Ground Tilt
Author(s) TANAKA, Torao
Citation Bulletin of the Disaster Prevention Research Institute (1968),18(2): 23-36
Issue Date 1968-12
URL http://hdl.handle.net/2433/124753
Right
Type Departmental Bulletin Paper
Textversion publisher
Kyoto University
brought to you by COREView metadata, citation and similar papers at core.ac.uk
provided by Kyoto University Research Information Repository
Bull. Disas. Prey. Res. Inst., Kyoto Univ., Vol. 18, Part 2, No. 136, Dec. 1968 23
On the Effect of Atmospheric Pressure upon Ground Tilt
By Torao TANAKA
(Manuscript received Sep. 3, 1968)
Abstract
The Fourier transforms of the tiltmetric and barometric records at the Oura and Akibasan stations in Wakayama City have been obtained and compared to investigate the effect of atmospheric pressure on the ground tilt observed by tiltmeters of the horizontal pendulum type. The result shows that the amplitude ratio of ground tilt to pressure increases as the frequency increases and that the phase difference between them also varies slightly with the frequency. This suggests that pressure influence on the tiltmetric record consists of two parts. One is a local term which is propor-tional to the change of pressure and possibly related to purely local influence includ-ing instrumental disturbance. The other is proportional to the time derivative which may also be either related to the purely local effect of the pressure or related to ground deformation due to the extensive loading effect of the pressure. The same treatment has been carried out as to the tiltmetric and barometric data observed at the Amagase Observatory in Kyoto, the result of which shows that there is no contradiction of the above inference for the interpretation of the atmospheric disturbance at Amagase.
I. Introduction
Ground is generally deformed by the change of atmospheric pressure, and hence tiltmetric records are more or less disturbed by it so long as the observa-tions of the ground are carried out in a tunnel near the earth's surface. Since G. H. Darwin ll treated ground deformation due to the loading effect of
a sinusoidal atmospheric pressure theoretically, many workers 2) have made theoretical and observational investigations of pressure effects on ground defor-mation. It is absolutely necessary for the analysis of earth-tides and detection of substantial ground deformation due to geotectonic origins to clarify the rela-tion between the change of atmospheric pressure and ground deformation due to it, and to elucidate the mechanism of appearance of pressure disturbance.
Atmospheric pressure is considered to disturb tiltmetric or extensometric records in the following ways, (1) tilt or bending of the earth's crust due to loading effect, (2) purely local deformation of the ground or observational site which is related to minor geological circumstances, such as fracture zones and heterogeneity of the structure, and is related also to the geographical situation of the site including the shape of the tunnel and configuration of instruments in it, (3) underground water level, and so on.
However, even if we confine ourselves to the problem of loading effect only, there must be many factors which control the phenomenon and make treatment of this problem complicated. For example, if the block movement of the earth's crust prevails as pointed out by E. Nishimura[.) , then we should take the extent of the blocks and distribution of the load hr the pressure on

24 7'. TANAKA
them into consideration. Furthermore, it is doubtful whether the earth's crust behaves as a perfect elastic body or not, namely whether the linearity of the
relation between the loading and consequent ground deformation holds or wheth-er some other effect enters into the deformetion of the ground. As to the
local effect, instrumental disturbance and underground water level, the pressure effect is expected to show different aspects at respective stations and instrum-
ents, and individual examination for quantitative treatments of the disturbance will be required for each station and instrument.
On the tiltmetric records at Oura and Akibasan, small fluctuations which correspond fairly well to the change of atmospheric pressure are observed, and
simple treatments were carried out for these fluctuations in the previous reportll . In the present article, we have obtained the Fourier transforms of the tiltmetric
and barometric data and compared them in order to find the relation between them in more detail. Since the extensometric records have also been disturbed
by the pressure in the case of Oura, they have been analysed incidentally.
2. Data and Analysis
Descriptions of the instruments and sensitivities are given in Table 1.
Deflections of the image points from the barograph, tiltmeters and extensome-
ters were recorded on the same photographic paper, the recording speed was 30 mm/hour, and the lamps were switched off every ten minutes for the time
mark.
Table I. Descriptions of the instruments.
Station Instrument Azimuth Sensitivity Symbol
Oura Tiltmeter E-W 0. 0036"/mm Ao
(135° 09'. 5E)N-S 0.0(40"/mm Bo 34° 11'. 2N/ Extensometer E -W 2.8x 10"/mm Eeo
tL=500cm)N-S 4. 7 x 10⁻⁹/mm Eno Barometer 0. 18 mb/mm Po
Ak i basaa Tiltme ter E-W 0. 0032" /mm Aa
(135° 10'. 4E\N-S(I. 0033"/mm Ba 34° 11'. 8N) Barometer 0. 11mb/mm Pa
Several data intervals in which the change of atmospheric pressure was especially-
large have been picked out and values for every minute were read out by a
comparator. The data intervals used for the analysis are listed in Table 2. Examples of the tiltmetric and extensometric records and barograms are shown in Figs. 1 and 2. After eliminating the linear drift, their Fourier transforms
have been calculated by the following conventional formula,
F(w) = -1,,fr(t)e-itht dt
T where f (t) is the tiltmetric or extensometric record or barogram, and T is half of the time interval analysed. In the present study, the periodic range has

On the Effect of Atmospheric Pressure upon Ground Tilt 25
Table 2. The time intervals analysed.
Station Time interval (JST)
Oura Feb. 6, 08: 00 - 11 : 00, 1961 Mar. 2, 05 : 00 - 08 : 00, 1961
Mar. 24, 02 : 20 - 06 : 00, 1961
Apr. 12, 13 : 00 - 16 : 00, 1961
(Data of the Eeo lacked) May 3, 18 : 30 - 21 : 50, 1961
May 20, 14 : 50 - 18 : 00, 1961
June 9, 04 : 00 - 08 : 00, 1961
July 9, 19 : 00 - 23 : 00, 1961
A It ibasan Sep. 12, 11 : 00 - 13 : 10, 1960 Sep. 14, 06 : 10 - 08 : 20, 1960
Nov. 10, 00 : 08 - 03 : 08, 1960 Nov. 12, 18 : 28 - 22 : 58, 1960
Nov. 12, 22 : 58 - Nov. 13, 02 : 28, 1960 Dec. 9, 03 : 30 - 06 : 40, 1960
Dec. 11, 23 : - Dec. 12, 01 : 30, 1960
2mn P°
o
0Ao
:] Bo 5058
01 Eno 3,thie
Eeo 0
111111 t i i i i i i LI 11 1 1 I 53h 04E 05E 06E
Mor.24, 1961
Fig. 1. Example of the record section at Oura from which the
spectra were taken. Po ; atmospheric pressure, Ao ; E-
W component tilt, Bo ; N-S component tilt, Eno ; N-S
component strain, Eeo ; E-W component strain.
been restricted within periods of one hour and five minutes respectively accord-
ing to the lengths and sampling intervals of the data used. Typical examples
of the amplitude and phase spectra are shown in Figs. 3 to 10. Good corres-
pondence between the amplitude spectra of the tiltmetric and extensometric
records and those of the harograms is apparent in all cases except the N-S
component tilt at Altibasan in which the correspondence is not so remarkable.
In order to reduce the effect due to truncation of the data analysed, care
has been taken not to cut off the data where the pressure change was quick.

S6 T. TANAKA
mb No windows have been
applied before the trans- 0 1 Pa forms and the errors
due to truncation and
reading out of the .05] Aa records may not be
0 disregarded when the
amplitude of the deflection .05
Bo is very small in such
o a case as the N-S comp- orient tilt at Akibasan. I ll I I I
I I i I I I 1 i o 7 h 08h
Sept. 14, 1960
Fig. 2. Example of the record section at Akibasan
from which (he spectra were taken. Pa ;
atmospheric pressure, Aa ; E-W component
tilt, Ba : N-S component tilt.
mb .2 I I
.0010
4
'. AMn Alid).It-4
.o005-I
•
. ,
.. . _
- . . •..
.'
. . . 0 • - ... 1 .—
I......;.......10 50 to 0 :....211 — O 50 W 1\
21T — • • OM
c\•
•R.. (DM\I\••-..-':.. n - N. ...•
.
..•o •-
.
0_ • • 60 30 10 s min
60 30 10 5 n" Fig . 4. Amplitude and phase spectra
Fig. 3. Amplitude and phase spectra of the E-W component tilt at
of the atmospheric pressure at Oura calculated from the data
Oura calculated from the data from Nlar. 24, 02:20 to 06:00,
from Mar. 24, 02 : 21) to 06:00, 1961.
1961.
On the Effect of Atntosphergc Pressure upon Ground Tilt 27
-1111 .>
1.6 x10r -1- -1---1-1- - T --T-11-Cr-n
.002 L0 -
Alm). ... .
, . .
0.5
10 50 14 ... 21 . .
0
..
• 10 50 1° Cis).211-
7 ..
•
. '....40.)
•\ Tr . . . .. • .
60 30 10 5 min .. . . . _ 0
Fig. 5. Amplitude and phase spectra 1[111 i 5115
of the N-S component tilt at60 30 10 5
Oura calculated from the data Fig. 6. Amplitude and phase spectra
from Mar. 24, 02: 20 to 06:00, of the E-W component strain
1961. at Oura calculated from the
data from Mar. 24, 02:20 to
06:00, 1961.
5x10mb .2 11 1 I I 111111
4 _
3 A54.1 Alm)' _ •
.
2
'
,. . . ••... -
I . 0i
o 1 r 1 r t 0 50 w 10 504, _12n -
4504. .. .. ..I1 .
ct,49• ..n- n ••,\V-
•
, •.ref • • . . .
11 I 1 1 Illil i 60 30 10 5 nun
60 30 10 5min Fig. 8. Amplitude and phase spectra
Fig. 7. Amplitude and phase spectra of the atmospheric pressure at
of the N-S component strain Akibasan calculated from the
at Oura calculated from the data from Sep. 14, 06:10 to 08
data from Mar. 24, 02:20 to :20, 1960.
06:00, 1961.

28 T. T AN AKA
.ocion i, ITT ITTI,
Ao9
Mel .0002 - •
.000t - -•
•
. .
506) 211 o
10 50 €4 24 • • • . .64 • • •
•
• • •
• •
Co)•
•
• • • • 11 1 1 111111
• 60 30 10 5 min 0
60 30 10 5 min Fig. 1D. Amplitule and phase spectra of the N-S component tilt at
Fig. 9. Amplitude and phase spectra Akibasan calculated from the of the E-W component tilt at data from Sep . 19, 06:10 to
Akibasan calculated from the 08:2It 1960. data from Sep. 14, 06:10 to
08:20, 1960.
3. Spectral Ratios and Discussion
Under the assumption that the pressure disturbance is represented by the
transformation through a linear system and expressed as the convolution of the
pressure and proper weight functions, amplitude ratios and phase differences have been calculated for each tilt and strain component. It is needless to say, however, that the disturbance caused by the pressure on the tiltmetric and
extensometric data can not be fully represented by the convolution of the pres-
sure change at one fixed point and weight function but spatial information
about the pressure distribution is necessary to depict the response to the press-ure change. Although we have been obliged to use only the barographic data
at Oura and Akibasan in the present study, the above assumption will require some modification in the light of more extensive materials available, if possible.
Now, since meteorological effects other than those due to pressure and
earth-tides also distort the spectra obtained from the tiltmetric and extensometric records, we shall deal with the amplitude ratios and phase differences with
regard only to the amplitude spectral peaks for which good correspondence is seen between the spectra of the tiltmetric or extensometric records and harp-
grams. The amplitude ratios and phase differences thus obtained are shown in Figs. 11 to 16. As seen in the figures, all components of tilts and strains at
Ow-a and the E-W component tilt at Akibasan show fairly systematical aspects. In the cases of the E-W component tilt and N-S component strain at Oura, the
amplitude ratios are almost constant and independent of the frequency in the
present periodic range, and phase differences are also constant and nearly ectual to Jr. Therefore it is concluded that the disturbance due to atmospheric pressure which appeared on the records of these components is almost proportional to the barometric change al. Oura and can be expressed as the curves multiplied by

On the Effect of Atmospheric Pressuure upon Ground Tilt 29
- _..
. •
. • • • • - .. . . . .
- - -
. . ...
-" 105C) W 211 p • i
.001
2n 10 50 w.
-
. - 71=y- -- c-,-.ta:-7.-triC:i •(o) ..
0 H 60 301O15min
0 60 30 10 sm'"
Fig. 12. Amplitude ratio and phase Fig. 11. Amplitude ratio and phase difference of the N-S compo-
difference of the E-W compo- nent tilt at Oura to the atmo- rent tilt at Oura to the spheric pressure. Unit of
atmospheric pressure. Unit of the ordinate of the ratio is the ordinate of the ratio is second of arc/mb.
second of arc/mb.
100., . , 50. .r . J. 50:
• . •.; . - AM) - _ .. • • • • • . ------ r • ..
_ - •
' 0 .E 10 —.-- - 5 '1 • r.-
_
5 ,„., ' 1050b) I iIL211p, „. 10
50w 211 P 1 T " -
'PM
<DM . .........._ . .
.
. .
o . . . i ,-, • 60 30 10 5min 0 , . . , , , I 1-j. c , 1
60 30 10 5"n Fig. 14. Amplitude ratio and phase
Fig. 13. Amplitude ratio and phase difference of the N-S compo- difference of the E-W compo- nent strain at Oura to the
nent strain at Oura to the atmospheric pressure. Unit of atmospheric pressure. Unit of the ordinate of the ratio is the ordinate of the ratio is X X 10-9/mb.
10-9/mb•
30 T. TANAKA
.05'' ••rl
•
.011 .005:
Ann) • •
•
• •
. .
. • ________
.001,
.001 •
211 211 10 50to 10 5014
(PP) n
• .•
60 10 5min 60 30 IO 5min
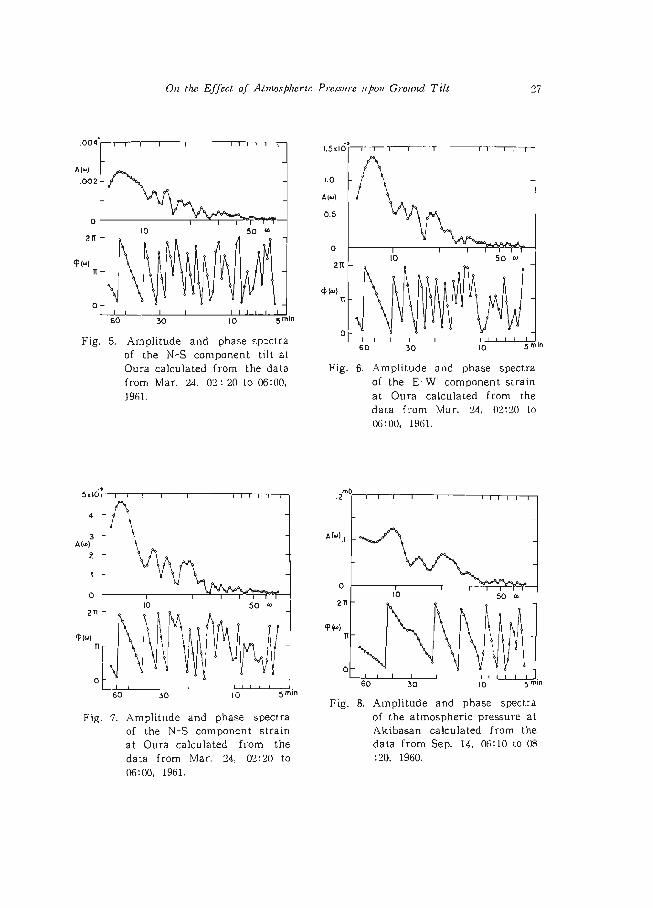
Fig. 15. Amplitude ratio and phase Fig. Di. Amplitude ratio and phase difference of the E-W compo- difference of the N-S compo-
nent tilt at Akibasan to the nent tilt at Akibasan to the at-mospheric pressure. Unit atmospheric pressure. Unit of
of the ordinate of the ratio the ordinate of the ratio is is second of arc/mb. second of arcimb.
some constants to the barogram at Oura within the present periodic range. On the other hand, the spectrals ratios of the N-S component tilt and E-W component strain at Oura and E-W component tilt at Akibasan show some different aspects from those mentioned above, namely that in these components the amplitude ratios gradually increase as the frequency increases, and the phase differences deviate slightly from 7. A similar tendency is also seen in the N-S component tilt at Akibasan, although the data points of the phase difference show considerable scattering. It is deduced from these facts that the disturb-ance due to atmospheric pressure on the tiltmetric and extensometric records can be expressed as the output from transformations of the pressure change through linear systems as a first approximation, However, the periodic range of the Fourier transforms calculated is insufficient to get the inverse transforms and to straightforwardly determine the forms of the weight functions in the time domain. Then, in order to interprete the frequency dependence of the spectral ratios from another viewpoint, we introduce the tiltmetric or extenso-metric change proportional to the time derivative of the atmospheric pressure at Oura and Akibasan. Let p(t) be the sequence of the observed atmospheric
pressure and f(t) the disturbance due to it on the tiltmetric or extensometric record, and we simply assume that the following relation holds,
.1(0=ft.ti(0+ ;3. dP(0 (1)
where a and a are constants. Then making the Fourier transform, we get
F(w)=a • P(w)- j • P(w),
where F(w) and P(w) are the Fourier transforms of f(t ) and P(t), respectively. Accordingly, the amplitude ratio ; F(m)/ P(w) and phase difference 0(w)
as to 1(t) and p(t) are given as

On the Effect of Atmospheric Preisure upon Ground Tilt 31
F(m)P/(m) I = a2+1920)2 (2)
r(w)=tan 1( — i5cola) (3) Therefore, the frequency dependence of the spectral ratios may be explained by adding the term proportional to the time derivative of the pressure to the term proportional directly to its change. Upon this, the values of a and p for each tilt and strain component have been determined so as to satisfy the data points of the amplitude ratios by (2), and then the phase difference have been calculated by (3) using the a and ft. The values of a and p thus estimated are summarized in Table 3, and the corresponding amplitude ratios and
Table 3. Values of a and p at Oura and Akibasan.
Station a ft
Oura E-W Tilt -0. 0074"/mb +O. 000040"/mb/hour
N-S Tilt -0, 019 +0.00033 E-W Strain -9.4x 10⁻³/mb +0. 12X 10-9/mb/hour
N-S Strain -24 x ur, to. 23X 10-9 Akibasan
E-W Tilt -O. 0050"/mb +0. 00015"/Inb/houl- N-S Tilt ! 0. 0011 -0.000027
phase differences calculated from (2) and (3) are also shown in Figs. 11 to 16 by dashed lines. As seen in the figures the curves favorably satisfy the data
points, and from this it is concluded that the disturbance due to atmospheric pressure is able to be approximately expressed by the sum of the direct effect which is proportional to the pressure change and second effect proportional to the time derivative of the pressure change.
As to the results of ground tilt, the former is considered to be due to instrumental or purely local disturbance caused by the pressure and the latter is considered to be due to the tilt caused by the loading effect of the pressure, if the time derivative can be approximately substituted for the spatial derivative of the pressure. In this case, as is pointed out by D. Simon et al.5), the direct effect a•p(t) is considered to take different values at respective stations and instruments, while the second term p•dp(t)/dt may be related to the deformation extending over a fairly large area and they are supposed to be nearly equal to each other when the distance between observation stations is not so large. As shown in Table 3, however, the values of ft in the same direction at the two stations are not in agreement with each other, namely the ground tends to incline nearly southwards or eastwards at Oura or Akibasan respectively, when atmospheric pressure increases. One reason for the discrepancy may be due to the substitution of the time derivative of the pressure change for the spatial derivative and leaving the azimuthal effect out of consideration. Besides, if there exists a boundary of crustal blocks between the two stations, then each block on which Oura or Akibasan is located may respond in a different manner to the loading effect of atmospheric pressure. Indeed, Nishimura 6) reported

32 T. 7'ANAKA
two examples of different tilting motions of the ground caused by quick pressure
changes at four stations spaced out 500 - 1000 m in Beppu and suggested block
movements of the ground due to its mosaic structure.
Meanwhile, it is observed on the vectorial representation of a and 19 shown
in Fig. 17 that the tilting vector of 19 almost points in the opposite direction to
that of a for each station. From this, another interpretation for the pressure
disturbance may be drawn, namely that
the ground tends to incline prevailingly
in an NNW-SSE direction at Oura and
Akibasan WSW-ENE at Akibasan according to the pressure change, and that the tilting
Ouramotion can be divided into two terms, the one proportional to the pressure change
0,01 and the other proportional to its time derivative. In this case the second term is considered to relate also to the purely
00001local disturbance of the pressure as well as the first term, and consequently
Fig. 17. Vectorial representationthe large scale crustal tilting is less of a and 9 at Oura and important and negligible within the present
Akibasan. periodic range from one hbur to several minutes compared with the purely local
effect of the pressure. When we stand on this viewpoint, the directions of the tilting vectors seem to be related to the geographical situation of the stations.
When the atmospheric pressure is distributed over the semi-infinite elastic body along a certain direction in the shape of a sinusoidal wave, p = — gph cos 2w(x/A — VT), with parallel undulation, the horizontal (u) and vertical (w) displacements at the point x, z are given, following the result obtained by Darwin 7.), as
gp h ze u=-2nnsin24Ax 2pt (4) T
w=g4rP—hd(1 + 2n.)e-21n/lcos2r( xt \ (5) pT
where p is the modulus of rigidity, g the acceleration of gravity, h the baro-
metric height represented by the mercury column, p the mercury density, x
the distance along the horizontal, z the depth below the surface, t the time,
and and T the wave length and period of the sinusoidal wave. Then the
tilt and horizontal strain due to the sinusoidal pressure wave are expressed as
dw _ gph (1±2rt\
T
z)e-,‘"sina( x(6) dx 2p
du _wzgph e-2"zncos27r xt (7) dx211dT
Putting aPiat=( —2ngph/T)sin 27r(x/2 —1/T) into (6), we get
dw T (1 +27r)e-21"ll•f)P dxibrp at '
Therefore it is to he noted that, although we have implicitly assumed small

On the Effect of Atmospheric Pressure upon Ground Tilt 33
scale block movements of the ground compared with the wave length of the
pressure and coefficients a and 15 to be independent of m, in the case of the tilt the coefficient ,3 is not a constant as assumed in (I) but a function of m-2:7,7, and in the case of the horizontal strain the coefficient a becomes a
function of 2, in other words, a function of the velocity of the wave v and w,
and putting a to be a function of o, the pressure disturbance might he explained
by (1 ;IT) ra(w)P(m)e-1 'do) in place of (1). In order to compare the pressure influence on the ground tilt at Oura and
Akibasan to that of another station, the same analysis has been carried out as to the tiltmetric data observed at the Amagase Observatory in Uji City, Kyoto
-which is located at 34'53' N latitude and 135°50'E longitude , approximately 100 km NE of Wakayama City. As seen in the example of the barographic and tiltmetric records shown in Fig. 18, the disturbance of the pressure upon I he tiltmetric record is rather small compared with those of
Oura and Akibasan be-cause of the depth of the observational site under- ca„
.4-
neath the earth's sur- 0
face. The sensitivities of the tiltmeters are 0. .017 e
0042 and O. 0043",(min in
the E-W and N-S com- I t I I I I I I I 1 I I I I I I ponents respectively, and 21h 22h 23h the recording speed is June 9 , 1968
also 30 mm/hour. The Fig . 18. Example of the record section at Amagase analysed data intervals from which the spectra were taken . P ; are given in Table 4, atmospheric pressure, A ; E-W component Typical examples of the tilt, B; N-S component tilt.
Fourier spectra are
Table 4. The time intervals analysed.
Station Time interval (JST)
Amagase May 19. 06 : 00 — 08 : 51. 1968
May 19, 20 : 59 — 23 :43, 1968
May 23, IX): 00 — 02 : 52, 1968
June 3, 20 : 57 — 23 : 40, 1968 June 9, 20 : 56 23 : 40, 1968
June 10, 05: 57 08:99, 1968
July 2, 05:58 08 : 50, 1968 .luly 5, 23 : 58 — July 6, 02:50, 1968
shown in Figs. 19 to 21. Figs. 22 and 23 show the amplitude ratios and phase
differences regarding the prominent peaks for which good correspondence is seen

34 T TANAKA
, , , 1 1 1 1 1 I i .I I I I I III]] T
.
m
A Is)
.0004- - b
- A . -
.0002 -
-
•
..•-. -, •" ••.
•-.'.. ••- .....
. .. ."'.. -•. •• •'.• • - •0
i 10 50 W 0
2n- - 0 50 ca .
2n- - . . . , ..
inw)....
.
..
• .
OM. ..• - .
. . . . .
. , •
......_ 0-1.1 r I I I i i I I .
60 30 10 5min 50-I(•II 1T(I 1 1 60 30 10 5 rnin
Fig. 20. Amplitude and phase spectra Fig. 19. Amplitude and phase spectra of the E-W component tilt at
of the atmosheric pressure at Amagase calculated from the Amagase calculated from the data from June 9, 20:56 to
data from .June 9, 20 : 56, to 23:40, 1968. 23:40, 1968,
.000e
• __,
. .
At') .005' • ' •
.0004 " AM ' • • •
. • . • .
• . .
.
. . .001 ......'...'.10 50 67 211 —• •
211 4,(Li) M WIti
O
11
60 30... 10. 5 min 0
60 30 10 5 min Fig. 22. Amplitude ratio and phase dif- ference of the E-W component
Fig. 21. Amplitude and phase spectra tilt at Amagase to the atmos- of the N-S component tilt at pheric pressure. Unit of the
Amagase calculated from the ordinate of the ratio issecond data from June 9. 20:56 to of archnb.
23:40, 1968.
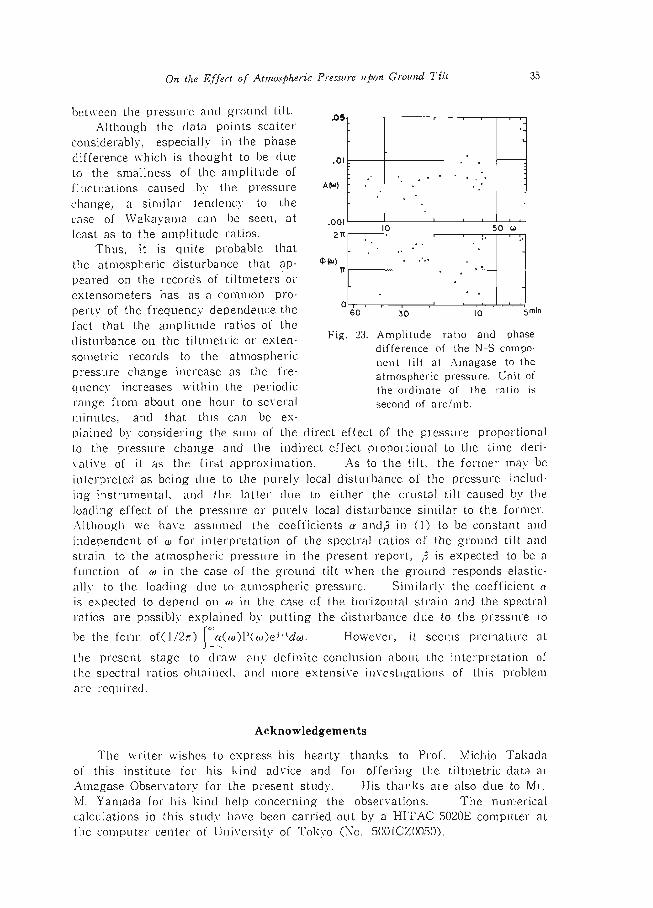
On the Effect of Atmospheric Presthre upon Ground Tilt 35
between the pressure and ground tilt. .05 Although the data points scatter
considerably, especially in the phase • - difference which is thought to he due .01 •
to the smallness of the amplitude of
.
fluctuations caused by the pressure AO) - • • • •
change, a similar tendency to the • •
case of Wakayama can be seen, at .001 •I
least as to the amplitude ratios. 2n10 50 co•
Thus, it is quite probable that . • .. •• •
. ••••
the atmospheric disturbance that ap- 4)00
• peared on the records of tiltmeters or extensometers has as a common pro-
o •- perty of the frequency dependence theth) smin fact that the amplitude ratios of the disturbance on the tiltmetric or exten- Fig. 23. Amplitude ratio and phase sometric records to the atmosphericdifference of the N-S compo- nent tilt at Amagase to the
pressure change increase as the fre- atmospheric pressure. Unit of q uency increases within the periodic the ordinate of the ratio is range from about one hour to several second of a rc/ m b.
minutes, and that this can be ex-
plained by considering the sum of the direct effect of the pressure proportional to the pressure change and the indirect effect proportional to the time deri-vative of it as the first approximation. As to the tilt, the former may be interpreted as being due to the purely local disturbance of the pressure includ-ing instrumental, and the latter due to either the crustal tilt caused by the loading effect of the pressure or purely local disturbance similar to the former. Although we have assumed the coefficients a and,li in (I) to be constant and independent of to for interpretation of the spectral ratios of the ground tilt and strain to the atmospheric pressure in the present report, s is expected to be a function of to in the case of the ground tilt when the ground responds elastic-ally to the loading due to atmospheric pressure. Similarly the coefficient a is expected to depend on at in the case of the horizontal strain and the spectral
ratios are possibly explained by putting the disturbance due to the pressure to
be the form of(1/2r) a(w)P(m)ebacho. However, it seems premature at
the present stage to draw any definite conclusion about the interpretation of the spectral ratios obtained, and more extensive investigations of this problem
are required.
Acknowledgements
The writer wishes to express his hearty thanks to Prof. Michio Takada of this institute for his kind advice and for offering the tiltmetric data at Amagase Observatory for the present study. His thanks are also due to Mr.
M. Yamada for his kind help concerning the observations. The numerical calculations in this study have been carried out by a HITAC 5020E computer at
the computer center of University of Tokyo (No. 5001C7,0050).
36 T. TANAKA
References
1) Darwin, G. H. ; On Variations in the Vertical due to Elasticity of the Earth's Surface, Scientific Papers (Oceanic Tides), Vol. 1, 1882, 449-959.
2) for example, Khorosheva, V. V. ; Effect of the Atmospheric Pressure on the Tilt- ing of the Earth's Surface, Izv. Akad. Nauk, SSSR, No.1 (English Translation),
1958, 77-79. Tomaschek, R. ; Tides of the Solid Earth, Encyclopedia of Physics (Handbuch der
Physik), Vol. 48, Geophysics, U, 1957, 838-839 Bonchkovskii, V. F. ; A Specific Case of Connection between the Variations of
Tilts and Linear Deformations and the Distribution of Atmospheric Pressure, Izv. Akad. Nauk, SSSR, No. 9 (English Translation), 1963, 832-836.
3) Nishimura, E. ; ChikakuchOseki ni tsuite, Sono-2, Chikyu-butsuri, Vol. 5, No. 1, 1941, 33-86.
4) Tanaka, T. ; Study on the Relation between Local Earthquakes and Minute Ground Deformation (Part 1), Bulletin of the Disaster Prevention Research Institute, Kyoto
Univ., Vol, 14, Part 1, 1964, 55-77. 5) Simon, D. and M. Schneider; Zum Auftreten luftdruckbedingter StOrungen in
Horizontalpendelaufzeichnungen auf drei verschiedenen Erdgezeitenstationen, Mar- ées Terrestres, Bulletin d'Informations, No. 49, 1967, 2218-2225.
6) loc. cit., 3). 7) loc. cit.,; 1).