Title: Improved Wildfire Prediction Using Remote … · grassland areas at both Makua (320 ha) and...
30
Title: Improved Wildfire Prediction Using Remote Sensing Technology on Guinea Grasslands in Hawaii Project ID: 11-3-1-12 Graduate Research Innovation (GRIN) Award PI: Creighton M. Litton, University of Hawaii at Manoa, Department of Natural Resources and Environmental Management CO-PI: Lisa M. Ellsworth, University of Hawaii at Manoa, Department of Natural Resources and Environmental Management
Transcript of Title: Improved Wildfire Prediction Using Remote … · grassland areas at both Makua (320 ha) and...

Title: Improved Wildfire Prediction Using Remote Sensing Technology
on Guinea Grasslands in Hawaii
Project ID: 11-3-1-12
Graduate Research Innovation (GRIN) Award
PI: Creighton M. Litton, University of Hawaii at Manoa, Department of Natural
Resources and Environmental Management
CO-PI: Lisa M. Ellsworth, University of Hawaii at Manoa, Department of Natural
Resources and Environmental Management

Abstract
The synergistic impacts of nonnative grass invasion and frequent anthropogenic fire
threaten endangered species and native ecosystems, and adjacent land throughout the tropics. It
is generally accepted that these impacts result in landscape scale conversion from forest to
grassland throughout the tropics. However, there is little published data to support this paradigm
on a landscape scale on tropical islands, and no study has examined changes in fire potential
following type conversion in these systems. If true, nonnative grasslands are more flammable
than forests due to changes in fuel loads and microclimate and, thus, are at increased risk of fire
occurrence and spread. Further, current predictive fire models do not accurately predict fire
ignition or behavior in Hawaii’s invasive grasslands, largely due to inadequate prediction of fuel
moisture, a key driver of wildfire. The objectives of this research were to: (i) compare potential
fire behavior in forests vs. grasslands, (ii) measure land cover change from 1950-2011 along two
grassland/forest ecotones in Hawaii, and (iii) investigate the potential for using remotely sensed
MODIS imagery to improve fuel moisture prediction. To address these objectives, we quantified
fuel loads and moistures in nonnative forest and grassland (Megathyrsus maximus) plots (n=6),
and used these field data to model potential fire behavior using the BehavePlus fire modeling
program. Rate and extent of land cover change were quantified from 1950-2011 with historical
imagery. Finally, we developed empirical models to predict real-time fuel moisture content in
nonnative grasslands in Hawaii dominated by Megathyrsus maximus from Terra-MODIS NDVI
and EVI2 vegetation indices.
Live and dead fuel moisture content and fine fuel loads did not differ between forests and
grasslands, but mean surface fuel height was 31% lower in forests (72 cm) than grasslands (105
cm; P<0.02). However, predicted fire behavior differed greatly in forests vs. grasslands. Rates
of spread were 3-5 times higher in grasslands (5.0-36.3 m min-1) than forests (0-10.5 m min-1)
(P<0.001), and flame lengths were 2-3 times higher in grasslands (2.8-10.0 m) than forests (0-4.3
m) (P<0.01). Between 1950 and 2011, invasive grassland cover increased in heavily utilized
grassland areas at both Makua (320 ha) and Schofield (745 ha) at rates of 2.62 and 1.83 ha yr-1,
respectively, with more rapid rates of conversion before active fire management practices were
implemented in the early 1990’s. MODIS-based predictive models for live fuel moisture were
modest (R2= 0.46), and outperformed the currently used National Fire Danger Rating System
(R2= 0.37) and the Keetch-Byram Drought Index (R
2= 0.06). Dead fuel moisture prediction was
less robust, and was best predicted by a model including EVI2 and NDVI (R2= 0.19). These
results support accepted paradigms for the tropics, and demonstrate that the type conversion
associated with nonnative grass invasion and subsequent fire has occurred on a landscape scale.
Moreover, once forests were converted to grassland there was a significant increase in fire
intensity, likely providing a positive feedback to continued grassland dominance in the absence
of active fire management. More accurate fuel moisture prediction in nonnative grasslands will
greatly improve management of fire in Hawaii, as well as other tropical ecosystems dominated
by nonnative grasses.

Background and purpose
Highly flammable African pasture grasses have been widely introduced throughout the
tropics where they are now problematic invaders (D'Antonio and Vitousek, 1992; Williams and
Baruch, 2000). In addition to impacting fire regimes, these invasive grasses commonly
outcompete native plants for above- and belowground resources (Ammondt and Litton, 2012;
Ammondt et al., 2012), and alter carbon storage and forest structure (Litton et al., 2006) and
nutrient dynamics (Asner and Beatty, 1996; Mack et al., 2001). These highly competitive
grasses typically form a continuous layer of fine fuels, even under a forest canopy (LaRosa et al.,
2008), thereby increasing the potential for future fire and type conversion to nonnative grassland.
Once a fire does inevitably occur, the postfire plant community is typically characterized by
rapid nonnative grass regeneration, which then predisposes these ecosystems to more frequent
and higher intensity fires as a result of increased fine fuel loads and changes in microclimate
(Smith and Tunison, 1992; Pyne et al., 1996; Blackmore and Vitousek, 2000; LaRosa et al.,
2008; Ainsworth and Kauffman, 2010). This cycle of nonnative grass invasion, fire, and grass
reinvasion is a common occurrence in tropical ecosystems that leads to large scale land cover
change (D'Antonio and Vitousek, 1992).
Plot level studies provide important insights into the relationships between nonnative
grass invasion, fire, and type conversion from forest to grassland, but a greater understanding of
these dynamics is only possible by examining these processes at the landscape scale (Brook and
Bowman, 2006; Levick and Rogers, 2011). Furthermore, an understanding of the spatio-
temporal dynamics of vegetation change over longer time scales can better elucidate the
mechanisms driving vegetation change. Because the invasive grass–wildfire cycle has been so
well documented at the plot scale, the dominant paradigm on tropical islands is that fire shifts
composition from woody communities to nonnative grassland, that these changes persist over
long time periods, and that the end result is a landscape that is increasingly dominated by
nonnative invasive grasses that have a much higher fire risk than the forests that they replaced.
However, few studies in the tropics have looked at landscape vegetation cover patterns resulting
from repeated fire and grass invasion at larger scales (Blackmore and Vitousek, 2000; Grigulis et
al., 2005).
Fire modeling programs such as BehavePlus (Andrews et al., 2005) and the National Fire
Danger Rating System (NFDRS, (Schlobohm and Brain, 2002) were developed to simulate fire
potential and behavior and to assist in predicting fire danger ratings, thereby providing fire
managers with a suite of decision-making tools. The predictive capability of these models,
however, depends largely on the accuracy of input variables such as fuel loads and fuel moisture,
along with a suite of microclimate variables, all of which change rapidly over short temporal
scales (Ellsworth et al, in press). The field method most commonly used for quantifying fuel
moisture, a critical driver of fire occurrence and behavior, is to simply measure the proportion of
fresh weight:dry weight of a number of samples collected from the site of interest. However, this
method is time and labor intensive, and provides fuel moisture for only a snapshot in time. It
would be useful for fire behavior prediction if fuel moisture for guinea grass could be estimated
using remotely-sensed data, as has been done elsewhere for other vegetation types (Chuvieco et
al., 2002; Caccamo et al., 2011).
Current tools used to predict live and dead fuel moisture on the mainland United States
have not been widely tested in Hawaii against in situ fuel moisture data (Beavers, 2001), and it is
unclear whether they accurately predict fuel moisture, and thus potential for fire. The National
Fire Danger Rating System (NFDRS) is most commonly used by agencies in Hawaii as a tool to

assess the potential for ignition, spread and difficulty of control. This index is based on the
relationships between on-site fuels, weather, and topography and is calculated for each station
within the Remote Automated Weather Station (RAWS) network (Schlobohm and Brain, 2002).
Live and dead (1-hr) fuel moistures, in turn, are calculated as intermediates in the NFDRS and
can also be obtained for any weather station in the network. The Keetch-Byram drought index
(KDBI) is a meteorological index designed for predicting fire potential, and is based on the
cumulative moisture deficiency in the upper layers of the soil profile (Keetch and Byram, 1968).
While used widely for fire potential prediction, KBDI has been shown to be a poor to moderate
predictor of fuel moisture content (Dimitrakopoulos and Bemmerzouk, 2003; Pellizzaro et al.,
2007; Caccamo et al., 2011). KBDI is used more informally in Hawaii to assess longer term
drying trends (A. Beavers, personal communication), typically in conjunction with the NFDRS.
The objectives of this study were to: (i) use field data and modeling to compare fuels and
potential fire behavior in adjacent forests vs. grasslands, (ii) measure the rate and extent of land
cover change at the grassland-forest boundary from 1950-2011 in and around two heavily
utilized military installations on Oahu, Hawaii, and (iii) evaluate the use of vegetation indices
derived from remotely sensed MODIS data to accurately predict live and dead fuel moistures in
guinea grass dominated vegetation on leeward Oahu. We hypothesized that (i) fine fuel loads
and heights would be lower and fuel moisture higher in forest plots than grass plots due to
differences in understory microclimate (Hoffmann et al., 2002) and shading (Funk and
McDaniel, 2010); (ii) as a result of lower fuel heights and fuel loads, modeled fire behavior
would be less severe (i.e. lower rates of spread, fireline intensity, flame lengths, and probability
of ignition) in forest plots than grass plots (Freifelder et al., 1998); (iii) rates of conversion from
forest to grassland would increase through time over the past 50+ years due to increased ignition
sources, and rates of conversion would be higher in areas where there was already a large grass
component than in adjacent forests (Beavers, 2001); (iv) because vegetation indices are a good
indicator of vegetation greenness, there will be strong relationships between vegetation indices
derived from MODIS imagery and in situ live fuel moisture content; (v) because live and dead
fuel moisture are closely correlated, we also expect moderate relationships between vegetation
indices and dead fuel moisture content; (vi) because EVI performs well in areas of high biomass
(Jensen, 2007), it will be a stronger predictor of fuel moisture than other vegetation indices given
the dense grass cover present on our study sites; and (vii) daily MODIS data will show stronger
predictive relationships with in situ fuel moisture than 8-day or 16-day composites, as fuel
moisture can change rapidly within a site over a short time period, particularly following
precipitation events (Ellsworth et al, in press).

Study description and location
Fuel Quantification
Fuel loads in guinea grass-dominated open grassland (grass sites) and adjacent nonnative
forest (forest sites) were quantified in the summer of 2008 in the Waianae Kai Forest Reserve
(forest: 367 m a.s.l.; MAP [mean annual precipitation], 1399 mm; MAT [mean annual
temperature], 20ºC) (grass: 193 m.a.s.l.; MAP, 1134 mm; MAT, 23ºC) and Dillingham Airfield
(forest and grass: 4 m a.s.l.; MAP, 900 mm; MAT, 24ºC; T. Giambelluca, unpub. data) on the
Waianae Coast and North Shore areas, respectively, on the Island of Oahu, Hawaii, U.S.A. All
sites are dominated by guinea grass in the understory. Forest sites at Waianae Kai Forest
Reserve are dominated by nonnative trees, including Leucaena leucocephala (Lam.) De wit in
the subcanopy and kiawe (Prosopis pallida) and silk oak (Grevillea robusta) in the overstory.
Forest sites at Dillingham Airfield have dense nonnative L. leucocephala in the canopy, with
infrequent other nonnative woody species scattered throughout. Soils at Dillingham Airfield are
in the Lualualei series (fine, smectitic, isohyperthermic Typic Gypsitorrerts) formed in alluvium
and colluvium from basalt and volcanic ash. Soils at Waianae Kai are in the Ewa series (fine,
kaolinitic, isohyperthermic Aridic Haplustolls) formed in alluvium weathered from basaltic rock.
Within each of the two sites, three grassland and three forest plots were selected using
USGS imagery in Google Earth 5.0. Plot selection was based on continuous grass cover and
limited overstory trees for grassland plots, and a continuous tree overstory with guinea grass in
the understory for forest plots. Final plot selection was made randomly from all possible
locations that met these criteria. In each site, the following fuel variables were measured: (i)
total fuel loads (standing live and dead, and litter), (ii) fuel composition (live grass, dead grass,
shrubs, standing trees, downed wood), (iii) mean fuel height (calculated as 70% of maximum
observed surface fuel height in each plot (Burgan and Rothermel, 1984)) and (iv) live and dead
fine fuel moisture. In each plot, three parallel 50m transects were established 25m apart, and all
herbaceous fuel was destructively harvested in six 25 x 50 cm sub-plots at fixed locations along
each transect (n=18/plot). This sampling design adequately captured the spatial variability in
fuels at a given site (Ellsworth et al, in press). Samples were immediately placed into sealed
plastic bags to retain moisture. Within 6 hours of field collection, all samples were separated
into categories (live grass, standing dead grass, surface litter, and downed wood), weighed, dried
in a forced air oven at 70oC to a constant mass (minimum 48 hours), and reweighed to determine
dry mass and moisture content relative to oven dry weight.
Live standing trees and standing and downed dead wood were also quantified in each
forest plot. The diameter at breast height (dbh) of all L. leucocephala trees– the dominant
species in all forest plots – in a single 1 x 50 m belt transects was measured in each forest plot.
Live tree biomass was determined using an existing species-specific allometric equation for L.
leucocephala (Dudley and Fownes, 1992). The utility of this allometry for estimating biomass in
trees from the Waianae Kai field site was explored by harvesting trees across the widest possible
range of sizes found (n=20, dbh ranging from 1.5 to 6.2 cm dbh) and comparing observed vs.
predicted biomass. There was a strong correlation between predicted and observed biomass (r2=
0.95), indicating that the existing equation accurately estimates L. leucocephala biomass in our
study sites. While other woody species occurred in the general study area, none were
encountered in any of the sampling transects. Coarse downed woody fuels were sampled along
three 50 m transects/plot using a planar intercept technique (Van Wagner, 1968; Brown, 1974).
In addition, the height of the tallest blade of grass was measured in each subplot before clipping,

and mean fine fuel height was recorded as 70% of the average maximum height across subplots
(Burgan and Rothermel, 1984).
Fire Modeling
The fuels data described above were used to parameterize the BehavePlus 5 Fire
Modeling System (Andrews et al., 2005) to predict fire behavior for each plot. Live and dead
fuel heat contents were measured by bomb calorimetry (Hazen Research, Inc., Golden, CO,
USA). Previously published values of dead fuel moisture of extinction for guinea grass
(Beavers, 2001) and woody surface area to volume ratio for humid tropical grasslands (Scott and
Burgan, 2005) were used. Surface area to volume ratios for both live and dead fuels were
measured on guinea grass individuals from Dillingham Airfield and Waianae Kai Forest Reserve
(n=20 overall using a LI-3100C Leaf Area Meter (LI-COR Environmental, Lincoln, Nebraska)
and water displacement. After examining wind speed data collected at the field sites, we selected
an average 20-foot windspeed (15 km hr-1) and an extreme 20-foot windspeed (30 km hr-1) to
simulate moderate and severe wind scenarios that were then applied to all sites. Wind
adjustment factors of 0.4 and 0.3 were used for grass and forest plots, respectively, to adjust the
windspeed collected by the RAWS weather stations (20-foot wind speed) to that at the vegetation
height (surface wind speed) (Andrews et al., 2005). Output variables of interest from the fire
behavior model included: maximum rate of spread (ROS; m min-1), fireline intensity (kW m-1),
flame length (m), and probability of ignition (%).
Historical and Spatial Land Cover Change Analysis
Land cover classifications were made on orthorectified aerial photographs and high
resolution multispectral Worldview-2 imagery for Makua Military Reservation (108 m.a.s.l.;
MAP, 864 mm; MAT, 23ºC) and Schofield Barracks (297 m.a.s.l.; MAP, 1000 mm; MAT, 22ºC;
(Giambelluca et al., 2011); Figure 1). Classified maps for Makua were derived from images for
five time periods: 1962, 1977, 1993, and 2004 aerial photographs, and 2010 Worldview-2
scenes. Schofield land cover maps were created for six time periods: 1950, 1962, 1977, 1992,
and 2004 aerial photographs, and 2011 Worldview 2 scenes. The 2004 images for Makua and
Schofield were high resolution (0.3 m) USGS registered images with a positional accuracy that
did not exceed 2.12 m RMSE (root mean square error). The other images were registered to the
2004 images with a first-order polynomial warping (affine transformation) to achieve an average
RMSE of 3.37 m and a maximum RMSE of 9.84 m. Worldview-2 images are high resolution
(~0.5 m) with a positional accuracy of 12.2 m at the CE90 level.
Both Makua and Schofield site boundaries were digitized into polygon vector shapefiles
using ArcGIS Desktop Version 9.3.1 (ESRI, Redlands, California, USA). Each site was divided
into two areas of interest (AOI): a grassland area within the fire break which is heavily utilized
for military training activities and a forested area outside the fire break, where little military
activity occurs. While these areas were defined as grassland vs. forest, respectively, each
contains patches of both grass and woody cover as well as patches of more intensive utilization
(i.e. developed military training areas). The ArcGIS Data Management tool Create Fishnet was
used to divide the study sites into grids with a 50 x 50 m cell size and clip the grids to the site
boundaries. After the grids were created, they were overlaid onto the images for classification.
Each cell was classified into one of seven cover classes at Makua: Grass, shrub, forest,
bare, developed, military training area (MTA; highly disturbed area with minimal vegetative
cover), and shadow/cloud (treated as No Data). The woody plant composition at Schofield is

highly variable and forest and shrub cover classes are often indistinguishable from aerial images.
At Schofield, therefore, shrub and forest cover classes were combined into a single mixed woody
cover class, resulting in only six cover classes for this site (grass, woody, bare ground,
developed, MTA, and No Data). The total area of each cover class was calculated for every time
period within the two AOIs for both sites. Amounts and rates of land cover change (expressed as
average hectares per year) were then extrapolated for each of the four AOIs over each time
period.
In situ fuel moisture data collection
Bi-weekly in situ fuel moisture samples were collected from October 2009-October 2010
in guinea grass dominated ecosystems at Schofield Barracks, Yokohama State Park, and
Dillingham Ranch on the Island of Oahu, Hawaii. All sites are dominated by guinea grass with
some invasive Leucaena leucocephala (Lam.) De wit in the overstory. Yokohama (7 m.a.s.l.;
MAP = 857 mm; MAT = 24ºC), soils are in the Lualualei series, (fine, smectitic,
isohyperthermic Typic Gypsitorrerts) formed in alluvium and colluvium from basalt and
volcanic ash. Schofield Barracks and Dillingham Ranch sites are discussed above.
On the first sampling date in October 2009, a single 50m transect was established in each
site. Starting at the 0m mark of each transect, biomass of all herbaceous plant materials
occurring in a 25x50 cm plot was clipped at the soil surface every 10m along the transects
(n=6/transect). Samples were taken back to the laboratory and separated into the following
categories: live herbaceous vegetation, dead herbaceous vegetation and surface litter. Samples
were then weighed, dried in a forced air oven at 70oC to a constant mass, and re-weighed. Fuel
moisture was the calculated as the ratio of the weight of water to the dry weight of the plant
material, expressed as a percentage. Subsequent weeks’ sampling occurred on parallel transects,
with each biweekly sampling offset from the prior sampling transect by 1 m.
MODIS data acquisition and processing
MODIS data products were acquired from the NASA Earth Observing System Data and
Information System (http://reverb.echo.nasa.gov/reverb/) for all dates corresponding to in situ
sampling. The datasets used in our analyses included the following: Surface Reflectance Daily
L2G Global 250m (MOD09GQ), Surface Reflectance Daily L2G Global 1km and 500m
(MOD09GA), Surface Reflectance 8-day Global L3 Global 250m (MOD09Q1), Surface
Reflectance 8-day L3 Global 500m (MOD09A1), and Vegetation Indices 16-day L3 Global
250m (MOD13Q1). Each data product was available in the sinusoidal projection. We used the
MODIS Reprojection Tool (NASA Land Processes Distributed Active Archive Center [LP
DAAC], USGS/Earth Resources Observation and Science [EROS] Center, Sioux Falls, South
Dakota) to project the data into the Universal Transverse Mercator projection zone 4 on the
North American Datum 1983. ENVI 4.5 (Exelis Visual Information Solutions, Boulder,
Colorado) was used to reformat the data into a multi-date image cube and create a temporal
profile of reflectances for each band at each study site location.
Vegetation indices
Vegetation indices of interest – including NDVI, EVI, EVI2, VARI, NDWI, NDII,
RGRE, and an integral calculation (Chuvieco et al., 2002) – were calculated separately for daily
and 8-day reflectance values for the entire one year study period. 16-day NDVI and EVI
vegetation index products were also obtained, as well as reflectance values for bands 1-3.

MODIS 16-day composite data omits bands 4-7, allowing calculations of only a subset of the
vegetation indices (EVI2 and RGRE) for this temporal resolution.
NFDRS fuel moisture and KDBI
KDBI values and NFDRS (1978 system) calculations for live and dead fuel moisture for
each in situ sampling date were retrieved on June 14, 2012 from the Weather Information
Management System (WIMS), which is maintained by the National Wildland Coordinating
Group (https://fam.nwcg.gov/wims/jsp/wims.htm). Weather data used in WIMS calculations
was measured near each field site using the RAWS network (WIMS tower ID #’s 490308,
490301, and 499902 were used for Dillingham, Yokohama, and Schofield sites, respectively).
Statistical Analyses
General linear models were used to determine whether there were differences in live and
dead fine fuel loads, fine fuel moistures, average fuel height, fire behavior variables (ROS,
fireline intensity, flame length) and probability of ignition between grassland and forest plots,
after controlling for differences in mean annual precipitation (MAP) among sampled plots.
Because there is an elevation/ precipitation gradient at Waianae Kai Forest Reserve, and forest
plots were clustered ~150 m higher in elevation than grassland plots, MAP was included in the
model to control for differences in environmental variables that may have potentially impacted
fuels and fire behavior. Site was treated as a random factor, plot type (forest or grassland) was
treated as a fixed factor, and MAP was used as a covariate. Live and dead fine fuel variables
were log-transformed for analysis to meet model assumptions of normality and homogeneity of
variance, but all results are presented herein as untransformed data. Minitab v. 15 (Minitab, Inc.,
State College, PA) was used for all statistical analyses, and significance was assessed at α=0.05.
For Fragstats spatial analyses, AOI’s within sites are not independent, and only two sites were
analyzed, making statistical inference inappropriate. Therefore, this analysis was limited to an
examination of temporal trends in patterns.
Pearson correlation coefficients were calculated with all sites pooled to describe the
strength of the relationship between each daily, 8-day, and 16-day vegetation index with live,
dead, and litter fuel moisture. Because WIMS calculations and fire prediction tools (i.e.
BehavePlus) do not separate standing dead and surface litter fuel components, measurements for
dead fuel moisture were weighted by the proportion of the two dead fuel components and
examined in all analyses as a single variable. All significant correlations were further examined
individually and in combination using general linear regression models to identify the strongest
MODIS-based predictor variable(s) for in situ live and dead fuel moisture for each temporal
scale (daily, 8-day, and 16-day). Similarly, the ability of WIMS-calculated KBDI and fuel
moisture (live and dead) to predict in situ fuel moisture was examined using general linear
models. Finally, the best predictor variables for both MODIS-based and WIMS-based were
evaluated in hybrid models to determine the strongest predictive relationships between all
available fuel moisture predictors and in situ measured live and dead fuel moisture at each
temporal scale. We were most interested in a general model that accurately predicts live and
dead fuel moisture across all guinea grass ecosystems on leeward Oahu, Hawaii. However,
because these nonnative, invasive guinea grass ecosystems are high fire risk areas, we also
evaluated the inclusion of a site term in the best predictor model to test whether there was greater
capacity to accurately predict fuel moisture at a single site than across the larger area of interest.

Key findings
Fuel Quantification
After controlling for differences in MAP (P<0.01), there were few differences in fine
fuels between forest and grassland plots, with live fine fuels ranging from 2.1-5.9 Mg ha-
1(P=0.86), and dead fine fuels ranging from 10.4-19.5 Mg ha-1 (P=0.89; Table 1). MAP was a
strong predictor of both live (P=0.02) and dead (P=0.05) fuel moisture, and there was no
evidence of differences in fuel moistures between forest and grassland (live, P=0.19; dead,
P=0.95). Live fine fuel moisture at the time of sampling ranged from 47-173%, and dead fine
fuel moisture from 14-65%. Mean fuel height, however, was 31% lower in forests (72 cm)
than in grasslands (105 cm; P<0.02) after accounting for differences in MAP (Table1).
Fire Modeling
Despite holding microclimate constant and fuels only differing between forest and
grassland in terms of height, predicted fire behavior differed greatly between these two land
cover types (Table 2). Under moderate wind conditions (15 kph), rate of modeled fire spread
was 3-5x higher in grassland (5.0-17.7 m min-1) than forest (0-5.0 m min-1) (P<0.001), and
flame lengths were 2-3x higher in grassland (2.8-7.2 m) than forest (0-3.0 m; P<0.01). Fireline
intensity at moderate wind conditions was also higher in grassland (2,426-19,034 kW m-1) than
forest (0-2,914 kW m-1) (P<0.01). Under extreme wind conditions (30 kph), predicted rates of
spread were 3-10x higher in grasslands (10.1-36.3 m min-1) than in forests (0-10.5 m min-1)
(P<0.001); flame lengths were 2.5-4x higher in grasslands (3.9-10.0 m) than forests (0-4.3m)
(P<0.01); and fireline intensity was higher in grasslands (4,919-39,004 kW m-1) than in forests
(0-6,166 kW m-1) (P<0.01). Probability of ignition ranged from 0-32% and did not differ
between cover types under either moderate or extreme wind conditions (P=0.27) (Table 2).
Historical and Spatial Land Cover Change Analysis
Invasive grassland cover increased in heavily utilized areas inside the firebreak at
both Makua (total area of 320 ha) and Schofield (total area of 745 ha) at rates of 2.62 and 1.83 ha
yr-1, respectively, over the entire 50+ years examined, with more rapid rates of conversion (up to
7.41 ha yr-1) occurring before aggressive fire management practices were implemented in the
early 1990’s (Table 3; Figures 1-2). At Makua, conversion from forest to grassland in the
surrounding forest area (total area of 1244 ha) was slower (1.78 ha yr-1) than in the grass area
(Figure 1). Unlike Makua, in the forest area at Schofield (total area of 1576 ha) conversion of
grassland to forest occurred at a faster rate (4.75 ha yr-1) than in grass areas (Figure 2). Overall,
change in land cover over time was more dynamic at Makua (Figure 1) than at Schofield (Figure
2), coinciding with large and frequent fires at Makua, and fewer acres burned at Schofield.
In situ fuel moisture
Live and dead fuel moistures were dynamic throughout the sampling period, ranging
from 45 to 294% and 6 to 49%, respectively, and sometimes changing rapidly between biweekly
sampling dates. Schofield, which had the highest MAP, generally had the highest live and dead
fuel moisture of all sites, and live fuel moisture at this site never dropped below 122%. In
contrast, the Dillingham and Yokohama sites, which are located at lower elevations and lower
MAP, had frequent periods where live fuel moisture dropped well below 100%. Seasonal
patterns were similar across all sites, with highest fuel moistures in the winter months, and
periods of low fuel moisture in the drier summer and fall months (Figure 3).

MODIS-based fuel moisture correlations
Vegetation indices calculated from daily MODIS data were also dynamic (Figure 3) and
none were correlated with live, dead, or litter fuel moisture (Table 4; Figure 3), except daily EVI
values, which were positively and linearly correlated with live fuel moisture (r = 0.338;
P=0.001). Vegetation indices calculated from 8 day composite MODIS data had somewhat
clearer seasonal patterns (Figure 4) and stronger relationships with in situ fuel moisture
measurements, with EVI, NDVI, and EVI2 all showing significant relationships with live, dead,
and litter fuel moisture (P<0.01; Table 4). EVI had the strongest relationship with live fuel
moisture (r = 0.399; P<0.001), while EVI2 had a stronger relationship with dead fuel moisture
components (r = 0.379; P<0.001 for standing dead, and r = 0.380; P<0.001 for litter fuel
moisture). 16-day composite MODIS vegetation index products were positively and linearly
correlated with live, dead, and litter fuel moisture (Table 4; Figure 4). NDVI had the strongest
relationship with live fuel moisture (r = 0.462; P<0.001), and EVI2 had stronger correlations
with standing dead (r = 0.450; P<0.001) and litter (r = 0.374; P<0.001) fuel moisture.
MODIS-based fuel moisture models
Empirical models were derived from the MODIS-based vegetation indices (EVI, EVI2,
and NDVI) that were most strongly correlated with fuel moisture at each temporal scale (Table
1; daily, 8-day, 16-day). Each vegetation index was analyzed alone and in all possible
combinations to determine the strongest predictive relationships. Using daily vegetation index
data, EVI alone had the strongest linear relationship with live fuel moisture (R2 = 0.15; p<0.001;
Table 5), but no predictive power (R2
pred = 0.00), and no relationship with dead fuel moisture (R2
= 0.00; R2
pred = 0.00; p=0.082; Table 6). No other daily VI’s alone or in combination generated
models that accurately predicted dead fuel moisture. The best relationships using 8-day
composite data for both live (R2 = 0.20; R
2pred = 0.15; p<0.001; Table 2) and dead (R
2 = 0.14;
R2
pred = 0.06; p=0.001) fuel moisture contained both EVI and NDVI. 16-day composite indices
had the strongest relationships with both live and dead fuel moisture of all MODIS-based models
examined. Best MODIS-based predictive models for both live (R2 = 0.46; R
2pred = 0.40;
p<0.001; Table 5) and dead fuel moisture (R2 = 0.19; R
2pred = 0.12; p=0.002; Table 6)
included EVI2 and NDVI.
WIMS-based algorithms, which are currently used in fire planning and
management in Hawaii, were poor predictors of in situ fuel moisture measurements
compared with MODIS-based models. NFDRS predictions of live fuel moisture had slightly
weaker relationships with in situ measurements (R2 = 0.37; R
2pred = 0.33; p<0.001; Figure 5) than
MODIS-derived predictions (Table 5). There was no relationship between NFDRS predicted
and in situ dead fuel moisture (R2 = 0.05; R
2pred = 0.00; p=0.066; Table 6; Figure 4). KDBI was
an even poorer predictor of both live (R2 = 0.06; R
2pred = 0.01; p=0.050; Table 5) and dead (R
2 =
0.01; R2
pred = 0.00; p=0.477) fuel moisture (Table 6).
Hybrid models (containing both MODIS and WIMS components) were generally
stronger predictors of in situ fuel moisture than either MODIS or WIMS models alone (Table 5).
The strongest overall predictor of live fuel moisture used 8 day MODIS EVI as well as
NFDRS and KBDI data (R2 = 0.49; R
2pred = 0.41; p<0.001; Figure 7), which represents only a
slight improvement over the MODIS-only model. Hybrid models for dead fuel moisture (R2
pred =
0.00 for all models) did not offer improvements over the best MODIS-only model (Table 6;
Figure 8).

All models presented above are generalized across all study sites, but in some cases a site
specific model yielded stronger relationships with in situ fuel moisture. When a site factor was
added to the best MODIS-based model (16 day composite VI), additional variability was
explained by the model (R2 = 0.61; R
2pred = 0.59; p<0.001), adding considerable predictive
power. Similarly, adding a site factor to the NFDRS model for live fuel moisture prediction
improved model fit (R2 = 0.42; R
2pred = 0.39; p<0.001). Dead fuel moisture models were not
improved by the inclusion of a site factor.
Management implications
1. While type conversion from forest to grassland has occurred, active fire management can
offset, and even reverse this trend.
These results clearly show that the areas studied have experienced large type conversions
from forest to grassland over the past 50+ years. This conversion to grasslands, in turn, altered
fuel heights and increased modeled fire spread and intensity, which likely represents a positive
feedback to grassland dominance (i.e., the invasive grass-wildfire cycle). On a landscape scale,
however, the interactions among fire, grass invasion, nonnative woody species and fire
management appear to be much more complex. Because it is generally accepted that repeated
fires and the presence of nonnative grasses lead to a landscape that is increasingly dominated by
flammable grasslands, we expected to see an increase in the rate and extent of conversion in
more recent years as compared to historical landscapes. While we acknowledge that the two
valleys analyzed in this study do not mirror all landscapes in the tropics, they do represent
among the most highly impacted end of the spectrum in terms of utilization intensity and
opportunities for fire ignition (i.e., frequent military training activities). Because of this, we
expected to see rapid rates of land cover conversion. The mean trend over time in grassland
areas at both sites was a reduction in woody cover with a concomitant increase in grassland
cover, as originally hypothesized. This was expected, as these areas are heavily utilized by
military training activities, and ignitions from training are frequent. In the forests, however,
there were different trends observed over time. At Makua, where fires have been larger and
more frequent, the forest is slowly being replaced by grassland. Fire management has been
exceedingly difficult at this site (Beavers et al., 1999) due to low precipitation and fuel moisture,
remoteness, intensity of military training, and common anthropogenic ignitions (i.e. arson,
roadside). In 2004, all live fire training stopped at Makua to address fire concerns at this site, but
several human ignited fires have since occurred.
At Schofield, however, the pattern of change over time in the forest was very different
from Makua. Grass cover steadily decreased from 1950 to the present, while woody species, and
to a lesser extent, military training areas, increased. While this area is inaccessible due to
unexploded ordinance, we presume that most of the woody increase is due to the spread of
nonnative woody species, rather than a recovery of a very limited native plant component in the
area. Several factors may contribute to the differential response at Schofield. This site has
~16% higher precipitation than Makua (Giambelluca et al., 2011), with higher fuel moistures
(Ellsworth et al, in review). Additionally, fire managers at Schofield have been successful at
containing fires within the fire break perimeter since improved fire management began in the
1990’s. A well trained fire crew is housed on this instillation, and a well-designed fire
management plan has largely limited severe wildfires (Beavers and Burgan, 2001).

2. Remotely sensed vegetation index data are better predictors of fuel moisture than
currently used models for nonnative M. maximus-dominated grasslands in Hawaii
While MODIS-based models for live fuel moisture content showed only moderate
improvements over WIMS-based models, an important additional advantage of this method is
the continuous spatial coverage provided by satellite data. The RAWS network has weather
stations throughout the U.S., providing frequent points from which WIMS-based models can be
extrapolated (http://www.raws.dri.edu/). However, fires commonly occur in remote areas, and
there are large regions, particularly in Hawaii, with no RAWS coverage. In addition, many
areas, including Hawaii, have very steep topography, where important weather variables such as
precipitation and relative humidity change rapidly with spatial position (Giambelluca et al.,
2011), making accurate moisture prediction limited to small areas near RAWS towers. Further,
sensors on weather towers frequently are inoperable or have sensors that have not been calibrated
in years and, thus, commonly transmit inaccurate data which requires a thorough quality
assurance protocol on all data used – a time expenditure that few fire managers can justify. In
this study, for example, of all WIMS data points corresponding to in situ fuel moisture
measurements (N=116), only 62% of them (N= 72) could be used in the analysis of models
including WIMS data due to sensor or data transmission failure.
While MODIS-based models had stronger relationships with fuel moisture than WIMS-
based models, the best predictive model for live fuel moisture included components of both
systems. The problems associated with the WIMS measurements (proximity to RAWS station,
data quality) discussed above, however, should be carefully evaluated before using these hybrid
models to predict fuel moistures. The slight advantage of using the hybrid model (R2
pred =0.40)
over the MODIS-based model (R2
pred =0.41) is likely not enough to warrant the additional trouble
of assuring good WIMS data. Dead fuel moisture was best predicted using a model based on
MODIS data alone, eliminating the uncertainties associated with using WIMS data.
Issues with spatial continuity should also be considered before developing a site-specific
model for fuel moisture prediction. In this paper, there was improved predictive capability (i.e.
R2
pred =0.59 vs. R2pred =0.40) of some models when a site term was included, but due to the rapid
change in topography and, thus, climate in many areas of Hawaii (Giambelluca et al., 2011), site
specific models should be used only with extreme caution outside of the area where in situ fuel
moisture measurements were taken and the models were developed.
It was expected that there would be a tradeoff between accuracy in spatial and temporal
resolution of fuel moisture content when weather station models were compared to MODIS-
based models. Our hypothesis that daily MODIS data would be the best predictor of fuel
moisture, however, was not supported by our data. Instead, the best MODIS-only predictive
models for both live and dead fuel moisture were developed using the 16-day composite
data. We expect that this result is a function of improved accuracy of each pixel value in the
composite images outweighing the benefits of better temporal resolution of changes in vegetation
phenology. This finding provides an unexpected additional benefit for fire managers, as the
16-day composites are easily accessed and freely downloadable from the internet.

Relationship to other recent findings and ongoing work on this topic
Our results show that increased fuel bed depth and an increased effect of wind at the fuel
surface (Freifelder et al., 1998; Andrews et al., 2005) in grassland has led to the potential for
much more intense fire behavior compared to forest. These data support previous work in
Hawaii (Hughes et al., 1991; Freifelder et al., 1998), and elsewhere in the tropics (Williams and
Baruch, 2000; Hoffmann et al., 2002; Rossiter et al., 2003), demonstrating that, at the plot level,
the synergistic effects of fire and nonnative grass invasion can lead to a pervasive invasive grass-
wildfire cycle. From this study, it can be inferred that at a landscape scale, the grass-wildfire
cycle may not be the final endpoint for all fire impacted and nonnative grass invaded tropical
ecosystems, as is currently the paradigm in the science and management communities. A recent
review of the impacts of woody invasive plants on fire regimes (Mandle et al., 2011) showed
that, while most discussion centers around the effects of grass invaders, invasive woody plants
can also alter ecosystem properties and patterns, thereby impacting future fire regimes. A
dominant nonnative woody invader in the forested area at Schofield, Schinus terebinthifolius
Raddi (christmasberry) (Beavers and Burgan, 2001), may reduce fire temperature and spread
(Beavers and Burgan, 2001; Stevens and Beckage, 2009), potentially offering an escape from the
grass-wildfire cycle (Mandle et al., 2011). While our results show that grasslands are prone to
more extreme fire behavior than forests, it was not always the case that increased flammability
led to widespread increases in grassland cover across the landscape. In fact, many areas appear
to be recovering a woody overstory, albeit nonnative, suggesting that active fire management is
largely preventing further type conversion to nonnative grasslands.
The predictive capability of MODIS vegetation index data shown in our research support
similar work in shrubland, forest, and heathlands in Australia (Caccamo et al., 2011), where
MODIS data better predicted live fuel moisture (R2= 0.69) than the commonly used KDBI
predictors (R2= 0.15). Strong relationships were also shown between remotely sensed VI’s and
live fuel moisture in several Mediterranean vegetation types (0.72<R2< 0.82) (Chuvieco et al.,
2002) and in Coastal Plains in Georgia, USA (r =0.57-0.96) (Hao and Qu, 2007). While our
results showed improvement over the current system for live fuel moisture prediction in Hawaii,
the relationships were weaker than those typically found elsewhere. A possible explanation for
this is that there is a large amount of standing dead guinea grass, particularly during drier months
(Ellsworth et al, in press), making moisture content and, thus, reflectance signatures over an area
represented by one pixel quite variable, as described by Danson and Bowyer (2004).
Dead fuel moisture content in non-native M. maximus grasslands in Hawaii was not well
predicted by any of the models tested. We hypothesized that vegetation indices would be
stronger predictors of live fuel moisture than dead, but expected a better model for dead fuel
moisture, as both live and dead fuel moistures change seasonally with precipitation events
(Ellsworth et al in press). While several previous studies have evaluated various remotely
sensed greenness-based data products for their ability to predict live (Danson and Bowyer, 2004;
Hao and Qu, 2007; Caccamo et al., 2011) and total fuel moisture content (Chuvieco et al., 2002),
few have looked at the relationships with dead fuels alone (Nieto et al., 2010). In tropical
grassland ecosystems, dead fuels can make up well over half of the total fine fuel loads
((Kauffman et al., 1998, Ellsworth et al in press), and play a predominant role in driving fire
behavior. Despite this limitation of using MODIS-derived products to accurately predict dead
fuel moisture content in these systems, our results show that the current WIMS-based prediction
systems (NFDRS, KDBI), which are commonly used in fire management today, do an even
poorer job of predicting dead fuel moisture content in these ecosystems.

Future work needed
1. Similar research in other dominant invasive grass species in Hawaii
Guinea grass is one of the more problematic invasive grass species in the Hawaiian Islands,
but several others pose significant fire risk as well (i.e., fountain grass, Pennisetum setaceum;
molasses grass, Melinis minutiflora; and buffelgrass, Pennisetum ciliare). Investigations into the
differences in fuels characteristics, fire spread, and the potential for using remote sensing data for
fuel moisture prediction in these additional grassland ecosystems would better enable fire managers
to make landscape scale fire risk assessments.
2. Further testing of MODIS fuel moisture prediction system in guinea grass ecosystems
throughout the tropics
While this method has been shown to be an improvement on existing methodology for fuel
moisture prediction in Hawaii, it did not perform as well as has been seen in temperate ecosystems.
Some possible explanations for this may the large amount of standing dead guinea grass,
particularly during drier months making moisture content and, thus, reflectance signatures quite
variable within a single pixel. Further investigations in grass-dominated ecosystems throughout
the tropics would be a valuable next step.
3. Additional investigation into site specific models for local land manager’s use.
One of our objectives was to create models that were useful over a wide geographical range,
however, site specific models had greater predictive capability than did the more general model. In
areas where frequent fire ignitions are likely, it may be useful to have site specific models built to
more precisely predict fuel moisture.
4. Development of a user-friendly web-based interface to access MODIS outputs.
Work is currently in progress to develop a web-based, user-friendly interface to make the
readily accessible, freely available technologies presented in the current research more attractive to
land and fire managers. Currently there is a fair bit of technical jargon and several downloadable
webtools that are used in the data processing protocol. For land managers to be attracted to this
technology, it would be very useful to streamline the processing to a single web interface.

Table 1. Live and dead fine fuel loads (in Mg ha-1), fuel moisture (%), and maximum fuel height (cm) in open guinea grass
ecosystems and forested ecosystems with a guinea grass understory on leeward Oahu, Hawaii. Means and standard errors are given
for fuels variables at each site (N=3). Significant model factors are indicated by bold font in the last three columns.
Variable Dillingham
Grass
Dillingham
Forest
Waianae Kai
Grass
Waianae Kai
Forest
Model
R2
(%)
MAP Site Type
(P-value)
live fine fuels 4.6 (0.9) 5.9 (3.9) 3.7 (0.4) 2.1 (1.0) 31.1 0.38 0.65 0.86
dead fine fuels 19.5 (4.3) 19.5 (3.0) 13.7 (0.6) 10.4 (1.8) 51.4 0.52 0.80 0.89
live fuel moisture 47.2 (3.6) 78.2 (13.1) 57.7 (9.0) 173.6 (27.3) 84.2 0.02 0.18 0.19
dead fuel moisture 13.6 (2.3) 23.4 (6.8) 15.5 (2.9) 65.2 (31.4) 61.7 0.05 0.14 0.95
max. fuel height 138.6 (9.7) 71.0 (3.0) 71.3 (10.7) 72.3 (12.0) 76.5 0.02 <0.01 <0.01

Table 2. Predicted fire behavior under both moderate (15 kph) and severe (30 kph) wind conditions in open guinea grass
ecosystems and forested ecosystems with a guinea grass understory on leeward Oahu, Hawaii. Means and standard errors are
given for fire behavior variables at each site (N=3). Significant model factors are indicated by bold font in the last three columns.
Variable
Wind
condition
Dillingham
Grass
Dillingham
Forest
Waianae
Kai Grass
Waianae Kai
Forest
Model
R2 (%)
MAP Site Type
(P-value)
Rate of Spread
(m min -1)
moderate 14.9 (1.6) 2.7 (1.2) 5.8 (0.6) 0.4 (0.4) 91.0 0.04 <0.01 <0.001
severe 30.7 (3.1) 5.7 (2.6) 12.0 (1.2) 0.8 (0.8) 91.1 0.04 <0.01 <0.001
Flame Length
(m)
moderate 5.8 (1.0) 2.1 (0.5) 3.0 (0.2) 0.3 (0.3) 84.8 0.61 0.10 <0.01
severe 8.1 (1.4) 2.9 (0.8) 4.3 (0.3) 0.4 (0.4) 84.6 0.62 0.11 <0.01
Fireline Intensity
(kW m-1)
moderate 12829 (4075) 1503 (750) 2983 (537) 57.7 (57.7) 71.3 0.13 0.04 <0.01
severe 26355 (8298) 3154 (1598) 6135 (1084) 123.7 (123.7) 71.5 0.13 0.04 <0.01
Probability of
Ignition (%)
moderate 21.0 (7.0) 10 (10) 14.3 (5.6) 0.3 (0.3) 38.5 0.84 0.82 0.27
severe 21.0 (7.0) 10 (10) 14.3 (5.6) 0.3 (0.3) 38.5 0.84 0.82 0.27

Table 3. Rates of land cover change at Makua Military Reservation and Schofield Barracks from
1950 to 2011. Change is given in units of average hectares per year for each date range. Total
size for study areas are as follows: Schofield Grass, 745 ha; Schofield Forest, 1576 ha, Makua
Grass, 320 ha; and Makua Forest, 1244 ha.
1950-1962 1962-1977 1977-1992 1992-2004 2004-2011 1950-2011 (mean)
Schofield Grass grass 3.0 1.2 2.6 0.7 -5.5 1.2
woody -2.0 -0.7 -3.2 -1.5 -4.6 -2.1
bare ground 0.0 -0.1 0.0 0.2 -0.5 0.0
developed 0.0 0.0 0.0 0.0 0.0 0.0
shadow 0.0 0.0 0.0 0.0 0.0 0.0
MTA -1.0 -0.4 0.5 0.6 10.6 0.9
Schofield Forest grass -8.4 -7.3 -2.7 -1.0 -1.1 -4.5
woody -0.7 10.8 5.3 0.6 0.7 4.0
bare ground 0.9 -0.9 0.0 0.4 -0.7 0.0
developed 0.0 0.0 -0.4 -0.2 0.9 -0.1
shadow 8.5 -4.3 -2.7 0.0 0.0 -0.1
MTA -0.3 1.8 0.5 0.2 0.1 0.5
1962-1977 1977-1993 1993-2004 2004-2010 1962-2010 (mean)
Makua Grass grass 7.4 5.0 -6.3 6.8 3.4
shrub -5.7 -6.6 8.1 -6.7 -3.0
tree -1.9 0.2 -0.2 0.0 -0.6
bare ground 0.2 0.7 -1.1 -0.1 0.0
developed 0.0 0.0 0.0 0.0 0.0
shadow 0.0 0.0 0.0 0.0 0.0
MTA 0.0 0.8 -0.5 0.0 0.2
Makua Forest grass 0.8 9.5 -2.3 10.6 4.2
shrub 2.0 -1.0 3.9 -19.9 -1.3
tree 1.0 -1.4 3.3 8.7 1.7
bare ground 0.4 -0.2 0.1 0.0 0.1
developed 0.0 0.0 0.0 0.0 0.0
shadow -4.2 -6.8 -4.9 0.5 -4.6
MTA 0.0 0.0 0.0 0.0 0.0

Table 4. Pearson correlation coefficents (r) showing the strength of the relationships between
Terra-MODIS derived daily, 8-day, and 16-day vegetation indices for guinea grass ecosystems
on Oahu, Hawaii. Bold font indicates values that are statistically significant at the P<0.05 level.
Live Dead Litter
r P-value r P-value r P-value
Single day
images EVI_1 0.338 0.001 0.170 0.093 0.184 0.069
NDVI_1 0.088 0.368 -0.015 0.875 -0.019 0.844
EVI2_1 0.081 0.410 0.033 0.733 0.035 0.717
VARI_1 0.165 0.100 0.075 0.456 0.084 0.404
NDWI_1 -0.026 0.787 0.045 0.642 0.083 0.398
NDII_1 0.037 0.704 0.186 0.056 0.150 0.123
RGRE_1 0.055 0.576 0.045 0.643 -0.005 0.960
Integral_1 0.105 0.282 0.142 0.144 0.124 0.204
8 day
composites EVI_8 0.399 0.000 0.333 0.000 0.280 0.003
NDVI_8 0.347 0.000 0.309 0.001 0.403 0.000
EVI2_8 0.328 0.000 0.379 0.000 0.380 0.000
VARI_8 0.098 0.307 0.028 0.770 0.040 0.676
NDWI_8 0.020 0.837 0.120 0.211 0.016 0.871
NDII_8 0.139 0.144 0.220 0.020 0.160 0.093
RGRE_8 0.274 0.003 0.140 0.139 0.268 0.004
Integral_8 -0.101 0.287 -0.051 0.590 -0.200 0.033
16 day MODIS products
EVI_16 0.364 0.001 0.423 0.000 0.325 0.003
NDVI_16 0.462 0.000 0.362 0.001 0.329 0.002
EVI2_16 0.449 0.000 0.450 0.000 0.374 0.001
RGRE_16 0.398 0.000 0.049 0.663 0.119 0.283

Table 5. Models predicting in situ live fuel moisture. MODIS-based models were generated from remotely sensed Terra-MODIS
daily, 8-day composites, and 16-day vegetation index data. WIMS-based models are calculated from onsite weather data. Hybrid
models were developed using the best predictors from both MODIS and WIMS-based models. Bold font indicates strongest and
recommended models.
Model R2 Pred R
2 P
MODIS-based models
1-day LFM= 124 + 135 EVI_1 0.15 0.00 <0.001
8-day LFM= 91.1 + 171 EVI_8 + 78.4 NDVI_8 0.20 0.15 <0.001
16-day LFM=2.1 + 402 EVI2_16 + 144 NDVI_16 0.46 0.40 <0.001
WIMS-based models
NFDRS LFM = 78.7 + 0.807 NFDRS 0.37 0.33 <0.001
KBDI LFM = 191 - 0.0624 KBDI 0.06 0.01 0.050
Hybrid models
1-day LFM = 101 + 67.6 EVI_1 + 0.654 NFDRS - 0.0652 KBDI 0.46 0.37 <0.001
8-day LFM = 91.2 + 7.77 EVI_8 + 0.735 NFDRS - 0.0524 KBDI 0.49 0.41 <0.001
16-day LFM = 35.2 + 0.650 NFDRS + 244 EVI_16 0.38 0.30 <0.001

Table 6. Models predicting in situ dead fuel moisture. MODIS-based models were generated from remotely sensed Terra-MODIS
daily, 8-day composites, and 16-day vegetation index data. WIMS-based models are calculated from onsite weather data. Hybrid
models were developed using the best predictors from both MODIS and WIMS-based models. Bold font indicates the strongest and
recommended model.
Model R2 Pred R
2 P
MODIS-based models
1-day DFM = 16.0 + 8.61 EVI_1 0.00 0.00 0.082
8-day DFM = 10.5 + 16.7 EVI_8 + NDVI_8 0.14 0.06 0.001
16-day DFM = 5.55 + 39.3 EVI2_16 + 10.9 NDVI_16 0.19 0.12 0.002
WIMS-based models
NFDRS DFM = 7.62 + 1.12 NFDRS 0.05 0.00 0.066
KBDI DFM = 19.9 - 0.00355 KBDI 0.01 0.00 0.477
Hybrid models
1-day DFM = 8.53 + 4.93 EVI_1 - 0.00807 KBDI + 1.11 NFDRS 0.13 0.00 0.116
8-day DFM = 4.34 + 20.8 EVI_8 + 0.945 NFDRS 0.14 0.00 0.010
16-day DFM = 0.79 + 56.2 EVI2_16 + 0.577 NFDRS 0.19 0.00 0.026

Figure 1. Land cover at Makua Military Reservation on leeward Oahu, Hawaii from 1962
through 2010. The area inside the firebreak is heavily utilized for military training activities, and
fire is frequent. The area outside the firebreak has historically been forested, has many
threatened and endangered species, and is impacted to a lesser extent by military activities and
fire.
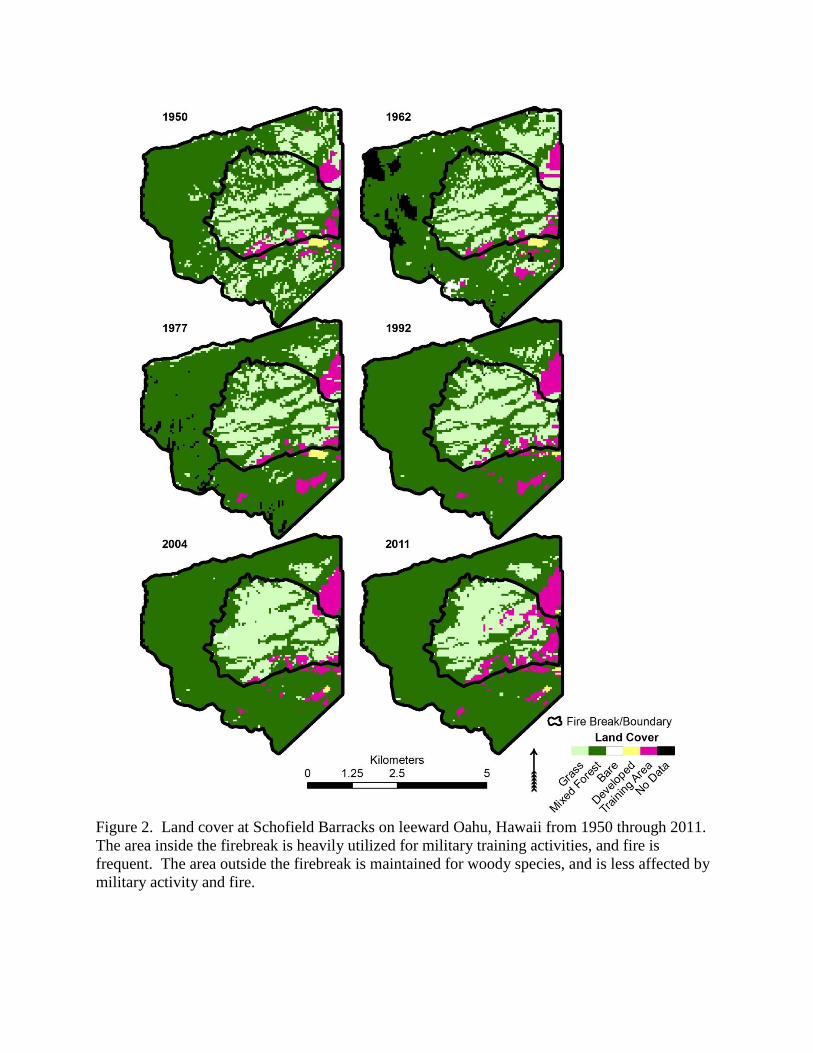
Figure 2. Land cover at Schofield Barracks on leeward Oahu, Hawaii from 1950 through 2011.
The area inside the firebreak is heavily utilized for military training activities, and fire is
frequent. The area outside the firebreak is maintained for woody species, and is less affected by
military activity and fire.

Figure 3: Temporal trends of in situ live and dead fuel moisture and daily MODIS-derived
vegetation indices (VI) for nonnative invasive guinea grass ecosystems at (a) Schofield Barracks,
(b) Dillingham Ranch, and (c) Yokohama State Park on Oahu, Hawaii from October 2009 –
October 2010. VI’s (NDVI, EVI, and EVI2) are shown by black lines, and live (solid) and dead
(dashed) fuel moisture is shown in grey.
0.0
0.2
0.4
0.6
0.8
1.0
(a)
Fu
el M
ois
ture
(%
)
50
100
150
200
250
300
(c)
Month
Oct Nov Dec Jan Feb Mar Apr May Jun Jul Aug Sep Oct
50
100
150
200
250
300
live fuel moisture
dead fuel moisture
0.0
0.2
0.4
0.6
0.8
1.0
EVI
NDVI
EVI2
VI
0.0
0.2
0.4
0.6
0.8
1.0
50
100
150
200
250
300
(b)

Figure 4: Temporal trends in 8-day composite and 16-day MODIS-derived vegetation indices
(VI) for nonnative invasive guinea grass ecosystems at Schofield Barracks, Dillingham Ranch,
and Yokohama State Park on Oahu, Hawaii from October 2009 – October 2010.
Month
Oct
Nov
Dec
Jan
Feb
Mar
Apr
May
Jun
Jul
Aug
Sep
Oct
8 D
ay N
DV
I
0.2
0.4
0.6
8 D
ay E
VI2
0.2
0.4
0.6
8 D
ay E
VI
0.2
0.4
0.6
Dillingham
Schofield
Yokohama
16 D
ay E
VI
0.2
0.4
0.6
Month
Oct
Nov
Dec
Jan
Feb
Mar
Apr
May
Jun
Jul
Aug
Sep
Oct
16 D
ay N
DV
I
0.2
0.4
0.6
16 D
ay E
VI2
0.2
0.4
0.6

Figure 5: NFDRS system of live fuel moisture prediction (x-axis) vs. in situ live fuel moisture
(y-axis) measurements.
Figure 6: NFDRS system of dead fuel moisture prediction (x-axis) vs. in situ dead fuel moisture
(y-axis) measurements.
NFDRS Predicted Live Fuel Moisture (%)
50 100 150 200 250 300Measure
d L
ive F
uel M
ois
ture
(%
)
50
100
150
200
250
300
Dillingham
Yokohama
Schofield
R2 = 0.37 P < 0.01
NFDRS Predicted Dead Fuel Moisture (%)
10 20 30 40 50Mea
su
red
De
ad
Fue
l M
ois
ture
(%
)
10
20
30
40
50
Dillingham
Yokohama
Schofield
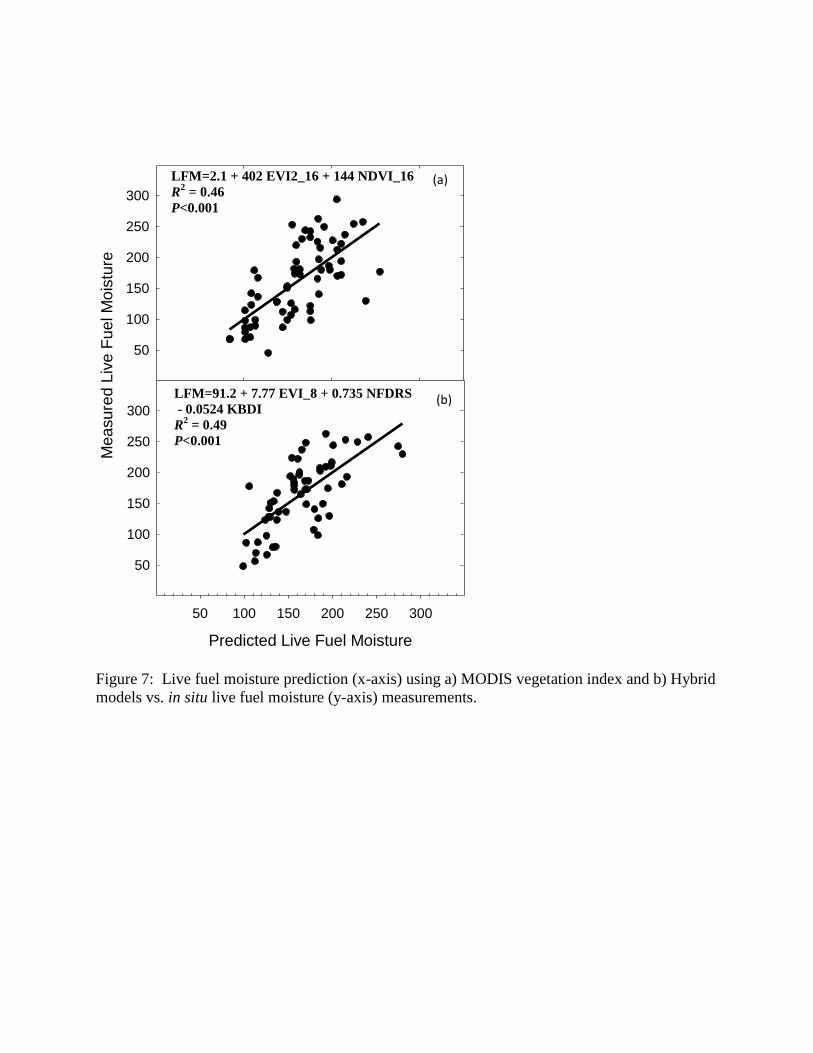
Figure 7: Live fuel moisture prediction (x-axis) using a) MODIS vegetation index and b) Hybrid
models vs. in situ live fuel moisture (y-axis) measurements.
X Data
50
100
150
200
250
300
Predicted Live Fuel Moisture
50 100 150 200 250 300
Me
asu
red
Liv
e F
ue
l M
ois
ture
50
100
150
200
250
300
LFM=2.1 + 402 EVI2_16 + 144 NDVI_16
R2 = 0.46
P<0.001
LFM=91.2 + 7.77 EVI_8 + 0.735 NFDRS
- 0.0524 KBDI
R2 = 0.49
P<0.001
(a)
(b)

Figure 8: Dead fuel moisture prediction (x-axis) using MODIS vegetation indices vs. in situ live
fuel moisture (y-axis) measurements.
Predicted Dead Fuel Moisture
0 10 20 30 40 50 60
Me
asu
red
De
ad
Fu
el M
ois
ture
0
10
20
30
40
50
60DFM = 5.55 + 39.3 EVI2_16 + 10.9 NDVI_16
R2 = 0.19
P=0.002

References
Ainsworth, A., Kauffman, J.B., 2010. Interactions of Fire and Nonnative Species Across an Elevation/Plant
Community Gradient in Hawaii Volcanoes National Park. Biotropica 42, 647-655.
Ammondt, S.A., Litton, C.M., 2012. Competition between Native Hawaiian Plants and the Invasive Grass
Megathyrsus maximus: Implications of Functional Diversity for Ecological Restoration. Restoration Ecology 20,
638-646.
Ammondt, S.A., Litton, C.M., Ellsworth, L.M., Leary, J.K., 2012. Restoration of native plant communities in a
Hawaiian dry lowland ecosystem dominated by the invasive grass Megathyrsus maximus. Applied Vegetation
Science, n/a-n/a.
Andrews, P., Bevins, C., Seli, R., 2005. BehavePlus fire modeling system, version 4.0: User's Guide. In: Department
of Agriculture, F.S., Rocky Mountain Research Station (Ed.), Ogden, UT, p. 132.
Asner, G., Beatty, S., 1996. Effects of an African grass invasion on Hawaiian shrubland nitrogen biogeochemistry.
Plant and Soil 186, 205-211.
Beavers, A., 2001. Creation and validation of a custom fuel model representing mature Panicum maximum (Guinea
grass) in Hawaii. In. Center for Environmental Management of Military Lands. Department of Forest Sciences,
Colorado State University.
Beavers, A., Burgan, R., 2001. Wildland Fire Risk and Management on West and South Ranges, Schofield Barracks,
Oahu. In. Center for Environmental Management of Military Lands, Department of Forest Sciences, Colorado State
University, CO.
Beavers, A., Burgan, R., Fujioka, F., Laven, R., Omi, P., 1999. Analysis of Fire Management Concerns at Makua
Military Reservation. In. Center for Ecological Management of Military Lands, Department of Forest Sciences,
Colorado State University, CO.
Blackmore, M., Vitousek, P.M., 2000. Cattle grazing, forest loss, and fuel loading in a dry forest ecosystem at Pu'u
Wa'aWa'a ranch, Hawai'i. Biotropica 32, 625-632.
Brook, B.W., Bowman, D., 2006. Postcards from the past: charting the landscape-scale conversion of tropical
Australian savanna to closed forest during the 20th century. Landsc. Ecol. 21, 1253-1266.
Brown, J.K., 1974. Handbook for inventorying downed woody material. In. Intermountain Forest and Range
Experiment Station, Ogden, UT, p. 24.
Burgan, R.E., Rothermel, R.C., 1984. BEHAVE: Fire Behavior Prediction and Fuel Modeling System--FUEL
Subsystem. In: Group, N.W.C. (Ed.).
Caccamo, G., Chisholm, L.A., Bradstock, R.A., Puotinen, M.L., Pippen, B.G., 2011. Monitoring live fuel moisture
content of heathland, shrubland and sclerophyll forest in south-eastern Australia using MODIS data. Int. J. Wildland
Fire 21, 257-269.
Chuvieco, E., Riano, D., Aguado, I., Cocero, D., 2002. Estimation of fuel moisture content from multitemporal
analysis of Landsat Thematic Mapper reflectance data: applications in fire danger assessment. International journal
of remote sensing 23, 2145-2162.
D'Antonio, C.M., Vitousek, P.M., 1992. Biological invasions by exotic grasses, the grass/fire cycle, and global
change. Annual Review of Ecology and Systematics 23, 63-87.
Danson, F.M., Bowyer, P., 2004. Estimating live fuel moisture content from remotely sensed reflectance. Remote
Sensing of Environment 92, 309-321.
Dimitrakopoulos, A.P., Bemmerzouk, A.M., 2003. Predicting live herbaceous moisture content from a seasonal
drought index. International Journal of Biometeorology 47, 73-79.
Dudley, N.S., Fownes, J.H., 1992. Preliminary biomass equations for eight species of fast-growing tropical trees.
Journal of tropical forest science 5, 68-73.
Freifelder, R.R., Vitousek, P.M., D'Antonio, C.M., 1998. Microclimate change and effect on fire following forest-
grass conversion in seasonally dry tropical woodland. Biotropica 30, 286-297.
Funk, J.L., McDaniel, S., 2010. Altering Light Availability to Restore Invaded Forest: The Predictive Role of Plant
Traits. Restoration Ecology 18, 865-872.
Giambelluca, T., Chen, Q., Frazier, A., Price, J., Chen, Y.-L., Chu, P.-S., Eischeid, J., Delparte, D., 2011. The
Rainfall Atlas of Hawai‘i http://rainfall.geography.hawaii.edu.
Grigulis, K., Lavorel, S., Davies, I.D., Dossantos, A., Lloret, F., Vila, M., 2005. Landscape-scale positive feedbacks
between fire and expansion of the large tussock grass, Ampelodesmos mauritanica in Catalan shrublands. Global
Change Biology 11, 1042-1053.
Hao, X., Qu, J., 2007. Retrieval of real-time fuel moisture content using MODIS measurements. Remote Sensing of
Environment 108, 130-137.

Hoffmann, W.A., Schroeder, W., Jackson, R.B., 2002. Positive feedbacks of fire, climate, and vegetation and the
conversion of tropical savanna. Geophys. Res. Lett. 29, 2052.
Hughes, R.F., Vitousek, P.M., Tunison, T., 1991. Alien grass invasion and fire in the seasonal submontane zone of
Hawai'i. Ecology 72, 743-746.
Jensen, J.R., 2007. Remote Sensing of the Environment: An Earth Resource Perspective. Pearson: Prentice Hall,
Upper Saddle River, NJ.
Kauffman, J.B., Cummings, D.L., Ward, D.E., 1998. Fire in the Brazilian Amazon. 2. Biomass, Nutrient Pools and
Losses in Cattle Pastures. Oecologia 113, 415-427.
Keetch, J.J., Byram, G.M., 1968. A drought factor index for forest fire control. USDA Forest Service, Southeastern
Forest Experiment Station, Research paper SE-38 (Asheville, NC).
LaRosa, A.M., Tunison, J.T., Ainsworth, A., Kauffman, J.B., Hughes, R.F., 2008. Fire and nonnative invasive plants
in the Hawaiian Islands Bioregion. In: Zouhar, K., Smith, J. K., Sutherland, S.,Brooks, M. L. (Ed.), Wildland fire in
ecosystems: Fire and nonnative invasive plants. U.S. Department of Agriculture, Forest Service, Rocky Mountain
Research Station, Ogden, UT, pp. 225-242.
Levick, S.R., Rogers, K.H., 2011. Context-dependent vegetation dynamics in an African savanna. Landsc. Ecol. 26,
515-528.
Litton, C.M., Sandquist, D.R., Cordell, S., 2006. Effects of non-native grass invasion on aboveground carbon pools
and tree population structure in a tropical dry forest of Hawaii. Forest Ecology and Management 231, 105-113.
Mack, M.C., D'Antonio, C.M., Ley, R.E., 2001. Alteration of ecosystem nitrogen dynamics by exotic plants: a case
study of C4 grasses in Hawaii. Ecological Applications 11, 1323-1335.
Mandle, L., Bufford, J., Schmidt, I., Daehler, C., 2011. Woody exotic plant invasions and fire: reciprocal impacts
and consequences for native ecosystems. Biological Invasions 13, 1815-1827.
McGarigal, K., Cushman, S., Ene, E., 2012. FRAGSTATS v4: Spatial Pattern Analysis Program for Categorical and
Continuous Maps. In, Available at the following web site:
http://www.umass.edu/landeco/research/fragstats/fragstats.html. University of Massachusetts, Amherst.
Nieto, H., Aguado, I., Chuvieco, E., Sandholt, I., 2010. Dead fuel moisture estimation with MSG-SEVIRI data.
Retrieval of meteorological data for the calculation of the equilibrium moisture content. Agric. For. Meteorol. 150,
861-870.
Pellizzaro, G., Cesaraccio, C., Duce, P., Ventura, A., Zara, P., 2007. Relationships between seasonal patterns of live
fuel moisture and meteorological drought indices for Mediterranean shrubland species. Int. J. Wildland Fire 16, 232-
241.
Pyne, S.J., Andrews, P.L., Laven, R.D., 1996. Introduction to Wildland Fire. John Wiley and Sons, Inc, New York.
Rossiter, N.A., Setterfield, S.A., Douglas, M.M., Hutley, L.B., 2003. Testing the grass-fire cycle: alien grass
invasion in the tropical savannas of northern Australia. Divers. Distrib. 9, 169-176.
Schlobohm, P., Brain, J., 2002. Gaining an Understanding of the National Fire Danger Rating System, PMS
932/NFES 2665. In, National Wildfire Coordinating Group, p. 72.
Scott, J.H., Burgan, R.E., 2005. Standard Fire Behavior Fuel Models: A Comprehensive Set for Use with
Rothermel’s Surface Fire Spread Model. In: Service, U.S.D.o.A.F. (Ed.), p. 72.
Smith, C.W., Tunison, T.J., 1992. Fire and Alien Plants in Hawaii: Research and Management Implications for
Native Ecosystems. University of Hawaii Press, Honolulu, HI.
Stevens, J.T., Beckage, B., 2009. Fire feedbacks facilitate invasion of pine savannas by Brazilian pepper (Schinus
terebinthifolius). New Phytologist 184, 365-375.
Van Wagner, C.E., 1968. The Line Intersect Method in Forest Fuel Sampling. Forest Science 14, 20-26.
Williams, D., Baruch, Z., 2000. African Grass Invasion in the Americas: Ecosystem Consequences and the Role of
Ecophysiology. Biological Invasions 2, 123-140.

Deliverables crosswalk table
Proposed Delivered Status
Conference Presentations (i) Hawaii Ecosystems Meeting: Predicting and Managing Fire in Oahu's Nonnative
Grasslands
(ii) Hawaii Conservation Conference: Changes in land cover and fire risk associated
with nonnative grass invasion in Hawaii
(iii) Ecological Society of America: Changes in land cover and fire risk associated with
nonnative grass invasion in Hawaii
(iv) 5th
International Fire Ecology and Management Congress: Improved prediction of
fuel moisture in invasive guinea grasslands in Hawaii using MODIS data
Presented July 2011
Presented July 2012
Presented August 2012
Presented December 2012
Computer model/algorithm Algorithm with protocol for use of new methodology Protocol and algorithm developed; Work in
progress with the Pacific Fire Exchange to
develop user friendly web tools to access this
algorithm
Dissertation Chapter(s) (i) Changes in land cover and fire behavior associated with nonnative grass invasion in
Hawaii
(ii) Improved prediction of live and dead fuel moisture in invasive Megathyrsus maximus
grasslands in Hawaii with Moderate Resolution Imaging Spectroradiometer (MODIS)
Dissertation Completed 12/15/12
Refereed Publication(s) (i) Changes in land cover and fire behavior associated with nonnative grass invasion on
a tropical island
(ii) Improved prediction of live and dead fuel moisture in invasive Megathyrsus maximus
grasslands in Hawaii with Moderate Resolution Imaging Spectroradiometer (MODIS)
In review, Forest Ecology and Management
In prep for Remote Sensing of Environment
Final Report Final Report submitted to JFSP Submitted to JFSP


![]s - Началоagup.varna.bg/.../article/492/a_2014_1_PROTOKOL_ESUT.pdfP O T O K O r. Ha Ha No Ha ' I sa Ha - Ha Ha crc ...](https://static.fdocuments.us/doc/165x107/5ad73c2b7f8b9af9068bf3a5/s-agupvarnabgarticle492a20141protokolesutpdfp-o-t-o.jpg)