Title: Discrimination of Inner- and Outer-sphere …chemlabinkaist.net/ProcedureFile/CH252F/Exp1-1...
22
1 Title: Discrimination of Inner- and Outer-sphere Electrode Reactions by Cyclic Voltammetry Experiments Key Words Marcus theory, electron transfer, chronoamperometry, chronocoulometry, Cyclic voltammetry, electrical double layer Object It aims to learn basic concepts of microscopic pictures in electrochemistry and principles of charge transfer reactions with hand-on skills of chronoamperometry, chronocoulometry, and cyclic voltammetry. Introduction Electrochemistry is the branch of chemistry concerned with the interrelation of electrical and chemical effects. A large part of this field deals with the study of chemical changes caused by the passage of an electric current and the production of electrical energy by chemical reaction. In fact, the field of electrochemistry encompasses a huge array of different phenomena (e.g., electrophoresis and corrosion), devices (electrochromic displays, electro analytical sensors, batteries, and fuel cells), and technologies (the electroplating of metals and the large-scale production of aluminum and chlorine). Scientists make electrochemical measurements on chemical systems for a variety of reasons. They may be interested in obtaining thermodynamic data about a reaction. They may want to generate an unstable intermediate such as a radical ion and study its rate of decay or its spectroscopic properties. They may seek to analyze a solution for trace amounts of metal ions or organic species. In these examples, electrochemical methods are employed as tools in the study of chemical systems in just the way that spectroscopic methods are frequently applied. There are also investigations in which the electrochemical properties of the systems themselves are of primary interest, for example, in the design of a new power source or for the electrosynthesis of some product. Many electrochemical methods have been devised. Their application requires an understanding of the fundamental principles of electrode reactions and the electrical properties of electrode-solution interfaces. Therefore electrochemistry will play a key role in any future sustainable energy system, both for energy storage and energy conversion.
Transcript of Title: Discrimination of Inner- and Outer-sphere …chemlabinkaist.net/ProcedureFile/CH252F/Exp1-1...

1
Title: Discrimination of Inner- and Outer-sphere Electrode Reactions by Cyclic
Voltammetry Experiments
Key Words
Marcus theory, electron transfer, chronoamperometry, chronocoulometry, Cyclic
voltammetry, electrical double layer
Object
It aims to learn basic concepts of microscopic pictures in electrochemistry and principles of
charge transfer reactions with hand-on skills of chronoamperometry, chronocoulometry, and
cyclic voltammetry.
Introduction
Electrochemistry is the branch of chemistry concerned with the interrelation of electrical and
chemical effects. A large part of this field deals with the study of chemical changes caused by
the passage of an electric current and the production of electrical energy by chemical reaction.
In fact, the field of electrochemistry encompasses a huge array of different phenomena (e.g.,
electrophoresis and corrosion), devices (electrochromic displays, electro analytical sensors,
batteries, and fuel cells), and technologies (the electroplating of metals and the large-scale
production of aluminum and chlorine). Scientists make electrochemical measurements on
chemical systems for a variety of reasons. They may be interested in obtaining
thermodynamic data about a reaction. They may want to generate an unstable intermediate
such as a radical ion and study its rate of decay or its spectroscopic properties. They may seek
to analyze a solution for trace amounts of metal ions or organic species. In these examples,
electrochemical methods are employed as tools in the study of chemical systems in just the
way that spectroscopic methods are frequently applied. There are also investigations in which
the electrochemical properties of the systems themselves are of primary interest, for example,
in the design of a new power source or for the electrosynthesis of some product. Many
electrochemical methods have been devised. Their application requires an understanding of
the fundamental principles of electrode reactions and the electrical properties of
electrode-solution interfaces. Therefore electrochemistry will play a key role in any future
sustainable energy system, both for energy storage and energy conversion.

2
Background Information
1. Marcus Theory of Electron Transfer
Figure 1. Geometrically constrained molecules dissolved in a polar solvent
Fe2++Fe3+ → Fe3++Fe2+
Suppose electron transfer between the same ions (Figure 1). It seems that there is no energy
barrier for the electron transfer in this case. However, it is more complicated than seen. Such
electron transfer may be happened even in a dark room, where it should occur while keeping
energy conservation law, because there is no energy change by photon absorption. In the same
time, electron transfer is much faster than the nuclei motion according to the Franck-Condon
principle or Born-Oppenheimer approximation. To satisfy these two conditions, Rudy Marcus
(Nobel prize 1992) noted that electron Transfer is occurred at the moment when the reactant
reaches the transition state in which the energy of the molecular structure including solvents is
identical before and after the charge transfer. Such a molecular rearrangement to the transition
state can be achieved by the vibrational motions of molecules. Therefore, their potential
energy surfaces can be approximated as parabolic by virtue of the successful harmonic
oscillator approximation of molecular vibrations in quantum mechanics as shown in Figure 2
Figure 2. Parabolic approximation of potential energy surface for electron transfer
In this energy diagram, activation barrier is readily evaluated with simple algebra. Under the
parabolic approximation

3
Ea(X) = Ea +1/2K(X –Xa)2 (1)
Eb(X) = Eb +1/2K(X – Xb)2
(2)
Energy conservation is kept at the transition state where Ea(Xtr) = Eb(Xtr). Thus,
Xtr =[Eb – Ea + 1/2K(Xb2-Xa
2)]/K(Xb – Xa) (3)
Then, activation energy from the reactant to the transition state is given by
EA = Ea(Xtr) – Ea(Xa) =1/2K(Xtr – Xa)2
(4)
Xtr – Xa =[Eb – Ea +1/2K(Xb2 – Xa
2) – KXa Xb + KXa
2 ]/K(Xb – Xa)
=[△E + 1/2K(Xb – Xa)2]/K(Xb – Xa) (5)
=△E + Er/√
where △E = Eb – Ea and Er is the reorganization energy which is defined by
Er =1/2K(Xa – Xb)2
(6)
Substituting Equation (5) into (4),
EA= [K(△E + Er)2]/4 Er =KEr /4 (1 +△E/Er)
2 (7)
Now we adopt the Eyring equation or the simple Arrhenius equation for the rate constant of
electron transfer reactions as follows.
k = A = A
△
(8)
Often it is written by
k = A = A
△
(9)
where = Er, △E = △G, and K 1. As can be seen from Equation 9, the electron transfer rate
highly depends on the reorganization energy and temperature. In most cases, the
reorganization energy is the energy required for the reorientation of solvent molecules to
adjust to the change in a charging state between before and after the charge transfer. The
Boltzmann factor in Equation 9 means that the reorganization energy comes from thermal
motions of solvents and solutes.
2. Electrical double layer: Inner Helmholtz Plane (IHP) and Outer Helmholtz Plane (OHP)
This section has been adopted from wikipedia: http://en.wikipedia.org/wiki/Double
_layer_(interfacial)

4
A double layer (DL) is a structure that appears on the surface of an object when it is
exposed to a fluid, as shown in Figure 3. The object might be a solid particle, a gas bubble, a
liquid droplet, or a porous body. The DL refers to two parallel layers of charge surrounding
the object. The first layer, the surface charge (either positive or negative), comprises ions
adsorbed onto the object due to chemical interactions. The second layer is composed of ions
attracted to the surface charge via the Coulomb force, electrically screening the first layer.
This second layer is loosely associated with the object. It is made of free ions that move in the
fluid under the influence of electric attraction and thermal motion rather than being firmly
anchored. It is thus called the "diffuse layer".
Figure 3. Schematic picture of a double layer
Interfacial DL is most apparent in systems with a large surface area to volume ratio, such as
colloid or porous bodies with particles or pores (respectively) on the scale of micrometres to
nanometres. However, DL is important to other phenomena, such as the electrochemical
behavior of electrodes. The DL plays a fundamental role in many everyday substances. For
instance, milk exists only because fat droplets are covered with a DL that prevents their
coagulation into butter. DLs exist in practically all heterogeneous fluid-based systems, such as
blood, paint, ink and ceramic and cement slurry. The DL is closely related to electrokinetic
phenomena and electroacoustic phenomena.
A. Helmholtz model
When an electronic conductor is brought in contact with a solid or liquid ionic conductor
(electrolyte), a common boundary (interface) among the two phases appears. Hermann von
Helmholtz was the first to realize that charged electrodes immersed in electrolytic solutions
repel the co-ions of the charge while attracting counterions to their surfaces. Two layers of

5
opposite polarity form at the interface between electrode and electrolyte. In 1853 he showed
that an electrical double layer is essentially a molecular dielectric and stores charge
electrostatically. Below the electrolyte's decomposition voltage the stored charge is linearly
dependent on the voltage applied. This model, while a good foundation for the description of
the interface, does not consider important factors including diffusion/mixing of ions in
solution, the possibility of adsorption onto the surface and the interaction between solvent
dipole moments and the electrode.
B. Gouy-Chapman model (Figure 4)
Louis Georges Gouy in 1910 and David Leonard Chapman in 1913 both observed that
capacitance was not a constant and that it depended on the applied potential and the ionic
concentration. The "Gouy-Chapman model" made significant improvements by introducing a
diffuse model of the DL. In this model the charge distribution of ions as a function of distance
from the metal surface allows Maxwell–Boltzmann statistics to be applied. Thus the electric
potential decreases exponentially away from the surface of the fluid bulk.
Figure 4. Gouy-Chapman model of the double-layer region.
C. Stern model
Gouy-Chapman model fails for highly charged DLs. In 1924 Otto Stern suggested
combining Helmholtz with Gouy-Chapman. In Stern's model, some ions adhere to the
electrode as suggested by Helmholtz, giving an internal Stern layer, while some forms a
Gouy-Chapman diffuse layer. The Stern layer accounted for ions' finite size and consequently
ions' closest approach to the electrode is on the order of the ionic radius. The Stern model had
its own limitations, effectively modeling ions as point charges, assuming all significant

6
interactions in the diffuse layer are Coulombic, assuming dielectric permittivity to be constant
throughout the double layer and that fluid viscosity is constant above the slipping plane.
D. Grahame model (Figure 5)
D. C. Grahame modified Stern in 1947. He proposed that some ionic or uncharged species
can penetrate the Stern layer, although the closest approach to the electrode is normally
occupied by solvent molecules. This could occur if ions lose their solvation shell as they
approach the electrode. He called ions in direct contact with the electrode "specifically
adsorbed ions". This model proposed the existence of three regions. The inner Helmholtz
plane (IHP) plane passes through the centers of the specifically adsorbed ions. The outer
Helmholtz plane (OHP) passes through the centers of solvated ions at the distance of their
closest approach to the electrode. Finally the diffuse layer is the region beyond the OHP.
Figure 5. Grahame model of the double-layer region.
3. Inner- and outer-sphere electrode transfer
Electrode reactions are distinguished as inner- and outer-sphere electron-transfer reactions at
electrodes. In an outer-sphere electrode reaction, electron transfer between the electrode and
the oxidant/reductant takes place at the OHP, while in an inner-sphere electrode reaction, a
coordinated ligand of electroactive metal complexes is bound to the electrode surface and
electron transfer may take place through the ligand adsorbed on the electrode, as depicted in
Figure 6. The term "outer-sphere" denotes a reaction between two species in which the
original coordination spheres are maintained in the activated complex (electron transfer from

7
one primary bond system to another). In contrast, "inner-sphere" reactions occur in an
activated complex where the ions share a ligand (electron transfer within a primary bond
system). A typical example of the outer-sphere electrode reaction is the heterogeneous
reduction of Ru(NH3)6+
, where the reactant at the electrode surface is essentially the same as
in the bulk. The reduction of oxygen in water and the oxidation of hydrogen at Pt are the
examples of inner-sphere reactions. Another type of inner sphere reaction features a
specifically adsorbed anion that serves as a ligand bridge to a metal ion. Obviously, the rate
constant of an inner-sphere electrode reaction should be highly dependent on the electrode
material, while that of an outer-sphere electrode reaction should be less dependent.
Figure 6. Schematic illustration of the mechanism of electrode reactions: (left) outer-sphere
mechanism and (right) inner-sphere mechanism. IHP is the inner Helmholtz plane and OHP is the
outer Helmholtz plane. This figure has been taken from Ref. 1.
4. Three electrode system
Figure 7. Three-electrode setup: (1) working electrode; (2) counter electrode; (3) reference electrode

8
The working electrode, which makes contact with the analyte, must apply the desired
potential in a controlled way and facilitate the transfer of charge to and from the analyte. A
second electrode acts as the other half of the cell. This second electrode must have a known
potential with which to gauge the potential of the working electrode, furthermore it must
balance the charge added or removed by the working electrode in the case of two electrode
systems. However, the two electrode systems have a number of shortcomings like IR drop. To
solve this problem, the roles of supplying electrons and providing a reference potential are
divided between two separate electrodes. The reference electrode is a half cell with a known
reduction potential. Its only role is to act as reference in measuring and controlling the
working electrode's potential and at no point does it pass any current. The counter (or
auxiliary) electrode passes all the current needed to balance the current observed at the
working electrode. To achieve this current, the counter electrode will often swing to extreme
potentials at the edges of the solvent window, where it oxidizes or reduces the solvent or
supporting electrolyte. These electrodes, the working, reference, and counter make up the
modern three electrode system.
5. Type of voltammetry
A. Chronoamperometry (CA)
Figure 8. Potential wave form for chronoamperometry and chronocoulometry
CA is an electrochemical technique in which the potential of the working electrode is
stepped as described in Figure 8. The potential is changed instantaneously from the Initial
Potential to the First Step Potential, and it is held at this value for the First Step Time. This is
a single potential step experiment. In a double potential step experiment, the potential is
9
changed to the Second Step Potential after the First Step Time, and it is then held at this value
for the Second Step Time. The resulting current from faradic processes occurring at the
electrode (caused by the potential step) is monitored as a function of time. Limited
information about the identity of the electrolyzed species can be obtained from the ratio of the
peak oxidation current versus the peak reduction current. However, as with all pulsed
techniques, the CA generates high charging currents which decay exponentially with time as
any RC circuit. The Faradaic current, which is due to electron transfer events and is most
often the current component of interest, decays much slower than the charging decay as
described in the Cottrell equation which is explained below. That is, the current is said to be
"diffusion controlled."
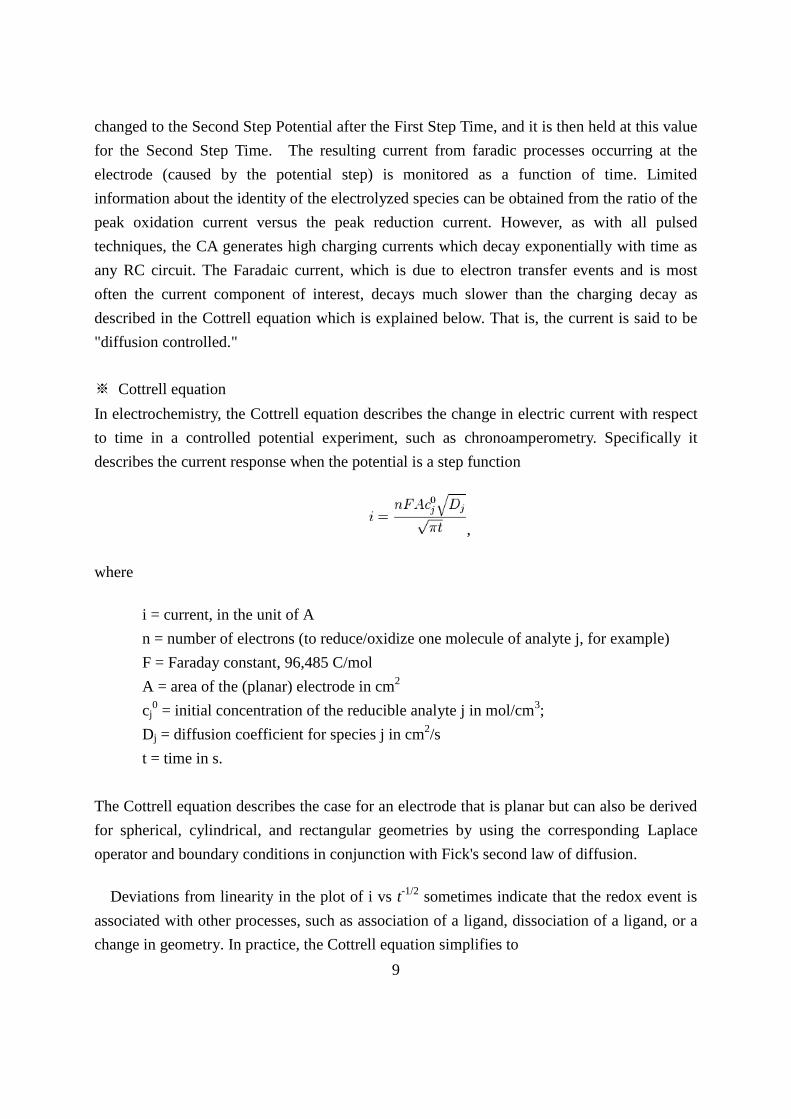
※ Cottrell equation
In electrochemistry, the Cottrell equation describes the change in electric current with respect
to time in a controlled potential experiment, such as chronoamperometry. Specifically it
describes the current response when the potential is a step function
,
where
i = current, in the unit of A
n = number of electrons (to reduce/oxidize one molecule of analyte j, for example)
F = Faraday constant, 96,485 C/mol
A = area of the (planar) electrode in cm2
cj0 = initial concentration of the reducible analyte j in mol/cm
3;
Dj = diffusion coefficient for species j in cm2/s
t = time in s.
The Cottrell equation describes the case for an electrode that is planar but can also be derived
for spherical, cylindrical, and rectangular geometries by using the corresponding Laplace
operator and boundary conditions in conjunction with Fick's second law of diffusion.
Deviations from linearity in the plot of i vs t-1/2
sometimes indicate that the redox event is
associated with other processes, such as association of a ligand, dissociation of a ligand, or a
change in geometry. In practice, the Cottrell equation simplifies to

10
i = kt-1/2
,
where k is the collection of constants for a given system (n, F, A, cj0, Dj).
B. Chronoamperometry (CA) vs chronocoulometry (CC)
Both methods have the same potential wave form (the potential step) which is one of the
simplest potential wave forms as shown in Figure 8. In CA, the current is monitored as a
function of time, whereas in CC, the charge is monitored as a function of time. It is important
to note that the basic potential step experiment is CA; that is, during the experiment, the
current is recorded as a function of time. However, after the experiment, the data can also be
displayed as charge as a function of time (the charge is calculated by integrating the current).
Hence, chronocoulometry data can be obtained. In summary, CA (y:current, x:time ) and CC
( y:charge, x:time ).
C. Cyclic voltammetry (CV)
This part has been adopted from the website: http://chemwiki.ucdavis.edu/Analytical
_Chemistry/Instrumental_Analysis/Cyclic_Voltammetry
CV is a very useful electrochemical technique and widely used to determine the redox
potential of redox couples and to elucidate electrode reaction mechanisms including chemical
reactions that accompany the electrode reaction. The potential of the working electrode is
measured against a reference electrode which maintains a constant potential, and the resulting
applied potential produces an excitation signal such as that of Figure 9.
In the forward scan of Figure 9, the potential first scans negatively, starting from a greater
potential (a) and ending at a lower potential (d). The potential extrema (d) is called the
switching potential, and is the point where the voltage is sufficient enough to cause an
oxidation or reduction of an analyte. The reverse scan occurs from (d) to (g), and is where the
potential scans positively. Figure 9 shows a typical reduction occurring from (a) to (d) and an
oxidation occurring from (d) to (g). It is important to note that some analytes undergo
oxidation first, in which case the potential would first scan positively. This cycle can be
repeated, and the scan rate can be varied. The slope of the excitation signal gives the scan rate
used.

11
Figure 9. CV Excitation Signal
A cyclic voltammogram is obtained by measuring the current at the working electrode during
the potential scans.² Figure 10 shows a cyclic voltammogram resulting from a single electron
reduction and oxidation. Consider the following reversible reaction:
M+ + e
- ⇌ M
Figure 10. Voltammogram of a Single electron oxidation-reduction
In Figure 10, the reduction process occurs from (a) the initial potential to (d) the switching
potential. In this region the potential is scanned negatively to cause a reduction. The resulting

12
current is called the cathodic current (ipc). The corresponding peak potential occurs at (c), and
is called the cathodic peak potential (Epc). The Epc is reached when all of the substrate at the
surface of the electrode has been reduced. After the switching potential has been reached (d),
the potential scans positively from (d) to (g). This results in anodic current (Ipa) and oxidation
to occur. The peak potential at (f) is called the anodic peak potential (Epa), and is reached
when all of the substrate at the surface of the electrode has been oxidized.
6. Equipment
Potentiostat (ez tech DY2300) [additional manual attached]

13
Pre-Laboratory Questions
1. Compare the different models of an electrical double layer.
2. Explain the difference between three and two electrode systems and describe the functions
of each electrode (working, counter, reference).
3. Explain the reason why electrolytes are required in the experiment.
4. Illustrate schematically the inner- and outer- electrode reaction pathways.
Materials
Reagents
Potassium hexacyanoferrate(III), K3[Fe(CN)6] [13746-66-2]
Iron(III) chloride hexahydrate, FeCl3·6H2O [10025-77-1], hygroscopic
Iron(III) sulfate n-hydrate, Fe2(SO4)3·nH2O [15244-10-7], hygroscopic
1.0 M KCl
1.0 M HCl
0.50 M H2SO4
Apparatus
Instrument for cyclic voltammetry (a set of a potentiostat, a potential sweeper, and an x-y
recorder). Voltammograms can be stored in a personal computer.
Electrochemical cell
Platinum disk working electrode
Glassy carbon (GC) disk working electrode
Platinum wire counter electrode
Ag/AgCl(3 M NaCl) reference electrode
Alumina polishing powder
Abrasive cloth
N2 gas
Safety and Hazards
- Iron(III) chloride hexahydrate, Iron(III) chloride hexahydrate: Causes skin irritation serious
eye damage
- HCl, H2SO4 : Causes severe skin burns and eye damage, respiratory irritation.

14
Experimental Procedure
Preparation of sample
1. 65.8 mg of exactly weighed K3[Fe(CN)6] is dissolved with 1.0 M KCl in a 100 mL
volumetric flask so as to be 2.00 mM.
2. About 54 mg of FeCl3·6H2O is dissolved with 1.0 M HCl in a 100 mL volumetric flask.
3. About 50 mg of Fe2(SO4)3·nH2O is dissolved with 0.50 M H2SO4 in a 100 mL volumetric
flask.
Assembly of a potentiostat
Figure 11. Left to Right; working, counter, reference electrode
Figure 12. Electrochemical cell for voltammetric measurements. WE: working electrode, RE:
reference electrode, CE: counter electrode
A voltammetric cell is assembled as shown in Figure 12. A platinum disk (diameter = 1.6 mm)
and a glassy carbon (GC) disk (diameter = 3.0 mm) are used as working electrodes. The
reference and counter electrodes are an Ag/AgCl(3M NaCl) and a platinum wire, respectively.
←N2 gas inlet
RE: Ag/AgCl
↓ WE ↓
CE: Pt→

15
Polishing Electrodes
1. Pretreatment of the working electrode surface may be required. The exposed working
electrode surface is polished with powdered alumina slurry(in order from the biggest to the
smallest,1micron⇒0.05micron) on a piece of abrasive cloth as shown in Figure 13 and
rinsed thoroughly with distilled water.
Figure 13. Grab a working Electrode and polish it while drawing "∞”on a polishing pad.
The other two electrodes (counter and reference Electrode) need to be washed with
distilled water.
※ Caution: keep the reference electrode in a brown bottle with 3M KCl or NaCl
solution whenever it is not in use.
Turn on the device and Set up a cell
2. Turn on the computer and potentiostat (back side). Both are connected! (check on the light
in the device).
3. Run DY2300EN

16
※ Check on the setup window[setup→system] if not on the “Positive right state”
4. Pour the solutions (step5,6,7) in a cell and set up the cell connected to a potentiostat.
Figure 14. Example of the set-up of a cell. Note that WHITE: Ref , RED: Counter, BLACK: working
electrodes, respectively.
←N2 gas inlet
RE: Ag/AgCl
↓ WE ↓
CE: Pt→

17
Measuring the surface area of the working electrodes
(To confirm that the area of Pt and GC disk electrodes are close to 0.020 cm2 for Pt and
0.071 cm2 for the GC electrode)
5. Change the mode to Chronocoulometry(CC) in the right top and set the parameters as
shown below and save the data
Chronocoulometry using 2.0 mM K3[Fe(CN)6]
in 1.0 M KCl(rxn: Fe3+ → Fe
2+) at Pt,GC
Parameters setting:
Init E: 0.5V, High E: 0.5, Low E: 0V
Scan polarity: Negative
Number of steps: 1,
Pulse width: more than 100 sec
In the potential-step chronocoulometric measurements the initial and step potentials are set at
0.5 V and 0 V vs Ag/AgCl, respectively. After the potential step the charge (Q) passed by
electrochemical reduction of [Fe(CN)6]3-
to [Fe(CN)6]4-
is monitored as a function of time (t).
c2/1
2/1
*O
2/1O2
Qtπ
CFADQ (P1)
where F is the Faraday constant, A is the electrode area, DO is the diffusion coefficient of
[Fe(CN)6]3-
, CO* is the bulk concentration of [Fe(CN)6]
3-, and Qc is the capacitive charge
required for charging the electric double layer. The electrode area is then determined from the
slope of the Q vs t1/2
plot according to equation P1 using the known value of the diffusion
coefficient of [Fe(CN)6]3-
in 1.0 M KCl, Do = 0.763×10⁻⁵
cm2 s
-1 and Co
* = 2.0×10
-6 mol cm
-3.
The surface area of the Pt and GC working electrodes measured electrochemically should be
close to the geometric surface area, which is 0.020 cm2 for the Pt electrode and 0.071 cm
2 for
the GC electrode, respectively.

18
※ Just in case of that the CC mode is not available, use the CA mode.
Parameters setting
Init E: 0.5V, High E: 0.5, Low E: 0V
Scan polarity: Negative
Number of steps: 1,
Pulse width: more than 100sec
Figure 15. Explanation of parameters in the CA measurement.

19
Measuring the diffusion coefficients of Fe3+
in 1.0 M HCl[FeCl3·6H2O] and 0.50 M
H2SO4[Fe2(SO4)3·nH2O] at the Pt electrode
6. Set chronocoulometry at the Pt electrode according to the similar procedure for the
determination of the surface area of working electrodes as above and save the data. The
diffusion coefficients of Fe3+
in 1.0 M HCl and 0.50 M H2SO4 are then determined by
chronocoulometry at the Pt electrode according to the similar procedure for the
determination of the surface area of working electrodes as above.
Measuring ΔEp using CV
7. Change the mode to CV in the right top and set the parameters and save the data
[Set the parameters(voltage range, scan rate) as below
(Table1), Init scan: negative, # of cycles: 2]

20
Figure 16. Explanation of parameters in the CV measurement.
8. Perform CV measurements for K3[Fe(CN)6] in 1.0 M KCl, FeCl3 in 1.0 M HCl and
Fe2(SO4)3 in 0.50 M H2SO4 at the platinum and GC disk electrodes. The experimental
conditions for CV measurements are summarized in Table 1.
Table 1. Experimental Conditions for CV Measurements.
electrode Ei / V E / V scan rate/mVs-1
[Fe(CN)6]3-
1.0 M KCl
Pt 0.5 0 200
GC 0.5 0
Fe3+
1.0 M HCl
Pt 0.6 0.2 50
GC 0.8 0
Fe3+
0.50 M H2SO4
Pt 0.6 0.2 50
GC 1.0 -0.2
Ei: initial potential, E: switching potential

21
Table 2. Relationship between Function Parameter and Peak Potential Separation ΔEp.a)
ΔEp/ mV ΔEp/ mV
61.6 6.0 220 0.10
62.5 5.0 288 5.0×10⁻²
63.8 4.0 382 2.0×10⁻²
66.0 3.0 454 1.0×10⁻²
70.3 2.0 525 5.0×10⁻³
82.8 1.0 620 2.0×10⁻³
90.6 0.75 691 1.0×10⁻³
105 0.50 763 5.0×10⁻⁴
123 0.35 857 2.0×10⁻⁴
144 0.25 929 1.0×10⁻⁴
a) The table is constructed by utilizing the digital simulation package DigiSim 3.0
(Bioanalytical Systems). (one-electron reduction, DO = DR, c = 0.5, E – Eo’ = -1 V)
Post-Laboratory Data Evaluation
1. Calculate the diffusion coefficients of Fe3+
in 1.0 M HCl and 0.50 M H2SO4 from the
chronocoulometric measurements using the known values of the Fe3+
concentration in
both solutions and the known value of the electrochemical electrode area of the Pt
electrode.
2. Measure the cathodic peak potential, Epc, and the anodic peak potential, Epa, in cyclic
voltammograms for the three redox couples at Pt and GC electrodes, respectively.
3. Determine the formal redox potential, Eo’, which can be calculated by averaging Epc and
Epa.
4. Calculate the potential difference of Epa and Epc, Ep. Then convert Ep into the
function parameter utilizing Table 2.
5. Determine the electrode reaction rate constant, ko’, from related to as expressed by
equation P2.
)()]/[
'p2/1
(O
o
EfRTnFvD
k
(P2)
6. Based on the dependency of the rate constant on the type of electrodes, determine
whether each of the three samples at the two electrodes is inner-sphere or outer sphere
electrode reaction and justify your answer.

22
References
1. dx.doi.org/10.1021/ed200604m | J. Chem. Educ. 2013, 90, 778−781
2. Bard, A. J.; Faulkner, L. R. Electrochemical Methods: Fundamentals and Applications, 2nd
ed.; Wiley: New York, 2001; pp 115-124.
3.http://chemwiki.ucdavis.edu/Analytical_Chemistry/Instrumental_Analysis/Cyclic_Voltamm
etry
4. http://www.basinc.com/mans/EC_epsilon/Techniques/ChronoI/ca.html
5. Kissinger, P.T.; Heineman,W.R. J. Chem. Educ. 1983, 60, 702-706(C1).
6. Van Benschoten, J. J.; Lewis, J. Y.; Heineman, W. R.; Roston, D. A.; Kissinger, P. T. J.
Chem. Educ. 1983, 60, 772-776(C2).