Title: Deglaciation rate on southern and ... - rebus.us.edu.pl · 78 Joanna Ewa Szafraniec (Stroeve...
23
Title: Deglaciation rate on southern and western Spitsbergen in the conditions of Arctic amplification Author: Joanna Ewa Szafraniec Citation style: Szafraniec Joanna Ewa. (2018). Deglaciation rate on southern and western Spitsbergen in the conditions of Arctic amplification. “Polish Polar Research” (Vol. 39, iss. 1 (2018), s. 77-98), doi 10.24425/118739
Transcript of Title: Deglaciation rate on southern and ... - rebus.us.edu.pl · 78 Joanna Ewa Szafraniec (Stroeve...

Title: Deglaciation rate on southern and western Spitsbergen in the conditions of Arctic amplification
Author: Joanna Ewa Szafraniec
Citation style: Szafraniec Joanna Ewa. (2018). Deglaciation rate on southern and western Spitsbergen in the conditions of Arctic amplification. “Polish Polar Research” (Vol. 39, iss. 1 (2018), s. 77-98), doi 10.24425/118739

Pol. Polar Res. 39 (1): 77–98, 2018
vol. 39, no. 1, pp. 77–98, 2018 doi: 10.24425/118739
Deglaciation rate on southern and western Spitsbergen in the conditions of Arctic amplification
Joanna Ewa SZAFRANIEC
Centre for Polar Studies, Faculty of Earth Sciences, University of Silesia in Katowiceul. Będzińska 60, 41-200 Sosnowiec, Poland
Abstract: This paper reports on a morphometric analysis of land-terminating glaciers on southern and western Spitsbergen in the years 1936–2014. An attempt was made to estimate the deglaciation rate and the scale of its acceleration in the 21st century in the conditions of Arctic amplification. Satellite scenes and topographic map sheets were used for the study and were analyzed by means of remote sensing and GIS methods.The study covered 2000–2014 years and concluded that surface recession accelerated on average by a factor of 2.75 compared to the 1936–2000 period, while linear recession was 2.2 times faster. The greatest increase in the deglaciation rate can be observed in the case of glaciers faced to N and W sectors. The deglaciation process is the most advanced in the central part of the island, where small, compact mountain glaciers pre-dominate. In recent years, a slowdown in the deglaciation processes in these glaciers was observed. The studies demonstrate that the deglaciation rate was mainly influenced by the basin relief determining the glacier geometry. The resultant fractal nature of the ice cover makes it highly vulnerable to the disintegration of complex glacial systems into smaller ones due to glacier thinning and the separation of outlets. The acceleration of the deglaciation rate in turn is modified by the climate factor, especially the impact of warming air masses from the N and W sectors where seas are becoming increasingly ice-free and, consequently, have an increasing heat capacity.
Key words: Arctic, Svalbard, recession rate, acceleration of deglaciation rate, GIS.
Introduction
At the present time, climate warming in northern latitudes is twice as fast on average as in the northern hemisphere as a whole, which is referred to as the Arctic amplification (Francis and Vavrus 2012). Recent data points that air temperatures have increased of 0.05°C to even 0.112°C per decade in the 21st century (Huang et al. 2017). It is believed that Arctic amplification is caused by the growing amount of greenhouse gases in the atmosphere, among other factors

Joanna Ewa Szafraniec78
(Stroeve et al. 2012). Another component contributing to the changes in the Svalbard Archipelago is the increased penetration of Arctic waters by the warmer waters of the West Spitsbergen Current (WSC) (Piechura and Walczowski 2009; Walczowski et al. 2012; Pavlov et al. 2013). As a consequence, the surface area of sea ice is gradually shrinking – by 25–30% since 1979 (Meier et al. 2011). The area of SW Spitsbergen has recorded an increase in sea surface temperatures of 1.5–1.7°C in the last two decades of the 20th century (Kruszewski 2004). In the area of Isfjorden and Grønfjorden, the value was 0.19°C and 0.21°C per decade respectively, with an increase of more than 1°C at the beginning of the 21st century compared to 20th-century data (Pavlov et al. 2013). All these phenomena and the decreasing albedo of sea areas (greater heat capacity) add more to the climate warming in the region than the increasing frequency of influx of warmer air masses in atmospheric circulation (Isaksen et al. 2016). Climate models indicate that the increase in air temperatures and precipitation (particularly liquid) is bound to continue (Overland et al. 2011; López-Moreno et al. 2016).
The spiral of feedbacks also extends to Arctic glaciers, including those on Spitsbergen, which results in their intense recession (Hagen et al. 1993, 2003; Kohler et al. 2007; Olsen et al. 2011). Recent years have seen a significant acceleration of the rate of this recession (e.g. Rachlewicz et al. 2007; Ziaja and Pipała 2007; Błaszczyk et al. 2013; Małecki 2013, 2016; Małecki et al. 2013; Nuth et al. 2013; Sobota et al. 2016; Ziaja et al. 2016).
The purpose of this paper is to carry out a comprehensive investigation of the spatial variation in the deglaciation rate of S and W Spitsbergen, which are affected by the Arctic amplification and are the areas most heavily exposed to the impact of the WSC. An attempt will also be made to determine the scale of the acceleration at the beginning of the 21st century compared to the 1936–2000 reference period. Account will be taken of the role of the morphometry of Spitsbergen glaciers in the deglaciation rate.
Methods
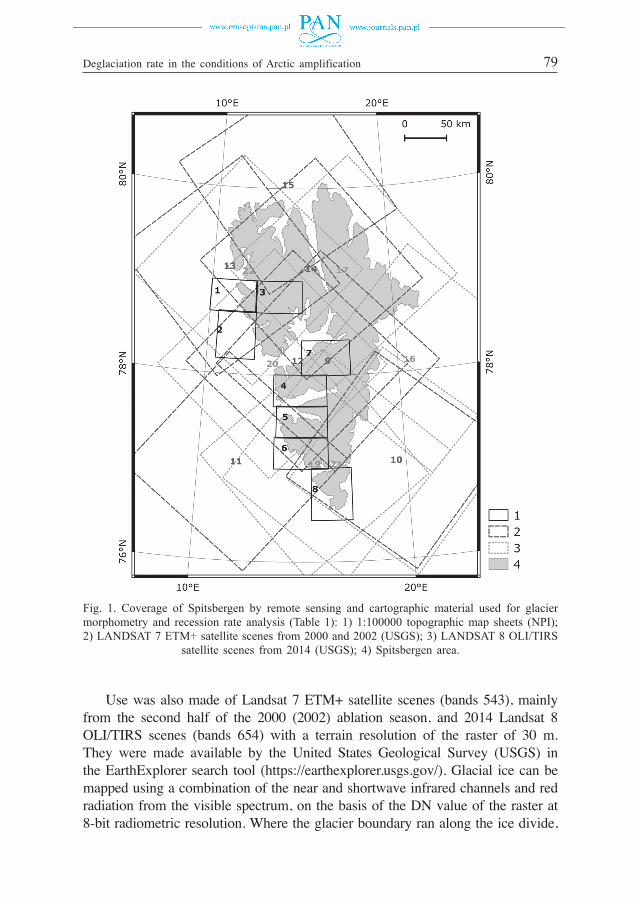
The rate of surface and linear recession in the years 1936–2000 and the various morphometric parameters of selected land-terminating glaciers in W and S Spitsbergen were calculated on the basis of manual feature vectorisation from 1:100 000 topographic map sheets (The Norwegian Polar Institute – NPI). The maps of older edition were prepared inter alia on the basis of 1936 aerial photographs (Fig. 1 and Table 1). They were calibrated to the UTM 33X system on the ED50 ellipsoid (EPSG:23033), and then the system was transformed into the WGS84 ellipsoid (EPSG:32633) with a terrain resolution of the raster of 17 m.
Deglaciation rate in the conditions of Arctic amplification 79
Use was also made of Landsat 7 ETM+ satellite scenes (bands 543), mainly from the second half of the 2000 (2002) ablation season, and 2014 Landsat 8 OLI/TIRS scenes (bands 654) with a terrain resolution of the raster of 30 m. They were made available by the United States Geological Survey (USGS) in the EarthExplorer search tool (https://earthexplorer.usgs.gov/). Glacial ice can be mapped using a combination of the near and shortwave infrared channels and red radiation from the visible spectrum, on the basis of the DN value of the raster at 8-bit radiometric resolution. Where the glacier boundary ran along the ice divide,
Fig. 1. Coverage of Spitsbergen by remote sensing and cartographic material used for glacier morphometry and recession rate analysis (Table 1): 1) 1:100000 topographic map sheets (NPI); 2) LANDSAT 7 ETM+ satellite scenes from 2000 and 2002 (USGS); 3) LANDSAT 8 OLI/TIRS
satellite scenes from 2014 (USGS); 4) Spitsbergen area.

Joanna Ewa Szafraniec80
Tab
le 1
Lis
t of
top
ogra
phic
al m
ap s
heet
s an
d sa
telli
te s
cene
s us
ed i
n th
e m
orph
omet
ric
anal
ysis
of
the
ice
cove
r of
S a
nd W
Spi
tsbe
rgen
sh
own
in F
ig.
1.
NO
.M
AP
SHE
ET
S(1
:100
000
), N
PIL
AN
DSA
T s
cene
s
1A
7 K
ongs
fjor
den
NO
.7
ET
M+
2000
& 2
002,
USG
SD
AT
E
AC
QU
IRE
DN
O.
8 O
LI/
TIR
S20
14,
USG
SD
AT
E
AC
QU
IRE
D
2A
8 Pr
ins
Kar
ls
Forl
and
9L
E72
1300
4200
0207
KIS
0025
.07.
2000
16L
C82
1000
4201
4216
LG
N00
4.08
.201
4
3B
7 T
re K
rone
r10
LE
7208
0052
0021
93E
DC
0012
.07.
2002
17L
C82
1600
3201
4258
LG
N00
15.0
9.20
14
4B
10 V
an M
ijenf
jord
en11
LE
7213
0052
0002
07K
IS00
25.0
7.20
0018
LC
8208
0052
0142
18L
GN
006.
08.2
014
5B
11 V
an
Keu
lenf
jord
en12
LE
7214
0042
0002
30K
IS00
17.0
8.20
0019
LC
8029
2392
0141
96L
GN
0015
.07.
2014
6B
12 T
orel
lbre
en13
LE
7220
0032
0002
08E
DC
0026
.07.
2000
20L
C82
1500
4201
4235
LG
N00
23.0
8.20
14
7C
9 A
dven
tdal
en14
LE
7217
0032
0021
92E
DC
0011
.07.
2002
21L
C82
1000
5201
4232
LG
N00
20.0
8.20
14
8C
13 S
ørka
pp15
LE
7222
0022
0002
06A
GS0
024
.07.
2000
22L
C80
2524
1201
4232
LG
N00
20.0
8.20
14

Deglaciation rate in the conditions of Arctic amplification 81
use was made of the digital elevation model (S0 Terrengmodell, Norwegian Polar Institute, 2014; https://doi.org/10.21334/npolar.2014.dce53a47) with a resolution of 20 m, created mainly with the use of vertical aerial photographs taken in 1990. Satellite scenes with 3D visualisation were superimposed on the model. When shading in the imagery hindered the identification of the boundary of a glacier, use was made of another satellite scene taken with lighting from a different azimuth.
The calculated rate of surface recession was tested using data from the World Glacier Inventory (WGI; National Snow & Ice Data Center, https://nsidc.org/data/glacier_inventory/). The exercise yielded the expected area of each glacier in the year of the WGI data. There was a 97% likelihood of glacier area values being underestimated by an average of 6.7% when compared to inventory data. This inaccuracy is linked to the methodology of image identification in both cases and to the timing of the image capture, i.e. the progress of surface ablation and the presence of snow cover. Another issue is the dating of the WGI data (sources from 2002 to 2008), which period includes years with different surface recession rates compared to the value adopted for the uniform study period 2000 (2002)–2014. Finally, the differences stem from the treatment of glaciers as stand-alone glacial systems. Indeed, the WGI continues to present many glaciers as single systems even if their branches have already been separated (e.g. hanging cirque glaciers). Additionally, sections of the ice divide are traced as a straight line. In contrast, this study traces the ice divides along skeleton lines produced by digital terrain model (using the Convergence index tool).
The glacier parameters, such as area (A) and perimeter (D), were calculated with the use of the vector geometry tools in the QGIS software. The glacier length (L) and linear recession (LR) were measured along the central line and the main axis of the valley with measuring tools. The mean width (Bs), defined as the ratio of the glacier area to the glacier length, the compactness coefficient (RF), defined as the glacier perimeter to the circle perimeter of area equal to the glacier area, as well as the elongation index (α), understood as the ratio of the glacier area to the glacier mean width, were calculated using the following formulae: Bs = A/L, RF = D/√
–2–(π––A)
–, α = L/Bs. The glacier terminus (minimum)
elevation (Hf), the glacier maximum elevation (Ht) and the average glacier surface slope (S) for 1936 were calculated on the basis of a topographic map and, for the years 2000 and 2014 – on the basis of a digital elevation model (NPI), using the Profile tool plugin in QGIS. The aspect of glacier termini was determined directly on the satellite scenes. The distance from fjord waters (M) was calculated with a tool measuring the distance from the glacier terminus edge along the axis of the valley to the river mouth.
The cartographic visualisation of the results of the work was produced with the open source software QGIS 2.14 Essen and SAGA GIS 2.12 as well as Surfer 12 and Grapher 11 applications from the Golden Software package.

Joanna Ewa Szafraniec82
Results
Morphometry of S and W Spitsbergen glaciers. — The study comprised 103 glaciers, which saw, in the years 1936–2014, a radical average decrease: in surface area by 33.8%, in length – by 22.8%, and in perimeter – by 14.9%. The general trend of the changes also indicates an increase in the slope of the glacier surface as a result of the retreat of termini to ever higher valley sections.
The deglaciation process is largely dependent on the condition of the ice cover at the onset of the climate changes responsible for the warming, which, in turn,
Fig. 2. Morphometric characteristics of land-terminating glaciers in S and W Spitsbergen, according to terminus exposure to the cardinal directions for the years 1936, 2000 and 2014.

Deglaciation rate in the conditions of Arctic amplification 83
differs from one terminus exposure sector to another. The lowest average absolute values of the morphometric indices (except the glacier slope) were characteristic of the E (i.e. among glacers with eastern termini exposure) and NW sectors, while the highest ones were characteristic of the S and SE sectors (Fig. 2).
When looking at the glaciers in terms of size (Fig. 3a), it can clearly be seen that large glaciers (with an area of over 6 km2) are mainly concentrated along the N–S axis. More than half of the glaciers in the group – with a surface area of over 10 km2 – are glaciers from the SE and S sectors. The group of large glaciers in the study does not include glaciers facing E and NW. Small glaciers, with an area of less than 3 km2, are characteristic of the NW and E and SW sectors.
Fig. 3. Selected morphometric parameters of land-terminated glaciers in W and S Spitsbergen according to terminus exposure to the cardinal directions: (A) size of glaciers, (B) the compactness coefficient of glaciers in 1936, 2000 and 2014, (C) the elongation index of glaciers in 1936, 2000, and 2014, (D) average elevation of the upper and lower (terminus) edges of the glacier
in 1936 and 2014.
A
C
B
D

Joanna Ewa Szafraniec84
The surface slope is the gentlest on the large glaciers, especially in the sector with termini facing the SE and S, and averages 6°. The greatest inclination is found in glaciers facing NW, and the greatest increase in slope has been observed in this group, from 9.1° in 1936 to 10.9° in 2014 on average. The most stable sectors in terms of surface slope are the eastern sectors, where the average values ranged from 0.4% to 3% in the period under investigation. By contrast, an 8% decrease of the slope, in contrast to the general trend, was observed for the W sector in the period 1936–2000, and has remained stable since.
The multiannual period included in the study (78 years) saw a rising trend in the compactness coefficient, which for the sample analysed increased from 1.81 to 2.00 on average. The process was most pronounced for glaciers with their termini facing the N, NE and SE (Fig. 3B). In turn, the remaining glaciers initially observed an increase in compactness coefficient values to see the tendency halted or reversed at the beginning of the 21st century. The glaciers of the eastern sector were found to be the most compact (1.60 on average).
Regarding elongation, the glaciers have a ratio typical of valley and mountain glaciers, fitted into the bedrock. Their average length is over four times greater than the mean width. In the 21st century, elongation proceeds the fastest in the SE and NE sectors (Fig. 3C), where the length exceeds the mean width over five times. The glaciers in the E, S and NW sectors are shortening. The elongation index highlights the compactness of the glaciers with termini facing eastwards. Here, glaciers are only three times longer than their mean width.
In the population under study, the glaciers shrink both as a result of terminus retreat, and surface ablation. As a result, snouts recede upslope, the glacier area shrinks, and the sagging glacier edges loose elevation (Fig. 3D). During the period under study, the glacier termini withdrew from an average height of 197 m ±13 m a.s.l. to 287 m ±14 m a.s.l., with the greatest changes in the NW and NE sectors – by 127 m and 105 m of denivelation, respectively. The least pronounced changes occurred in the SW and S sectors – by 66 m and 67 m of denivelation, respectively. The process leads to changes in the surface slope, as mentioned above. In the population under analysis, the average surface slope changed from 7.6° ±0.3° to 8.1° ±0.4°. The process was most noticeable in the northern sectors, especially among glaciers with termini facing the NW. The upper edges of glaciers from the SE and E sectors saw the greatest reduction in height, by more than 50 m, with an average height change of 27 m among the entire population.
Surface recession rate on S and W Spitsbergen. — The individual years of the 21st century are considered to be significantly warmer than the long-term average. The average rate of deglaciation on Spitsbergen during the 2000–2014 period was investigated, excluding north-east basins 16 and 17. To this end, 362 land-terminating glaciers of different geometries were analysed. In the population

Deglaciation rate in the conditions of Arctic amplification 85
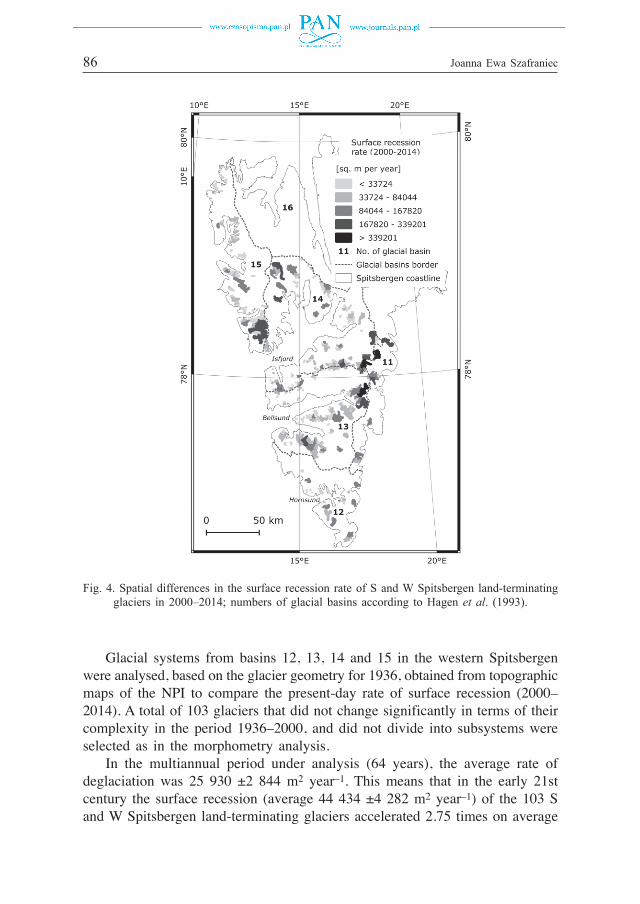
under study, the surface area of glacial systems decreased by 250.8 km2 (by 10.3% on average) over the 14-year period. The average rate of deglaciation was 52 207 ±4 220 m2 year–1. However, the rate differed from one part of the island to another (Table 2 and Fig. 4): from an average of less than 9000 m2 year–1 in the S part, to an average of almost 161 000 m2 year–1 in the E part.
To investigate the relationship between glacier size and the deglaciation rate in the 21st century (Fig. 5), the population of glaciers was sorted in ascending order of size, and the resulting dataset was divided into 7 groups of similar size (50–52 glaciers in each group). It follows from the analysis that the bigger the glacier, the faster the surface recession rate, but, at the same time, the lower the percentage rate of loss of glacier surface area. For small glaciers, it exceeds 25% on average, and for the largest ones, is lower than 10%.
In terms of terminus aspect, the highest rate of deglaciation is observable for the E sector, and it averages 72 500 m2 year–1 (Fig. 6A). This absolute value was influenced, in particular, by the larger glaciers from SE Spitsbergen (basin 11); see Fig. 4. The lowest rate of surface recession is recorded for the NW sector, which is represented by the largest number of glaciers in the population analysed (Fig. 6B), and averages 37 500 m2 year–1. In both extreme groups, the average glacier size is similar (1.34 and 1.70 km2, respectively), and is significantly lower than the average surface area of all the glaciers.
Table 2Changes in glacier surface area and the rate of land release from under the ice cover
in S and W Spitsbergen in 2000–2014.
RegionNumber
of analysed glaciers
Total area of analysed glaciers in 2000 (average)
[km2]
Total area of analysed glaciers in 2014 (average)
[km2]
Surface recession rate of analysed
glaciers [m2 rok–1]
11 15 235.57(15.70)
198.20(13.21) 160 776
12 30 169.01(5.63)
153.18(5.11) 8 730
13 131 828.02(6.32)
743.07(5.67) 51 205
14 104 606.82(5.83)
529.80(5.09) 52 897
15 82 593.13(7.23)
557.45(6.80) 32 972
Spitsbergen without N & NE
glacier basins362 2 433 ± 4.13
(6.69)2 182 ± 3.73
(6.00)av. 52 333 ±
± 4 219
Joanna Ewa Szafraniec86
Glacial systems from basins 12, 13, 14 and 15 in the western Spitsbergen were analysed, based on the glacier geometry for 1936, obtained from topographic maps of the NPI to compare the present-day rate of surface recession (2000–2014). A total of 103 glaciers that did not change significantly in terms of their complexity in the period 1936–2000, and did not divide into subsystems were selected as in the morphometry analysis.
In the multiannual period under analysis (64 years), the average rate of deglaciation was 25 930 ±2 844 m2 year–1. This means that in the early 21st century the surface recession (average 44 434 ±4 282 m2 year–1) of the 103 S and W Spitsbergen land-terminating glaciers accelerated 2.75 times on average
Fig. 4. Spatial differences in the surface recession rate of S and W Spitsbergen land-terminating glaciers in 2000–2014; numbers of glacial basins according to Hagen et al. (1993).

Deglaciation rate in the conditions of Arctic amplification 87
compared to the multiannual period (Fig. 7). However, the acceleration differs from one glacial basin of W Spitsbergen to another, ranging on average from 1.5 times in the Bellsund basin, 1.9 times in the Hornsund basin, 3.4 times in the NW Spitsbergen basin, to 3.8 times in the Isfjorden basin. It also varies in relation to terminus exposure. The greatest acceleration of the surface recession
Fig. 5. Changes in average surface recession and surface area of S and W Spitsbergen land-terminating glaciers in 2000–2014, by glacier size classes.
Fig. 6. Differences in average surface recession rate (A) of S and W Spitsbergen land-terminating glaciers in the years 2000–2014, according to terminus exposure to the cardinal directions relative
to the number of glaciers (B) in the population analysed by exposure sector.
A B

Joanna Ewa Szafraniec88
rate in recent years has been seen in glaciers from the W sector – 4.1 times, and from the N sector – 3.7 times (Fig. 8A). In recent years, acceleration is the slowest for glaciers with termini in the S sector – 1.6 times.
Linear recession rate. — In the period 1936–2000, the linear recession of W Spitsbergen glaciers was progressing at an average rate of 12.3 ±1 m year–1, most intensively in the Hornsund basin (19.4 m year–1), and at the lowest pace in NW Spitsbergen (11.4 m year–1). Meanwhile, in the years 2000–2014, the
Fig. 7. Spatial differences in average acceleration rate in surface recession of S and W Spitsbergen land-terminating glaciers at the beginning of the 21st century compared to 1936–2000; numbers
of glacial basins according to Hagen et al. (1993).

Deglaciation rate in the conditions of Arctic amplification 89
pace increased by an average of 26.7 m year–1 ±3.1 m year–1, ranging from 13.7 m year–1 in the NW basin (stable recession rate) to 33.6 m year–1 in the Isfjorden basin (three-fold acceleration).
Regarding terminus exposure in 1936–2000, the linear recession rate was fairly uniform in the western part of the island (Fig. 8B), slightly higher in the S sector (15.9 m year–1 on average), and the lowest for those glaciers whose termini are facing the NE and W (10 m year– 1 on average). The years of the 21st-century are characterised by a significant increase in the rate of recession, especially in the SE sector (up to 40.3 m year–1). By contrast, the lowest rate of disappearance is observed for the western sector and is 21.9 m year–1. In the years 2000–2014, the linear retreat of W Spitsbergen land-terminating glaciers accelerated almost three times on average in the sector with termini facing the SE (Fig. 8A), with the lowest rate observed for glaciers with termini facing the SW (1.7 times). Against a background of acceleration of surface recession for the different variants of terminus exposure, it can be seen that glaciers with a significantly increased acceleration of surface recession see a slower rate of acceleration of linear recession.
As it is indicated by the data (Table 3), the deglaciation rate during the 1936–2000 period was largely determined by the glacier geometry, and thus, indirectly, by the basins relief, with glacier size being of particular importance, i.e. surface area and mean width, especially at the beginning of the period analysed. The larger the glacier, the greater is the deglaciation rate.
Fig. 8. Deglaciation rate parameters of S and W Spitsbergen land-terminating glaciers by terminus exposure to the cardinal directions. (A) average acceleration in linear recession rate vs. average acceleration in surface recession rate in the 21st century compared to 1936–2000, (B) differences
in average linear recession rate in 1936–2000 and 2000–2014.
A B

Joanna Ewa Szafraniec90
Tab
le 3
Cor
rela
tion
coef
fici
ent
betw
een
the
degl
acia
tion
rate
of
S an
d W
Spi
tsbe
rgen
lan
d-te
rmin
atin
g gl
acie
rs i
n 19
36–2
000
and
2000
–201
4 an
d th
e ac
cele
ratio
n of
deg
laci
atio
n at
the
beg
inni
ng o
f th
e 21
st c
entu
ry a
nd d
iffe
rent
des
crib
ed m
orph
omet
ric
para
met
ers
of g
laci
ers
in 1
936
and
2014
. Pa
ram
eter
s of
gla
cier
s: A
– a
rea,
L –
len
gth,
D –
per
imet
er,
Bs
– m
ean
wid
th,
S –
surf
ace
slop
e, H
f –
term
inus
(m
inim
um)
elev
atio
n, H
t –
max
imum
ele
vatio
n, M
– d
ista
nce
from
fjo
rd w
ater
s.
Gla
cier
mor
phom
etri
c pa
ram
eter
sA
1936
A20
14L
1936
L20
14D
1936
D20
14B
s 193
6B
s 201
4S 1
936
S 201
4H
f 193
6H
f 201
4H
t 193
6H
t 201
4M
2014
Deg
laci
atio
n ra
te
(193
6–20
00)
0.82
0.79
0.69
0.73
0.48
0.50
0.83
0.78
0.71
0.71
0.54
0.56
0.20
0.17
0.15
Deg
laci
atio
n ra
te
(200
0–20
14)
0.71
0.67
0.73
0.72
0.68
0.69
0.64
0.57
0.70
0.66
0.30
0.41
0.02
0.02
0.22
Acc
eler
atio
n of
deg
laci
atio
n0.
040.
090.
100.
060.
100.
060.
080.
110.
070.
070.
250.
200.
180.
240.
27

Deglaciation rate in the conditions of Arctic amplification 91
The role of surface area together with its mean width, as well as of the orographic factor, has become less pronounced in the deglaciation processes in recent years (2000–2014), while the role of the glacier perimeter has gained importance. The parameters related to the vertical extent of the glacier and the distance from fjord waters are not relevant as regards the deglaciation rate. In addition, neither the basins relief nor the morphometry of a glacier have had any direct effect on the acceleration of surface recession in recent years.
Influence of Arctic amplification on the Spitsbergen deglaciation rate
The Spitsbergen land-terminating glaciers represent nearly all forms of glaciation; from extensive ice caps, through vast systems of outlet valley glaciers, to small mountain glaciers, and even rock glaciers. However, regardless of their geometry, all glaciers are seeing a significant reduction in their surface area, length and thickness.
The surface recession rate in the S and W parts of the island has been estimated to be in the 21st century 2.75 times higher on average than in the years 1936–2000. The observations correspond to the results calculated on the basis of previously published data for selected areas of Spitsbergen. It has been observed in the tidewater glaciers of the Hornsund glacial basin (SW Spitsbergen), which are the dominant type in the area, that the rate of surface recession in recent years has been three times greater than in the beginning of the 20th century (Błaszczyk et al. 2013). In the Billefjorden glacial basin (central part of the island), the rate of surface recession of the land-terminating glaciers in the years 1990–2002 was 1.5 times higher on average than in 1960–1990, based on data of Rachlewicz et al. (2007). For three land-terminating glaciers in the Nordenskiöld Land (Isfjorden region, central Spitsbergen), the deglaciation rate between 2001 and 2006 was 1.5–1.9 times higher than in 1936–2001, based on data of Ziaja and Pipała (2007). A characteristic feature is the power dependence between the surface recession rate and the size of surface area class of glaciers – the larger the glacier, the higher the rate of surface recession. By contrast, the larger the glacier, the lower is the percentage loss of mass (see Fig. 5). The areas located more to the north (basin 15) are characterised by a lower average deglaciation rate, despite being exposed to the same westerly oceanic-atmospheric circulation as the basins lying slightly further south (14, 13 and 12). Owing to the continentalisation of the climate inside the islands (basins 13 and 14), the amount of precipitation is lower than on the coast, which enhances the role of the radiation factor, affecting surface ablation of glaciers (Szafraniec 2002; Laska et al. 2017) and the negative climatic mass balance (Möller et al. 2016). Many of glaciers in the area are of the small mountain type.

Joanna Ewa Szafraniec92
The great acceleration in the warming of the Arctic climate, including Spitsbergen, in the 21st century, referred to as the Arctic amplification, is primarily explained by changes in the air mass circulation and the significant reduction of sea ice (Meier et al. 2011), which increases surface air temperature (Overland and Wang 2010; López-Moreno et al. 2016). It has been observed that the advection of air masses from the northern and eastern sea areas has had the greatest effect on the warming of the Spitsbergen area (Isaksen et al. 2016). In addition, attention is drawn to a local factor, namely the concentration of sea ice. Its reduction in recent years has added to the warming of waters in western fjords, especially Isfjorden. At the same time, the entire spiral of feedbacks is linked strongly with the increase in the inflow of warmer WSC waters (Piechura and Walczowski 2009; Walczowski et al. 2012; Pavlov et al. 2013). How does the changing deglaciation rate reflect the impact of the reduction of sea ice, and thus the increase in the heat capacity of the Spitsbergen waters?
The glaciers whose shapes undergo the greatest modifications are the most susceptible to climate change because, in line with the “constructal theory” (Reis 2006), this proves that the elements of a glacial system are constantly adapting to its vulnerable equilibrium. In terms of glacier geometry, such changes are measured by shape indicators, such as the elongation index and the compactness coefficient. In the years 1936–2014, the most noticeable percentage changes in the compactness coefficient of the glacier form, i.e. decrease in the glacier surface area relative to the perimeter, were seen for the glaciers facing to N-NE-W sectors, where RF increased by 16% and 14%, respectively. By contrast, the greatest area losses, as reflected by the narrowing of glaciers relative to their length, i.e. increase in the elongation index, are found in the W sector, in the period under study the average value of the elongation ratio grew by 22%. This is also mirrored by the greatest acceleration in the surface recession rate in the N and W sectors (Fig. 8A). N–S aspects reflect the radiation factor influence on the glacier cover condition (Evans and Cox 2005, 2010), thus data points the increasing role of the warming air masses (circulation factor) coming from the north sea areas (Isaksen et al. 2016). W and SW aspects are favourable for direct warming sea water effect and precipitation.
At the same time, both these morphometric indices – the elongation index and the compactness coefficient – are indicative of an increase in the interaction zone – relevant for the heat balance between the bedrock, the glacier, and the air, with water playing a role too, e.g. expanding proglacial lakes (Ewertowski 2014). The less compact the shape, the more efficient the heat exchange.
The most compact glaciers are the ones in the E sector, which undergo the most advanced deglaciation process (cf. Fig. 6). This is caused by surface melt, which has gradually lowered their upper extent (see Fig. 3D). As a result, notwithstanding the increase in the average slope of the surface of Spitsbergen glaciers, it has stabilised, and even slowed down, in the groups of E sector

Deglaciation rate in the conditions of Arctic amplification 93
glaciers. The concealment of ice mass on the bottom of cirques, where it is protected against direct radiation by the surrounding slopes and by an insulation layer of thickening mineral material on the surface, causes the surface recession rate in the sector to slow down in the case of the smallest glaciers, which is also noted by Rasmussen (2006). This is most clearly seen in the central part of the island (Fig. 7). By contrast, the least elongated glaciers, which saw a decrease in the elongation index over the 78-year period by an average of 23%, are those from the NW sector. This is mainly caused by the retreat of glacier snouts to higher elevations, also in absolute terms. The glaciers are therefore characterised by the greatest average increase in surface slope. The glaciers from the E and NW sectors form a significant group of small mountain glaciers (Fig. 3A), not all taken into the WGI (Evans and Cox 2010), but are represented in this analysis.
As it is shown by the analysis, deglaciation is largely determined indirectly by glacial basins relief (see Table 3). This leads to the creation of extensive valley systems, most with longitudinal orientation, e.g. axes of the main valleys and tectonic faults (Birkenmayer 1972). The largest glaciers see the lowest percentage loss of mass as a result of climate warming. Their considerable vertical extent allows both the reservoir zone to be supplied with new mass, and the increasing area of the ablation zone to melt. The response of a glacier to the prevalence of either factor causes glaciers with varied shapes with multiple accumulation basins and a narrow ablation zone to be, at the same time, the most dynamic forms, including a glacier surge (Clarke et al. 1986). The accelerated deglaciation rate indicates that climate is the main factor underlying deglaciation, preventing the build-up of the reservoir area. This is also indicated by the extension of the surge cycle on Spitsbergen (Dowdeswell et al. 1995; Fowler et al. 2001; Małecki et al. 2013) even though an increase in precipitation has been observed, but with a growing role of liquid precipitation. This contributes to the wash-out of the firn layer in the accumulation area and thereby reduces its albedo (Małecki 2013, 2016). Reduction in the Svalbard glaciers albedo (HiRSvaC500-α albedo data set) follows with distinct trend of –0.010 per decade (Möller and Möller 2017). This is accompanied by an increase in summer air temperatures, which in the 21st century have been the highest in the history of measurements in the Arctic, and also the highest in the last 2000 years (Walsh et al. 2011a, b) as well as an increase of the duration of ablation seasons (Laska et al. 2017). As a result, the deglaciation model stresses surface lowering as the key determinant of glaciated surface depletion, which is also emphasised by Kohler et al. (2007) and Ziaja et al. (2016). It adds significantly to the disintegration of huge valley systems into smaller subsystems. The lowering of the surface causes hanging tributary glaciers to be cut off and to function, from that moment on, as separate forms. At the same time, old systems are separated from additional reservoir areas.

Joanna Ewa Szafraniec94
The deglaciation process also intensifies linear recession, which has been, in the 21st century, 2.2 times faster on average than in 1936–2000. This leads to an increase in the average slope of the glacier surface as snouts retreat into higher sections of the valley. The highest retreat vector in absolute terms is observable, in particular, for the SE and S sectors (Fig. 8B), where large glaciers represent a large share. The denivelation of the termini are not high in this case on account of the relatively small slopes of the largest valleys. This follows from the fact that the glacier surface inclination is clearly correlated with surface area and glacier length, even though the correlation has reduced in recent years. An exception is seen with small, compact cirque glaciers, which mainly occupy cirque bottoms, especially those clustered in the centre of the island, where a trend to a decrease in surface slope is observed, even though small glaciers in general tend to have significantly steeper slopes. The group of glaciers with the greatest surface slope demonstrates the greatest deviation from the prevailing trend.
Conclusions
The Arctic amplification has a significant effect on the changes in the geometry of land-terminating glaciers of S and W Spitsbergen, and has contributed to the acceleration of the deglaciation rate in the 21st century. The following conclusions can be drawn from the analysis conducted: 1. The deglaciation of S and W Spitsbergen was determined to a large extent
by the fractal character of the glaciation of that part of the island, resulting chiefly from the network of deep valleys separated by high ridges, which led to the formation of vast, complex glacial systems. Complicated glacier geometry means an extensive zone of interaction between the bedrock, glacier and the atmosphere, and thus also an increased heat exchange zone.
2. The dynamics and the spatial and temporal variability of atmospheric circu-lation resulting from climate change, the radiation factor, and the circulation of Arctic waters add to the role of topography, resulting in an accelerated retreat of glaciers. The main determinant in the deglaciation model is glacier surface thinning, which leads to the separation of branches and division of large glacial systems into smaller ones, mainly of the valley type.
3. The average expansion rate of the proglacial areas of land-terminating glaciers in S and W Spitsbergen in 2000–2014 was 2.75 times higher on average than in the years 1936–2000. It was found that the larger the glacier surface area, the higher the deglaciation rate, but at the same time, the lower the percentage loss of surface area.

Deglaciation rate in the conditions of Arctic amplification 95
4. The most intensive deglaciation is observed in the central part of the island, in the Isfjorden glacial basin, where it has accelerated 3.8 times in the 21st century – this particularly applies to westwards and northwards facing glaciers. The pace of the deglaciation has been the slowest in the case of small mountain glaciers in Nordenskiöld Land and Nathorst Land.
5. The acceleration of deglaciation rate is indicative of the role of climate in the region.
6. Further deglaciation of the area primarily involves the shortening of glaciers, especially the ones at lower elevations. This is reflected by the retreat of termini by an average of 90 m in elevation terms, with the fastest pace in the NW (i.e. among glaciers facing NW) and NE sectors, and the slowest – in the SW and S sectors. The greater continental influence in the island’s interior resulted in the lowering of the upper reach of the glaciers by 26 m on average, with a drop by as many as 50 m in the SE and E sectors. The changes result in a reduction in the surface slopes of the glaciers, especially those with termini facing E, SE and W.
7. The rate of linear recession has seen the greatest acceleration, i.e. three times in the central part of the island, especially for glaciers with termini facing the SE, and has remained stable in NW Spitsbergen.
8. As a result of the separation of tributaries from the main glacial systems, which cuts them off from their accumulation zones and deprives them of their mass, and the structural change in precipitation towards an increasing share of liquid precipitation, the surge cycle is likely to extend, and for many glaciers, die down.
9. The slowdown of the deglaciation rate for small glaciers, especially in the central part of the island, provides evidence of the importance of the geo-metric compactness of the glaciers. The insulating effect of the moraine cover on the ice surface plays a role, too.
10. Some large land-terminating glaciers, including the surging ones as Bungebreen, Kokbreen and Elisebreen, have also seen reduced deglaciation rates in recent years, which, in turn, could be considered as indicative of a quiescent phase of surge.
Acknowledgments. – I wish to thank Wiesława E. Krawczyk (University of Silesia in Katowice) for her valuable comments to the early manuscript. This paper has been created thanks to funds of the Leading National Research Centre (KNOW) received by the Centre for Polar Studies for the period 2014–2018, for which I wish to extend my sincere thanks. I would also like to thank Grzegorz Rachlewicz (Adam Mickiewicz University in Poznań) and Jon Ove Hagen (University of Oslo) for their reviews and all helpful comments and remarks.

Joanna Ewa Szafraniec96
References
BIRKENMAJER K. 1972. Tertiary history of Spitsbergen and continental drift. Acta Geologica Polonica 22: 193–218.
BŁASZCZYK M., JANIA J.A. and KOLONDRA L. 2013. Fluctuations of tidewater glaciers in Hornsund Fjord (Southern Svalbard) since the beginning of the 20th century. Polish Polar Research 34: 327–352.
CLARKE G.K.C., COLLINS S.G. and THOMPSON D.E. 1984. Flow, thermal structure, and subglacial conditions of a surge-type glacier. Canadian Journal of Earth Sciences 21: 232–240.
DOWDESWELL J.A., HODGKINS R., NUTTALL A.-M., HAGEN J.O. and HAMILTON G.S. 1995. Mass balance change as a control on the frequency and occurrence of glacier surges in Svalbard, Norwegian High Arctic. Geophysical Research Letters 22: 2909–2912.
EVANS I.S. and COX N.J. 2005. Global variations of local asymmetry in glacier altitude: separation of north–south and east–west components. Journal of Glaciology 51: 469–482.
EVANS I.S. and COX N.J. 2010. Climatogenic north–south asymmetry of local glaciers in Spitsbergen and other parts of the Arctic. Annals of Glaciology 51: 16–22.
EWERTOWSKI M. 2014. Recent transformations in the high-Arctic glacier landsystem, Ragnarbreen, Svalbard. Geografi ska Annaler 96: 265–285.
FOWLER A.C., MURRAY T. and NG F.S.L. 2001. Thermally controlled glacier surging. Journal of Glaciology 47: 527–538.
FRANCIS J.A. and VAVRUS S.J. 2012. Evidence linking Arctic amplifi cation to extreme weather in mid-latitudes. Geophysical Research Letters 39: L06801.
HAGEN J.O., LIESTØL O., ROLAND E. and JORGENSEN T. 1993. Glacier atlas of Svalbard and Jan Mayen. Meddelelser 129, Oslo: 141 pp + maps.
HAGEN J.O., KOHLER J., MELVOLD K. and WINTHER J.-G. 2003. Glaciers in Svalbard: mass balance, runoff and freshwater fl ux. Polar Research 22: 145–159.
HUANG J., ZHANG X., ZHANG Q., LIN Y., HAO M., LUO Y., ZHAO Z., YAO Y., CHEN X., WANG L., NIE S., YIN Y., XU Y. and ZHANG J. 2017. Recently amplifi ed arctic warming has contributed to a continual global warming trend. Nature Climate Change 7: 875–879.
ISAKSEN K., NORDLI Ø., FØRLAND E.J., ŁUPIKASZA E., EASTWOOD S. and NIEDŹWIEDŹ T. 2016. Recent warming on Spitsbergen – Infl uence of atmospheric circulation and sea ice cover. Journal of Geophysical Research: Atmospheres 121: 11,913–11,931.
KOHLER J., JAMES T.D., MURRAY T., NUTH C., BRANDT O., BARRAND N.E., AAS H.F. and LUCKMAN A. 2007. Acceleration in thinning rate on western Svalbard glaciers. Geophysical Research Letters 34: L18502.
KRUSZEWSKI G. 2004. Changeability in sea surface temperature in the region of Spitsbergen (1982–2002) refl ecting climatic changes observed at present. Problemy Klimatologii Polarnej 14: 79–86 (in Polish).
LASKA M., BARZYCKA B. and LUKS B. 2017. Melting characteristics of snow cover on tidewater glaciers in Hornsund fjord, Svalbard. Water 9: 804.
LÓPEZ-MORENO J.I., BOIKE J., SANCHEZ-LORENZO A. and POMEROY J.W. 2016. Impact of climate warming on snow processes in Ny-Ålesund, a polar maritime site at Svalbard. Global and Planetary Change 146: 10–21.
MAŁECKI J. 2013. Elevation and volume changes of seven Dickson Land glaciers, Svalbard, 1960–1990–2009. Polar Research 32: 18400.
MAŁECKI J. 2016. Accelerating retreat and high-elevation thinning of glaciers in central Spitsbergen. The Cryosphere 10: 1317–1329.

Deglaciation rate in the conditions of Arctic amplification 97
MAŁECKI J., FAUCHERRE S. and STRZELECKI M.C. 2013. Post-surge geometry and thermal structure of Hørbyebreen, central Spitsbergen. Polish Polar Research 34: 305–321.
MEIER W.N., GERLAND S., GRANSKOG M.A. and KEY J.R. 2011. Sea ice. In: Snow, Water, Ice and Permafrost in the Arctic (SWIPA): Climate Change and Cryosphere. Arctic Monitoring and Assessment Programme (AMAP), Oslo: 357–443.
MÖLLER M. and MÖLLER R. 2017. Modeling glacier-surface albedo across Svalbard for the 1979–2015 period: The HiRSvaC500-α data set. Journal of Advances in Modeling Earth Systems 9: 404–422.
MÖLLER M., OBLEITNER F., REIJMER C.H., POHJOLA V.A., GŁOWACKI P. and KOHLER J. 2016. Adjustment of regional climate model output for modelling the climatic mass balance of all glaciers on Svalbard. Journal of Geophysical Research: Atmospheres 121: 5411–5429.
NUTH C., KOHLER J., KÖNIG M., VON DESCHWANDEN A., HAGEN J.O., KÄÄB A., MOHOLDT G. and PETTERSSON R. 2013. Decadal changes from a multi-temporal glacier inventory of Svalbard. The Cryosphere 7: 1603–1621.
OLSEN M.S., CALLAGHAN T.V., REIST J.D., REIERSEN L.O., DAHL-JENSEN D., GRANSKOG M.A., GOODISON B., HOVELSRUD G.K., JOHANSSON M., KALLENBORN R., KEY J., KLEPIKOV A., MEIER W., OVERLAND J.E., PROWSE T.D., SHARP M., VINCENT W.F. and WALSH J. 2011. The Changing Arctic Cryosphere and Likely Consequences: An Overview. AMBIO 40: 111–118.
OVERLAND J.E. and WANG M. 2010. Large-scale atmospheric circulation changes are associated with the recent loss of Arctic sea ice. Tellus 62A: 1–9.
OVERLAND J.E., WANG M., WALSH J.E., CHRISTENSEN J.H., KATTSOV V.M. and CHAPMAN W.L. 2011. Climate Model Projections for the Arctic. In: Snow, Water, Ice and Permafrost in the Arctic (SWIPA): Climate Change and Cryosphere. Arctic Monitoring and Assessment Programme (AMAP), Oslo: 37–54.
PAVLOV A.K., TVERBERG V., IVANOV B.V., NILSEN F., FALK-PETERSEN S. and GRANSKOG M.A. 2013. Warming of Atlantic Water in two west Spitsbergen fjords over the last century (1912–2009). Polar Research 32: 11206.
PIECHURA J. and WALCZOWSKI W. 2009. Warming of the West Spitsbergen Current and sea ice north of Svalbard. Oceanologia 51: 147–164.
RACHLEWICZ G., SZCZUCIŃSKI W. and EWERTOWSKI M. 2007. Post-“Little Ice Age” retreat rates of glaciers around Billefjorden in central Spitsbergen, Svalbard. Polish Polar Research 28: 159–186.
RASMUSSEN S.H. 2006. Deglaciation dynamics following the Little Ice Age on Svalbard: Implication of debris-covered glaciers dynamic and morphological setting. Term project, The Quaternary history of Svabard, AG 210. The University Centre of Svalbard: 15 pp.
REIS A.H. 2006. Constructal theory: from engineering to physics, and how fl ow systems develop shape and structure. Applied Mechanics Reviews 59: 269–282.
SOBOTA I., NOWAK M. and WECKWERTH P. 2016. Long-term changes of glaciers in north-western Spitsbergen. Global and Planetary Change 144: 182–197.
STROEVE J.C., SERREZE M.C., HOLLAND M.M., KAY J.E., MALANIK J. and BARRETT A.P. 2012. The Arctic’s rapidly shrinking sea ice cover: A research synthesis. Climatic Change 110: 1005–1027.
SZAFRANIEC J. 2002. Infl uence of positive degree-days and sunshine duration on the surface ablation of Hansbreen, Spitsbergen glacier. Polish Polar Research 23: 227–240.
WALCZOWSKI W., PIECHURA J., GOSZCZKO I. and WIECZOREK P. 2012. Changes in Atlantic water properties: an important factor in the European Arctic marine climate. ICES Journal of Marine Science 69: 864–869.
Joanna Ewa Szafraniec98
WALSH J.E., OVERLAND J.E., GROISMAN P.Y. and RUDOLF B. 2011a. Arctic Climate: Recent Variations. In: Snow, Water, Ice and Permafrost in the Arctic (SWIPA): Climate Change and Cryosphere. Arctic Monitoring and Assessment Programme (AMAP), Oslo: 23–35.
WALSH J.E., OVERLAND J.E., GROISMAN P.Y. and RUDOLF B. 2011b. Ongoing Climate Change in the Arctic. AMBIO 40: 6–16.
ZIAJA W. and PIPAŁA R. 2007. Glacial recession 2001–2006 and its landscape effects in the Lindströmfjellet-Håbergnuten mountain ridge, Nordenskiöld Land, Spitsbergen. Polish Polar Research 28: 237–247.
ZIAJA W., DUDEK J. and OSTAFIN K. 2016. Landscape transformation under the Gåsbreen glacier recession since 1899, southwestern Spitsbergen. Polish Polar Research 37: 155–172.
Received 22 June 2017Accepted 11 December 2017