Titeldia - MVO · 2016-07-04 · 1. Botlek Tank Terminal 21 70,000 2. Maastank 64 48,000 3. Koole...
37
Vegoil presentation 2016 Jaap van Dalen
Transcript of Titeldia - MVO · 2016-07-04 · 1. Botlek Tank Terminal 21 70,000 2. Maastank 64 48,000 3. Koole...

Titeldia
Vegoil presentation 2016
Jaap van Dalen

Custom (Wit)
Port and industrial area
|2
Over 40 kms!

Afbeelding (XL)
Port development
1400 - 1800
1800 - 1900
1906 - 1922
1934 - 1946
1929 - 1949
1948 - 1957
1960 - 1970
1970 - 2008
2008 - 2030
|3

Tekst + afbeelding (M)
Maasvlakte 2
• Gross size: 2,000 ha
(= 20% expansion of port)
• Use: containers, industry, and offshore
• Investment so far: some € 1.5 billion
• Access via Yangtzehaven: 600 m. wide and
20 m. deep
|4
Maasvlakte 2
Afbeelding (XL) 4x
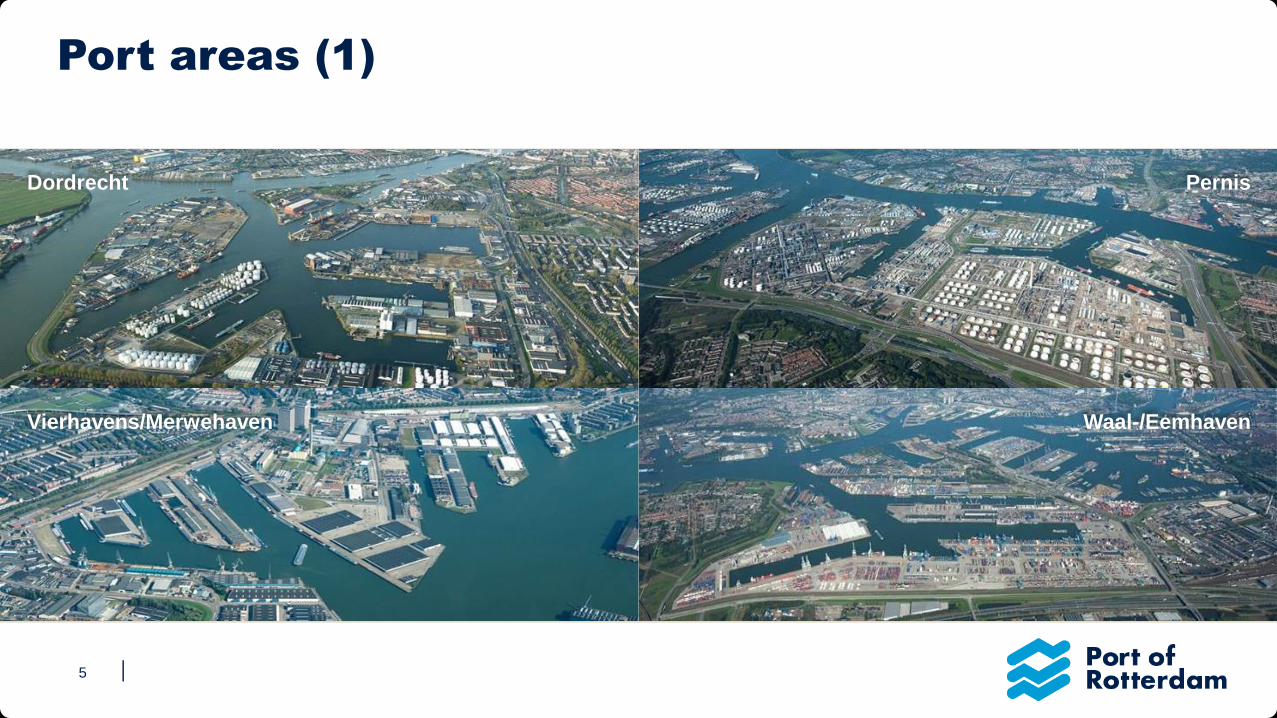
Port areas (1)
|5
Waal-/EemhavenVierhavens/Merwehaven
PernisDordrecht

Afbeelding (XL) 4x
Port areas (2)
|6
Maasvlakte 2Europoort
BotlekMaasvlakte 1

Tekst + afbeelding (S)
Port in figures
Port of Rotterdam engine of the economy
• Total port area 12,500 ha (net 6,000 ha)
• Total employment 180,000 people
• Total added value € 21 billion (3.2% GNP)
• 4,000 companies
• Largest port in Europe, 8th port worldwide
• Throughput approx. 465 million tons;12 million TEU (containers)
• Depth up to 75 ft (= 24 m)
|7
Employment

Tekst + afbeelding (S)
Port Authority
• Non-listed public ltd company
• Municipality (70%), State (30%)
• Approx. € 700 mln revenues, € 250 mln investments
• 1,100 staff
• Main responsiblities:
• Development, construction and management of port &
industrial area
• Efficient & safe vessel traffic management
|8
Employment

Object (XL)
2015: Record throughput, +21 million tons (+5%)
|9
x 1 million tons
435
442 441445
466
400
410
420
430
440
450
460
470
480
2011 2012 2013 2014 2015
+5%

Object (XL)
Throughput by segment 2015
|10
48%
27%
19%
6%
Liquid bulk
Containers
Dry bulk
Breakbulk
Object (XL)
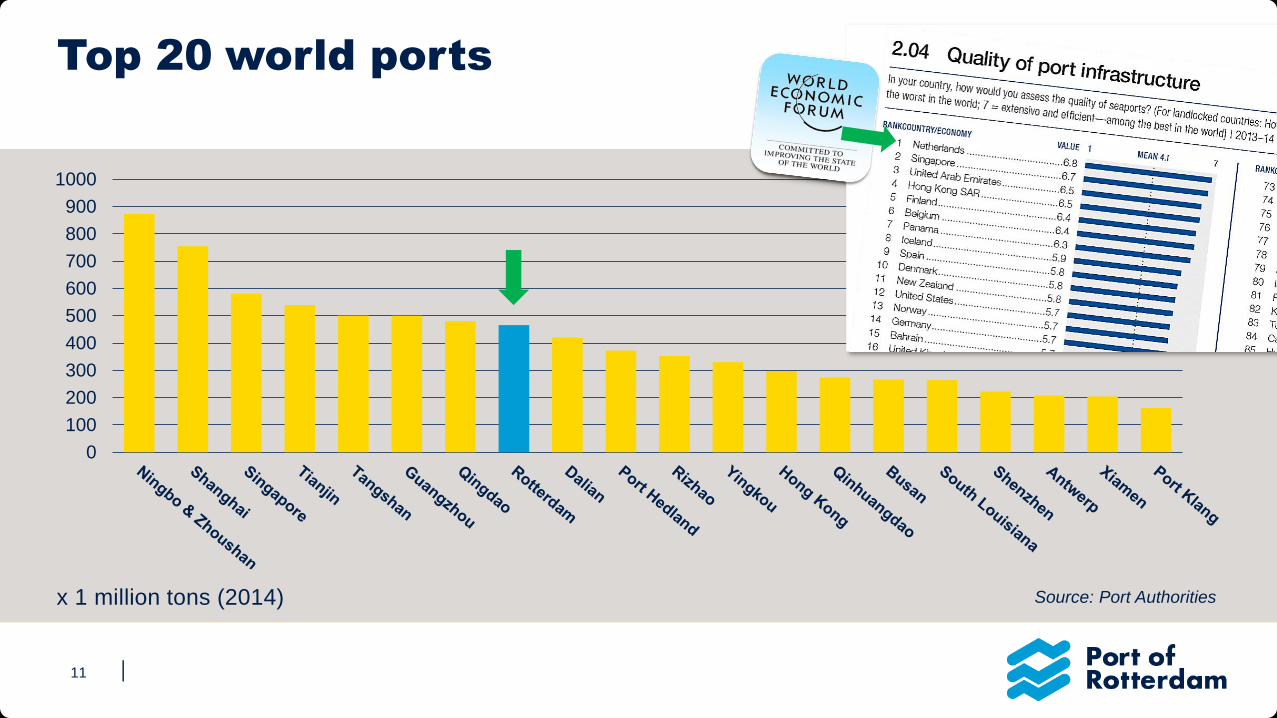
Top 20 world ports
|11
0
100
200
300
400
500
600
700
800
900
1000
x 1 million tons (2014) Source: Port Authorities

Afbeelding (XXL) + Tekstkader (Linksboven)
|12
Mission:
The Port of Rotterdam Authority createseconomic and social value by workingtogether with clients and stakeholders on the realisation of sustainable growth in Rotterdam’s world-class port.

Afbeelding (XL)
Port Authority investment projects 2015/16
|13
Quay Koole
Buoys and Dolphins
Calandkanaal
Stenaline 2e berth
LNG Breakbulk
terminal
Maasvlakte Plaza
RDM Heavy forge
Patrol boats
Quay wall UWT
Western connectionroad Heijplaat
Marcor
Sif - Verbrugge
Container Exchange
RouteTheemsweg route
Coolport
Plans for CER and Theemsweg route subject to approval by shareholders
Breeddiep
Nieuwe Waterweg

Tekst + Object (L)
High level of investments by private sector and
Port Authority
• Largest investments by Port
Authority in 2015:
− LNG Breakbulk Terminal, UWT
quay wall, RDM, buoys and
dolphins, LBC jetty, Sif Verbrugge
− Ratio of Port Authority to private
sector investments is 1:7
• In 2016, the Port Authority will
be investing approximately
€ 200 mln
|14
0
500
1000
1500
2000
2500
3000
3500
2011 2012 2013 2014 2015 2016 2017
Private sector Port of Rotterdam Authority
In million €

Titeldia
VEGOILS

16© Copyright - Port of Rotterdam - 2012
Liquid bulk 2015: 225 mln tons
crude oil 103
mineral oil products 89
other liquid bulk 31
LNG; 2.3
17© Copyright - Port of Rotterdam - 2012
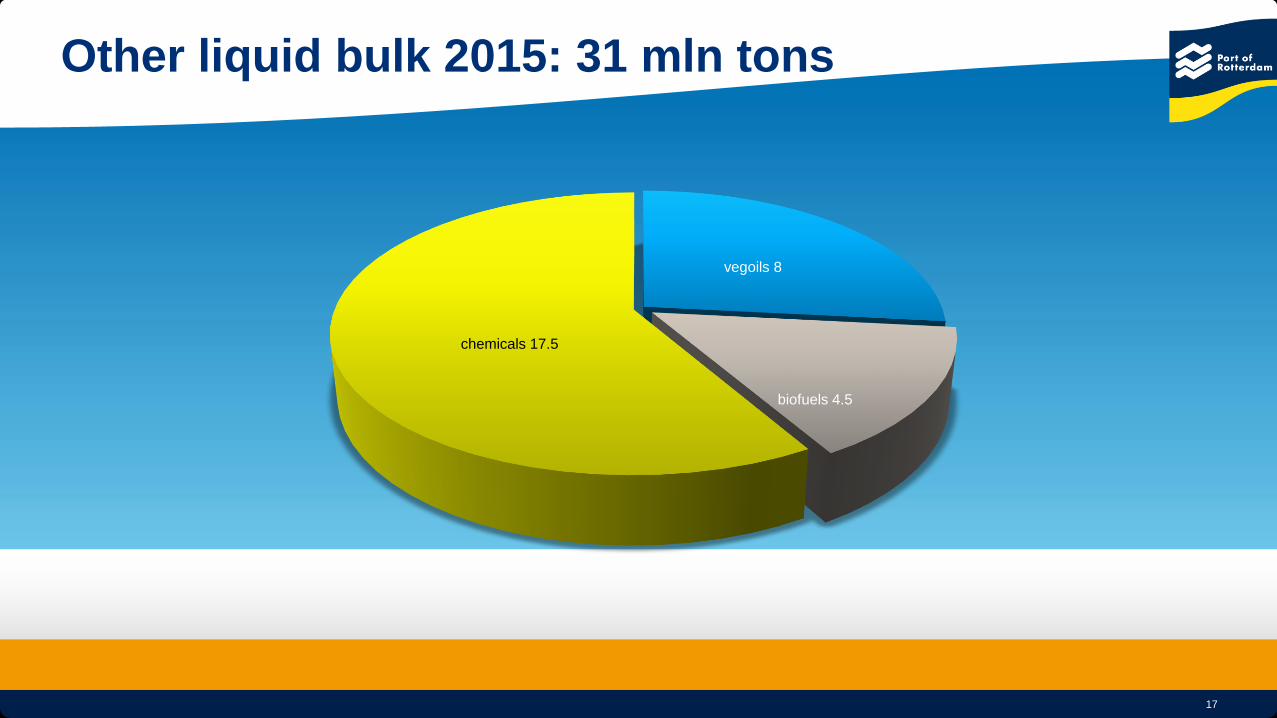
Other liquid bulk 2015: 31 mln tons
vegoils 8
biofuels 4.5
chemicals 17.5

18© Copyright - Port of Rotterdam - 2012
NL imports by country
vegoils 8
biofuels 5chemicals 20.5

19© Copyright - Port of Rotterdam - 2012
Rotterdams’ position at start of century
• Superior accessibility
• Extensive tankterminal capacity for liquids
• Extensive agribulk sector including terminals, trading,
service providers
• Food processing sector nearby
• Existing refining capacity (Rotterdam, Zwijndrecht)
And a Port Authority willing to invest !

20© Copyright - Port of Rotterdam - 2012
Developments
• Increase demand from food sector for vegetable oils
• Relocation of crushing to oilseed producing countries
• Relocation of vegoil refining capacity to Europe
• European biodiesel production
• Investments in storage and refining capacity
• Increase in demand for edible oil logistics
• Increase in vesselsize
21© Copyright - Port of Rotterdam - 2012
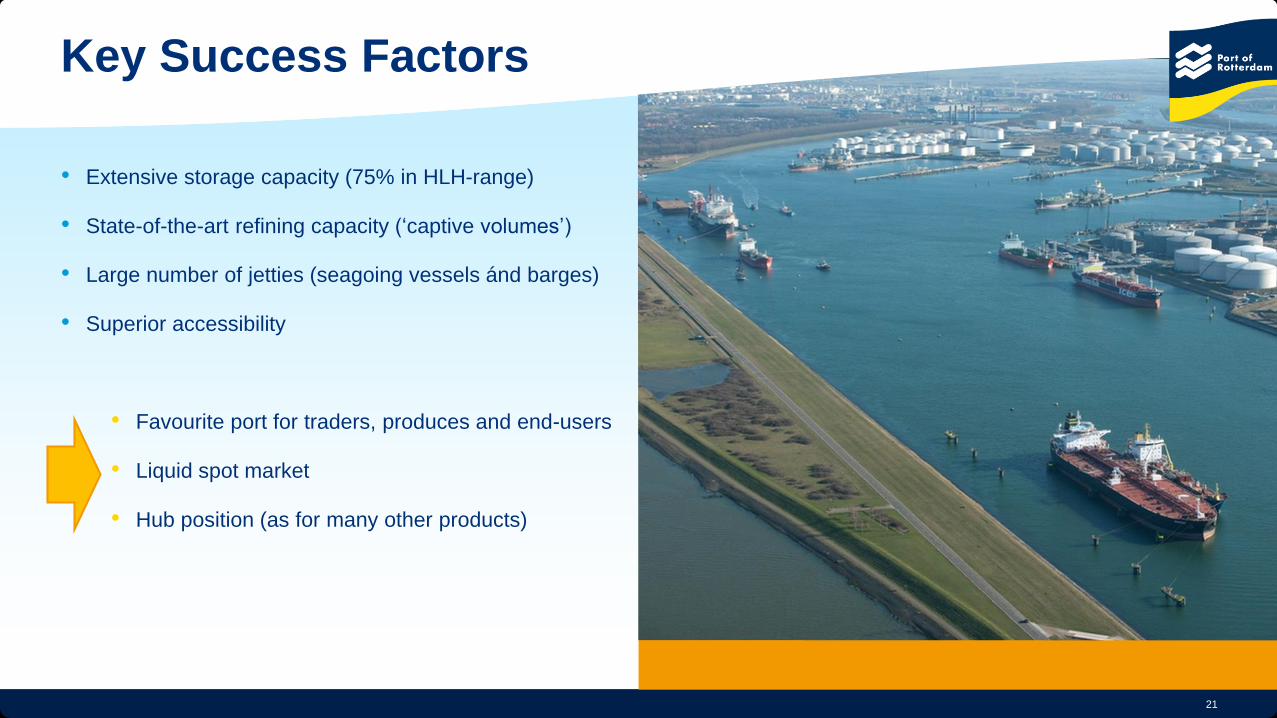
Key Success Factors
• Extensive storage capacity (75% in HLH-range)
• State-of-the-art refining capacity (‘captive volumes’)
• Large number of jetties (seagoing vessels ánd barges)
• Superior accessibility
• Favourite port for traders, produces and end-users
• Liquid spot market
• Hub position (as for many other products)

March 2011
1 2 3
Company capacity in MT/YR
1. Neste Oil NExBTL Plant 0.8 mln
2. IOI-Loders Croklaan 1.2 mln
3. ADM soybean/rapeseed crusher 2.4 mln

March 20113
Company capacity in MT/YR
1. Cargill 900,000
2. MaasRefinery 40,000
3. Wilmar Edible Oils 750,000
4. (Unimills) Sime Darby 450,000
Refineries
32
1
Tankstorage vegoils
Company tanks cap. in m3
1. Botlek Tank Terminal 21 70,000
2. Maastank 64 48,000
3. Koole Tankstorage Pernis 270 + 625,000
4. Vopak Vlaardingen 351 + 565,000
4
21
4
Biodiesel plants
Company refinery capacity in MT/YR
1. Biopetrol 400,000
2. Biopetrol 200,000
3. CleanerG 200,0001 2
3

24© Copyright - Port of Rotterdam - 2012
Koole
• Terminal operator with interest in shipping
• Majority shareholder: EQT
• Large investments during last decade
• Capacity some 625,000 m3
• 11 berths, including 3 for seagoing vessels

25© Copyright - Port of Rotterdam - 2012
Maastank
• Owned by Dekker
• Smaller tankterminal dedicated to specialised vegoils
and oleochemicals
• 60 heating points for the heating of ISO’s /flexibags and
tanktrucks (both steam and warmwater)
• New plot of land allows tankstorage to increase from
48,000 m3 (64 tanks) to 90,000 m3 in the future
• Seajetty has been upgraded to accommodate
55,000 dwt vessels; draft > 10 meters

26© Copyright - Port of Rotterdam - 2012
Vopak
• Part of Royal Vopak, the largest independent operator
of tankstorage
• In operation for more than 80 years
• 351 tanks with a capacity of some 565,000 m3
• 11 berths, including 5 for coasters & other
seagoing vessels

27© Copyright - Port of Rotterdam - 2012
Botlek Tank Terminal
• Formerly Maas Silo, located in Botlek
• Fully owned by HES
• Recently enlargement (50,000 m2 by land reclamation)
allows storage capacity to be expanded from
200,000 m3 to 750,000 m3
• 420 meters jetty (13.85 m draft); 8 berths

28© Copyright - Port of Rotterdam - 2012

29© Copyright - Port of Rotterdam - 2012
IOI – Loders Croklaan
• State-of-the-art palm oil refinery (800,000 t/yr)
opened in 2005
• Mid 2010: additional capacity (350,000 t/yr) and
enzymic interesterification capacity (100,000 t/yr)
• Tankcapacity doubled to 200,000 m3

30© Copyright - Port of Rotterdam - 2012
Cargill
• Refinery with nearly 1 mln t / year capacity
• Feedstock: palm oil, palm kernel, rapeseed, cocos oil
• 2 recent projects:
• berth upgraded to receive Panamax vessels
(11,65 m 15 m draft)
• additional land (30,000 m2)

31© Copyright - Port of Rotterdam - 2012

32© Copyright - Port of Rotterdam - 2012
Wilmar Edible Oils
• State-of-the art refinery (300,000 t/yr) started 2005
• 2nd refinery (additional capacity 450,000 t/yr)
started Q4 2009
• Inbound/outbound logistics via
Koole Tankstorage Pernis
• Trading office for refined oils, biodiesel and
oleochemicals located in centre Rotterdam
• New investment: fatty-alcohol plant (Huntsman site)

33© Copyright - Port of Rotterdam - 2012
MaasRefinery
• Shareholder: Remia
• Specialties toll refinery; started Q4 2009
• Batches of min. 5 t; annual capacity some 40,000 t/yr
• Logistics outsourced to Maastank

34© Copyright - Port of Rotterdam - 2012
Sime Darby Unimills
• Supplier of tailor-made natural vegetable
oil-based ingredients
• Deodorization capacity around 450,000 t/yr
• All processes on one site: refining, double-
fractionation, flaking and enzyme technology.
Also lecithin production, based on enzymatic
hydrolysis and fractionation
• A few years ago: expansion of tankfarm,
100,000 t/yr enzymatic arrangement plant,
innovation center (€ 35 mln project)

35© Copyright - Port of Rotterdam - 2012
Neste Oil: production NExBTL
• Operational since Q4 2011
• Investment: nearly € 700 mln
• Capacity: 800,000 tons /year
• Feedstock: various vegoils, by-products of vegetable oil
refining, waste animal fats

36© Copyright - Port of Rotterdam - 2012
To summarise
• Rotterdam gained a very strong position in the
Vegetable Oils sector
• Private companies invested heavily in past 10 years
• All major companies have a presence in Rotterdam
• Continuous investment by refineries, tankstorage
companies and the Port Authority will further improve
superior position
37© Copyright - Port of Rotterdam - 2012
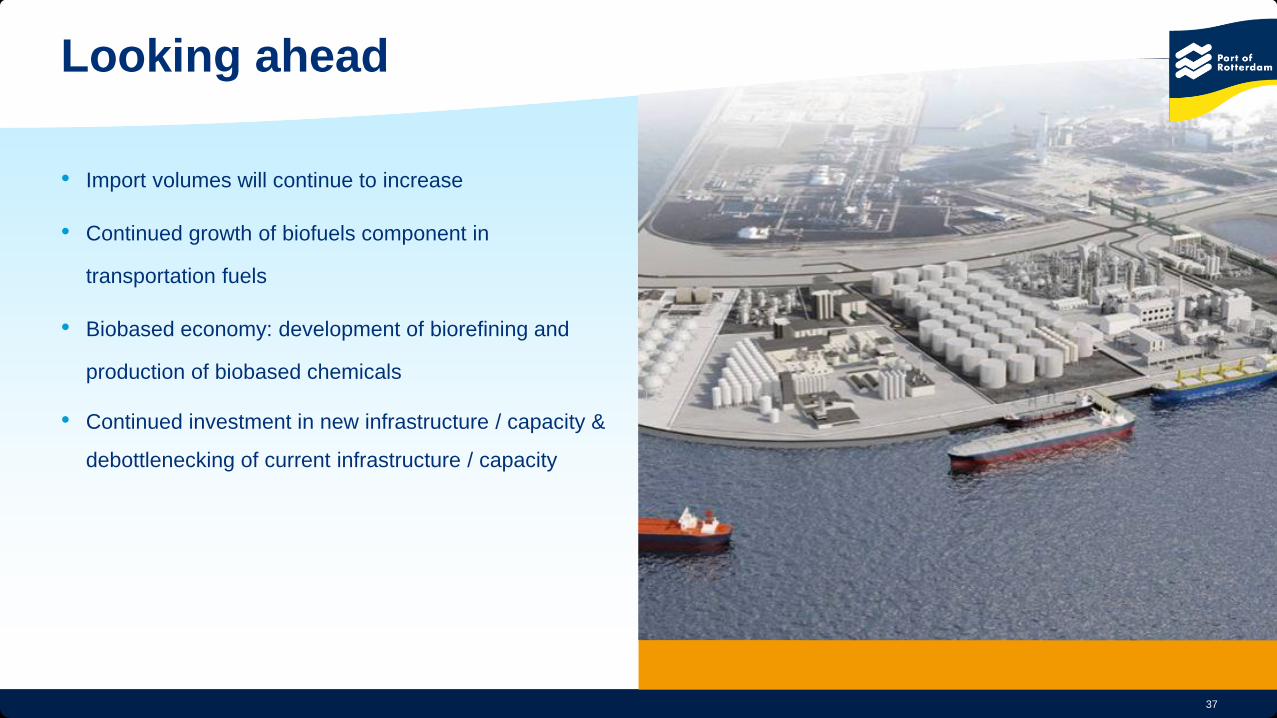
Looking ahead
• Import volumes will continue to increase
• Continued growth of biofuels component in
transportation fuels
• Biobased economy: development of biorefining and
production of biobased chemicals
• Continued investment in new infrastructure / capacity &
debottlenecking of current infrastructure / capacity