
Tips and Tricks for Optimising Excel
77
www.hanrickcurran.com.au Optimising Excel™ Using Excel™ to optimise decision making and avoiding common problems with spreadsheets and financial analysis June 2014
-
Upload
hanrick-curran -
Category
Business
-
view
275 -
download
11
description
Tips and Tricks for Optimising and Using Excel - avoid common problems with spreadsheets and analysis
Transcript of Tips and Tricks for Optimising Excel
www.hanrickcurran.com.au
Optimising Excel™
Using Excel™ to optimise decision making and avoiding common problems with spreadsheets and financial analysis
June 2014

2experience. new thinking
Todays presenters

3experience. new thinking
Today’s agenda
Learning’s from implementing FAST at Wilmar with Gerard Cooney
Common problems seen in practice with Matthew Green
Spreadsheet Detective and its review abilities with Anthony Berglas
4experience. new thinkingexperience. new thinking 4
Insights from implementing the FAST standard at Wilmar SugarGerard Cooney
Implementing FAST

5experience. new thinkingexperience. new thinking 5
A review of the implementation of the FAST modelling standard at Wilmar Sugar – Gerard Cooney(fomerly Sucrogen and CSR Sugar)
Implementing FAST
6experience. new thinking
The Problem
Excel is ubiquitous in business User friendly Very flexible
These attractive attributes cause problems: Everyone thinks they can use excel
effectively Models structured using the idiosyncrasies of
the user The result is often a mess
7experience. new thinking
Key Problems
Every model is structured differently Difficult to review and audit Prone to errors Difficult to modify Difficult to understand
8experience. new thinking
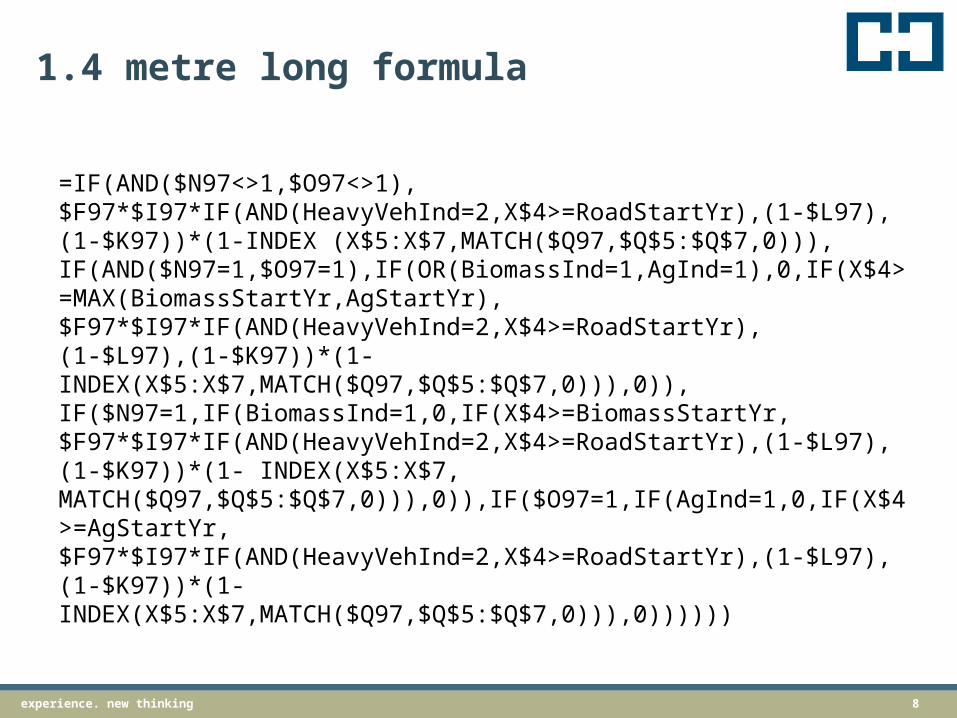
1.4 metre long formula
=IF(AND($N97<>1,$O97<>1),$F97*$I97*IF(AND(HeavyVehInd=2,X$4>=RoadStartYr),(1-$L97),(1-$K97))*(1-INDEX (X$5:X$7,MATCH($Q97,$Q$5:$Q$7,0))),IF(AND($N97=1,$O97=1),IF(OR(BiomassInd=1,AgInd=1),0,IF(X$4>=MAX(BiomassStartYr,AgStartYr), $F97*$I97*IF(AND(HeavyVehInd=2,X$4>=RoadStartYr),(1-$L97),(1-$K97))*(1-INDEX(X$5:X$7,MATCH($Q97,$Q$5:$Q$7,0))),0)),IF($N97=1,IF(BiomassInd=1,0,IF(X$4>=BiomassStartYr,$F97*$I97*IF(AND(HeavyVehInd=2,X$4>=RoadStartYr),(1-$L97),(1-$K97))*(1- INDEX(X$5:X$7,MATCH($Q97,$Q$5:$Q$7,0))),0)),IF($O97=1,IF(AgInd=1,0,IF(X$4>=AgStartYr,$F97*$I97*IF(AND(HeavyVehInd=2,X$4>=RoadStartYr),(1-$L97),(1-$K97))*(1-INDEX(X$5:X$7,MATCH($Q97,$Q$5:$Q$7,0))),0))))))
9experience. new thinking
THE FAST STANDARD
What does it stand for? Flexible Accurate Structured Transparent
http://www.fast-standard.org/
10experience. new thinking
FLEXIBLE
Design and modelling techniques must allow models to be both flexible in the immediate term and adaptable in the longer term.
Flexibility is born of simplicity.
11experience. new thinking
APPROPRIATE/ACCURATE
Models must reflect key business assumptions directly and faithfully without being over-built or cluttered with unnecessary detail.
12experience. new thinking
STRUCTURED
Rigorous consistency in model layout and organization is essential to retain a model’s logical integrity over time, particularly as a model’s author may change.
13experience. new thinking
TRANSPARENT
Simple, clear formulas that can be understood by other modellers and non-modellers alike. Confidence in a financial model’s integrity can only be assured with clarity of logic structure and layout.
14experience. new thinking
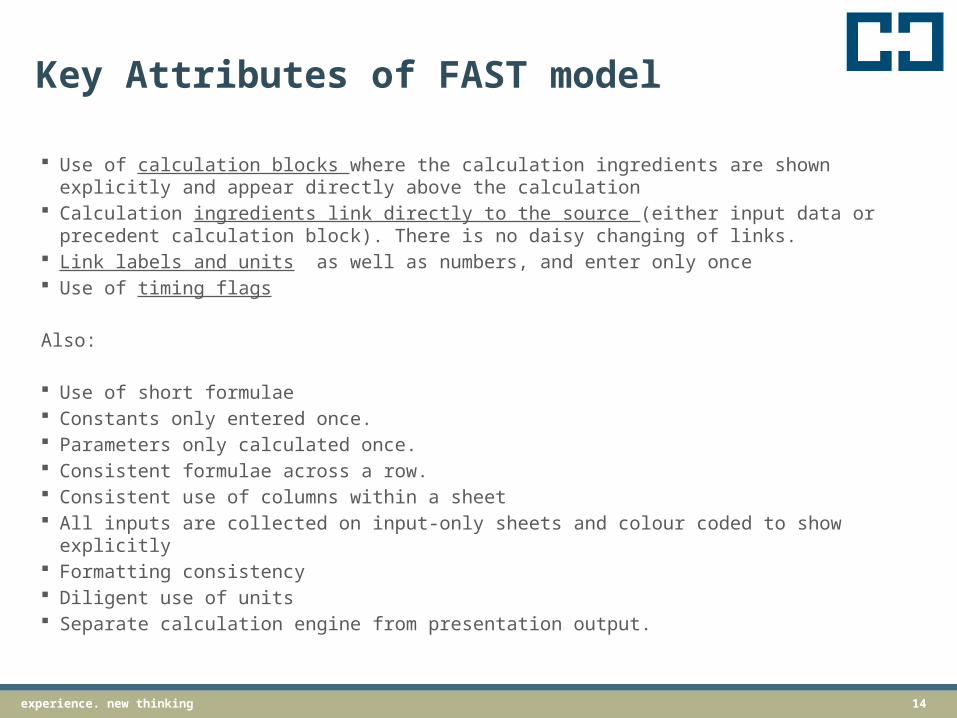
Key Attributes of FAST model
Use of calculation blocks where the calculation ingredients are shown explicitly and appear directly above the calculation
Calculation ingredients link directly to the source (either input data or precedent calculation block). There is no daisy changing of links.
Link labels and units as well as numbers, and enter only once Use of timing flags
Also:
Use of short formulae Constants only entered once. Parameters only calculated once. Consistent formulae across a row. Consistent use of columns within a sheet All inputs are collected on input-only sheets and colour coded to show explicitly Formatting consistency Diligent use of units Separate calculation engine from presentation output.
15experience. new thinking
Key Attributes of FAST model
Use of calculation blocks where the calculation ingredients are shown explicitly and appear directly above the calculation
Calculation ingredients link directly to the source (either input data or precedent calculation block). There is no daisy changing of links.
Link labels and units as well as numbers, and enter only once
Use of timing flags
16experience. new thinking
Secondary Attributes of FAST model
Use of short formulae Constants only entered once. Parameters only calculated once. Consistent formulae across a row. Consistent use of columns within a sheet All inputs are collected on input-only sheets
and colour coded to show explicitly Formatting consistency Diligent use of units Separate calculation engine from presentation
output.
17experience. new thinking
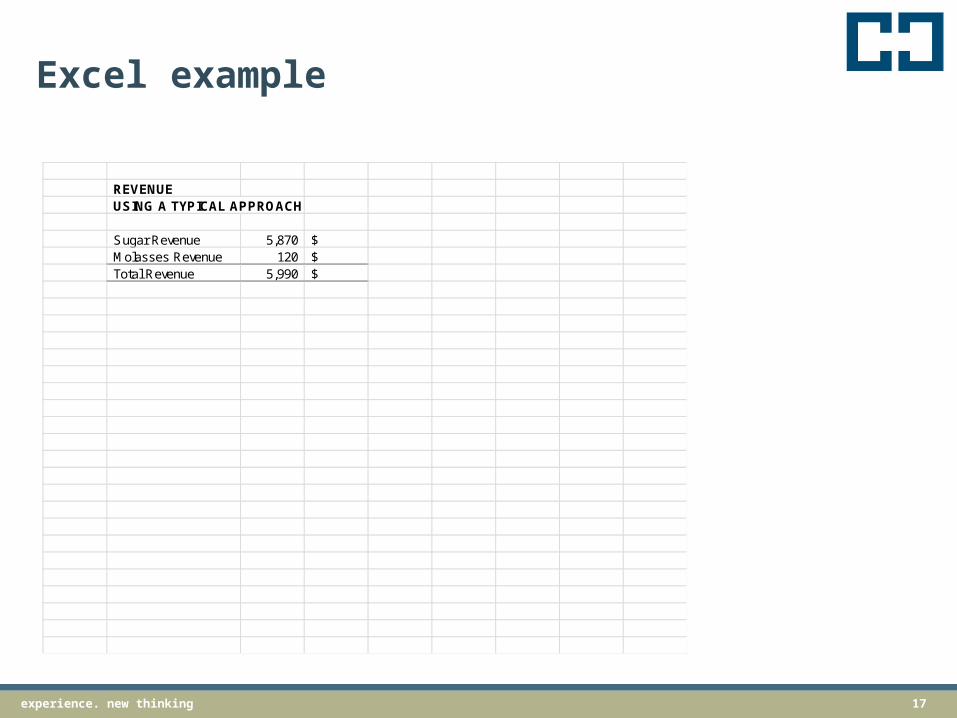
Excel example
REVENUE USING A TYPICAL APPROACH
Sugar Revenue 5,870 $ Molasses Revenue 120 $ Total Revenue 5,990 $
18experience. new thinking
Common Complaints
Doesn’t a standard approach stifle creativity It takes too long to model using the FAST
Standard
19experience. new thinking
Resources
http://www.fast-standard.org/
http://info.f1f9.com/31-day-financial-modelling-course
http://www.fi-mech.com/
http://www.financialmodellinghandbook.com/
20experience. new thinkingexperience. new thinking 20
Understanding the common issues we see with Excel™ spreadsheets, some conceptual insight into how errors occur and some suggestions on how to prevent them…Matthew Green
Common issues with Excel™ spreadsheets and models
21experience. new thinking
My agenda
How prevalent is Excel™ Common problems Error research The need for graphical presentation of data 7 steps to review your spreadsheets Practical learning's and takeaways

22experience. new thinking
Typical balance sheet
Excel used in the following key areas and calculations: Account reconciliations Other asset listings and
amortisation Fixed asset registers and
depreciation Deferred and current tax Intangible asset reconciliations Impairment models Debt covenants Interest accruals Employee benefits Derivative reconciliations and to
cross check bank valuations Spreadsheets for transactional
reports with Pivot tables for further analysis
Consolidation schedules
23experience. new thinkingexperience. new thinking 23
"I suppose it is tempting, if the only tool you have is a hammer, to treat everything as if it were a nail."
Abraham Maslow, 1966

24experience. new thinking
Excel & Accountants …“like giving your kid a chainsaw, powerful tool, but does he really understand what he’s got in his hands and how to use it?” You have to ask yourself: “Is this going to end well?” (And “No, he’s not getting one for Christmas!”)
25experience. new thinking
How many problems really exist?
“In our experience, most spreadsheets are poorly developed. This is probably because there isn’t much formal training on how to build a spreadsheet and people don’t have time to build them so that they are optimised for their purpose and to support decision making.”
Want to see some examples?
26experience. new thinking
Common problems
Confusing, complicated formula Unstructured layout Formula & Function errors Range & Pointing errors Hard coding Remote references Empty precedents
27experience. new thinking
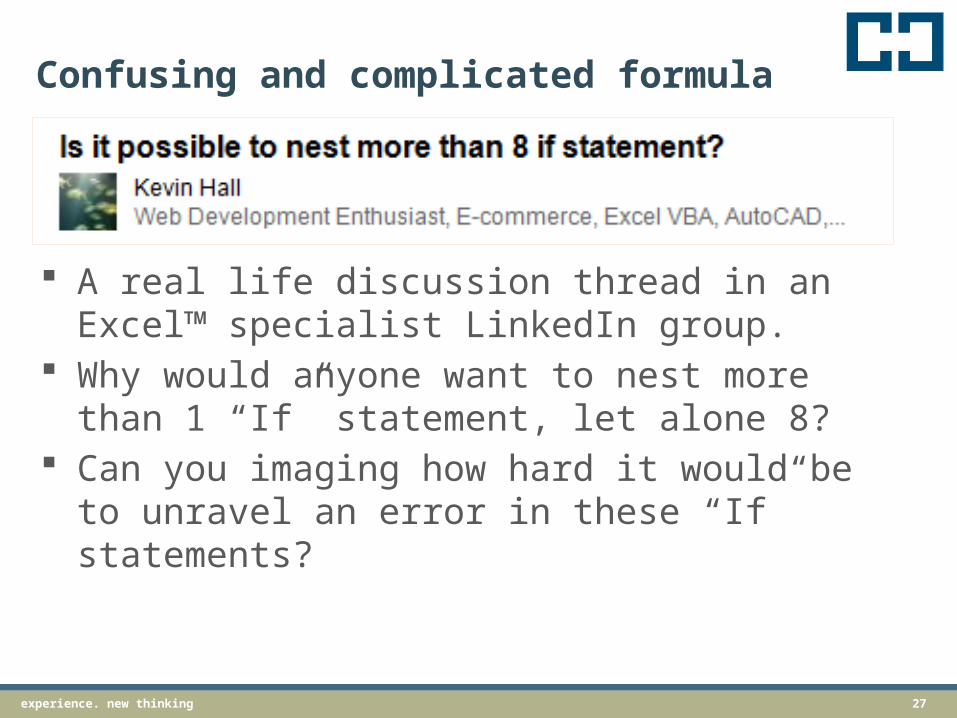
Confusing and complicated formula
A real life discussion thread in an Excel™ specialist LinkedIn group.
Why would anyone want to nest more than 1 “If” statement, let alone 8?
Can you imaging how hard it would be to unravel an error in these “If” statements?
28experience. new thinking
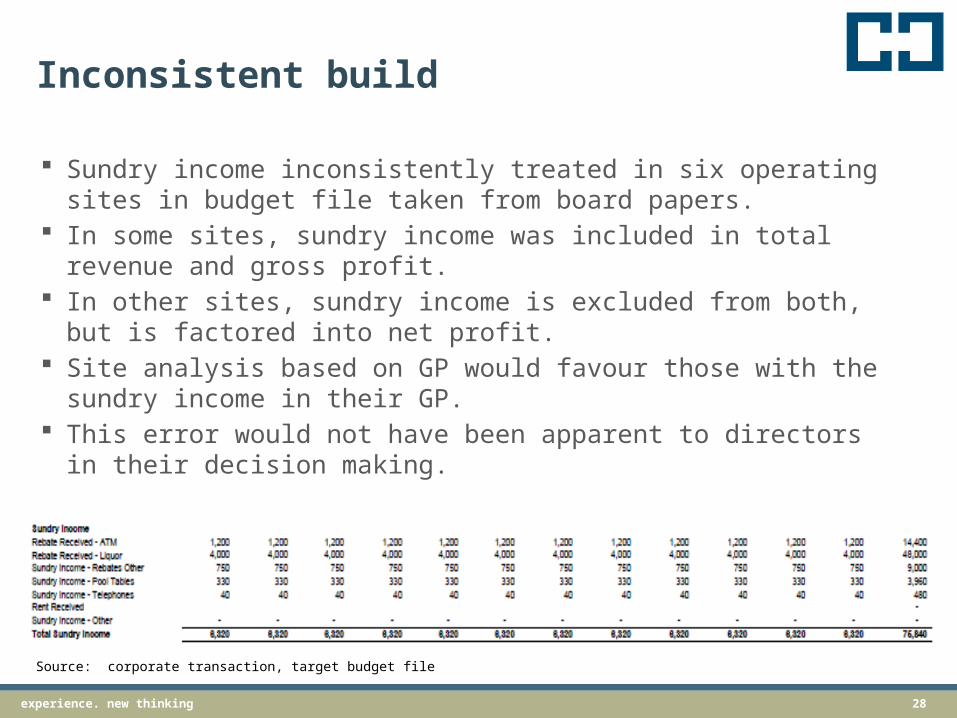
Inconsistent build
Sundry income inconsistently treated in six operating sites in budget file taken from board papers.
In some sites, sundry income was included in total revenue and gross profit.
In other sites, sundry income is excluded from both, but is factored into net profit.
Site analysis based on GP would favour those with the sundry income in their GP.
This error would not have been apparent to directors in their decision making.
Source: corporate transaction, target budget file
29experience. new thinking
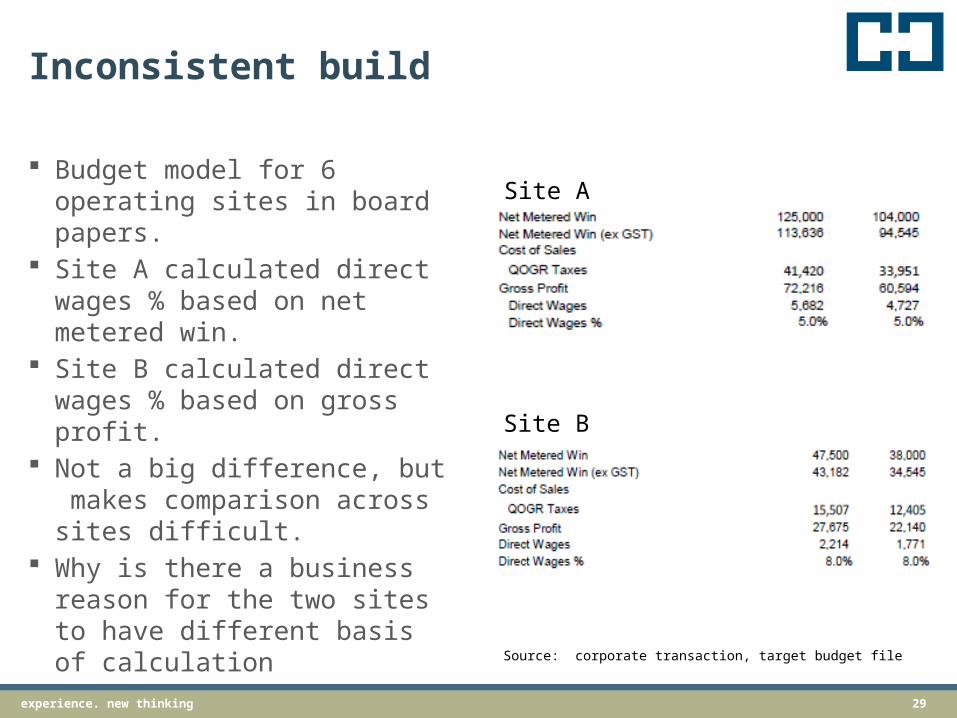
Inconsistent build
Budget model for 6 operating sites in board papers.
Site A calculated direct wages % based on net metered win.
Site B calculated direct wages % based on gross profit.
Not a big difference, but makes comparison across sites difficult.
Why is there a business reason for the two sites to have different basis of calculation
Site A
Site B
Source: corporate transaction, target budget file
30experience. new thinking
Hard coding and format
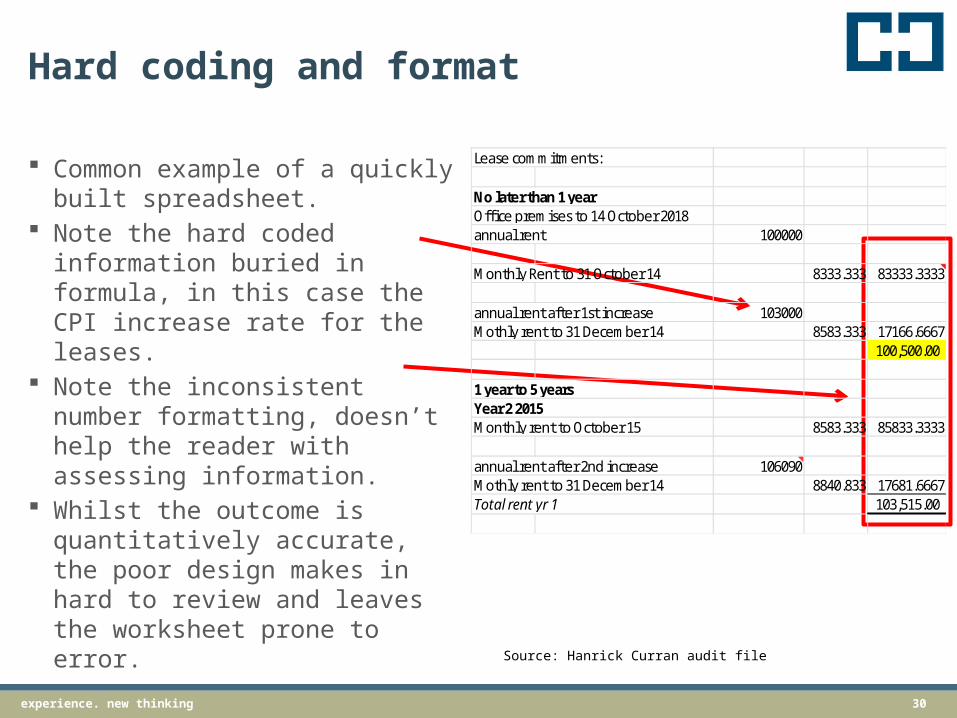
Common example of a quickly built spreadsheet.
Note the hard coded information buried in formula, in this case the CPI increase rate for the leases.
Note the inconsistent number formatting, doesn’t help the reader with assessing information.
Whilst the outcome is quantitatively accurate, the poor design makes in hard to review and leaves the worksheet prone to error.
Lease commitments:
No later than 1 yearOffi ce premises to 14 October 2018annual rent 100000
Monthly Rent to 31 October 14 8333.333 83333.3333
annual rent after 1st increase 103000Mothly rent to 31 December 14 8583.333 17166.6667
100,500.00
1 year to 5 years Year 2 2015Monthly rent to October 15 8583.333 85833.3333
annual rent after 2nd increase 106090Mothly rent to 31 December 14 8840.833 17681.6667Total rent yr 1 103,515.00
Source: Hanrick Curran audit file

31experience. new thinking
Hard coding
Commonly seen on ad hoc spreadsheets. Typically involves a formula like:
= C5 * (A36 + 1.03) – 408 + 12 The reviewer can usually decipher that the 1.03 is
probably CPI, but what about the other adjustments. A better way is to put the CPI number in its own cell
as an input. Hard coded adjustments should also be avoided. If
needed, build data entry cells for adjustments.Example of problem use of hard coding
Source: Hanrick Curran client board reporting file

32experience. new thinking
Remote references
A “remote reference” is a reference in a formula to cells that are remote from the worksheet the formula is on, either to another worksheet in the same file or to a different file.
Remote references are difficult to review and prone to errors. We recommend they be avoided by using a ‘links sheet’ in a
workbook for all ‘cross-file links’. Formula within a workbook should also avoid remote
references by gathering all needed data and then using the formula
Source: Hanrick Curran client board reporting file
Source: Hanrick Curran client board reporting file
Example of problem use of remote references
Example of corrected approach to use of remote references

33experience. new thinking
How big can the errors get?
In January 2010, academics Carmen Reinhart and Kenneth Rogoff published “Growth in a Time of Debt”.
Their report was widely cited by politicians as theoretical and research based support for reducing public debt and public spending.
Later analysis reveals errors with the underlying spreadsheet analysis; countries are excluded from the average because of a ‘range error’.
Great Brittan slashes spending by £10 billion, in response to the research and increase in debt following in the GFC.
Source: Quartz website, http://qz.com/75119Pasted from <http://qz.com/75119/how-to-avoid-making-an-excel-mistake-like-rogoff-and-reinhart/>

34experience. new thinking
Reinhart & Rogoff’s public problems
Source: Australian Financial Review, 23 April 2013
35experience. new thinking
Allied Irish Bank – US$691 m. Fraud
AIB is one of the Irish big 4 commercial banks, parent of Allfirst Bank, based in Baltimore, Maryland, US.
John Rusnak, committed a US$691 million currency trading fraud.
Rather than pay $10,000 fee for a Reuters feed to the treasury compliance team (back office) the data feed to the VaR calculation was based on data from Rusnak’s computer.
The data was loaded into a spreadsheet which Rusnak manipulated to ensure that trading losses were otherwise hidden from the VaR assessment.
Source: AIB p.l.c. SEC filing, March 12, 2002Source: R. Butler, “The role of Spreadsheets in the Allied Irish Bank / Allfirst Currency Trading Fraud” (2009) VaR = Value-at-Risk
36experience. new thinking
Allied Irish Bank – US$691 m. Fraud
AIB SEC Filing: “A simple check to see if the holdover figures were captured in the next day's trading activity would have caught this scheme.”
At least two points of failure:1. Data in spreadsheets was open to
manipulation2. Compensating controls were not
strong enough to detect the manipulation
Source: AIB p.l.c. SEC filing, March 12, 2002Source: Hanrick Curran research
37experience. new thinking
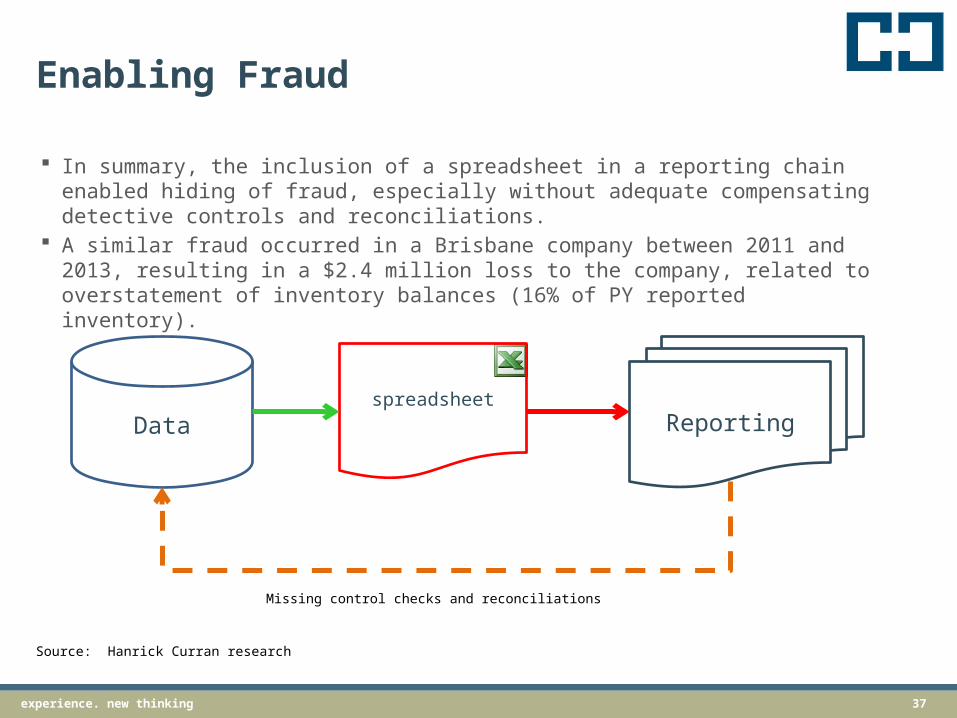
Enabling Fraud
In summary, the inclusion of a spreadsheet in a reporting chain enabled hiding of fraud, especially without adequate compensating detective controls and reconciliations.
A similar fraud occurred in a Brisbane company between 2011 and 2013, resulting in a $2.4 million loss to the company, related to overstatement of inventory balances (16% of PY reported inventory).
Source: Hanrick Curran research
Dataspreadsheet
Reporting
Missing control checks and reconciliations
38experience. new thinkingexperience. new thinking 38
Raymond Panko, University of Hawaii, has undertaken significant research into spreadsheet errors. Panko’s research informs the classification of errors in spreadsheets.
Error taxonomy and research
39experience. new thinking
Error research
There is a significant amount of research into human error from fields as diverse as mathematics, programming, aircraft accidents, nuclear incidents, proofreading and linguistics.
A key insight from these fields is that “human cognitive processes produce the correct result nearly all the time but have a small inherent error rate that stems from the same processes that produce correct results. In other words, the way we actually think … is the heart of the problem, not simple sloppiness.”
Source: Raymond Panko and Salvatore Aurigemma “Revising the Panko-Halverson Taxonomy of Spreadsheet Errors” (February 2010) p.4
40experience. new thinking
Mistakes, Slips and Lapses
When working with spreadsheets, errors can be categorised as follows (Reason, 1990): Mistake – an error in planning Slip – an error during a sensory-motor action, such
as typing the wrong number in a cell (e.g., $120,000 instead of $210,000)
Lapse – a failure in memory, usually caused by overloading the limited human memory capacity
In terms of error detection, planning and memory errors that occur ‘off spreadsheet’ leave little if any evidence for error detection.
Source: Raymond Panko and Salvatore Aurigemma “Revising the Panko-Halverson Taxonomy of Spreadsheet Errors” (February 2010) p.5
41experience. new thinking
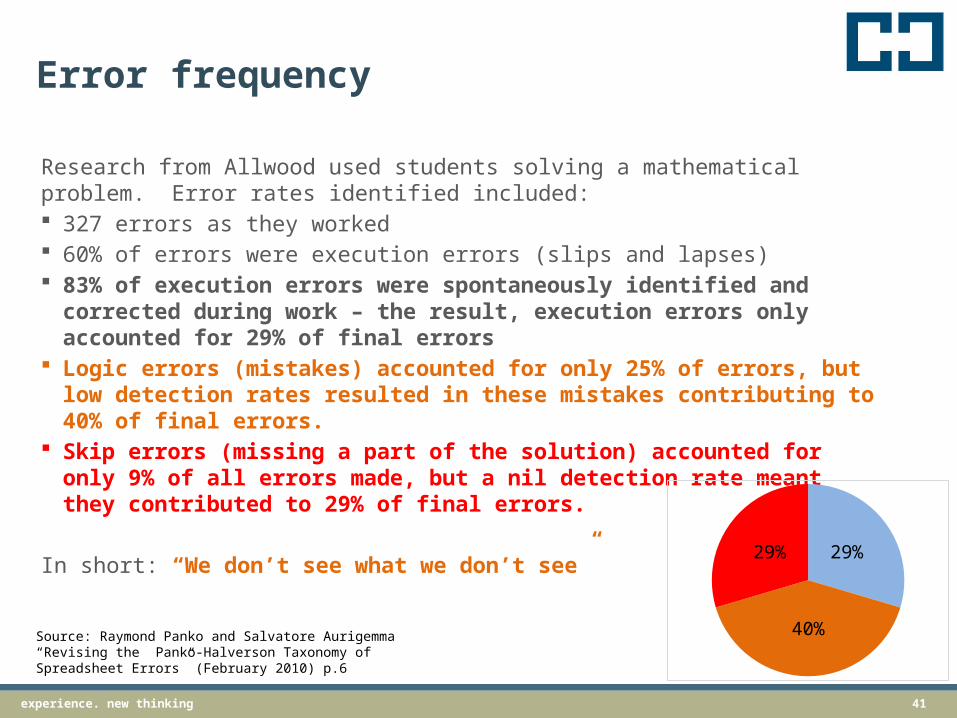
Error frequency
Research from Allwood used students solving a mathematical problem. Error rates identified included: 327 errors as they worked 60% of errors were execution errors (slips and lapses) 83% of execution errors were spontaneously identified and
corrected during work – the result, execution errors only accounted for 29% of final errors
Logic errors (mistakes) accounted for only 25% of errors, but low detection rates resulted in these mistakes contributing to 40% of final errors.
Skip errors (missing a part of the solution) accounted for only 9% of all errors made, but a nil detection rate meant they contributed to 29% of final errors.
In short: “We don’t see what we don’t see”
Source: Raymond Panko and Salvatore Aurigemma “Revising the Panko-Halverson Taxonomy of Spreadsheet Errors” (February 2010) p.6
29%
40%
29%
42experience. new thinking
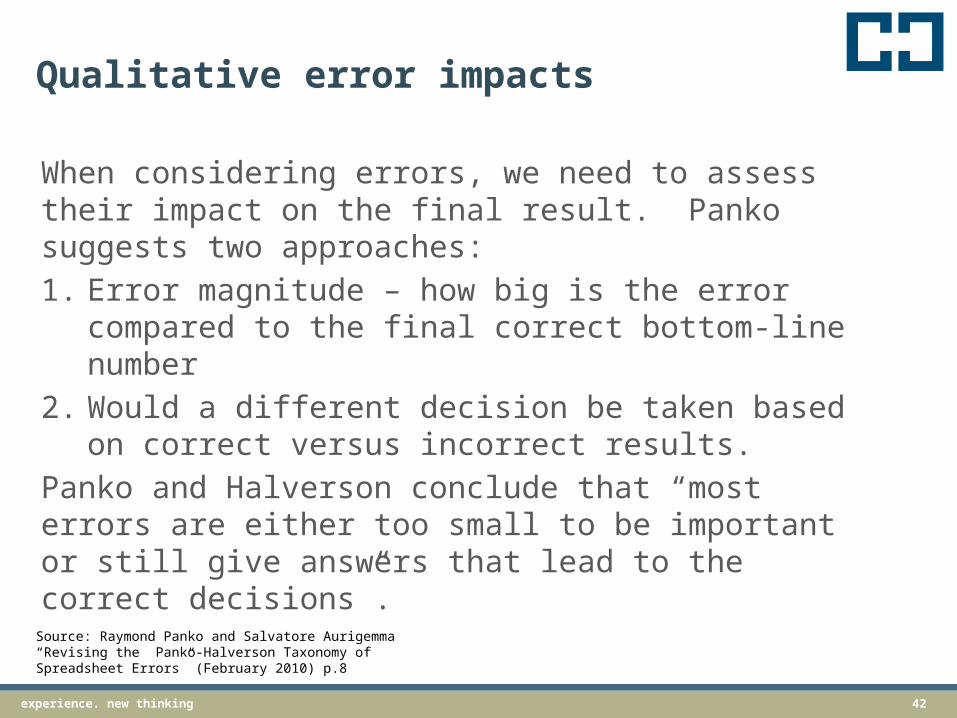
Qualitative error impacts
When considering errors, we need to assess their impact on the final result. Panko suggests two approaches:1. Error magnitude – how big is the error
compared to the final correct bottom-line number
2. Would a different decision be taken based on correct versus incorrect results.
Panko and Halverson conclude that “most errors are either too small to be important or still give answers that lead to the correct decisions”.
Source: Raymond Panko and Salvatore Aurigemma “Revising the Panko-Halverson Taxonomy of Spreadsheet Errors” (February 2010) p.8

43experience. new thinking
Panko & Halverson error taxonomy
A revised error taxonomy is described by Panko and Halverson.
Source: Raymond Panko and Salvatore Aurigemma “Revising the Panko-Halverson Taxonomy of Spreadsheet Errors” (February 2010) p.25
44experience. new thinking
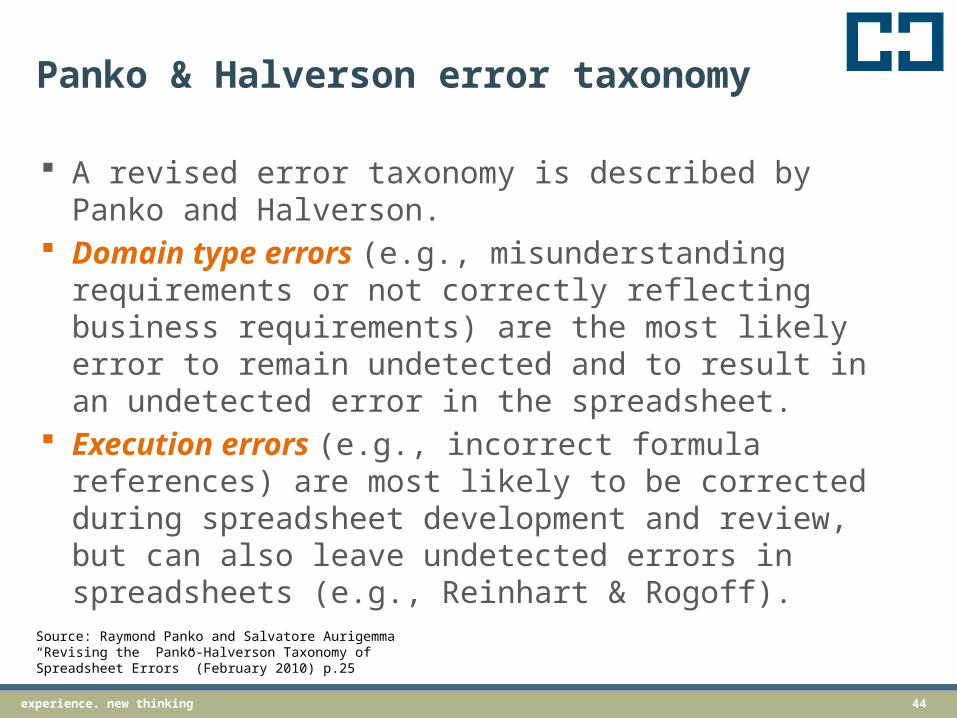
Panko & Halverson error taxonomy
A revised error taxonomy is described by Panko and Halverson.
Domain type errors (e.g., misunderstanding requirements or not correctly reflecting business requirements) are the most likely error to remain undetected and to result in an undetected error in the spreadsheet.
Execution errors (e.g., incorrect formula references) are most likely to be corrected during spreadsheet development and review, but can also leave undetected errors in spreadsheets (e.g., Reinhart & Rogoff).
Source: Raymond Panko and Salvatore Aurigemma “Revising the Panko-Halverson Taxonomy of Spreadsheet Errors” (February 2010) p.25
45experience. new thinkingexperience. new thinking 45
Graphing outputs of spreadsheets is important. Some examples of why follow…
A segue into the graphic display of information

46experience. new thinking
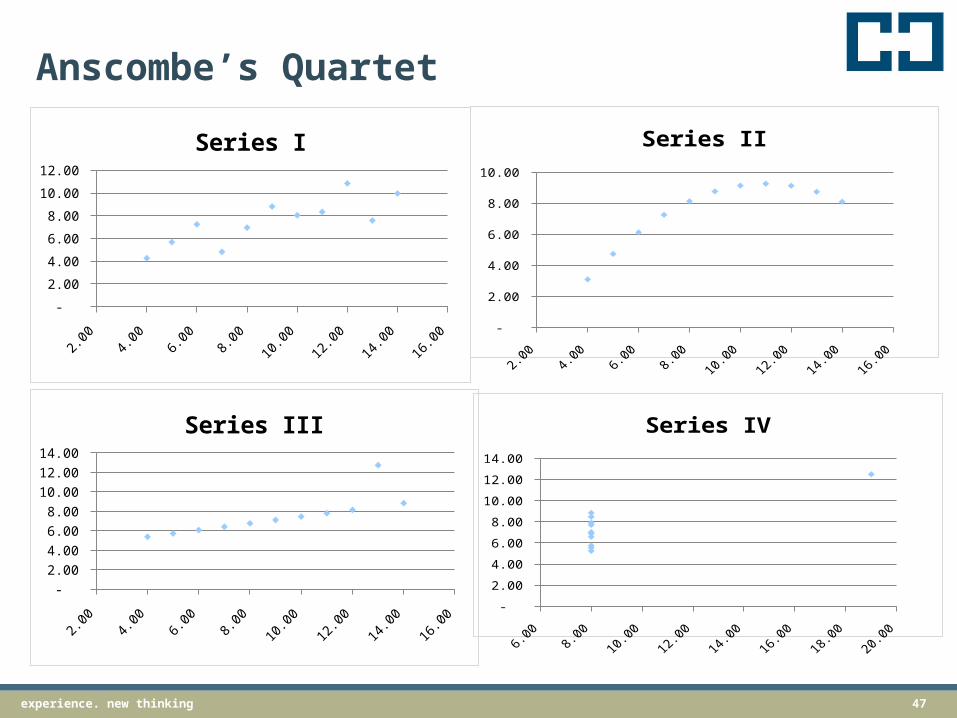
Anscombe’s Quartet
Four data sets with similar characteristics
X average = 9.0 Y average = 7.5
X sum = 99.0 Y sum = 82.5
x y x y x y x y 10.00 8.04 10.00 9.14 10.00 7.46 8.00 6.58 8.00 6.95 8.00 8.14 8.00 6.77 8.00 5.76 13.00 7.58 13.00 8.74 13.00 12.74 8.00 7.71 9.00 8.81 9.00 8.77 9.00 7.11 8.00 8.84 11.00 8.33 11.00 9.26 11.00 7.81 8.00 8.47 14.00 9.96 14.00 8.10 14.00 8.84 8.00 7.04 6.00 7.24 6.00 6.13 6.00 6.08 8.00 5.25 4.00 4.26 4.00 3.10 4.00 5.39 19.00 12.50 12.00 10.84 12.00 9.13 12.00 8.15 8.00 5.56 7.00 4.82 7.00 7.26 7.00 6.42 8.00 7.91 5.00 5.68 5.00 4.74 5.00 5.73 8.00 6.89 sum
99.0 82.5 99.0 82.5 99.0 82.5 99.0 82.5 Average
9.0 7.5 9.0 7.5 9.0 7.5 9.0 7.5
I II III IV
Source: Wikipedia
47experience. new thinking
Anscombe’s Quartet
2.00 4.00 6.00 8.00 10.00 12.00 14.00 16.00 -
2.00
4.00
6.00
8.00
10.00
12.00
Series I
2.00 4.00 6.00 8.00 10.00 12.00 14.00 16.00 -
1.00 2.00 3.00 4.00 5.00 6.00 7.00 8.00 9.00
10.00
Series II
2.00 4.00 6.00 8.00 10.00 12.00 14.00 16.00 -
2.00
4.00
6.00
8.00
10.00
12.00
14.00
Series III
6.00 8.00 10.00 12.00 14.00 16.00 18.00 20.00 -
2.00
4.00
6.00
8.00
10.00
12.00
14.00
Series IV
48experience. new thinking
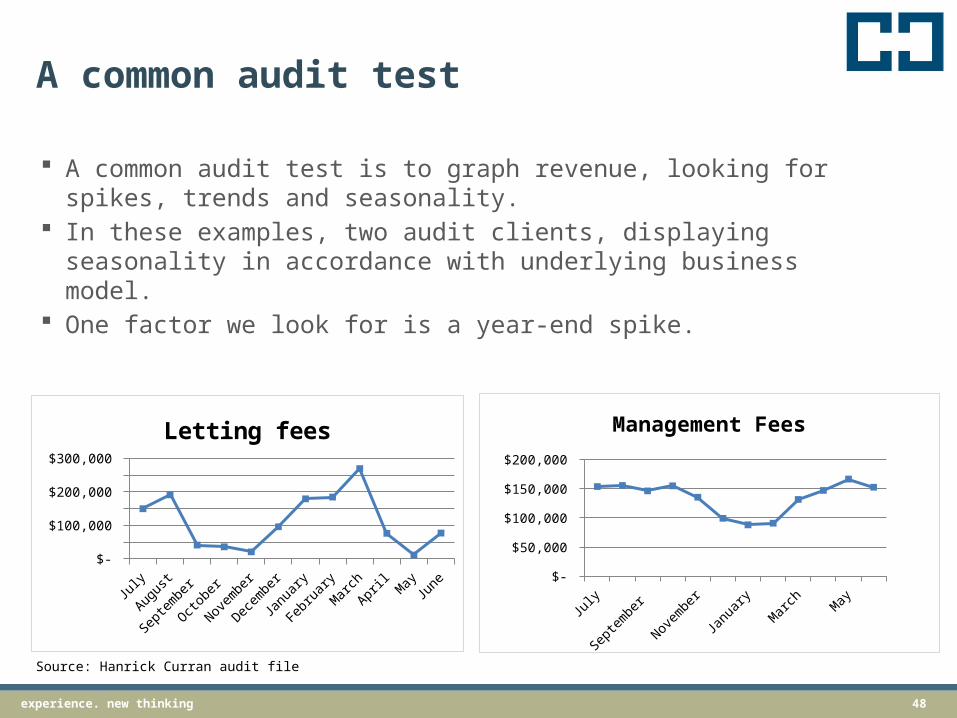
A common audit test
A common audit test is to graph revenue, looking for spikes, trends and seasonality.
In these examples, two audit clients, displaying seasonality in accordance with underlying business model.
One factor we look for is a year-end spike.
July
August
Septem
ber
October
November
December
January
Febru
aryMarc
hApril
MayJune
$-
$50,000
$100,000
$150,000
$200,000
$250,000
$300,000
Letting fees
July
Augus
t
Sept
embe
r
Octob
er
Novem
ber
Decem
ber
Janu
ary
Febr
uary
March
April
MayJu
ne $-
$50,000
$100,000
$150,000
$200,000
Management Fees
Source: Hanrick Curran audit file
49experience. new thinking
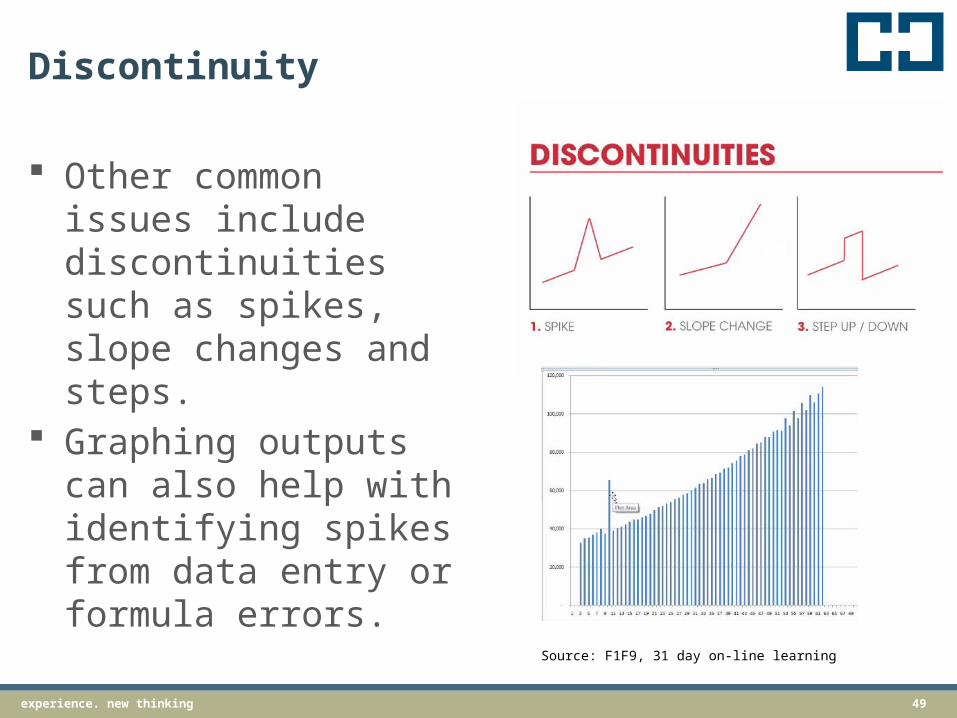
Discontinuity
Other common issues include discontinuities such as spikes, slope changes and steps.
Graphing outputs can also help with identifying spikes from data entry or formula errors.
Source: F1F9, 31 day on-line learning
50experience. new thinking
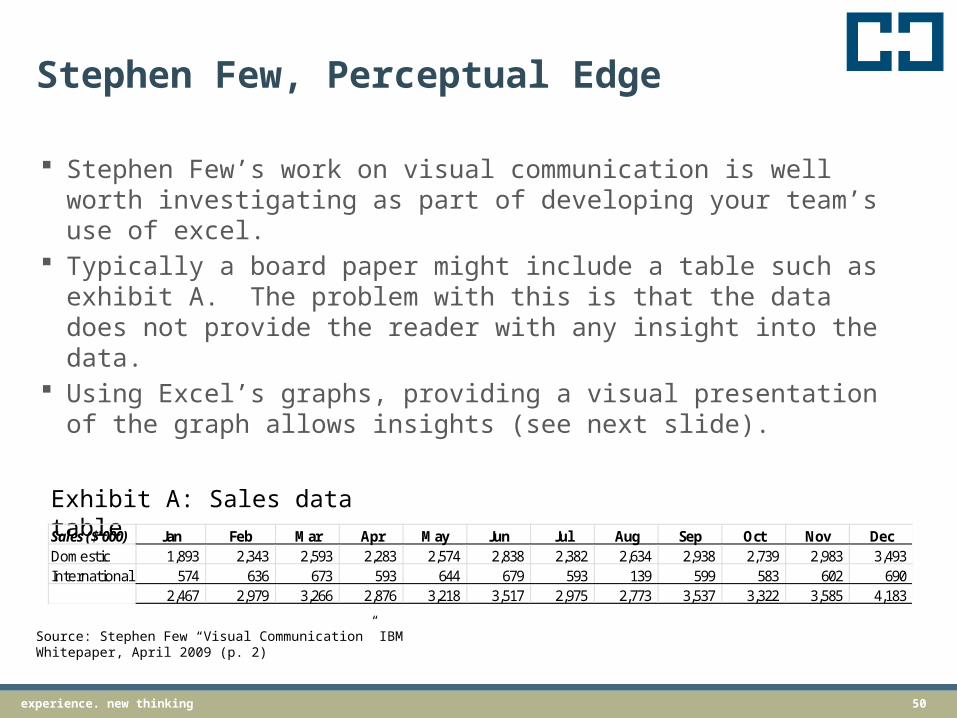
Stephen Few, Perceptual Edge
Stephen Few’s work on visual communication is well worth investigating as part of developing your team’s use of excel.
Typically a board paper might include a table such as exhibit A. The problem with this is that the data does not provide the reader with any insight into the data.
Using Excel’s graphs, providing a visual presentation of the graph allows insights (see next slide).
Sales ($'000) Jan Feb Mar Apr May Jun Jul Aug Sep Oct Nov DecDomestic 1,893 2,343 2,593 2,283 2,574 2,838 2,382 2,634 2,938 2,739 2,983 3,493 International 574 636 673 593 644 679 593 139 599 583 602 690
2,467 2,979 3,266 2,876 3,218 3,517 2,975 2,773 3,537 3,322 3,585 4,183
Exhibit A: Sales data table
Source: Stephen Few “Visual Communication” IBM Whitepaper, April 2009 (p. 2)
51experience. new thinking
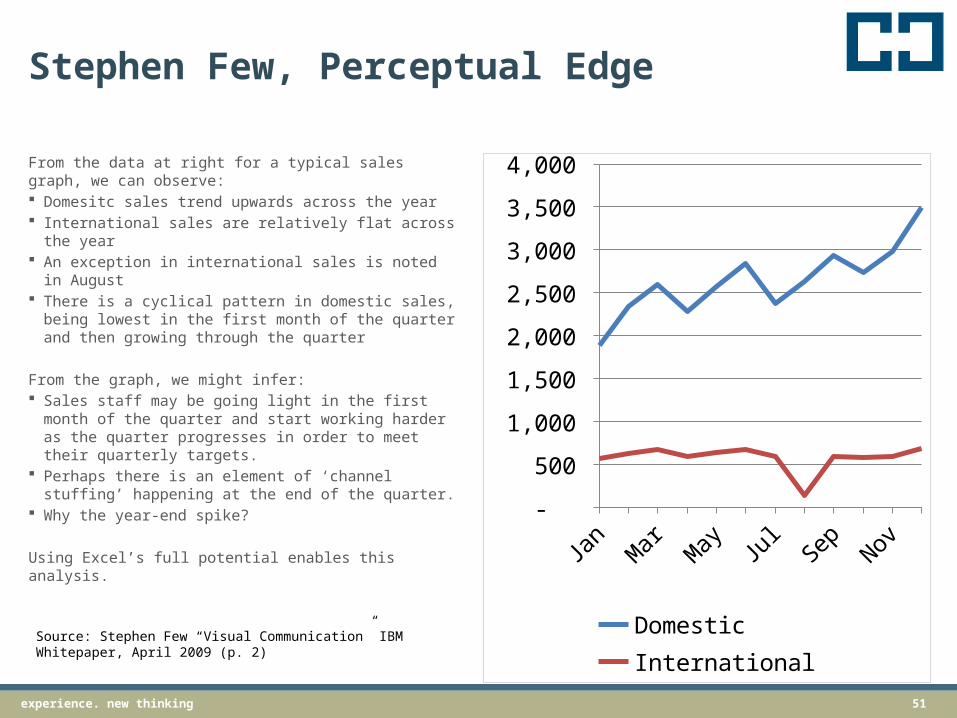
Stephen Few, Perceptual Edge
From the data at right for a typical sales graph, we can observe: Domesitc sales trend upwards across the year International sales are relatively flat across the
year An exception in international sales is noted in
August There is a cyclical pattern in domestic sales,
being lowest in the first month of the quarter and then growing through the quarter
From the graph, we might infer: Sales staff may be going light in the first month
of the quarter and start working harder as the quarter progresses in order to meet their quarterly targets.
Perhaps there is an element of ‘channel stuffing’ happening at the end of the quarter.
Why the year-end spike?
Using Excel’s full potential enables this analysis.Ja
nMar
May Ju
lSe
pNov
-
500
1,000
1,500
2,000
2,500
3,000
3,500
4,000
Domestic InternationalSource: Stephen Few “Visual Communication” IBM Whitepaper, April 2009 (p. 2)
52experience. new thinkingexperience. new thinking 52
All is not lost, here is a 7 step process to review your spreadsheets.
7 steps to assure your spreadsheets
53experience. new thinking
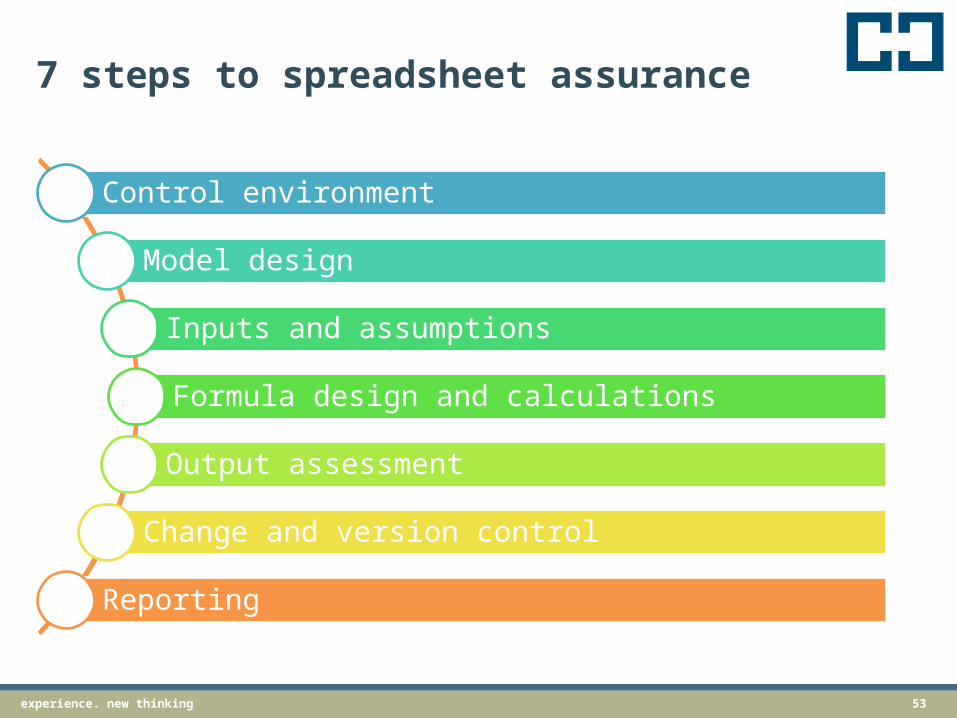
7 steps to spreadsheet assurance
Control environment
Model design
Inputs and assumptions
Formula design and calculations
Output assessment
Change and version control
Reporting
54experience. new thinking
Control environment
Review what spreadsheets exist and how they are controlled and developed
Review access and security arrangements for spreadsheets
Consider risk assessment for in-use spreadsheets
55experience. new thinking
Model design
Consider overall design and implementation of spreadsheets
Consider domain related information needed to understand model designs (e.g., are experts required such as geologists)
Consider periodicity and format consistency
56experience. new thinking
Inputs and assumptions
Review inputs and assumptions, consider approval requirements for assumptions included in spreadsheets
Consider inputs for data-entry errors
See: ASIC v MacDonald (No 11) [2009] NSWSC 287(James Hardy case)
Do key assumptions need board level approval?

57experience. new thinking
Formula design and calculation
Check formula for calculation consistency and accuracy
Examine model for potential errors including: hard coding, reference failures
How long can this take?Hanrick Curran were recently asked to review a transaction model with 1,173 unique formula and 50,028 total formula.At 1 minute per unique formula, that equates to 19.5 hours of review time or 2.6 days of just looking at formula. And this doesn’t even allow time to consider domain errors.
58experience. new thinking
Output assessment
Review model outputs for consistency Consider information accuracy Does the model promote effective decision
making
59experience. new thinking
Change and version control
Consider change controls implemented over the reviewed spreadsheet, including password protection
Consider version controls implemented over the model and to whom ownership of the spreadsheet is delegated
Tip: use a descriptive file name that includes information regarding status and version or date of the spreadsheet.Tip: put dates in YYYYMMDD order to enable auto-sortingExample: “division budget review (v2.3)(DRAFT).xlsx”
Example: “20140612”

60experience. new thinking
Reporting
Prepare and communicate with management regarding the outcomes of the spreadsheet review

61experience. new thinkingexperience. new thinking 61
Some suggestions on how to implement some key lessons from todays topics…
A brief summary and some practical solutions
62experience. new thinking
In summary
Errors will happen, if you plan well, their impact can be minimised.
Most errors are not material, but do you want to be the example that proves the rule?
Most errors are not actually on/in the spreadsheet.
63experience. new thinking
Practical solutions (I)
Set organisational spreadsheet standards; have a “this is the way we do it here.”
Implement a best practice standard (i.e., FAST).
Implement training in how to use Excel and how to design spreadsheets.
64experience. new thinking
Practical solutions (II)
Demand better presentation of information … in a way that supports decision making.(“But this requires better training to start with.”)
Stocktake where you are using spreadsheets … assess where your vulnerability lies and address key risks.
Implement a review process for key spreadsheets with external review if needed (e.g., internal audit, external audit or domain specialists).
65experience. new thinking
Practical solutions (III)
At a basic level, for ad hoc spreadsheets: Layout your work Use styles Format sheet well/properly Don’t hard code Don’t use remote references Include graphs Take time to check and review your work Document information sources
66experience. new thinking
Practical solutions (IV)
For more complex spreadsheets: Use a standard format & style Involve review and signoff of key inputs &
assumptions in the spreadsheet Build-in error checks Keep cross links to a minimum Keep all links between worksheets on a single
page Implement version and change controls

67experience. new thinkingexperience. new thinking 67
Self-checking your spreadsheets to avoid errors in decision making.Anthony Berglas
Spreadsheet Detective
68experience. new thinking
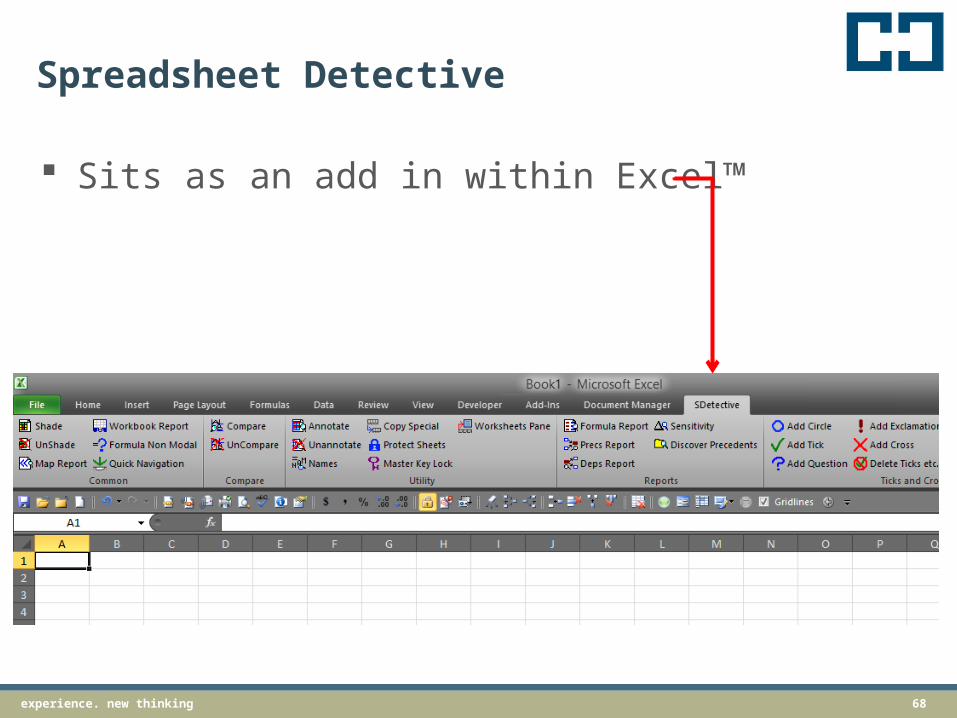
Spreadsheet Detective
Sits as an add in within Excel™
69experience. new thinking
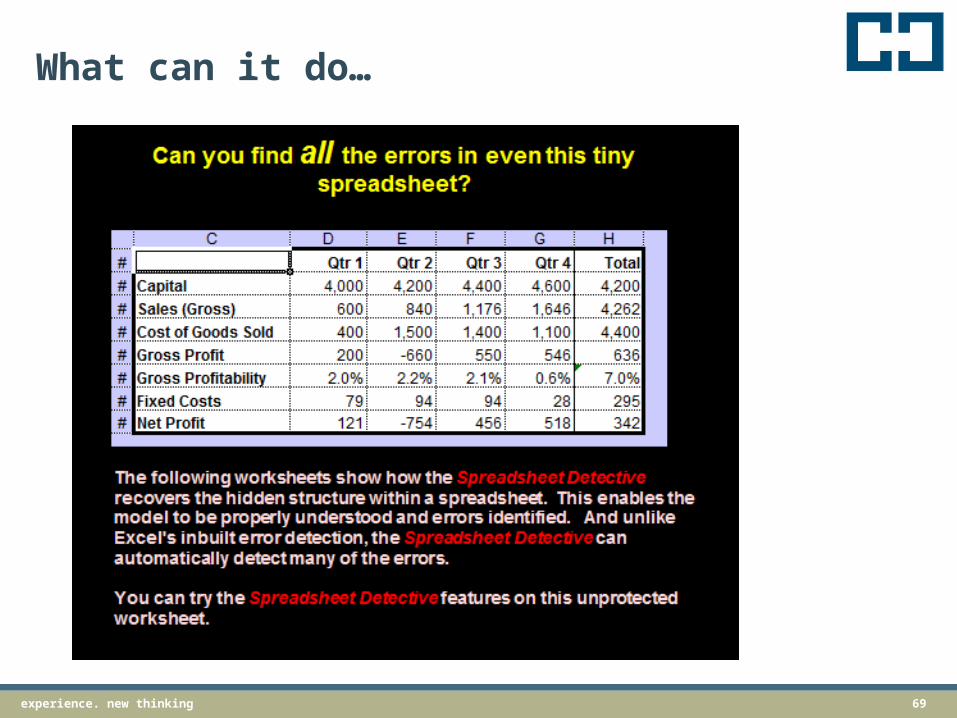
What can it do…
70experience. new thinking
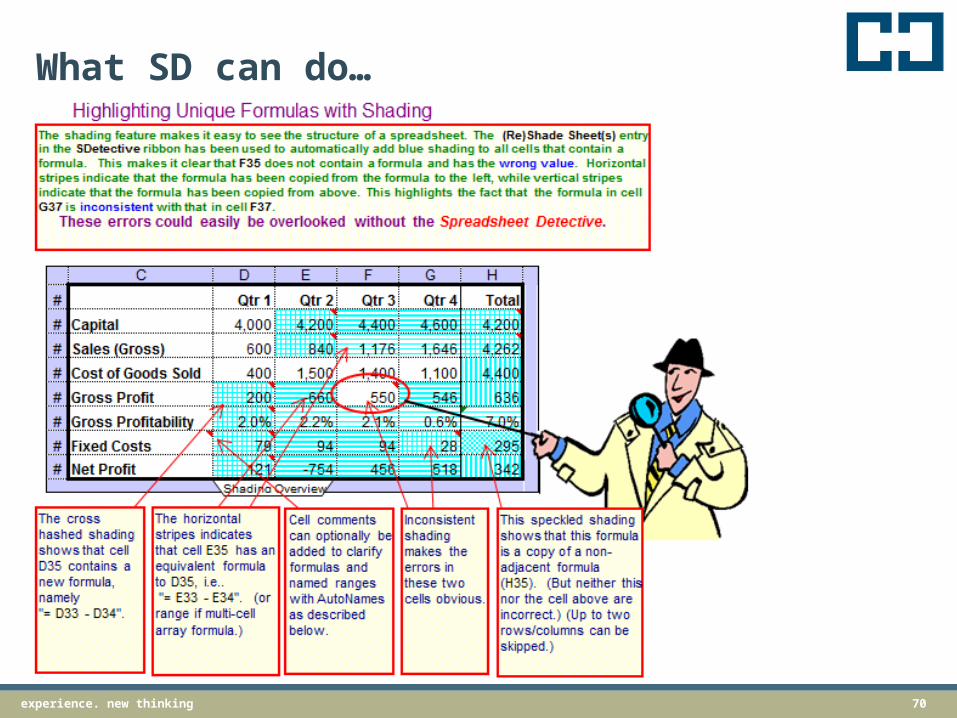
What SD can do…
71experience. new thinking
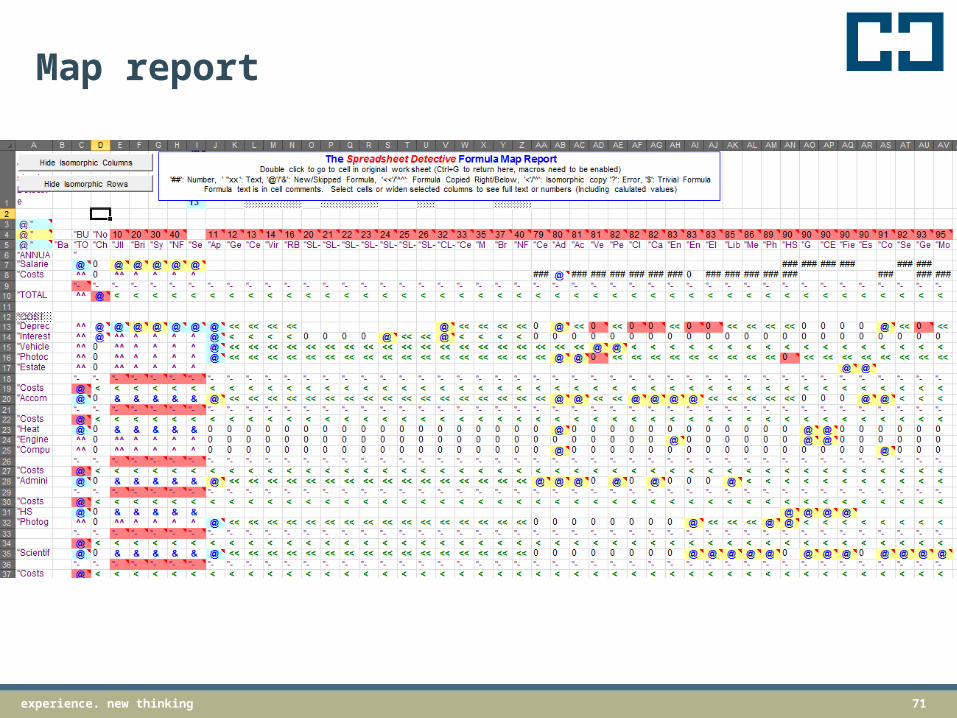
Map report

72experience. new thinking
Workbook report
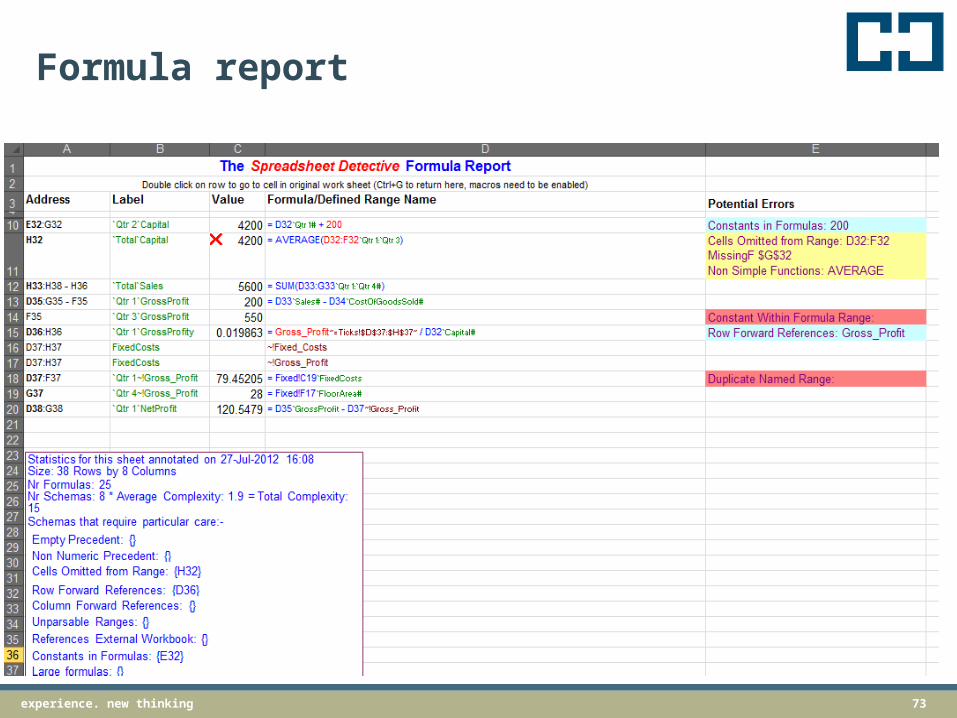
73experience. new thinking
Formula report

www.hanrickcurran.com.au
Questions?
75experience. new thinking
More resources
www.f1f9.com“Well worth trying their 31 day free online course for a brush-up on your excel skills.”
www.spreadsheetdetective.com“Use the tools we use, to understand and self-audit your model.”
www.asap-utilities.com“Great tools for every excel user. If you ever work with data, you need these tools.”
www.perceptualedge.com“For enlightening analysis and communication.”
76experience. new thinking
Disclaimers
This document contains information in summary form and is therefore intended for general guidance only. It is not intended to be a substitute for detailed research or the exercise of professional judgement. It does not purport to be comprehensive or to render professional advice. The reader should not act on the basis of any matter contained in this publication without first obtaining specific professional advice.
We believe that the statements made by us in this document are accurate but no warranty of accuracy or reliability is given. Our conclusions are based on interpretations of accounting standards and other relevant professional pronouncements and legislation current as at the date of this document. Should the interpretations, accounting standards, other relevant professional pronouncements or legislation change, our conclusions may not be valid. We are under no obligation to update the matters considered in this document after its publication.
© Hanrick Curran, June 2014All rights reserved

Thank you
www.hanrickcurran.com.au


