TIOMAN FIELD REPORT
66
Singapore American School • Tioman Field Research Study • Oct ’10 AP Environmental Science
description
AP Environmental Science - Tioman, Malaysia Field Report
Transcript of TIOMAN FIELD REPORT
Singapore American School • Tioman Field Research Study • Oct ’10 AP Environmental Science

Singapore American School • Tioman Field Research Study • Oct ’10 AP Environmental Science
I. Background/Aim
Tioman, Malaysia is a popular tourist attraction for many people visiting
South East Asia. Unlike the SAS APES students of 2010, most people go to
Tioman just to experience the beauty of the sun, the sand, and the blissfully
blue water. We went to Tioman to conduct our first hands-‐on experience
with in-‐field lab work. In previous years, the students had gone to Tioman
during the school week, missing a few days of classes, much to the dismay of
their teachers. This year, with that in mind, Mrs. Began took us to Tioman
over October Break, using the time to take us on a trip that would get us to
think about the outdoors in a systematic way. We were able to use test kits
and other technology to make measurements of tropical rainforests, conduct
soil and stream water quality analysis, survey coral reef biodiversity and
observe a sea turtle hatchery on Melina Beach with expert guidance and
instruction by trained marine biologists, oceanographers and ecologists
from Ecofieldtrips. Not only were we given ample in-‐field experience, we
were also given a good degree of “free” time, able to enjoy the scenery as we
pleased. Many of us spent the time relaxing with friends, either on the
beaches rocky outcroppings, in the ocean, or in each others rooms. For those
of us who took the opportunity to spend some of our free time alone in
contemplation, as almost all did at one point or another, we were able to
observe the natural beauty of the island free from hassle, able to appreciate
it for all it was worth. When we left for Tioman we were excited; when we
returned to Singapore we were eager to go back.
II. Biogeography of Pulau Tioman, Malaysia
Singapore American School • Tioman Field Research Study • Oct ’10 AP Environmental Science
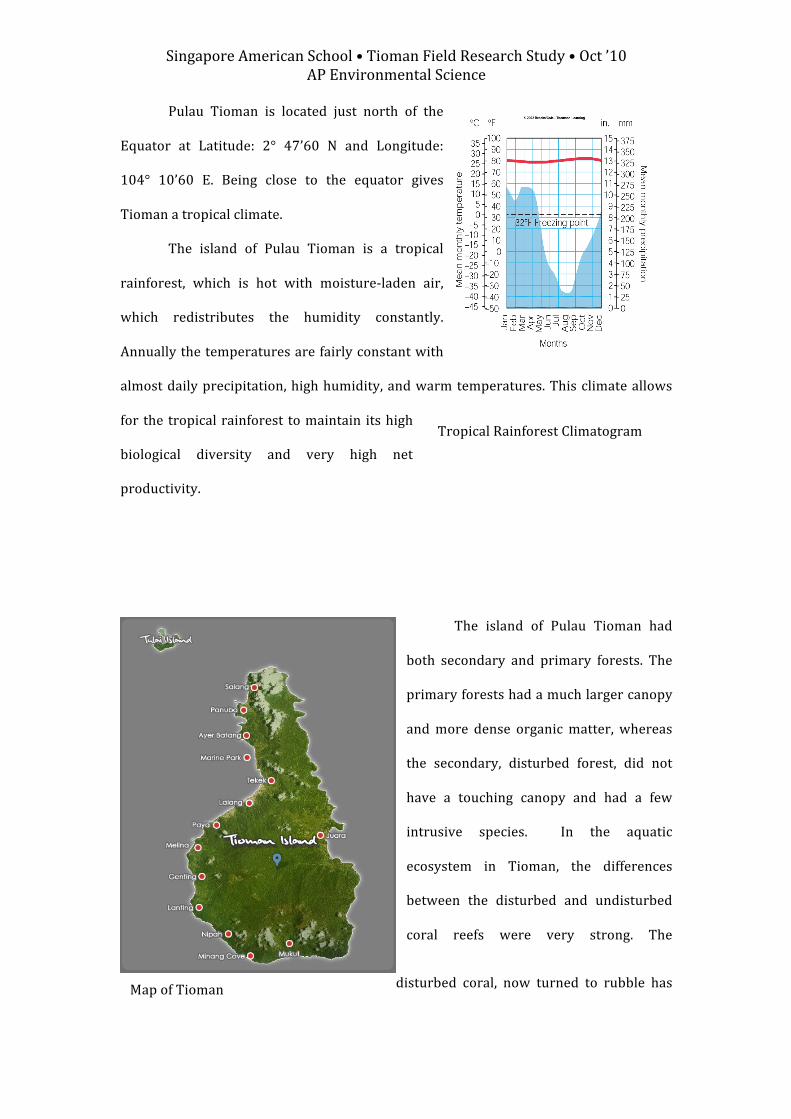
Pulau Tioman is located just north of the
Equator at Latitude: 2° 47’60 N and Longitude:
104° 10’60 E. Being close to the equator gives
Tioman a tropical climate.
The island of Pulau Tioman is a tropical
rainforest, which is hot with moisture-‐laden air,
which redistributes the humidity constantly.
Annually the temperatures are fairly constant with
almost daily precipitation, high humidity, and warm temperatures. This climate allows
for the tropical rainforest to maintain its high
biological diversity and very high net
productivity.
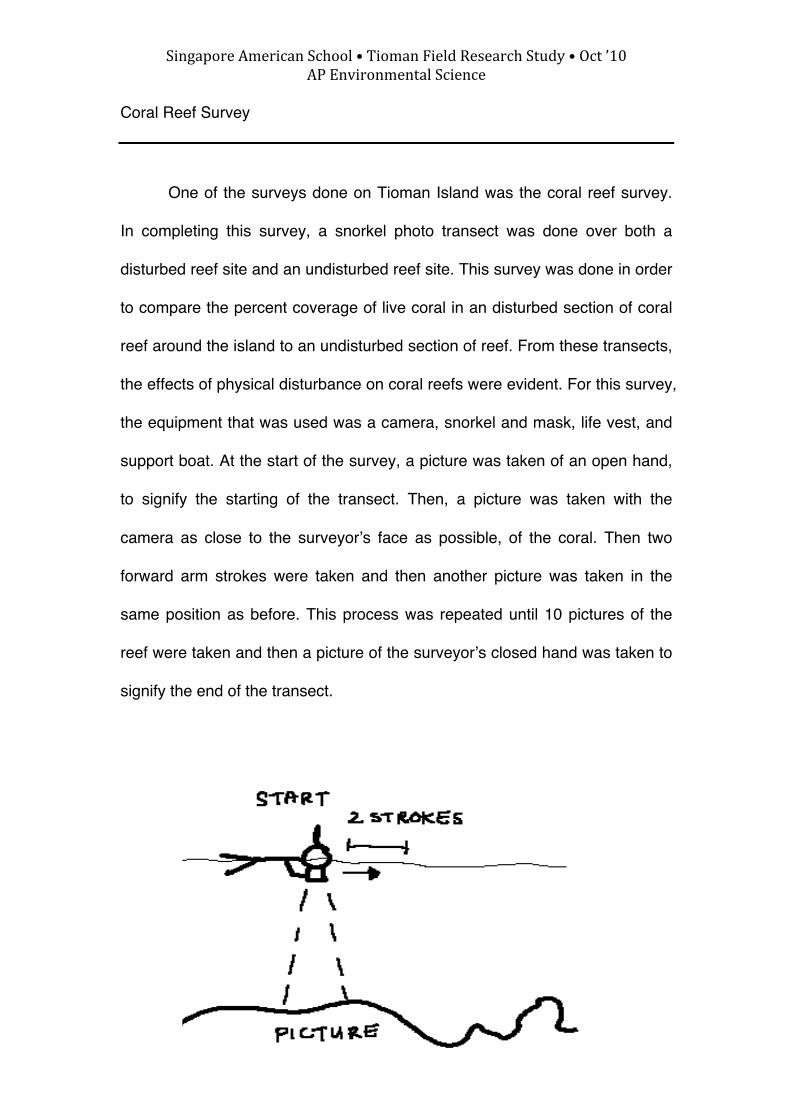
The island of Pulau Tioman had
both secondary and primary forests. The
primary forests had a much larger canopy
and more dense organic matter, whereas
the secondary, disturbed forest, did not
have a touching canopy and had a few
intrusive species. In the aquatic
ecosystem in Tioman, the differences
between the disturbed and undisturbed
coral reefs were very strong. The
disturbed coral, now turned to rubble has
Tropical Rainforest Climatogram
Map of Tioman

Singapore American School • Tioman Field Research Study • Oct ’10 AP Environmental Science
many causing from its death. A main concern is the increasing temperature rises,
causing the bleaching of the coral. The mangroves in Tioman are different from
Singapore, in that they have a black coloring. In the mangroves we were able to identify
the Bruguiera and Xylocarpus trees, with their stilt like roots. Tioman has few
inhabitants, and little infrastructure.
Singapore American School • Tioman Field Research Study • Oct ’10 AP Environmental Science
Coral Reef Survey
One of the surveys done on Tioman Island was the coral reef survey.
In completing this survey, a snorkel photo transect was done over both a
disturbed reef site and an undisturbed reef site. This survey was done in order
to compare the percent coverage of live coral in an disturbed section of coral
reef around the island to an undisturbed section of reef. From these transects,
the effects of physical disturbance on coral reefs were evident. For this survey,
the equipment that was used was a camera, snorkel and mask, life vest, and
support boat. At the start of the survey, a picture was taken of an open hand,
to signify the starting of the transect. Then, a picture was taken with the
camera as close to the surveyor’s face as possible, of the coral. Then two
forward arm strokes were taken and then another picture was taken in the
same position as before. This process was repeated until 10 pictures of the
reef were taken and then a picture of the surveyor’s closed hand was taken to
signify the end of the transect.

Singapore American School • Tioman Field Research Study • Oct ’10 AP Environmental Science
Figures __ and __: Getting ready for an introductory snorkel
Figure __: Procedure of photo transect
(Schult)

Singapore American School • Tioman Field Research Study • Oct ’10 AP Environmental Science
DATA: Table ___: Disturbed Reef Percent Coverage of Living Coral
Number Photo Percent coverage of living coral
1
0%
2
0%
3
0%

Singapore American School • Tioman Field Research Study • Oct ’10 AP Environmental Science
4
10%
5
0%
6
5%
7
0%

Singapore American School • Tioman Field Research Study • Oct ’10 AP Environmental Science
8
5%
9
0%
10
0%
Average: 2%
Table ___: Undisturbed Reef Percent Coverage of Living Coral
Number Photo Percent coverage
of living coral

Singapore American School • Tioman Field Research Study • Oct ’10 AP Environmental Science
1
90%
2
95%
3
95%
4
80%

Singapore American School • Tioman Field Research Study • Oct ’10 AP Environmental Science
5
75%
6
75%
7
90%
8
70%

Singapore American School • Tioman Field Research Study • Oct ’10 AP Environmental Science
9
95%
10
90%
Average: 85.5%
RESULTS:
Table ____: Averages of Living Coral Coverages
Disturbed Coverage Average Undisturbed Coverage Average
2% 85.5%

Singapore American School • Tioman Field Research Study • Oct ’10 AP Environmental Science
For the transects tested, the coverage of living coral in the disturbed
reef was 2% and the coverage of living coral in the undisturbed reef was
85.5%. It is possible that the transects that were tested in both of the reefs
could have been inaccurate representations of the entire reef. It is also
possible that the same parts of the reef were in more than one picture or there
were sections of reef on the transect that weren’t in any of the pictures at all.
ANALYSIS:
From these results, it can be seen that the disturbed reef has a lower
percent coverage of living coral than the undisturbed reef. The average
coverage of living coral at the undisturbed reef was 85.5% whereas at the
disturbed reef it was found to be 2%.
The disturbed reef was on Tioman, it had a nice beach nearby and a
mangrove close to it. The factor that most likely contributed the most to the
disturbance of this reef is the human interference. This could be due to
0
10
20
30
40
50
60
70
80
90
Disturbed Reef Undisturbed Reef
Coral Coverage in Undisturbed Reef vs. Disturbed Reef
% Coral Coverage
Singapore American School • Tioman Field Research Study • Oct ’10 AP Environmental Science
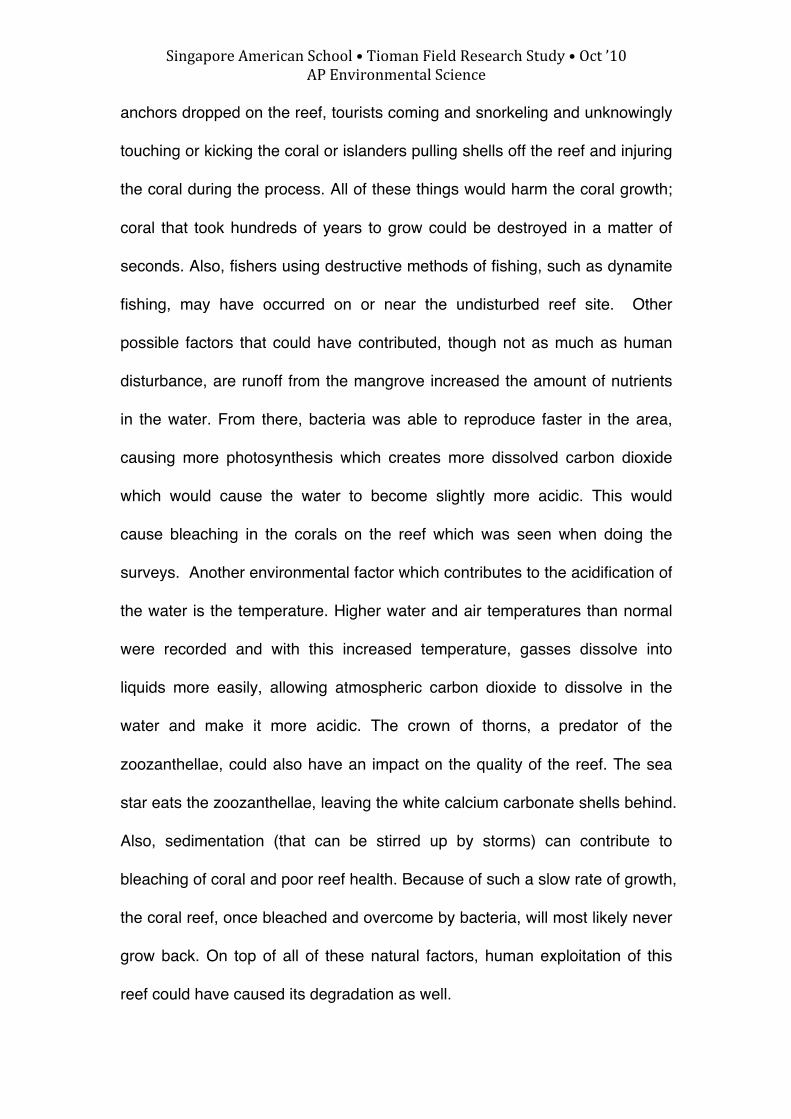
anchors dropped on the reef, tourists coming and snorkeling and unknowingly
touching or kicking the coral or islanders pulling shells off the reef and injuring
the coral during the process. All of these things would harm the coral growth;
coral that took hundreds of years to grow could be destroyed in a matter of
seconds. Also, fishers using destructive methods of fishing, such as dynamite
fishing, may have occurred on or near the undisturbed reef site. Other
possible factors that could have contributed, though not as much as human
disturbance, are runoff from the mangrove increased the amount of nutrients
in the water. From there, bacteria was able to reproduce faster in the area,
causing more photosynthesis which creates more dissolved carbon dioxide
which would cause the water to become slightly more acidic. This would
cause bleaching in the corals on the reef which was seen when doing the
surveys. Another environmental factor which contributes to the acidification of
the water is the temperature. Higher water and air temperatures than normal
were recorded and with this increased temperature, gasses dissolve into
liquids more easily, allowing atmospheric carbon dioxide to dissolve in the
water and make it more acidic. The crown of thorns, a predator of the
zoozanthellae, could also have an impact on the quality of the reef. The sea
star eats the zoozanthellae, leaving the white calcium carbonate shells behind.
Also, sedimentation (that can be stirred up by storms) can contribute to
bleaching of coral and poor reef health. Because of such a slow rate of growth,
the coral reef, once bleached and overcome by bacteria, will most likely never
grow back. On top of all of these natural factors, human exploitation of this
reef could have caused its degradation as well.

Singapore American School • Tioman Field Research Study • Oct ’10 AP Environmental Science
The undisturbed reef is still subject to the warming of the waters but it
wasn’t as prone to runoff from the land or from sedimentation as much as the
disturbed reef because of the large granite boulders that surrounded the cove
in which the reef was located.
Singapore American School • Tioman Field Research Study • Oct ’10 AP Environmental Science
Costal Ecosystem Survey
The zonation of intertidal organisms by belt transect and population density of
the alga, Padina and Sea Cucumber by randomly selecting quadrats.
Aim:
To determine which organisms are present in the intertidal zone using the belt
transect method. To analyze the zonation and see the distribution and
abundance of rocky shore organims as a function to tide level.
The population density will be calculated as well as the total population of
some areas for the species found in the belt transect by counting the species
present within the quadrat.
Equipment:
• 50m of measuring tape • 1m ruler • Field ID Guides • Quadrat 0.25 squared meter
Method:
1. Place the 50m measuring tape at the low tide mark then move down with it to the top of the beach
2. Place the 1m ruler with the 50cm mark laid on the transect line. This is the 0.5m belt for both sides of the transect line
3. Record every species of organism that’s visible inside the quadrat 4. Identify the species by using the ID guides and by asking your biologist
Data:
Saturday 16 October 9:10 Tioman Melina Beach
Table: Abundance and distribution of the species present on the intertidal
zone.
Distance from low tide Species

Singapore American School • Tioman Field Research Study • Oct ’10 AP Environmental Science
M2 Turf algae
M3 Turf algae
M4 Turf algae
M5 Gobies, crab, turf algae
M6 Sea hare
M7 Turf algae, snail (creeper)
M8 Turf algae
M9 Turf algae, red eyed reef crab, mermaid’s fain
(seaweed)
M10 Turf algae, mermaid’s fan
M11 Goby (x4), mermaid’s fan, turf algae
M12 Goby, mermaid’s fan
M13 7 gobies, crab
M14 Turf algae, barnacles
M15 Turf algae
M16 Turf algae, worm, 2 gobies
M17 4 gobies, Turf algae, crab
M18 Turf algae, crab 2
M19 Turf algae, 2 gobies, mermaid’s fan
M20 Mermaid’s fan, red eyed reef crab
M21 Start barnacles, limpids, turf algae, rock oyster
Singapore American School • Tioman Field Research Study • Oct ’10 AP Environmental Science
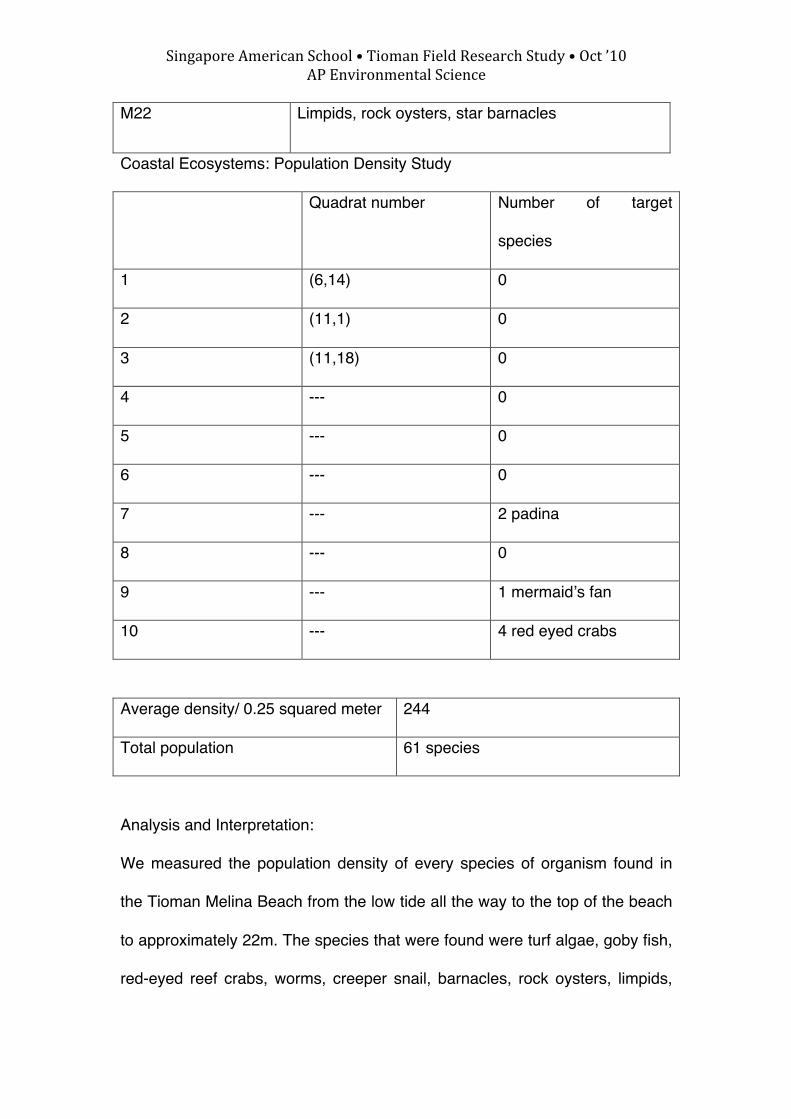
M22 Limpids, rock oysters, star barnacles
Coastal Ecosystems: Population Density Study
Quadrat number Number of target
species
1 (6,14) 0
2 (11,1) 0
3 (11,18) 0
4 --- 0
5 --- 0
6 --- 0
7 --- 2 padina
8 --- 0
9 --- 1 mermaid’s fan
10 --- 4 red eyed crabs
Average density/ 0.25 squared meter 244
Total population 61 species
Analysis and Interpretation:
We measured the population density of every species of organism found in
the Tioman Melina Beach from the low tide all the way to the top of the beach
to approximately 22m. The species that were found were turf algae, goby fish,
red-eyed reef crabs, worms, creeper snail, barnacles, rock oysters, limpids,
Singapore American School • Tioman Field Research Study • Oct ’10 AP Environmental Science
and mermaid’s fans. Some of the species were mobile and remained in rock
pool when the tide retreated while others were in an area trying not to be
exposed to terrestrial abiotic pressures. Some limitations were due to the
night time, and we may have missed some species as we did not have
enough light or we could have slightly measured wrongly. And because the
tide was above 1.3 it’s not very low which was a limitation since the purpose
of the survey was supposed to be during low tide.

Singapore American School • Tioman Field Research Study • Oct ’10 AP Environmental Science
Beach Profile
AIM: The aim of profiling beaches is to observe how natural forces such as wind,
currents, and waves affect the redistribution of sand along beaches, and to identify
storm and tide levels as well as how a beach is changing over time. The shape of the
beach profile determines how vulnerable a coast is to storms and how much is
available for recreational and habitat purposes.
EQUIPTMENT:
• Profiling sticks
To make a set of profile sticks you will need: Two wooden
sticks (1"x 2" x 8 ft pieces of wood cut down to 2 meters)
marked and numbered with lines at ten centimeter intervals
starting from zero at eye level (four feet from the bottom is
adequate, drill a hole there to aid in sighting the horizon).
Number intervals using positive numbers (+10, +20, etc.) from
zero point down to bottom of pole. Number intervals above the
zero point using negative numbers (-10, -20, etc.).
• Recording Material (Log notebook, writing utensil, clipboard) • 50 meter measuring tape • Clinometer
Method:
Starting at the edge of the water, unroll the tape measure until all 50 meters are
extended in a straight line.Then place one profile stick into the ground at the top of
the measuring tape (not at the water), then proceed 5 meters with the other stick.
Once you have reached the 5m mark with the second stick, rest it on the top of the
sand.

Singapore American School • Tioman Field Research Study • Oct ’10 AP Environmental Science
Standing at the second stick, look upwards back to the 1st profile stick through the
clinometer. Observe the angle. Record. Repeat steps 2-4 until you have reached the
beginning of the measuring tape.
DATA:
Table comparing the length of beach in comparison to the degree of angle
Length (meters) Degree of Incline 1st trial Degree of Incline 2nd trial
0-5 2 9
5-10 9 5
10-15 6 8
15-20 5 9
20-25 6 7
25-30 5 5
30-35 4 4
35-40 5 3
40-45 2 5
45-50 1 2
ANALYSIS/INTERPRETATION:
Because at no point excepting the initial drop is there a big difference in
angles, it is assumed that for the most part, the beach profiled is mostly untouched
by tough waves and irregular currents. Taking it further, one can assume that

Singapore American School • Tioman Field Research Study • Oct ’10 AP Environmental Science
because the beach showed such regularity, there is a big section of rocky shore area
in front of the beach, acting as a barrier.
The profile of the beach also has a profound effect on the organisms living
there. For instance, if too steep, the recently hatched sea turtles further up the incline
will be unable to reach the water before predators find them, or other various threats
cause their deaths.

Singapore American School • Tioman Field Research Study • Oct ’10 AP Environmental Science
Rocky Shore Food Web
Aim:
The purpose of constructing this rocky shore food web is to get a better
understanding of the ecosystem of the rocky shore on Melina Beach.
Biologists generally assemble food webs to gain more knowledge of the
specific organisms that inhabit a certain area. The more complex and
detailed a food web is, the greater the ecological biodiversity in the area.
Materials/Equipment:
All that is needed for our certain food web experiment is our Tioman
notebooks, pencil/pen, knowledge of the ecosystem, and a brief introduction
of the organisms that live in this certain area. While not every single organism
can be recorded (as there are way too many), students should be able to
recognize that every single organism is important and plays a specific role in
its ecosystem.
Methods:
To conduct this investigation, the students must observe and gain
knowledge of all of the organisms that inhabit the area. Without direct
observation information, one would be unable to construct the food web, as
they wouldn’t know the ecological relationships of the organisms that do
inhabit the area. Next, the students would need to observe the organisms
(big or small) in their environment to figure out what eats what and what is

Singapore American School • Tioman Field Research Study • Oct ’10 AP Environmental Science
eaten by what. This is a very important step, as without it, the student would
be unable to conduct the experiment and would be stuck trying to construct
the web. Lastly, the students need to come to a final conclusion and begin to
construct the web. The final step should result in a neat, organized and
accurate food web that shows the flow of energy as well as the process of
how everything works in this rocky environment. The flow of energy will be
constructed from the bottom to the top to show the correct energy flow and the
specific trophic levels. In this final food web, students have 4 trophic levels
listed (primary producers, primary consumers, secondary consumers, and
final consumers) to show the direct energy flow.
Data and Observations:
Organisms Recorded at Melina Beach Resort, Tioman’s Nearby Rocky
Shore
Flora Fauna
1. Podina (Mermaid Fan) 2. Turf algae
1. Gobies 2. Sculpin 3. Black-red eyed Reef Crab 4. Creeper Snail 5. Star barnacles 6. Bat starfish 7. Limpids 8. Rock oysters 9. Clams 10. Sea birds 11. Egrets
Singapore American School • Tioman Field Research Study • Oct ’10 AP Environmental Science
Results:
After hard work and thought, students construct a detailed food web
with all organisms present. This food web should include all of the organisms
and should neatly display the flow of energy in the ecosystem using arrows.
Error Analysis: Possible errors that may occur during this assignment range
from not including all of the organisms to arranging the food in an incorrect
manor. Simple errors like this can lead to future errors while discussing the
flow of energy in this ecosystem.

Singapore American School • Tioman Field Research Study • Oct ’10 AP Environmental Science
Rocky Shore Food Web Tioman Journal Entry
COASTAL ECOSYSTEMS NOTES-hbIaIatr.,I
r-l1
--t
--tt
-J
-----l
-.1!t-
---t----3t_-'t--I-l-,--4r-
---;-t_-)-L5Et--L.{r}-,,t.-L5
' Pa{1}.+ /' Jtfies ,/' $cutpin -3,e..,tl r,r-hl11 fraq J'cta45s -/' exu4ot (snai >,/'ferf er 3s ,/o gsf lgncrl.t6l2T r'
'EA S&." +-JsA /. ;1,,r9tA( ,/
'tttt,-, ,/t (o/c. oJfltrs i
. ctolfi ,,,.
'5&r bir/ /br'* e0@+
stt^'&5h
XA bvd
rcdE oylcr5
I Sobw-s\ tfi"rgas
ran\1'61.,
36Vl7ntI
grab
Cry
Il/
olgar-tvr{

Singapore American School • Tioman Field Research Study • Oct ’10 AP Environmental Science
Rocky Shore Food Web – Trophic Levels Included
Analysis/Interpretation/Discussion:
Students are able to tell that the large birds are the top feeders in this food
web and the phytoplankton and zooplankton are at the bottom as the primary
producers. They are able to tell this because the well-constructed food web
shows that the seabird (egret) has no natural predators and the phytoplankton
is the key and supplies many primary consumers. The final result organizes
all organisms into a food web with the energy flowing up towards the top
feeders. This food web helps students learn because it teaches them to
understand the rocky shore of Melina Beach, Tioman and all of its inhabitants.
It shows the top feeding organisms and the organisms that provide food and
energy for the top feeders.
Singapore American School • Tioman Field Research Study • Oct ’10 AP Environmental Science
Primary(Mature) and Secondary Rainforest Surveys
AIM
Forest Trees by Maturity Index
The aim of the investigation would be to categorize the trees based on the
relative thickness of their trunks. As trees grow layers upon their trunks as
they grow older, primary rainforests will have a larger number of trees whose
trunks are greater than the width of the relascope. Secondary rainforests, on
the other hand, will have a lower number of trees whose trunks are wider than
the width of the relascope, because they are still undergoing succession and
therefore the trees will (on average) be younger.
Transect Sampling
The aim of this survey will be to gain vital information about the height,
diameter, etc. of trees in a transect which is 25 meters long. The transect will
have a number of trees along its length, and the tests performed will include a
test for the Diameter of a Tree at Breast Height and the Tree Height.
Quadrat Comparisons to analyze successions
At the end of both surveys, a comparison will be done to compare the
results of the primary rainforest to the secondary rainforest.
Design
Forest Trees by Maturity Index
Singapore American School • Tioman Field Research Study • Oct ’10 AP Environmental Science
The investigation will be reproduced 3 times in both the primary and
secondary forests. It involves holding a relascope at eye level, and looking
through the nails (exactly 1cm apart) to test how many trees are within the
(relative) confines of the relascope nails, and which are not. The greater the
number that are not, the older the forest. Percentages can be used to
compare the two forests.
Transect Sampling
This investigation consists of two parts. In part one, the tree’s height
is measured using a clinometer and basic trigonometry. The clinometer is
used to first measure the angle from eye level to the top of the tree, then from
eye level to the bottom. These measurements are then applied to the tangent
function, used to calculate the length of a side in trigonometry, multiplied by
the distance between the biologist and the tree, and finally added together.
The second part consists of measuring the tree’s circumference at
breast height, which is then used to measure its diameter at breast height.
The term “breast height” is different depending on the height of the biologist,
and therefore has been standardized. It is assumed to be 1.35m off the
ground. Dividing the circumference by the mathematical constant “pi” will give
you the diameter of the tree.
Equipment
Forest Trees by Maturity Index
Measuring the maturity index of forest trees is relatively easy, requiring the
same, reusable piece of equipment for both a primary and secondary forest.

Singapore American School • Tioman Field Research Study • Oct ’10 AP Environmental Science
This piece of equipment is called a relascope, which consists of two nails,
1cm apart, on a stick.
Transect Sampling
The two parts of this experiment use two pieces of equipment. The
most important piece of equipment that is used is a measuring tape. Not only
is it used to mark out the transect, but also to measure the circumference of a
circle and the distance from a tree when measuring its height.
The other piece of equipment is a clinometer, which is used to measure
angles. The clinometer may be pointed up or down to show its angle in
relation to the ground. This, coupled with a measuring tape to measure the
distance from the tree to the biologist, will provide complete data for the
experiment.
Methods
Forest Trees by Maturity Index
To measure the maturity index of a tree, one must first hold the relascope
at eye level. Then, they must look through the gap in the nails, and test the
relative width of each tree trunk via the nails on the relascope. If the tree
trunk’s width exceeds the measurement of the nails, the tree is considered to
be “outside.” Otherwise, it is considered to be “inside”. It is important that the
biologist does not move during this experiment, and may only turn on the spot.
Transect Sampling
For the first component of this survey, one will require a measuring
tape. Simply lay out the transect, and then begin measuring the

Singapore American School • Tioman Field Research Study • Oct ’10 AP Environmental Science
circumference of trees along it at a height of 1.35m. These values can later
by divided by pi to receive the Diameter of the tree at Breast Height.
For the second component, one requires a measuring tape and a
clinometer. Stepping away from the tree (a minimum distance of 10m is
recommended to prevent inaccurate measurements), record the angle on the
clinometer from the biologist’s eye level to the top, and then the bottom of the
tree. The data can later be placed into the formula: b tan(a) + b tan(c) where
b is the height from the tree, and where a and c are the angles measured on
the clinometer.
Data
Forest Trees by Maturity Index – Trees inside v. outside Relascope range
Primary In(# of
trees)
Primary Out(# of
trees)
Secondary In(# of
trees)
Secondary Out(#
of trees)
47 trees 37 trees 59 trees 35 trees
Transect Sampling - Circumference at Breast Height in Primary v. Secondary
Forests
Primary
Circumference
(cm)
Primary Diameter
(cm)
Secondary
Circumference
(cm)
Secondary
Diameter (cm)
110 cm 35.01 cm 39 cm 12.41 cm
110 cm 35.01 cm 46 cm 14.64 cm
53 cm 16.87 cm 72 cm 22.91 cm

Singapore American School • Tioman Field Research Study • Oct ’10 AP Environmental Science
50 cm 15.91 cm 16 cm 5.09 cm
125 cm 39.7 cm 111 cm 35.33 cm
95 cm 30.23 cm 20 cm 6.36 cm
40 cm 12.73 cm 36 cm 11.45 cm
164 cm 52.2 cm 59 cm 18.7 cm
71 cm 22.6 cm 71 cm 22.6 cm
103 cm 32.78 cm 68 cm 21.64 cm
45 cm 14.32 cm 19 cm 6.04 cm
150 cm 47.74 cm 120 cm 38.19 cm
165 cm 52.52 cm 90 cm 28.64 cm
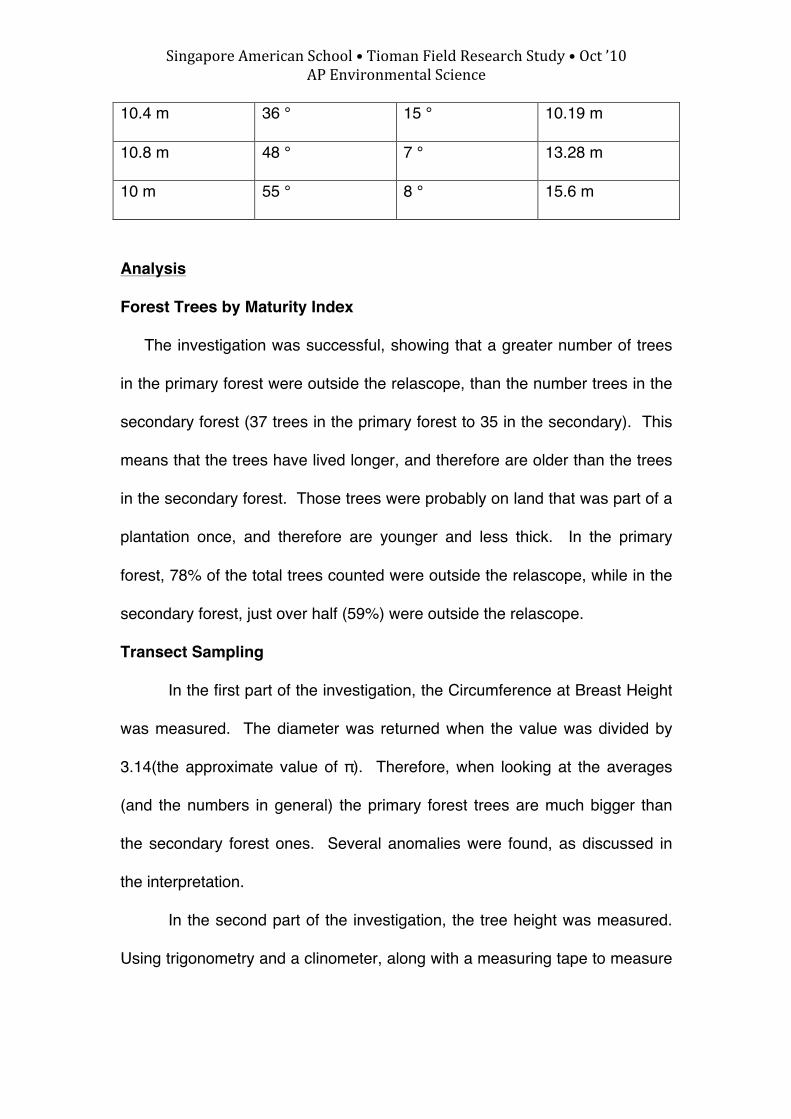
Transect Sampling - Tree Height in Primary and Secondary forests
Distance(meters) Angle to top
(degrees)
Angle to ground
(degrees)
Height (meters)
Primary
8.86 m 45 ° 14 ° 10.98 m
10 m 62 ° 1 ° 18.97 m
10 m 53 ° 15 ° 15.8 m
10 m 55 ° 4 ° 14.8 m
10 m 67 ° 11 ° 25.4 m
Secondary
10.53 m 53 ° 5 ° 23.06 m
11.23 m 50 ° 6 ° 14.48 m
Singapore American School • Tioman Field Research Study • Oct ’10 AP Environmental Science
10.4 m 36 ° 15 ° 10.19 m
10.8 m 48 ° 7 ° 13.28 m
10 m 55 ° 8 ° 15.6 m
Analysis
Forest Trees by Maturity Index
The investigation was successful, showing that a greater number of trees
in the primary forest were outside the relascope, than the number trees in the
secondary forest (37 trees in the primary forest to 35 in the secondary). This
means that the trees have lived longer, and therefore are older than the trees
in the secondary forest. Those trees were probably on land that was part of a
plantation once, and therefore are younger and less thick. In the primary
forest, 78% of the total trees counted were outside the relascope, while in the
secondary forest, just over half (59%) were outside the relascope.
Transect Sampling
In the first part of the investigation, the Circumference at Breast Height
was measured. The diameter was returned when the value was divided by
3.14(the approximate value of π). Therefore, when looking at the averages
(and the numbers in general) the primary forest trees are much bigger than
the secondary forest ones. Several anomalies were found, as discussed in
the interpretation.
In the second part of the investigation, the tree height was measured.
Using trigonometry and a clinometer, along with a measuring tape to measure

Singapore American School • Tioman Field Research Study • Oct ’10 AP Environmental Science
the distance, the height average was extremely close between both the
primary and secondary forests.
Interpretation
Forest Trees by Maturity Index
This investigation was carried out with one crucial error – instead of using
separate entries for each of the points, the points were added up cumulatively.
Therefore, anomalies may be present, but cannot be accounted for with
accuracy. However, the experiment was still a success because almost 20%
more trees were outside the relascope’s range in a primary forest than in a
secondary forest.
Transect Sampling
In the secondary forest, two trees were found that may be anomalous –
a tree with 111 cm circumference, and a tree with 120 cm circumference. In
the primary forest, there were two trees with circumferences of 40cm and 45
cm respectively. These four trees were considered anomalous because they
were either too wide or too narrow for their forest classification. This may be
because they grow faster, or they have recently taken root.
One of the most surprising results, as well as one of the biggest anomalies,
was the tree height of the trees in the primary and secondary forests. The
trees in the primary forests were just slightly taller (on average) than the trees
in the secondary forests. The trees in either forest may have been measured
incorrectly – measuring both forests is extremely difficult, and a matter of
personal bias comes into place because the clinometer cannot tell the

Singapore American School • Tioman Field Research Study • Oct ’10 AP Environmental Science
biologist where the tree trunk ends and the branches begin. Thefore, it might
have been human error.
Quadrat Comparisons to analyze succession
In the secondary forest, many of the qualities were smaller, or less
impressive, than the in the primary forest. The trees were smaller, while
being farther away from each other. There was also less leaf litter and more
sunlight, which is a characteristic of secondary forests. As succession
proceeds, the height of the trees would increase and the amount of leaves
that drop would increase. Therefore, there would be more leaf litter. And
since there are more leaves to begin with, there would be more transpiration
which means more rain. As there’s more rain, it would be more damp, which
provides optimum conditions for decomposers (although the effect of rain
overall would be questionable in such a small area). Thus, the secondary
forest is less developed and is not a climax community because it has a
slower nutrient cycle. Also, biodiversity would be less in the secondary forest.
Only 4 distinct species of trees were observed in the secondary forest, while
up to 8 were noticed in the primary forest.
Observations of Tioman Rainforest Flora and Fauna

Singapore American School • Tioman Field Research Study • Oct ’10 AP Environmental Science
Soil Quality Survey
Aim:
Soil is a made up of organic matter, water, and air making it an intricate blend of
minerals. Abiotic and biotic factors that limit soil are depended upon its location. For
this reason we conducted soil tests in different locations on the island of Tioman. The
tests were done to see the difference between soil from primary and secondary
rainforests. The surveys that were conducted were used to differentiate between the
amounts of nitrogen, potassium, humus, phosphorous, and pH levels from the two
different rainforests. By measuring the soils amount of silt, clay, and sand the soils
ability to sustain life is known. Using these tests, the availability of nutrients between
primary, old growth forests and secondary, handled forests.
Materials:
• Soil test kit LaMotte: nitrogen, potassium, humus, phosphorus o Color Strip Indicators o Closable Containers o Pipette o Test tubes o Necessary Solutions o Instructions
• Distilled Water • Shovel • Plastic Bag for Soil Collection • pH Test Kit • 200-‐mL Graduated Cylinder • Core Soil Sampler
Method:
Many different tests were conducted to measure the soil quality in primary and
secondary rainforests; phosphorus, potassium, nitrogen, and pH levels. Soil texture tests
were all conducted after visiting the site of soil collection.

Singapore American School • Tioman Field Research Study • Oct ’10 AP Environmental Science
After the spot of testing was chose, qualitative observations were taken for both
primary and secondary. Firstly, the phosphorous test was carried out. A test tube was
filled with about 5-‐mL of phosphorous extracting solution from the kit provided. Two
tablespoons were then added to the same test tube containing the solution, and stirred
carefully. Once the soil had slightly settles one pipette was used to extract to the
remaining clear solution into a second test tube. Six drops of Phosphorous Indicator
Reagent was then added to the second test tube containing the clear solution, the test
tube was then shaken to mix the two liquids together. After this one Phosphorous Test
Tablet was added to the second test tube with the mixed solutions. Once added the test
tube was shaken until the Tablet had completely dissolved, leaving a slightly purpled
blue color. To find out the measurement of phosphorous in the soil the color was
matched with the given Phosphorous Color Chart. This test was conducted on both the
primary and secondary rainforests.
Secondly, the nitrogen test was completed. A test tube was filled with 7-‐mL of
Nitrogen Extracting Solution. Two tablespoons of soil was then added to the test tube.
After the soil had settled at the bottom two tablespoons of Nitrogen Indicator Powder
was added. Once these steps were completed a color should have become visible. The
color chart was then used to measure the level of nitrogen in the soil.
This test was conducted with both primary and secondary rainforest soil.
Thirdly, the potassium test was conducted. The test tube was filled with 8-‐mL of
Potassium Extracting Solution; two tablespoons were then added to the same test tube.
After the test tube was capped, allowing the soil to sink to the bottom. A distilled pipette
was then used to transfer the liquid into a second clean test tube, without transferring
any soil particles to the new test tube. A Potassium Indicator Tablet was then added to
the second test tube. Potassium Test Solution was added; one drop at a time, after every
drop the contents of the test tube was mixed. Once the color of the liquid changed to
Singapore American School • Tioman Field Research Study • Oct ’10 AP Environmental Science
blue Potassium Solution drops were no longer added. This test was completed for both
the primary and secondary rainforests.
The pH test was part of a separate kit. A sample of 3 tablespoons of soil was
mixed in with 10-‐mL of pH indicator liquid. It was shaken until all the contents were
mixed. Litmus paper was then place in with the soil and solution. The color that
appeared on the litmus paper was then matched up with its according color given with
the kit. The pH test was used with both secondary and primary rainforest soil.
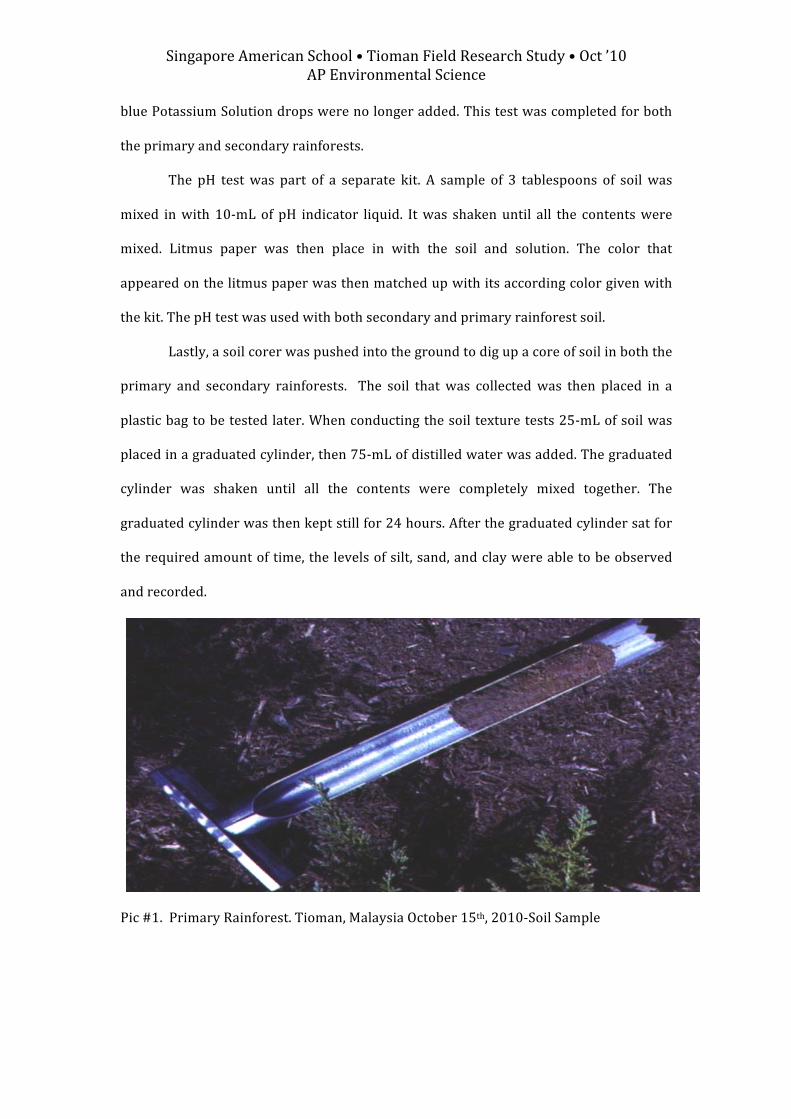
Lastly, a soil corer was pushed into the ground to dig up a core of soil in both the
primary and secondary rainforests. The soil that was collected was then placed in a
plastic bag to be tested later. When conducting the soil texture tests 25-‐mL of soil was
placed in a graduated cylinder, then 75-‐mL of distilled water was added. The graduated
cylinder was shaken until all the contents were completely mixed together. The
graduated cylinder was then kept still for 24 hours. After the graduated cylinder sat for
the required amount of time, the levels of silt, sand, and clay were able to be observed
and recorded.
Pic #1. Primary Rainforest. Tioman, Malaysia October 15th, 2010-‐Soil Sample

Singapore American School • Tioman Field Research Study • Oct ’10 AP Environmental Science
Data Table #1 Observations in Primary and Secondary Rainforest.
Locale Soil Texture Leaf Litter
Primary Rainforest Sandy, wet, easy to roll, cracks Floor fully covered with larger leafs
Secondary
Rainforest
Easy to roll, wet, smoother, A few clear areas, covered with smaller
leafs.
Error Analysis:
There are many limitations that occur while conducting tests outside. The
nutrient tests showed to be most difficult because of the limits of resources (i.e. Litmus
paper). We were only allowed to conduct each test because of time constrains, and this
limits the accuracy of the data. The soil tests, which were not done in the field, are more
Locale pH Nitrogen Phosphorus Potassium Humus
Primary
Rainforest
8 trace trace High- 6 drops Low - 2
Secondary
Rainforest
6 trace trace Low- 24 drops Low – 1

Singapore American School • Tioman Field Research Study • Oct ’10 AP Environmental Science
likely to be more accurate because each team member had the opportunity to measure
the textures.
Analysis/Interpretation/Discussion:
From our knowledge of rainforests and its soil, we were able to further
understand the habitat and vegetation, which grows there. The data that was collected
in Tioman allows us to see the differences in secondary and primary rainforests. There
were quite a few similarities between the two, for example both rainforests showed low
nitrogen levels and slightly acidic pH. We know that the acidity of the soil is from the
high decomposition rate that occurs on the floor of the rainforest. With the phosphorous
and potassium levels also being low, it is a bit alarming because it shows a main limiting
factor; low nutrients. With the humus being vary low, we can assume again that this is
because of the high rate of decomposition of dead matter, so the humus is unable to stay
in the soil. In all we didn’t expect the soil quality of Tioman to have this poor of results,
showing low nutrients.
While conducting the soil texture tests we came to the conclusion that the
primary rainforest was somewhere near silty loam. It was sandier than the secondary
rainforest, which showed to be siltier. It is good for soil to be loamy because is more
permeable and has more aeration with higher filtration rates.
The soil samples from both the primary and secondary rainforest have rich soil and can
sustain life. While making general observations about both rainforests, we were able to
clearly differentiate between the two because of their amounts of leaf litter. In the
primary rainforest, the soil was less rich, telling us there is a slower rate of
decompostion. The reason why the leaf litter is thicker. Meaning that the soil is poorer in
primary rainforests than secondary ones. In all we noticed that both rainforests do not
have ideal levels of nutrients. This is from many limiting factors.
Singapore American School • Tioman Field Research Study • Oct ’10 AP Environmental Science
Fresh Water Stream River Cross Section and River Velocity
Purpose: To measure the velocity of a fresh water stream in a primary
rainforest on the island of Tioman in Malaysia and to measure the width and
depth of five different spots in the river. From these surveys, the stream’s
condition/health could be determined.
Materials:
River Cross Section: Winding tape measure and a long stick.
Stream River Velocity: A winding tape measure, cork cap, stopwatch
Procedure:
River Cross Section:
This was one of the easier surveys to perform because all we really had to do
is measure the different lengths of the aspects in the freshwater stream. First, we ha
d to measure the two different widths of the stream, the first being the width of the act
ual stream, and the other being the width of the banks. We divided the length of the s
tream by five so that we could place the stick to measure water depth at five different
locations. We then recorded the width of the stream, width of the bank, and water de
pth at five different locations and we were done.
River Velocity:
For this survey, we measured the velocity of the stream. First, we found a stre
tch of the river that was at least ten meters long. Two students would stand apart and
would measure the time it took for the cork to travel a certain distance (distance bet
ween the two students). Once the distane and time were found, since speed is equal

Singapore American School • Tioman Field Research Study • Oct ’10 AP Environmental Science
to distance by time, the velocity could be found. This procedure was repeated by our
groups several times to get a more accurate river velocity.
Photo of the stream we sampled
Data
River Cross Section
Lengths of the width of stream, width of bank, and the depth of the stream
Width of Stream- 5m 15cm
(point where the dry bank
meets the water)
Depth of Stream Bankful Width
(point where the dry bank meets the
vegetation)
1 m 16 cm 6m 32 cm
2 m 12 cm 6m 32 cm
3 m 6 cm 6m 32 cm
4 m 10 cm 6m 32 cm
5 m 0 cm 6m 32 cm

Singapore American School • Tioman Field Research Study • Oct ’10 AP Environmental Science
River Velocity
Distance, time, and surface velocity of cork cap in the fresh water stream
Distance (m) Time (seconds) Surface Velocity
(dist./time)
10 47.29 0.21m/s
10 41.18 0.24m/s
10 66.00 0.15m/s
Average time and velocity of cork cap in a Fresh water stream
Average of Time Results Average of Velocity Results
51.49 seconds 0.2 m/s
Analysis/Conclusion
Stream cross section
Based on the data that my group collected, the fresh water stream that
we surveyed had a width of 5.15 meters with a bank width of 6.32 meters. By
selecting 5 different spots to measure the depth of the stream at 1m, 2m, 3m,
4m, and 5m, we recorded 16cm, 12cm, 6cm, 10cm, and 0cm on the spots
respectively. From this data, we can conclude that since the width of the
stream is not that large, and the difference between the stream and the bank
is small, the stream can be interpreted as an up flowing stream.
Singapore American School • Tioman Field Research Study • Oct ’10 AP Environmental Science
River Velocity:
The velocity of a river stream survey was a very good indicator for us to
check the condition of the stream. According to the group’s data, the cork, on
average from the trials, took approximately 51.49 seconds to travel 10 meters.
This data can show us the average velocity of the stream, which in this casee
is 0.2 m/s. This data also shows that this stream is constantly flowing,
meaning that this stream’s water is constantly mixed with other fresh water
from higher level streams. This stream provides habitats for some species
that thrive in flowing water streams instead of still water.
River Cross Section
In every experiment, there are some sources of error. In the cross section of a
river survey, one source of error was human error. The sticks had to be
placed at certain locations due to our survey, but maybe due to rocks or other
obstacles, the sticks couldn’t be placed right where we needed them to be. If
the stick had to be relocated somewhere nearby, the depth could be different
and therefore our data could be off.
River Velocity:
Resistance was one thing that was prevalent in the river, and that was the
large collection of stones scattered around the stream that have an impact on
the actualy velocity of the river. Many times, the cork’s path was obstructed by
the many stones, causing us to redo the experiment. The stones could also
be working their might the other way, meaning they could have created a

Singapore American School • Tioman Field Research Study • Oct ’10 AP Environmental Science
separate current and the cork could have drifted into that. The stones were a
source of error in our survey.
Singapore American School • Tioman Field Research Study • Oct ’10 AP Environmental Science
Water Quality Survey Aim In sampling the water quality of the different locations, ecologists are able to yield physicochemical and indicator species data for the ecosystems. Samples were collected from the upstream and downstream of a tropical rainforest freshwater stream, coastal marine water, and the undisturbed coral reef marine water. In doing the tests, the quality of the water was found based on physical characteristics and chemical substances, the organisms were compared, the relationships and trends among the sites were found, and the similarities and differences between the sites were collected and noted. The goal was to determine base line environmental measurements sustainability of ecosystems, and from there, establish what is needed for the continuation of a successful ecosystem. The purpose of conducting these tests and why ecologists do them is because they provide knowledge that may be used to establish the relative integrity of bodies of water and, if sampled regularly, chart changes over time.
Materials/Equipment • Test Kits (Chemetrics)
o (2) Dissolved Oxygen o Nitrate-Nitrogen o Phosphate o Turbidity
• (5) bottle with closeable lid • Probes – LabQuest Vernier
o pH o Conductivity o Temperature o Light o Relative Humidity
• Other o Measuring tape o Stopwatch o Collection net o Long Pole or Measuring Stick
Method For all of the locations, the water quality was tested. Light intensity,
humidity, conductivity, temperature, and pH were measured. To measure these, a probe (specific to each test) was used by being connected to a Lab Quest which would read the results from holding the probe in the desired and appropriate location. Another grouping of tests that were shared among locations includes the dissolved oxygen, pH, nitrate, and phosphate tests. For each of these, the Chemetrics Test Kit’s provided
Singapore American School • Tioman Field Research Study • Oct ’10 AP Environmental Science
instructions card was used. While doing so, some things were kept in mind: the water was gathered from below the surface level, no air bubbles were allowed in the sample, and the water flowed into the sample bottle slowly and gently. The tests yielded color metric results. To measure the turbidity, a Secchi Disk and a Turbidity test kit are required. With the Secchi Disk, the transparency of the water is found by lowering the disk in the water to find when it is no longer visible. With the Turbidity kit, the instructions card inside told of what to do.
One thing that was not measured at each site was the BOD, or Biological Oxygen Demand. To measure the BOD of the water, 2 samples were drawn. One was used immediately to record the current dissolved oxygen level; the other was kept in complete darkness (either by foil, bags, or location) for 5 days. After these five days of darkness and a constant temperature of 20°C, the dissolved oxygen was tested again. The reading of Day 1 was subtracted by that of Day 5 to give the BOD level (measured in ppm).
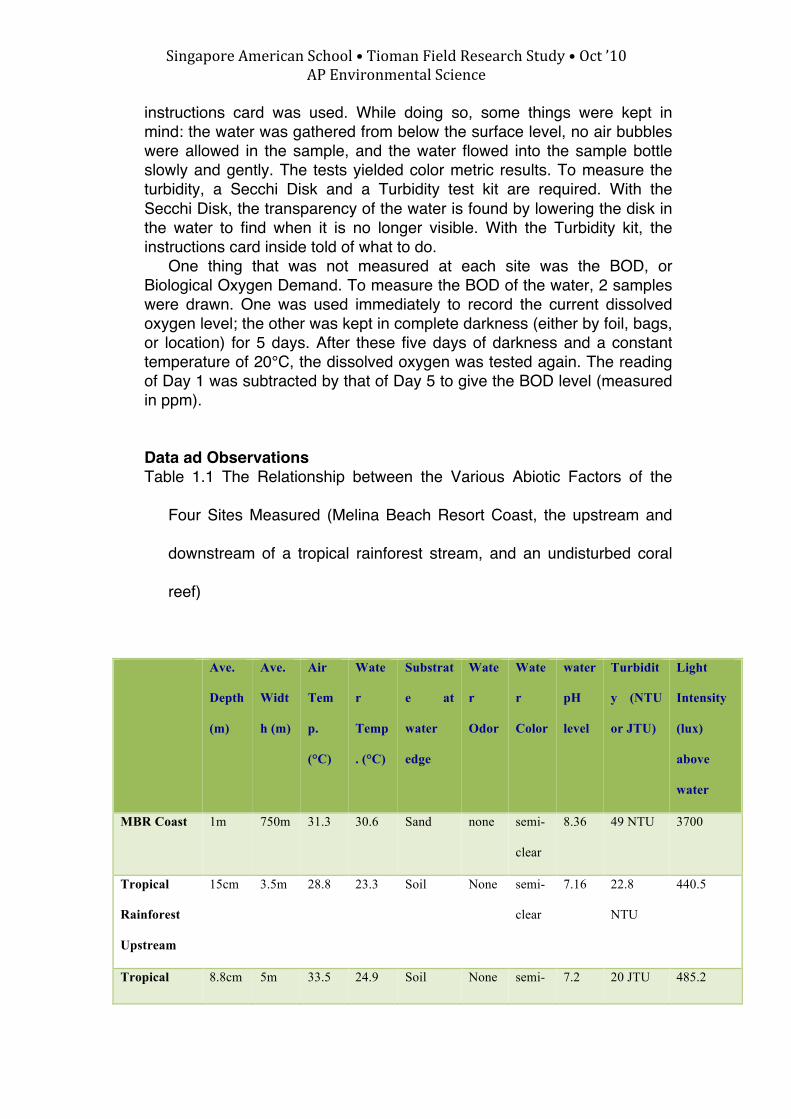
Data ad Observations Table 1.1 The Relationship between the Various Abiotic Factors of the
Four Sites Measured (Melina Beach Resort Coast, the upstream and
downstream of a tropical rainforest stream, and an undisturbed coral
reef)
Ave.
Depth
(m)
Ave.
Widt
h (m)
Air
Tem
p.
(°C)
Wate
r
Temp
. (°C)
Substrat
e at
water
edge
Wate
r
Odor
Wate
r
Color
water
pH
level
Turbidit
y (NTU
or JTU)
Light
Intensity
(lux)
above
water
MBR Coast 1m 750m 31.3 30.6 Sand none semi-
clear
8.36 49 NTU 3700
Tropical
Rainforest
Upstream
15cm 3.5m 28.8 23.3 Soil None semi-
clear
7.16 22.8
NTU
440.5
Tropical 8.8cm 5m 33.5 24.9 Soil None semi- 7.2 20 JTU 485.2

Singapore American School • Tioman Field Research Study • Oct ’10 AP Environmental Science
Rainforest
Down-
stream
15cm clear
Undisturbed
Coral Reef
4m N/A 34.1 30.2 Rock None blue 8.57 18.3 JTU 28750
Table 1.2 The Relationship between the Physiochemical Properties of the Water Sampled at Four
Various Locations (Melina Beach Resort Coast, the upstream and downstream of a tropical rainforest
stream, and an undisturbed coral reef)
Location Phosphate (ppm) Nitrate (ppm) Dissolved
Oxygen (ppm)
BOD (ppm)
Melina Beach
Resort Coast
0.0 0.4 4.5 4.5
Upstream
Tropical
Rainforest
0.1 0.1 12 7
Downstream
Tropical
Rainforest
0.0 0.0 6 1
Undisturbed
Coral Reef
0.05 0.0 7.7 2.2
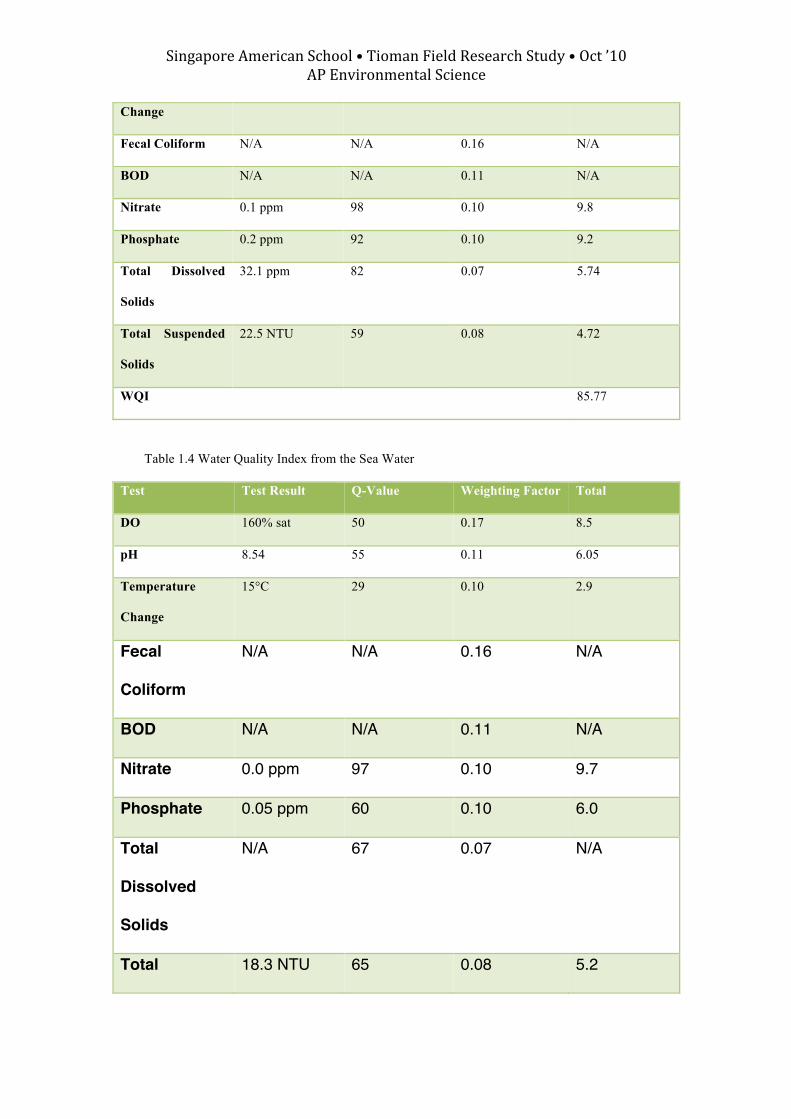
Table 1.3 Water Quality Index from the Freshwater Stream
Test Test Result Q-Value Weighting Factor Total
DO 75% sat 82 0.17 13.94
pH 7.74 91 0.11 10.01
Temperature 1.7°C 92 0.10 9.2
Singapore American School • Tioman Field Research Study • Oct ’10 AP Environmental Science
Change
Fecal Coliform N/A N/A 0.16 N/A
BOD N/A N/A 0.11 N/A
Nitrate 0.1 ppm 98 0.10 9.8
Phosphate 0.2 ppm 92 0.10 9.2
Total Dissolved
Solids
32.1 ppm 82 0.07 5.74
Total Suspended
Solids
22.5 NTU 59 0.08 4.72
WQI 85.77
Table 1.4 Water Quality Index from the Sea Water
Test Test Result Q-Value Weighting Factor Total
DO 160% sat 50 0.17 8.5
pH 8.54 55 0.11 6.05
Temperature
Change
15°C 29 0.10 2.9
Fecal
Coliform
N/A N/A 0.16 N/A
BOD N/A N/A 0.11 N/A
Nitrate 0.0 ppm 97 0.10 9.7
Phosphate 0.05 ppm 60 0.10 6.0
Total
Dissolved
Solids
N/A 67 0.07 N/A
Total 18.3 NTU 65 0.08 5.2
Singapore American School • Tioman Field Research Study • Oct ’10 AP Environmental Science
Suspended
Solids
WQI 58.96
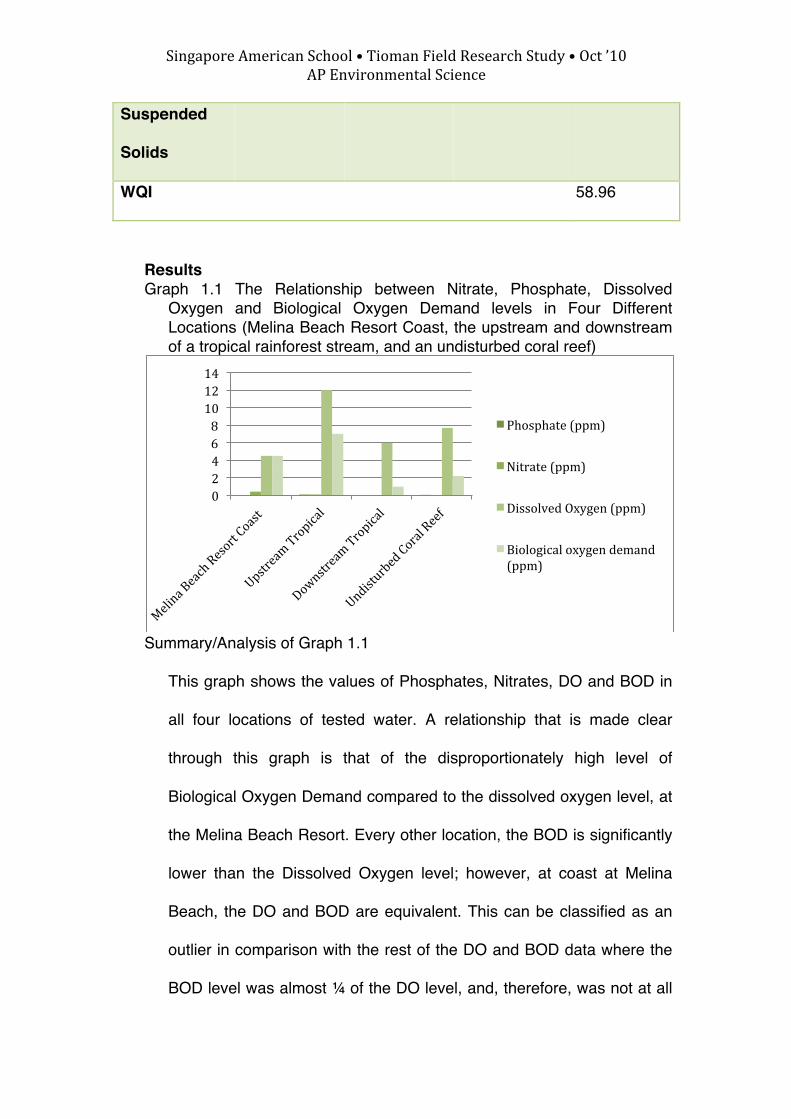
Results Graph 1.1 The Relationship between Nitrate, Phosphate, Dissolved
Oxygen and Biological Oxygen Demand levels in Four Different Locations (Melina Beach Resort Coast, the upstream and downstream of a tropical rainforest stream, and an undisturbed coral reef)
Summary/Analysis of Graph 1.1
This graph shows the values of Phosphates, Nitrates, DO and BOD in
all four locations of tested water. A relationship that is made clear
through this graph is that of the disproportionately high level of
Biological Oxygen Demand compared to the dissolved oxygen level, at
the Melina Beach Resort. Every other location, the BOD is significantly
lower than the Dissolved Oxygen level; however, at coast at Melina
Beach, the DO and BOD are equivalent. This can be classified as an
outlier in comparison with the rest of the DO and BOD data where the
BOD level was almost ¼ of the DO level, and, therefore, was not at all
0 2 4 6 8 10 12 14
Phosphate (ppm)
Nitrate (ppm)
Dissolved Oxygen (ppm)
Biological oxygen demand (ppm)

Singapore American School • Tioman Field Research Study • Oct ’10 AP Environmental Science
like Melina Beach. However, it is plausible that this may have been a
sampling error.
Graph 1.2 Physicochemical Factors of Air Temperature, Water
Temperature, and pH Levels acquired from the Various Locations
(Melina Beach Resort Coast, the upstream and downstream of a
tropical rainforest stream, and an undisturbed coral reef)
Summary/Analysis of Graph 1.2
This graph shows the measurements of Air Temperature, Water
Temperature, and the pH Level of each of the four locals. A relationship
that is quite evident is the closeness of the ph level among the varying
sites.
Analysis/Interpretation/Discussion
0
5
10
15
20
25
30
35
40
Melina Beach Resort Coast
Upstream Tropical Rainforest
Downstream Tropical Rainforest
Undisturbed Coral Reef
Air Temperature (°C)
Water Temperature (°C)
pH Level

Singapore American School • Tioman Field Research Study • Oct ’10 AP Environmental Science
Throughout all of the data collected in the four various places in
and around Tioman Island, numerous pieces of data were collected. Table 1.1 measures all of the abiotic factors that might have an effect on the water quality. It is of no value that, when looking at the two salt water locations, the coast and reef, the water temperature was nearly the same, yet the light intensity was almost 7 times greater at the undisturbed reef. Expecting that the more light that was penetrating the surface of the ocean, the warmer it would be, this data has proven this conclusion wrong and that the water has a high specific heat. A possible reasoning behind this would be that clouds may have recently formed over the coast before the readings were taken. Saying this means that the water would not have had time enough to cool, even though the light intensity would have been significantly less than to the previous readings. Table 1.2 functions as a good indicator of the water quality in the diverse areas. Given that there are low phosphate and nitrate levels in each, the areas can be categorized as good quality. Having higher phosphate and nitrate levels would mean that the body of water was becoming eutrophic, probably from the addition of nutrients from humans. The Water Quality Index of the coast and of the freshwater are displayed in Tables 1.3 and 1.4 and it is shown that the freshwater had a higher measure than the salt water.
However, within all of the data and observations made, it can be said that most of it is not 100% accurate due to errors. Some could have been small, such as not fully rinsing the probes before usage or reading the wrong color on the test results of the Chemetrics Test Kits. Also, some error may have not been the doing of those testing, but rather the environment itself. The tests may have been done one different types of days, like sunny or rainy causing the results to vary in accuracy. These could not have been controlled, but others such as clean equipment and clear reading should have been brought more to attention in terms of getting the proper data.
Because most of the data and tests showed that the levels of
such things as BOD, pH, Nitrates, and Phosphates, etc, to be normal or good, it is shown that the areas tested were moving on successfully. Some of the sites appear to be more sustainable than the others. For example, because the coast at Melina Beach deals with people on a day-to-day basis, it is not as sustainable because one cannot control how all people deal and interact with an ecosystem. But, the stream in the rainforest and the undisturbed coral reef are in locations that are rarely affected by human forces that would cause harm to the ecosystems; therefore, they are found more sustainable. But, just because they appear to be more sustainable, all the sites should be given proper attention and protection. They are all necessary for organisms’ habitats and other’s as a source of water and nutrients and they should not be taken for granted.
Singapore American School • Tioman Field Research Study • Oct ’10 AP Environmental Science
Real World Application
Each of the places that data was collected from contains different helping factors for their ecosystems as well as for others to use. These include the fact that they are the habitat for many a species and they provide shelter and nutrients for those living in them as well as for those who feed off of it. This includes humans as well. They are sources of food and water for humanity. If the water is polluted, they will not be as usable for drinking or cooking. Not only that, but also, it would be difficult for the organisms to continue living, which would hurt the amount of seafood available for consumption, which may also hurt jobs, such as those of fishermen. It is important for these locales to be kept sustained and protected in order for theirs and the sake of the organisms that live there’s survival.

Singapore American School • Tioman Field Research Study • Oct ’10 AP Environmental Science
Macroinvertebrate Survey of freshwater stream, quality index results
Back ground
In fresh water stream survey, we collected the data based on our investigation and
searched the organisms that live in the fresh water stream. The river that we used
was Sungei Paya, which was 2hours away from our resort. Since it was deep inside
the secondary forest, the temperature was cooler because the trees blocked the
sunlight.
Purpose
In Tioman trip, one investigates the WQI of fresh water stream and collected the data.
The purpose of this investigation is to improve one’s understandings of how to use
test kits and other technology to make measurements of familiar components of the
natural world, to collect the data of the fresh water stream condition, to have a deep
understanding of how those water qualities can actually effect the organisms, and to
have a deep understanding of process of quality index investigation. Also, to have
deep understandings of the organisms that live around this area is important as well.
The most significant purpose was to have a deep understanding of how those water
qualities can actually effect the organisms. That is because slight changes in water
quality can affect the organisms. And for additional, the habitats that those organisms
live are keep changing due to the effect of the water pollution and the global warming,
so one has to understand that the small changes in those water temperature and
nutrients easily effect the ecosystem of this fresh water stream.
Materials
Probe
Water collecting bottles
pH solution to testify the amount of nutrients inside the water
Thermometer
Singapore American School • Tioman Field Research Study • Oct ’10 AP Environmental Science
Procedure
Group has to divide the jobs and each person has to research the different WQI. It is
good if everyone in the group can rotate around to deepen the understanding of this
investigation. It is crucial to do this investigation at the upper stream since it is less
effected by different factors. At the upper stream, group has to collect the data of the
water quality index such as temperature, pH, nitrates, and so on. One uses the probe
to find out the air temperature, water temperature, and light intensity. In order to find
these out, one has to set the probe at each different categories. For example, if one
is measuring the water temperature, one has to set the probe to water temperature
setting. So for the air temperature, one has to set the probe to the temperature
setting and just hold it with the hand above the air. One does the same thing for the
water temperature, insert the probe 10cm into the water and wait for the temperature
to stabilized. To measure the pH, one has to measure two different water
temperatures at two different spots. And find out the difference of those two
temperatures. This will be the q-value so use this to find out the pH in pH test results
table. At the middle stream, group had to research the living organisms that live in
this river. To find this out, group use the kick sampling method. Firstly, group place
the net vertically in the river bed facing the upper stream. Secondly, one person in
the group kicks different types of substrates. Thirdly, group collects those
organisms(if any) that came from those kicked substrates. Also, other people can
pick the random rocks and search for those little algae and insects sticking under the
rocks. And lastly, record those organisms that were found from this kick sampling.
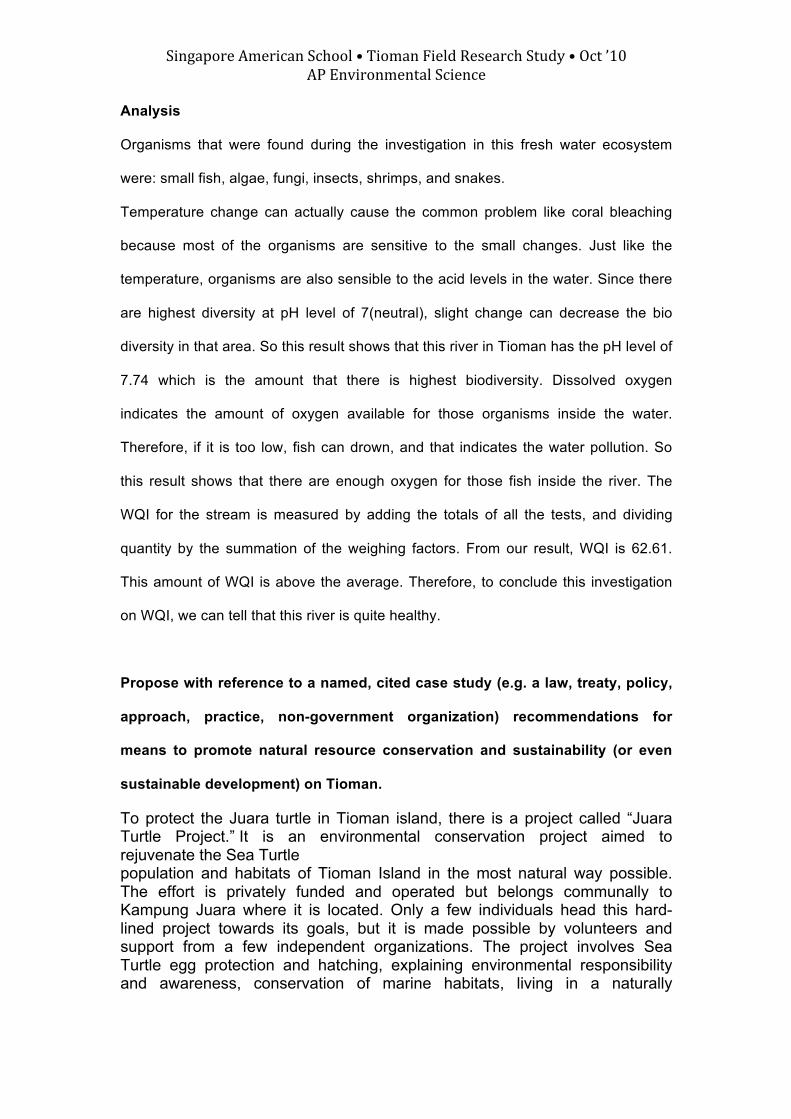
Physicochemical water sampling data
Parameter Fresh water stream sample
Light intensity 5250
Relative humidity 58.35%

Singapore American School • Tioman Field Research Study • Oct ’10 AP Environmental Science
Water temperature 24.7℃
Water temperature change 1.7℃
Air temperature 30.5℃
Dissolved oxygen 6ppm
Saturation of dissolved oxygen in water 75%
Water pH 7.74
Nitrate 0.01ppm
Total phosphates 0.2ppm
Total dissolved solids Turbidity 22.5ntu
Total Coliform +
Total Alkalinity 40ppm
Total Hardness -
Fresh water stream WQI
Test Result Q-value Weighing
factors
Total
DO 75% sat. 82 0.17 13.94
pH 7.74 91 0.11 10.01
Temperature
change
1.0 92 0.10 9.2
Fecal Coliform - - - -
BOD - - 0.11 -
Nitrate 0.1ppm 98 0.10 9.8
Phosphate 0.2ppm 92 0.10 9.2
TDS 32.1ppm 82 0.07 5.74
TSS 22.5 NTU 59 0.08 4.72
Sum of the nine totals = WQI 62.61
Singapore American School • Tioman Field Research Study • Oct ’10 AP Environmental Science
Analysis
Organisms that were found during the investigation in this fresh water ecosystem
were: small fish, algae, fungi, insects, shrimps, and snakes.
Temperature change can actually cause the common problem like coral bleaching
because most of the organisms are sensitive to the small changes. Just like the
temperature, organisms are also sensible to the acid levels in the water. Since there
are highest diversity at pH level of 7(neutral), slight change can decrease the bio
diversity in that area. So this result shows that this river in Tioman has the pH level of
7.74 which is the amount that there is highest biodiversity. Dissolved oxygen
indicates the amount of oxygen available for those organisms inside the water.
Therefore, if it is too low, fish can drown, and that indicates the water pollution. So
this result shows that there are enough oxygen for those fish inside the river. The
WQI for the stream is measured by adding the totals of all the tests, and dividing
quantity by the summation of the weighing factors. From our result, WQI is 62.61.
This amount of WQI is above the average. Therefore, to conclude this investigation
on WQI, we can tell that this river is quite healthy.
Propose with reference to a named, cited case study (e.g. a law, treaty, policy,
approach, practice, non-government organization) recommendations for
means to promote natural resource conservation and sustainability (or even
sustainable development) on Tioman.
To protect the Juara turtle in Tioman island, there is a project called “Juara Turtle Project.” It is an environmental conservation project aimed to rejuvenate the Sea Turtle population and habitats of Tioman Island in the most natural way possible. The effort is privately funded and operated but belongs communally to Kampung Juara where it is located. Only a few individuals head this hard-lined project towards its goals, but it is made possible by volunteers and support from a few independent organizations. The project involves Sea Turtle egg protection and hatching, explaining environmental responsibility and awareness, conservation of marine habitats, living in a naturally

Singapore American School • Tioman Field Research Study • Oct ’10 AP Environmental Science
respectful manner and sustainability within the surrounding political and economical environment.
Based on your experience with this investigation, do you think water pollution
is a problem in the water we tested in Tioman? In Singapore? In Southeast
Asia? In the USA?
There are many organisms live around the coast of Tioman because of those coral
reefs. However, what we saw during our investigation was the massive coral
bleaching that was cause by the global warming. Global warming increases the water
temperature, and since the corals are really sensitive to the water temperature, slight
change can cause them to coral bleaching. Therefore, we had to have 2hours boat
ride just to observe the coral reefs since the corals near our resort were mostly the
dead corals. Other thing I noticed was the oil spill from the boat that we used. The oil
spill was really obvious because the sea surface with the oil reflects more light than
the other areas of the sea surface. Since Malaysia’s tourism industries depends on
its nature, water pollution can cause serious damage not only to the nature but also
Malaysia’s economy. Coral bleaching and oil spill can cause to the decreases of
those organisms that live around the coast of Tioman, which is the important tourist
spot for Malaysia. So based on my experience in Tioman, I think It is crucial for
Malaysia to prevent the water pollution.

Singapore American School • Tioman Field Research Study • Oct ’10 AP Environmental Science
General Conservation Pulau Tioman
Tioman is an island off the coast of Malaysia whose coral reefs and
rainforests are well protected. Because the island’s dense rainforest and
diversely populated coral reef is so well protected, it attracts many tourists
and therefore is a major source of income. Around the world, there are many
beautiful ecosystems that are being destroyed because there aren’t laws that
are protect them or methods to enforce the protection laws. Tioman is one of
the few protected environments in the world, meaning that humans cannot
intentionally come in and take/destroy the environment. However, this doesn’t
mean that the humans still don’t do it. One of the most commonly destroyed
things in the environmental world is the coral reef.
Coral reefs are beautiful creations
that take thousands of years to
fully develop into the stereotypical
image people see in their mind
when they hear the phrase coral
reef. Many folks like to go fishing in the reefs and catch exotic looking fish. No
one can blame them, they must make a living, but they are destroying the
various kinds of coral species, the coral trout being one example, and
disturbing fish populations through something called overfishing. The grouper
fish was a fish that our guide, Ruben, explained was being overfished and
was not being able to reproduce fast enough. Coral reefs are also being

Singapore American School • Tioman Field Research Study • Oct ’10 AP Environmental Science
destroyed rapidly by fishermen using
unsustainable techniques such as
bomb fishing and cyanide fishing. In
bomb fishing, homemade bombs are
thrown into the water and when they
explode, scores of fish die from the
explosion, making it easy for the fishermen to capture them. In cyanide fishing,
the fishermen throw the poison into the water, which then paralyzes the fish,
making them float to the surface of the water. The fishermen then can easily
take a net and scoop the fish up. Not only are these methods extremely
harmful to the fish (often killing them), but also destroy the coral reefs. The
bomb fishing destroys coral that could have been growing for hundreds of
years in just seconds. The cyanide intoxicates the corals, making them too
sick too live. However, the fishermen are not the only guilty ones in the
destruction of the coral reefs; Us humans contribute just as well. By
contributing to global warming, we are contributing to the destruction of the
coral reefs. Because of the rising temperatures of the oceans, the reefs begin
to bleach. Coral bleaching is a major issue and results in the death to millions
of corals.

Singapore American School • Tioman Field Research Study • Oct ’10 AP Environmental Science
The rainforests contain so many species
and it is important to make sure it stays
that way. Organisms thrive on the forest
floor, in and around the trees, and up on
the canopies as well. Though many
rainforests around the world are protected by acts and laws, humans continue
to “intrude” and take what’s not theirs. Deforestation is the main threat to our
rainforests today, and continues to be an issue all around the world.
Deforestation destroys the habitat for many species, and in the case of
endangered species, this is very dangerous. We need to do everything we
can to preserve them, and cutting down their habitats is doing just the
opposite. Many might think that the animals living in the trees that they are
cutting down will just hop/jump/swing/crawl over to the next tree, a philosophy
that is extremely wrong. Eventually, the animal that has had to relocate will
adapt to the changes but natural adaptation takes a while, definitely not as
fast as the trees are being cut down.
Mangroves are home to a wide variety of
species that are specifically adapted to live in
the mangrove environment. The mangrove
snake, the flying tree snake, and the
mudskipper are examples of organisms that
are specifically adapted to living in the mangrove environment. The number of
mangroves remaining around the world is very little, but still mangroves are
being destroyed. The main cause for the destruction of mangroves is littering,

Singapore American School • Tioman Field Research Study • Oct ’10 AP Environmental Science
because as litter is dumped into the ocean, it will eventually wash up into the
mangroves and destroy/kill the animals and trees. Deforestation in mangroves
is a serious issue because the wood from the trees there is very high quality
lumber. This ecosystem, just like the rainforests and coral reefs is under a lot
of pressure and being eliminated rapidly.
The Melina Beach Turtle Hatchery is one way that humans are showing their
dedication to attempting to save the turtle population from going extinct. One
hatchery will not have much of an effect, so that’s why people around the
world are beginning to take initiative to help out. The turtle eggs are brought to
the Melina Beach Resort by collectors who are paid for their work by Eco-
Field Trips, the organization that runs this turtle hatchery. The turtle eggs can
take their time and hatch without the fear of predators coming in to eat them
or tourists stepping on them, etc. This method has shown a statistically
significant increase of the turtle population around the Tioman islands.

Singapore American School • Tioman Field Research Study • Oct ’10 AP Environmental Science
Biodiversity/Real World Application
The value of Biodiversity in Tioman can be seen as having intrinsic value
providing ecological services for humankind. The biodiversity in Tioman provides
economic, aesthetic, and recreational value. The aquatic ecosystem, with is beautiful
coral reefs and diverse population of fish brings economic stability to a small island.
With the current rise in temperatures the aquatic ecosystem is showing
distress. Tioman, which is relatively undeveloped, has a population that still supports
itself using techniques such as fishing. With growing populations the demand for fish
has risen, causing overfishing to occur all around Tioman. The environment is what
drives the economy, and we want this to be sustainable so that future generations
can continue with their traditions. In a growing society and with growing demand it is
important that we educate and set new regulations and policies to protect the coral
reefs and fish in turn.
Coral reefs are home to about 25 percent of marine life. Currently they are the
most threatened marine ecosystem. Although most of the living coral reefs around
Tioman are supposed to be protected there is currently no enforcement of the
regulations and/or scientific program to report of its success.
There is currently an ongoing case study in the Palau Islands and Micronesia
on the sustainability of coral reefs. “Transforming Coral Reef Conservation in the 21st
Century” by: Belinda Morris talks about the opportunity costs of protecting our reefs
for tomorrow and today, she talks about the great rewards future generations will
gain. This case study helps to identify the benefits of having Marine Protected Areas
and contrasts it with the difficult transitions populations in areas like Tioman must
endure. Peoples who earn their salary through jobs like fishing and shelling

Singapore American School • Tioman Field Research Study • Oct ’10 AP Environmental Science
collecting think short-term; Belinda Morris is saying that now we need to think long
term. The ways of our heritage are no longer sustainable for the future.
Through our transect lines on the undisturbed and disturbed coral reefs, the
biodiversity between the two is extremely apparent. Even the visibility and quality of
the water was noticeably different. The bleaching or cutting of the coral destroyed a
whole ecosystem and set off a chain of reactions.
Ideally stopping climate change would help lessening the bleaching of the
coral reefs, and unsustainable fishing techniques would end. For example blast
fishing, which is a favored technique in South Asia for its quantity over quality occurs
when fisherman throw bombs into the water causing a huge blast, sending all the
dead fish to the surface killing all the coral, which is then just left to decompose.
Many argue that there is no balance between ecological and economic values
of coral reefs. The Galapagos Islands in the Pacific Ocean is challenging this
assumption by setting new diving regulations. Parque Nacional Galapagos have
been working for the past 15 years to save the ecosystems around and on the
islands; they are trying to do this in a way that also allows for tourism. Working from
with the Parque Nacional the Galapagos Marine Reserve has been working to save
the aquatic diversity around the islands.
For 40 miles around the islands are fully protected, and the waters have been
separated into zones depending on the organisms that inhabit them. Some zones
are prohibited areas for tourism and fishing, and solely used for the purpose of
science and education. In the zones that are left untouched, the Marine Reserve
works to see the extent of human impact and the rate of recovery for the ecosystem.
The Marine Reserve is a huge part of the sustainability of the islands, they
control the fishing from overexploitation, they set heavy diving regulations to a few
diving companies who hold permits. They monitor the size of boats, and all other

Singapore American School • Tioman Field Research Study • Oct ’10 AP Environmental Science
aspects regarding the waters. Locally they teach the residents about the weather
such as El Nino and its effect on the environment, they also teach them how the
dangers of overexploitation and the intrinsic value of their surroundings. The
Galapagos have only recently been able to accomplish this whole system of
regulations, which are now followed. Since the 1970s, the government and locals
ignored the scientists even when over fishing was a problem. They were ignored for
so long that some organisms might never fully recuperate.
Tioman is different from the Galapagos in a lot of ways, but it is time for them
to set strict regulations before it is too late. We saw the destruction of the coral reefs
around the islands, and it will continue at an even faster rate unless we find the
balance between humans and their environment. Why should we be allowed to dive if
every time we destruct the habitat at a result? The Galapagos Islands are working on
finding equilibrium between humans and their surroundings. Unless Tioman creates
enforced rules and change in thinking their only source of income will be gone in the
next 15 years. We need to educate the locals about these astounding facts so that
they learn how to think long term. At Melina Beach they have started this process,
but it is not nearly at the level that it has to be to last for future generations.

Singapore American School • Tioman Field Research Study • Oct ’10 AP Environmental Science
Bibliography
"Beach Profiles." Typical Beach Profiles. Web. 29 Nov. 2010. <http://ux.brookdalecc.edu/staff/sandyhook/tripdata /beaches/profile.html>. "Fieldwork - Geography Teaching Today." Home - Geography Teaching Today.. Web. 29 Nov. 2010. <http://www.geographyteachingtoday.org.uk/fieldwork /resource/fieldwork-techniques/coasts/beach-profil es/>. Hanson, Lindsey. "Beach Profiling." Salem State University: Salem State Home. 19 June 2009. Web. 29 Nov. 2010. <http://www.salemstate.edu/~lhanson/gls214/gls214_p rof_procedure.html>. Melina Beach Resort: Home: Tioman Island Eco Resort: Malaysia. Web. 29
Nov. 2010. <http://www.tioman-melinabeach.com/>.
Peters, Francesc. "Turbulence and the Microbial Food Web: Effects on Bacterial Losses to Predation and on Community Structure." Journal of Plankton Research (2001). Print. Fitting Algae Into the Food Web." Bigelow Laboratory for Ocean Sciences :: Home. Web. 29 Nov. 2010. <http://www.bigelow.org/edhab/fitting_algae.html>. "Visualizing the Food-web Effects of Fishing for Tunas in the Pacific Ocean." Ecology and Society. Web. 29 Nov. 2010. <http://www.ecologyandsociety.org/vol9/iss1/art10/>.
"Coral Bleaching." Wikipedia. Web. 03 Nov. 2010.
<http://en.wikipedia.org/wiki/Coral_bleaching>.
"Coral Reef Bleaching." Odyssey Expeditions - Tropical Marine Biology
Voyages! Web. 03 Nov. 2010.
<http://www.marinebiology.org/coralbleaching.htm>.