Timothy Copeland Populations, David A. Venditti & … · ARTICLE The Importance of Juvenile...
17
This article was downloaded by: [Timothy Copeland] On: 15 October 2014, At: 07:10 Publisher: Taylor & Francis Informa Ltd Registered in England and Wales Registered Number: 1072954 Registered office: Mortimer House, 37-41 Mortimer Street, London W1T 3JH, UK Transactions of the American Fisheries Society Publication details, including instructions for authors and subscription information: http://www.tandfonline.com/loi/utaf20 The Importance of Juvenile Migration Tactics to Adult Recruitment in Stream-Type Chinook Salmon Populations Timothy Copeland a , David A. Venditti a & Bruce R. Barnett a a Idaho Department of Fish and Game, 1414 East Locust Lane, Nampa, Idaho 83686, USA Published online: 10 Oct 2014. To cite this article: Timothy Copeland, David A. Venditti & Bruce R. Barnett (2014) The Importance of Juvenile Migration Tactics to Adult Recruitment in Stream-Type Chinook Salmon Populations, Transactions of the American Fisheries Society, 143:6, 1460-1475, DOI: 10.1080/00028487.2014.949011 To link to this article: http://dx.doi.org/10.1080/00028487.2014.949011 PLEASE SCROLL DOWN FOR ARTICLE Taylor & Francis makes every effort to ensure the accuracy of all the information (the “Content”) contained in the publications on our platform. However, Taylor & Francis, our agents, and our licensors make no representations or warranties whatsoever as to the accuracy, completeness, or suitability for any purpose of the Content. Any opinions and views expressed in this publication are the opinions and views of the authors, and are not the views of or endorsed by Taylor & Francis. The accuracy of the Content should not be relied upon and should be independently verified with primary sources of information. Taylor and Francis shall not be liable for any losses, actions, claims, proceedings, demands, costs, expenses, damages, and other liabilities whatsoever or howsoever caused arising directly or indirectly in connection with, in relation to or arising out of the use of the Content. This article may be used for research, teaching, and private study purposes. Any substantial or systematic reproduction, redistribution, reselling, loan, sub-licensing, systematic supply, or distribution in any form to anyone is expressly forbidden. Terms & Conditions of access and use can be found at http:// www.tandfonline.com/page/terms-and-conditions
Transcript of Timothy Copeland Populations, David A. Venditti & … · ARTICLE The Importance of Juvenile...

This article was downloaded by: [Timothy Copeland]On: 15 October 2014, At: 07:10Publisher: Taylor & FrancisInforma Ltd Registered in England and Wales Registered Number: 1072954 Registered office: Mortimer House,37-41 Mortimer Street, London W1T 3JH, UK
Transactions of the American Fisheries SocietyPublication details, including instructions for authors and subscription information:http://www.tandfonline.com/loi/utaf20
The Importance of Juvenile Migration Tactics toAdult Recruitment in Stream-Type Chinook SalmonPopulationsTimothy Copelanda, David A. Vendittia & Bruce R. Barnetta
a Idaho Department of Fish and Game, 1414 East Locust Lane, Nampa, Idaho 83686, USAPublished online: 10 Oct 2014.
To cite this article: Timothy Copeland, David A. Venditti & Bruce R. Barnett (2014) The Importance of Juvenile MigrationTactics to Adult Recruitment in Stream-Type Chinook Salmon Populations, Transactions of the American Fisheries Society,143:6, 1460-1475, DOI: 10.1080/00028487.2014.949011
To link to this article: http://dx.doi.org/10.1080/00028487.2014.949011
PLEASE SCROLL DOWN FOR ARTICLE
Taylor & Francis makes every effort to ensure the accuracy of all the information (the “Content”) containedin the publications on our platform. However, Taylor & Francis, our agents, and our licensors make norepresentations or warranties whatsoever as to the accuracy, completeness, or suitability for any purpose of theContent. Any opinions and views expressed in this publication are the opinions and views of the authors, andare not the views of or endorsed by Taylor & Francis. The accuracy of the Content should not be relied upon andshould be independently verified with primary sources of information. Taylor and Francis shall not be liable forany losses, actions, claims, proceedings, demands, costs, expenses, damages, and other liabilities whatsoeveror howsoever caused arising directly or indirectly in connection with, in relation to or arising out of the use ofthe Content.
This article may be used for research, teaching, and private study purposes. Any substantial or systematicreproduction, redistribution, reselling, loan, sub-licensing, systematic supply, or distribution in anyform to anyone is expressly forbidden. Terms & Conditions of access and use can be found at http://www.tandfonline.com/page/terms-and-conditions
ARTICLE
The Importance of Juvenile Migration Tactics to AdultRecruitment in Stream-Type Chinook Salmon Populations
Timothy Copeland,* David A. Venditti, and Bruce R. BarnettIdaho Department of Fish and Game, 1414 East Locust Lane, Nampa, Idaho 83686, USA
AbstractThe existence of multiple migration tactics within a population has been observed for several fish species, and
they may contribute differentially to adult recruitment. Relative contribution by juveniles using the same habitatson different schedules is variable; therefore, understanding and conserving this diversity should be important tofisheries managers. We investigated adult recruitment by two distinct juvenile migration tactics in several spawningpopulations of stream-type Chinook Salmon Oncorhynchus tshawytscha in Idaho: those leaving the spawninggrounds as subyearlings during June through November (downstream rearing, or DSR, type) and those emigratingfrom natal areas 1 year after emergence (natal reach rearing, or NRR, type). The DSR type had greater juvenileabundance in all populations, although the NRR type exhibited better survival from the natal reach to themigratory corridor. The DSR type had greater survival from smoltification to adult return to freshwater comparedwith the NRR type. More DSR emigrants than NRR emigrants returned to freshwater as adults, although thedifference was influenced by cohort and population. Adult recruits to stream-type Chinook Salmon populations inIdaho are comprised mostly of DSR emigrants, i.e., fish that dispersed from their natal habitats and reared inreaches downstream. This finding is ubiquitous, although the size of the effect depends on cohort and population.We demonstrated that juvenile Chinook Salmon in Idaho do indeed use downstream rearing habitats effectively,thereby increasing recruitment of adults back to the spawning gravels in these populations. This study illustrateshow dispersive life histories are essential to achieve the full productive potential of migratory stream fishpopulations.
The return of spawning salmon to their natal areas is
remarkable in its accuracy and in the consistency of its timing
(Quinn 2005). Less is known about emigration, i.e., the down-
stream migration of juveniles. Recent work has led to a greater
appreciation of the variation in the ways that juvenile salmon
accomplish their journeys (e.g., Trudel et al. 2009), but the rel-
ative importance of how this life history diversity translates
into adult recruitment is poorly understood.
The existence of multiple migratory life history types
within a population has been observed for several fish species
(Secor 1999). The life histories within a cohort of juvenile
migratory fish often contribute differentially to recruitment
into the adult population (Reimers 1973; Limburg 2001; Cope-
land and Venditti 2009). Given sufficient temporal variability,
juveniles using the same habitats on different schedules may
have very different fates. Relative contribution by life history
types is temporally variable; therefore, understanding and con-
serving this diversity should be important to fisheries manag-
ers (Hilborn et al. 2003; Kerr et al. 2010; Petitgas et al. 2010).
Many salmon populations in the Pacific Northwest are
listed under the U.S. Endangered Species Act (Good et al.
2005). For effective conservation, population bottlenecks must
be identified in order to be ameliorated. However, variations
in life history, as identified above, may be affected differen-
tially by proposed conservation measures. Habitat restoration
has often been implemented with the goal of increasing returns
of adult salmon (Katz et al. 2007). These are typically
enhancements within spawning tributaries, which benefit most
the portion of the population that resides there until smoltifica-
tion. Characteristics of good spawning habitat are to some
*Corresponding author: [email protected] March 31, 2014; accepted July 16, 2014
1460
Transactions of the American Fisheries Society 143:1460–1475, 2014
� American Fisheries Society 2014
ISSN: 0002-8487 print / 1548-8659 online
DOI: 10.1080/00028487.2014.949011
Dow
nloa
ded
by [
Tim
othy
Cop
elan
d] a
t 07:
10 1
5 O
ctob
er 2
014

degree opposed to the characteristics of good rearing habitat,
i.e., cold, well-oxygenated, sterile streams are ideal environ-
ments for incubating embryos, but juveniles need food and
warmer temperatures for digestion (Mundie 1969; Quinn
2005). Therefore, rearing habitat limitations, rather than inade-
quate spawning gravels, are more likely to affect juvenile pro-
duction in salmon populations (Quinn 2005).
Pacific salmon (genus Oncorhynchus) exhibit a continuum
of life histories with respect to anadromy, which is one of the
defining characteristics of the genus (Quinn and Myers 2004).
Species, populations, and even individuals within populations
may vary with respect to the time they spend in freshwater
before emigrating to the sea as a smolt (Quinn 2005). For
example, populations of Chinook Salmon O. tshawytscha are
often classified (following Healey 1991) as stream-type (that
is, they have an extended freshwater rearing phase and enter
the ocean as yearlings) or ocean-type (they rear in freshwater
for a shorter time and enter the ocean before their first winter
as a subyearling). Within these broad categories there is con-
siderable variation in how individual Chinook Salmon use the
accessible freshwater habitat (e.g., Reimers 1973).
Dispersal of juvenile salmon for rearing and wintering is
likely of demographic importance in populations with
extended freshwater rearing. In some cases, juveniles disperse
into small, nonnatal tributaries to rear or spend the winter
(e.g., Murray and Rosenau 1989; Erkinaro et al. 1997; Brad-
ford et al. 2001; Daum and Flannery 2011). On the Oregon
coast, Coho Salmon O. kisutch use intermittent streams during
the winter, even though these reaches are dry during the sum-
mer (Ebersole et al. 2006). Levings and Lauzier (1991) found
that the main-stem reaches of the Fraser River basin, British
Columbia, were used as winter habitat by juvenile Chinook
Salmon. Large-scale dispersal by juvenile salmon should be
important in large river basins where the habitats that can sup-
port downstream rearing are connected to natal reaches.
There are limitations to juvenile production by stream-type
Chinook Salmon populations in relatively unaltered habitats in
Idaho (Copeland and Venditti 2009; Walters et al. 2013). Here
we present a more intensive investigation of the recruitment of
natural-origin Chinook Salmon exhibiting two juvenile migra-
tion tactics. Juveniles of the first type (downstream rearing, or
DSR) initially disperse downstream from natal habitat as parr,
winter downstream in nonnatal reaches, and then enter the
migration corridor as yearling smolts the following spring.
Juveniles of the second type (natal-reach rearing, or NRR)
rear in their natal habitat for roughly 1 year after emergence
until the onset of smoltification and active seaward migration.
Biologists have long known that DSR emigrants use down-
stream-rearing and wintering habitats in the lower stretches of
the Salmon and Grande Ronde rivers or in the middle reaches
of the Snake River (Chapman and Bjornn 1969; Raymond
1979; Figure 1), but explicit information on their early life his-
tory and fate through adulthood is lacking. Our goal was to
elucidate the demographic importance of the two juvenile
migration tactics in 11 stream-type Chinook Salmon popula-
tions in Idaho by providing comparisons of (1) estimated emi-
grant abundance at exit from the natal reach, (2) estimated
survival from natal reach to migration corridor entry, (3) esti-
mated survival from migration corridor to adult return to fresh-
water, and (4) estimated total adult recruitment to freshwater
as well as survival from natal reach to adult.
We made several predictions regarding survival among the
stages defined above and number of adult recruits of each
type. We knew that abundance of DSR emigrants would
exceed abundance of NRR emigrants of the same cohort (Wal-
ters et al. 2013). A clear contrast in rate of survival from emi-
gration from natal areas to migration corridor entry was
anticipated because a portion of the DSR marked at emigration
from natal areas die during the winter before the NRR from the
same cohort were marked (hypothesis [H]1: DSR < NRR). We
hypothesized that the influence of initial emigration timing
would become negligible after migration corridor entry
because both DSR and NRR juveniles would be large, actively
migrating smolts (H2: DSR D NRR). Given H1 and H2, we
hypothesized that survival from natal reach to adult would
likely favor the NRR emigrants (H3: DSR < NRR), but the
DSR type would return more adults to freshwater because
DSR emigrants were numerically dominant (H4: DSR >
NRR). We knew a priori that there would be differences
among populations and among cohorts; therefore, these were
included as factors in the analysis, but our focus was the com-
parison of the two types.
METHODS
Study populations.—We examined juvenile production for
nine Chinook Salmon populations in Idaho (Figure 1) for 11
cohorts (fish spawned during 1997–2007). All populations are
part of the Snake River spring–summer Chinook Salmon Evo-
lutionarily Significant Unit, which is listed as threatened under
the U.S. Endangered Species Act (NMFS 1992). All Snake
River spring–summer Chinook Salmon are considered to have
a stream-type life history (Good et al. 2005). Snake River
spring–summer Chinook Salmon are genetically distinct from
Chinook Salmon from other parts of the Columbia River basin
and from the fall Chinook Salmon within the Snake River,
which have an ocean-type life history (Waples et al. 2004;
Narum et al. 2007). However, approximately one-third of the
smolts from the Pahsimeroi River population emigrate to the
ocean as subyearling smolts, which have very low adult return
rates (Copeland and Venditti 2009; D. A. Venditti, unpub-
lished data), so only the DSR and NRR emigrants from the
Pahsimeroi River are used in this analysis.
Data collection.—Emigrating Chinook Salmon juveniles
were collected by a rotary screw trap, typically located near
the lower extent of major spawning areas. The traps were
deployed as early as possible in the spring (usually early
March) and operated until the formation of ice prevented trap
JUVENILE MIGRATION TACTICS OF CHINOOK SALMON 1461
Dow
nloa
ded
by [
Tim
othy
Cop
elan
d] a
t 07:
10 1
5 O
ctob
er 2
014

FIGURE 1. Location of study reaches and Chinook Salmon populations in Idaho. Squares indicate locations of rotary screw traps. Inset shows the study area in
relation to the Columbia River basin and Bonneville Dam.
1462 COPELAND ET AL.
Dow
nloa
ded
by [
Tim
othy
Cop
elan
d] a
t 07:
10 1
5 O
ctob
er 2
014

operation (usually the middle of November). Before they were
processed, all fish were anesthetized with a buffered solution
of tricaine methanesulfonate (MS-222). Trap tenders proc-
essed fish at least once daily. Fish were counted and measured,
and a subsample was tagged with a PIT tag. The transponder
in these tags emits a unique code that can be read by a detector
when the tag passes through a magnetic field (Prentice et al.
1990). All fish were measured to the nearest 1 mm from the
tip of the snout to the fork of the caudal fin (FL) and scanned
for the presence of a PIT tag. Size and visual characteristics
(e.g., silver color and parr marks) were used to distinguish
NRR (which emigrate directly to the ocean) and DSR (which
winter downstream from the trap and emigrate the following
spring) for 2–4-week period when both migratory types were
captured concurrently (Figure 2). After processing, all PIT-
tagged fish were released approximately 0.5 km upstream
from the trap. Efficiency of the trap was calculated from recap-
tures of these fish. Recaptured fish and any individuals not
tagged were released below the trap.
Tagging procedures followed recommendations of the PIT
Tag Steering Committee (1999). Natural-origin fish (as evi-
denced by an intact adipose fin) �60 mm FL were eligible for
tagging (see procedures below). We assumed there was no
size-related effect from tagging on growth or survival within
the size range tagged (see Ombredane et al. 1998). Tags were
injected into the body cavity using a hypodermic needle. Nee-
dles and tags were sterilized in ethanol for 10 min prior to and
between uses. Essentially all NRR emigrants trapped were
tagged. We tagged DSR emigrants at a rate determined by the
expected number of emigrants and the number of tags avail-
able for the year, which spread tagging effort over the entire
migratory period. Tagging data were recorded into a computer
file each day and were uploaded to the central repository for
all PIT-tagging activities in the Columbia Basin (PIT Tag
Information System [PTAGIS], www.ptagis.org) within 48 h.
We queried the PTAGIS database for detections of tagged
fish as they entered the migratory corridor as smolts at Lower
Granite Dam and as returning adults ascending Bonneville
Dam (Figure 1). Lower Granite Dam (695 km from the ocean)
is the first dam encountered by smolts during seaward migra-
tion. Smolts pass the dam primarily through turbine intakes or
over the spillway when water is spilled. A portion of the PIT-
tagged smolts entered the turbine intakes and was routed away
from the powerhouse by submersible bar screens into a bypass
fitted with PIT tag monitors that detected PIT-tagged fish with
nearly 100% efficiency (Prentice et al. 1990). Bonneville Dam
(234 km from the ocean) is the first dam encountered by adults
returning to freshwater, and above this point other potentially
confounding factors come into play (e.g., nonselective harvest
and spill management); therefore, this is a logical endpoint for
our study. The ladders that provide adult passage are also
equipped with highly efficient PIT tag monitors (i.e., probabil-
ity of detection �1.0: Fryer et al. 2012). We downloaded the
detection data for both juveniles and adults from the central
database. Detection information was linked to the tagging
information.
Data analyses.—Abundance of each emigrant type as they
exited the natal reach (natural-origin fish only) was estimated
with mark–recapture software designed specifically for time-
stratified rotary screw trap data developed by Steinhorst et al.
(2004). Periods during which the DSR and NRR passed the
traps were further stratified based on changes in flow, tempera-
ture, or other variables that affect trap efficiency. Abundance
of all emigrants from a cohort by type was estimated using a
summation of Bailey’s modified estimator (Ricker 1975),
NjDXkiD 1
ci.miC 1/=.riC 1/;
where Nj is number of emigrants of type j, k is the number of
periods designated, ci is the number of all fish captured, mi is
the number of tagged fish released in period i, and ri is number
of recaptures in period i. The estimator was computed using
an iterative maximization of the log likelihood, assuming fish
are captured independently with probability pi (equivalent to
trap efficiency) and tagged fish mix thoroughly with untagged
fish. To get population abundance in populations with more
than one trap, abundances were summed because the traps
were sampling different tributaries (e.g., in the South Fork
Clearwater River population; Figure 1). The point estimates of
abundance from each population are used for determining tag-
ging rates. There was no spawning observed in Marsh Creek
in 1999; therefore, we excluded that cohort from the analysis.
The Big Creek rotary screw trap was first run in 2007, so there
are only data from the 2006 and 2007 cohorts for that
population.
We estimated survival of each migratory type based on the
number of tags placed and then detected at Lower Granite and
FIGURE 2. An example of the separation between natal-reach-rearing
(NRR) and downstream-rearing (DSR) types of Chinook Salmon based on
length and time of capture. Data are from individuals tagged from the Marsh
Creek population in 2008. The NRR are from the 2006 cohort, and the DSR
are from the 2007 cohort. Vertical lines indicate the period of time when the
two types were collected concurrently. Dates are given as month/day.
JUVENILE MIGRATION TACTICS OF CHINOOK SALMON 1463
Dow
nloa
ded
by [
Tim
othy
Cop
elan
d] a
t 07:
10 1
5 O
ctob
er 2
014

Bonneville dams. Survival from trap to Lower Granite Dam
(St¡l) and the probability of detection at the dam were com-
puted using a Cormack–Jolly–Seber model implemented by
SURPH software (Lady et al. 2010). Survival from smolt emi-
gration at Lower Granite Dam to adult return to Bonneville
Dam, commonly referred to as smolt-to-adult return (SAR)
rate, was computed as the number of PIT tags detected on
adult return at Bonneville Dam divided by the number of tags
passing Lower Granite Dam (tags detected in juveniles
adjusted for detection probability). Survival rate of fish pass-
ing the traps to adulthood (Sa) was estimated by dividing the
number of adult detections by the number of PIT tags placed
in each cohort because detection probability of adults ascend-
ing the Bonneville Dam fish ladders is essentially 1.0 (Fryer
et al. 2012) and therefore equivalent between migratory types.
Our goal was to understand the importance of the migratory
types to population dynamics, which requires an estimate of
adult abundance. Total adult recruitment back to freshwater
was the number of tags detected expanded by the tagging rate
for each combination of migration tactic, cohort, and popula-
tion. The tagging rate was estimated by dividing the number
of tags placed by the abundance of each emigrant type as they
exited the natal reach.
We used a model selection approach to inference. Models
were compared and a final model selected for inference based
on Akaike’s information criterion (AIC) corrected for small
sample sizes (AICc), which is a quantitative metric that meas-
ures a tradeoff of model fit versus parsimony (Burnham and
Anderson 2002). We report the ANOVA statistics for each
selected model. Acceptable risk of type 1 error was set at 0.05.
All models were implemented as general linear models using
Systat version 13. Performance of each selected model was
assessed by inspection of the residuals.
Each survival metric (St¡l, SAR, Sa) was compared
between types by taking the natural logarithm of partitioned
survival by DSR emigrants over that of NRR emigrants for
each population by cohort. Therefore, we tested the ratio of
survival, i.e., loge (DSR S/NRR S), which is interpreted as the
number of DSR surviving for each surviving NRR emigrant.
Thus, the global model was
Loge.DSR S=NRR S/Dbo Cbyr Cbpop C e;
where bo is the overall mean, byr is the cohort effect, bpop is
the population effect, and e is residual error. We tested for an
interaction between population and cohort with Tukey’s test
of additivity (Steel et al. 1997). Briefly, predicted values from
the main effects model are output and the analysis is rerun
using the squared predicted values as a regressor. In this analy-
sis, each cohort by population combination is considered a rep-
licate. We excluded year-class failures from the SAR and Saanalyses (i.e., no adults detected from either type). There were
several instances in which adults were detected from one type
but not from the other, so we added a small constant to each
SAR and Sa estimate. The minimum observed SAR
(0.001101) and Sa (0.000174) were used, which approximate
the lowest survival that was detectable. Given that there were
more zeros in NRR returns, these additions provided conserva-
tive metrics with which to test hypotheses. The value of bo
was used to evaluate hypotheses H1, H2, and H3.
Total adult recruitment was modeled using a square-root
transformation before analysis (y0 D ffiffiffiffiffiffiffiffiffiffiffiffiffiffiyC 0:5
p/ to address
parametric model assumptions (Zar 1999). There may be dif-
ferences among cohorts and populations, so these were
included to account for their effects and potential interactions.
The global model used was then
N Dbo Cbtype Cbyr Cbpop C .btype £ yr/
C .btype £bpop/C .bpop £byr/C e;
where btype is the effect of emigrant type and the other
parameters are as defined above. Because we were specifically
interested in the effects of emigrant type, only models with
that effect were evaluated. Models considered included the
global model, main effects only, and all possible combinations
of two-way interactions. The primary interest is in the differ-
ence between adult recruitment by type, so the value of btype
was used to evaluate hypothesis H4.
RESULTS
There were 330,336 juvenile Chinook Salmon PIT-tagged
among the 11 cohorts represented in this study, and of these
0.3% were detected as adults returning to Bonneville Dam.
We PIT-tagged 2.2% of the DSR emigrants and 10.4% of the
NRR emigrants. There were 906 DSR tags and 226 NRR tags
detected as adults at Bonneville Dam. The abundance of DSR
emigrants exiting the natal reaches was much greater than that
of the NRR emigrants, averaging 85.8% of the juvenile pro-
duction over all populations and cohorts. The average propor-
tion of DSR emigrants ranged from 98.9% in the Secesh
population to 70.8% in the South Fork Clearwater population.
Selected details of trapping results and estimates used in the
analyses are presented in Table A.1 in the Appendix.
Differential Life Stage Survival
Survival from trap to Lower Granite Dam was almost
always higher for NRR emigrants than for DSR emigrants
(Figure 3). The average loge ratio of St-l was ¡0.89, i.e., sur-
vival of NRR emigrants was 2.4 times higher on average. The
only positive loge ratio was in the 2007 cohort from the Secesh
River, in which St-l was higher for DSR emigrants. All other
loge St-l ratios were negative and ranged from ¡0.01 to ¡2.52.
Model selection for St-l was not straightforward. The AICc
for the full model was 58.95 but the main effects were not sig-
nificant, making their interaction hard to interpret. The next
1464 COPELAND ET AL.
Dow
nloa
ded
by [
Tim
othy
Cop
elan
d] a
t 07:
10 1
5 O
ctob
er 2
014

best model had an AICc of 60.21 (a difference of <2), indicat-
ing an equivalent amount of support (Burnham and Anderson
2002), so we selected that model for inference. The selected
model of relative juvenile survival included both population
and cohort effects (Table 1). The estimate of bo (–0.90) was
significantly less than zero (F D 628.3, P < 0.001); therefore,
survival to Lower Granite Dam was significantly greater for
NRR emigrants. The predicted difference between DSR St-land NRR St-l was least in the Secesh population and greatest
in the South Fork Clearwater population. Similarly by cohort,
the predicted difference between DSR St-l and NRR St-l was
greatest in the 2001 cohort and least in the 1998 cohort. How-
ever, note that St-l estimates for DSR emigrants included win-
ter mortality whereas St-l for NRR emigrants did not because
the latter were not tagged until exiting the natal reach after
winter.
Relative SAR was more variable but tended to favor DSR
emigrants (Figure 4). The average loge SAR ratio was 0.50,
which means that DSR SAR was 1.6 times higher on average.
However, values ranged from ¡3.1 to 3.7. The extremes
occurred when adults of one emigrant type but not the other
were detected in a cohort. Of the 78 cohorts that produced an
adult recruit, there were 26 instances of zero returns by one
type when the other produced adults. In 18 of these 26 instan-
ces, the NRR type produced no adults.
The best model of relative SAR included a population
effect (Table 1). This model had an AICc weight > 0.99, indi-
cating it essentially was the only supportable model. The esti-
mate of bo (0.43) was significantly greater than zero (F D8.64, P < 0.004); therefore, predicted survival from Lower
Granite Dam to adult return was significantly greater for DSR
FIGURE 3. Loge ratios of survival of Chinook Salmon from the trap to
Lower Granite Dam (St-l). Points above zero (dashed line) indicate better sur-
vival by downstream-rearing emigrants; points below zero indicate better sur-
vival by natal-reach-rearing emigrants. Boxes represent the middle 50% of the
observations and the median is shown by the bisecting line. Whiskers show
range of values within 1.5 times the interquartile range. Outliers are repre-
sented by asterisks (*).
TABLE 1. Results of ANOVA of the selected models for survival from natal reach to Lower Granite Dam (St-l), smolt-to-adult survival (SAR), survival to
adulthood (Sa), and number of adult returns (number) for Chinook Salmon.
Source Sums of squares df Mean squares F-ratio P-value
Loge ratio St-lPopulation 5.48 8 0.69 8.43 <0.001
Cohort 4.75 10 0.48 5.85 <0.001
Error 5.69 70 0.08
Loge ratio SAR
Population 33.48 8 4.19 2.69 0.01
Error 107.22 69 1.55
Loge ratio SaPopulation 74.67 8 9.33 4.22 <0.001
Error 152.62 69 2.21
Number
Population 2,635.91 8 329.49 15.17 <0.001
Cohort 1,669.74 10 166.97 7.69 <0.001
Type 1,665.05 1 1,665.05 76.66 <0.001
Population £ Type 2,389.61 8 298.70 13.75 <0.001
Cohort £ Type 720.06 10 72.01 3.32 <0.001
Error 3,040.65 140 21.72
JUVENILE MIGRATION TACTICS OF CHINOOK SALMON 1465
Dow
nloa
ded
by [
Tim
othy
Cop
elan
d] a
t 07:
10 1
5 O
ctob
er 2
014

emigrants. The predicted loge SAR ratio favored DSR emi-
grants in six populations and NRR emigrants in three popula-
tions. The ratio of DSR SAR to NRR SAR was highest in the
Secesh and lowest in the Lemhi populations.
Survival rate to adulthood (Sa) was extremely variable
(Figure 5), averaging 0.38% over type, populations, and years.
Note that the average includes cohort failures, which are omit-
ted from the models reported below. Survival among cohorts
that returned adults varied from 0.11% in the 1999 cohort to
1.13% in the 2006 cohort. Among populations, Sa was greatest
for Big Creek (1.56%), but this was based only on two cohorts
when there were better-than-average returns in all populations.
For the other populations, Sa varied from 0.11% (South Fork
Clearwater) to 0.50% (Lemhi River). Averaging over all popu-
lation and cohort combinations, mean Sa was 0.32% and
0.43% for DSR emigrants and NRR emigrants, respectively.
The differential rate at which migrants returned as adults
was not influenced by cohort but there were differences among
populations (Table 1). This model also had an AICc weight >
0.99, indicating it essentially was the only supportable model.
The ratio of DSR Sa to NRR Sa was highest in the Secesh and
lowest in the Lemhi populations. The estimate of bo (¡0.11)
was not significantly different from zero (F D 0.35, P D 0.56);
therefore, survival from the natal reach to adult return to fresh-
water was equivalent between types after population and
cohort effects were accounted for.
Total Adult Recruitment
We estimated that 23,449 adults returned to freshwater
from our study populations from the 11 cohorts. Of these,
89.5% were returning DSR emigrants. The highest overall
recruitment was by the 2006 cohort with 4,601 adult recruits.
The lowest overall recruitment was by the 1999 cohort with
only 45 recruits. There were 12 instances of recruitment failure
among the study populations, of which half were in the 1999
cohort. The South Fork Clearwater and Lochsa populations
each had three failures: the 1999, 2001, and 2005 cohorts. In
most cases the majority of the returning adults were DSR emi-
grants (Figure 6). Conversely, adult spawning cohorts com-
posed mostly of returning NRR emigrants only occurred when
adult recruitment was very low. The cohorts dominated by
NRR adults (14 out of 78) had an average estimated return of
only 36 fish.
For inferences about total adult recruitment, we selected the
model including all main effects plus two interactions:
FIGURE 4. Loge ratios of smolt-to-adult return (SAR) rate for Chinook
Salmon. Points above zero (dashed line) indicate better survival by down-
stream-rearing emigrants; points below zero indicate better survival by
natal-reach-rearing emigrants. Boxes represent the middle 50% of the
observations and the median is shown by the bisecting line. Whiskers
show range of values within 1.5 times the interquartile range. Outliers are
represented by asterisks (*).
FIGURE 5. Loge ratios of survival of Chinook Salmon from the trap to adult
recruitment (Sa). Points above zero (dashed line) indicate better survival by
downstream-rearing emigrants; points below zero indicate better survival by
natal-reach-rearing emigrants. Boxes represent the middle 50% of the observa-
tions and the median is shown by the bisecting line. Whiskers show range of
values within 1.5 times the interquartile range. Outliers are represented by
asterisks (*).
1466 COPELAND ET AL.
Dow
nloa
ded
by [
Tim
othy
Cop
elan
d] a
t 07:
10 1
5 O
ctob
er 2
014

between emigrant type and population, and between emigrant
type and cohort (Table 1). The selected model was 32.8 times
(AICc weight, 0.97) more likely than the next best model
(AICc weight, 0.03), which had the main effects and one inter-
action term (emigrant type and population).The selected
model always predicted more DSR emigrants than NRR emi-
grants to return, which was supported by PIT tag observations.
Migrant type had a significant effect on the number of return-
ing adults (btype D 3.64; Table 1). The predicted difference
between types was lowest in Pahsimeroi, followed by Lochsa,
South Fork Clearwater, and Lemhi populations, respectively
(Figure 7).
DISCUSSION
Our goal was to compare the demographic performance of
the DSR and NRR types in order to increase understanding of
the dynamics of the Chinook Salmon study populations. We
confirmed that NRR emigrants survive from natal reach to the
migration corridor at a greater rate (H1: DSR < NRR). How-
ever, the second prediction (H2: DSR D NRR) was refuted
because we found that SARs were not equivalent; therefore,
the influence of type was not negligible after entering the
migratory corridor (DSR > NRR). Consequently, the third
prediction (H3: DSR < NRR) was refuted because survival
from natal reach to adult was equivalent between types
(DSR D NRR). Total adult recruitment to stream-type Chi-
nook Salmon populations in Idaho is comprised mostly of fish
that dispersed from their natal habitats and reared in reaches
downstream prior to smoltification (DSR type), although the
size of the effect depended on cohort and population. This
result corroborated our last prediction (H4: DSR > NRR).
We conclude that DSR emigrants are the more productive
juvenile type in stream-type Chinook Salmon populations in
Idaho. The relative survival advantage between the two types
(loge Sa) varies around zero among populations. However, the
numerical advantage of the DSR type carries through to adult
recruitment back to freshwater, although ratios of survival
rates were much more variable than the numerical effect. The
numerical advantage of adults produced from DSR emigrants
arises from a greater abundance at exit from natal reaches but
was not constant in time. For example, in cohorts returning
fewer than 100 fish, NRR emigrants dominated numerically
(Figure 6). Logically, relative fitness was greater for the NRR
type for those populations at those times. We discuss the
implications of our results for fitness and population dynamics
below.
Demographic Effects of Diversity in JuvenileMigration Tactics
Our study demonstrates the importance of different migra-
tory tactics to population recruitment and resilience. Diversity
in migratory life histories spreads demographic risk (Kerr
et al. 2010) and some life histories may tend to produce most
of the spawning population. The more dispersive type is often
the more productive component of the population (e.g., Kraus
and Secor 2005), as we also found. In effect, the dispersive
FIGURE 6. Proportion of the adult Chinook Salmon recruits that exhibited
the downstream-rearing tactic (DSR) in relation to total adult recruitment for
each population and cohort.
FIGURE 7. Comparison of total adult recruitment by emigrant type and
population for Chinook Salmon. For each population, data for down-
stream-rearing emigrants are on the left (open boxes) and natal-reach-rear-
ing emigrants are on the right (shaded boxes). Boxes represent the middle
50% of the observations and the median is shown by the bisecting line.
Whiskers show range of values within 1.5 times the interquartile range.
Outliers are represented by asterisks (*).
JUVENILE MIGRATION TACTICS OF CHINOOK SALMON 1467
Dow
nloa
ded
by [
Tim
othy
Cop
elan
d] a
t 07:
10 1
5 O
ctob
er 2
014

type expands the niche of the population to take advantage of a
greater expanse of the accessible habitat, resulting in greater
adult recruitment to the spawning population (e.g., Neville
et al. 2006; Morita et al. 2009; Anderson et al. 2013).
The fitness of a migratory life history is sensitive to the
costs of movement (Gross 1987; Hendry et al. 2004); there-
fore, migratory fishes need connected stream reaches with
rearing habitats of good quality to use (Northcote 1997).
Connectivity to high-quality rearing habitats is important,
even if these areas are not used for spawning and are distant
from natal reaches (Anderson et al. 2013). Nonnatal habitats
can provide significant survival and growth advantages for
juvenile salmon, especially through winter (Ebersole et al.
2006). There may be indirect synergistic benefits to individ-
ual fitness from the ability to use a suite of habitats because
juveniles that rear well tend to have good life performance
(Lindstr€om 1999; Metcalfe and Monaghan 2001; Taborsky
2006).The populations in this study have several hundred
kilometers of river between their natal reaches and Lower
Granite Dam (266 to 747 km), below which there is no
record of them rearing. Much of this area above the dam is
within statutory wilderness and therefore is affected mini-
mally by anthropogenic factors, and also offers the river-
scape connectivity necessary for dispersive life histories to
be successful (Baguette et al. 2013). Population dynamics
of stream fishes are greatly affected by the ability to move
among habitats and exploit food resources (Schlosser 1995;
Northcote 1997; Wipfli and Baxter 2010). Watersheds with
a high degree of habitat complementation and connectivity
support more robust salmon runs than watersheds with
lower habitat complementation and connectivity (Kim and
Lapointe 2011).
To advance our knowledge of the dynamics of these popu-
lations, it is necessary to understand the fitness values of the
emigrant types that comprise them and when each type is
likely to be successful. It is unclear from the data in hand at
what point DSR emigrants may achieve a true survival advan-
tage over NRR emigrants. In this study, winter survival is
accounted for in DSR emigrants, whereas it is not in NRR emi-
grants. Winter can be a stressful season for young salmonids
(Cunjak et al. 1998; Huusko et al. 2007; Brown et al. 2011).
If winter survival is accounted for in the NRR type, DSR fit-
ness may be higher than NRR fitness, but we do not have reli-
able survival estimates in the natal reaches of the study
populations. Smith and Griffith (1994) reviewed studies of
winter survival in 24 populations of juvenile salmonids
exposed to prolonged periods of 0�C temperatures and esti-
mated mean survival was 0.50 (SD D 0.18). Mitro and Zale
(2002) estimated winter survival was 0.20 in good habitat for
young Rainbow Trout O. mykiss in Henrys Fork in Idaho near
our study area (we use this as a benchmark for severe winter
conditions). Clearly, there should be some amount of winter
mortality on fish remaining in their natal reaches until
emigration.
We conducted a thought experiment to examine the
likely consequences of winter mortality on relative fitness
between the emigrant types. Consider Sw*, the NRR winter
survival threshold at which Sa is equivalent between types.
This threshold is related to Sa by loge(1) D loge[DSR Sa/
(NRR Sa £ Sw*)], which simplifies to Sw
* D DSR Sa/NRR
Sa. For the 1998 cohort in the upper Salmon River, the
closest data point to the model intercept bo (–0.11), Sw* is
0.92. On average across the data set, likely winter survival
will be such that the DSR type should have higher relative
fitness. The Sw* will vary among populations and is lowest
for the Lochsa population (0.32). Severe winter conditions
imply that the DSR migrant type has the higher relative fit-
ness in all populations. Winter severity will vary, which
may explain why there was a significant cohort effect on
total adult recruitment but not on Sa. Certainly, the pres-
ence of significant population and cohort effects on total
adult recruitment imply that relative fitness is not constant.
This thought experiment underscores the importance to
salmon conservation of dispersive life histories and the
rearing and wintering habitats that support them; however,
no studies have yet demonstrated that alternative migratory
tactics have equal or unequal average fitness in salmonid
fishes (Dodson et al. 2013).
Juvenile Chinook Salmon exhibiting the DSR migration
tactic achieved a survival advantage over the NRR emigrants
in SAR. Theoretically, dispersing individuals may accrue ben-
efits by avoiding conspecific competition or deteriorating envi-
ronmental conditions but incur costs by expenditures of
limited time and energy as well as the risk of failure, i.e., mor-
tality (Bowler and Benton 2005; Baguette et al. 2013). In this
case, we hypothesize that the proximate advantages of down-
stream rearing are (1) earlier and easier final emigration the
following spring and (2) increased overwinter survival and
additional growth opportunity. These two hypotheses are not
mutually exclusive.
In terms of demography, dispersive life history types
increase population productivity and resilience, but resident
life histories enhance stability, and thus both contribute to pop-
ulation persistence (Kerr et al. 2010). In the stream-type
Chinook Salmon populations of Idaho, the capacity of the hab-
itat to produce NRR emigrants is limited, whereas production
of DSR emigrants is less constrained (Walters et al. 2013). In
most of Idaho, the salmon spawning reaches are infertile
(Sanderson et al. 2009) and have a short growing season.
Salmon spawning is concentrated by philopatry, but rearing
space and food usually limit smolt production rather than
spawning habitat (Quinn 2005). This tension impels move-
ment by juveniles to prepare for successful emigration to, and
survival in, the ocean. The tradeoff between freshwater forag-
ing opportunities versus winter mortality encourages diversity
in migratory life histories (Dodson et al. 2013). Given limita-
tions in spawning reaches, the DSR type should be more
important in recovery as abundance is increasing, while the
1468 COPELAND ET AL.
Dow
nloa
ded
by [
Tim
othy
Cop
elan
d] a
t 07:
10 1
5 O
ctob
er 2
014

NRR emigrants should buffer the population during periods of
low abundance (Figure 6).
Implications for the Snake River Basin
For population-specific assessment and management of
Chinook Salmon in the Snake River basin, a better understand-
ing of rearing and winter habitats is needed. Migrating salmo-
nids often show fidelity to feeding and refuge habitats
(Northcote 1997); therefore, specific reaches may be important
to a population. In interior Oregon, Tattam (2006) found that
most individuals of a steelhead (anadromous Rainbow Trout)
population spent the winter in a relatively short reach in the
main stem of the South Fork John Day River. Confined use of
habitat increases population vulnerability to catastrophe. In
this study, we demonstrated recruitment of fish from down-
stream rearing habitats into the adult population, but we do not
know the extent of these habitats. However, DSR emigrants
typically arrive at Lower Granite Dam approximately a month
earlier than the NRR emigrants (Venditti et al. 2005), suggest-
ing that habitats occupied by DSR emigrants during winter are
a significant distance downstream from the natal reaches. Our
results suggest a broad focus is needed in restoration plans and
that rearing reaches downstream from spawning grounds
should also be addressed. In general, this study has interesting
demographic implications for how migratory populations of
stream fish use accessible habitats and how managers may use
this understanding to increase adult recruitment.
Similarly, management of the migration corridor is focused
on the aggregate rather than specific populations of concern. If
there are weak stocks, the aggregate approach may inhibit
effectiveness of recovery actions. Early ocean entrance seems
to be important to survival to adulthood (Scheuerell et al.
2009). Several studies have demonstrated that delayed emigra-
tion to the ocean results in lower survival (Petrosky and Schal-
ler 2010; Haeseker et al. 2012). Because DSR emigrants have
a different timing into the migration corridor (Venditti et al.
2005), management actions in the migratory corridor may
affect populations differently.
In summary, juvenile salmon migrate to the ocean where
they can maximize growth and therefore eventual fecundity.
Stream-type Chinook Salmon in Idaho spawn in some of the
highest, most remote locations accessible. Here they poten-
tially overseed the rearing capacity of natal habitats with eggs
but maximize early survival and therefore production of fry,
even though current adult escapements are well below histori-
cal abundance. However, these streams are infertile with short
growing seasons and harsh winters. It is logical that salmon
populations constrained by rearing and wintering habitat in
natal reaches would exhibit some amount of juvenile move-
ment to avoid these constraints. We demonstrated that juvenile
Chinook Salmon in Idaho do indeed use downstream rearing
habitats effectively, thereby increasing recruitment of adults
back to the spawning gravels in these populations. This study
illustrates how dispersive life histories are essential to achieve
the full productive potential of migratory stream fish
populations.
ACKNOWLEDGMENTS
Funding for this work was provided by the Bonneville
Power Administration (projects 1989-098-00 and 1990-055-
00). Trap operations were supervised by Kim Apperson, Brett
Bowersox, Arnie Brimmer, Nathan Brindza, Jeff Diluccia, Jon
Flinders, Ryan Kinzer, Brian Leth, and Jerry Lockhart. Kirk
Steinhorst (University of Idaho) provided statistical advice.
Paul Bunn created Figure 1. An earlier version of the manu-
script benefitted from critiques by Lance Hebdon, Charlie Pet-
rosky, and Bill Schrader. We greatly appreciate the numerous
constructive comments from William Connor, Matthew Kee-
fer, and two anonymous reviewers.
REFERENCESAnderson, J. H., G. R. Pess, P. M. Kiffney, T. R. Bennett, P. L. Faulds, W. I.
Atlas, and T. P. Quinn. 2013. Dispersal and tributary immigration by juve-
nile Coho Salmon contribute to spatial expansion during colonization. Ecol-
ogy of Freshwater Fish 22:30–42.
Baguette, M., S. Blanchet, D. Legrand, V. M. Stevens, and C. Turlure. 2013.
Individual dispersal, landscape connectivity and ecological networks. Bio-
logical Reviews 88:310–326.
Bradford, M. J., J. A. Grout, and S. Moodie. 2001. Ecology of juvenile Chi-
nook Salmon in a small non-natal stream of the Yukon River drainage and
the role of ice conditions on their distribution and survival. Canadian Jour-
nal of Zoology 79:2043–2054.
Brown, R. S., W. A. Hubert, and S. F. Daly. 2011. A primer on winter, ice, and
fish: what fisheries biologists should know about winter ice processes and
stream-dwelling fish. Fisheries 36:8–26.
Bowler, D. E., and T. G. Benton. 2005. Causes and consequences of animal
dispersal strategies: relating individual behavior to spatial dynamics. Bio-
logical Reviews 80:205–225.
Burnham, K. P, and D. R. Anderson. 2002. Model selection and multimodel
inference: a practical information-theoretic approach, 2nd edition. Springer-
Verlag, New York.
Chapman, D. W., and T. C. Bjornn. 1969. Distribution of salmonids in streams,
with special reference to food and feeding. Pages 153–176 in T. G. North-
cote, editor. Symposium on salmon and trout in streams. University of Brit-
ish Columbia, Vancouver.
Copeland, T., and D. A. Venditti. 2009. Contribution of three life history types
to smolt production in a Chinook Salmon (Oncorhynchus tshawytscha) pop-
ulation. Canadian Journal of Fisheries and Aquatic Sciences 66:1658–1665.
Cunjak, R. A., T. D. Prowse, and D. L. Parrish. 1998. Atlantic Salmon (Salmo
salar) in winter: “the season of parr discontent”? Canadian Journal of Fish-
eries and Aquatic Sciences 55(Supplement 1):161–180.
Daum, D. W., and B. G. Flannery. 2011. Canadian-origin Chinook Salmon
rearing in nonnatal U.S. tributary streams of the Yukon River, Alaska.
Transactions of the American Fisheries Society 140:207–220.
Dodson, J. J., N. Aubin-Horth, V. Th�eriault, and D. J. Pa�ez. 2013. The evolu-
tionary ecology of alternative migratory tactics in salmonid fishes. Biologi-
cal Reviews 88:602–625.
Ebersole, J. L., P. J. Wigington Jr., J. P. Baker, M. A. Cairns, M. R. Church, B.
P. Hansen, B. A. Miller, H. R. LaVigne, J. E. Compton, and S. G. Leibowitz.
2006. Juvenile Coho Salmon growth and survival across stream network
seasonal habitats. Transactions of the American Fisheries Society
135:1681–1697.
JUVENILE MIGRATION TACTICS OF CHINOOK SALMON 1469
Dow
nloa
ded
by [
Tim
othy
Cop
elan
d] a
t 07:
10 1
5 O
ctob
er 2
014

Erkinaro, J., J. B. Dempson, M. Julkunen, and E. Niemel€a. 1997. Importance
of ontogenetic habitat shifts to juvenile output and life history of Atlantic
Salmon in a large subarctic river: an approach based on analysis of scale
characteristics. Journal of Fish Biology 51:1174–1185.
Fryer, J. K., J. Whiteaker, and D. Kelsey. 2012. Upstream migration timing of
Columbia basin Chinook Salmon, Sockeye Salmon, and steelhead in 2010.
Columbia River Inter-Tribal Fish Commission, Technical Report 12-02,
Portland, Oregon.
Good, T. P., R. S. Waples, and P. B. Adams. 2005. Updated status of federally
listed ESUs of West Coast salmon and steelhead. NOAA Technical Memo-
randum NMFS-NWFSC-66.
Gross, M. R. 1987. Evolution of diadromy in fishes. Pages 14–25 inM. J. Dad-
swell, R. J. Klauda, C. M. Moffitt, R. L. Saunders, R. A. Rulifson, and J. E.
Cooper, editors. Common strategies of anadromous and catadromous fishes.
American Fisheries Society, Symposium 1, Bethesda, Maryland.
Haeseker, S. L., J. A. McCann, J. Tuomikoski, and B. Chockley. 2012.
Assessing freshwater and marine environmental influences on life-
stage-specific survival rates of Snake River spring-summer Chinook
Salmon and steelhead. Transactions of the American Fisheries Society
141:121–138.
Healey, M. C. 1991. Life history of Chinook Salmon (Oncorhynchus tshawyt-
scha). Pages 311–393 in C. Groot and L. Margolis, editors. Pacific salmon
life histories. University of British Columbia Press, Vancouver.
Hendry, A. P., T. Bohlin, B. Jonsson, and O. K. Berg. 2004. To sea or not to
sea? Anadromy versus non-anadromy in salmonids. Pages 92–125 in A. P.
Hendry and S. C. Stearns, editors. Evolution illuminated: salmon and their
relatives. Oxford University Press, New York.
Hilborn, R., T. P. Quinn, D. E. Schindler, and D. E. Rogers. 2003. Biocom-
plexity and fisheries sustainability. Proceedings of the National Academy of
Sciences of the USA 100:6564–6568.
Huusko, A., L. Greenberg, M. Stickler, T. Linnansaari, M. Nyk€anen, T. Veha-
nen, S. Koljonen, P. Louhi, and K. Alfredsen. 2007. Life in the ice lane: the
winter ecology of stream salmonids. River Research and Applications
23:469–491.
Katz, S. L., K. Barnas, R. Hicks, J. Cowen, and R. Jenkinson. 2007. Freshwater
habitat restoration actions in the Pacific Northwest: a decade’s investment in
habitat improvement. Restoration Ecology 15:494–505.
Kerr, L. A., S. X. Cadrin, and D. H. Secor. 2010. The role of spatial dynamics
in the stability, resilience, and productivity of an estuarine fish population.
Ecological Applications 20:497–507.
Kim, M., and M. Lapointe. 2011. Regional variability in Atlantic Salmon
(Salmo salar) riverscapes: a simple landscape ecology model explaining the
large variability in size of salmon runs across Gasp�e watersheds, Canada.
Ecology of Freshwater Fish 20:144–156.
Kraus, R. T., and D. H. Secor. 2005. Application of the nursery-role hypothesis
to an estuarine fish. Marine Ecology Progress Series 291:301–305.
Lady, J., P. Westhagen, and J. R. Skalski. 2010. SURPH (survival under pro-
portional hazards), version 3.1.1. Available: http://www.cbr.washington.
edu/analysis/apps/surph/. (October 2010)
Levings, C. D., and R. B. Lauzier. 1991. Extensive use of the Fraser River
basin as winter habitat by juvenile Chinook Salmon (Oncorhynchus tsha-
wytscha). Canadian Journal of Zoology 69:1759–1767.
Limburg, K. E. 2001. Through the gauntlet again: demographic restructuring
of American Shad by migration. Ecology 82:1584–1596.
Lindstr€om, J. 1999. Early development and fitness in birds and mammals.
Trends in Ecology and Evolution 14:343–348.
Metcalfe, N. B., and P. Monaghan. 2001. Compensation for a bad start: grow
now, pay later? Trends in Ecology and Evolution 16:254–260.
Mitro, M. G., and A. V. Zale. 2002. Seasonal survival, movement, and habitat
use of age-0 Rainbow Trout in the Henrys Fork of the Snake River, Idaho.
Transactions of the American Fisheries Society 131:271–286.
Morita, K., S. H. Morita, and S. Yamamoto. 2009. Effects of habitat fragmen-
tation by damming on salmonid fishes: lessons from White-spotted Charr in
Japan. Ecological Research 24:711–722.
Mundie, J. H. 1969. Ecological implications of the diet of juvenile coho in
streams. Pages 135–152 in T. G. Northcote, editor. Symposium on salmon
and trout in streams. University of British Columbia, Vancouver.
Murray, C. B., and M. L. Rosenau. 1989. Rearing of juvenile Chinook Salmon
in nonatal tributaries of the lower Fraser River, British Columbia. Transac-
tions of the American Fisheries Society 118:284–289.
Narum, S. R., J. J. Stephenson, and M. R. Campbell. 2007. Genetic variation
and structure of Chinook Salmon life history types in the Snake River.
Transactions of the American Fisheries Society 136:1252–1262.
Neville, H. M., J. B. Dunham, and M. M. Peacock. 2006. Landscape attributes
and life history variability shape genetic structure of trout populations in a
stream network. Landscape Ecology 21:901–916.
NMFS (National Marine Fisheries Service). 1992. Threatened status for Snake
River spring/summer Chinook Salmon, threatened status for Snake River
fall Chinook Salmon. Federal Register 57:78(22 April 1992)14653–14663.
Northcote, T. G. 1997. Potadromy in Salmonidae—living and moving in
the fast lane. North American Journal of Fisheries Management
17:1029–1045.
Ombredane, D., J. L. Baglini�ere, and F. Marchand. 1998. The effects of pas-
sive integrated transponder tags on survival and growth of juvenile Brown
Trout (Salmo trutta L.) and their use for studying movement in a small river.
Hydrobiologia 371/372:99–106.
Petitgas, P., D. H. Secor, I. McQuinn, G. Huse, and N. Lo. 2010. Stock collap-
ses and their recovery: mechanisms that establish and maintain life-cycle
closure in space and time. ICES journal of Marine Science 67:1841–1848.
Petrosky, C. E., and H. A. Schaller. 2010. Influence of river conditions during
seaward migration and ocean conditions on survival rates of Snake River
Chinook Salmon and steelhead. Ecology of Freshwater Fish 19:520–536.
PIT Tag Steering Committee. 1999. PIT tag marking station procedural man-
ual, version 2.0. Pacific States Marine Fisheries Commission, Portland,
Oregon.
Prentice, E. F., T. A. Flagg, C. S. McCutcheon, and D. F. Brastow. 1990. PIT-
tag monitoring systems for hydroelectric dams and fish hatcheries. Pages
323–334 in N. C. Parker, A. E. Giorgi, R. C. Heidinger, D. B. Jester Jr., E.
D. Prince, and G. A. Winans, editors. Fish-marking techniques. American
Fisheries Society, Symposium 7, Bethesda, Maryland.
Quinn, T. P. 2005. The behavior and ecology of Pacific salmon and trout. Uni-
versity of Washington Press, Seattle.
Quinn, T. P., and K. W. Myers. 2004. Anadromy and the marine migrations of
Pacific salmon and trout: Rounsefell revisited. Reviews in Fish Biology and
Fisheries 14:421–442.
Raymond, H. L. 1979. Effects of dams and impoundments on migrations of
juvenile Chinook Salmon and steelhead from the Snake River, 1966–1975.
Transactions of the American Fisheries Society 108:505–529.
Reimers, P. E. 1973. The length of residence of juvenile fall Chinook Salmon
in Sixes River, Oregon. Research Reports of the Fish Commission of Ore-
gon, Portland.
Ricker, W. E. 1975. Computation and interpretation of biological statistics of
fish populations. Fisheries Research Board of Canada Bulletin 191.
Sanderson, B. L., H. J. Coe, C. D. Tran, K. H. Macneale, D. L. Harstad, and A.
B. Goodwin. 2009. Nutrient limitation of periphyton in Idaho streams:
results from nutrient diffusing substrate experiments. Journal of the North
American Benthological Society 28:832–845.
Scheuerell, M. D., R. W. Zabel, and B. P. Sandford. 2009. Relating juvenile
migration timing and survival to adulthood in two species of threatened
Pacific salmon (Oncorhynchus spp.). Journal of Applied Ecology 46:
983–990.
Schlosser, I. J. 1995. Critical landscape attributes that influence fish population
dynamics in headwater streams. Hydrobiologia 303:71–81.
Secor, D. H. 1999. Specifying divergent migrations in the concept of stock: the
contingent hypothesis. Fisheries Research 43:13–34.
Smith, R. W., and J. S. Griffith. 1994. Survival of young Rainbow Trout during
their first winter in the Henry Fork of the Snake River, Idaho. Transactions
of the American Fisheries Society 123:747–756.
1470 COPELAND ET AL.
Dow
nloa
ded
by [
Tim
othy
Cop
elan
d] a
t 07:
10 1
5 O
ctob
er 2
014

Steel, R. G. D., J. H. Torrie, and D. A. Dickey. 1997. Principles and procedures of
statistics: a biometrical approach, 3rd edition. McGrawHill, Columbus, Ohio.
Steinhorst, K., Y. Wu, B. Dennis, and P. Kline. 2004. Confidence intervals for
fish out-migration estimates using stratified trap efficiency methods. Journal
of Agricultural, Biological, and Environmental Statistics 9:284–299.
Taborsky, B. 2006. The influence of juvenile and adult environments on life-
history trajectories. Proceedings of the Royal Society B 273:741–750.
Tattam, I. A. 2006. Seasonal life history of Oncorhynchus mykiss in the South
Fork John Day River basin, Oregon. Master’s thesis. Oregon State Univer-
sity, Corvallis.
Trudel, M., J. Fisher, J. A. Orsi, J. F. T. Morris, M. E. Thiess, R. M. Sweeting,
S. Hinton, E. A. Fergusson, and D. W. Welch. 2009. Distribution and migra-
tion of juvenile Chinook Salmon derived from coded wire tag recoveries
along the continental shelf of western North America. Transactions of the
American Fisheries Society 138:1369–1391.
Venditti, D. A., K. A. Apperson, A. Brimmer, N. Brindza, C. Gass, A. Kohler,
J. Lockhart. 2005. Idaho supplementation studies; brood year 2002 coopera-
tive report. Annual progress report to Bonneville Power Administration,
Project 1989-098-00, Portland, Oregon.
Walters, A. W., T. Copeland, and D. A. Venditti. 2013. The density dilemma:
limitations on juvenile production in threatened salmon populations. Ecol-
ogy of Freshwater Fish 22:508–519.Waples, R. S., D. J. Teel, J. M. Meyers, and A. R. Marshall. 2004. Life-history
divergence in Chinook Salmon: historic contingency and parallel evolution.
Evolution 58:386–403.Wipfli, M. S., and C. V. Baxter. 2010. Linking ecosystems, food webs,
and fish production: subsidies in salmonid watersheds. Fisheries
35:373–387.
Zar, J. H. 1999. Biostatistical analysis, 4th edition. Prentice Hall, Upper Saddle
River, New Jersey.
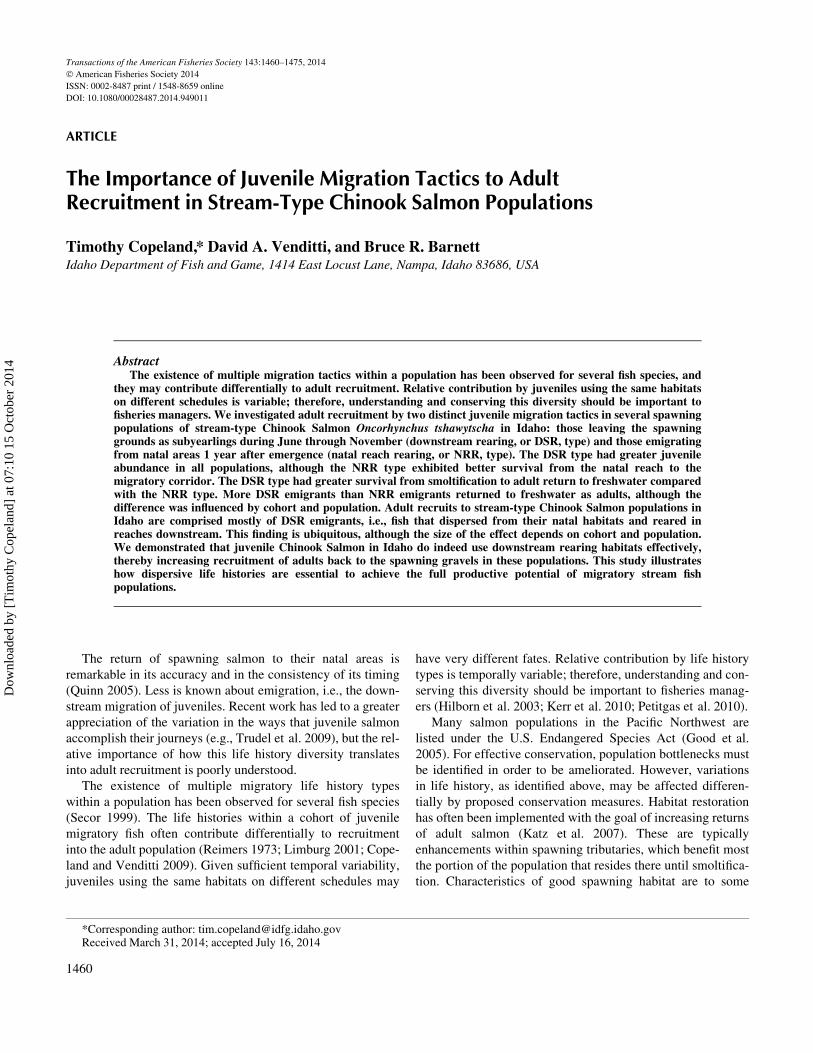
Appendix: Trap and Population Statistics
TABLE A.1. Summary of trap operations and values used in the analyses of Chinook Salmon by population, cohort, and tactic. These include number of tags
placed and estimates of trap efficiency, juvenile abundance (juvenile Nb), survival from trap to Lower Granite Dam (St¡l), smolt-to-adult return rate (SAR), sur-
vival from trap to adult (Sa), and total adult recruitment (adult Nb). Tactics are downstream rearing (DSR) or natal-reach rearing (NRR).
Cohort Tactic Tags Trap efficiency Juvenile Nb St¡l SAR Sa Adult NbBig Creek
2007 DSR 3,185 0.0923 46,555 0.3970 0.0301 0.0119 555
NRR 829 0.1000 9,331 0.6810 0.0124 0.0084 79
2006 DSR 5,454 0.2372 44,461 0.2580 0.0718 0.0185 823
NRR 725 0.0400 18,981 0.5140 0.0456 0.0234 445
Lemhi2007 DSR 3,223 0.0991 28,928 0.3335 0.0093 0.0031 90
NRR 340 0.1997 1,190 0.7172 0.0041 0.0029 4
2006 DSR 3,327 0.3440 12,909 0.3175 0.0293 0.0093 120
NRR 258 0.2610 644 0.7539 0.0308 0.0233 15
2005 DSR 2,452 0.2743 11,052 0.3281 0.0394 0.0061 68
NRR 310 0.3162 1,206 0.7200 0.0086 0.0032 4
2004 DSR 2,063 0.1584 9,951 0.2658 0.0055 0.0015 14
NRR 409 0.3374 1,312 0.6800 0.0108 0.0073 10
2003 DSR 1,613 0.1491 6,375 0.1961 0.0000 0.0000 0
NRR 383 0.2559 1,590 0.4700 0.0000 0.0000 0
2002 DSR 4,147 0.2167 17,981 0.2646 0.0046 0.0012 22
NRR 586 0.2872 2,000 0.5300 0.0000 0.0000 0
2001 DSR 2,580 0.0792 40,429 0.1712 0.0045 0.0008 31
NRR 370 0.1005 2,898 0.4800 0.0113 0.0054 16
2000 DSR 1,908 0.1283 10,836 0.3109 0.0084 0.0026 28
NRR 199 0.1313 1,489 0.5200 0.0097 0.0050 7
1999 DSR 1,918 0.1434 12,246 0.2743 0.0000 0.0000 0
NRR 142 0.1631 852 0.5800 0.0243 0.0141 12
1998 DSR 1,847 0.1486 10,739 0.3693 0.0147 0.0054 58
NRR 283 0.1555 1,818 0.6700 0.0158 0.0106 19
1997 DSR 3,586 0.1597 40,425 0.3788 0.0029 0.0011 45
NRR 623 0.1293 4,930 0.7400 0.0087 0.0064 32
(Continued on next page)
JUVENILE MIGRATION TACTICS OF CHINOOK SALMON 1471
Dow
nloa
ded
by [
Tim
othy
Cop
elan
d] a
t 07:
10 1
5 O
ctob
er 2
014

Cohort Tactic Tags Trap efficiency Juvenile Nb St¡l SAR Sa Adult NbLochsa
2007 DSR 1,020 0.2635 4,604 0.3763 0.0182 0.0069 32
NRR 175 0.1372 1,287 0.8906 0.0128 0.0114 15
2006 DSR 2,187 0.4207 6,137 0.2522 0.0272 0.0069 42
NRR 163 0.0902 2,128 0.6773 0.0091 0.0061 13
2005 DSR 1,508 0.2059 9,861 0.1655 0.0000 0.0000 0
NRR 116 0.0442 2,166 0.5531 0.0000 0.0000 0
2004 DSR 3,398 0.2250 27,780 0.2769 0.0064 0.0018 49
NRR 358 0.0750 5,707 0.6543 0.0085 0.0056 32
2003 DSR 2,130 0.1631 81,849 0.2145 0.0000 0.0000 0
NRR 515 0.0998 4,998 0.5347 0.0036 0.0019 10
2002 DSR 2,964 0.1672 41,443 0.1768 0.0057 0.0010 42
NRR 351 0.0706 4,624 0.3325 0.0171 0.0057 26
2001 DSR 3,259 0.2046 38,426 0.1012 0.0000 0.0000 0
NRR 426 0.0815 5,014 0.3834 0.0000 0.0000 0
2000 DSR 2,288 0.2027 53,563 0.2025 0.0086 0.0017 94
NRR 168 0.1014 1,705 0.4052 0.0147 0.0060 10
1999 DSR 623 0.2113 4,735 0.3814 0.0000 0.0000 0
NRR 284 0.0654 4,025 0.5538 0.0000 0.0000 0
1998 DSR 1,226 0.0890 13,794 0.3418 0.0143 0.0049 68
NRR 360 0.0640 7,045 0.4983 0.0167 0.0083 59
1997 DSR 2,764 0.1607 50,400 0.3054 0.0047 0.0014 73
NRR 704 0.0782 12,234 0.5901 0.0024 0.0014 17
Marsh Creek2007 DSR 6,324 0.2216 39,412 0.3272 0.0174 0.0057 224
NRR 265 0.3596 1,053 0.4514 0.0000 0.0000 0
2006 DSR 7,051 0.2708 31,834 0.3714 0.0363 0.0135 429
NRR 190 0.2895 691 0.6300 0.0167 0.0105 7
2005 DSR 4,489 0.1663 36,077 0.2527 0.0106 0.0027 96
NRR 79 0.3333 228 0.5900 0.0000 0.0000 0
2004 DSR 2,118 0.1395 18,700 0.2088 0.0023 0.0005 9
NRR 211 0.3684 854 0.5200 0.0000 0.0000 0
2003 DSR 2,520 0.2715 207,358 0.1000 0.0000 0.0000 0
NRR 729 0.3478 2,142 0.2800 0.0049 0.0014 3
2002 DSR 3,920 0.2520 139,993 0.1554 0.0000 0.0000 0
NRR 2,174 0.4423 6,226 0.3300 0.0014 0.0005 3
2001 DSR 3,127 0.4334 112,584 0.1672 0.0019 0.0003 36
NRR 650 0.3812 2,084 0.4800 0.0000 0.0000 0
2000 DSR 1,566 0.1642 14,823 0.3602 0.0142 0.0051 76
NRR 119 0.2542 465 0.5400 0.0311 0.0168 8
1998 DSR 2,124 0.1024 61,880 0.3020 0.0265 0.0080 495
NRR 263 0.1686 1,694 0.6300 0.0000 0.0000 0
1997 DSR 2,180 0.1892 29,396 0.3321 0.0069 0.0023 67
NRR 157 0.0921 1,881 0.6900 0.0000 0.0000 0
Pahsimeroi
2007 DSR 856 0.0928 10,610 0.2841 0.0041 0.0012 12
NRR 77 0.0548 1,080 0.5124 0.0507 0.0260 28
2006 DSR 860 0.1730 6,407 0.2200 0.0793 0.0174 112
NRR 276 0.1451 1,853 0.6700 0.0162 0.0109 20
(Continued on next page)
TABLE A.1. Continued.
1472 COPELAND ET AL.
Dow
nloa
ded
by [
Tim
othy
Cop
elan
d] a
t 07:
10 1
5 O
ctob
er 2
014

Cohort Tactic Tags Trap efficiency Juvenile Nb St¡l SAR Sa Adult Nb2005 DSR 2,374 0.0624 46,065 0.2300 0.0073 0.0017 78
NRR 817 0.1243 6,595 0.5500 0.0067 0.0037 24
2004 DSR 1,995 0.1276 14,029 0.2027 0.0074 0.0015 21
NRR 1,461 0.2244 6,731 0.6400 0.0021 0.0014 9
2003 DSR 1,920 0.0935 37,977 0.2200 0.0000 0.0000 0
NRR 1,422 0.2392 6,187 0.4300 0.0065 0.0028 17
2002 DSR 2,639 0.1063 26,394 0.2300 0.0033 0.0008 20
NRR 810 0.2518 3,433 0.4800 0.0051 0.0025 8
2001 DSR 2,721 0.0794 36,176 0.1992 0.0000 0.0000 0
NRR 1,304 0.2452 6,189 0.5800 0.0013 0.0008 5
2000 DSR 320 0.0614 5,610 0.2100 0.0149 0.0031 18
NRR 127 0.0439 4,083 0.6100 0.0000 0.0000 0
1999 DSR 1,434 0.1622 10,316 0.2700 0.0000 0.0000 0
NRR 120 0.1391 1,924 0.5300 0.0000 0.0000 0
1998 DSR 825 0.1109 15,751 0.3700 0.0131 0.0048 76
NRR 320 0.1234 2,646 0.7400 0.0211 0.0156 41
1997 DSR 878 0.1408 7,855 0.3602 0.0063 0.0023 18
NRR 478 0.1261 3,485 0.7300 0.0115 0.0084 29
Secesh
2007 DSR 4,265 0.0546 128,935 0.2521 0.0270 0.0068 877
NRR 409 0.1659 1,685 0.2310 0.0000 0.0000 0
2006 DSR 4,971 0.2475 55,098 0.2772 0.0450 0.0125 687
NRR 176 0.0000 0 0.4945 0.0000 0.0000 0
2005 DSR 3,325 0.1896 227,198 0.1943 0.0294 0.0057 1,298
NRR 616 0.1070 2,422 0.2681 0.0182 0.0049 12
2004 DSR 3,516 0.1433 392,659 0.1318 0.0302 0.0040 1,563
NRR 514 0.0636 3,739 0.1853 0.0000 0.0000 0
2003 DSR 4,764 0.1039 876,489 0.1436 0.0015 0.0002 184
NRR 1,108 0.1786 4,613 0.2367 0.0000 0.0000 0
2002 DSR 3,327 0.1412 568,760 0.0951 0.0063 0.0006 342
NRR 1,026 0.0982 6,619 0.2770 0.0000 0.0000 0
2001 DSR 6,967 0.1886 747,244 0.0990 0.0029 0.0003 215
NRR 1,067 0.1231 5,471 0.2369 0.0000 0.0000 0
2000 DSR 5,232 0.2402 357,372 0.1596 0.0192 0.0031 1,093
NRR 436 0.2180 1,355 0.4279 0.0000 0.0000 0
1999 DSR 5,390 0.2888 45,092 0.3463 0.0021 0.0007 33
NRR 716 0.2877 2,025 0.4182 0.0000 0.0000 0
1998 DSR 3,604 0.1477 103,977 0.3181 0.0419 0.0133 1,385
NRR 351 0.1381 1,441 0.3223 0.0088 0.0028 4
1997 DSR 6,601 0.1231 177,971 0.2640 0.0052 0.0014 243
NRR 287 0.2438 1,378 0.3429 0.0102 0.0035 5
South Fork Clearwater
2007 DSR 3,371 0.3538 27,404 0.1876 0.0127 0.0024 65
NRR 818 0.1673 6,761 0.3035 0.0000 0.0000 0
2006 DSR 1,592 0.3198 7,171 0.1965 0.0064 0.0013 9
NRR 1,103 0.1579 9,643 0.3405 0.0053 0.0018 17
2005 DSR 683 0.0846 7,444 0.0818 0.0000 0.0000 0
NRR 2,329 0.2726 10,192 0.3565 0.0000 0.0000 0
(Continued on next page)
TABLE A.1. Continued.
JUVENILE MIGRATION TACTICS OF CHINOOK SALMON 1473
Dow
nloa
ded
by [
Tim
othy
Cop
elan
d] a
t 07:
10 1
5 O
ctob
er 2
014
Cohort Tactic Tags Trap efficiency Juvenile Nb St¡l SAR Sa Adult Nb2004 DSR 2,725 0.1671 72,679 0.1453 0.0101 0.0015 107
NRR 570 0.1222 15,795 0.4689 0.0075 0.0035 55
2003 DSR 5,736 0.1684 139,993 0.1584 0.0011 0.0002 24
NRR 3,881 0.1792 26,053 0.5027 0.0000 0.0000 0
2002 DSR 3,141 0.1445 192,887 0.0519 0.0123 0.0006 123
NRR 2,434 0.1212 36,072 0.4739 0.0017 0.0008 30
2001 DSR 1,028 0.1000 94,471 0.0341 0.0000 0.0000 0
NRR 2,800 0.1200 27,228 0.4257 0.0000 0.0000 0
2000 DSR 902 0.1300 19,463 0.1615 0.0069 0.0011 22
NRR 1,832 0.2400 16,298 0.5510 0.0030 0.0016 27
1999 DSR 411 0.2595 1,802 0.2201 0.0000 0.0000 0
NRR 324 0.1869 1,739 0.4898 0.0000 0.0000 0
1998 DSR 2,372 0.1993 116,223 0.2055 0.0123 0.0025 294
NRR 1,767 0.1923 19,047 0.4716 0.0108 0.0051 97
1997 DSR 1,825 0.0399 528,900 0.1706 0.0000 0.0000 0
NRR 1,444 0.1836 32,445 0.4569 0.0061 0.0028 90
South Fork Salmon
2007 DSR 5,975 0.1996 52,946 0.2401 0.0230 0.0055 292
NRR 1,491 0.3116 4,866 0.6100 0.0110 0.0067 33
2006 DSR 2,203 0.1762 69,770 0.2287 0.0476 0.0109 760
NRR 944 0.4034 3,004 0.5800 0.0183 0.0106 32
2005 DSR 5,533 0.2878 63,248 0.2333 0.0108 0.0025 160
NRR 2,008 0.4648 5,977 0.3800 0.0066 0.0025 15
2004 DSR 4,351 0.2889 313,995 0.1350 0.0136 0.0018 577
NRR 1,561 0.4358 6,443 0.3600 0.0036 0.0013 8
2003 DSR 2,566 0.2020 546,670 0.1305 0.0000 0.0000 0
NRR 2,583 0.3666 7,562 0.3800 0.0000 0.0000 0
2002 DSR 3,449 0.1290 761,350 0.0948 0.0061 0.0006 441
NRR 1,375 0.2656 5,121 0.3800 0.0057 0.0022 11
2001 DSR 2,246 0.1588 659,711 0.0656 0.0204 0.0013 881
NRR 587 0.3325 2,354 0.4600 0.0037 0.0017 4
2000 DSR 1,312 0.1721 132,065 0.1071 0.0000 0.0000 0
NRR 650 0.3167 3,813 0.5100 0.0060 0.0031 12
1999 DSR 1,394 0.0979 194,042 0.1900 0.0000 0.0000 0
NRR 480 0.2312 6,888 0.4800 0.0000 0.0000 0
1998 DSR 4,478 0.0932 242,991 0.2008 0.0311 0.0063 1,519
NRR 1,582 0.1575 9,055 0.3800 0.0100 0.0038 34
1997 DSR 2,811 0.0668 366,613 0.1559 0.0091 0.0014 522
NRR 949 0.1916 6,932 0.5200 0.0020 0.0011 7
Upper Salmon
2007 DSR 1,579 0.0196 74,983 0.2070 0.0275 0.0057 427
NRR 1,210 0.2264 5,728 0.6300 0.0184 0.0116 66
2006 DSR 3,331 0.0349 112,624 0.1938 0.0403 0.0078 879
NRR 369 0.0351 9,964 0.6600 0.0287 0.0190 189
2005 DSR 4,094 0.0167 257,673 0.1576 0.0171 0.0027 692
NRR 575 0.0464 12,010 0.5800 0.0090 0.0052 63
2004 DSR 4,456 0.0555 177,721 0.1313 0.0137 0.0018 319
NRR 1,634 0.0919 17,682 0.5700 0.0129 0.0073 130
(Continued on next page)
TABLE A.1. Continued.
1474 COPELAND ET AL.
Dow
nloa
ded
by [
Tim
othy
Cop
elan
d] a
t 07:
10 1
5 O
ctob
er 2
014

Cohort Tactic Tags Trap efficiency Juvenile Nb St¡l SAR Sa Adult Nb2003 DSR 2,982 0.1261 137,286 0.1034 0.0032 0.0003 46
NRR 4,126 0.1232 47,435 0.5300 0.0027 0.0015 69
2002 DSR 4,194 0.0955 193,337 0.1086 0.0066 0.0007 138
NRR 2,507 0.1965 34,049 0.4700 0.0068 0.0032 109
2001 DSR 3,587 0.1224 164,990 0.1283 0.0065 0.0008 138
NRR 2,649 0.1771 28,182 0.5200 0.0058 0.0030 85
2000 DSR 2,557 0.1448 59,827 0.1687 0.0301 0.0051 304
NRR 695 0.0409 28,096 0.5900 0.0073 0.0043 121
1999 DSR 908 0.0864 14,691 0.2487 0.0000 0.0000 0
NRR 384 0.1882 1,991 0.6200 0.0000 0.0000 0
1998 DSR 1,019 0.0402 30,750 0.2617 0.0337 0.0088 272
NRR 527 0.1061 4,868 0.5800 0.0164 0.0095 46
1997 DSR 353 0.0523 8,020 0.2922 0.0097 0.0028 23
NRR 279 0.0291 14,683 0.6600 0.0054 0.0036 53
TABLE A.1. Continued.
JUVENILE MIGRATION TACTICS OF CHINOOK SALMON 1475
Dow
nloa
ded
by [
Tim
othy
Cop
elan
d] a
t 07:
10 1
5 O
ctob
er 2
014


![Adriano Venditti Hematology Fondazione Policlinico Tor ...Solalettura].pdf · MRD detection in AML Adriano Venditti Hematology Fondazione Policlinico Tor Vergata Rome](https://static.fdocuments.us/doc/165x107/5c65ce2c09d3f2876e8d3974/adriano-venditti-hematology-fondazione-policlinico-tor-solaletturapdf.jpg)