Impact of Climatic Factors & Adaptation Measures On Productivity of Tea Plantations In Sri Lanka

TIMING OF CLIMATIC FACTORS THAT MAY INFLUENCE POTATO YIELD,
QUALITY, AND POTENTIAL NITROGEN LOSSES IN A NORTHEAST FLORIDA SEEPAGE-IRRIGATED POTATO PRODUCTION SYSTEM
By
CHRISTINE MARIA WORTHINGTON
A DISSERTATION PRESENTED TO THE GRADUATE SCHOOL OF THE UNIVERSITY OF FLORIDA IN PARTIAL FULFILLMENT
OF THE REQUIREMENTS FOR THE DEGREE OF DOCTOR OF PHILOSOPHY
UNIVERSITY OF FLORIDA
2006

Copyright 2006
by
Christine Maria Worthington

To my two strongholds in life, Curtiss and Jevin.

iv
ACKNOWLEDGMENTS
I would like to extend my deepest and heartfelt gratitude to Chad M. Hutchinson,
my advisor, for his unwavering support, patience and confidence in my ability to achieve
my goal. I would also like to extend my sincere appreciation to my committee members,
Drs. Bill Stall, Rao Mylavarapu, Tom Obreza, Kenneth Portier and James White, for their
patience and guidance through this life lesson. I would especially like to thank Dr.
Portier for unselfishly assisting me in analyzing all the data and his patience getting it
completed.
The completion of this work would not have been possible if it weren’t for the
dedicated staff at the Plant Science and Research Unit, Hastings, FL., especially Doug
Gergela, Pam Solano, Bart Harrington and Larry Miller.
I sincerely appreciate the faculty and staff in the Horticultural Sciences Department
for giving me the opportunity to accomplish my goal.
I would like to thank my parents, Paul and Cecilia Worthington and Patti Hoff, for
their unconditional love and support and believing - I can.
Finally, all this wouldn’t have been possible if it weren’t for the support and love
and years of patience from Curtiss and Jevin who I owe my deepest gratitude.

v
TABLE OF CONTENTS page
ACKNOWLEDGMENTS ................................................................................................. iv
LIST OF TABLES...............................................................................................................x
LIST OF FIGURES ......................................................................................................... xvi
ABSTRACT................................................................................................................... xviii
CHAPTER
1 INTRODUCTION ........................................................................................................1
Florida Potato Production .............................................................................................1 Tri-County Agricultural Area................................................................................2 Potato Capital of Florida .......................................................................................3 Florida Chip Potato Varieties ................................................................................4
Seasonal Environmental Stress Associated with IHN..................................................7 Moisture Stress ......................................................................................................8 Nutrition ................................................................................................................9 Rationale..............................................................................................................10
Organization of Dissertation.......................................................................................11
2 DEVELOPMENT OF A GROWING DEGREE DAY MODEL TO DETERMINE OPTIMAL PLANTING DATE AND ENVIRONMENTAL INFLUENCE ON POTATO YIELD AND QUALITY IN NORTHEAST FLORIDA...........................12
Introduction.................................................................................................................12 Growing Degree Days ................................................................................................13 Materials and Methods ...............................................................................................14
Site Description ...................................................................................................14 Experimental Design ...........................................................................................14
Crop Production Practices ..........................................................................................15 Tuber Planting .....................................................................................................15 Irrigation ..............................................................................................................15 Nutrient Management ..........................................................................................16 Tuber Production Analysis ..................................................................................16 Tuber Specific Gravity ........................................................................................17 External Quality...................................................................................................17 Internal Quality....................................................................................................17

vi
Growing Degree Days ................................................................................................18 Statistical Analysis......................................................................................................18 Results And Discussion ..............................................................................................19
Tuber Yield for 2004 ...........................................................................................19 Planting date main effect..............................................................................19 Nitrogen rate main effect..............................................................................20 Variety main effect.......................................................................................20 Main effect interaction .................................................................................20
Tuber Yield for 2005 ...........................................................................................21 Planting date main effect..............................................................................21 Nitrogen rate main effect..............................................................................22 Variety main effect.......................................................................................22 Main effect interactions................................................................................23
Tuber External Quality for 2004 .........................................................................23 Planting date main effect..............................................................................23 Nitrogen main effect.....................................................................................24 Variety main effect.......................................................................................24
Tuber External Quality for 2005 .........................................................................24 Planting date main effect..............................................................................24 Nitrogen rate main effect..............................................................................24 Variety main effect.......................................................................................25
Tuber Internal Quality for 2004 ..........................................................................25 Planting date main effect..............................................................................25 Nitrogen rate main effect..............................................................................26 Variety main effect.......................................................................................26
Tuber Internal Quality for 2005 ..........................................................................26 Planting date main effect..............................................................................26 Nitrogen rate main effect..............................................................................27 Variety main effect.......................................................................................27
Growing Degree Day Model ......................................................................................28 Growing Degree Day Model and Potato Plant Development .............................28 Growing Degree Day Model and Tuber Yield ....................................................28 Growing Degree Day Model and Internal Tuber Quality ...................................30
Conclusion ..................................................................................................................31
3 YIELD AND QUALITY OF ‘ATLANTIC’ POTATO (SOLANUM TUBEROSUM L.) TUBERS AND OFF-FIELD NUTRIENT MOVEMENT UNDER VARYING NITROGEN SOURCES AND STAGED LEACHING IRRIGATION EVENTS.............................................................................................49
Introduction.................................................................................................................49 Materials and Methods ...............................................................................................53
Site Description ...................................................................................................53 Experimental Design ...........................................................................................53
Crop Production Practices ..........................................................................................54 Tuber Planting .....................................................................................................54 Irrigation ..............................................................................................................54
Nutrient Management .................................................................................................55

vii
Ammonium Nitrate Nitrogen ..............................................................................55 Controlled Release Fertilizer ...............................................................................56
Tuber Production Analysis. ........................................................................................56 Tuber Specific Gravity. .......................................................................................57 External Quality...................................................................................................57 Internal Quality....................................................................................................57
Water Sample Collection and Nutrient Load..............................................................57 Surface Run-Off Volume ....................................................................................57 Nutrient Load.......................................................................................................58 Wells....................................................................................................................58 Lysimeters ...........................................................................................................58
Growing Degree Day Model ......................................................................................59 Statistical Analysis......................................................................................................59 Results And Discussion ..............................................................................................60
Tuber Yield for 2004 ...........................................................................................60 Irrigation date main effect ............................................................................60 Fertilizer main effect ....................................................................................61 Main effect interactions................................................................................61
Tuber Yield for 2005 ...........................................................................................62 Irrigation date main effect ............................................................................62 Fertilizer main effect ....................................................................................63 Sidedress main effect ...................................................................................63 Main effect interactions................................................................................63
Tuber External Quality for 2004 .........................................................................64 Irrigation date main effect ............................................................................64 Fertilizer main effect ....................................................................................64 Sidedress main effect ...................................................................................64
Tuber External Quality for 2005 .........................................................................64 Irrigation date main effect ............................................................................64 Fertilizer main effect ....................................................................................65 Sidedress main effect ...................................................................................65
Tuber Internal Quality for 2004 ..........................................................................65 Irrigation date main effect ............................................................................65 Fertilizer main effect ....................................................................................67 Sidedress main effect ...................................................................................68
Tuber Internal Quality for 2005 ..........................................................................69 Irrigation date main effect ............................................................................69 Fertilizer source main effect.........................................................................70 Sidedress main effect ...................................................................................70
Nitrate Nitrogen Concentration in Wells for 2004 ..............................................71 Irrigation main effect....................................................................................71 Fertilizer main effect ....................................................................................71 Sidedress main effect ...................................................................................72
Nitrate Nitrogen Concentration in Wells for 2005 ..............................................72 Irrigation main effect....................................................................................72 Fertilizer main effect ....................................................................................73 Sidedress main effect ...................................................................................73

viii
Nitrate Nitrogen Concentration in Lysimeters for 2004......................................73 Irrigation main effect....................................................................................73 Fertilizer main effect ....................................................................................74 Sidedress main effect ...................................................................................74
Nitrate Nitrogen Concentration in Lysimeters for 2005......................................74 Irrigation main effect....................................................................................74 Fertilizer main effect ....................................................................................75 Sidedress main effect ...................................................................................76
Nutrient Load Concentration in Surface Water...................................................76 Water volume: 2004 ....................................................................................76 Water volume: 2005 ....................................................................................77 Nutrient load: 2004......................................................................................77 Nutrient load: 2005......................................................................................77
Growing Degree Days .........................................................................................78 Conclusions.................................................................................................................79
4 SUMMARY, AND FUTURE RESEARCH.............................................................110
Optimum Planting Dates...........................................................................................111 Climatic Factors........................................................................................................112 Potato Varieties.........................................................................................................113 Fertilizer Source........................................................................................................113 Additional N Sidedress .............................................................................................114 Water Quality............................................................................................................114 Future Research ........................................................................................................115
APPENDIX
A ADDITIONAL DATA AND ANOVA TABLES FOR PLANTING DATE YIELD ......................................................................................................................116
B ADDITIONAL DATA AND ANOVA TABLES FOR PLANT TISSUE FOR PLANTING DATE...................................................................................................135
C ADDITIONAL DATA AND ANOVA TABLE FOR POST HARVEST SOIL NUTRIENTS FOR PLANTING DATE...................................................................148
D ANOVA TABLES FOR YIELD AND QUALITY FOR IRRIGATION STUDY ..151
E ADDITIONAL DATA AND ANOVA TABLES FOR SURFACE WATER NUTRIENT CONCENTRATION ...........................................................................160
F ADDITIONAL DATA AND ANOVA TABLES FOR TISSUE NUTRIENT CONCENTRATION AND FUE FOR IRRIGATION STUDY...............................188
G ADDITIONAL DATA AND ANOVA TABLES FOR SOIL NUTRIENT CONCENTRATION ................................................................................................208

ix
LIST OF REFERENCES.................................................................................................219
BIOGRAPHICAL SKETCH ...........................................................................................225

x
LIST OF TABLES
Table page 2-1 Total and marketable yield and specific gravity production statistics for 2004
and 2005. ..................................................................................................................32
2-2 Two-way interaction between planting date and nitrogen rate main effects for total and marketable tuber yields in 2004. ...............................................................34
2-3 Two-way interaction between planting date and variety main effects for total tuber yields in 2004 and 2005. .................................................................................35
2-4 Size class distribution and range (%) production statistics 2004 and 2005. ............36
2-5 Two-way interaction between planting date and nitrogen rate main effects for size class range (%) for A1 in 2004 and A3 and size class distribution for A1 to A2 in 2005. ...............................................................................................................38
2-6 Two-way interaction between planting date and variety main effects for size class range (%) for A1, A2, A3 and A2 to A3 in 2004 and B, A1, A3 and A1 to A2 in 2005. ...............................................................................................................39
2-7 External quality (green, growth cracks, mis-shaped, rot and total culls) % of total yield 2004 and 2005. ........................................................................................40
2-8 Internal quality (%) of total yield 2004 and 2005. ...................................................42
2-9 Mean maximum and minimum temperature (C) for planting dates 1-6, 2004 and 2005. .........................................................................................................................44
2-10 Accumulated GDD and calendar days to obtain emergence and full flower 2004 and 2005 ...................................................................................................................45
2-11 Early and late season yield reduction and harvest date at 2000 GDD for 2004 and 2005. ..................................................................................................................46
3-1 Irrigation treatment (WAP), fertilizer treatment, fertilizer source and additional sidedress application (DAP) for 2004 and 2005 production seasons.......................80

xi
3-2 Total and marketable tuber yields and specific gravity for ‘Atlantic’ potato under varying staged leaching irrigation treatments and fertilizer source in Hastings, FL in 2004 and 2005 ................................................................................82
3-3 Three-way interaction between irrigation date, fertilizer source and side dress application main effects for total and marketable tuber yields and specific gravity for ‘Atlantic’ potato under varying staged leaching irrigation treatments and fertilizer source in Hastings, FL in 2004 and 2005 ...........................................84
3-4 Size class distribution and range (%) production statistics for ‘Atlantic’potato under varying staged leaching irrigation treatments and fertilizer source in Hastings, FL in 2004 and 2005 ................................................................................85
3-5 External tuber defects (%) of total yield for ‘Atlantic’ under varying staged leaching irrigation treatments, fertilizer source and additional sidedress in Hastings, FL in 2004 and 2005 ................................................................................87
3-6 Internal tuber defects (%) of total yield for ‘Atlantic’ under varying staged leaching irrigation treatments, fertilizer source and additional sidedress in Hastings, FL in 2004 and 2005 ................................................................................89
3-7 Well NO3-N concentration (mg L-1) under varying staged leaching irrigation treatments, fertilizer source and additional sidedress in Hastings, FL in 2004 and 2005..........................................................................................................................91
3-8 Lysimeter NO3-N concentration (mg L-1) under varying staged leaching irrigation treatments, fertilizer source and additional sidedress in Hastings, FL in 2004 and 2005 ..........................................................................................................93
3-9 Total NO3-N nutrient load by fertilizer source and leaching irrigation date and percent reduction in load from CRF compared with AN - 2004..............................95
3-10 Total NO3-N nutrient load by fertilizer source and leaching irrigation date and percent reduction in load from CRF compared with AN - 2005..............................95
3-11 Accumulated Growing Degree Days to leaching irrigation event, emergence and full flower .................................................................................................................96
A-1 Total and marketable yield and specific gravity production statistics for late harvest 2004 and 2005............................................................................................117
A-2 Size class distribution and range (%) production statistics for late harvest 2004 ..119
A-3 Size class distribution and range (%) production statistics for late harvest 2005 ..121
A-4 Size class distribution and range (%) production statistics for late harvest 2005 ..122

xii
A-5 External quality (green, growth cracks, mis-shaped, rot and total culls) (%) of total yield late harvest 2004 and 2005....................................................................123
A-6 Internal quality (%) of total yield late harvest 2004 and 2005..............................125
A-7 2004 ANOVA table for potato yield in planting date study ..................................127
A-8 2005 ANOVA table for potato total and marketable yield and size distribution in planting date study .................................................................................................128
A-9 2004 ANOVA table for potato internal and external quality in planting date study .......................................................................................................................129
A-10 2005 ANOVA table for potato internal and external quality in planting date study .......................................................................................................................130
A-11 2004 ANOVA table for potato yield in planting date study late harvest ...............131
A-12 2005 ANOVA table for potato yield in planting date study late harvest ...............132
A-13 2004 ANOVA table for potato internal and external quality in planting date study late harvest ....................................................................................................133
A-14 2005 ANOVA table for potato internal and external quality in planting date study late harvest ....................................................................................................134
B-1 Haulm nutrient concentration (%) at tuber initiation in 2004 and 2005 ................136
B-2 Full flower (haulm) nutrient concentration (%) for 2004 and 2005.......................138
B-3 Tuber diced pieces nutrient concentration (kg ha-1) at harvest 2005 .....................140
B-4 Ca++ and TKN fertilizer use efficiency (%) 2005 ..................................................141
B-5 2004 ANOVA table for haulm tissue at tuber initiation for planting date .............142
B-6 2004 ANOVA table for haulm tissue at full flower for planting date....................143
B-7 2005 ANOVA table for haulm tissue at tuber initiation for planting date .............144
B-8 2005ANOVA table for haulm tissue at full flower ................................................145
B-9 2005ANOVA table for FUE ..................................................................................146
B-10 2005ANOVA table for tuber diced pieces for planting date..................................147
C-1 Soil nutrient concentration (mg kg-1) post harvest 2005 ........................................149
C-2 2005 ANOVA table for post harvest soil planting date .........................................150

xiii
D-1 2004 ANOVA table for potato total and marketable yield and specific gravity....152
D-2 2004 ANOVA table for potato size class distribution and range...........................153
D-3 2005 ANOVA table for potato total and marketable yield and specific gravity....154
D-4 2005 ANOVA table for potato size class distribution and range...........................155
D-5 2004 ANOVA table for potato external quality .....................................................156
D-6 2004 ANOVA table for potato internal quality......................................................157
D-7 2005 ANOVA table for potato external quality .....................................................158
D-8 2005 ANOVA table for potato internal quality......................................................159
E-1 Well NH4-N concentration (mg L-1) under varying staged leaching irrigation treatments, fertilizer source and additional sidedress in Hastings, FL in 2004 and 2005........................................................................................................................161
E-2 Lysimeter NH4-N concentration (mg L-1) under varying staged leaching irrigation treatments, fertilizer source and additional sidedress in Hastings, FL in 2004 and 2005 ........................................................................................................163
E-3 2004 ANOVA table for well water sample 29 DAP..............................................165
E-4 2004 ANOVA table for well water sample 44 DAP..............................................166
E-5 2004 ANOVA table for well water sample 60 DAP..............................................167
E-6 2004 ANOVA table for well water sample 72 DAP..............................................168
E-7 2004 ANOVA table for well water sample 89 DAP..............................................169
E-8 2005 ANOVA table for well water sample 17 DAP..............................................170
E-9 2005 ANOVA table for well water sample 33 DAP..............................................171
E-10 2005 ANOVA table for well water sample 45 DAP..............................................172
E-11 2005 ANOVA table for well water sample 59 DAP..............................................173
E-12 2005 ANOVA table for well water sample 73 DAP..............................................174
E-13 2005 ANOVA table for well water sample 89 DAP..............................................175
E-14 2004 ANOVA table for lysimeter water sample 45 DAP......................................176
E-15 2004 ANOVA table for lysimeter water sample 65 DAP......................................177

xiv
E-16 2004 ANOVA table for lysimeter water sample 73 DAP......................................178
E-17 2004 ANOVA table for lysimeter water sample 90 DAP......................................179
E-18 2005 ANOVA table for lysimeter water sample 18 DAP......................................180
E-19 2005 ANOVA table for lysimeter water sample 34 DAP......................................181
E-20 2005 ANOVA table for lysimeter water sample 45 DAP......................................182
E-21 2005 ANOVA table for lysimeter water sample 60 DAP......................................183
E-22 2005 ANOVA table for lysimeter water sample 73 DAP......................................184
E-23 2005 ANOVA table for lysimeter water sample 89 DAP......................................185
E-24 2004 NO3-N concentration in surface water runoff (Figures 3.4-3.6) ...................186
E-25 2005 NO3-N concentration in surface runoff (Figures 3.7-3.10) ...........................187
F-1 Leaf Ca++ (%) under varying staged leaching irrigation treatments, fertilizer source and additional sidedress in Hastings, FL in 2004 and 2005 .......................189
F-2 Leaf TKN (%) under varying staged leaching irrigation treatments, fertilizer source and additional sidedress in Hastings, FL in 2004 and 2005 .......................190
F-3 Full flower (haulm) nutrient uptake (kg ha-1) under varying staged leaching irrigation treatments, fertilizer source and additional sidedress in Hastings, FL in 2004 and 2005 ........................................................................................................191
F-4 Tuber nutrient uptake (kg ha-1) at harvest under varying staged leaching irrigation treatments, fertilizer source and additional sidedress in Hastings, FL in 2004 and 2005 ........................................................................................................192
F-5 Fertilizer use efficiency (%) of total fertilizer applied under varying staged leaching irrigation treatments, fertilizer source and additional sidedress in Hastings, FL in 2004 and 2005 ..............................................................................193
F-6 SPAD leaf chlorophyll values under varying staged leaching irrigation treatments, fertilizer source and additional sidedress in Hastings, FL in 2004 and 2005........................................................................................................................194
F-7 2004 ANOVA table for leaf tissue 36 DAP...........................................................196
F-8 2004 ANOVA table for leaf tissue 51 DAP...........................................................197
F-9 2004 ANOVA table for leaf tissue 67 DAP...........................................................198
F-10 2004 ANOVA table for full flower haulm .............................................................199

xv
F-11 2004 ANOVA table for tuber tissue at harvest ......................................................200
F-12 2005 ANOVA table for leaf tissue 41 DAP...........................................................201
F-13 2005 ANOVA table for leaf tissue 74 DAP...........................................................202
F-14 2005 ANOVA table for full flower haulm tissue...................................................203
F-15 2005 ANOVA table for nutrient tuber tissue .........................................................204
F-16 2004 ANOVA table for FUE .................................................................................205
F-17 2005 ANOVA table for FUE .................................................................................206
F-18 2004 ANOVA table for SPAD 2004 and 2005 ......................................................207
G-1 Post harvest soil nutrient concentration Ca, NH4-N, and NO3-N (mg kg -1) under varying staged leaching irrigation treatments, fertilizer source and additional sidedress in Hastings, FL in 2004 and 2005...........................................................209
G-2 2004 ANOVA table for post harvest soil nutrient concentration 106 DAP...........210
G-3 2005 NOVA table for post harvest soil nutrient concentration 106 DAP..............211
G-4 2004 Equality of variances for pre-post soil nutrient concentration at irrigation treatment 2 WAP....................................................................................................212
G-5 2004 Equality of variances for pre-post soil nutrient concentration at irrigation treatment 8 WAP....................................................................................................213
G-6 2004 Equality of variances for pre-post soil nutrient concentration at irrigation treatment 12 WAP..................................................................................................214
G-7 2005 Equality of variances for pre-post soil nutrient concentration at irrigation treatment 2 WAP....................................................................................................215
G-8 2005 Equality of variances for pre-post soil nutrient concentration at irrigation treatment 4 WAP....................................................................................................216
G-9 2005 Equality of variances for pre-post soil nutrient concentration at irrigation treatment 8 WAP....................................................................................................217
G-10 2005 Equality of variances for pre-post soil nutrient concentration at irrigation treatment 12 WAP..................................................................................................218

xvi
LIST OF FIGURES
Figure page 1-1. Loading potatoes onto railroad car in Hastings, Florida ca 1920’s ...........................3
1-2 Internal heat necrosis in ‘Atlantic’ .............................................................................6
2-1 Varieties a.‘Atlantic’ b.‘Harley Blackwell’...........................................................13
2-2 Daily rainfall (cm) for a. 2004 and b. 2005 production season. Grouping of red bars denote a leaching rainfall event (7.6 cm in 3 days or 10.1 cm in 4 days). The yellow, pink, blue, green, orange and black lines denote planting dates 1-6, respectively, from emergence to tuber initiation......................................................47
2-3 Total and marketable yield at each planting date x variety and accumulated GDD at harvest. a. 2004 b. 2005 .............................................................................48
3-1 Aerial photograph of potato production fields along the St. Johns River, St. Johns County, Florida. Courtesy of Pam Livingston-Way, SJRWMD...................50
3-2 Plot map leaching irrigation project .........................................................................81
3-3 Total water volume from each irrigation date a. 2004 and b. 2005 .........................97
3-4 NO3-N nutrient concentration (mg 10min-1) of AN fertilizer treatment (blue lines) and CRF treatments (red lines) with parameter estimates by replication at leaching event 2 WAP, 2004....................................................................................98
3-5 NO3-N nutrient concentration (mg 10min-1) of AN fertilizer treatment (blue lines) and CRF treatments (red lines) with parameter estimates by replication at leaching event 8 WAP, 2004....................................................................................99
3-6 NO3-N nutrient concentration (mg 10min-1) of AN fertilizer treatment (blue lines) and CRF treatments (red lines) with parameter estimates by replication at leaching event 12 WAP, 2004................................................................................100
3-7 NO3-N nutrient concentration (mg 10min-1) of AN fertilizer treatment (blue lines) and CRF treatments (red lines) with parameter estimates by replication at leaching event 2 WAP, 2005..................................................................................101

xvii
3-8 NO3-N nutrient concentration (mg 10min-1) of AN fertilizer treatment (blue lines) and CRF treatments (red lines) with parameter estimates by replication at leaching event 4 WAP, 2005..................................................................................102
3-9 NO3-N nutrient concentration (mg 10min-1) of AN fertilizer treatment (blue lines) and CRF treatments (red lines) with parameter estimates by replication at leaching event 8 WAP, 2005..................................................................................103
3-10 NO3-N nutrient concentration (mg 10min-1) of AN fertilizer treatment (blue lines) and CRF treatments (red lines) with parameter estimates by replication at leaching event 12 WAP, 2005................................................................................104
3-11 NO3-N load (kg ha-1) at 2, 8 and 12 WAP, 2004. a. 2 WAP b. 8 WAP c. 12 WAP .......................................................................................................................105
3-12 NO3-N load (kg ha-1) at 2, 4, 8 and 12 WAP, 2005. a. 2 WAP b. 4 WAP c. 8 WAP d. 12 WAP ....................................................................................................107
3-13 Daily rainfall (cm) for the a. 2004 and b. 2005 production season. The group of red bars denote a leaching rainfall event (7.6 cm in 3 days or 10.1 cm in 4 days). The yellow, blue, pink and green arrows denote a stage leaching irrigation event at 2, 4, 8 and 12 WAP, respectively .......................................................................109

xviii
Abstract of Dissertation Presented to the Graduate School of the University of Florida in Partial Fulfillment of the Requirements for the Degree of Doctor of Philosophy
TIMING OF CLIMATIC FACTORS THAT MAY INFLUENCE POTATO YIELD, QUALITY, AND POTENTIAL NITROGEN LOSSES IN A NORTHEAST FLORIDA
SEEPAGE-IRRIGATED POTATO PRODUCTION SYSTEM
By
Christine Maria Worthington
December 2006
Chair: Chad M. Hutchinson Major Department: Horticultural Sciences
Potato, a cool season crop, is planted in Northeast Florida in January when
temperatures are cool. As the season progresses, daily temperatures and incidence of
leaching rainfall events increase which can affect yield and quality. Nutrient runoff from
potato production land has thought to have been primarily responsible for the non-point
source pollution into the St Johns River watershed. Best Management Practices (BMPs)
for potato production in the TCAA have been implemented. With over 7,000 ha in potato
production in the TCAA, the main concern with the implementation of the BMPs are to
not compromise yield and quality. The experimental design in chapter 2 was a split-split
design with four blocks. Planting dates (1-6) were main plots. The first split was the N
rate (168 and 224 kg ha-1). The second split was potato variety, ‘Atlantic’ and ‘Harley
Blackwell’. The experimental design in chapter 3 was a split-split design with four
blocks. Irrigation treatments were main plots at 0, 2, 4, 8, and 12 WAP (weeks after
xix
planting). The first split was the nitrogen source (AN or CRF). The second split was an
additional side-dress fertilizer application. Optimal yields for the TCAA occurred over a
4 week period (early to late February) in a twelve week planting window. ‘Harley
Blackwell’ demonstrated its effectiveness to produce quality tubers under conditions
when air temperatures and leaching rainfall events stressed plants. IHN was triggered by
rainfall and nutritional conditions that stressed the plant early in the season combined
with increasing minimum daily temperatures later in the season. Marketable yields in the
CRF treatments were an average of 12% higher compared with the AN fertilizer
treatment. The CRF treatments had a significantly higher incidence of tubers with IHN
compared with the AN fertilizer treatment at 22.3 and 15.6%, respectively. NO3-N
loading from surface water runoff from potato production was decreased an average of
43% with the use of the CRF compared with the AN fertilizer treatment. A CRF used in
potato production, rather than a soluble N fertilizer, could reduce NO3-N loads into the
St. Johns River watershed by 56,000 kg N per year.

1
CHAPTER 1 INTRODUCTION
Cultivated potatoes (Solanum tuberosum L.) were introduced into Europe by the
Spaniards who traveled to South America in the 1500’s, but not until the late 1600’s were
they found throughout Europe. During the 18th and 19th centuries the potato was an
established major agronomic food crop throughout Europe. Its acceptance was primarily
due to the increasing cost of grain and the demands for food to accommodate the growing
populace (Burton, 1989a). Many believe the onslaught of Ireland’s Great Potato Famine
in 1845 spawned the beginning of the cultivated potato in America. Actually, the first
‘Irish’ white potatoes were grown in Derry (previously Londonberry) New Hampshire in
the spring of 1719 (Hawkins, 1967).
Today, potatoes are not only important on a world-wide basis, but in the U.S as
well. According to the National Potato Council, 2002, the U.S. ranked third, worldwide,
in potato production (24,000,000 metric tons) following China and the Russian
Federation which produced 65,052,000 and 31,900,000 metric tons, respectively. Since
its introduction as a cultivated crop, potato has become as economically and culturally
important to society as wheat (Triticum aestivum L.) and rice (Oriza sativa L). (National
Potato Council website).
Florida Potato Production
Florida potato production (9,659,000 cwt) ranks in the top 1/3 of the 36 states in
commercial potato production (National Potato Council website). Florida potato
production (chip and fresh market) encompasses approximately 12,550 ha (31,000 acres)

2
extending as far south as Hendry County and north to Jackson County. According to
Witzig and Pugh, (2004), potatoes continue to remain among the top five vegetables
produced in Florida with a cash value of approximately $115 million (Witzig and Pugh,
2004).
Tri-County Agricultural Area
The largest concentration of potato production is in the tri-county agricultural area
(TCAA; Flagler, Putnam and St. Johns counties) of northeast Florida. Irrigation for the
area is applied by seepage irrigation. V-shaped furrows approximately 18 m apart and a
hardpan clay layer approximately 61 cm below the soil surface allows water to move
down and laterally across the bed and supply needed moisture to the potato crop (Hensel,
1964). Florida can also receive large amounts of rainfall in a very short amount of time.
The 50 year average rainfall received during the production season in the TCAA (January
through June) is approximately 57 cm. Rainfall events as leaching rainfall events and
defined as 7.6 cm in 3 days or 10.1 cm in 7 days are not uncommon during the production
season. The 50 year average for a 7.6 cm leaching rainfall event to occur during the
production season is 2.5 times while the 50 year average for a 10.1 cm leaching rainfall
event to occur is 5.3 times during the production season. In 2004, this area produced
potatoes on approximately 18,000 acres (~7,300 ha) providing a cash value of 42,773,000
(Florida Agricultural Fast Facts, 2005). The majority of the potatoes grown in south
Florida for winter harvest are fresh market varieties. Potatoes grown in the TCAA for
spring harvest are primarily for chip (60%) with fresh market varieties accounting for
about 40% of total production. In the TCAA, potato planting begins in late December
and continues through mid-March. Harvest usually begins by late April and runs through
June.

3
Potato Capital of Florida
Hastings, located in the southwest portion of St. Johns County, is referred to as the
‘Potato Capital of Florida’. The area has been in potato production for over 100 years
when Henry Flagler, a well known philanthropist, railroad magnate, and real estate
developer asked his cousin, Thomas Horace Hastings, (founder of Hastings ca. 1890) to
grow winter vegetables for his hotel guests in St. Augustine. At his request, Thomas built
the first greenhouses in Hastings establishing vegetable production in Northeast Florida.
His production included cucumber (Cucumus sativus L.), cabbage (Brassica oleracea L.,
Capitata group), cauliflower (Brassica oleracea L., Botrytis group), onions (Allium cepa
L.), potatoes, and rice. Potato production acreage started out small 3 to 4 ha (7-9 acres),
but in the following years acreage increased as Hastings became a major supplier for new
potatoes for the northeastern U.S. By 1928, approximately 7,900 railcar loads of fresh
spring potatoes were shipped out of the Hastings area for the northern markets
(Weingartner and Hensel, 2003).
Figure 1-1. Loading potatoes onto railroad car in Hastings, Florida ca 1920’s .
The standard cultivar grown for fresh market in the TCAA during this time during
the 20’s and up until 1938 was Spaulding Rose. With its resistance to late blight, mild

4
mosaic, net necrosis and brown rot, it was an excellent variety for Florida growing
conditions (Folsom, 1945). In the 1950’s, ‘Sebago’ was also found to be a good
processing potato for the burgeoning chip industry. From that point on, Hastings market
went from 100% fresh to more than 80% chip.
Florida Chip Potato Varieties
The standard chip variety grown today in the TCAA is ‘Atlantic’ which is noted for
its light chip color, relatively high yield (39-50 t ha-1);(350-450 cwt/A), and high specific
gravity (1.090). Higher specific gravity allows for more processed product per unit of
raw product used. Less fat is absorbed during frying along with a shorter frying time.
However, it is susceptible to internal heat necrosis (IHN), a physiological tuber disorder
that causes an unacceptable browning of the tuber tissue
‘Atlantic’ is resistant to scab (Streptocmyces scabies), Verticillium wilt, pink eye,
caused by the bacterium Pseudomonas marginalia, common races of the late blight
fungus (Phytothera infestans) and race A of the golden nematode (Globodera
rostochiensis) and is immune to virus X (Potato X potexvirus) and tuber net necrosis.
With its higher yields and specific gravity, ‘Atlantic’ replaced ‘Sebago’ as the primary
chipping potato grown in the TCAA. In the early 1990’s ‘Snowden’ was released and
appeared to be a promising chipping potato with comparable yields and specific gravities
to ‘Atlantic’, but ‘Snowden’ can accumulate unacceptable glycoalkaloid levels.
Glycoalkaloids contribute to the potatoes flavor, but in high concentrations can be toxic
to humans causing nausea, headaches and diarrhea (Cantwell, 1996). Today, limited
acreage of ‘Snowden’ is grown in the TCAA for chip and fresh market, since the
primary chip acreage is planted in ‘Atlantic’ (Personal communication, Hutchinson,
2004).

5
‘Atlantic’ was released July 16, 1976 by USDA, Florida, New Jersey and Maine
Agricultural Experiment Stations and the Virginia Truck and Ornamentals Research
Station, Norfolk Virginia. In replicated trials over three years, ‘Atlantic’ was compared
to the most popular variety grown for the aforementioned states. Consistently, ‘Atlantic’
yielded more (t ha-1), with exception of the Virginia site, and had higher specific gravities
in all states (Webb et al., 1978).
Recently a potato variety was released that may provide chip potato growers an
alternative to ‘Atlantic’ and ‘Snowden’; ‘Harley Blackwell’, was released in 2003 by the
USDA based on the cooperative research results of many institutions including the
University of Florida. Plant size (vigor), maturity, canopy shape and flowering
characteristics are all similar to ‘Atlantic’.
Yields and specific gravities of ‘Harley Blackwell’ are lower than ‘Atlantic’, but
are acceptable according to chipping standards (Beltsville Agricultural Research Center
website) (United States Standards for Grades of Potatoes for Chipping, 1997). Another
desirable characteristic of ‘Harley Blackwell’ is its resistance to internal heat necrosis
(IHN).
IHN is described in the Compendium of Potato Diseases, 2nd edition, as a
physiological disorder caused by elevated soil temperatures during the latter stages of
growth and development of the tuber. If the vines and leaves are still actively growing
and green during this period of elevated temperatures, water and nutrients are
translocated from the tuber to supply the plant. The vascular system of the tuber is
stressed and cannot sustain the evapotranspirational demands of the plant. Under these
conditions, it is reported that the vascular ring deteriorates and becomes necrotic.

6
Symptoms are most severe during hot, dry weather conditions in sandy, gravel, muck or
peat soils. Necrotic areas are mostly found in and around the vascular ring usually
coalescing and radiating to the center (pith). The symptoms are also more prevalent at
the bud (apical) end of the tuber and not the stem end. Peterson et al. (1985) reported that
as the tuber expands there is more xylem at the stem end of the tuber during growth and
development. IHN does not affect the nutritional value of the tuber, but the economic
impact can be significant due to off-grade quality. The exterior of the potato tuber does
not show visible signs of IHN. According to the Department of Agriculture (1978),
USDA no. 1 potatoes may not exceed 10 and 5% external and internal defects by weight,
respectively.
Figure 1-2. Internal heat necrosis in ‘Atlantic’
Internal necrosis (physiological necrosis) was first reported in 1937 by Larson and
Albert when they recognized it as an economic concern for commercially grown
potatoes. Internal necrosis has been referred to as internal brown spot (IBS), chocolate
and rust spot, internal browning and internal brown fleck (Sterrett and Henninger, 1997).
Unlike IBS that is reported to occur throughout the growing season, IHN of ‘Atlantic’ has
been reported to occur during the mid to late bulking period of the tuber.

7
Seasonal Environmental Stress Associated with IHN
Sterrett et al. (1991) reported that IHN is influenced by more than one
environmental stress factor. During the 1986-1988 production years, seven planting
dates in two locations (New Jersey and Virginia) and several harvests, beginning at 80
DAP and continuing to 147 DAP, were evaluated using a step-wise regression model that
included the variables temperature, rainfall, days after planting (DAP), yield and
percentage of large tubers (>64mm in diameter) to assess when potatoes become off-
grade during the growing season. Accumulated heat units were evaluated in the model
with a penalty imposed if the maximum and minimum temperatures were above 25 and
21C, respectively for a consecutive duration of three or more days (Lee et al., 1992). A
weak correlation was observed with the occurrence of IHN due to DAP, yield and
percentage of large tubers. Although rainfall was included in the model it was not
assessed. The findings concluded that more than one environmental factor, such as,
reduced solar radiation, reduced temperature and increased relative humidity and its role
in photosynthesis, respiration could be involved in the development of IHN.
Henninger et al. (2000) also used the heat sum model by Lee to evaluate 19
different potato clones and their parents including ‘Atlantic’ for the occurrence of IHN
over three years and in six locations in NJ and VA. Temperatures during the later part of
the 1991 and 1993 production years were above the maximum temperature allowed for
potatoes going off-grade due to IHN according to the Lee heat sum model. Although
‘Atlantic’ had the highest yield and specific gravity, it also had the highest incidence and
severity of IHN. This result was in agreement with (Sterrett and Henninger, 1997) who
reported a higher incidence of IHN near harvest and generally in the larger tubers (>76
mm). Lee et al. (1992) reported that IHN in ‘Atlantic’ occurred earlier in plant

8
development correlating with the highest mean maximum temperature during the 0-30
DAP and the highest mean minimum temperature during the remainder of the growing
season up to 90 DAP. They concluded that the high minimum temperatures had an effect
on the occurrence of IHN.
Moisture Stress
Wannamaker and Collins (1992) evaluated nine cultivars, including ‘Atlantic’ for
its susceptibility to IHN, at two locations (Tidewater Research Station TRS, NC and
Horticultural Crops Research Station HCRS, Castle Hayne, NC), and two planting and
harvest dates in 1989 and 1990. Occurrence of IHN was higher at the TRS site in 1989
(1.3 to 68.7%) when compared with HCRS with an occurrence of IHN of 0 to 35.5%.
Temperatures were similar for both locations and years, but rainfall was higher at the
TRS site in 1989 and 1990. Although the occurrence of IHN was lower in 1989 the TRS
site still had the highest amount of rainfall and incidence of IHN. Sterrett et al. (1991)
reported that during the growing season in 1989, IHN was delayed due to the increased
rainfall during the first 60 DAP but incidence increased during a dry, warm spring.
Although IHN may be due to a combination of environmental stressors, Wannamaker and
Collins’ report contradicts others that IHN typically occurs during dry conditions. While
IBS is a similar physiological defect, a report by Iritani et al. (1984) supports
Wannamaker and Collins findings suggesting that temperature and, most important of all,
moisture fluctuations are suspected to cause IBS. Novak et al. (1986) studied brown
fleck in potatoes in Queensland. They found an increase in brown fleck incidence when
soil moisture levels were high late in the season. They suggested withholding irrigation
as the crop reached maturity to reduce the disorder that contradicts Sterret et al. (1991)
that a higher incidence of IHN was noted when a hot dry weather later in the season.

9
Nutrition
Silva et al. (1991) evaluated varying gypsum and nitrogen rates in conjunction with
three irrigation schedules (no irrigation, required irrigation, and excess irrigation) on
specific gravity, yield, and internal defects of ‘Atlantic’ over a three year period.
Nitrogen rates had no significant effect on the internal quality of tubers, but the
application of gypsum did lower IBS occurrence in ‘Atlantic’ tubers. They also found
that excess irrigation increased the incidence of IBS in ‘Atlantic’ potatoes in two of the
three years evaluated. Sterrett and Henninger, (1997) reported that Clough, (1994), found
an increase in IHN incidence when lower N rates (68 or 84 kg N ha-1 were applied vs.
168 or 252 kg N ha-1). Sterrett and Henninger (1991), report supports Clough’s findings
that IHN was slightly reduced with the higher N rates of 84 and 252 kg N ha-1 versus 64
kg N ha-1.
Palta (1996), reported since tubers are naturally deficient in Ca++ especially those
grown in sandy soil, applying Ca++ to the tuber-stolon junction improved Ca++ uptake in
tuber peel and medullary tissue, suggesting that placement is key to improving uptake
efficiency of Ca++. Ozgden et al. (2005) recently reported potato plants that received split
applications of calcium nitrate throughout the season had significantly lower incidence of
IBS in 1997. They also reported that tuber calcium concentrations were higher in 1999,
but the incidence of IBS was not significantly different than the treatments without
calcium nitrate. The authors mentioned that a leaching rainfall (13cm) within 24 hrs
occurred during the bulking period that may have had an effect on the incidence of IBS in
‘Russet Burbank’ potatoes. Gunter et al. (2000) reported soluble sources of calcium
applied in split applications was more effective at reducing the incidence of IBS
compared with the application of gypsum. Tzeng et al. (1986), reported a negative
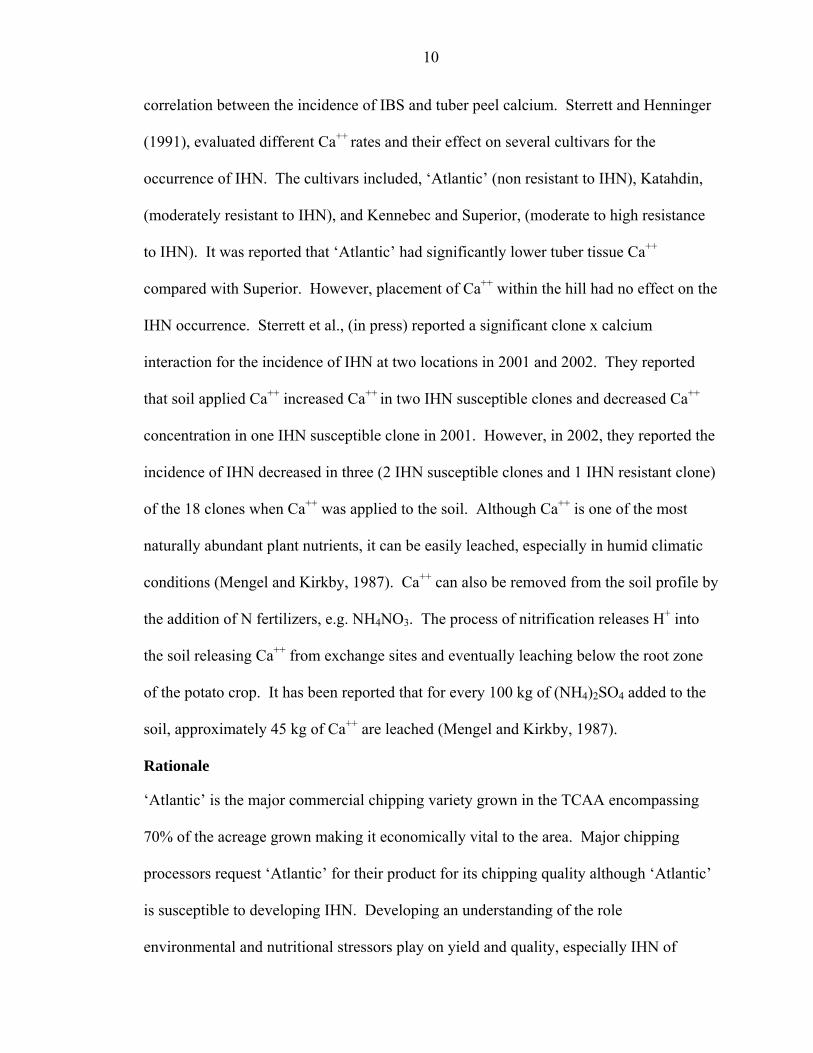
10
correlation between the incidence of IBS and tuber peel calcium. Sterrett and Henninger
(1991), evaluated different Ca++ rates and their effect on several cultivars for the
occurrence of IHN. The cultivars included, ‘Atlantic’ (non resistant to IHN), Katahdin,
(moderately resistant to IHN), and Kennebec and Superior, (moderate to high resistance
to IHN). It was reported that ‘Atlantic’ had significantly lower tuber tissue Ca++
compared with Superior. However, placement of Ca++ within the hill had no effect on the
IHN occurrence. Sterrett et al., (in press) reported a significant clone x calcium
interaction for the incidence of IHN at two locations in 2001 and 2002. They reported
that soil applied Ca++ increased Ca++ in two IHN susceptible clones and decreased Ca++
concentration in one IHN susceptible clone in 2001. However, in 2002, they reported the
incidence of IHN decreased in three (2 IHN susceptible clones and 1 IHN resistant clone)
of the 18 clones when Ca++ was applied to the soil. Although Ca++ is one of the most
naturally abundant plant nutrients, it can be easily leached, especially in humid climatic
conditions (Mengel and Kirkby, 1987). Ca++ can also be removed from the soil profile by
the addition of N fertilizers, e.g. NH4NO3. The process of nitrification releases H+ into
the soil releasing Ca++ from exchange sites and eventually leaching below the root zone
of the potato crop. It has been reported that for every 100 kg of (NH4)2SO4 added to the
soil, approximately 45 kg of Ca++ are leached (Mengel and Kirkby, 1987).
Rationale
‘Atlantic’ is the major commercial chipping variety grown in the TCAA encompassing
70% of the acreage grown making it economically vital to the area. Major chipping
processors request ‘Atlantic’ for their product for its chipping quality although ‘Atlantic’
is susceptible to developing IHN. Developing an understanding of the role
environmental and nutritional stressors play on yield and quality, especially IHN of

11
potato would benefit Florida farmers. According to Sterrett and Henninger, to date there
have been no cultural management practices which alleviate the onset and progression of
IHN. Therefore, the focus of this research is to determine at what stage IHN may be
initiated and the correlation with cultural and/or environmental stressors throughout the
growing season.
Organization of Dissertation
This work is organized into four chapters. The first chapter is an introduction
describing the history of the potato from its South American origin to its vital role as part
of Florida’s agriculture today. The second chapter describes the results of a two year
study evaluating multiple planting dates with two N rates and two varieties and how the
timing of climatic factors and cultural practices effect tuber production and quality in the
TCAA during the growing season. The third chapter reports the results of a two year
study which addresses the effects of two nitrogen (N) fertilizer sources and simulated
leaching rainfalls during the growing season on yield, tuber quality and nitrate leaching
(NO3-N). The fourth chapter summarizes the results and conclusions and suggests future
research addressing yield and quality of potato production in the TCAA.
12
CHAPTER 2 DEVELOPMENT OF A GROWING DEGREE DAY MODEL TO DETERMINE
OPTIMAL PLANTING DATE AND ENVIRONMENTAL INFLUENCE ON POTATO YIELD AND QUALITY IN NORTHEAST FLORIDA
Introduction
Potato production in Florida spans from as far south as Hendry County to Jackson
County in the north. The largest area in production is northeast Florida’s Tri-County
Agricultural Area (TCAA) (St. Johns, Putnam and Flagler counties) with 7,300 ha
(18,000 acres). Potatoes continually rank among the top five vegetables in production in
Florida with annual value of approximately $125 million (Witzig and Pugh, 2004).
Potatoes, a cool season crop, are planted in the TCAA beginning in late December
when day length is short and temperatures cool. As the season progresses and the potato
progresses through key developmental stages, daylight hours lengthen and temperatures
increase. Winkler (1971) reported that yields may suffer due to extended periods of cool
temperatures (below 18C) as well as higher temperatures (above 20C) for extended
periods. Cooler and higher temperatures reduce net assimilation to the tubers while
higher temperatures may prevent tuber initiation.
‘Atlantic’ is the most prevalent chip variety in northeast Florida. ‘Atlantic’ is
noted for its light chip color, relatively high yield and high specific gravity (Fig 2.1a).
However, it is susceptible to internal heat necrosis (IHN), a physiological tuber disorder
that causes an unacceptable browning of the tuber tissue (Fig 2.2).

13
F
D
g
c
B
i
(
a
e
p
h
p
D
a
igure 2-1. Varieties. a.‘Atlantic’ b.‘Harley‘Harley Blackwell’, a new variety res
epartment of Agriculture (USDA, Beltsvill
ravity of ‘Harley Blackwell’ are lower than
hipping standards (United States Standards
oth ‘Atlantic’ and ‘Harley Blackwell’ were
Growing D
Growing Degree Days (GDD) are a us
n crops such as broccoli (Brassica oleracea
Hoover, 1955); corn (Zea mays L.); cucumb
nd taro (Colocasia esculenta L. ‘Schott’) (L
valuated a revised accumulated heat unit sy
otato tubers would go off-grade. With this
arvest to avoid economic losses due to tube
Historically, growers in the TCAA ha
redict key potato developmental stages e.g.
eveloping and utilizing the growing degree
b
Blackwell’
istant IHN, was released in 2003 by the US
e Md., 2004) (Fig 2.1b). Yield and specific
‘Atlantic’ but are acceptable according to
for Grades of Potatoes for Chipping, 1978).
planted in this study.
egree Days
eful tool to determine harvest dates and yield
L.) (Dufault, 1997), peas (Pisum sativum L.)
er (Cucumis sativus L.) (Perry et al., 1986)
u et al., 2001). Sterrett et al. (1991)
stem (Lee et al., 1992) to predict when
system, growers could determine when to
r quality issues.
ve used calendar days and experience to
emergence, full flower and full senescence.
day system may be a more accurate

14
predictor of these stages throughout the season to determine optimal planting dates and
yields compared with calendar days. It would also facilitate a more efficient fertilizer
and pesticide application schedule.
This experiment was designed to evaluate and quantify the effects of multiple
planting dates on the occurrence of IHN based upon environmental stressors (rainfall and
temperature) as well as determine the influence of growing degree day accumulation on
the timing of key developmental stages and production of optimal yields over multiple
planting dates typically experienced in the TCAA.
The objectives of this study were to 1) determine the effects of multiple planting
dates and N rates on yield and quality of potato in Northeast Florida 2) determine when
and what climatic factors influence yield and quality of potato in Northeast Florida 3)
develop a model based on GDD to determine key developmental stages of potato.
Materials and Methods
Site Description
The experiment was conducted during production years 2004 and 2005 at the
University of Florida, Plant Science Research and Education Unit, Hastings, Florida on
an Ellzey fine sand (sandy, siliceous, hyperthermic Arenic Ochraqualf; sand 90% to 95%,
<2.5% clay, <5% silt). The soil profile is described as poorly drained although the top 94
cm have a very high permeability rate (5-10 cm hr-1). A restricting clayey layer lies below
the sandy loam top layer of the profile. The water table is within 25 cm of the surface for
one to six months of the year (Soil Survey, St Johns County, 1983)
Experimental Design
The experiment was arranged as a randomized complete block with a split-split
design with four blocks in bed 16 NL at the PSREU – Hastings Farm. Planting dates (1-

15
6) were assigned to main plots. Each main plot (planting date) was 46.3 m by 6.0 m (6
rows) with a 12.1 m buffer between the north and south end of the main plots. The first
split was the N rate at 168 and 224 kg ha-1. N rate plots were 4.8 m by 6.0 m (6 rows).
The second split was potato variety, ‘Atlantic’ and ‘Harley Blackwell’ (Maine Farmer’s
Exchange-MFX, Presque Isle, Maine). Potato variety plots were 4.8 m by 3.0 m (3 rows)
Crop Production Practices
Tuber Planting
Potatoes were cut at planting to an approximate 71 g seed piece and dusted with
fungicide [1.13 g a.i. fludioxonil and 21.82 g a.i. mancozeb per 45.4 kg seed pieces
(Maxim MZ; Syngenta Crop Protection, Inc., Greensboro, N.C.)]. Azoxystrobin [0.1 L
ha-1 a.i. (a.i., Amistar; Syngenta, Crop Protection, Greensboro, N.C.)] and aldicarb [3.36
kg ha-1 a.i (a.i., Temik, Bayer Corp., Kansas City, Mo.)] was applied in-row at planting.
All other pesticide applications during the growing season followed recommendations for
Florida potato production (Hutchinson et al., 2004).
Irrigation
Plots were irrigated with seepage irrigation throughout the growing season except
during periods of sufficient rainfall. The seepage irrigation system is a semi-closed
system. Water withdrawn from the confined aquifer is pumped through PVC (polyvinyl
chloride) pipe to each V-shaped open water furrow in the field. Each water furrow is
situated 18.2 m apart. Water seeps from the water furrow laterally, underground, across
the bed and through capillarity reaches the rooting system of the potato plant (Singleton,
1990). Water is controlled at each water furrow by a valve that can be turned on or off
when necessary. Current research at the farm as estimated that each valve can deliver
approximately (8.3 L min-1).

16
Nutrient Management
Fertilizer application was based on 100 and 75% of the best management practice
(BMP) recommendations for Florida potato production [224 and 168 kg ha-1 N,
respectively] (Hutchinson et al., 2004). In both seasons, pre-plant fertilizer (1 day before
planting) was applied with a two-row hydraulic fertilizer applicator (Kennco Mfg.,
Ruskin Fl, 33570) banded on top of the row at 112 kg N ha-1 as 14N-6.0 P2O5-12.0 K2O.
Total P requirement 44.8 kg P2O5 ha-1 was applied in a single pre-plant application.
Fertilizer was chopped and incorporated with a four-row chopper then each row was
bedded prior to planting. One sidedress of remaining N [112 and 56 kg N ha-1,
34N-0P2O5-0 K2O] and K [60.4 kg K2O ha- 0N-0P2O5-50K2O] was applied
approximately 30 d after each planting date when plants were 10 to 15 cm tall with a two-
row, ground driven, belted fertilizer applicator that banded the fertilizer on each side of
the plant. Rows were then single disked to cover the fertilizer on the shoulder of the row.
Tuber Production Analysis
At harvest potatoes were graded and sized into the following class sizes; B = 3.8 to
4.4 cm, A1 = 4.4 to 6.4 cm, A2 = 6.4 to 8.3 cm, A4 = > 10.2 cm. Culls (growth cracks,
misshapen, sunburned and rotten tubers) were removed and weighed before “A” size
classes were separated. Marketable yield is defined as no. 1 tubers with diameters
between 4.4 and 10.2 cm (USDA, 1978) and without visible blemishes (rotten, green,
misshapen, or containing growth cracks).
One row of potato plants (5.8 meters) from each fertilizer rate by variety plot
within each block and planting date were harvested at least 100 DAP as required by
aldicarb labeling. A late season harvest, approximately 128 DAP, of one row of potato
plants (5.8 m) from each fertilizer rate by variety plot within each block and planting date

17
were also harvested. At both harvests, tubers were washed, graded and sized into five
classes as described above.
Tuber Specific Gravity
Specific gravity was calculated from a sub-sample of marketable tubers from each
fertilizer by variety plot within each block and planting date using weight in air/ weight
in water method (Burton, 1989c). ‘Atlantic’ potatoes are the standard for chipping in
Florida, therefore, high tuber specific gravity is desired. Specific gravities of at least
1.078 are considered good for production at the PSREU research farm in Hastings, FL
(Hutchinson et al., 2002).
External Quality
Culls (green, growth cracks, misshapen, and rotten tubers) were removed and
weighed at the grading line. External quality (green, growth cracks, misshaped and rot)
were reported as a percentage of total yield.
Internal Quality
A 20 tuber sub-sample from each fertilizer by variety plot within each block and
planting date were cut into quarters and rated for internal quality. Rated physiological
disorders included hollow heart (HH), internal heat necrosis (IHN) and brown center
(BC). Disease induced disorders included corky ring spot (CRS) and brown rot (BR). A
twenty tuber sample from each plot was scored for percent hollow heart, IHN, and BC.
IHN severity was scored on a one to six scale with a score of one to four relating to the
number of quarters with IHN. A score of five or six indicated that all quarters had the
disorder and up to 75 to 100% of all quarters were showed visual symptoms, respectively
(Figure 2- 3).

18
Growing Degree Days
Growing degree days (GDD) were calculated throughout the season for each
planting date for the 2004 and 2005 production season with the following formula (Sands
et al., 1979):
GDD = [(minT + maxT)/2)-7C].
where minT and maxT are the minimum and maximum daily temperatures and the base is
7C.
GDD totals were recorded for key growth and developmental stages (emergence,
tuber initiation and full flower). Emergence was determined when the plantlets were just
emerging from the soil. Tuber initiation was determined by the visual observance of the
radial growth of the stolon tip and full flower was determined when approximately 90-
95% of the peduncals on plants in each plot had open flowers.
Statistical Analysis
Tuber production. A general linear model was used to determine yield, internal
and external quality responses of ‘Atlantic’ and ‘Harley Blackwell’ potato varieties as a
result of multiple planting dates and two N rates for the 2004 and 2005 production
seasons. Normality for each potato class size was checked by residual analysis using the
Shapiro-Wilk test as implemented in the PROC CAPABILITY procedure of SAS (SAS,
Institute, 2004). Means were separated using Tukey adjustment as implemented in SAS
(SAS Institute, 2004) to separate individual factor means and/or interaction means when
significant.
19
Results And Discussion
This experiment was designed to determine optimal yields over a typical growing
season and the effects of nutrient and environmental stressors (rainfall, temperature)
would have on yields and quality in the TCAA. Additionally, GDD were also calculated
for each planting date to determine optimal yields and key developmental stages and
throughout the 2004 and 2005 growing season.
Tuber Yield for 2004
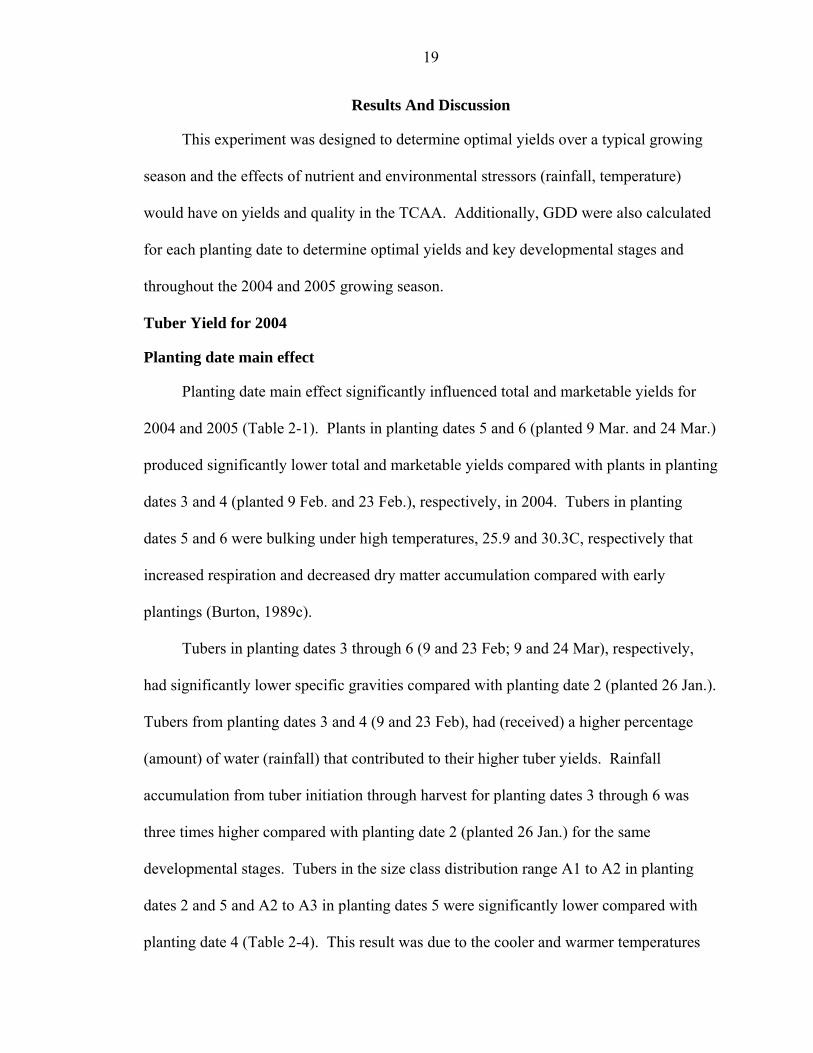
Planting date main effect
Planting date main effect significantly influenced total and marketable yields for
2004 and 2005 (Table 2-1). Plants in planting dates 5 and 6 (planted 9 Mar. and 24 Mar.)
produced significantly lower total and marketable yields compared with plants in planting
dates 3 and 4 (planted 9 Feb. and 23 Feb.), respectively, in 2004. Tubers in planting
dates 5 and 6 were bulking under high temperatures, 25.9 and 30.3C, respectively that
increased respiration and decreased dry matter accumulation compared with early
plantings (Burton, 1989c).
Tubers in planting dates 3 through 6 (9 and 23 Feb; 9 and 24 Mar), respectively,
had significantly lower specific gravities compared with planting date 2 (planted 26 Jan.).
Tubers from planting dates 3 and 4 (9 and 23 Feb), had (received) a higher percentage
(amount) of water (rainfall) that contributed to their higher tuber yields. Rainfall
accumulation from tuber initiation through harvest for planting dates 3 through 6 was
three times higher compared with planting date 2 (planted 26 Jan.) for the same
developmental stages. Tubers in the size class distribution range A1 to A2 in planting
dates 2 and 5 and A2 to A3 in planting dates 5 were significantly lower compared with
planting date 4 (Table 2-4). This result was due to the cooler and warmer temperatures

20
early and later in the growing season which decreased tuber development caused by
reduced net assimilation to the tubers.
Nitrogen rate main effect
Fertilizer main effect significantly influenced marketable tuber yields in 2004.
Plants in the 224 kg N ha-1 treatment had significantly higher marketable yields compared
with plants in the 168 kg N ha-1 treatment at 23.2 and 20.5 t ha-1, respectively (Table 2-1).
Variety main effect
Variety main effect significantly influenced total and marketable yields in 2004.
Total and marketable yields for ‘Atlantic’ were 8% and 20% higher compared with
‘Harley Blackwell’, respectively, over all planting dates and nitrogen rates. ‘Atlantic’
had higher specific gravity compared with ‘Harley Blackwell’ (1.078 and 1.075),
respectively, as well (Table 2-1). Varieties that are resistant to IHN typically have lower
specific gravities than varieties prone to IHN e.g. ‘Atlantic’ (Sterrett and Henninger who
in 1991). Although ‘Harley Blackwell’ had lower specific gravity, chipping companies
will still accept them due to their internal quality.
Main effect interaction
The two-way interaction between planting date and fertilizer rate main effects was
significant for the total and marketable tuber yields in 2004. A two-way interaction was
also significant for the planting date by variety main effects. The two-way interaction
term was calculated using LSMeans with the slice option (planting date) (SAS 2004).
This option enabled the comparison of the fertilizer rates within each of the planting dates
as well as the comparison of the varieties within each planting date.
The 224 kg ha-1 N rate had significantly higher total and marketable yields in
planting dates 3, 5 and 6 (planted 9 Feb and 9 and 24 Mar, respectively) compared with

21
the 168 kg ha-1 N rate within each of the respective planting dates. These results
indicated that planting late in the season (March) led to tuber bulking in warmer and
wetter weather conditions that negatively impacted total and marketable yields (Table 2-
2).
The interaction term for planting date by variety main effects was significant in
2004. ‘Atlantic’ had significantly higher total tuber yields in planting dates 1, 3, 5 and 6
compared with ‘Harley Blackwell’. Although ‘Atlantic’ had significantly higher total
yields compared with ‘Harley Blackwell’ in the later planting dates (planting dates 5 and
6), ‘Atlantic’ had a significantly higher incidence of rots compared with ‘Harley
Blackwell’ that would explain the non significant planting date by variety interaction for
marketable yield (Table 2-3 and Table 2-7). There were no other main effect interactions
for yield.
Tuber Yield for 2005
Planting date main effect
Planting date main effect significantly influenced total and marketable yields in
2005. Planting dates 1, 2, 5 and 6 had significantly lower marketable yields compared
with planting dates 3 and 4 (planted 8 and 22 Feb) (Table 2-1). A leaching rainfall event
occurred early in the season for planting date 6 (1 June) that delayed plant emergence
(Figure 2-4). The significantly lower marketable yields in planting dates 1 and 2 may be
due to the lower temperatures early in the season, with average low temperatures of
11.4C which reduced net assimilation to the developing tubers and negatively impacted
yield. Higher temperatures in planting dates 5 and 6 later in the season increased tuber
respiration and decreased dry matter accumulation during the bulking period with
average high temperatures of 29C between full flower and harvest (Figure 2-4). Size

22
class distribution was also significantly influenced by planting dates. Planting date 1 and
6 had the highest weight of B size tubers compared with all other planting dates.
Additionally, planting dates 1 and 6 also had the lowest percentages of tubers in size class
ranges A1 to A2 and A2 to A3 (Table 2-4) which are the marketable tuber size class
range. Cooler temperatures early in the season as well as the higher temperatures late in
the season also decreased and/or prevented tuber initiation and development (Burton,
1989c).
Nitrogen rate main effect
Nitrogen rate main effect did not significantly influence total or marketable tuber
yields in 2005. Plants in the 224 kg N ha-1 had slightly higher tuber total yields compared
with the 168 kg N ha-1 rate at 25.2 and 24.5 t ha-1, respectively. Total and marketable
tuber yields were not significantly different in the 224 kg N ha-1 treatment compared with
plants in the 168 kg N ha-1 treatment at 19.4 and 19.1 t ha-1, respectively (Table 2-1).
Three leaching rainfall events occurred during the 2005 season compared with one in the
2004. This may explain the similarities in the total and marketable yields between
fertilizer treatments in 2005 (Figure 2-4a and 2.4b). There were no significant nitrogen
rate main effects interaction for tuber total and marketable yields in 2005.
Variety main effect
The variety main effects significantly influenced total and marketable yields in
2005. ‘Harley Blackwell’ had significantly higher total and marketable yields 26.1 and
20.0 t ha-1 compared with ‘Atlantic’ at 23.6 and 18.6 t ha-1, respectively. This result was
most likely due to a higher tuber set per plant in ‘Harley Blackwell’ compared with
‘Atlantic’. ‘Atlantic’ may also be more sensitive to colder temperatures early in the
season and warmer temperatures later in the season, both of which would reduce net

23
assimilation to developing tubers. ‘Atlantic’ had significantly higher specific gravity
compared with ‘Harley Blackwell’ at 1.078 and 1.076, respectively. Plants in planting
dates 5 and 6 in 2004 and 2005 were bulking under high temperatures that increased
respiration and decreased dry matter accumulation compared with early plantings that
resulted in lower yields (Burton, 1989c). Optimum planting dates to obtain highest yields
in the TCAA, based on the results of this research, encompassed a 4-week period in the
middle of the traditional 12-week planting window. These dates corresponded to planting
dates 3 and 4 and extended from early February through the last week of February (Table
2-1).
Main effect interactions
The two-way interaction between planting date and variety main effects were
significant for the total tuber yields in 2005. ‘Harley Blackwell’ had significantly higher
total yields in planting dates 2, 3, and 6 compared with ‘Atlantic’ (Table 2-3). As
discussed in the variety main effects, ‘’Harley Blackwell’ appears to tolerate
environmental stress better compared with ‘Atlantic’ early and later in the season.
Tuber External Quality for 2004
Planting date main effect
Planting date main effect significantly influenced the number of total culls in 2004.
Tubers in planting dates 5 and 6 (planted 9 and 24 Mar) produced significantly higher
total culls, 14.5 and 10.4%, respectively, compared with all other planting dates (Table 2-
7). Since potatoes are a cool season crop, this was due to the warmer day and night
temperatures with an average of 4 and 6 degrees warmer, respectively, as well as wetter
weather conditions with an average additional rainfall amount of 5.3 cm.

24
Nitrogen main effect
Nitrogen rate main effect did not significantly influence the occurrence of external
defects. Percentages of total culls for the 168 and 224 kg ha-1 N rate treatments were 3.2
and 2.4%, respectively (Table 2-7).
Variety main effect
Variety main effect significantly influenced the incidence of total culls. ‘Atlantic’
had a significantly higher percentage of total culls (2.9%) compared with ‘Harley
Blackwell’ (2.8%) (Table 2-7). The interaction term for the planning date and variety
main effects were significant for total culls. ‘Atlantic’ had a significantly higher
percentage of total culls compared with ‘Harley Blackwell’ in planting date 2 at 3.1 and
0.3%, respectively. There were no other interaction effects for the 2004 production
season.
Tuber External Quality for 2005
Planting date main effect
Planting date main effect in 2005 significantly influenced total cull production
Tubers in planting dates 5 and 6 had significantly higher percentages of total culls (21.1
and 30.1% of total yields) compared with tubers from all other planting dates. A leaching
rainfall event (17.0 cm) between 31 May and 1 June, 2005 (early to mid bulking) during
planting dates 5 and 6 combined with higher temperatures during these planting dates
(average of 8 degrees) explained the significantly higher total culls, primarily rots, for
both planting dates 5 and 6 (Table 2-7; Fig 2.5).
Nitrogen rate main effect
Nitrogen main effect did not significantly influence external defects in 2005.

25
Variety main effect
Variety main effect significantly influenced total culls. ‘Harley Blackwell’ had
significantly lower total culls compared with ‘Atlantic’ (4.0 and 8.1%), respectively
(Table 2-7). As mentioned previously, ‘Atlantic’ may be more sensitive to the warmer
temperatures late in the season. ‘Atlantic’ should be planted for early chipping contracts
and ‘Harley Blackwell’ should be planted to fill late season contracts when ‘Atlantic’
quality can be suspect.
Tuber Internal Quality for 2004
Planting date main effect
Internal tuber defects are an important class of defects. Unlike external tuber
defects, internal defects cannot be seen on the grading table. Therefore, they cannot be
‘picked-out’ before loading on the truck. The only recourse a grower has for a field of
potatoes with high levels of internal defects is to blend the load with tubers that do not
have a high percentage of defects. According to the Department of Agriculture, 1978,
USDA no. 1 potatoes may not exceed 10 and 5% external and internal defects by weight,
respectively.
Planting date main effect significantly influenced the occurrence of IHN in tubers
in 2004. Tubers from planting date 4 (planted 23 Feb) had significantly higher incidence
of IHN compared with tubers from planting dates 1, 5 and 6 (planted 13 Jan., 9 and 24
Mar.) in 2004 (Table 2-8). IHN severity ranged from a high of 1.5 in planting date 4 to a
low of none in planting date 6. The significantly higher incidence of IHN in tubers
during planting date 4 could be explained in part to a leaching rainfall event in the first 30
DAP, between 200 and 400 GDD, which most likely leached a majority of the preplant
fertilizer (112 kg N ha-1) below the root zone. Although preplant N was applied in

26
planting dates 1-4, planting date 4 had the shortest amount of time before a leaching
rainfall event occurred after planting, approximately 21 DAP. Plants were in their early
vegetative stage, which required less nitrogen (approximately 15% of total N applied)
(Ojala et al., 1990). N applied preplant may have gone through nitrification and
subsequently leached below the root zone, therefore, leaving only the N applied at the
second sidedress for growth and development the remainder of the season.
Nitrogen rate main effect
Nitrogen main effect did not significantly influence the occurrence of tubers with
IHN in 2004 (Table 2-8).
Variety main effect
Variety main effect significantly influenced the incidence IHN in tubers in 2004.
‘Atlantic’ had a significant higher percentage of tubers with IHN compared with ‘Harley
Blackwell’, 1.7 and 0.0% of total yield, respectively (Table 2-8).
Tuber Internal Quality for 2005
Planting date main effect
Planting date main effect significantly influenced the percentage of tubers with
IHN in the 2005 production season. Similarly in 2004, tubers in planting date 4 (planted
22 Feb) had a significantly higher incidence of IHN (3.9%) compared with all other
planting dates. Tubers in planting date 5 also had a higher incidence of IHN (3.1%)
compared with planting dates 1, 2, 3, and 6. Severity was highest in planting dates 4 and
5, each having an IHN severity rating of 1.5.
A leaching rainfall event (Potatoes horticulturally and environmentally sound
fertilization of Hastings area potatoes, brochure) occurred between emergence and tuber
initiation (between 200 and 400 GDD for planting dates 4 and 5). NO3-N was most
27
likely leached below the root zone leaving the sidedress application as the primary N
supply for the remainder of the season. A second and third leaching rainfall, 55-60 DAP;
10.26 cm and 85 DAP; 9.69 cm, respectively, occurred during the early to mid and late
bulking periods for planting date 5 (Fig 2.5). The two late seasons leaching rainfall events
occurred during the period of highest N demand by the plant explaining the 15 fold
increase in tuber IHN levels compared with the 2004 season (Table 2-4). Ojala et al.
(1991) reported plants during tuber initiation and bulking use approximately 30 and 58
to71%, respectively, of the total N applied.
Nitrogen rate main effect
Nitrogen rate main effect did not significantly influence IHN in tubers, with similar
nitrogen rate main effect results in 2004, it would suggest that N rate alone is not the
single cause of IHN development in tubers
Variety main effect
Variety main effect significantly influenced the incidence of IHN in tubers.
‘Atlantic’ had a significantly higher incidence of IHN compared with ‘Harley Blackwell’
at 2.3 and 0.0%, respectively. ‘Atlantic’ also had a higher severity rating (1.3) compared
with ‘Harley Blackwell’ (0.0) (Table 2-8).
The percentage of tubers with IHN was highest in planting date 4 in 2004 and
2005. The highest mean maximum temperatures during the first 30 DAP and mean
minimum temperatures up to 90 DAP were observed starting in planting date 4. This
supports the findings by Lee et al. (1992) that IHN in ‘Atlantic’ is highly correlated with
high maximum temperatures in the first 30 DAP and high minimum temperatures for the
remainder of the season up to 90 DAP (Table 2-9). Additionally, leaching rainfall events
early in the season for planting date 4 in 2004 and 2005 as well as planting date 5 in 2005

28
predisposed these tubers to IHN due to a combination of nutritional and environmental
stress during early tuber development (Fig 2.4).
Growing Degree Day Model
Growing Degree Day Model and Potato Plant Development
The key developmental stages evaluated for this study were emergence and full
flower. Emergence and full flower occurred on average across planting dates at 213 and
804 accumulated GDD, respectively for the 2004 production season. In 2005, the
average across planting dates for emergence and full flower were 210 and 813
accumulated GDD, respectively. GDD is a more predictive model compared with
calendar days for determining key developmental stages for the potato plant. For
instance, full flower occurred from 68 to 40 d after planting for 2004 and 71 to 42 DAP
in 2005 over all planting dates. As planting dates progressed during the season, periods
between developmental stages compressed (Table 2-10). This result would be an
important concept to communicate to growers. Fertilizer and pesticide applications, as
well as, harvest dates should be timed by accumulated GDD and not calendar days as
commonly done.
Growing Degree Day Model and Tuber Yield
During the 2004 production season, planting date 4 had the highest total and
marketable yields, with accumulated GDD 2374. Marketable tuber yields were similar
for planting date 1 through 3 (Table 2-1). Planting in January and March resulted in an
average reduction in yield of 16 and 25%, respectively (Table 2-11).
The 2005 production season also had the highest yields in planting dates 3 and 4,
with accumulated GDD of 1894 an 2160, respectively. Optimum planting dates to obtain
highest yields in the TCAA, based on the results of this research, encompassed a 4-week
29
period in the middle of the traditional 12-week planting window. Optimum period for
highest yield extended from early to late February, 2004, which corresponded to 1951 to
2374 accumulated GDD for a 100 d season when planted during this part of the season.
Planting before and after this 4 week period resulted in an average decline in yield of 16
and 25% compared with planting date 4 respectively (Table 2-11).
The optimum period for highest yields in 2005 extended from early February
through the first week of March, 2005, which corresponded to 1894 to 2385 accumulated
GDD for a 100 d season. Planting date 4 had the highest yields in 2005, as well.
Planting before this date resulted in a reduction in yields from 48 to 55%. Planting later
resulted in a decrease in yields from 36 to 73% (Table 2-11).
Optimum planting dates for both the 2004 and 2005 season were planting dates 3
and 4. Planting before and after this 4-week period resulted in decreased yields for both
‘Atlantic’ and ‘Harley Blackwell’ for the 2004 and 2005 production seasons due to colder
temperatures early in the season and warmer and wetter weather later in the season
(Figure 2-4).
In this experiment (and on many private farms), harvest was not determined by
accumulated GDD but determined by calendar days. Aldicarb, a common soil applied
insecticide/nematicide used in the area has a 100-d harvest interval. Growers time their
harvest according to this required harvest interval. The calendar method works better for
the mid-season planting because ‘Atlantic’ and ‘Harley Blackwell’ both have about a
100-d season. Timing harvest by calendar days does not work late in the season because
as the season compresses, harvest should be accelerated. This concept would be
important in later plantings because hot and wet weather in June increases rots in mature

30
tubers as was demonstrated in this research. A grower that had late season contracts to
fill, could theoretically harvest their crop from 92 to 83 DAP rather than the 100 day
interval based upon aldicarb labeling requirements if an alternative to aldicarb could be
identified (Table 2-11).
Growing Degree Day Model and Internal Tuber Quality
The highest incidence of tubers with IHN in 2004 was during planting dates 3 and 4
with IHN values of 1.8 and 5.6% of total yield, respectively (Table 2-8). A leaching
rainfall event occurred between 200 and 400 GDD for planting dates 3 and 4 in 2004
(emergence and tuber initiation) (Figure 2-4). Accumulated GDD for planting dates 3
and 4 at harvest were 1951 and 2374, respectively (Table 2-11). The GDD accumulated
by harvest should not be used to predict the incidence of IHN in tubers. IHN most likely
is a combination of plants stresses that occur throughout the season and cannot be tied to
a single GDD number at the end of the season. It would be useful to relate the
accumulated GDD to the development stage of the potato plant and the timing of a
perceived plant stress. This may provide insight to the development of IHN in tubers.
The highest percentage of tubers with IHN in 2005 occurred in planting dates 4 and
5, with IHN values of 3.9 and 3.1% of total yield, respectively (Table 2-8). As is 2004, a
leaching rainfall event occurred between 200 and 400 accumulated GDD during planting
dates 4 and 5 in 2005 (Figure 2-4).
Lee et al. (1992) reported that IHN in ‘Atlantic’ developed early in the plant season
and correlated with the highest mean maximum temperature from 0-30 DAP and the
highest mean minimum temperature during the remainder of the growing season up to 90
DAP. The results of this research indicated that a leaching event early in the season,

31
between emergence and tuber initiation (200 to 400 GDD) also contributed to the
occurrence of IHN in tubers.
Conclusion
This experiment was designed to determine seasonal environmental (rainfall,
temperature) and nutrient constraints that impact plant stress and, in turn, tuber quality as
well as determining optimal yields over a typical growing season in the TCAA.
Optimal yields for the TCAA occur over a 4 week period in a twelve week planting
window from late January to late February. The results from this research suggest a
couple of options for growers who need to meet late season contracts. First, ‘Harley
Blackwell’ has demonstrated its effectiveness to produce quality tubers under conditions
when air temperatures and leaching rainfall events stress plants. Second, if an alternative
to the pesticide aldicarb is identified, a grower could harvest at 79 to 90 DAP based on
the GDD model. This alternative would reduce the incidence of rots due to the warmer
and wetter weather conditions typically experienced later in the season.
This research has also demonstrated that the internal physiological disorder, IHN is
triggered by rainfall and nutritional conditions that stress the plant early in the season
combined with increasing minimum daily temperatures later in the season. Leaching
rainfall events between 200 and 400 GDD after planting stressed the plants nutritionally
by potentially leaching nutrients from the root zone when potato plants are at a stage of
rapid growth and development as discussed in chapter 3.

32
Table 2-1. Total and marketable yield and specific gravity production statistics for 2004 and 2005 Total
yield Marketable yield
Specific gravity
Total yield
Marketable yield
Specific gravity
2004 2005
Main Effect t ha-1 t ha-1
Planting Datez (PD)
1 28.0 bcy 24.0 ab 1.083 a 19.3 c 14.9 d 1.081 a 2 28.0 bc 21.2 bc 1.085 a 19.6 c 16.9 d 1.076 b 3 30.8 ab 23.7 ab 1.079 b 29.7 b 26.2 b 1.080 a 4 33.0 a 26.4 a 1.076 c 35.3 a 32.4 a 1.081 a 5 25.5 c 17.0 d 1.068 d 30.5 b 20.9 c 1.076 b 6 24.5 c 19.4 cd 1.066 d 17.4 c 9.0 e 1.069 c Nitrogen Rate (NR)
168 kg N ha-1 29.4 a 20.5 b 1.076 25.2 19.1 1.077 224 kg N ha-1 27.1 b 23.2 a 1.076 24.5 19.4 1.077 Variety (V)
Atlantic 29.3 a 24.2 a 1.078 23.6 b 18.6 b 1.078 a Harley Blackwell 27.1 b 19.6 b 1.075 26.1 a 20.0 a 1.076 b

33
Table 2-1. Continued Total
yield Marketable yield
Specific gravity
Total yield
Marketable yield
Specific gravity
2004 2005
t ha-1 t ha-1
Interaction effectsx
PD*NR ** ** ns ns ns ns PD*V * ns *** ** ns * NR*V ns ns ns ns ns ns PD*NR*V ns ns ** ns ns ns zPlanting dates 1 through 6 for 2004 and 2005 were (13 Jan, 27 Jan, 9 Feb, 23 Feb, 9 Mar, 24 Mar, 2004 and 11 Jan, 25 Jan, 8 Feb, 22 Feb, 7 Mar 22 Mar,2005). yMeans are separated with column and main effect using Tukey’s studentized range test. Means followed by different letters are significantly different at p≤ 0.05. Means with no letters are not significantly different. xns, *, **, *** non-significant or significant at p≤ 0.05, 0.01, 0.001 using ANOVA

34
Table 2-2. Two-way interaction between planting date and nitrogen rate main effects for total and marketable tuber yields in 2004
Total yield
Marketable yield
2004
PDz*NR Slicedy by PD
t ha-1
1 168 27.8 23.8 1 224 28.2 24.0 2 168 27.0 20.7 2 224 28.9 21.7 3 168 28.0 bx 20.3 b 3 224 33.7 a 27.4 a 4 168 33.4 26.8 4 224 32.5 26.1 5 168 24.4 b 15.7 b 5 224 26.7 a 18.5 a 6 168 22.5 b 17.1 b 6 224 26.6 a 21.8 a zPlanting dates 1 through 6 for 2004 and 2005 were (13 Jan, 27 Jan, 9 Feb, 23 Feb, 9 Mar, 24 Mar, 2004) ySliced by PD - This option enabled the comparison of the fertilizer rates among each of the planting date treatments xMeans of the interaction effects followed by different letters within each planting date and column are significantly different at p≤ 0.05. Means with no letters are not significantly different.

35
Table 2-3. Two-way interaction between planting date and variety main effects for total tuber yields in 2004 and 2005
Total yield
Total yield
2004 2005
PDz*V Slicedy by PD
t ha-1
t ha-1
1 Atlantic 29.3 ax 19.2 1 Harley Blackwell 26.8 b 19.4 2 Atlantic 27.5 16.8 b 2 Harley Blackwell 28.4 22.7 a 3 Atlantic 32.1 a 26.9 b 3 Harley Blackwell 29.4 b 32.6 a 4 Atlantic 33.8 35.1 4 Harley Blackwell 32.1 35.5 5 Atlantic 29.0 a 32.5 a 5 Harley Blackwell 22.2 b 28.5 b 6 Atlantic 24.5 14.9 b 6 Harley Blackwell 24.5 20.0 a zPlanting dates 1 through 6 for 2004 and 2005 were (13 Jan, 27 Jan, 9 Feb, 23 Feb, 9 Mar, 24 Mar, 2004 and 11 Jan, 25 Jan, 8 Feb, 22 Feb, 7 Mar 22 Mar,2005). ySliced by PD - This option enabled the comparison of the varieties among each of the planting date treatments xMeans of the interaction effects followed by different letters within each planting date and column are significantly different at p≤ 0.05. Means with no letters are not significantly different.

36
Table 2-4. Size class distribution and range (%) production statistics 2004 and 2005 Size
Distribution by class (%)z Size Class Range (%)
Size Distribution by class (%)z
Size Class Range (%)
Main effects
B A1 A2 A3 A1 to A2
A2 to A3
B A1 A2 A3 A1 to A2
A2 to A3
Planting Datez (PD)
2004 2005
1 7.5 aby 68.5 a 15.3 a 1.0 ab 84.4 a 17.1 ab 19.2 a 71.2 ab 5.9 d 0.0 b 78.3 b 6.3 d 2 9.7 a 61.4 b 13.9 ab 0.7 ab 76.1 c 15.6 bc 10.1 b 73.6 a 13.0 c 0.2 b 87.3 a 13.9 c 3 9.2 a 62.0 b 15.5 a 0.0 b 78.8 bc 15.7 bc 8.8 bc 62.5 c 22.4 b 3.6 a 85.2 a 27.1 b 4 6.1 b 63.9 ab 18.6 a 1.1 ab 83.3 ab 15.6 ab 6.1 c 52.8 d 38.8 a 3.9 a 87.5 a 39.9 a 5 9.2 a 66.4 ab 9.1 b 0.0 ab 77.5 c 10.5 c 9.8 b 71.7 ab 15.4 c 0.0 b 88.1 a 15.8 c 6 5.8 b 65.5 ab 18.6 a 1.6 a 86.4 a 21.7 a 22.3 a 68.2 b 2.8 d 0.0 b 75.1 b 3.6 d Nitrogen Rate (NR) (kg ha-1)
224 7.4 64.1 16.3 0.9 81.8 18.4 13.0 a 66.4 13.7 0.6 84.7 a 15.3 168 8.3 65.2 13.7 0.5 80.6 15.2 11.3 b 67.2 14.4 0.7 83.1 b 16.6 Variety (V)
Atlantic 5.4 b 64.9 20.3 a 1.5 a 86.1 a 23.3 a 9.6 b 66.7 17.6 a 0.9 86.4 a 19.9 a Harley Blackwell
10.8 a 64.3 10.4 b 0.2 b 75.0 b 11.2 b 15.0 a 66.9 10.8 b 0.4 81.1 b 12.4 b

37
Table 2-4. Continued Size
Distribution by class (%)z Size Class Range (%)
Size Distribution by class (%)z
Size Class Range (%)
B A1 A2 A3 A1 to A2
A2 to A3
B A1 A2 A3 A1 to A2
A2 to A3
Interaction effectsx
2004 2005
PD*NR ns * ns ns ns ns ns ns ns * * ns PD*V ns *** ** * ns *** ** * ns * *** ns NR*V ns * ns * ns ns ns ns ns ns ns ns PD*NR*V ns ns ns ns ns ns ns ns ns ns ns ns zPlanting dates 1 through 6 for 2004 and 2005 were (13 Jan, 27 Jan, 9 Feb, 23 Feb, 9 Mar, 24 Mar, 2004 and 11 Jan, 25 Jan, 8 Feb, 22 Feb, 7 Mar 22 Mar,2005). yMeans are separated with column and main effect using Tukey’s studentized range test. Means followed by different letters are significantly different at p≤ 0.05. Means with no letters are not significantly different. xns, *, **, *** non-significant or significant at p≤ 0.05, 0.01, 0.001 using ANOVA.

38
Table 2-5. Two-way interaction between planting date and nitrogen rate main effects for size class range (%) for A1 in 2004 and A3 and size class distribution for A1 to A2 in 2005 A1 A3 A1 to A2
2004 2005
PDz*NR Slicedy by PD
%
%
1 168 84.1 ax 0.0 79.6 1 224 77.4 b 0.0 76.1 2 168 71.9 0.5 88.8 2 224 72.9 0.0 85.4 3 168 71.1 2.0 b 86.1 3 224 74.2 5.2 a 84.0 4 168 76.5 5.9 a 85.4 b 4 224 74.7 2.4 b 88.8 a 5 168 76.1 0.0 88.1 5 224 81.3 0.0 87.5 6 168 80.8 0.2 76.9 a 6 224 73.6 0.0 72.6 b zPlanting dates 1 through 6 for 2004 and 2005 were (13 Jan, 27 Jan, 9 Feb, 23 Feb, 9 Mar, 24 Mar, 2004 and 11 Jan, 25 Jan, 8 Feb, 22 Feb, 7 Mar 22 Mar,2005) ySliced by PD - This option enabled the comparison of the fertilizer rates among each of the planting date treatments xMeans of the interaction effects followed by different letters within each planting date and column are significantly different at p≤ 0.05. Means with no letters are not significantly different.

39
Table 2-6. Two-way interaction between planting date and variety main effects for size class range (%) for A1, A2, A3 and A2 to A3 in 2004 and B, A1, A3 and A1 to A2 in 2005
A1 A2 A3 A2 to A3
B A1 A3 A1 to A2
2004 2005
PDz*V Slicedy by PD
%
%
1 Atlantic 69.4 18.1 1.1 20.1 16.9 b 71.7 0.0 80.8 a 1 Harley Blackwell 67.6 12.4 0.9 14.3 21.7 a 69.8 0.0 75.2 b 2 Atlantic 64.7 ax 16.7 0.7 18.6 9.1 73.8 0.3 88.1 2 Harley Blackwell 58.0 b 11.3 0.8 12.8 11.1 73.4 0.1 86.1 3 Atlantic 62.4 20.8 a 0.0 21.2 a 6.6 b 60.7 6.4 a 84.7 3 Harley Blackwell 61.5 10.9 b 0.0 10.9 b 11.2 a 64.1 1.5 b 85.1 4 Atlantic 64.1 22.8 2.8 a 26.8 a 4.2 b 50.6 5.6 a 88.1 4 Harley Blackwell 63.7 14.6 0.2 b 15.6 b 8.3 a 55.0 1.6 b 86.1 5 Atlantic 70.8 a 12.9 a 1.9 a 16.5 a 7.7 b 67.9 b 0.0 90.6 a 5 Harley Blackwell 61.1 b 5.7 b 0.0 b 5.7 b 12.0 a 75.3 a 0.0 84.7 b 6 Atlantic 57.2 b 31.7 a 4.5 a 38.1 a 15.6 b 73.3 a 0.0 83.3 a 6 Harley Blackwell 72.6 a 8.3 b 0.1 b 9.0 b 29.7 a 62.9 b 0.2 65.7 b zPlanting dates 1 through 6 for 2004 and 2005 were (13 Jan, 27 Jan, 9 Feb, 23 Feb, 9 Mar, 24 Mar, 2004 and 11 Jan, 25 Jan, 8 Feb, 22 Feb, 7 Mar 22 Mar,2005) ySliced by PD - This option enabled the comparison of the varieties among each of the planting date treatments xMeans of the interaction effects followed by different letters within each planting date and column are significantly different at p≤ 0.05. Means with no letters are not significantly different.

40
Table 2-7. External quality (green, growth cracks, mis-shaped, rot and total culls) % of total yield 2004 and 2005 External tuber defects (%) Main effects Green Growth
crack Mis-shaped
Rot Total cullz
Green Growth crack
Mis-shaped
Rot Total cullz
Planting Date (PD)
2004 2005
1 0.0 c 0.0 0.0 b 0.0 c 0.0 c 0.5 a 0.1 a 0.0 0.0 c 0.9 c 2 0.0 bc 0.3 a 0.2 a 0.0 c 0.0 c 0.3 a 0.1 a 0.1 0.1 c 1.5 c 3 0.1 ab 0.0 0.1 ab 0.4 c 0.4 c 0.5 ab 0.0 ab 0.1 0.0 c 1.4 c 4 0.5 a 0.0 0.0 b 4.6 b 4.6 b 0.3 b 0.0 b 0.0 0.0 c 0.5 c 5 0.0 bc 0.0 0.0 ab 13.8 a 14.5 a 0.5 ab 0.0 ab 0.0 19.9 b 21.1 b 6 0.0 c 0.0 0.0 ab 10.4 a 10.4 a 0.0 a 0.0 b 0.0 29.9 a 30.1 a Nitrogen Rate (NR) kg ha-1
224 0.20 0.0 0.0 2.4 2.4 0.3 0.0 0.0 8.20 5.7 168 0.39 0.0 0.0 3.2 3.2 0.3 0.0 0.0 9.18 6.0 Variety (V) Atlantic 0.4 0.0 0.1 a 2.9 2.9 a 0.4 0.0 a 0.1 a 9.87 8.1 a Harley Blackwell
0.1 0.0 0.0 b 2.8 2.8 b 0.2 0.0 b 0.0 b 7.52 4.0 b

41
Table 2-7. Continued Green Growth
crack Mis-shaped
Rot Total cullz
Green Growth crack
Mis-shaped
Rot Total cullz
Interaction effects
2004 2005
PD*NR ns ns ns ns ns ns ns ns ns * PD*V ns ns ns ns * ns ns ns ns ns PD*F ns ns ns ns ns ns ns ns * ns PD*NR*V ns ns ns ns ns ns ns ns ns ns zPlanting dates 1 through 6 for 2004 and 2005 were (13 Jan, 27 Jan, 9 Feb, 23 Feb, 9 Mar, 24 Mar, 2004 and 11 Jan, 25 Jan, 8 Feb, 22 Feb, 7 Mar 22 Mar,2005). yMeans are separated with column and main effect using Tukey’s studentized range test. Means followed by different letters are significantly different at p≤ 0.05. Means with no letters are not significantly different. xns, *, **, *** non-significant or significant at p≤ 0.05, 0.01, 0.001, respectively using ANOVA.

42
Table 2-8. Internal quality (%) of total yield 2004 and 2005 Internal Quality (%)
Main effects HH IHN IHN severity
CRS BCL HH IHN IHN severity
CRS BCL
Planting Date (PD)
2004 2005
1 0.9 b 0.0 b 1.0 14.3 a 0.0 b 0.0 0.0 b 0.1 b 0.3 a 6.0 2 3.8 a 1.2 ab 0.6 0.7 b 1.2 a 0.0 0.0 b 0.3 b 0.0 b 0.6 3 0.0 c 1.8 ab 0.5 3.9 ab 0.0 b 0.0 0.0 b 0.1 b 0.0 b 0.0 4 0.0 c 5.6 a 1.0 0.4 b 1.4 a 0.0 3.9 a 1.5 a 0.0 b 0.3 5 0.0 c 0.2 b 0.7 0.0 b 0.0 b 0.0 3.1 a 1.5 a 0.0 b 0.0 6 0.0 bc 0.8 b 0.6 0.0 b 0.0 b 0.0 0.2 b 0.5 b 0.0 b 0.0 Nitrogen Rate (NR) kg ha-1
224 0.3 1.0 0.9 0.8 b 0.2 0.0 0.4 0.7 0.0 0.4 168 0.2 1.1 0.5 2.6 a 0.1 0.0 0.8 0.6 0.0 0.7 Variety (V) Atlantic 1.0 a 3.2 a 0.6 1.6 0.4 a 0.0 2.3 a 1.3 a 0.0 2.1 Harley Blackwell
0.0 b 0.0 b 0.9 1.5 0.1 b 0.0 0.0 b 0.0 b 0.0 0.0

43
Table 2-8. Continued HH IHN IHN
severity CRS BCL HH IHN IHN
severity CRS BCL
Interaction effects
2004 2005
PD*NR ns ns ns ns ns ns * ns ns ns PD*V ns ns ns ns ns *** * ns ns ** PD*F ns ns * ns ns ns ns ns ns ns PD*NR*V ns ns ns ns ns ns ns ns ns ns zPlanting dates 1 through 6 for 2004 and 2005 were (13 Jan, 27 Jan, 9 Feb, 23 Feb, 9 Mar, 24 Mar, 2004 and 11 Jan, 25 Jan, 8 Feb, 22 Feb, 7 Mar 22 Mar,2005). yMeans are separated with column and main effect using Tukey’s studentized range test. Means followed by different letters are significantly different at p≤ 0.05. Means with no letters are not significantly different. xns, *, **, *** non-significant or significant at p≤ 0.05, 0.01, 0.001, respectively using ANOVA.

44
Table 2-9. Mean maximum and minimum temperature (C) for planting dates 1-6, 2004 and 2005 0-30 DAP 30-60 DAP 60-90 DAP 2004 Mean Mean Mean Planting Order
Date of Planting
Max Min Max Min Max Min
1 13 Jan 18.8 7.2 19.4 8.3 23.3 10.5 2 27 Jan 18.3 7.7 22.2 10.0 24.4 11.1 3 9 Feb 19.4 8.8 22.7 9.4 25.5 12.2 4 23 Feb 21.1 10.5 23.8 11.1 27.2 16.1 5 9 Mar 22.2 9.4 25.5 12.2 30.0 17.7 6 24 Mar 23.8 10.5 27.2 15.0 31.6 20.0
0-30 DAP 30-60 DAP 60-90 DAP 2005 Mean Mean Mean
Planting Order
Date of Planting
Max Min Max Min Max Min
1 11 Jan 17.2 6.1 20.0 7.2 23.3 11.6 2 25 Jan 19.4 7.2 20.0 8.8 24.4 10.5 3 8 Feb 20.0 7.7 23.3 11.6 23.8 10.5 4 22 Feb 20.0 9.4 24.4 11.6 26.1 13.3 5 7 Mar 22.2 11.1 23.8 11.1 28.8 16.1 6 22 Mar 24.4 11.6 26.1 13.3 29.4 19.4

45
Table 2-10. Accumulated GDD and calendar days to obtain emergence and full flower 2004 and 2005 2004 Planting Order
Date of Planting
Date of emergence
Days to emergence
GDDy to emergence
Calendar days to FF
GDD to FF Calendar days to harvest
GDD to harvest
1 13 Jan 6 Feb 24 240 68 841 104 1493 2 27 Jan 16 Feb 20 226 61 806 104 1676 3 9 Feb 25 Feb 16 178 52 749 106 1951 4 23 Feb 7 Mar 13 218 49 820 106 2374 5 9 Mar 22 Mar 13 202 47 816 104 2490 6 24 Mar 5 Apr 12 211 40 792 104 2840 Average 16 213 53 804 2137 2005 Planting Order
Date of Planting
Date of emergence
Days to emergence
GDD to emergence
Calendar days to FFx
GDD to FF Calendar days to harvest
GDD to harvest
1 11 Jan 8 Feb 28 244 71 814 104 1442 2 25 Jan 15 Feb 21 213 61 794 106 1677 3 8 Feb 23 Feb 15 199 56 837 105 1894 4 22 Feb 12 Mar 18 211 48 801 106 2160 5 7 Mar 22 Mar 15 197 47 811 105 2385 6 22 Mar 31 Mar 9 198 42 826 105 2719 Average 18 210 54 813 2046

46
Table 2-11. Early and late season yield reduction and harvest date at 2000 GDD for 2004 and 2005
2004 Planting Order
Date of Planting
Date of emergence
Yield reduction
Calendar days to 2000 GDD
Harvest date at 2000 GDD
1 13 Jan 6 Feb -15 130 17 May 2 27 Jan 16 Feb -16 115 21 May 3 9 Feb 25 Feb -7 104 25 May 4 23 Feb 7 Mar 0 97 30 May 5 9 Mar 22 Mar -23 89 6 June 6 24 Mar 5 Apr -26 81 13 June 2005 Planting Order
Date of Planting
Date of emergence
Yield reduction
Calendar days to 2000 GDD
Harvest date at 2000 GDD
1 11 Jan 8 Feb -55 130 21 May 2 25 Jan 15 Feb -48 118 23 May 3 8 Feb 23 Feb -20 110 29 May 4 22 Feb 12 Mar 0 101 3 June 5 7 Mar 22 Mar -36 94 9 June 6 22 Mar 31 Mar -73 84 14 June

47
0.00
1.00
2.00
3.00
4.00
5.00
6.00
7.00
8.00
9.00
10.00
1/13
/04
1/20
/04
1/27
/04
2/3/
042/
10/0
42/
17/0
42/
24/0
43/
2/04
3/9/
043/
16/0
43/
23/0
43/
30/0
44/
6/04
4/13
/04
4/20
/04
4/27
/04
5/4/
045/
11/0
45/
18/0
45/
25/0
46/
1/04
6/8/
046/
15/0
46/
22/0
46/
29/0
47/
6/04
Date
Rai
nfal
l (cm
)
0
5
10
15
20
25
30
35
Dai
ly a
vera
ge te
mpe
ratu
re (C
)
Rainfall events Average daily temperature
Daily rainfall and average daily temperature - 2004
0.00
1.00
2.00
3.00
4.00
5.00
6.00
7.00
8.00
9.00
10.00
1/12
/05
1/19
/05
1/26
/05
2/2/
05
2/9/
052/
16/0
5
2/23
/05
3/2/
053/
9/05
3/16
/05
3/23
/05
3/30
/05
4/6/
05
4/13
/05
4/20
/05
4/27
/05
5/4/
05
5/11
/05
5/18
/05
5/25
/05
6/1/
05
6/8/
056/
15/0
56/
22/0
5
6/29
/05
Date
Rai
nfal
l (cm
)
0
5
10
15
20
25
30
35
Ave
rage
dai
ly te
mpe
ratu
re (C
)
Rainfall events Average daily temperature
Daily rainfall and average daily temperature – 2005
Figure 2-2. Daily rainfall (cm) for a. 2004 and b. 2005 production season. Grouping of
red bars denote a leaching rainfall event (7.6 cm in 3 days or 10.1 cm in 4 days). The yellow, pink, blue, green, orange and black lines denote planting dates 1-6, respectively, from emergence to tuber initiation
a.
b.

48
0.00
5.00
10.00
15.00
20.00
25.00
30.00
35.00
40.00
Atl Atl Atl Atl Atl Atl HB HB HB HB HB HB
1 2 3 4 5 6 1 2 3 4 5 6
Planting Date x Variety
Yiel
d (t/
ha)
0
500
1000
1500
2000
2500
3000
Acc
umul
ated
GD
D
Total yield Marketable yield Accumulated GDD
0.00
5.00
10.00
15.00
20.00
25.00
30.00
35.00
40.00
Atl Atl Atl Atl Atl Atl HB HB HB HB HB HB
1 2 3 4 5 6 1 2 3 4 5 6
Planting date x Variety
Yiel
d (t/
ha)
0
500
1000
1500
2000
2500
3000
Acc
umul
ated
GD
D
Total yield Marketable yield Accumulated GDD
Figure 2-3. Total and marketable yield at each planting date x variety and accumulated
GDD at harvest. a. 2004 b. 2005
a.
b.

49
CHAPTER 3 YIELD AND QUALITY OF ‘ATLANTIC’ POTATO (SOLANUM TUBEROSUM L.)
TUBERS AND OFF-FIELD NUTRIENT MOVEMENT UNDER VARYING NITROGEN SOURCES AND STAGED LEACHING IRRIGATION EVENTS
Introduction
The St. Johns River has been identified by the state of Florida as a priority water
body in need of restoration under the auspices of the Surface Water Improvement and
Management Act implemented by the Florida legislature in 1987. Personnel from the St.
Johns River Water Management District (SJRWMD), University of Florida, multiple
state government agencies, and the North Florida Grower’s Exchange have developed
“Best Management Practices” (BMP) for potato production in the Tri-County
Agricultural Area (St. John’s, Putnam, and Flagler Counties, TCAA). The purpose of
implementing BMPs is to reduce nitrate run-off from the approximately 7,300 ha of land
in potato production in the St. John’s River watershed.
The SJRWMD has estimated that as much as 36% of the pollutant load entering the
river basin today is related to human activities that include agricultural production. Algal
blooms in the St. Johns River have coincided with peak runoff associated with the TCAA
potato season (SJRWMD, 1996).
Bailey and Wadell (1979) reported non-point source pollution from agricultural
runoff contributes approximately 9.5 million tons of N and P to U.S. surface waters
annually. The EPA reports that non-point source pollution from agriculture has impaired
60% of the river miles and half of the lake acreage surveyed by states, territories and
tribes (EPA website).

50
Figure 3-1. Aerial photograph of potato production fields along the St. Johns River, St.
Johns County, Florida. Courtesy of Pam Livingston-Way, SJRWMD
Growers in Northeast Florida typically apply approximately 308 kg N ha-1 for
commercial potato production (Hochmuth, et al., 1993). Growers participating in the
BMP program are encouraged to apply the IFAS recommended nitrogen rate of 224 kg N
ha-1. In the event of a leaching rain, growers are allowed, under the provisions of the
program, to apply an additional 34 kg N ha-1 (Hutchinson et al., 2002).
It has generally been accepted that leaching rains are responsible for the majority of
nitrate movement out of potato production ground. IFAS research defines a leaching rain
as 7.6 cm of rain in three days or 10 cm of rain over seven days. After a leaching event,
growers are encouraged to apply an additional 34 kg N ha-1 (Kidder et al., 1992)
Potatoes are typically grown in sandy, course textured soils that have a low water
holding capacity, which exacerbates the potential of NO3-N leaching below the root
system of the potato plant. Potato plants have a relatively shallow root system with
greater than 90% of the total root area located in the upper 25 cm of the soil profile
(Munoz, 2004; Rosen, 2001). Heavy rain washes fertilizer out of the potato row and
either into the furrow or into the perched water table. Fertilizer washed into the furrow

51
moves in surface water off the potato beds and into tail-water or drainage canals. The
amount of fertilizer that potentially could be leached from the row is dependent on the
type and amount of fertilizer applied within the row, as well as the time between fertilizer
application and a leaching event occurs.
Controlling NO3-N leaching can be difficult under the best management practices
due to unforeseen leaching rainfall events. Wang and Alva (1996), evaluated soil
columns with a Wabasso sand and reported approximately 88 to 100% of ammonium
nitrate was lost due to leaching compared to 11.5 to 11.7% of a polymer-coated
controlled release fertilizer (CRF). Maynard and Lorenz, (1979); Elkashif and Locascio,
(1983) reported the release of N from sulfur coated urea (SCU, slow release fertilizer)
was too slow to sufficiently meet the demands of the potato crop. Waddell et al. (1999)
reported the tuber N uptake in SCU treatments was the lowest compared with other
fertilizer treatments and attributed this to the lack of release of the coated urea when the
plant N demand was high. While CRFs have been on the market for several years
(Trenkel, 1997), vegetable growers require a CRF with a more predictable release
pattern, one that is customized for individual crop growth and development stages.
Fertilizer manufacturers addressed this with the release of a polymer-coated urea (PCU).
Unlike SCU that is affected by soil properties (moisture or microbial activity), PCUs are
dependent upon temperature and moisture permeability of the resin coating, therefore,
making the release rate more predictable or controlled (Shoji and Gandeza, 1992).
Studies have reported the benefits of polymer-coated CRFs in potato production
systems. CRFs maintained quality and yield while reducing nutrient leaching.
Hutchinson et al. (2003), reported that yield and quality of ‘Atlantic’ on an Ellzey fine

52
sand in FL was not adversely affected, although, two leaching rainfall events occurred
during the production season (7-13 DAP and 92-98 DAP).
Hutchinson (2005) reported a 69% reduction in tubers with IHN with the use of a
blended polymer coated urea product (168 kg N ha-1) with an approximate release rate of
45, 75 and 120 DAP, compared with ammonium nitrate (AN) at the BMP rate (224 kg N
ha-1). Similar results were also reported by Pack (2004), in which the average reduction
of tubers with IHN was68% with CRF (168 kg N ha-1) treatments compared with the
BMP rate of AN (224 ha N ha-1). Zvomuya and Rosen (2001) reported in 1996 and 1997,
PCU treatments produced significantly higher total and marketable tuber yields of
‘Russet Burbank’ on a Hubbard loamy sand in MN when compared with AN fertilizer.
Leaching events (> 5cm within a 48 hr period) were recorded in 1996 (20 and 50 DAP)
and 1997, (40, 50 and 75 DAP). IHN was not reported, although the incidence of HH
remained the same over both production seasons for the CRF treatment and decreased in
1997 in the AN fertilizer treatment.
Zvomuya et al. (2003) reported a decrease in NO3-N leaching of 34-49% after
leaching irrigation events in CRF plots. Total and marketable tuber yields of ‘Russet
Burbank’ were 12 to 19% higher with CRFs compared with multiple applications of urea
on a Hubbard loamy sand in Becker, MN.
CRF could be the N management tool for Northeast Florida potato production that
reduces NO3-N leaching while, at the same time, maintaining acceptable yields.
However, the relationships between fertilizer source, leaching irrigation timing, and tuber
quality and yield are not well understood.

53
The objectives of this study were to 1) determine the influence of fertilizer source
(soluble and controlled release) and timing of leaching irrigation on yield and quality of
‘Atlantic’ 2) determine the influence of fertilizer source (soluble and controlled release)
and timing of leaching irrigation on nutrient leaching and nutrients in surface water
runoff during a leaching event.
Materials and Methods
Site Description
The experiment was conducted during the 2004 and 2005 production years at the
University of Florida, Plant Science Research and Education Unit (PSREU), Hastings,
Florida on an Ellzey fine sand (sandy, siliceous, hyperthermic Arenic Ochraqualf; sand
90% to 95%, <2.5% clay, <5% silt). The soil profile is described as poorly drained
although the top 94 cm have a very high permeability rate (5-10 cm/hr). A restricting
clayey layer lies below the sandy loam top layer of the profile. The water table is within
25 cm of the surface for one to six months of the year (Soil Survey, St Johns County,
1983)
Experimental Design
The experiment was arranged as a factorial randomized complete block as a split-
split design with four blocks. Each of the four blocks were located in a single bed at the
PSREU (beds 12-15 NL). The study was conducted at the same location for the 2004 and
2005 production years. The main effects were irrigation event, nitrogen source, and side-
dress fertilizer application.
Main plots were 16 rows wide (102 cm centers) by 18.3 m (60 ft) long running
south to north with a 6.1 m (20 ft) buffer between main plots. Irrigation treatments were
applied to main plots at 0, 2, 4, 8, and 12 WAP (weeks after planting). Nitrogen source

54
was applied to eight row sub-plots in each main plot. Ammonium nitrate (AN) and
polymer coated urea (controlled release fertilizer; CRF) were the fertilizer sources. The
last main effect, side-dress fertilizer application, was applied to four of the eight rows in
each sub-plot. Ammonium nitrate (34-0-0) was applied with a hydraulic fertilizer
applicator as a band on either side of the potato plant after each leaching irrigation date
event (Table 3-1 and Fig 3.1).
Crop Production Practices
Tuber Planting
Potatoes were cut at planting to an approximate 71 g seed piece and dusted with
fungicide [1.13 g a.i., fludioxonil and 21.8 g a.i. mancozeb per 45.4 kg seed pieces]
(Maxim MZ; Syngenta Crop Protection, Inc., Greensboro, N.C.)]. Azoxystrobin, a.i.[0.1
L ha-1 (Amistar; Syngenta, Crop Protection, Greensboro, N.C.)] and aldicarb a.i. [3.4 kg
ha-1 (Temik, Bayer Corp., Kansas City, Mo.)] was applied in-row at planting. All other
pesticide applications during the growing season followed recommendations for Florida
potato production (Hutchinson et al., 2004).
Potatoes were planted 19 and 22 Feb 2004 and 2005 and harvested 1 and 8 June
2004 and 2005 (106 and 108 DAP), respectively. Between and within row spacing was
102 and 20 cm (40 and 8 inches), respectively. This resulted in a plant density of
approximately 48,400 plants ha-1.
Irrigation
Overhead solid set sprinkler irrigation system with #4 mini-wobblers (127 L hr-1 or
0.6 gpm at 25 psi; Senninger Irrigation, Inc., Clermont, FL) was installed to apply each
leaching irrigation event (2, 4, 8 and 12 WAP) 7.6 cm of simulated rainfall to main plots.
55
Irrigation was collected in U. S. Weather Bureau approved rain gauges (Forestry
Suppliers, Inc., Jackson, MS) placed in each irrigation main plot.
Plots were irrigated with seepage irrigation throughout the growing season except
during leaching irrigation events and periods of sufficient rainfall. The seepage
irrigation system is a semi-closed system. Water withdrawn from the confined aquifer is
pumped through PVC (polyvinyl chloride) pipe to each V-shaped open water furrow in
the field. Each water furrow is situated 18.2 m apart. Water seeps from the water furrow
laterally, underground, across the bed and through capillarity reaches the root system of
the potato plant (Singleton, 1990). A perched water table was maintained at
approximately 45-60 cm from the top of the potato row.
Nutrient Management
Ammonium Nitrate Nitrogen
Fertilizer application was based on best management practice (BMP)
recommendations for Florida potato production (224 kg.N ha-1; Hutchinson et al., 2004).
Pre-plant fertilizer was applied as a 15 cm wide band on top of the row at a rate of 112 kg
N ha-1 as 14N-6P2O5-12K2O with a John Deere 6615 and a two-row hydraulic fertilizer
applicator (Kennco Mfg., Ruskin FL,). Fertilizer was incorporated into each row with a
four-row chopper then rows were bedded prior to planting. Two additional sidedress
applications of 56 kg N ha-1 as 30-0-0 were banded on either side of the potato plants
with a two row hydraulic fertilizer applicator at 34 and 43 DAP in 2004 and 37 and 43
DAP in 2005 to AN plots to achieve the BMP rate of 224 kg ha-1. Following each
sidedress application, a four row covering disk was used to cover the fertilizer banded
along side the potato plants in each row. This is not the side dress nitrogen main effect.

56
After a leaching irrigation event, a third side dress nitrogen application of 34 kg N
ha-1 (30-0-0 NPK) was mechanically applied to four of the eight row main fertilizer
treatments (treatments 2 and 4) following the BMP recommendation for fertilizer
application after a leaching rain. (Table 3-1, Fig 3.1). This is the sidedress nitrogen
application main effect.
Controlled Release Fertilizer
All CRF fertilizer was applied in a single preplant application at 196 kg N ha-1 (38-
0-0, The Scotts Company, Marysville, OH) on 12 and 21 Feb 2004 and 2005,
respectively (Fig 3.1). CRF is a polymer-sulfur coated urea product designed to release
75% of the nitrogen by 75 DAP. All CRF treatments received 78 kg ha-1 P2O5 as 0-20-0
and 202 kg ha-1 K2O as 0-0-50 preplant.
Tuber Production Analysis.
At harvest, two rows (6.1 meters each) from each fertilizer source by additional
sidedress application plot were harvested, washed, and mechanically graded and sized
into the following class sizes; B = 3.8 to 4.4 cm, A1 = 4.4 to 6.4 cm, A2 = 6.4 to 8.3 cm,
A3=8.3 cm to 10.2 cm, A4 = > 10.2 cm at the PSREU. Marketable yield is defined as
no. 1 tubers with diameters between 4.4 and 10.2 cm (USDA, 1978) and without visible
blemishes (rotten, green, misshapen, or growth cracks).

57
Tuber Specific Gravity.
Specific gravity was calculated on a sub-sample of marketable tubers from each
fertilizer source by additional sidedress application plot using the weight in air/weight in
air-weight in water method (Burton, 1989a). ‘Atlantic’ potatoes are the standard chip
variety. High specific gravity is desired. Specific gravities of at least 1.078 are
considered good for production at the PSREU research farm in Hastings, FL (Hutchinson
et al., 2002).
External Quality.
Culls (green, growth cracks, misshapen, and rotten tubers) were removed and
weighed at the grading line. External quality (green, growth cracks, misshaped and rot)
were reported as a percentage of total yield.
Internal Quality.
A 20 tuber sub-sample from each fertilizer source by additional sidedress
application plot was cut into quarters and rated for internal quality. Rated physiological
disorders included hollow heart (HH), internal heat necrosis (IHN) and brown center
(BC). Disease induced disorders included corky ring spot (CRS) and brown rot (BR).
IHN severity was scored on a one to six scale with a score of one to four relating to the
number of quarters with IHN. A score of five or six indicated that all quarters had the
disorder and up to 75 to 100% of all quarters were covered, respectively.
Water Sample Collection and Nutrient Load
Surface Run-Off Volume
Surface run-off volume was collected from a fertilizer source main plot during each
irrigation event. A 7.1 cm (18 in) PVC pipe was placed perpendicular to each of the

58
eight plots at the water furrow to route surface water flow. Water volume was collected
every ten minutes from the pipe for ten seconds and the water volume was recorded.
Nutrient Load
A 20 mL water sample was collected every 10 min as runoff started from each
fertilizer source main plot, (8 total) at each 10 minute sample interval using the system
described for surface water volume. Sample collection stopped once irrigation was
turned off and runoff ceased from each of the fertilizer plots. Water samples were stored
in a freezer at -15C until analyzed. Samples were analyzed for NO3-N and NH4-N (EPA
method 353.2), P, K (EPA method 200.7), and EC at the University of Florida/IFAS
Analytical Research Laboratory, Gainesville, FL (Mylavarapu and Kennelley, 2002).
Wells
Observation wells (10 cm diameter by 0.9 m long) were installed (10 and 8 Mar,
2004 and 2005 (23 and 15 DAP), respectively in each fertilizer source by sidedress
application plot (80 total) so that the top of the wells were flush with the top of the row.
This allowed access to the perched water table for water samples during the growing
season. A 20 mL water sample was collected biweekly and at 24 hours post irrigation
event. Water samples were processed and stored as described previously.
Lysimeters
Porous cup suction lysimeters (model 1900 Soil Water Samplers) (SoilMoisture
Equipment Corp., Santa Barbara, CA) were installed (10 and 9 Mar, 2004 and 2005; 23
and 16 DAP, respectively) in each fertilizer source by sidedress application plot (80 total)
to a depth of 30 cm. At sampling, a vacuum (50-60 kPa) was drawn on each lysimeter. A
46 cm plastic tube attached to a 50cc syringe was used to extract the water from each
lysimeter. Samples (20 mL) were taken biweekly and at 24 hours post leaching irrigation
59
event from each fertilizer source plot. Water samples were processed and stored as
described previously.
Growing Degree Day Model
Growing degree days (GDD) were calculated throughout the season in 2004 and
2005 with the following formula (Sands et al., 1979):
GDD = [(minT + maxT)/2)-7C].
where minT and maxT are the minimum and maximum daily temperatures and the base is
7C or 45°F.
GDD totals were recorded for key growth and developmental stages (emergence,
and full flower). Emergence was determined when the plantlets were just emerging from
the soil. Full flower was determined when approximately 90-95% of the peduncals on
plants in each plot had open flowers.
Statistical Analysis
Tuber production. A general linear model was used to determine yield and
internal and external quality responses of potato as a result of fertilizer source and
leaching irrigation events for the 2004 and 2005 production seasons. Normality for each
potato class size was checked by residual analysis using the Shapiro-Wilk test as
implemented in the PROC CAPABILITY procedure of SAS (SAS Institute, 2004).
Means were separated using Tukey adjustment as implemented in SAS (SAS Institute,
2004) to separate individual factor means and/or interaction means when significant.
Interactions were calculated using LSMeans with the slice option (SAS 2004).
Water analysis. A general linear model was used to determine water nutrient
concentrations in the water table (wells and lysimeters) as well as nutrient load from each
irrigation date treatment for 2004 and 2005 production years. Normality for each water

60
nutrient analyzed was checked by residual analysis using the Shapiro-Wilk test as
implemented in the PROC CAPABILITY procedure of SAS (SAS, Institute, 2004).
Concentrations of nutrients were log transformed and checked for normality then back
transformed. Means were separated using Tukey adjustment as implemented in SAS
(SAS Institute, 2004) to separate individual factor means and/or interaction means when
significant.
Results And Discussion
Tuber Yield for 2004
Irrigation date main effect
Irrigation date main effect significantly influenced total and marketable tuber yields
for the 2004 season (Table 3-2). The later in the season a leaching event occurred, total
and marketable tuber yields and specific gravity were more negatively impacted. Total
and marketable tuber yields for the 8 and 12 WAP irrigation date were 10 and 11 %
lower, respectively, than the 0 WAP irrigation date. Ojala et al. (1990), reported
nutritional and/or environmental stress at or near full flower can negatively impact total
and marketable tuber yields as well as specific gravity. This is due to the high nitrogen
requirement during the tuber bulking stage. Approximately, 58 to 71% of total nitrogen
uptake by the potato crop occurs from early to mid tuber bulking.
Optimal yield for this study should be in 0 WAP irrigation plots since no
supplemental irrigation was applied. The 4 WAP irrigation date was not applied due to a
naturally occurring leaching rainfall at the scheduled irrigation event in 2004. It received
the same rainfall and irrigation schedule as the 0 WAP plot. Total and marketable tuber
yields for plants in the 0 WAP treatment were a respectable 29.5 and 25.0 t ha-1,
respectively in 2004.

61
Tubers from plants in the 8 and 12 WAP irrigation treatment had significantly
lower specific gravities compared with tubers in the 0, 2 and 4 WAP irrigation treatments
in 2004 (Table 3-2). The percent of tuber weight in the A2 to A3 size class range was
also negatively impacted in the 8 and 12 WAP irrigation date treatments. A 45%
decrease in this tuber classification was observed compared with the 0 WAP date (Table
3-4). The scheduled leaching rainfall in combination with frequent rainfall events after
the 8 and 12 WAP irrigation treatments negatively influenced tuber specific gravity.
Fertilizer main effect
The fertilizer source main effect demonstrated the effectiveness of the CRF in
potato production. Total and marketable tuber yields for plants in the CRF fertilizer
treatments were 8 and 10 % higher, respectively, compared with plants in the
conventional AN treatment for the 2004 production season (Table 3-2). The sidedress
main effect treatment did not significantly influence total and marketable tuber yields nor
tuber size and specific gravity (Table 3-2).
Main effect interactions
The three-way interaction between irrigation date, fertilizer source, and side dress
application main effects was significant for total and marketable tuber yields. The three-
way interaction term was calculated using LSMeans with the slice option (irrigation
treatment*side) (SAS 2004). This option enabled the comparison of the fertilizer source
with or without the extra sidedress treatment among each of the irrigation date treatments
Plants in the CRF - 2 WAP irrigation date treatment with the 34 kg N ha-1 sidedress
application had significantly higher marketable tuber yields (28%) compared with plants
in the AN fertilizer plots with the same sidedress amount (Table 3-3). Lower yield from
plants in the AN fertilizer--extra sidedress application plots may be explained by a large

62
amount of AN leached from the plot (Table 3-9) at the 2 WAP irrigation date. Potato
plants were just starting to emerge and the root system of the plant was not large enough
to utilize the applied fertilizer. The CRF plots did not leach as much nitrogen (data to
follow). Therefore, the sidedress nitrogen added to the overall nitrogen load instead of
replacing lost nitrogen as in the AN plots. All other irrigation treatments with or without
the extra sidedress were not significantly different among each irrigation treatment.
Tuber Yield for 2005
Irrigation date main effect
Irrigation date main effect significantly influenced total and marketable tuber yields
during the 2005 season. Plants in the 12 WAP irrigation date treatment had the lowest
marketable yield followed by plants in irrigation treatments 4 and 8 WAP plots (Table 3-
2). The leaching rainfall event that occurred at the scheduled 4 WAP irrigation date
treatment, negatively affected marketable tuber yields, since tubers are usually initiated at
this time (Figure 3-12). Plants in the 8 and 12 WAP irrigation treatments also produced
the lowest percentage of tubers in the size class range A2 to A3 compared with the 0
WAP treatment (Table 3-4). The additional plant stress (too much water) in plants in
irrigation treatments 4, 8 and 12 WAP resulted in an average decline of marketable tubers
weight by 18% compared with the 0 WAP irrigation date treatment.
Specific gravities for tubers from plants in the 4 and 12 WAP irrigation treatments
(1.080) were significantly lower than in tubers from plants in the 0 WAP irrigation date
treatment (1.082). A leaching rainfall event occurred within 7 to 10 days of the 4 and 12
WAP scheduled leaching irrigation events (Figure 3-13). As in 2004, the additional
leaching irrigation events in conjunction with the wetter weather conditions later in the
season reduced tuber specific gravity.

63
Fertilizer main effect
Fertilizer main effect demonstrated the effectiveness of CRF in potato production
in 2005. Plants in the CRF treatment produced 10.0 and 13.0% more total and
marketable tuber yields than plants in the standard ammonium nitrate treatment (Table 3-
2). A 16% increase in the percent of tubers in size class range A2 to A3 was also
observed for the CRF treatments compared with the AN fertilizer treatment in 2005
(Table 3-4).
Specific gravity was also influenced by the fertilizer main effect treatments.
Tubers from plants in the AN fertilizer treatment had significantly higher specific gravity,
1.079 compared with tubers from plants in the CRF fertilizer treatment, 1.077 (Table 3-
2).
Sidedress main effect
The sidedress main effect did not significantly influence total and marketable tuber
yield, specific gravity or size class distribution (Table 3-2 and 3.4).
Main effect interactions
The three-way interaction between irrigation date, fertilizer source and side dress
application main effect was significant for the total and marketable tuber yields in 2005.
In 2005, plants in the CRF - additional 34 kg·N ha-1 treatment had higher total and
marketable tuber yields, 28 and 26%, respectively compared with yield from plants in the
AN - additional 34 kg N ha-1 (Table 3-3) in the 2 WAP irrigation date treatment. This is
a similar result to 2004. Nitrogen in the CRF is protected early in the season compared
with AN. The sidedress N application adds positively to the CRF treatment but does not
make up for that which is leached in the AN treatment. As the season progressed, the

64
ability for the sidedress N to add positively to yield decreased. The extra side dress
application should be examined further.
Tuber External Quality for 2004
Irrigation date main effect
Irrigation treatment main effect had limited influence on external tuber quality such
as green, growth cracks, misshapes, and total culls. Green tubers were reduced in the 8
and 12 WAP irrigation treatments in 2004 (Table 3-5). This is because the irrigation
treatment plots were middle busted and hilled later in the season compared with the 0
WAP irrigation date plots resulting in better soil coverage of the tubers.
Fertilizer main effect
Fertilizer main effect did not significantly influence external tuber quality in 2004.
Sidedress main effect
Sidedress main effect had no influence on external tuber quality. There were no
interaction effects for external tuber defects for the 2004 production season.
Tuber External Quality for 2005
Irrigation date main effect
Irrigation date main effect significantly influenced all external tuber defects in
2005. The 12 WAP irrigation date in 2005 resulted in significantly higher percentages of
green, rotten and total culled tubers compared with the 0 WAP irrigation date (Table 3-5).
Late in the season, the 12 WAP irrigation date washed soil from the potato row exposing
tubers and resulting in green tubers. The combination of late season irrigation and heat
resulted in a high number of rots in the 12 WAP irrigation date. Tubers in the 12 WAP
irrigation date had significantly higher total culls 16.6% compared with the 0, 2, 4 and 8
WAP irrigation treatments at 4.8, 5.9, 7.5 and 7.5%, respectively (Table 3-5).

65
Fertilizer main effect
Fertilizer main effect significantly influenced external tuber defects in 2005. Plants
in CRF plots had a higher percentage of tuber rots compared with plants in the AN
fertilizer plots (3.4 and 2.7 % respectively; Table 3-5). The additional water applied at
the 12 WAP irrigation date combined with a leaching rainfall event 7 to 10 days prior to
harvest (Figure 3-13) and warmer temperatures negatively impacted tuber quality late in
the season.
Sidedress main effect
Sidedress main effect did not significantly influence tuber external quality. There
were no interaction effects for external tuber defects for the 2005 production season
(Table 3-5).
Tuber Internal Quality for 2004
Irrigation date main effect
Internal defects include physiological disorders which are hollow heart (HH),
internal heat necrosis (IHN) and brown center (BC). Disease induced disorders include
corky ring spot (CRS) and brown rot (BR).
BC and HH occur when sudden growing conditions change during the growing
season. This occurs when the potato plant recovers too quickly after an environmental or
nutritional stress during the growing season. As the tubers start to grow and expand the
pith tissue in the center of the tuber turns necrotic or can split open leaving a void in the
center of the potato. IHN is characterized by necrotic areas mostly in and around the
vascular ring usually coalescing and radiating to the center (pith) at the bud (apical) end
of the tuber and not the stem end. IHN is thought to occur late in the growing season due
to elevated temperatures and hot dry weather conditions, but may be initiated earlier in

66
the growing season as discussed in chapter 2. BC, HH, nor IHN affects the potato
nutritionally, but can negatively impact the chip processing potatoes.
CRS is a viral disease (tobacco rattle virus; TRV) transmitted by the stubby-root
nematode (Paratrichodorus minor). As the nematode feeds on the tuber the virus
transmitted causes concentric brown necrotic arcs in the tuber flesh. Brown rot also
known as bacterial wilt is caused by a soil borne pathogen (Ralstonia solanacearum).
The pathogen infects the potato roots through wounds and at emergence of lateral roots.
In this study, both percent affected and severity were calculated for IHN. Severity is
based upon a score on a scale of one to six. A score of one to four indicates that 0 to 25%
of all four quarters had the disorder. A score of five or six indicated that all quarters had
the disorder and up to 75 to 100% of all quarters were covered, respectively.
Irrigation date main effect treatments significantly influenced the development of
internal heat necrosis in tubers (IHN) in 2004. IHN appears to be initiated by early
season plant stress (too much water and poor nutrition) and is exacerbated by increased
temperatures later in the season as discussed in chapter 2. Plants in the 8 and 12 WAP
irrigation treatments produced tubers with significantly lower percentages of IHN, 3.3
and 4.3% of total tuber yield, respectively, compared with the 2WAP irrigation date at
16.3%. The 2 WAP irrigation event occurred at emergence and was followed by another
natural leaching rainfall event that occurred approximately 2 weeks later around tuber
initiation. This corresponded to approximately 200 to 400 GDD, respectively. This is
supported by the findings in chapter 2. The plots with the highest incidence of tubers
with IHN experienced a leaching rainfall event between 200 and 400 GDD. Plant stress
(too much water) in conjunction with a nutritional loss (nutrient leaching) early in the

67
season, between 200 and 400 GDD, may predispose the tubers to IHN. IHN severity was
highest as well in tubers from the 2 WAP irrigation treatment at 2.3. IHN severity in
tubers in the 2 WAP irrigation treatment was significantly different from levels in tubers
at 8 and 12 WAP (1.3 and 1.7), respectively, but the same as 0 and 4 WAP irrigation
treatments (Table 3-6).
The natural rainfall event described above that was devastating to plants in the 2
WAP irrigation treatment occurred at the 4 WAP irrigation date. Therefore, the irrigation
treatment was not applied at 4 WAP. Interestingly, the percentages of tubers with IHN
and their IHN severity were similar in the 0 WAP and 4 WAP irrigation treatments.
Therefore, this provides evidence that the 2 WAP irrigation event “stressed” (too much
water) plants causing the increase in the percentage of tubers with IHN and the severity
of IHN.
Although this early “plant stress” at 2 WAP was necessary for the development of
IHN, it may have only been part of the necessary events for the development of IHN by
the end of the season. In other words, creating potato plant stress by excessive irrigation
and the resulting reduced nutrition early in the season (emergence to tuber initiation) may
predispose the developing tubers to the occurrence of IHN. However, a late season stress
may be necessary to exacerbate the symptoms.
Fertilizer main effect
Fertilizer main effect significantly influenced the incidence of tubers with IHN.
CRF treatment had a significantly higher incidence of tubers with IHN compared with the
AN fertilizer treatment, 11.0 and 5.6% of total tuber yield, respectively. IHN severity
was not significantly different among fertilizer treatments (Table 3-6). The higher
incidence of IHN may be caused by the time needed for the CRF treatments to ‘recharge’

68
the nutrient levels in the soil after a leaching event. CRF with a faster release rate will
recharge sooner than one that has a slower release rate. A slow recharge rate would
result in sub-optimal soil nutrient conditions resulting in plant nutrient stress. Studies
have related IHN development in tubers to nitrogen stress as reported by (Sterrett and
Henninger, 1997; Sterrett and Henninger, 1991 and Clough, 1994).
Sidedress main effect
Interestingly, the sidedress main effect did not significantly reduce the occurrence
of tubers with IHN in 2004. Tubers with IHN and the IHN severity rating for the CRF
treatment was 9.8% and 1.9 respectively compared with the AN fertilizer treatment at
7.1% and 1.8, respectively. If nutrient stress does relate to IHN, then additional nitrogen
should reduce the occurrence and severity of IHN. Three items relating to the application
of additional nitrogen in this study may have prevented the optimal use of the sidedress
application. First, the application method applied a “dry” soluble fertilizer to the row
shoulders. However, this application method places the fertilizer in the dry area of the
bed above the capillary zone of the seepage irrigation and where few potato roots are
located (Munoz, 2004). This means that rainfall is necessary to push the fertilizer into
the root zone of the crop. If the rainfall is too heavy, fertilizer will move in surface water
runoff into the drainage canals.
Secondly, in order for fertilizer to be used by the plant, it needs to be available
prior to full flower (30 to 50 DAP). Certainly, the 8 and 12 WAP application treatments
are well past full flower and not expected to be beneficial to the crop. And as noted, the
0, 2, and 4 WAP sidedress applications could only be beneficial if natural rainfall pushed
the fertilizer into the row and not off the row in surface water movement. The leaching

69
rainfall event that occurred at 4 WAP washed the soil away from the hill exposing the
potato roots as well as washing the fertilizer away from the hill and into the alley.
Lastly, the BMP recommendation of 34 kg N ha-1 may not be enough N to make a
difference in yield or quality. The functionality of the application is related to placement
and rate. For instance, if it were placed properly, less N would be needed to impact
quality and/or yield. However, this study did not examine rate; therefore, a conclusion on
the influence of rate and placement on the effectiveness of the sidedress application can
only be presumed. There were no significant main effect interactions in 2004 (Table 3-
6).
Tuber Internal Quality for 2005
Irrigation date main effect
Irrigation date main effect treatments did not significantly influence the internal
tuber quality in 2005. Occurrence of IHN in tubers for the 2005 season was 71% higher
compared with the 2004 production season (Table 3-6). There was no significant
differences among the irrigation date treatments for the incidence or severity of tubers
with IHN. Tubers with IHN ranged from a high of 35.5% in the 2 WAP irrigation date
treatment to a low of 24.9 in the 0 WAP irrigation treatment. Plants in the 2 WAP
irrigation treatment received water/nutrient stress early in the season with the staged
leaching irrigation event followed by an additional leaching rainfall event near 4 WAP
(Figure 3-13); (Table 3-6). IHN severity among irrigation treatments was not
significantly different. IHN severity rating ranged from 3.4 in the 2 WAP irrigation date
treatment down to 3.0 in the 12 WAP irrigation date treatment.

70
Fertilizer source main effect
Fertilizer source main effect significantly influenced the development of tubers
with IHN. The incidence of IHN was 24% higher in tubers in the CRF treatments
compared with tubers in the AN fertilizer treatment (Table 3-6). IHN severity was not
significantly different between the CRF and AN treatment at 3.3 and 3.1, respectively.
Although CRF had significantly more tubers with IHN, the severity rating was similar.
As in 2004, this was most likely caused by the CRF treatments to ‘recharge’ the nutrient
levels in the soil that is related to CRF type and release rate.
CRF treatments had significantly higher incidences of tubers with IHN in 2004 and
2005 compared with the AN fertilizer treatments that contradicts the results reported by
Hutchinson, 2005 and Pack, 2004. The difference in results may be due to the timing of
the leaching event and its relation to the growth stage of the potato plant.
In 2004, the highest incidence of tubers with IHN was in the 2 WAP irrigation
treatment while the lowest incidence of tubers with IHN were the late season irrigation
events, 8 and 12 WAP. Similarly, in 2005, the 2 WAP irrigation treatment also had the
highest incidence of tubers with IHN compared with the other irrigation treatments.
Although leaching rainfall events occurred during both seasons, the time when leaching
rainfall events occured in conjunction with the growth stage of the potato crop may
determine when IHN in tubers is initiated due to nutritional and environmental stressors.
Sidedress main effect
Sidedress main effect treatment did not significantly influence the occurrence of
tubers exhibiting IHN. The IHN severity rating for the sidedress treatments were
identical at 3.2. Quality (particularly IHN) did not improve with the BMP recommended

71
side dress application. The BMP should be reexamined to make sure the side dress
methodology is beneficial to potato crop in the production system (Table 3-6).
Nitrate Nitrogen Concentration in Wells for 2004
Irrigation main effect
Irrigation treatment main effect significantly influenced NO3-N concentrations in
well water samples in 2004. During the 2004 production season, well water NO3-N
concentrations were highest at the 29 DAP sample date and decreased exponentially over
time. A leaching rainfall event occurred the night before that would explain the high
NO3-N values.
The 4 WAP irrigation treatment had the highest well NO3-N value at the 29 DAP
sample date at 30.2 mg L-1. All other irrigation treatments had well NO3-N
concentrations between 17.1 and 29.5 mg L-1. Well water NO3-N concentrations at 72
DAP were significantly higher at the 8 WAP irrigation date compared with the 0 and 2
WAP irrigation date. All sample dates except at 29 DAP had well NO3-N levels ≤ 8.2
mg L-1 (Table 3-7). The relatively low NO3-N concentrations in the observation wells
may be due to a couple of factors. First, most of the nutrients were most likely moved
out of the bed due to surface water flow. Second, the amount of water applied at the
leaching events may not have been enough and/or had been diluted by the time the
nutrients reached the depth of the observation wells as it moved down through the soil
profile.
Fertilizer main effect
The fertilizer main effect significantly influenced well water NO3-N concentrations
in 2004. The 89 DAP well water NO3-N concentrations were significantly higher in the
CRF compared with the AN fertilizer treatment, 0.5 and 0.2 mg L-1, respectively. This

72
may indicate that the CRF was still releasing N late in the season. Similarly to the
irrigation treatments, well water NO3-N concentrations were highest at the 29 DAP
sample date and decreased exponentially over time.
Sidedress main effect
The sidedress main effect did not significantly influence well water NO3-N
concentrations at any of the sampling dates. There were no significant interaction effects
for the 2004 production season (Table 3-7).
Nitrate Nitrogen Concentration in Wells for 2005
Irrigation main effect
The irrigation treatment main effects did not significantly influence well water
NO3-N concentrations in 2005. At the 17 DAP sample date, well water NO3-N
concentration ranged from a high of 7.4 mg L-1 in the 2 WAP irrigation treatment,
followed by 12, 4, 8 and 0 WAP irrigation treatments at 7.3, 6.4, 5.2 and 4.1 mg L-1,
respectively. This result was due to the 2 WAP irrigation treatment that was applied 24 h
prior to the 17 DAP sample acquisition. Well water NO3-N concentrations increased up
to 45 DAP. Since no irrigation treatment was applied before this sample date, the
increase in NO3-N concentration in the wells was the result of a 2.8 cm rainfall event at
44 DAP. Well water NO3-N concentrations ranged from a high of 3.4 mg L-1in the 8
WAP irrigation date treatment to a low of 1.4 mg L-1 in the 0 WAP irrigation treatment at
the 59 DAP sample event. This result was due to the 8 WAP irrigation treatment applied
24 h previous to the 59 DAP well sample (Table 3-7). This shows that leaching events do
have an impact on the movement of nutrients down through the soil profile into the water
table.

73
Fertilizer main effect
Fertilizer main effect did not significantly influence well NO3-N concentrations in
2005. CRF treatments consistently had lower NO3-N levels throughout each of the
sampling dates compared with the AN fertilizer treatments. Overall sample dates, the
average reduction of well NO3-N in the CRF treatments was approximately 19% lower
compared with the AN fertilizer treatment.
Sidedress main effect
The sidedress main effect did not significantly influence well NO3-N
concentrations in 2005. The 0 and 34 kg N ha-1 sidedress treatments were similar
throughout all sample dates (Table 3-7).
A decreasing trend in lysimeter NO3-N concentration was noted after the 29 and 45
DAP sampling dates for 2004 and 2005, respectively. This may be due to the
combination of the scheduled leaching irrigation events and the leaching rainfall events
during the latter part of the season in 2005 (Figure 3-13).
Nitrate Nitrogen Concentration in Lysimeters for 2004
Irrigation main effect
Irrigation date main effects significantly influenced lysimeter NO3-N
concentrations in 2004. The highest values observed during the 2004 production season
were at the 30 DAP sampling event with an average value of 216.4 mg L-1. The flush of
NO3-N was most likely due to the leaching rainfall received the previous night (11 cm)
(29 DAP). At the 45 DAP sample date the 8 WAP irrigation treatment had the highest
lysimeter NO3-N concentration at 41.9 mg L-1 followed by irrigation treatments, 12, 2, 0
and 4 WAP with NO3-N values of 34.4, 26.1, 25.2, and 22.1 mg L-1, respectively. A
sharp decline in lysimeter NO3-N concentrations were observed at the 90 DAP sample

74
date in all irrigation treatments with the exception of the 12 WAP irrigation treatment had
lysimeters NO3-N concentrations below 1.1 mg L-1. The 12 WAP irrigation date at the
90 DAP sample date had significantly higher lysimeter NO3-N concentration, 9.3 mg L-1
that was most likely due to the 12 WAP irrigation treatment applied 24 h before the 90
DAP sample acquisition (Table 3-8).
Fertilizer main effect
Fertilizer main effect did not significantly influence lysimeter NO3-N
concentrations. CRF treatment consistently had lower NO3-N nutrient concentrations
throughout all sampling dates compared with the AN fertilizer treatment for the 2004
production season. CRF treatments had an average 30% lower lysimeter NO3-N
concentration compared with AN fertilizer treatment over all lysimeter sampling dates in
2004 (Table 3-8). A decreasing trend was noted over the season until the last sample date
(90 DAP) when lysimeter NO3-N concentrations increased. This may be due to the flush
of nutrients from the potato crop late in the season due to the lack of nutrient uptake by
the senesced plants.
Sidedress main effect
Sidedress main effect did not significantly influence lysimeters NO3-N
concentrations. Similarly to the fertilizer main effects, a downward trend was also noted
over the season until the last sample date 90 DAP when lysimeter NO3-N concentrations
increased. There were no other significant interaction effects for 2004 (Table 3-8).
Nitrate Nitrogen Concentration in Lysimeters for 2005
Irrigation main effect
Irrigation date main effect significantly influenced NO3-N concentrations in
lysimeter water samples in treatment plots in 2005. Although not significant, at the 18
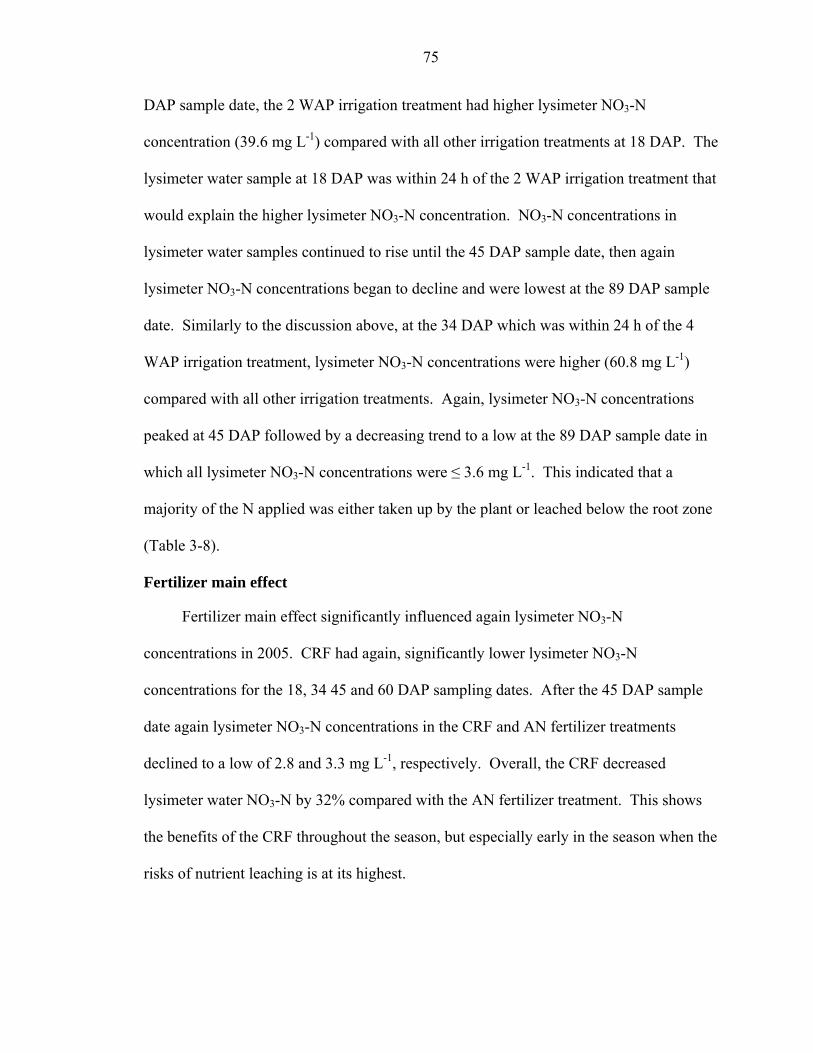
75
DAP sample date, the 2 WAP irrigation treatment had higher lysimeter NO3-N
concentration (39.6 mg L-1) compared with all other irrigation treatments at 18 DAP. The
lysimeter water sample at 18 DAP was within 24 h of the 2 WAP irrigation treatment that
would explain the higher lysimeter NO3-N concentration. NO3-N concentrations in
lysimeter water samples continued to rise until the 45 DAP sample date, then again
lysimeter NO3-N concentrations began to decline and were lowest at the 89 DAP sample
date. Similarly to the discussion above, at the 34 DAP which was within 24 h of the 4
WAP irrigation treatment, lysimeter NO3-N concentrations were higher (60.8 mg L-1)
compared with all other irrigation treatments. Again, lysimeter NO3-N concentrations
peaked at 45 DAP followed by a decreasing trend to a low at the 89 DAP sample date in
which all lysimeter NO3-N concentrations were ≤ 3.6 mg L-1. This indicated that a
majority of the N applied was either taken up by the plant or leached below the root zone
(Table 3-8).
Fertilizer main effect
Fertilizer main effect significantly influenced again lysimeter NO3-N
concentrations in 2005. CRF had again, significantly lower lysimeter NO3-N
concentrations for the 18, 34 45 and 60 DAP sampling dates. After the 45 DAP sample
date again lysimeter NO3-N concentrations in the CRF and AN fertilizer treatments
declined to a low of 2.8 and 3.3 mg L-1, respectively. Overall, the CRF decreased
lysimeter water NO3-N by 32% compared with the AN fertilizer treatment. This shows
the benefits of the CRF throughout the season, but especially early in the season when the
risks of nutrient leaching is at its highest.

76
Sidedress main effect
Sidedress main effect did not significantly influence again, lysimeter NO3-N
concentrations for any of the lysimeter sample dates in 2005. There were no significant
main effects interactions in 2005 (Table 3-8). Therefore, this is another argument that the
placement of a dry soluble fertilizer on the shoulder of the row is not the proper
application method. The production BMPs for potato production may need to be revised
to create an effective sidedress treatment after a leaching rain.
Overall, the lysimeter NO3-N nutrient concentrations in 2004 and 2005 again for
CRF treatments was 29 and 25% less, respectively, compared with the AN fertilizer
treatments. Theoretically, if growers in the TCAA used a CRF, based upon this research,
reduction of N into the St. Johns River could be 56,000 kg N per year.
Nutrient Load Concentration in Surface Water
Water volume: 2004
The volume of water flow from the field varied with irrigation treatments in 2004.
Surface water flow during the 2 WAP irrigation treatment was highest peaking between
300 and 350 L compared with the 8 and 12 WAP irrigation treatments. High surface
flow from the plot was most likely due to the wetter weather conditions prior to the
irrigation event as well as the lack of crop cover since potato plants were just starting to
emerge at 2 WAP. Additionally, at this stage of growth and development of the potato
plant, high surface water flow from the plots would have carried fertilizer out of the bed
into the drainage canals creating a nutrient and water stress early in the season. This can
be seen due to the higher incidence of tubers with IHN in the 2 WAP irrigation treatment
and would also support the theory that IHN may be initiated early in the season due to a
combination of plant stress caused by too much water and too low nutritent concentration
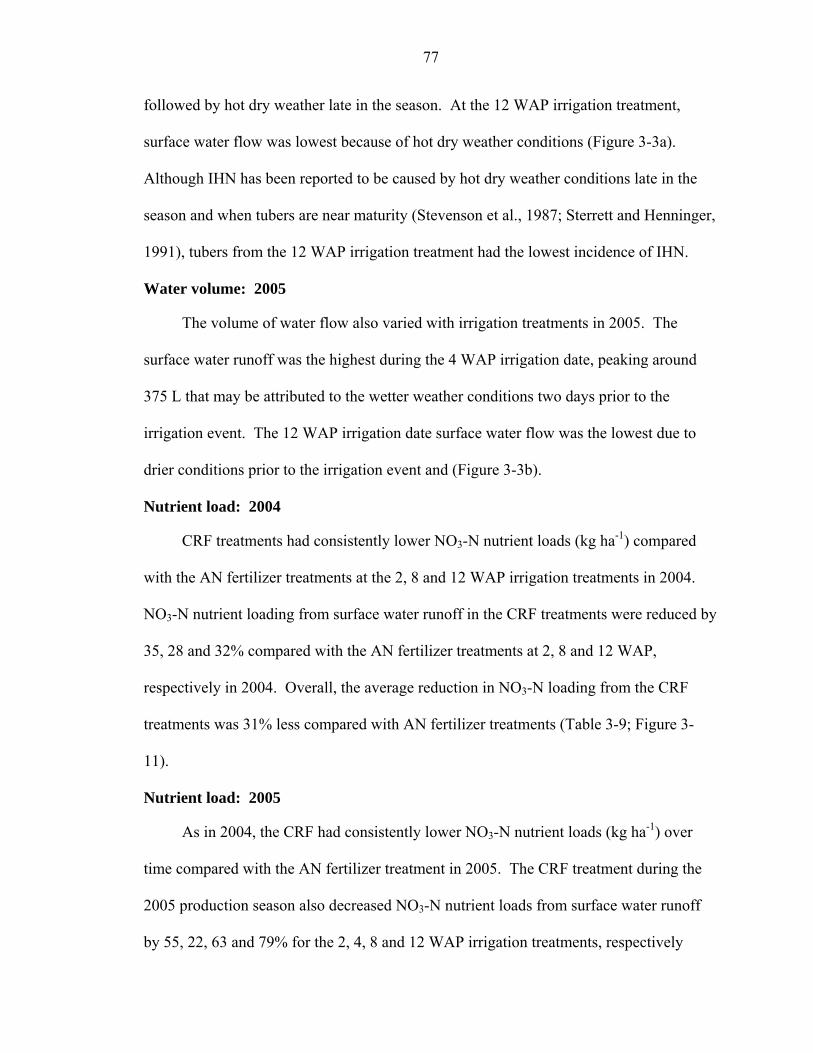
77
followed by hot dry weather late in the season. At the 12 WAP irrigation treatment,
surface water flow was lowest because of hot dry weather conditions (Figure 3-3a).
Although IHN has been reported to be caused by hot dry weather conditions late in the
season and when tubers are near maturity (Stevenson et al., 1987; Sterrett and Henninger,
1991), tubers from the 12 WAP irrigation treatment had the lowest incidence of IHN.
Water volume: 2005
The volume of water flow also varied with irrigation treatments in 2005. The
surface water runoff was the highest during the 4 WAP irrigation date, peaking around
375 L that may be attributed to the wetter weather conditions two days prior to the
irrigation event. The 12 WAP irrigation date surface water flow was the lowest due to
drier conditions prior to the irrigation event and (Figure 3-3b).
Nutrient load: 2004
CRF treatments had consistently lower NO3-N nutrient loads (kg ha-1) compared
with the AN fertilizer treatments at the 2, 8 and 12 WAP irrigation treatments in 2004.
NO3-N nutrient loading from surface water runoff in the CRF treatments were reduced by
35, 28 and 32% compared with the AN fertilizer treatments at 2, 8 and 12 WAP,
respectively in 2004. Overall, the average reduction in NO3-N loading from the CRF
treatments was 31% less compared with AN fertilizer treatments (Table 3-9; Figure 3-
11).
Nutrient load: 2005
As in 2004, the CRF had consistently lower NO3-N nutrient loads (kg ha-1) over
time compared with the AN fertilizer treatment in 2005. The CRF treatment during the
2005 production season also decreased NO3-N nutrient loads from surface water runoff
by 55, 22, 63 and 79% for the 2, 4, 8 and 12 WAP irrigation treatments, respectively

78
(Table 3-10; Figure 3-12). Nutrient runoff over time in each leaching irrigation event in
2004 and 2005 was variable within replications, but overall, the CRF treatment had less
NO3-N runoff (Figure 3.4-3.6; Appendix E-24 pg 189) and (Figure 3-7-3.10; Appendix
E-25 pg. 190).
Overall the average reduction in NO3-N nutrient loading from the CRF treatment
was 54% compared with AN fertilizer treatment (Table 3-10). This data has shown the
benefits using a CRF that can significantly reduce the amount of nutrient loading into the
watersheds and reduce the negative impacts that nutrient loading would have on sensitive
environmental areas in the TCAA. Based upon this research, if growers in the TCAA
used a CRF in their production practices, N into the St. Johns River could be reduced by
56,000 kg per year, a substantial savings of pollutant into the river. This was determined
by the average NO3-N load (kg ha-1) for AN and CRF treatments in 2004 and 2005 (Table
3.9 and 3.10) multiplied by the total potato production area in the TCAA (8,000)
hectares.
Growing Degree Days
Potato plant emergence in 2004 and 2005 occurred at 18 and 19 DAP, respectively.
The accumulated GDD to reach emergence in 2004 and 2005 was 225 and 228,
respectively. Full flower in 2004 and 2005 occurred 53 and 49 DAP, respectively that
corresponded to 807 and 798, respectively (Table 3-11). The accumulated GDD to reach
emergence and full flower are in agreement with the findings discussed in chapter two.
The highest incidence of tubers with IHN in 2004 and 2005 occurred in the 2 WAP
irrigation treatment. The 2 WAP irrigation event occurred at 193 accumulated GDD. As
in chapter two, the higher incidence of tubers with IHN experienced a leaching event
between 200 and 400 accumulated GDD for both 2004 and 2005.

79
Conclusions
This research has demonstrated the effectiveness of a CRF in potato production
compared with a soluble N fertilizer. Marketable yields in the CRF treatments were an
average of 12% higher compared with the AN fertilizer treatment. Additionally, 13%
less N fertilizer was applied in the CRF treatment compared with the AN fertilizer
treatment.
Overall, the sidedress main effect of the additional 34 kg N ha-1 after a leaching
rainfall event did not significantly influence total or marketable yields in 2004 or 2005.
Although, the three-way interaction between irrigation date, fertilizer source and side
dress application main effect was significant for the total and marketable tuber yields in
2004 and 2005 in the CRF treatment at the 2 WAP irrigation treatment date. Internal and
external quality were unaffected with the additional N application after a leaching event,
therefore, the BMP rate was not adequate to prevent IHN.
The CRF treatments had a significantly higher incidence of tubers with IHN
compared with the AN fertilizer treatment at 22.3 and 15.6%, respectively. The CRF
treatment had a 31% higher incidence of tubers with IHN compared with the AN
fertilizer treatment. This also supports the hypothesis that the CRF needed to have a
faster release rate earlier in the season.
NO3-N loading from surface water runoff from potato production was decreased by
an average of 43% with the use of the CRF compared with the AN fertilizer treatment.
Therefore, if growers in the TCAA used a CRF in potato production, rather than a soluble
N fertilizer at the BMP rate of 224 kg N ha-1, NO3-N loads into the St. Johns River
watershed could be reduced by 56,000 kg N per year.

80
Table 3-1. Irrigation treatment (WAP), fertilizer treatment, fertilizer source and additional sidedress application (DAP) for 2004 and 2005 production seasons
Irrigation treatment
WAPz
Fertilizer treatment
Fertilizer sourcey
Irrigation date Timing DAPx
Additional N side dressw kg N ha-1
Additional sidedress DAP
2004 2005 2004 2005 0 1 ANy 0 0 0 - - 0 2 AN 0 0 34 43 43 0 3 CRF 0 0 0 - - 0 4 CRF 0 0 34 43 43 2 1 AN 17 16 0 - - 2 2 AN 17 16 34 43 43 2 3 CRF 17 16 0 - - 2 4 CRF 17 16 34 43 43 4 1 AN 28 30 0 - - 4 2 AN 28 30 34 43 43 4 3 CRF 28 30 0 - - 4 4 CRF 28 30 34 43 43 8 1 AN 59 58 0 - - 8 2 AN 59 58 34 67 64 8 3 CRF 59 58 0 - - 8 4 CRF 59 58 34 67 64 12 1 AN 91 88 0 - - 12 2 AN 91 88 34 N/A N/A 12 3 CRF 91 88 0 - - 12 4 CRF 91 88 34 N/A N/A
zWAP Weeks after planting yAN Ammonium nitrate; CRF Controlled release fertilizer xDAP Days after planting wAdditional sidedress applied as 30-0-0.

81
E -12
D - 8
C - 4
B - 2
A - No irrigation
Irrigation treatment(WAP)
4 -CRF 30-0-0
3 - CRF No additional N
2 - AN 30-0-0
1 - AN No additional N
N source and additional N treatment
Rep 2Rep 1 Rep 3 Rep 4
N
2 1 4 3
A
3 4 1 2
A
2 1 3 4
A
2 1 4 3
A
3 4 1 2
B
1 2 3 4
B
1 2 3 4
B
4 3 1 2
B
4 3 2 1
C
2 1 4 3
C
3 4 2 1
C
1 2 3 4
C
1 2 3 4
D
4 3 2 1
D
4 3 1 2
D
3 4 1 2
D
3 4 1 2
E
4 3 2 1
E
1 2 3 4
E
2 1 4 3
E
Figure 3-2. Plot map leaching irrigation project

82
Table 3-2. Total and marketable tuber yields and specific gravity for ‘Atlantic’ potato under varying staged leaching irrigation treatments and fertilizer source in Hastings, FL in 2004 and 2005
Total yield
Marketable yield
Specific gravity Total
yield Marketable yield
Specific gravity
2004 2005 Main Effect t ha-1 t ha-1
Date (D) (WAP)x 0 WAP 29.5 abw 25.0 ab 1.079a 28.2 ay 24.9 a 1.082a 2 WAP 28.5 ab 24.9 ab 1.079a 26.3 ab 22.9 ab 1.081b 4 WAP 30.3 a 25.7 a 1.079a 24.3 b 20.5 cd 1.080b 8 WAP 26.7 b 21.9 b 1.077b 26.6 ab 22.0 bc 1.082a 12 WAP 27.1 b 22.7 ab 1.077b 25.1 ab 18.8 d 1.080b Fertilizer (F)
CRFv 29.7 a 25.2 a 1.077b 27.4 a 23.2 a 1.081 AN 27.3 b 22.9 b 1.079a 24.8 b 20.4 b 1.081 Sidedress (S)
0.0 (kg N ha-1) 29.1 24.6 1.078 25.7 21.9 1.080 34.0 (kg N ha-1) 28.1 23.6 1.078 26.3 21.7 1.081

83
Table 3-2. Continued
Total yield
Marketable yield
Specific gravity Total
yield Marketable yield
Specific gravity
2004 2005 t ha-1 t ha-1
Interaction effectsu D*F ns ns * ns * ns D*S ns ns ns ns ns ns F*S ns ns ns ns ns ns D*S*F * * ns * * ns zMarketable Yield: Sum of size classes A1 to A3. ySize classes: B = 3.8 to 4.4 cm, A1 = 4.4 to 6.4 cm, A2 = 6.4 to 8.3 cm, A3 = 8.3 to 10.2 cm. Size Distribution by Class: Class (wt)/(Total Yield (wt) – culls (wt))
xWAP = Weeks after planting. wMeans followed by a different letter are significant at the p≤ 0.05 using Tukeys studentized range test. vCRF = Controlled release fertilizer, AN = Ammonium nitrate. uns, *, **, *** nonsignificant or significant at p≤ 0.05, 0.01, 0.001, respectively using ANOVA.

84
Table 3-3. Three-way interaction between irrigation date, fertilizer source and side dress application main effects for total and marketable tuber yields and specific gravity for ‘Atlantic’ potato under varying staged leaching irrigation treatments and fertilizer source in Hastings, FL in 2004 and 2005
Total yield
Marketable yield
Specific gravity
Total yield
Marketable yield
Specific gravity
2004 2005
Trmt*fert*side t ha-1 t ha-1 Slicedz by trmt*side
A AN 0 25.5 b 20.3 b 1.082 a 29.3 25.2 1.083 A CRF 0 31.2 a 27.3 a 1.078 b 28.3 25.7 1.083 A AN 30 32.2 27.8 1.079 27.0 23.9 1.081 A CRF 30 29.2 24.3 1.078 28.5 25.2 1.081 B AN 0 27.5 23.6 1.078 28.0 25.1 1.080 B CRF 0 28.6 24.4 1.080 26.7 22.8 1.080 B AN 30 24.8 b 21.7 b 1.079 21.5 b 18.9 b 1.081 B CRF 30 33.4 a 29.8 a 1.078 29.7 a 25.5 a 1.081 C AN 0 29.1 24.9 1.079 22.1 b 18.3 b 1.080 C CRF 0 33.0 28.5 1.078 28.4 a 25.0 a 1.079 C AN 30 28.6 23.5 1.080 21.3 b 17.2 b 1.081 C CRF 30 30.4 25.7 1.080 26.2 a 22.4 a 1.081 D AN 0 28.3 23.9 1.078 a 26.2 21.7 1.084 D CRF 0 25.2 19.7 1.075 b 27.3 23.0 1.082 D AN 30 26.0 21.1 1.079 a 26.4 21.6 1.082 D CRF 30 27.8 23.2 1.076 b 26.9 22.1 1.082 E AN 0 25.4 21.4 1.078 a 23.8 17.1 b 1.080 E CRF 0 28.6 24.2 1.076 b 26.5 20.9 a 1.081 zSliced trmt*fert - This option enabled the comparison of the fertilizer source with or without the extra sidedress treatment among each of the irrigation date treatments

85
Table 3-4. Size class distribution and range (%) production statistics for ‘Atlantic’potato under varying staged leaching irrigation treatments and fertilizer source in Hastings, FL in 2004 and 2005
Size Distribution by class (%)z
Size Class Range (%)
Size Distribution by class (%)z
Size Class Range (%)
B A1 A2 A3 A1 to A2
A2 to A3
B A1 A2 A3 A1 to A2
A2 to A3
Main effects 2004 2005
Date (D) (WAP)x
0 WAP 7.1 b 62.1 b 23.6a 1.3 87.1 a 25.0 a 6.0 b 48.6 b 32.5 a 11.2 ab 93.0 a 44.0 a 2 WAP 6.0 b 62.0 b 26.0a 0.9 88.9 a 26.8 a 6.0 b 46.6 b 31.6 ab 14.0 a 93.2 a 46.2 a 4 WAP 7.0 b 65.2 ab 20.8ab 0.8 87.1 a 21.7 ab 7.7 ab 52.1 ab 26.7 a-c 10.7 a-c 91.1 ab 38.5 ab 8 WAP 9.8 a 68.6 ab 14.1c 0.2 83.1 b 14.3 c 8.7 a 55.7 a 25.2 c 8.2 bc 89.9 b 34.1 b 12 WAP 7.8 ab 69.9 a 16.2bc 0.1 86.4a 16.4 bc 8.1 ab 56.7 a 25.8 bc 6.5 c 90.6 ab 33.2 b Fertilizer (F) CRFv 7.5 63.7 b 21.7 1.1 86.8 22.9 a 6.5b 49.5 b 29.4 12.5 a 92.4 a 42.5 a AN 7.5 67.4 a 18.5 0.2 86.2 18.8 b 8.1a 54.5 a 27.3 7.7 b 90.8 b 35.9 b Sidedress (S) 0.0 ( kg N ha-1) 7.4 64.1 21.9 0.5 86.7 22.5 7.1 51.2 28.5 11.0 91.5 40.0 34.0 ( kg N ha-1) 7.6 66.5 18.9 0.8 86.4 19.7 7.4 52.5 28.2 9.3 91.7 38.6

86
Table 3-4. Continued Size
Distribution by class (%)z Size Class Range (%)
Size Distribution by class (%)z
Size Class Range (%)
B A1 A2 A3 A1 to A2
A2 to A3
B A1 A2 A3 A1 to A2
A2 to A3
Interaction effectsu
2004 2005
D*F ns ns ns * ns ns * ns ns ns * ns D*S ns ns ns ns ns ns ns ns ns ns ns ns F*S ns ns ns ns ns ns ns ns ns ns ns ns D*S*F ns ns ns ns ns ns ns ns * ns ns ns zMarketable Yield: Sum of size classes A1 to A3. ySize classes: B = 3.8 to 4.4 cm, A1 = 4.4 to 6.4 cm, A2 = 6.4 to 8.3 cm, A3 = 8.3 to 10.2 cm. Size Distribution by Class: Class (wt)/(Total Yield (wt) – culls (wt))
xWAP = Weeks after planting. wMeans followed by a different letter are significant at the p≤ 0.05 using Tukeys studentized range test. vCRF = Controlled release fertilizer, AN = Ammonium nitrate. uns, *, **, *** nonsignificant or significant at p≤ 0.05, 0.01, 0.001, respectively using ANOVA.

87
Table 3-5. External tuber defects (%) of total yield for ‘Atlantic’ under varying staged leaching irrigation treatments, fertilizer source and additional sidedress in Hastings, FL in 2004 and 2005
External tuber defects (%) Sun
burned Growth crack
Mis-shaped
Rot Total cullz Sun
burned Growth crack
Mis-shaped
Rot Total cullz
Date (D) (WAP)x 2004 2005
0 WAP 0.7 0.0 0.2 1.6 3.0 2.7 by 0.0 b 0.0 b 1.1 b 4.8 b 2 WAP 0.4 0.0 0.1 1.3 2.2 2.7 b 0.0 ab 0.0 b 2.7 b 5.9 b 4 WAP 0.5 0.0 0.0 1.6 2.6 3.4 ab 0.3 a 0.8 ab 1.9 b 7.5 b 8 WAP 0.3 0.0 0.1 1.1 1.9 3.4 ab 0.1 ab 1.3 a 1.7 b 7.5 b 12 WAP 0.3 0.0 0.1 1.6 2.7 4.4 a 0.0 ab 0.3 ab 10.7 a 16.6 a Fertilizer (F) ANw 0.4 0.0 0.1 1.4 2.5 3.0 0.0 0.2 2.7 b 8.4 CRF 0.5 0.0 0.1 1.4 2.4 3.5 0.0 0.5 3.4 a 7.8 Sidedress (S) 0.0 (kg N ha-1) 0.4 0.0 0.1 1.6 2.6 3.3 0.0 0.3 3.9 9.0 34.0 (kg N ha-1) 0.5 0.0 0.1 1.2 2.2 3.2 0.0 0.4 1.9 6.7

88
Table 3-5. Continued External tuber defects (%) Sun
burned Growth crack
Mis-shaped
Rot Total cullz Sun
burned Growth crack
Mis-shaped
Rot Total cullz
Interaction effectsv 2004 2005
D*F ns ns ns ns ns ns ns ns ns ns D*S ns ns ns ns ns ns ns ns ns ns F*S ns ns ns ns ns ns ns ns ns ns D*S*F ns ns ns ns ns ns ns ns ns ns zTotal culls are the sum of growth cracks, misshaped, green, and rotten categories and are calculated as a percent of total yield. Categories may not appear additive due to rounding yMeans separated within columns using Tukey’s studentized range test at p ≤ 0.05. Means with no letters were not significantly different. xWAP = Weeks after planting. wAN = Ammonium nitrate CRF = Controlled release fertilizer vns, *, **, *** nonsignificant or significant at p≤ 0.05, 0.01, 0.001.

89
Table 3-6. Internal tuber defects (%) of total yield for ‘Atlantic’ under varying staged leaching irrigation treatments, fertilizer source and additional sidedress in Hastings, FL in 2004 and 2005
Internal tuber defects (%) HHz IHN IHN
severity CRS BCL HH IHN IHN severity CRS BCL
2004 2005
Date (D) (WAP)y
0 WAP 0.18 10.9 abx 2.2 a 0.5 0.3 0.0 24.9 3.1 0.0 0.0 2 WAP 0.38 16.7 a 2.3 a 0.1 0.7 0.0 35.5 3.4 0.0 0.0 4 WAP 0.00 8.8 ab 1.8 ab 0.1 0.4 0.0 30.0 3.1 0.0 0.3 8 WAP 0.19 3.3 b 1.3 b 0.0 0.0 0.0 30.9 3.2 0.0 0.5 12 WAP 0.19 4.3 b 1.7 b 0.0 0.1 0.0 26.6 3.0 0.0 0.0 Fertilizer (F) ANw 0.15 5.6 b 1.6 0.1 0.3 0.0 25.6 b 3.1 0.0 0.1 CRF 0.23 11.0 a 2.0 0.1 0.2 0.0 33.6 a 3.3 0.0 0.3 Sidedress (S) 0.0 (kg N ha-1) 0.19 7.1 1.8 0.2 b 0.2 0.0 30.0 3.2 0.0 0.1 34.0 (kg N ha-1) 0.19 9.8 1.9 0.0 a 0.3 0.0 28.8 3.2 0.0 0.4

90
Table 3-6. Continued Internal tuber defects (%) HHz IHN IHN-S CRS BCL HH IHN IHN-S CRS BCL Interaction effectsv 2004 2005
D*F ns ns ns ns ns ns * ns ns ns D*S ns ns ns ns ns ns * ns ns ns F*S ns ns ns ns ns ns ns ns ns ns D*S*F ns ns ns ns ns ns ns ns ns ns zHH – Hollow heart, IHN – Internal heat necrosis; IHN-S – internal heat necrosis severity; CRS – Corky ring spot; BCL- Brown center (light) yWAP = Weeks after planting. xMeans separated within columns using Tukey’s studentized range test at p ≤ 0.05. Means with no letters were not significantly different. wAN = Ammonium nitrate CRF = Controlled release fertilizer vns, *, **, *** nonsignificant or significant at p≤ 0.05, 0.01, 0.001, respectively using ANOVA.

91
Table 3-7. Well NO3-N concentration (mg L-1) under varying staged leaching irrigation treatments, fertilizer source and additional sidedress in Hastings, FL in 2004 and 2005
2004 (DAP) 2005 (DAP) Main Effects 29 44 64 72 89 17 33 45 59 73 89 Datey (D) 0 WAP 24.1 5.1 1.3 az 0.3 b 0.3 4.1 9.0 14.4 1.4 4.1 1.9 2 WAP 27.5 6.8 1.5 a 0.3 b 0.3 7.4 16.9 23.7 2.9 7.2 1.9 4 WAP 30.2 4.6 1.5 a 0.5 ab 0.5 6.4 13.2 25.4 2.6 6.3 2.0 8 WAP 17.1 4.4 1.4 a 0.7 a 0.4 5.2 12.9 18.5 3.4 7.4 2.4 12 WAP 29.5 8.2 0.9 b 0.4 ab 0.3 7.3 10.6 20.2 3.1 5.4 1.8 Fertilizerx (F) CRF 24.7 5.8 1.2 0.4 0.5 a 5.4 11.3 17.8 2.0 4.7 2.2 AN 25.7 5.5 1.4 0.4 0.2 b 6.5 13.3 22.6 3.4 7.5 1.8 Sidedress (S) 0.0 (kg N ha-1) - 6.0 1.2 0.4 0.3 - - 20.0 2.9 5.8 2.0 34.0 (kg N ha-1) - 5.0 1.5 0.4 0.4 - - 20.2 2.1 6.3 2.0

92
Table 3-7. Continued 2004 (DAP) 2005 (DAP) 29 44 64 72 89 17 33 45 59 73 89 Interaction effectsw
D*F ns ns ns ns ns ns ns ns ns ns ns D*S - ns ns ns ns - - ns ns ns ns F*S - ns ns ns ns - - ns ns ns ns D*S*F - ns ns ns ns - - ns ns ns ** zMeans followed by a different letter within columns are significant at the p≤ 0.05 using Tukey’s studentized range test. yWAP = weeks after planting. xCRF = controlled release fertilizer, AN = ammonium nitrate. wns, *, **, *** non-significant or significant at p≤ 0.05, 0.01, 0.001, respectively using ANOVA.

93
Table 3-8. Lysimeter NO3-N concentration (mg L-1) under varying staged leaching irrigation treatments, fertilizer source and additional sidedress in Hastings, FL in 2004 and 2005
2004 (DAP) 2005 (DAP) Main Effects 30 45 65 73 90 18 34 45 60 73 89 Datey (D) 0 WAP 242.4 25.2 0.8 0.3 0.4 bz 26.7 48.4 b 77.9 8.4 b 10.3 c 2.2
2 WAP 190.5 26.1 0.5 0.2 0.6 b 39.6 60.8 ab 93.4 24.8 a 27.4 ab 3.5
4 WAP - 22.1 1.0 0.3 0.6 b 29.2 64.1 a 87.4 27.7 a 18.4 bc 2.8
8 WAP - 41.9 1.1 0.2 0.9 b 26.1 51.4 ab 76.7 32.6 a 53.0 a 3.6
12 WAP - 34.4 0.7 0.2 9.3 a 32.4 55.0 ab 85.5 24.6 a 29.1 ab 3.3
-
Fertilizerx (F)
CRF 205.5 21.7 1.25 0.2 2.89 22.4 b 49.2 b 72.1 b 16.9 b 18.6 2.8
AN 224.7 38.4 1.69 0.3 4.34 42.8 a 62.9 a 97.0 a 27.5 a 31.1 3.3
Sidedress (S)
0.0 (kg N ha-1) - 21.6 1.50 0.6 5.17 - - 91.1 20.0 24.5 3.6
34.0 (kg N ha-1) - 32.4 1.45 0.3 1.00 - - 81.4 22.3 23.7 2.9

94
Table 3-8. Continued 2004 (DAP) 2005 (DAP) 30 45 65 73 90 18 34 45 60 73 89 Interaction effectsw
D*F ns ns * ns ns ns ns ns ns ns ns
D*S - ns ns ns ns - - ns ns ns ns
F*S - ns ns ns ns - - ns ns ns ns
D*S*F - ns ns ns ns - - ns ns ns ns zMeans followed by a different letter within columns are significantly different at the p≤ 0.05 using Tukey’s studentized range test. yWAP = weeks after planting. xCRF = controlled release fertilizer, AN = ammonium nitrate. wns, *, **, *** non-significant or significant at p≤ 0.05, 0.01, 0.001, respectively using ANOVA.
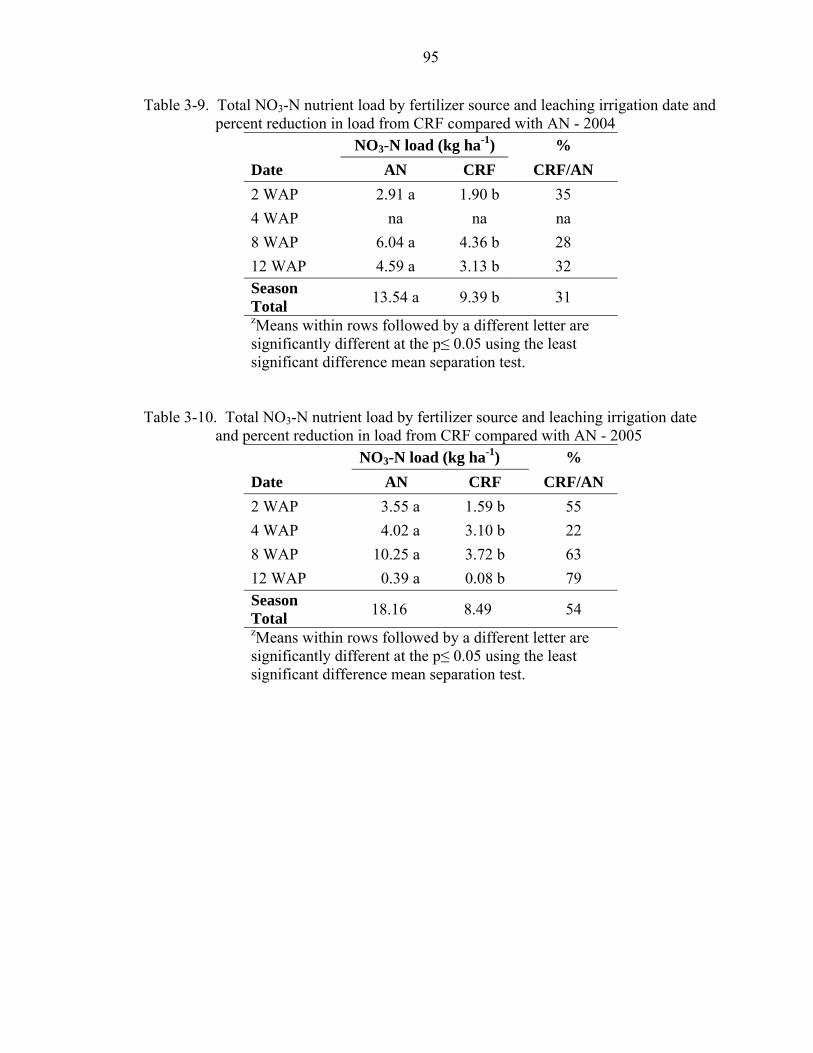
95
Table 3-9. Total NO3-N nutrient load by fertilizer source and leaching irrigation date and percent reduction in load from CRF compared with AN - 2004
NO3-N load (kg ha-1) % Date AN CRF CRF/AN 2 WAP 2.91 a 1.90 b 35 4 WAP na na na 8 WAP 6.04 a 4.36 b 28 12 WAP 4.59 a 3.13 b 32 Season Total 13.54 a 9.39 b 31 zMeans within rows followed by a different letter are significantly different at the p≤ 0.05 using the least significant difference mean separation test.
Table 3-10. Total NO3-N nutrient load by fertilizer source and leaching irrigation date and percent reduction in load from CRF compared with AN - 2005
NO3-N load (kg ha-1) % Date AN CRF CRF/AN 2 WAP 3.55 a 1.59 b 55 4 WAP 4.02 a 3.10 b 22 8 WAP 10.25 a 3.72 b 63 12 WAP 0.39 a 0.08 b 79 Season Total 18.16 8.49 54 zMeans within rows followed by a different letter are significantly different at the p≤ 0.05 using the least significant difference mean separation test.

96
Table 3-11. Accumulated Growing Degree Days to leaching irrigation event, emergence and full flower
2004 Irrigation Date
GDDy at irrigation
date IHNx IHN
severity
Days to
emergence
GDD to
emergence
Calendar days to
FFw
GDD to FF
GDD to harvest
0 WAPz - 10.9 abx 2.2 a 18 225 53 807 2107 2 WAP 198 16.7 a 2.3 a 18 225 53 807 2107 4 WAP 371 8.8 ab 1.8 ab 18 225 53 807 2107 8 WAP 979 3.3 b 1.3 b 18 225 53 807 2107 12 WAP 1666 4.3 b 1.7 b 18 225 53 807 2107 2005 Irrigation Date
GDD at irrigation
date IHN IHN
severity
Days to
emergence
GDD to
emergence
Calendar days to
FFx
GDD to FF
GDD to harvest
0 WAP - 24.9 3.1 19 228 49 798 2144 2 WAP 188 35.5 3.4 19 228 49 798 2144 4 WAP 408 30.0 3.1 19 228 49 798 2144 8 WAP 948 30.9 3.2 19 228 49 798 2144 12 WAP 1629 26.6 3.0 19 228 49 798 2144 zWAP = Weeks after Planting yGDD = Growing Degree Days xIHN = Internal Heat Necrosis - % of total yield wFF = Full Flower

97
0
50
100
150
200
250
300
350
400
0 10 20 30 40 50 60 70 80 90 100 110 120 130 140 150 160 170 180 190 200 210 220
Time (minutes)
H2O
(L/1
0min
)
2 WAP 8 WAP 12 WAP
0
50
100
150
200
250
300
350
400
0 10 20 30 40 50 60 70 80 90 100 110 120 130 140 150 160 170 180 190 200 210
Time (minutes)
H20
(L/1
0min
)
2 WAP 4 WAP 8 WAP 12 WAP
Figure 3-3. Total water volume from each irrigation date a. 2004 and b. 2005
a.
b.

98
rep=1
f er t AN CRF
0
1000
2000
3000
4000
5000
6000
Fert i l i zer Type
0 20 40 60 80 100 120 140 160 180 200 220 240
rep=2
f er t AN CRF
0
1000
2000
3000
4000
5000
6000
Fert i l i zer Type
0 20 40 60 80 100 120 140 160 180 200 220 240
rep=3
f er t AN CRF
0
1000
2000
3000
4000
5000
6000
Fert i l i zer Type
0 20 40 60 80 100 120 140 160 180 200 220 240
rep=4
f er t AN CRF
0
1000
2000
3000
4000
5000
6000
Fert i l i zer Type
0 20 40 60 80 100 120 140 160 180 200 220 240
Figure 3-4. NO3-N nutrient concentration (mg 10min-1) of AN fertilizer treatment (blue lines) and CRF treatments (red lines) with
parameter estimates by replication at leaching event 2 WAP, 2004

99
rep=1
f er t AN CRF
0
1000
2000
3000
4000
5000
6000
7000
8000
9000
10000
Fert i l i zer Type
0 20 40 60 80 100 120 140 160 180 200 220 240
rep=2
f er t AN CRF
0
1000
2000
3000
4000
5000
6000
7000
8000
9000
10000
Fert i l i zer Type
0 20 40 60 80 100 120 140 160 180 200 220 240
rep=3
f ert AN CRF
0
1000
2000
3000
4000
5000
6000
7000
8000
9000
10000
Fert i l i zer Type
0 20 40 60 80 100 120 140 160 180 200 220 240
rep=4
f er t AN CRF
0
1000
2000
3000
4000
5000
6000
7000
8000
9000
10000
Fert i l i zer Type
0 20 40 60 80 100 120 140 160 180 200 220 240
Figure 3-5. NO3-N nutrient concentration (mg 10min-1) of AN fertilizer treatment (blue lines) and CRF treatments (red lines) with
parameter estimates by replication at leaching event 8 WAP, 2004

100
rep=1
f er t AN CRF
1000
2000
3000
4000
5000
6000
7000
8000
9000
Fert i l i zer Type
0 20 40 60 80 100 120 140 160 180 200 220 240
rep=2
f ert AN CRF
1000
2000
3000
4000
5000
6000
7000
8000
9000
Fer t i l i zer Type
0 20 40 60 80 100 120 140 160 180 200 220 240
rep=3
f ert AN CRF
1000
2000
3000
4000
5000
6000
7000
8000
9000
Fer t i l i zer Type
0 20 40 60 80 100 120 140 160 180 200 220 240
rep=4
f er t AN CRF
1000
2000
3000
4000
5000
6000
7000
8000
9000
Fert i l i zer Type
0 20 40 60 80 100 120 140 160 180 200 220 240
Figure 3-6. NO3-N nutrient concentration (mg 10min-1) of AN fertilizer treatment (blue lines) and CRF treatments (red lines) with
parameter estimates by replication at leaching event 12 WAP, 2004

101
rep=1
f er t AN CRF
0
1000
2000
3000
4000
5000
Fert i l i zer Type
0 20 40 60 80 100 120 140 160 180 200 220 240
rep=2
f ert AN CRF
0
1000
2000
3000
4000
5000
Fer t i l i zer Type
0 20 40 60 80 100 120 140 160 180 200 220 240
rep=3
f er t AN CRF
0
1000
2000
3000
4000
5000
Fer t i l i zer Type
0 20 40 60 80 100 120 140 160 180 200 220 240
rep=4
f er t AN CRF
0
1000
2000
3000
4000
5000
Fert i l i zer Type
0 20 40 60 80 100 120 140 160 180 200 220 240
Figure 3-7. NO3-N nutrient concentration (mg 10min-1) of AN fertilizer treatment (blue lines) and CRF treatments (red lines) with
parameter estimates by replication at leaching event 2 WAP, 2005

102
rep=1
f er t AN CRF
0
1000
2000
3000
4000
5000
6000
7000
Fert i l i zer Type
0 20 40 60 80 100 120 140 160 180 200 220 240
rep=2
f er t AN CRF
0
1000
2000
3000
4000
5000
6000
7000
Fert i l i zer Type
0 20 40 60 80 100 120 140 160 180 200 220 240
rep=3
f er t AN CRF
0
1000
2000
3000
4000
5000
6000
7000
Fert i l i zer Type
0 20 40 60 80 100 120 140 160 180 200 220 240
rep=4
f er t AN CRF
0
1000
2000
3000
4000
5000
6000
7000
Fert i l i zer Type
0 20 40 60 80 100 120 140 160 180 200 220 240
Figure 3-8. NO3-N nutrient concentration (mg 10min-1) of AN fertilizer treatment (blue lines) and CRF treatments (red lines) with
parameter estimates by replication at leaching event 4 WAP, 2005
103
rep=4
f er t AN CRF
0
1000
2000
3000
4000
5000
6000
7000
8000
9000
10000
11000
12000
13000
14000
15000
16000
17000
18000
Fert i l i zer Type
0 20 40 60 80 100 120 140 160 180 200 220 240
rep=1
f er t AN CRF
0
1000
2000
3000
4000
5000
6000
7000
8000
9000
10000
11000
12000
13000
14000
15000
16000
17000
18000
Fert i l i zer Type
0 20 40 60 80 100 120 140 160 180 200 220 240
rep=2
f er t AN CRF
0
1000
2000
3000
4000
5000
6000
7000
8000
9000
10000
11000
12000
13000
14000
15000
16000
17000
18000
Fert i l i zer Type
0 20 40 60 80 100 120 140 160 180 200 220 240
rep=3
f er t AN CRF
0
1000
2000
3000
4000
5000
6000
7000
8000
9000
10000
11000
12000
13000
14000
15000
16000
17000
18000
Fert i l i zer Type
0 20 40 60 80 100 120 140 160 180 200 220 240
Figure 3-9. NO3-N nutrient concentration (mg 10min-1) of AN fertilizer treatment (blue lines) and CRF treatments (red lines) with
parameter estimates by replication at leaching event 8 WAP, 2005
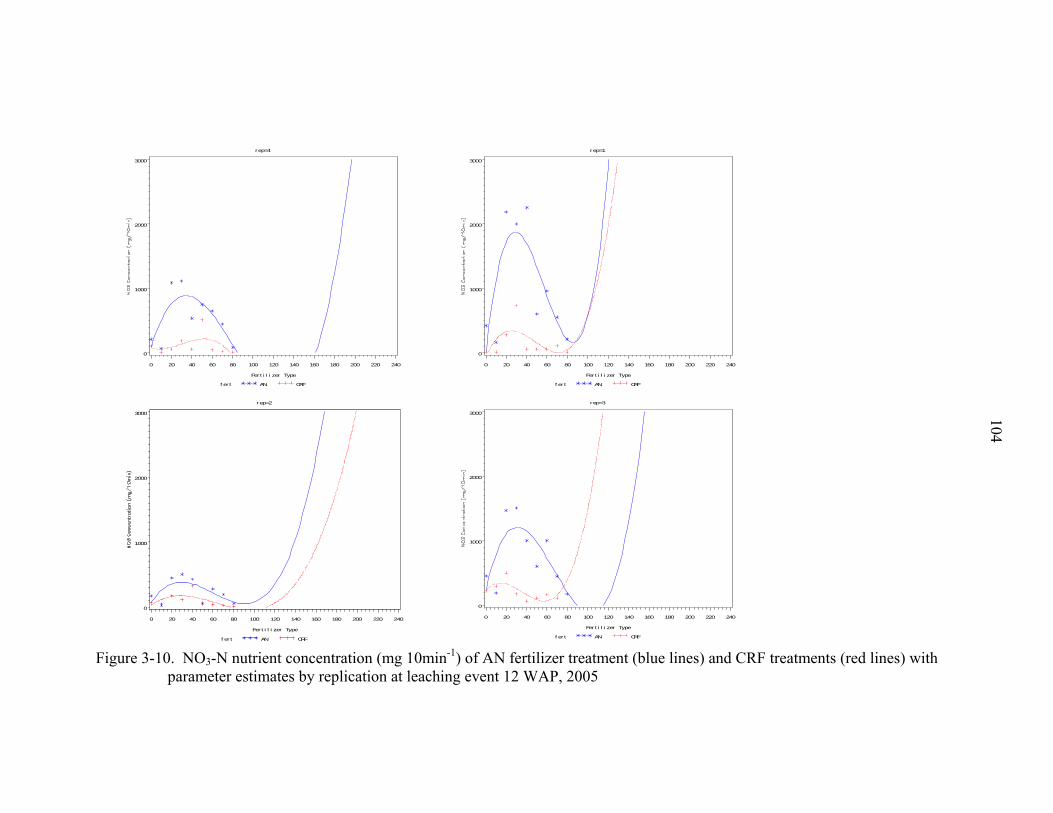
104
rep=4
f er t AN CRF
0
1000
2000
3000
Fert i l i zer Type
0 20 40 60 80 100 120 140 160 180 200 220 240
rep=1
f er t AN CRF
0
1000
2000
3000
Fert i l i zer Type
0 20 40 60 80 100 120 140 160 180 200 220 240
rep=2
f er t AN CRF
0
1000
2000
3000
Fer t i l i zer Type
0 20 40 60 80 100 120 140 160 180 200 220 240
rep=3
f er t AN CRF
0
1000
2000
3000
Fert i l i zer Type
0 20 40 60 80 100 120 140 160 180 200 220 240
Figure 3-10. NO3-N nutrient concentration (mg 10min-1) of AN fertilizer treatment (blue lines) and CRF treatments (red lines) with
parameter estimates by replication at leaching event 12 WAP, 2005

105
0.00
0.10
0.20
0.30
0.40
0.50
0.60
0.70
0.80
0.90
1.00
0 10 20 30 40 50 60 70 80 90 100 110 120 130 140 150 160 170 180
Time (minutes)
NO
3-N lo
ad (k
g/ha
)
AN CRF
0.00
0.10
0.20
0.30
0.40
0.50
0.60
0.70
0.80
0.90
1.00
0 10 20 30 40 50 60 70 80 90 100 110 120 130 140 150 160 170 180 190 200 210 220
Time (minutes)
NO
3-N lo
ad (k
g/ha
)
AN CRF
Figure 3-11. NO3-N load (kg ha-1) at 2, 8 and 12 WAP, 2004. a. 2 WAP b. 8 WAP c. 12
WAP
b.
a.

106
0.00
0.10
0.20
0.30
0.40
0.50
0.60
0.70
0.80
0.90
1.00
0 10 20 30 40 50 60 70 80 90 100 110 120 130 140 150 160 170 180 190
Time (minutes)
NO
3-N lo
ad (k
g/ha
)
CRFAN
Figure 3-11. Continued
c.

107
0.00
0.10
0.20
0.30
0.40
0.50
0.60
0.70
0.80
0.90
1.00
0 10 20 30 40 50 60 70 80 90 100 110 120 130 140 150 160 170 180 190 200
Time (minutes)
NO
3-N lo
ad (k
g//h
a)
AN CRF
0.00
0.10
0.20
0.30
0.40
0.50
0.60
0.70
0.80
0.90
1.00
0 10 20 30 40 50 60 70 80 90 100 110 120 130 140 150 160 170
Time (minutes)
NO
3-N lo
ad (k
g//h
a)
AN CRF
Figure 3-12. NO3-N load (kg ha-1) at 2, 4, 8 and 12 WAP, 2005. a. 2 WAP b. 4 WAP c.
8 WAP d. 12 WAP
b.
a.

108
0.00
0.10
0.20
0.30
0.40
0.50
0.60
0.70
0.80
0.90
1.00
0 10 20 30 40 50 60 70 80 90 100 110 120 130 140 150 160 170 180 190 200 210
Time (minutes)
NO
3-N lo
ad (k
g//h
a)
AN CRF
0.00
0.10
0.20
0.30
0.40
0.50
0.60
0.70
0.80
0.90
1.00
0 10 20 30 40 50 60 70 80
Time (minutes)
NO
3-N lo
ad (k
g//h
a)
AN CRF
Figure 3-12. Continued
c.
d.

109
0.00
1.00
2.00
3.00
4.00
5.00
6.00
7.00
8.00
9.00
10.00
11.00
12.00
2/17
/04
2/24
/04
3/2/
04
3/9/
04
3/16
/04
3/23
/04
3/30
/04
4/6/
04
4/13
/04
4/20
/04
4/27
/04
5/4/
04
5/11
/04
5/18
/04
5/25
/04
Date
Rai
nfal
l (cm
)
0
5
10
15
20
25
30
Ave
rage
dai
ly te
mpe
ratu
re (C
)
Rainfall events Average daily temperature
0.00
1.00
2.00
3.00
4.00
5.00
6.00
7.00
8.00
9.00
10.00
2/23
/05
3/2/
05
3/9/
05
3/16
/05
3/23
/05
3/30
/05
4/6/
05
4/13
/05
4/20
/05
4/27
/05
5/4/
05
5/11
/05
5/18
/05
5/25
/05
6/1/
05
6/8/
05
Date
Rai
nfal
l (cm
)
0
5
10
15
20
25
30
Ave
rage
dai
ly te
mpe
ratu
re (C
)
Rainfall events Average daily temperature
Figure 3-13. Daily rainfall (cm) for the a. 2004 and b. 2005 production season. The
group of red bars denote a leaching rainfall event (7.6 cm in 3 days or 10.1 cm in 4 days). The yellow, blue, pink and green arrows denote a stage leaching irrigation event at 2, 4, 8 and 12 WAP, respectively
a.
b.

110
CHAPTER 4 SUMMARY, AND FUTURE RESEARCH
The St. Johns River in the state of Florida has been recognized as a priority water
body in need of restoration. Best Management Practices (BMPs) for potato production in
the TCAA have been implemented in response to the water quality concerns in the St.
Johns River. With over 7,000 ha in potato production in the TCAA, nutrient runoff from
potato production land has thought to have been primarily responsible for the non-point
source pollution into the St Johns River watershed. Potato production BMPs to reduce
nutrients entering the watershed have included a reduction of N fertilizer applied to the
potato crop, from a grower standard of 286 kg N ha-1 to 224 kg N ha-1. Second, the use
of alternative N fertilizers, e.g. controlled release fertilizers which would supply N to the
potato crop as it is needed throughout the season. Third, in the event of a leaching
rainfall event which is defined as 7.6 cm in 3 days or 10.2 cm in 7 days an additional 34
kg N ha-1 may be applied to the potato crop to compensate for what potential N losses
were incurred after the leaching rainfall event.
The concerns of the grower with the implementation of the BMPs are first, to not
compromise yield and second to maintain quality both externally and internally which are
related to nutrition and/or environmental stress (high temperatures and large amounts of
rainfall) during the growing season. Potato, a cool season crop, is planted in the TCAA
beginning in January when day length is short and temperatures cool. As the season
progresses, daylight hours lengthen and temperatures increase as the potato goes through
key developmental stages. Leaching rainfall events during the production season are also

111
common and can affect yield and quality of potato. The 50 year average for leaching
rainfall events during the production season in the TCAA from 1954 to 2004 is 2.5 times
for a 7.6 cm rainfall in 3 days and 5.3 times for a 10.2 cm rainfall in 7 days during the 6
month production season. Addressing these environmental and nutritional issues is
important to the grower since approximately 70% of the acreage in the TCAA is planted
in ‘Atlantic’ which is a potato that typically requires higher amounts of nitrogen to
maintain quality and yield. This research addressed the concerns of the grower from a
BMP standpoint as well as evaluating the environmental factors which could impact both
yield and quality of the potato crop throughout the production season. This research has
found:
Optimum Planting Dates
Based upon this research the optimum planting dates in the TCAA are a four week
period (early to late February) in the typical twelve week planting window from January
through March. Planting in January, in order to meet early April chipping contracts,
could reduce yields by approximately 34%. The earlier planting dates also had little to no
external and internal defects.
Planting in March, a grower could expect an average reduction in yield of
approximately 38%. This was primarily due to the increased percentages of rots due to
the warmer day and night temperatures later in the season. Day and night time
temperatures during tuber bulking (between full flower and harvest) in planting dates 5
and 6 were 8 and 10 degrees warmer, respectively, compared with all other planting
dates. Furthermore, the average amount of rainfall received during planting dates 5 and 6
was 58% more rainfall compared with the other planting dates 1 through 4 during the
production season.

112
Growing degree days evaluated throughout the growing season in 2004 and 2005
for each of the planting dates demonstrated optimal yields were obtained for ‘Atlantic’
and ‘Harley Blackwell’ at approximately 2000 GDD. Additionally, key growth and
developmental stages were determined using GDD. Average GDD to reach emergence
and full flower in 2004 and 2005 was 212 and 808 GDD, respectively. ‘Atlantic’ and
‘Harley Blackwell’ are generally harvest at or soon after 100 days after plating. This is
primarily due to the aldicarb, an insecticide/nematicide, labeling restrictions. This
harvest date works for early to mid season plantings, but not for late season plantings in
March. As planting dates extend further into the season, average daily temperatures
increase, therefore, developmental stages occur sooner and the growing season is
compressed based on accumulated growing degree days. Therefore, if a grower were to
base the harvest of the late season plantings upon GDD and changed the
insecticide/nematicide program, harvest could theoretically be 10 to 21 days sooner rather
than the 100 day harvest interval potentially reducing the incidence of rots in the field
and therefore higher marketable yields.
Climatic Factors
This research also demonstrated that a leaching rainfall event between 200 and 400
GDD predisposed ‘Atlantic’ to the onset of IHN due to plant stress caused by excess
water which leads to low soil nutrient concentration early in the season followed by
warmer temperatures later in the season. The average number of leaching rainfall events
occurring between Jan and July over the last 50 years in the TCAA is 2.5 times for a 7.6
cm rainfall in 3 days and 5 times for a 10.1 cm rainfall in 7 days. Therefore, the
influence of leaching rains on potato growth and production is imperative information to
relay to the grower.

113
Potato Varieties
Although ‘Harley Blackwell’ typically has lower yields compared with ‘Atlantic’ it
has proven to be a viable option for a chipping stock because of its desirable internal
quality characteristics. Average marketable yields for ‘Harley Blackwell’ and ‘Atlantic’
were 19.8 and 21.4 t ha-1, respectively. Although, averaged marketable yields were
lower, ‘Harley Blackwell’ had significantly lower total culls compared with ‘Atlantic’ in
2004 and 2005. Adverse weather conditions during the growing season in the TCAA
have certainly made ‘Harley Blackwell’ a viable option as an alternative chipping variety
in the TCAA. Its ability to withstand the warmer temperatures later in the season while
maintaining its internal quality makes it a better chipping variety for late season contracts
compared with ‘Atlantic’.
Fertilizer Source
This research has additionally demonstrated the effectiveness of a CRF in potato
production compared with soluble N fertilizer. CRF treatments had an average increase
in marketable yields of 12% with 13% less N fertilizer applied compared with the AN
fertilizer treatment. FUE was also significantly higher in the CRF treatments, with an
average increase in nitrogen FUE of 18% compared with the AN fertilizer treatments
(data in appendix, F-5 page 6). Additionally, CRF was applied just prior to planting
which means less time spent in the field applying additional fertilizer and a savings on
fuel costs.
External tuber defects, particularly IHN, was higher in the CRF treatments
compared with the AN fertilizer treatments. This is most likely due to two conditions,
first, the formulation of the CRF and its ability to ‘recharge’ in the soil. Therefore, a
blend should be created that contains a thinner coated material to release faster and

114
reduce the recharge timing. Second, the placement of the CRF so that more of the
material is in the root zone of the plant.
Similarly to the multiple planting date study, the incidence of IHN was also highest
in the leaching irrigation treatments which occurred between 200 and 400 GDD, followed
by the warmer temperatures later in the season. The additional plant stress (leaching
irrigation event) at 8 and 12 WAP coupled with the warmer temperatures late in the
season significantly impacted marketable yields.
Additional N Sidedress
Overall, the BMP of 34 kg N ha-1 after a leaching irrigation event did not
significantly influence total or marketable tuber yields or external or internal tuber quality
in 2004 or 2005. The three way interaction between irrigation main effects, fertilizer
source and side dress did result in significantly higher tuber total and marketable yields in
the CRF treatments at the 2 WAP irrigation date event. This was not the result in the AN
fertilizer treatment in which the additional side dress did not make up for what was lost to
leaching. At this time, this BMP does not appear to be a sufficient amount to compensate
for what nutrient losses were incurred during a leaching event. Therefore, this BMP
should be reevaluated for potato production in the TCAA which may be an issue of N
rate and/or placement.
Water Quality
Use of CRF in potato production has also demonstrated it effectiveness in reducing
the potential of nutrients moving into the water table. In 2005, the use of CRF reduced
well NO3-N approximately 19% compared with the AN fertilizer treatment.
Additionally, the use of CRF in potato production in 2004 and 2005 demonstrated a
reduction in NO3-N in lysimeters by an average of 14 and 32%, respectively.

115
This research demonstrated that nutrient loading from surface water runoff was
significantly reduced with the use of CRF compared with the AN fertilizer treatment.
The average reduction of NO3-N removed from the field due to surface water runoff was
43% compared with the AN fertilizer treatment. Based upon this research, NO3-N loads
into the St. John River watershed from potato production in the TCAA can be reduced by
56, 000 kg per year with the use of a CRF vs. an AN fertilizer.
Future Research
Based upon the results of this dissertation, possible future research topics include:
• Growth and developmental characteristics as well as yield and quality of potato should be further investigated in a controlled environment (greenhouse or rainout shelter) instrumented to further evaluate the nutritional and environmental stressors which affect potato production in the TCAA.
• Based upon the results of this dissertation, in the event of an early season leaching rainfall, a CRF with a faster release rate to alleviate early season nutritional stress should be further investigated with particular attention to the incidence of tubers with IHN.
• A nutritional study including Ca++ related to placement, timing and rate during the production season and how these factors relate to Ca++ distribution in the tuber tissue of ‘Atlantic’.
• The reevaluation of the BMP of 34 kg N ha-1 after a leaching rainfall event should be studied in regards to placement and N rate applied for potato production in the TCAA.
• Further investigate the movement and concentration of nutrients from surface water flow from potato production acreage into the St. Johns River watershed.

116
APPENDIX A ADDITIONAL DATA AND ANOVA TABLES FOR PLANTING DATE YIELD
In this appendix are reported additional data and ANOVA tables for planting date yield and late harvest yield. The tables include potato size distribution and external and internal quality.

117
Table A-1. Total and marketable yield and specific gravity production statistics for late harvest 2004 and 2005
Total yield
Marketable yield
Specific gravity Total
yield Marketable yield
Specific gravity
2004 2005
Main Effect t ha-1 t ha-1
Planting Datez (PD) 1 31.8 ay 27.1 a 1.077 a 24.2 c 21.1 b 1.074 c 2 27.4 a 19.8 b 1.075 ab 20.1 d 17.6 bc 1.075 bc 3 27.7 a 20.2 b 1.076 a 25.3 bc 21.1 b 1.079 a 4 28.6 a 22.6 ab 1.073 b 34.0 a 25.7 a 1.076 b 5 18.8 b 10.8 c 1.066 c 28.1 b 16.0 c 1.069 d 6 11.5 c 6.1 d 1.063 d 12.7 e 6.2 d 1.061 e Nitrogen Rate (NR)
168 kg N ha-1 24.7 a 17.9 a 1.079 a 23.9 17.4 1.072 224 kg N ha-1 22.5 b 15.9 b 1.071 b 23.4 17.1 1.072 Variety (V)
Atlantic 23.3 18.6 a 1.073 a 21.2 b 15.0 1.074 a Harley Blackwell 23.9 15.3 b 1.070 b 26.1 a 19.6 1.071 b

118
Table A-1. Continued
Total yield
Marketable yield
Specific gravity Total
yield Marketable yield
Specific gravity
2004 2005
t ha-1 t ha-1
Interaction effectsx PD*NR ns ns * ns ns ns PD*V ** ns * *** ** ns NR* V ns ns ns ns ns ns PD*NR*V ns ns ns ns ns ns zPlanting dates 1 through 6 for 2004 and 2005 were (13 Jan, 27 Jan, 9 Feb, 23 Feb, 9 Mar, 24 Mar, 2004 and 11 Jan, 25 Jan, 8 Feb, 22 Feb, 7 Mar 22 Mar, 2005). yMeans are separated with column and main effect using Tukey’s studentized range test. Means followed by different letters are significantly different at p≤ 0.05. Means with no letters are not significantly different. xns, *, **, *** non-significant or significant at p≤ 0.05, 0.01, 0.001, respectively using ANOVA.

119
Table A-2. Size class distribution and range (%) production statistics for late harvest 2004
Size Distribution by class (%)z
Size Class Range (%)
Main effects
B A1 A2 A3 A1 to A2
A2 to A3
Planting Datey (PD)
2004
1 5.5 bcx 61.3 24.0 0.7 86.2 ab 25.9 2 9.1 a 60.4 12.3 0.9 75.1 c 14.3 3 7.7 ab 60.7 14.8 0.8 78.8 c 16.9 4 4.7 c 66.3 20.9 2.5 88.2 a 24.7 5 7.9 ab 68.3 10.3 0.5 81.7 bc 14.4 6 5.1 bc 67.8 12.8 0.1 89.7 a 11.5 Nitrogen Rate (NR) (kg ha-1)
224 6.9 61.9 b 17.8 a 1.1 83.3 20.7 a 168 6.3 66.4 a 13.4 b 0.5 83.7 14.8 b Variety Atantic 3.8 b 62.6 24.7 a 1.4 a 89.3 a 27.7 a Harley Blackwell
9.9 b 65.7 8.2 b 0.3 b 76.7 b 9.5 b
zPlanting dates 1 through 6 for 2004 and 2005 were (13 Jan, 27 Jan, 9 Feb, 23 Feb, 9 Mar, 24 Mar, 2004 and 11 Jan, 25 Jan, 8 Feb, 22 Feb, 7 Mar 22 Mar, 2005). yMeans are separated with column and main effect using Tukey’s studentized range test. Means followed by different letters are significantly different at p≤ 0.05. Means with no letters are not significantly different. xns, *, **, *** non-significant or significant at p≤ 0.05, 0.01, 0.001, respectively using ANOVA

120
Table A-2. Continued Size
Distribution by class (%)z Size Class Range (%)
B A1 A2 A3 A1 to A2
A2 to A3
Interaction effectsw 2004
PD*NR ns *** * ns ns ** PD*V ns ns * * * * NR*V ns ns ns ns ns ns PD*NR*V ns ns ns * ns ns zPlanting dates 1 through 6 for 2004 and 2005 were (13 Jan, 27 Jan, 9 Feb, 23 Feb, 9 Mar, 24 Mar, 2004 and 11 Jan, 25 Jan, 8 Feb, 22 Feb, 7 Mar 22 Mar, 2005). yMeans are separated with column and main effect using Tukey’s studentized range test. Means followed by different letters are significantly different at p≤ 0.05. Means with no letters are not significantly different. xns, *, **, *** non-significant or significant at p≤ 0.05, 0.01, 0.001, respectively using ANOVA.

121
Table A-3. Size class distribution and range (%) production statistics for late harvest 2005
Size Distribution by class (%)z
Size Class Range (%)
Main effects
B A1 A2 A3 A1 to A2
A2 to A3
Planting Datey (PD)
2005
1 6.6 c 55.9 cd 28.7 a 5.8 a 91.9 a 35.4 ab 2 8.0 c 63.6 a-
c 23.8 ab 0.6 b 90.2 a 25.9 b
3 7.3 c 60.6 bc 29.0 a 0.4 b 91.6 a 30.6 ab 4 7.5 c 47.8 d 35.4 a 5.2 a 91.7 a 43.4 a 5 12.2 b 70.3 a 14.0 bc 0.0 c 86.5 b 14.0 c 6 18.9 a 67.0 ab 8.1 c 0.0 c 79.3 c 9.2 c Nitrogen Rate (NR) (kg ha-1)
224 10.3 59.5 23.1 1.4 88.4 26.6 168 9.3 62.3 21.5 0.9 89.3 24.1 Variety Atantic 7.6 59.7 25.1 a 1.6 91.2 a 29.0 a Harley Blackwell
12.1 62.1 19.7 b 0.8 86.3 b 22.0 b
zPlanting dates 1 through 6 for 2004 and 2005 were (13 Jan, 27 Jan, 9 Feb, 23 Feb, 9 Mar, 24 Mar, 2004 and 11 Jan, 25 Jan, 8 Feb, 22 Feb, 7 Mar 22 Mar, 2005). yMeans are separated with column and main effect using Tukey’s studentized range test. Means followed by different letters are significantly different at p≤ 0.05. Means with no letters are not significantly different. xns, *, **, *** non-significant or significant at p≤ 0.05, 0.01, 0.001, respectively using ANOVA

122
Table A-4. Size class distribution and range (%) production statistics for late harvest 2005
Size Distribution by class (%)z
Size Class Range (%)
B A1 A2 A3 A1 to A2
A2 to A3
Interaction effectsw 2005
PD*NR ns ns ns ns ns ns PD*V ns ns ns ns ns ns NR*V ns ns ns ns ns ns PD*NR*V ns ns ns ns ns ns zSize class: B = 3.8 to 4.4 cm (1.5 to 1 7/8 in), A1 =4.4 to 6.4 cm (1 7/8 to 2.5 in), A2 = 6.4 to 8.3 cm (2.5 to 3.25 in), A3 = 8.3 to 10.2 cm (3.25 to 4 in). yPlanting dates 1 through 6 for 2004 and 2005 were (13 Jan, 27 Jan, 9 Feb, 23 Feb, 9 Mar, 24 Mar and 11 Jan, 25 Jan, 8 Feb, 22 Feb, 7 Mar 22 Mar), respectively. xMeans are separated with column and main effect using Tukey’s studentized range test. Means followed by different letters are significantly different at p≤ 0.05. Means with no letters are not significantly different. wns, *, **, *** non-significant or significant at p≤ 0.05, 0.01, 0.001, respectively using ANOVA.

123
Table A-5. External quality (green, growth cracks, mis-shaped, rot and total culls) (%) of total yield late harvest 2004 and 2005 External tuber defects (%) Main effects Green Growth
crack Mis-shaped
Rot Total cullz Green Growth
crack Mis-shaped
Rot Total cullz
Planting Date (PD)z 2004 2005
1 0.0 0.7 ay 0.2 b 0.1 d 1.9 d 2.8 a 0.0 0.1 0.0 d 3.7 cd 2 1.2 0.0 b 0.0 b 3.4 c 6.2 c 0.3 b 0.0 0.0 0.4 d 2.2 d 3 0.0 0.0 b 1.9 a 6.3 c 9.0 bc 2.1 a 0.0 0.0 3.8 c 7.0 c 4 0.0 0.0 b 0.0 b 12.8 b 13.3 b 2.6 a 0.0 0.0 12.6 b 16.2 b 5 0.0 0.0 b 0.0 b 28.7 a 28.9 a 1.5 a 0.0 0.0 30.8 a 33.1 a 6 1.0 0.0 b 0.0 b 33.0 a 35.7 a 0.0 b 0.0 0.0 38.7 a 39.1 a Nitrogen Rate (NR) kg ha-1
224 0.2 0.0 0.0 b 10.2 13.1 1.5 0.0 0.0 9.3 14.4 168 0.1 0.0 0.1 a 11.1 14.3 1.2 0.0 0.0 10.5 14.6 Variety (V) Atlantic 0.1 0.0 0.2 a 10.2 13.5 2.5 a 0.0 a 0.0 13.6 a 21.1 a Harley Blackwell
0.2 0.0 0.0 b 11.1 13.9 0.6 b 0.0 b 0.0 6.9 b 9.2 b

124
Table A-5. Continued External tuber defects (%) Green Growth
crack Mis-shaped
Rot Total cullz Green Growth
crack Mis-shaped
Rot Total cullz
Interaction effectsx 2004 2005
PD*NR ns ns ns ns ns ns ns ns * * PD*V ns ns *** ns ns * ns * ** ns NR* V ns ns ns ns ns ns ns ns ns ns PD*NR*V ns ns ns ns ns ns ns ns ns ns zPlanting dates 1 through 6 for 2004 and 2005 were (13 Jan, 27 Jan, 9 Feb, 23 Feb, 9 Mar, 24 Mar, 2004 and 11 Jan, 25 Jan, 8 Feb, 22 Feb, 7 Mar 22 Mar, 2005). yMeans are separated with column and main effect using Tukey’s studentized range test. Means followed by different letters are significantly different at p≤ 0.05. Means with no letters are not significantly different. xns, *, **, *** non-significant or significant at p≤ 0.05, 0.01, 0.001, respectively using ANOVA.

125
Table A-6. Internal quality (%) of total yield late harvest 2004 and 2005 Internal quality (%)
Main effects HH IHN IHN severity CRS BCL HH IHN IHN
severity CRS BCL
Planting Datez (PD) 2004 2005
1 2.1 by 5.3 a-c 1.3 ab 4.9 ab 1.1 0.0 3.9 0.0 c 0.2 0.4 2 5.1 a 8.1 a 1.7 a 6.5 a 1.7 0.0 5.3 0.0 c 0.0 0.0 3 0.0 c 1.1 b-d 0.7 bc 3.2 a-c 1.0 0.0 3.8 1.2 ab 0.0 0.0 4 0.0c 7.0 ab 1.5 a 0.3 bc 0.9 0.0 9.0 1.7 a 0.0 0.0 5 0.0 c 0.1 d 0.3 c 0.0 c 0.0 0.0 3.6 1.1 a 0.0 0.0 6 3.3 ab 0.4 cd 0.0 c 0.0c 0.0 0.0 0.7 0.6 b 0.0 0.0 Nitrogen Rate (NR) kg ha-1
224 0.7 2.5 0.9 1.5 0.6 0.0 4.1 0.7 0.0 0.0 168 0.9 3.0 0.9 1.4 0.5 0.0 3.8 0.6 0.0 0.0 Variety (V) Atlantic 1.5 a 9.6 a 1.7 a 0.4 b 1.5 a 0.0 16.0 a 1.3 a 0.0 0.0 a Harley Blackwell
0.3 b 0.0 b 0.1 b 3.2 a 0.1 b 0.0 0.0 b 0.0 b 0.0 0.0 b

126
Table A-6. Continued HH IHN IHN
severity CRS BCL HH IHN IHN severity CRS BCL
Interaction effects 2004 2005
PD*NR * ns ns ns ns ns *** ns * ns PD*V *** *** ns ** ** ns ** ns * ns NR* V * ns ns ns ns ns ns ns ns ns PD*NR*V ** ns ns ns ns ns ns ns * ns zPlanting dates 1 through 6 for 2004 and 2005 were (13 Jan, 27 Jan, 9 Feb, 23 Feb, 9 Mar, 24 Mar, 2004 and 11 Jan, 25 Jan, 8 Feb, 22 Feb, 7 Mar 22 Mar, 2005). yMeans are separated with column and main effect using Tukey’s studentized range test. Means followed by different letters are significantly different at p≤ 0.05. Means with no letters are not significantly different. xns, *, **, *** non-significant or significant at p≤ 0.05, 0.01, 0.001, respectively using ANOVA.

127
Table A-7. 2004 ANOVA table for potato yield in planting date study Type III Mean Squarez
Source of Variation DF Total Mkt B A1 A2 A3 A12 A23 SG
Replication 3 0.88 390.9 0.00 0.00 0.00 0.00 0.01 0.00 0.00
Planting Date 5 12.57 3026.6 0.01 0.01 0.04 0.02 0.04 0.04 0.00
Replication*Planting Date 15 0.80 579.7 0.00 0.00 0.00 0.00 0.00 0.00 0.00
Nitrogen Rate 1 10.10 7200.6 0.00 0.00 0.02 0.01 0.00 0.04 0.00
Planting Date*Nitrogen Rate
5 1.75 1387.4 0.00 0.00 0.01 0.02 0.00 0.01 0.00
Replication*Planting Date *Nitrogen Rate
18 0.36 282.8 0.00 0.00 0.01 0.00 0.00 0.01 0.00
Variety 1 8.83 400.0 0.24 0.00 0.46 0.14 0.41 0.63 0.00
Planting Date*Variety 5 2.45 1206.3 0.00 0.03 0.02 0.02 0.00 0.04 0.00
Nitrogen Rate*Variety 1 0.00 56.2 0.00 0.02 0.00 0.03 0.01 0.01 0.00
Planting Date*Nitrogen Rate*Variety
5 0.53 5359.8 0.00 0.00 0.01 0.01 0.00 0.01 0.00
z*Significant at Type I error<0.05 **Significant at Type I error < 0.01

128
Table A-8. 2005 ANOVA table for potato total and marketable yield and size distribution in planting date study Type III Mean Squarez
Source of Variation DF Total Mkt B A1 A2 A3 A12 A23 SG
Replication 3 2.07 1.44 0.00 0.00*** 0.00 0.02 0.00 0.00 0.00
Planting Date 5 77.74*** 129.91*** 0.14*** 0.10 0.42*** 0.12*** 0.08*** 0.53*** 0.00***
Replication*Planting Date 15 0.61 0.87 0.00 0.00 0.00 0.01* 0.00 * 0.00 0.00
Nitrogen Rate 1 1.09 0.23 0.01** 0.00 0.00 0.00 0.01 * 0.00 0.00
Planting Date*Nitrogen Rate
5 0.94 1.69 0.00* 0.00 0.00 0.01** 0.00 0.00 0.00
Replication*Planting Date *Nitrogen Rate
18 0.89 0.54 0.00 0.00 0.01 0.00 0.00 0.01 0.00
Variety 1 13.51*** 5.26* 0.16*** 0.00 0.22*** 0.01 0.12*** 0.25*** 0.00 **
Planting Date*Variety 5 6.21*** 3.28* 0.00** 0.01* 0.01 0.01* 0.02*** 0.00 0.00***
Nitrogen Rate*Variety 1 0.63 1.03 0.00 0.00 0.01 0.00 0.00 0.01 0.00**
Planting Date*Nitrogen Rate*Variety
5 1.29 2.22 0.00 0.00 0.02 0.01 0.00 0.01 0.00 *
z*Significant at Type I error<0.05 **Significant at Type I error < 0.01 ***Significant at Type I error<0.001

129
Table A-9. 2004 ANOVA table for potato internal and external quality in planting date study Type III Mean Squarez
Source of Variation DF GC Green Mis shapen Rot
Total cull CRS HH IHN BC(l)
Replication 3 0.00 0.00 0.00 0.00 0.00 0.12** 0.00 0.00 0.00
Planting Date 5 0.00* 0.01** 0.00 0.42*** 0.29*** 0.34*** 0.10*** 0.10*** 0.05***
Replication*Planting Date 15 0.00 0.00 0.00 0.00 0.00 0.06** 0.00 0.01 0.00
Nitrogen Rate 1 0.00 0.00 0.00 0.01 0.01 0.12* 0.00 0.00 0.00
Planting Date*Nitrogen Rate
5 0.00 0.00 0.00 0.00 0.00 0.02 0.00 0.05* 0.00
Replication*Planting Date*Nitrogen Rate
18 0.00 0.00 0.00 0.00* 0.00** 0.01 0.00 0.01 0.00
Variety 1 0.00 0.00 0.01** 0.00 0.03** 0.00 0.25*** 0.57*** 0.07**
Planting Date*Variety 5 0.00 0.00 0.00 0.00 0.01 * 0.00 0.10*** 0.09** 0.03**
Nitrogen Rate*Variety 1 0.00 0.00 0.00 0.00 0.00 0.02 0.00 0.00 0.00
Planting Date*Nitrogen Rate*Variety
5 0.00 0.00 0.00 0.00 0.00 0.01 0.00 0.02 0.00
z*Significant at Type I error<0.05 **Significant at Type I error < 0.01 ***Significant at Type I error<0.001

130
Table A-10. 2005 ANOVA table for potato internal and external quality in planting date study
Type III Mean Squarez
Source of Variation DF GC Green Mis shapen Rot
Total cull CRS HH IHN BC(l)
Replication 3 0.00 0.00 0.00 0.00 0.02 0.00 0.00 0.01 0.00
Planting Date 5 0.00* 0.00 0.00 1.08*** 0.79*** 0.00*** 0.00 0.12*** 0.12***
Replication*Planting Date
15 0.00 0.00 0.00 0.44 0.00 0.00 0.00 0.00 0.00
Nitrogen Rate 1 0.00 0.00 0.00 0.00 0.00 0.00 0.00 0.01 0.01
Planting Date *Nitrogen Rate
5 0.00 0.00 0.00 0.00 0.00* 0.00 0.00 0.01* 0.00
Replication*Planting Date*Nitrogen Rate
18 0.00 0.00 0.00 0.00 0.00 0.00 0.00 0.00 0.00
Variety 1 0.01** 0.01 0.01** 0.04** 0.18*** 0.00 0.00 0.53*** 0.52***
Planting Date*Variety 5 0.00 0.00 0.00 0.00 0.00 0.00 0.00 0.10*** 0.12***
Nitrogen Rate*Variety 1 0.00 0.00 0.00 0.03* 0.00 0.00 0.00 0.00 0.01
Planting Date*Nitrogen Rate*Variety
5 0.00 0.00 0.00 0.00 0.01 0.00 0.00 0.01 0.00
z*Significant at Type I error<0.05 **Significant at Type I error < 0.01 ***Significant at Type I error<0.001

131
Table A-11. 2004 ANOVA table for potato yield in planting date study late harvest Type III Mean Squarez
Source DF Total Mkt B A1 A2 A3 A12 A23 SG
Replication 3 3.63* 2.53 0.00 0.02 0.04 0.00 0.00 0.04 0.00
Planting Date 5 108.11*** 148.29*** 0.00** 0.02 0.08** 0.02 0.09*** 0.09** 0.00***
Replication*Planting Date 15 2.52* 2.97 0.00 0.01 0.05* 0.01 0.00 0.05* 0.00
Nitrogen Rate 1 11.62** 12.04* 0.00 0.05 0.08 0.02 0.00 0.14* 0.00**
Planting Date*Nitrogen Rate
5 1.21 1.93 0.00 0.01 0.01 0.00 0.00 0.02 0.00*
Replication*Planting Date*Nitrogen Rate
18 0.53 0.72 0.00 0.00 0.00 0.01 0.00 0.00 0.00
Variety 1 0.73 34.96*** 0.00*** 0.02 1.24*** 0.09** 0.70*** 1.39*** 0.00***
Planting Date*Variety 5 5.90** 3.61 0.00 0.02 0.06* 0.02* 0.03* 0.05* 0.00*
Nitrogen Rate*Variety 1 0.493 0.75 0.00 0.00 0.00 0.01 0.00 0.00 0.00
Planting Date*Nitrogen Rate*Variety
5 1.63 2.58 0.00 0.016 0.00 0.03* 0.01 0.00 0.00
z*Significant at Type I error<0.05 **Significant at Type I error < 0.01 ***Significant at Type I error<0.001

132
Table A-12. 2005 ANOVA table for potato yield in planting date study late harvest Type III Mean Squarez
Source DF Total Mkt B A1 A2 A3 A12 A23 SG
Replication 3 3.15 3.16 0.00 0.00 0.00 0.01 0.00 0.01 0.00
Planting Date 5 83.93*** 114.15*** 0.08*** 0.10*** 0.27*** 0.17*** 0.08*** 0.38*** 0.00***
Replication*Planting Date 15 1.65* 2.39 0.00 0.01 0.03** 0.00 0.00 0.03* 0.00
Nitrogen Rate 1 0.57 0.32 0.00 0.01 0.00 0.00 0.00 0.01 0.00
Planting Date*Nitrogen Rate
5 1.74* 1.47 0.00 0.00 0.01 0.00 0.00 0.01 0.00
Replication*Planting Date*Nitrogen Rate
18 0.68 0.79 0.00 0.00 0.010 0.00 0.00 0.01 0.00
Variety 1 52.45*** 58.74*** 0.14*** 0.01 0.10** 0.03 0.15*** 0.15** 0.00***
Planting Date*Variety 5 8.65*** 5.29** 0.00 0.00 0.02 0.02 0.00 0.02 0.00
Nitrogen Rate*Variety 1 2.31 0.96 0.00 0.01 0.01 0.00 0.00 0.02 0.00
Planting Date*Nitrogen Rate*Variety
5 0.54 1.03 0.00 0.00 0.01 0.00 0.00 0.00 0.00
z*Significant at Type I error<0.05 **Significant at Type I error < 0.01 ***Significant at Type I error<0.001

133
Table A-13. 2004 ANOVA table for potato internal and external quality in planting date study late harvest Type III Mean Squarez
Source of Variation DF GC Green Mis shapen Rot
Total cull CRS HH IHN BC(l)
Replication 3 0.00 0.00 0.00 0.00 0.00 0.11*** 0.00 0.01 0.01
Planting Date 5 0.01*** 0.03* 0.04*** 0.84*** 0.58*** 0.19*** 0.17*** 0.18*** 0.04**
Replication*Planting Date 15 0.00 0.0 0.00 0.00 0.00 0.02 0.00 0.02 0.02*
Nitrogen Rate 1 0.00 0.00 0.00 0.00 0.00 0.00 0.00 0.00 0.00
Planting Date*Nitrogen Rate
5 0.00 0.01* 0.00 0.00 0.00 0.01 0.00 0.02 0.01
Replication*Planting Date*Nitrogen Rate
18 0.00 0.00 0.00 0.00 0.00 0.02 0.00 0.02 0.01
Variety 1 0.00 0.00 0.01** 0.00 0.00 0.32*** 0.09*** 2.09*** 0.21***
Planting Date*Variety 5 0.00 0.00 0.00 0.00 0.00 0.06** 0.25*** 0.12*** 0.03**
Nitrogen Rate*Variety 1 0.00 0.00 0.00 0.00 0.00 0.036 0.01* 0.00 0.00
Planting Date*Nitrogen Rate*Variety
5 0.00 0.00 0.00 0.00 0.001 0.00 0.00* 0.00 0.01
z*Significant at Type I error<0.05 **Significant at Type I error < 0.01 ***Significant at Type I error<0.001

134
Table A-14. 2005 ANOVA table for potato internal and external quality in planting date study late harvest Type III Mean Squarez
Source of Variation DF GC Green Mis shapen Rot
Total cull CRS HH IHN BC(l)
Replication 3 0.00 0.00 0.00 0.00 0.00 0.00 0.00 0.02 0.00
Planting Date 5 0.00 0.05*** 0.00 1.15*** 0.72*** 0.00* 0.00 0.09** 0.00
Replication*Planting Date 15 0.00 0.00 0.00 0.01 0.012 0.00 0.00 0.03 0.00
Nitrogen Rate 1 0.00 0.00 0.00 0.00 0.00 0.00 0.00 0.00 0.00
Planting Date*Nitrogen Rate
5 0.00 0.00 0.00 0.01 0.01 0.00* 0.00 0.04 0.00
Replication*Planting Date*Nitrogen Rate
18 0.00 0.00 0.00 0.00 0.00 0.00 0.00 0.00 0.00
Variety 1 0.01* 0.14*** 0.00 0.20*** 0.55*** 0.000 0.00 3.96*** 0.04**
Planting Date*Variety 5 0.00 0.01* 0.00* 0.02** 0.01 0.00* 0.00 0.09** 0.00
Nitrogen Rate*Variety 1 0.00 0.00 0.00 0.00 0.00 0.00 0.00 0.00 0.00
Planting Date*Nitrogen Rate*Variety
5 0.00 0.00 0.00 0.00 0.00 0.00* 0.00 0.04 0.00
z*Significant at Type I error<0.05 **Significant at Type I error < 0.01 ***Significant at Type I error<0.001

135
APPENDIX B ADDITIONAL DATA AND ANOVA TABLES FOR PLANT TISSUE FOR
PLANTING DATE
In this appendix are reported additional data and ANOVA tables for planting date plant and tuber tissue nutrient concentrations.

136
Table B-1. Haulm nutrient concentration (%) at tuber initiation in 2004 and 2005
Haulm Nutrient Concentration (%)
2004 2005
Main Effect TKN K P Ca TKN K P Ca
Planting Datez (PD) 1 9.5 ay 18.0 bc 0.8 a 1.4 d 9.7 a - - 1.4 d 2 8.7 ab 18.8 ab 0.7 ab 2.1 b 8.4 b-d - - 2.0 c 3 8.0 bc 14.2 d 0.7 a-c 1.9 c 7.8 d - - 2.3 b 4 8.5 a-c 17.2 c 0.8 a 2.4 a 9.1 ab - - 2.1 bc 5 7.5 cd 19.4 a 0.6 c 2.2 b 8.1 cd - - 2.2 b 6 6.6 d 15.1 d 0.6 bc 1.9 c 8.6 bc - - 2.6 a Nitrogen Rate (NR)
168 kg N ha-1 7.9 b 17.3 0.7 1.9 8.6 - - 2.1 224 kg N ha-1 8.2 a 16.7 0.7 1.9 8.6 - - 2.1 Variety (V)
Atlantic 8.1 17.1 0.7 1.8 b 8.6 - - 1.9 b Harley Blackwell 8.0 16.9 0.7 2.1 a 8.6 - - 2.2 a

137
Table B-1. Continued Haulm Concentration (%)
2004 2005
TKN K P Ca TKN K P Ca
Interaction Effectsx
PD*NR ** ns * ns ns - - ns PD*V ns ns ns * ns - - ns PD*NR*V ns ns ns ns ns - - ns zPlanting dates 1 through 6 for 2004 and 2005 were (13 Jan, 27 Jan, 9 Feb, 23 Feb, 9 Mar, 24 Mar, 2004 and 11 Jan, 25 Jan, 8 Feb, 22 Feb, 7 Mar 22 Mar, 2005). yMeans are separated with column and main effect using Tukey’s studentized range test. Means followed by different letters are significantly different at p≤ 0.05. Means with no letters are not significantly different. xns, *, **, *** non-significant or significant at p≤ 0.05, 0.01, 0.001, respectively using ANOVA.

138
Table B-2 Full flower (haulm) nutrient concentration (%) for 2004 and 2005
Haulm Nutrient Concentration (%)
2004 2005
Main Effect TKN K P Ca TKN K P Ca
Planting Datez (PD) 1 6.4 ay 14.7 ab 0.3 b 2.4 bc 6.9 ab - - 2.3 bc 2 5.8 ab 14.1 b 0.3 b 2.5 ab 7.6 a - - 2.6 ab 3 6.5 a 15.0 ab 0.5 a 2.4 bc 5.9 c - - 2.0 cd 4 4.7 c 13.8 b 0.2 b 3.1 a 7.3 ab - - 2.3 b-d 5 5.3 bc 16.2 a 0.4 a 2.6 ab 6.9 ab - - 2.9 a 6 6.4 a 13.8 b 0.5 a 2.0 c 6.8 b - - 2.0 d Nitrogen Rate (NR) - -
168 kg N ha-1 5.5 b 14.8 0.3 2.6 6.7 b - - 2.3 224 kg N ha-1 6.1 a 14.3 0.3 2.4 7.0 a - - 2.4 Variety (V) - -
Atlantic 5.9 14.5 0.4 2.3 b 7.0 - - 2.2 b Harley Blackwell 5.8 14.6 0.3 2.7 a 6.8 - - 2.5 a

139
Table B-2. Continued Haulm Nutrient Concentration (%)
2004 2005
TKN K P Ca TKN K P Ca
Interaction Effectsx
PD*NR ns ns ns ns ns - - ns PD*V ns ns ns ns ns - - ns PD*NR*V ns ns ns ns ns - - ns zPlanting dates 1 through 6 for 2004 and 2005 were (13 Jan, 27 Jan, 9 Feb, 23 Feb, 9 Mar, 24 Mar, 2004 and 11 Jan, 25 Jan, 8 Feb, 22 Feb, 7 Mar 22 Mar, 2005). yMeans are separated with column and main effect using Tukey’s studentized range test. Means followed by different letters are significantly different at p≤ 0.05. Means with no letters are not significantly different. xns, *, **, *** non-significant or significant at p≤ 0.05, 0.01, 0.001, respectively using ANOVA.

140
Table B-3 Tuber diced pieces nutrient concentration (kg ha-1) at harvest 2005 Ca TKN Planting Datez (PD)
------- kg ha-1-------
1 1.1 bc 74.3 cd 2 1.0 bc 64.6 d 3 1.4 b 87.3 bc 4 2.5 a 107.6 a 5 1.5 b 92.9 ab 6 0.7 c 47.2 e Nitrogen Rate (NR) kg ha-1
168 1.2 73.9 b 224 1.4 81.6 a Variety Atly 1.2 b 75.1 b HB 1.5 a 80.3 a Interaction effects
PD*NR ns ns PD*V ns ** PD*NR*V ns ns zPlanting dates 1 through 6 for 2005 were (11 Jan, 25 Jan, 8 Feb, 22 Feb, 7 Mar 22 Mar), respectively. yMeans are separated with column and main effect using Tukey’s studentized range test. Means followed by different letters are significantly different at p≤ 0.05. Means with no letters are not significantly different. xns, *, **, *** non-significant or significant at p≤ 0.05, 0.01, 0.001, respectively using ANOVA.

141
Table B-4. Ca++ and TKN fertilizer use efficiency (%) 2005 Ca++ TKN Planting Date (PD) -------%------- 1 6.5 c 62.9 c 2 4.9 cd 52.2 d 3 4.4 d 63.1 c 4 11.2 ab 91.6 a 5 13.6 a 81.8 b 6 9.8 b 61.4 c Nitrogen Rate (NR) kg ha-1
168 7.6 66.6 b 224 8.5 70.9 a Variety Atlantic 7.0 b 65.3 b Harley Blackwell 9.3 a 72.0 a Interaction effects
PD*NR ns ns PD*V ns ns PD*NR*V ns ns zPlanting dates 1 through 6 for 2005 were (11 Jan, 25 Jan, 8 Feb, 22 Feb, 7 Mar 22 Mar), respectively. yMeans are separated with column and main effect using Tukey’s studentized range test. Means followed by different letters are significantly different at p≤ 0.05. Means with no letters are not significantly different. xns, *, **, *** non-significant or significant at p≤ 0.05, 0.01, 0.001, respectively using ANOVA.

142
Table B-5. 2004 ANOVA table for haulm tissue at tuber initiation for planting date Type III Mean Squarez
Source of Variation DF Ca TKN
Replication 3 0.01 0.02
Planting Date 5 0.60*** 0.27***
Replication*Planting Date 15 0.00 0.01
Nitrogen Rate 1 0.00 0.01
Planting Date*Nitrogen Rate 5 0.00 0.02
Replication*Planting Date*Nitrogen Rate
18 0.00 0.00
Variety 1 0.64*** 0.00
Planting Date*Variety 5 0.01* 0.01
Nitrogen Rate*Variety 1 0.00 0.00
Planting Date*Nitrogen Rate*Variety 5 0.01 0.00 z*Significant at Type I error<0.05 **Significant at Type I error < 0.01 ***Significant at Type I error<0.001

143
Table B-6. 2004 ANOVA table for haulm tissue at full flower for planting date Type III Mean Squarez
Source DF Ca TKN
Replication 3 0.00 0.00
Planting Date 5 0.30*** 0.24***
Replication*Planting Date 15 0.03 0.02
Nitrogen Rate 1 0.06 0.20***
Planting Date*Nitrogen Rate 5 0.01 0.01
Replication*Planting Date*Nitrogen Rate
18 0.01 0.01
Variety 1 0.44*** 0.00
Planting Date*Variety 5 0.00 0.00
Nitrogen Rate*Variety 1 0.01 0.00
Planting Date*Nitrogen Rate*Variety 5 0.00 0.00 z*Significant at Type I error<0.05 **Significant at Type I error < 0.01 ***Significant at Type I error<0.001

144
Table B-7. 2005 ANOVA table for haulm tissue at tuber initiation for planting date Type III Mean Squarez
Source of Variation DF Ca TKN
Replication 3 0.00 0.00
Planting Date 5 0.64*** 0.09***
Replication*Planting Date 15 0.01 0.11
Nitrogen Rate 1 0.01 0.00
Planting Date*Nitrogen Rate 5 0.01 0.00
Replication*Planting Date*Nitrogen Rate
18 0.01 0.01
Variety 1 0.47*** 0.00
Planting Date*Variety 5 0.01 0.00
Nitrogen Rate*Variety 1 0.01 0.02
Planting Date*Nitrogen Rate*Variety 5 0.00 0.01 z*Significant at Type I error<0.05 **Significant at Type I error < 0.01 ***Significant at Type I error<0.001

145
Table B-8. 2005ANOVA table for haulm tissue at full flower Type III Mean Squarez
Source of Variation DF Ca TKN
Replication 3 0.01 0.00
Planting Date 5 0.32*** 0.11***
Replication*Planting Date 15 0.02 0.00
Nitrogen Rate 1 0.08** 0.03
Planting Date*Nitrogen Rate 5 0.03* 0.00
Replication*Planting Date*Nitrogen Rate
18 0.01 0.00
Variety 1 0.45*** 0.02
Planting Date*Variety 5 0.01 0.00
Nitrogen Rate*Variety 1 0.01 0.00
Planting Date*Nitrogen Rate*Variety 5 0.02 0.00 z*Significant at Type I error<0.05 **Significant at Type I error < 0.01 ***Significant at Type I error<0.001

146
Table B-9. 2005ANOVA table for FUE Type III Mean Squarez
Source DF Ca TKN
Replication 3 0.00 0.03*
Planting Date 5 0.07*** 0.40***
Replication*Planting Date 15 0.00 0.00
Nitrogen Rate 1 0.00 0.09**
Planting Date*Nitrogen Rate 5 0.00 0.01
Replication*Planting Date*Nitrogen Rate
18 0.00 0.00
Variety 1 0.04*** 0.07**
Planting Date*Variety 5 0.00 0.01
Nitrogen Rate*Variety 1 0.00 0.00
Planting Date*Nitrogen Rate*Variety 5 0.00 0.00 z*Significant at Type I error<0.05 **Significant at Type I error < 0.01 ***Significant at Type I error<0.001

147
Table B-10. 2005ANOVA table for tuber diced pieces for planting date Type III Mean Squarez
Source of Variation DF Ca TKN
Replication 3 0.03 0.81
Planting Date 5 1.02*** 24.98***
Replication*Planting Date 15 0.04 0.48
Nitrogen Rate 1 0.04 4.62**
Planting Date*Nitrogen Rate 5 0.03 0.44
Replication*Planting Date*Nitrogen Rate
18 0.04 0.45
Variety 1 0.40** 2.02*
Planting Date*Variety 5 0.07 1.72**
Nitrogen Rate*Variety 1 0.08 0.06
Planting Date*Nitrogen Rate*Variety 5 0.02 0.27 z*Significant at Type I error<0.05 **Significant at Type I error < 0.01 ***Significant at Type I error<0.001

148
APPENDIX C ADDITIONAL DATA AND ANOVA TABLE FOR POST HARVEST SOIL
NUTRIENTS FOR PLANTING DATE
In this appendix are reported ANOVA tables for post harvest soil sample planting date 2005.

149
Table C-1. Soil nutrient concentration (mg kg-1) post harvest 2005
Ca NH4-N NO3-N EC pH Main Effect Planting Datez (PD) ------------mg kg-1------------ dS/M 1 428.7 a 1.8 a 13.2 a 0.0 d 5.1 2 339.0 ab 1.8 a 2.1 b 0.1 c 5.8 3 289.2 b 1.1 b 1.3 b 0.4 a 5.7 4 395.5 a 1.0 b 2.3 b 0.2 bc 5.4 5 399.6 a 0.5 c 1.3 b 0.3 ab 5.2 6 414.0 a 0.5 c 1.0 b 0.3 a 5.5 Nitrogen Rate (NR) kg ha-1
168 377.7 1.0 1.9 b 0.2 5.5 224 370.9 1.0 2.5 a 0.2 5.4 Variety Atly 367.5 1.0 2.3 0.2 5.4 HB 381.2 1.0 2.1 0.2 5.5 Interaction effects
PD*NR ns ns ns ns ns PD*V ns ns ns ns ns PD*NR*V ns ns ns ns ns zPlanting dates 1 through 6 for 2005 were (11 Jan, 25 Jan, 8 Feb, 22 Feb, 7 Mar 22 Mar), respectively. yMeans are separated with column and main effect using Tukey’s studentized range test. Means followed by different letters are significantly different at p≤ 0.05. Means with no letters are not significantly different. xns, *, **, *** non-significant or significant at p≤ 0.05, 0.01, 0.001, respectively using ANOVA .

150
Table C-2. 2005 ANOVA table for post harvest soil planting date Type III Mean Squarez
Source of Variation DF Ca NH4-N NO3-N pH EC
Replication 3 0.07 0.10 0.09 0.74*** 0.00
Planting Date 5 0.24*** 15.07*** 16.74*** 0.58*** 0.11**
Replication*Planting Date
15 0.07 0.04 0.20 0.05 0.01
Fertilizer 1 0.07 0.00 1.00 0.08 0.00
Planting Date*Nitrogen Rate
5 0.04 0.04 0.16 0.02 0.00
Replication*Planting Date*Nitrogen Rate
18 0.03 0.17 0.10 0.04 0.00
Variety 1 0.05 0.00 0.00 0.00 0.00
Planting Date*Variety
5 0.04 0.04 0.06 0.01 0.00
Nitrogen Rate*Variety
1 0.03 0.16 0.01 0.02 0.00
Planting Date*Nitrogen Rate*Variety
5 0.04 0.04 0.14 0.01 0.00
z*Significant at Type I error<0.05 **Significant at Type I error < 0.01 ***Significant at Type I error<0.001

151
APPENDIX D ANOVA TABLES FOR YIELD AND QUALITY FOR IRRIGATION STUDY
In this appendix are reported ANOVA tables for irrigation study potato yield, potato external and internal quality 2004 and 2005.

152
Table D-1. 2004 ANOVA table for potato total and marketable yield and specific gravity Type III Mean Squarez
Source of Variation DF Total Mkt SG
Replication 3 958.67 390.90 0.00
Treatment 4 2671.36* 3026.64* 0.00
Replication*Treatment 12 539.41 579.74 0.00
Fertilizer 1 8025.67** 7200.62** 0.00
Treatment*Fertilizer 4 1380.67* 1387.41** 0.00
Replication*Treatment*Fertilizer
15 309.05 282.82 0.00
Side 1 310.64 400.00 0.00
Treatment*Side 3 840.93 1206.37 0.00
Fertilizer*Side 1 43.89 56.25 0.00
Treatment*Fertilizer *Side
3 4332.01* 5359.87* 0.00
z*Significant at Type I error<0.05 **Significant at Type I error < 0.01

153
Table D-2. 2004 ANOVA table for potato size class distribution and range Type III Mean Squarez
Source of Variation DF C B A1 A2 A3 A12 A23
Replication 3 7.43** 16.98** 43.60 77.54 10.14* 43.97** 106.41
Treatment 4 9.88** 32.03** 184.13 361.13** 4.83 70.64** 431.37**
Replication*Treatment 12 1.18 4.07 34.33 22.42 2.15 7.21 31.28**
Fertilizer 1 3.92 0.05 282.67 230.31** 16.93 9.81 375.96
Treatment*Fertilizer 4 3.98 3.78 39.06 58.28* 5.47 11.65 87.17
Replication*Treatment*Fertilizer
15 2.00 2.75 18.24 18.54 3.98** 8.37 36.16
Side 1 0.76 0.06 9.76 40.64 6.25* 2.25 18.06
Treatment*Side 3 6.64 5.10 7.76 53.47 1.12 18.37 47.39
Fertilizer*Side 1 1.26 3.06 3.51 43.89 2.25 7.56 25.00
Treatment*Fertilizer *Side
3 8.97 16.35 23.93 93.55 1.45 47.10 117.83
z*Significant at Type I error<0.05 **Significant at Type I error < 0.01

154
Table D-3. 2005 ANOVA table for potato total and marketable yield and specific gravity Type III Mean Squarez
Source of Variation DF Total Mkt SG
Replication 3 6693.88** 7750.64** 0.00*
Treatment 4 3041.49* 7074.20** 0.00**
Replication*Treatment 12 626.10 320.84 0.00
Fertilizer 1 11539.24** 12278.88** 0.00
Treatment*Fertilizer 4 1578.61 1602.44 0.00
Replication*Treatment*Fertilizer
15 697.75 758.68 0.00
Side 1 1650.39 1969.14 0.00
Treatment*Side 3 177.39 123.59 0.00
Fertilizer*Side 1 1991.39 1130.64 0.00
Treatment*Fertilizer *Side
3 1886.55* 1860.01* 0.00
z*Significant at Type I error<0.05 **Significant at Type I error < 0.01

155
Table D-4. 2005 ANOVA table for potato size class distribution and range Type III Mean Squarez
Source of Variation DF C B A1 A2 A3 A12 A23
Replication 3 0.31 20.77 172.17* 67.01 188.31** 25.24* 233.03*
Treatment 4 0.13 26.73* 293.96** 185.60** 104.63** 39.38** 512.41**
Replication*Treatment 12 0.22 6.36 29.033 28.76 12.04 7.08 48.49
Fertilizer 1 0.07 47.02** 435.59** 76.83 345.86** 45.11* 766.95**
Treatment*Fertilizer 4 0.09 12.26 50.46 32.83 12.51 14.37 75.95
Replication*Treatment*Fertilizer
15 0.11 5.29 38.22 25.00 14.62 5.55 32.40
Side 1 0.14 0.39 10.56 11.39 0.01 6.25 21.39
Treatment*Side 3 0.14 1.55 48.72 53.59 3.93 2.62 53.76
Fertilizer*Side 1 0.01 3.51 18.06 0.14 8.26 2.25 6.89
Treatment*Fertilizer *Side
3 0.01 3.76 89.39 79.59* 22.09 2.45 100.76
z*Significant at Type I error<0.05 **Significant at Type I error < 0.01

156
Table D-5. 2004 ANOVA table for potato external quality Type III Mean Squarez
Source of Variation DF GC Green Mis shapen Rot Total cull
Replication 3 0.045 1.21* 0.08 9.04** 11.47**
Treatment 4 0.022 0.86* 0.41* 1.23 3.42
Replication*Treatment 12 0.035 0.22 0.08 0.98 1.43
Fertilizer 1 0.004 0.30 0.30 0.18 0.11
Treatment*Fertilizer 4 0.053 0.36 0.03 0.42 0.91
Replication*Treatment *Fertilizer
15 0.037 0.52 0.21 1.21 2.44
Side 1 0.015 0.14 0.01 0.76 1.26
Treatment*Side 3 0.057 0.26 0.05 0.34 0.01
Fertilizer*Side 1 0.140 0.39 0.14 1.26 0.76
Treatment*Fertilizer *Side
3 0.015 1.43 0.18 2.68 4.84
z*Significant at Type I error<0.05 **Significant at Type I error < 0.01

157
Table D-6. 2004 ANOVA table for potato internal quality Type III Mean Squarez
Source of Variation DF CRS HH IHN BC(l)
Replication 3 7.01 1.61 746.91** 1.35
Treatment 4 17.11 0.28 471.83* 3.49
Replication*Treatment 12 11.87 0.58 110.03 2.36
Fertilizer 1 0.18 0.11 782.20** 2.55
Treatment*Fertilizer 4 1.65 1.07 79.08 7.95
Replication*Treatment *Fertilizer
15 2.52 0.78* 71.24 2.72
Side 1 33.06* 0.00 28.89 0.39
Treatment*Side 3 14.77 0.37 124.22 5.80
Fertilizer*Side 1 1.56 0.56 13.14 4.51
Treatment*Fertilizer *Side
3 5.85 0.18 139.39 6.43
z*Significant at Type I error<0.05 **Significant at Type I error < 0.01

158
Table D-7. 2005 ANOVA table for potato external quality Type III Mean Squarez
Source of Variation DF GC Green Mis shapen Rot Total cull
Replication 3 0.41 13.63** 3.56 18.81 55.95
Treatment 4 1.37* 9.32** 7.55* 239.34**
339.18**
Replication*Treatment 12 0.37 1.50 1.63 21.65 29.32
Fertilizer 1 0.01 4.90 2.90* 0.14 12.01
Treatment*Fertilizer 4 0.39 2.04 0.34 23.44 28.17
Replication*Treatment *Fertilizer
15 0.34 2.30 0.59 14.57 24.58
Side 1 0.06 2.64 0.06 2.25 7.56
Treatment*Side 3 0.06 3.68 1.27 5.79 0.89
Fertilizer*Side 1 0.06 6.89 0.06 2.25 10.56
Treatment*Fertilizer *Side
3 0.06 1.76 0.10 2.20 3.39
z*Significant at Type I error<0.05 **Significant at Type I error < 0.01

159
Table D-8. 2005 ANOVA table for potato internal quality Type III Mean Squarez
Source of Variation DF CRS HH IHN BC(l)
Replication 3 3.40** 31.97 3.04 -
Treatment 4 0.29 286.35 5.17 -
Replication*Treatment 12 0.36 113.94 3.57 -
Fertilizer 1 0.92 1084.19* 0.73 -
Treatment*Fertilizer 4 0.13 178.72** 1.63 -
Replication*Treatment *Fertilizer
15 1.62 41.95 2.18 -
Side 1 1.00 110.25 0.39 -
Treatment*Side 3 2.12 317.29* 1.43 -
Fertilizer*Side 1 1.00 105.06 2.64 -
Treatment*Fertilizer *Side
3 0.12 272.18 1.93 -
z*Significant at Type I error<0.05 **Significant at Type I error < 0.01

160
APPENDIX E ADDITIONAL DATA AND ANOVA TABLES FOR SURFACE WATER NUTRIENT
CONCENTRATION
In this appendix are reported additional data and ANOVA tables for surface water nutrient concentrations in surface wells, lysimeters as well as regression equations for surface NO3-N runoff in 2004 and 2005. Each sample time is reported separately. The tables include water nutrient concentrations of NO3-N, NH4N, P, K, and electrical conductivity.

161
Table E-1. Well NH4-N concentration (mg L-1) under varying staged leaching irrigation treatments, fertilizer source and additional sidedress in Hastings, FL in 2004 and 2005
2004 (DAP) 2005 (DAP) Main Effects 29 44 64 72 89 17 33 45 59 73 89 Datey (D) 0 WAP 2.3 1.1 0.2 0.2 0.3 2.0 0.4 bz 0.4 0.3 0.5 0.5 2 WAP 2.4 1.1 0.1 0.2 0.2 2.3 1.5 a 1.5 0.4 0.6 0.3 4 WAP 2.5 1.4 0.3 0.4 0.4 2.0 0.9 ab 1.4 0.4 0.5 1.0 8 WAP 1.8 1.3 0.4 0.3 0.3 2.1 1.0 a 0.8 0.6 0.6 0.6 12 WAP 1.6 1.4 0.2 0.2 0.4 2.0 0.6 ab 0.5 0.5 0.6 0.4 Fertilizerx (F)
CRF 2.2 1.7 0.2 0.3 0.3 1.9 0.9 0.5 0.3 0.5 0.5 AN 2.0 0.9 0.3 0.2 0.3 2.3 0.8 0.8 0.6 0.6 0.6 Sidedress (S) 0.0 kg N ha-1 - 1.3 0.2 0.2 0.3 - - 0.6 0.6 0.6 0.6 34.0 kg N ha-1 - 1.1 0.2 0.3 0.3 - - 0.6 0.2 0.5 0.4

162
Table E-1. Continued 2004 (DAP) 2005 (DAP) 29 44 64 72 89 17 33 45 59 73 89 Interaction effectsw
D*F ns ns ns ns ns ns ns ns ns ns ns D*S - ns ns ns ns - - ns ns ns ns F*S - ns ns ns ns - - ns ns ns ns D*S*F - ns ns ns ns - - ns ns ns ns zMeans followed by a different letter within columns are significantly different at the p≤ 0.05 using Tukey’s studentized range test. yWAP = weeks after planting. xCRF = controlled release fertilizer, AN = ammonium nitrate. wns, *, **, *** non-significant or significant at p≤ 0.05, 0.01, 0.001, respectively using ANOVA.

163
Table E-2. Lysimeter NH4-N concentration (mg L-1) under varying staged leaching irrigation treatments, fertilizer source and additional in Hastings, FL in 2004 and 2005
2004 (DAP) 2005 (DAP) Main Effects 30 45 65 73 90 18 34 45 60 73 89 Datey (D) 0 WAP 5.8 0.2 0.1 0.1 bz 0.1 6.3 1.6 c 1.4 b 0.1 0.4 0.0
2 WAP 5.6 1.2 0.1 0.1 b 0.2 19.5 8.4 a 6.1 a 0.2 0.6 0.0
4 WAP - 0.2 0.1 0.1 b 0.2 13.2 3.3 b 2.2 b 0.5 0.5 0.0
8 WAP - 0.1 0.1 0.4 a 0.2 11.6 1.9 c 1.7 b 0.2 0.8 0.0
12 WAP - 0.2 0.1 0.2 ab 0.3 14.0 2.2 bc 1.7 b 0.2 0.8 0.0
Fertilizerx (F)
CRF 6.8 0.2 0.1 0.2 0.2 12.6 2.5 1.9 0.2 0.7 0.0
AN 4.7 0.1 0.1 0.1 0.2 11.6 3.4 2.6 0.2 0.5 0.0
Sidedress (S)
0.0 kg N ha-1 - 0.1 0.1 0.2 0.2 - - 1.2 0.3 0.6 0.0
34.0 kg N ha-1 - 0.2 0.1 0.1 0.2 - - 0.6 0.2 0.6 0.0

164
Table E-2. Continued 2004 (DAP) 2005 (DAP) 30 45 65 73 90 18 34 45 60 73 89 Interaction effectsw
D*F ns ns ns ns ns ns ns ns ns ns *
D*S - ns ns ns ns - - ns ns ns ns
F*S - ns ns ns ns - - ns ns ns ns
D*S*F - ns ns ns ns - - ns ns ns ns zMeans followed by a different within columns letter are significantly different at the p≤ 0.05 using Tukey’s studentized range test. yWAP = weeks after planting. xCRF = controlled release fertilizer, AN = ammonium nitrate. wns, *, **, *** non-significant or significant at p≤ 0.05, 0.01, 0.001, respectively using ANOVA.

165
Table E-3. 2004 ANOVA table for well water sample 29 DAP Type III Mean Squarez
Source of Variation DF NO3-N NH4N P K EC
Replication 3 0.33 0.69 0.29* 1134.85 3.49*
Treatment 4 21.39 1.81 0.69** 1442.61 4.50*
Replication*Treatment 12 1.33 1.16 0.07 852.26 0.87
Fertilizer 1 3.07 0.23 0.05 193.92 0.99
Treatment*Fertilizer 4 1.95 0.35 0.13 54.82 2.00
Replication*Treatment*Fertilizer
15 1.47 0.70 0.12 551.52 0.72
z*Significant at Type I error<0.05 **Significant at Type I error < 0.01

166
Table E-4. 2004 ANOVA table for well water sample 44 DAP Type III Mean Squarez
Source of Variation DF NO3-N NH4N P K EC
Replication 3 0.81 0.27 0.25 738.38 3.23*
Treatment 4 16.63** 1.03 0.69** 1009.75 3.99*
Replication*Treatment 12 1.51 0.58 0.10 1094.02 0.93
Fertilizer 1 4.15 0.01 0.00 1217.28 0.26
Treatment*Fertilizer 4 1.89 0.02 0.11 206.05 1.42
Replication*Treatment*Fertilizer
15 1.60 0.21 0.13 592.14 0.70
Side 1 0.00 0.00 0.13 636.09 0.13
Treatment*Side 3 0.72 0.025 0.14 421.48 0.39
Fertilizer*Side 1 2.54 0.20 0.00 125.29 0.27
Treatment*Fertilizer *Side
3 3.60* 0.09 0.60 3580.70 0.83
z*Significant at Type I error<0.05 **Significant at Type I error < 0.01

167
Table E-5. 2004 ANOVA table for well water sample 60 DAP Type III Mean Squarez
Source of Variation DF NO3-N NH4N P K EC
Replication 3 0.81 0.57 0.25 0.13 3.23
Treatment 4 16.63** 1.76 0.69* 0.26 3.99*
Replication*Treatment 12 1.51 1.25 0.10 0.25 0.93
Fertilizer 1 4.15 0.00 0.00 0.37 0.26
Treatment*Fertilizer 4 1.89 0.40 0.11 0.08 1.42
Replication*Treatment*Fertilizer
15 1.60 0.71 0.13 0.11 0.70
Side 1 0.00 0.00 0.13 0.43 0.13
Treatment*Side 3 0.720 0.17 0.14 0.13 0.39
Fertilizer*Side 1 2.54 0.88 0.00 0.03 0.27
Treatment*Fertilizer *Side
3 3.60* 0.33 0.60 0.96* 0.83
z*Significant at Type I error<0.05 **Significant at Type I error < 0.01
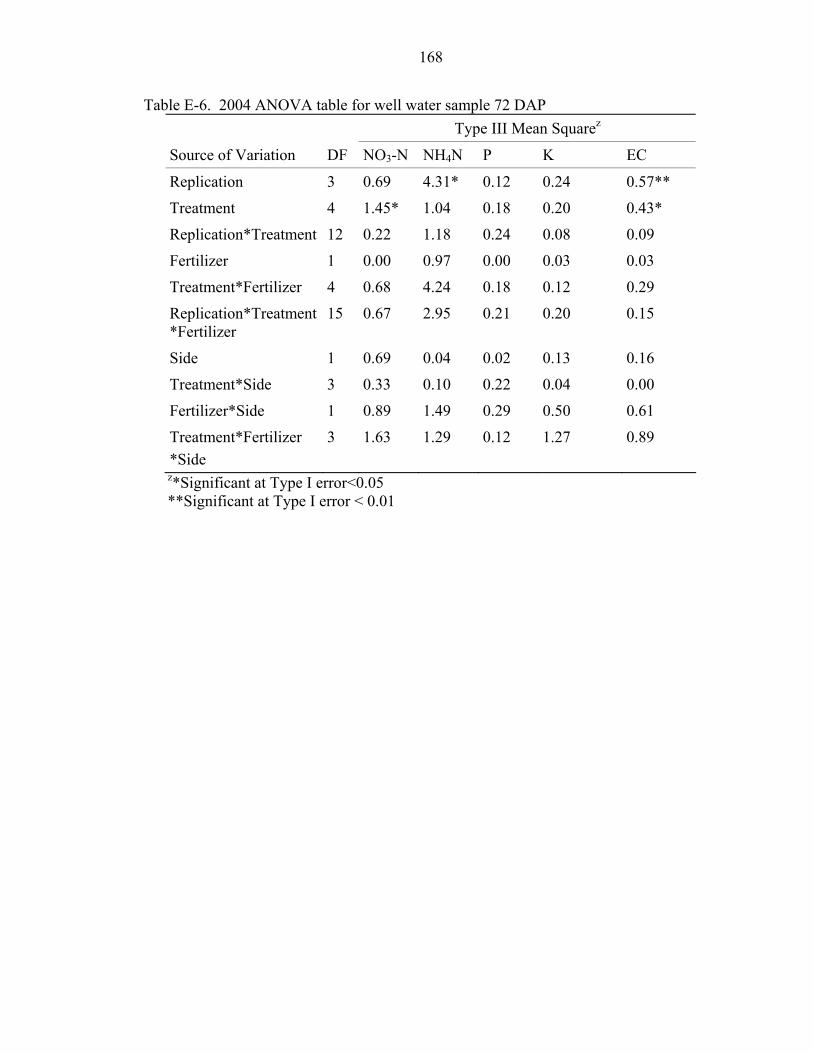
168
Table E-6. 2004 ANOVA table for well water sample 72 DAP Type III Mean Squarez
Source of Variation DF NO3-N NH4N P K EC
Replication 3 0.69 4.31* 0.12 0.24 0.57**
Treatment 4 1.45* 1.04 0.18 0.20 0.43*
Replication*Treatment 12 0.22 1.18 0.24 0.08 0.09
Fertilizer 1 0.00 0.97 0.00 0.03 0.03
Treatment*Fertilizer 4 0.68 4.24 0.18 0.12 0.29
Replication*Treatment*Fertilizer
15 0.67 2.95 0.21 0.20 0.15
Side 1 0.69 0.04 0.02 0.13 0.16
Treatment*Side 3 0.33 0.10 0.22 0.04 0.00
Fertilizer*Side 1 0.89 1.49 0.29 0.50 0.61
Treatment*Fertilizer *Side
3 1.63 1.29 0.12 1.27 0.89
z*Significant at Type I error<0.05 **Significant at Type I error < 0.01

169
Table E-7. 2004 ANOVA table for well water sample 89 DAP Type III Mean Squarez
Source of Variation DF NO3-N NH4N P K EC
Replication 3 2.92* 10.50** 3.10** 0.18 1.30**
Treatment 4 0.56 0.99 0.05 0.12 0.14
Replication*Treatment 12 0.72 0.55 0.10 0.07 0.06
Fertilizer 1 7.71* 0.00 0.00 0.13 0.03
Treatment*Fertilizer 4 0.62 0.21 0.08 0.13 0.38
Replication*Treatment*Fertilizer
15 1.15* 0.70 0.15 0.20 0.29
Side 1 1.83 0.17 0.27 0.00 0.00
Treatment*Side 3 0.26 0.77 0.14 0.39 0.31
Fertilizer*Side 1 2.14 0.84 0.07 0.10 0.06
Treatment*Fertilizer *Side
3 0.21 2.13 0.33 0.82 0.88
z*Significant at Type I error<0.05 **Significant at Type I error < 0.01

170
Table E-8. 2005 ANOVA table for well water sample 17 DAP Type III Mean Squarez
Source of Variation DF NO3-N NH4N P K EC
Replication 3 1.22 1.78 - - 1.32
Treatment 4 1.02 0.07 - - 0.36
Replication*Treatment 12 0.61 0.95 - - 0.20
Fertilizer 1 0.53 1.16 - - 0.03
Treatment*Fertilizer 4 0.32 0.84 - - 0.23
Replication*Treatment*Fertilizer
15 0.82 0.86 - - 0.50
z*Significant at Type I error<0.05 **Significant at Type I error < 0.01

171
Table E-9. 2005 ANOVA table for well water sample 33 DAP Type III Mean Squarez
Source of Variation DF NO3-N NH4N P K EC
Replication 3 0.68 4.61* - - 0.84
Treatment 4 0.89 3.66* - - 0.38
Replication*Treatment 12 0.30 0.89 - - 0.39
Fertilizer 1 0.55 0.39 - - 0.02
Treatment*Fertilizer 4 1.01 3.33* - - 0.02
Replication*Treatment*Fertilizer
15 0.79 1.88 - - 0.23
Side 1 0.04 0.01 - - 0.58
Treatment*Side 4 0.37 0.97 - - 0.08
Fertilizer*Side 1 0.71 0.48 - - 0.00
Treatment*Fertilizer *Side
4 0.88 0.86 - - 0.59
z*Significant at Type I error<0.05 **Significant at Type I error < 0.01

172
Table E-10. 2005 ANOVA table for well water sample 45 DAP Type III Mean Squarez
Source of Variation DF NO3-N NH4N P K EC
Replication 3 0.33 9.29*** - - 1.00
Treatment 4 0.79 4.61** - - 0.51
Replication*Treatment 12 0.43 1.61 - - 0.33
Fertilizer 1 0.90 3.28 - - 0.11
Treatment*Fertilizer 4 0.44 2.96* - - 0.09
Replication*Treatment*Fertilizer
15 0.33 1.53 - - 0.23
Side 1 0.01 0.01 - - 0.14
Treatment*Side 4 0.22 0.08 - - 0.11
Fertilizer*Side 1 0.61 1.25 - - 0.24
Treatment*Fertilizer *Side
4 0.53 0.32 - - 0.68
z*Significant at Type I error<0.05 **Significant at Type I error < 0.01

173
Table E-11. 2005 ANOVA table for well water sample 59 DAP Type III Mean Squarez
Source of Variation DF NO3-N NH4N P K EC
Replication 3 3.95** 4.98* - - 0.04
Treatment 4 0.63 0.27 - - 0.22
Replication*Treatment 12 0.70 1.55 - - 0.25
Fertilizer 1 2.80 0.02 - - 0.11
Treatment*Fertilizer 4 1.41 1.70 - - 0.14
Replication*Treatment*Fertilizer
15 3.38*** 1.63 - - 0.40
Side 1 0.03 4.57 - - 0.16
Treatment*Side 4 0.32 0.20 - - 0.06
Fertilizer*Side 1 0.25 2.48 - - 0.00
Treatment*Fertilizer *Side
4 0.16 0.73 - - 0.49
z*Significant at Type I error<0.05 **Significant at Type I error < 0.01

174
Table E-12. 2005 ANOVA table for well water sample 73 DAP Type III Mean Squarez
Source of Variation DF NO3-N NH4N P K EC
Replication 3 0.97 1.21 - - 0.52
Treatment 4 0.86 0.15 - - 0.39
Replication*Treatment 12 0.36 0.62 - - 0.22
Fertilizer 1 3.83* 0.80 - - 0.04
Treatment*Fertilizer 4 0.95 0.58 - - 0.02
Replication*Treatment*Fertilizer
15 3.23*** 0.72 - - 0.29
Side 1 0.04 0.04 - - 0.09
Treatment*Side 4 0.42 0.17 - - 0.02
Fertilizer*Side 1 0.90 0.00 - - 0.92
Treatment*Fertilizer *Side
4 0.31 0.74 - - 1.49*
z*Significant at Type I error<0.05 **Significant at Type I error < 0.01

175
Table E-13. 2005 ANOVA table for well water sample 89 DAP Type III Mean Squarez
Source of Variation DF NO3-N NH4N P K EC
Replication 3 0.94* 1.45 - - 0.33
Treatment 4 0.27 0.74 - - 0.41
Replication*Treatment 12 0.61 1.20 - - 0.14
Fertilizer 1 0.23 1.03 - - 0.00
Treatment*Fertilizer 4 0.31 0.84 - - 0.22
Replication*Treatment*Fertilizer
15 1.09** 0.82 - - 0.47
Side 1 0.16 0.01 - - 0.00
Treatment*Side 4 0.18 0.33 - - 0.06
Fertilizer*Side 1 0.66 0.11 - - 2.07*
Treatment*Fertilizer *Side
4 2.92** 1.04 - - 0.01
z*Significant at Type I error<0.05 **Significant at Type I error < 0.01

176
Table E-14. 2004 ANOVA table for lysimeter water sample 45 DAP Type III Mean Squarez
Source of Variation DF NO3-N NH4N P K EC
Replication 3 1741.48 1.15 4.85 0.15 10.67*
Treatment 4 719.29 0.95 4.28 0.00 0.56
Replication*Treatment 12 991.13 2.23 3.09 0.04 0.21
Fertilizer 1 2377.45 1.86 0.00 0.03 0.18
Treatment*Fertilizer 4 613.84 3.50 0.83 0.01 1.50
Replication*Treatment*Fertilizer
13 3077.44* 1.95** 4.71 0.05 1.08*
Side 1 4758.24 1.87* 3.07 0.08 0.30
Treatment*Side 2 1264.63 1.08 0.80 0.01 0.15
Fertilizer*Side 1 166.015 0.72 0.52 0.00 0.22
Treatment*Fertilizer *Side
2 3657.40 0.43 2.93 0.13 0.68
z*Significant at Type I error<0.05 **Significant at Type I error < 0.01

177
Table E-15. 2004 ANOVA table for lysimeter water sample 65 DAP Type III Mean Squarez
Source of Variation DF NO3-N NH4N P K EC
Replication 3 1.60 0.55 1.11 0.26 0.17
Treatment 4 0.85 0.85 1.67 0.07 4.88**
Replication*Treatment 12 1.46 0.48 1.70 0.11 0.68
Fertilizer 1 0.45 0.20 1.180 0.61* 0.37
Treatment*Fertilizer 4 2.74* 0.58 1.89 0.08 2.22
Replication*Treatment*Fertilizer
13 0.87 0.39 2.91 0.12 0.77
Side 1 0.00 0.72 0.01 0.00 0.14
Treatment*Side 2 0.01 0.27 0.03 0.08 0.05
Fertilizer*Side 1 0.56 6.11** 1.63 0.10 0.10
Treatment*Fertilizer *Side
2 1.03 0.02 1.13 0.39 1.40
z*Significant at Type I error<0.05 **Significant at Type I error < 0.01

178
Table E-16. 2004 ANOVA table for lysimeter water sample 73 DAP Type III Mean Squarez
Source of Variation DF NO3-N NH4N P K EC
Replication 3 0.11 2.12 32.13** 0.034 2.10
Treatment 4 0.85 4.29* 3.77 0.22 0.52
Replication*Treatment 12 0.47 1.11 2.57 0.09 0.70
Fertilizer 1 1.14 1.92 2.28 0.35 0.74
Treatment*Fertilizer 4 0.38 0.99 2.90 0.20 0.58
Replication*Treatment*Fertilizer
13 0.38 1.07 4.59* 0.21 1.11
Side 1 1.77 0.07 18.69** 0.04 0.57
Treatment*Side 2 0.48 0.35 0.65 0.24 0.79
Fertilizer*Side 1 0.30 0.20 0.33 0.47 1.58
Treatment*Fertilizer *Side
2 0.49 2.29 2.38 0.17 0.92
z*Significant at Type I error<0.05 **Significant at Type I error < 0.01

179
Table E-17. 2004 ANOVA table for lysimeter water sample 90 DAP Type III Mean Squarez
Source of Variation DF NO3-N NH4N P K EC
Replication 3 0.81 0.57 0.25 738.38 3.23*
Treatment 4 16.63** 1.76 0.69** 1009.75 3.99*
Replication*Treatment 12 1.51 1.25* 0.10 1094.02 0.93
Fertilizer 1 4.15 0.00 0.00 1217.28 0.26
Treatment*Fertilizer 4 1.89 0.40 0.11 206.05 1.42
Replication*Treatment*Fertilizer
13 1.60 0.71 0.13 592.14 0.70
Side 1 0.00 0.00 0.13 636.09 0.13
Treatment*Side 2 0.72 0.17 0.14 421.48 0.39
Fertilizer*Side 1 2.54 0.88 0.00 125.29 0.27
Treatment*Fertilizer *Side
2 3.60* 0.33 0.60 3580.70 0.83
z*Significant at Type I error<0.05 **Significant at Type I error < 0.01

180
Table E-18. 2005 ANOVA table for lysimeter water sample 18 DAP Type III Mean Squarez
Source of Variation DF NO3-N NH4N P K EC
Replication 3 4.14** 9.63*** - - 0.31
Treatment 4 0.35 2.29* - - 0.52
Replication*Treatment 12 0.28 0.74 - - 0.73
Fertilizer 1 6.59** 0.67 - - 0.61
Treatment*Fertilizer 4 0.36 0.73 - - 1.03
Replication*Treatment*Fertilizer
13 0.27 1.06 - - 0.48
z*Significant at Type I error<0.05 **Significant at Type I error < 0.01 *** significant at Type I error<0.001

181
Table E-19. 2005 ANOVA table for lysimeter water sample 34 DAP Type III Mean Squarez
Source of Variation DF NO3-N NH4N P K EC
Replication 3 1.34*** 7.22** - - 0.93
Treatment 4 0.28 6.56** - - 0.13
Replication*Treatment 12 0.07 0.42 - - 0.28
Fertilizer 1 1.46** 2.60 - - 1.90*
Treatment*Fertilizer 4 0.49* 2.03 - - 0.35
Replication*Treatment*Fertilizer
13 0.16 0.98 - - 0.58
z*Significant at Type I error<0.05 **Significant at Type I error < 0.01

182
Table E-20. 2005 ANOVA table for lysimeter water sample 45 DAP Type III Mean Squarez
Source of Variation DF NO3-N NH4N P K EC
Replication 3 0.22 10.16** - - 0.58
Treatment 4 0.07 4.71 - - 0.14
Replication*Treatment 12 0.08 0.93 - - 0.41
Fertilizer 1 1.58* 1.55 - - 1.65
Treatment*Fertilizer 4 0.10 1.49 - - 0.44
Replication*Treatment*Fertilizer
13 0.23 0.81 - - 0.41
Side 1 0.09 1.44 0.05
Treatment*Side 2 0.00 0.07 0.60
Fertilizer*Side 1 0.04 0.48 0.00
Treatment*Fertilizer *Side
2 0.50 2.03 0.26
z*Significant at Type I error<0.05 **Significant at Type I error < 0.01

183
Table E-21. 2005 ANOVA table for lysimeter water sample 60 DAP Type III Mean Squarez
Source of Variation DF NO3-N NH4N P K EC
Replication 3 0.78 13.24** - - 0.24
Treatment 4 3.63* 0.47 - - 0.09
Replication*Treatment 12 0.85 2.60 - - 0.40
Fertilizer 1 5.49* 6.39 - - 1.70*
Treatment*Fertilizer 4 0.39 2.61 - - 0.23
Replication*Treatment*Fertilizer
13 1.16 2.09 - - 0.68
Side 1 0.28 5.27 0.02
Treatment*Side 2 0.00 2.22 0.23
Fertilizer*Side 1 1.43 0.14 0.00
Treatment*Fertilizer *Side
2 1.98 1.66 0.80
z*Significant at Type I error<0.05 **Significant at Type I error < 0.01
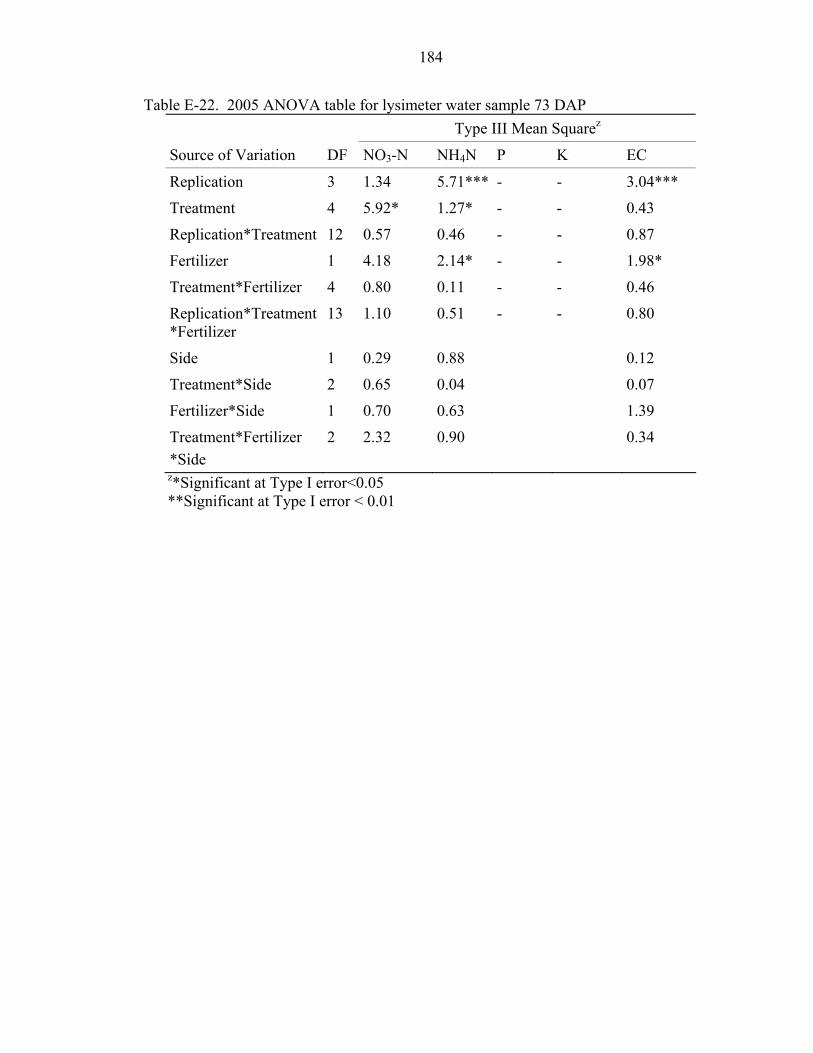
184
Table E-22. 2005 ANOVA table for lysimeter water sample 73 DAP Type III Mean Squarez
Source of Variation DF NO3-N NH4N P K EC
Replication 3 1.34 5.71*** - - 3.04***
Treatment 4 5.92* 1.27* - - 0.43
Replication*Treatment 12 0.57 0.46 - - 0.87
Fertilizer 1 4.18 2.14* - - 1.98*
Treatment*Fertilizer 4 0.80 0.11 - - 0.46
Replication*Treatment*Fertilizer
13 1.10 0.51 - - 0.80
Side 1 0.29 0.88 0.12
Treatment*Side 2 0.65 0.04 0.07
Fertilizer*Side 1 0.70 0.63 1.39
Treatment*Fertilizer *Side
2 2.32 0.90 0.34
z*Significant at Type I error<0.05 **Significant at Type I error < 0.01
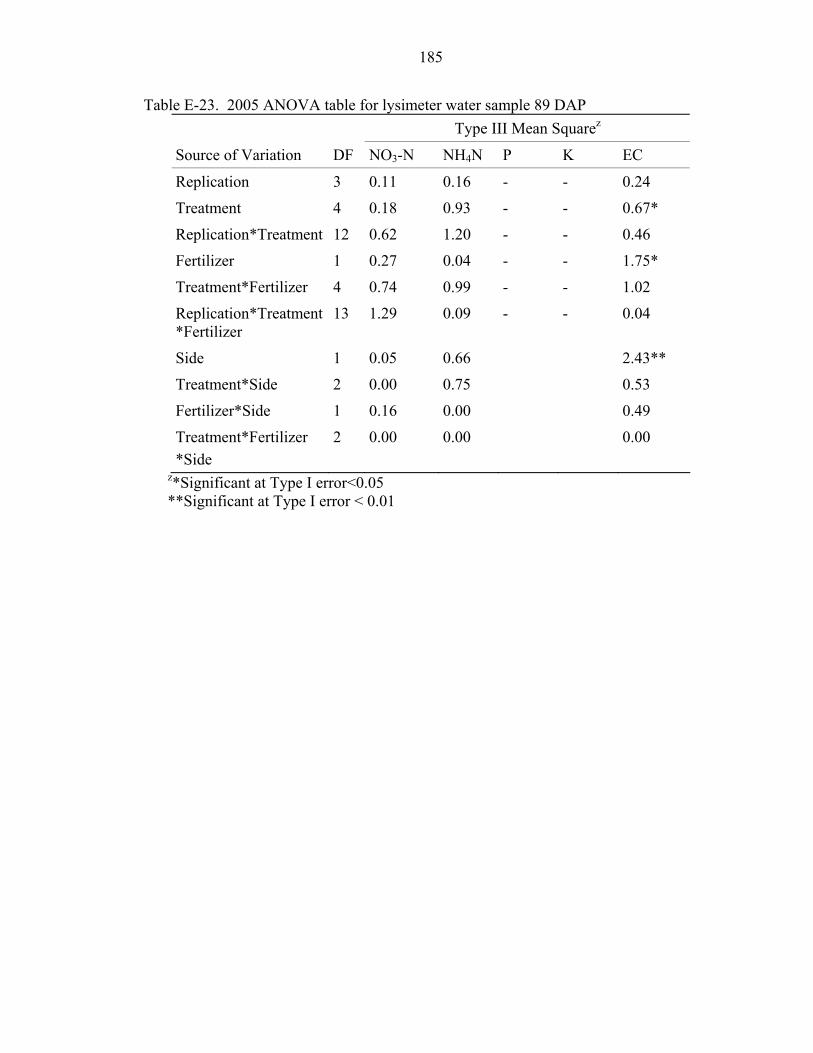
185
Table E-23. 2005 ANOVA table for lysimeter water sample 89 DAP Type III Mean Squarez
Source of Variation DF NO3-N NH4N P K EC
Replication 3 0.11 0.16 - - 0.24
Treatment 4 0.18 0.93 - - 0.67*
Replication*Treatment 12 0.62 1.20 - - 0.46
Fertilizer 1 0.27 0.04 - - 1.75*
Treatment*Fertilizer 4 0.74 0.99 - - 1.02
Replication*Treatment*Fertilizer
13 1.29 0.09 - - 0.04
Side 1 0.05 0.66 2.43**
Treatment*Side 2 0.00 0.75 0.53
Fertilizer*Side 1 0.16 0.00 0.49
Treatment*Fertilizer *Side
2 0.00 0.00 0.00
z*Significant at Type I error<0.05 **Significant at Type I error < 0.01

186
Table E-24. 2004 NO3-N concentration in surface water runoff (Figures 3.4-3.6) 2004 2 WAP
Fertilizer source
NO3-N Conc.
Intercept Linear Quadratic Cubic
Rep 1 AN NO3-N = 1257.2690 - 5.9756*t + 0.5535*t2 - 0.0028*t3 Rep 1 CRF NO3-N = 881.7719 + 1.7616*t + 0.3773*t2 - 0.0021*t3 Rep 2 AN NO3-N = 1507.6540 - 2.4254*t + 0.6182*t2 - 0.0033*t3 Rep 2 CRF NO3-N = 748.9925 - 12.0316*t + 0.5366*t2 - 0.0026*t3 Rep 3 AN NO3-N = 919.5608 - 32.8086*t + 1.1328*t2 - 0.0052*t3 Rep 3 CRF NO3-N = 1200.1280 - 25.3434*t + 0.5808*t2 - 0.0025*t3 Rep 4 AN NO3-N = 944.6789 - 36.4154*t + 0.8500*t2 - 0.0037*t3 Rep 4 CRF NO3-N = 550.9728 - 28.3725*t + 0.7326*t2 - 0.0032*t3 8 WAP Rep 1 AN NO3-N = 362.5155 + 117.4689*t - 1.1955*t2 + 0.0035*t3 Rep 1 CRF NO3-N = 2209.9310 + 30.2345*t - 0.4384*t2 + 0.0015*t3 Rep 2 AN NO3-N = 1364.8200 + 73.7360*t - 0.7496*t2 + 0.0024*t3 Rep 2 CRF NO3-N = 2810006.9 + 102.5645*t - 1.1692*t2 + 0.0035*t3 Rep 3 AN NO3-N = 1614040.6 + 187.1749*t - 2.0690*t2 + 0.0060*t3 Rep 3 CRF NO3-N = -8.9727 + 79.5071*t - 0.7062*t2 + 0.0019*t3 Rep 4 AN NO3-N = 2017.4450 + 56.2952*t - 0.6288*t2 + 0.0019*t3 Rep 4 CRF NO3-N = 832.0742 + 54.8061*t - 0.6290*t2 + 0.0020*t3 12 WAP Rep 1 AN NO3-N = 4753.4020 - 69.4826*t + 0.7071*t2 - 0.0024*t3 Rep 1 CRF NO3-N = 2043.1230 + 14.6515*t - 0.1201*t2 + 0.0002*t3 Rep 2 AN NO3-N = 3709.1410 + 7.0360*t - 0.2137*t2 + 0.0008*t3 Rep 2 CRF NO3-N = 3163.8050 - 12.0354*t + 0.0129*t2 + 0.0000*t3 Rep 3 AN NO3-N = -10912.7600 + 425.4301*t - 3.7789*t2 + 0.0106*t3 Rep 3 CRF NO3-N = 3710.6010 - 22.5319*t + 0.2206*t2 - 0.0008*t3 Rep 4 AN NO3-N = 6152.6640 - 87.7657*t + 0.7504*t2 - 0.0019*t3 Rep 4 CRF NO3-N = 3135.3690 - 60.0477*t + 0.6820*t2 - 0.0021*t3

187
Table E-25. 2005 NO3-N concentration in surface runoff (Figures 3.7-3.10) 2005 2 WAP
Fertilizer source
NO3-N Conc.
Intercept Linear Quadratic Cubic
Rep 1 AN NO3-N = 629.0319 - 4.1902*t + 0.5733*t2 - 0.0028*t3 Rep 1 CRF NO3-N = 441.6106 + 1.4065*t + 0.1690*t2 - 0.0009*t3 Rep 2 AN NO3-N = 586.369 + 51.3664*t - 0.0595*t2 - 0.0010*t3 Rep 2 CRF NO3-N = 454.3027 + 1.8442*t + 0.1989*t2 - 0.0010*t3 Rep 3 AN NO3-N = 905.4893 + 47.8330*t - 0.0834*t2 - 0.0008*t3 Rep 3 CRF NO3-N = 202.4595 - 2.6875*t + 0.3177*t2 - 0.0015*t3 Rep 4 AN NO3-N = 949.1000 + 4.4425*t + 0.4574*t2 - 0.0025*t3 Rep 4 CRF NO3-N = 260.8549 + 19.0567*t + 0.1400*t2 - 0.0012*t3 4 WAP Rep 1 AN NO3-N = 2164.3520 - 25.3937*t + 0.8207*t2 - 0.0044*t3 Rep 1 CRF NO3-N = 258.0521 + 3.6491*t + 0.5734*t2 - 0.0036*t3 Rep 2 AN NO3-N = 4647.8880 - 42.1462*t + 0.7983*t2 - 0.0042*t3 Rep 2 CRF NO3-N = 1601.3040 + 4.1128*t + 0.6093*t2 - 0.0041*t3 Rep 3 AN NO3-N = 3555.8490 - 23.4154*t 1 1.0305*t2 - 0.0061*t3 Rep 3 CRF NO3-N = 3325.5890 - 10.2819*t + 0.4723*t2 - 0.0031*t3 Rep 4 AN NO3-N = 3993.9000 - 14.7692*t + 0.6681*t2 - 0.0043*t3 Rep 4 CRF NO3-N = 2376.4190 + 38.7546*t + 0.0210*t2 - 0.0020*t3 8 WAP Rep 1 AN NO3-N = 1973.5780 + 16.4043*t + 1.2525*t2 - 0.0067*t3 Rep 1 CRF NO3-N = 923.6566 + 19.9737*t + 0.2075*t2 - 0.0015*t3 Rep 2 AN NO3-N = 2071.8450 + 143.2060*t + 0.0084*t2 - 0.0036*t3 Rep 2 CRF NO3-N = 1666.8170 + 23.7082*t + 0.1669*t2 - 0.0015*t3 Rep 3 AN NO3-N = 3316.2380 + 15.9283*t + 1.2506*t2 - 0.0067*t3 Rep 3 CRF NO3-N = 2440.5110 - 60.3510*t + 1.0669*t2 - 0.0040*t3 Rep 4 AN NO3-N = 1585.3940 + 3.9408*t + 1.3436*t2 - 0.0068*t3 Rep 4 CRF NO3-N = 889.6320 + 23.6046*t + 0.2521*t2 - 0.0018*t3 12 WAP Rep 1 AN NO3-N = 22.0378 + 143.3538*t - 3.3031*t2 + 0.0192*t3 Rep 1 CRF NO3-N = -75.5371 + 37.5613*t - 1.0098*t2 + 0.0069*t3 Rep 2 AN NO3-N = 79.4959 + 23.2340*t - 0.5233*t2 + 0.0029*t3 Rep 2 CRF NO3-N = 25.7384 + 11.5464*t - 0.2624*t2 + 0.0014*t3 Rep 3 AN NO3-N = 244.3768 + 68.7815*t - 1.4406*t2 + 0.0071*t3 Rep 3 CRF NO3-N = 228.4069 + 17.5211*t - 0.7683*t2 + 0.0071*t3 Rep 4 AN NO3-N = 76.9183 + 51.4944*t - 0.9448*t2 + 0.0038*t3 Rep 4 CRF NO3-N = 75.0206 - 4.6057*t + 0.3283*t2 - 0.0036*t3

188
APPENDIX F ADDITIONAL DATA AND ANOVA TABLES FOR TISSUE NUTRIENT
CONCENTRATION AND FUE FOR IRRIGATION STUDY
In this appendix are reported additional data tables and ANOVA tables for tissue nutrient concentrations in leaf samples, full flower haulm, tuber Ca++ and tuber TKN nutrient concentration at harvest and FUE in 2004 and 2005.

189
Table F-1·. Leaf Ca++ (%) under varying staged leaching irrigation treatments, fertilizer source and additional sidedress in Hastings, FL in 2004 and 2005
2004 (DAP) 2005 (DAP) Main Effects 36 51 67 41 74 Datey (D) 0 WAP 0.8 bz 1.0 1.6 b 0.5 b 1.3 b
2 WAP 1.0 a 1.0 1.5 b 0.6 a 1.3 b
4 WAP 0.8 b 1.0 1.6 b 0.6 ab 1.4 ab
8 WAP 0.8 b 1.1 1.9 a 0.5 b 1.5 a
12 WAP 0.8 b 1.1 1.6 b 0.5 ab 1.4 b
Fertilizerx (F)
CRF 0.9 1.1 1.7 a 0.6 1.4
AN 0.8 1.0 1.6 b 0.6 1.4
Sidedress (S)
0.0 kg N ha-1 - 1.0 1.7 - 1.3
34.0 kg N ha-1 - 1.1 1.6 - 1.4
Interaction effectsw
D*F ns ns ns ns ns D*S - ns ns - ns F*S - ns ns - ns D*S*F - ns ns - ns zMeans followed by a different letter within columns and main effects are significantly different at the p≤ 0.05 using Tukey’s studentized range test. yWAP = weeks after planting. xCRF = controlled release fertilizer, AN = ammonium nitrate. wns, *, **, *** non-significant or significant at p≤ 0.05, 0.01, 0.001, respectively using ANOVA.

190
Table F-2. Leaf TKN (%) under varying staged leaching irrigation treatments, fertilizer source and additional sidedress in Hastings, FL in 2004 and 2005 2004 (DAP) 2005 (DAP) Main Effects 36 51 67 41 74 Datey (D) 0 WAP 5.2 az 4.6 3.8 5.5 4.3
2 WAP 5.0 ab 4.9 3.7 5.3 4.4
4 WAP 5.0 ab 4.7 3.7 5.1 4.3
8 WAP 5.1 a 4.5 3.9 5.2 4.2
12 WAP 4.8 b 4.6 3.7 5.3 4.3
Fertilizerx (F)
CRF 5.1 4.6 b 3.7 b 5.2 4.2 b
AN 4.9 4.8 a 3.8 a 5.4 4.4 a
Sidedress (S)
0.0 kg N ha-1 - 4.9 3.8 - 4.3
34.0 kg N ha-1 - 4.6 3.7 - 4.3
Interaction effectsw
D*F ns ns * ns ns D*S - ns ns - ns F*S - ns ns - ns D*S*F - ns ns - ns zMeans followed by a different letter are significantly different within columns at the p≤ 0.05 using Tukey’s studentized range test. yWAP = weeks after planting. xCRF = controlled release fertilizer, AN = ammonium nitrate. wns, *, **, *** non-significant or significant at p≤ 0.05, 0.01, 0.001, respectively using ANOVA.

191
Table F-3. Full flower (haulm) nutrient uptake (kg ha-1) under varying staged leaching irrigation treatments, fertilizer source and additional sidedress in Hastings, FL in 2004 and 2005
2004 2005 Main Effects K P Ca TKN Ca TKN Datey (D) 0 WAP 50.1 1.5 22.1 24.1 14.1 60.3
2 WAP 65.1 1.9 27.1 30.0 15.8 55.6
4 WAP 52.7 1.7 24.7 25.6 16.4 60.4
8 WAP 65.5 1.9 30.2 31.8 13.6 53.3
12 WAP 54.3 1.7 23.9 26.2 14.5 57.3
Fertilizerx (F)
CRF 53.4 1.6 b 24.4 24.7 b 17.2 a 59.7
AN 60.9 1.9 a 26.3 30.2 a 12.6 b 55.0
Sidedress (S)
0.0 kg N ha-1 54.9 1.6 23.4 26.3 14.6 58.3
34.0 kg N ha-1 58.6 1.8 26.7 28.0 15.0 56.7
Interaction effectsw
D*F * * ns ns ns ns D*S ns ns ns ns ns ns F*S ns ns ns ns ns ns D*S*F ns ns ns ns ns ns zMeans followed by a different letter within columns are significantly different at the p≤ 0.05 using Tukey’s studentized range test. yWAP = weeks after planting. xCRF = controlled release fertilizer, AN = ammonium nitrate. wns, *, **, *** non-significant or significant at p≤ 0.05, 0.01, 0.001, respectively using ANOVA.

192
Table F-4. Tuber nutrient uptake (kg ha-1) at harvest under varying staged leaching irrigation treatments, fertilizer source and additional sidedress in Hastings, FL in 2004 and 2005
2004 2005 Main Effects K P Ca TKN Ca TKN Datey (D) 0 WAP 142.8 ab 11.7 az 1.5 ab 97.0 ab 1.2 75.6
2 WAP 133.4 a-c
11.5 ab 1.5 ab 94.7 ab 1.1 70.5
4 WAP 154.2 a 12.8 a 1.7 a 110.3 a 0.9 65.6
8 WAP 117.5 c 9.3 c 1.3 b 92.5 b 1.1 73.4
12 WAP 128.8 bc 9.7 bc 1.6 ab 92.3 b 1.1 70.1
Fertilizerx (F)
CRF 135.4 11.1 1.5 97.4 1.1 71.3
AN 135.0 10.8 1.5 96.9 1.0 70.7
Sidedress (S)
0.0 kg N ha-1 137.6 11.4 1.5 101.0 1.1 72.8
34.0 kg N ha-1 133.6 10.6 1.5 94.7 1.0 69.8
Interaction effectsw
D*F ns ns ns ns ns ns D*S ns ns ns ns ns ns F*S ns ns ns ns ns ns D*S*F ns ns ns ns ns ns zMeans followed by a different letter within columns are significantly different at the p≤ 0.05 using Tukey’s studentized range test. yWAP = weeks after planting. xCRF = controlled release fertilizer, AN = ammonium nitrate. wns, *, **, *** non-significant or significant at p≤ 0.05, 0.01, 0.001, respectively using ANOVA.

193
Table F-5. Fertilizer use efficiency (%) of total fertilizer applied under varying staged leaching irrigation treatments, fertilizer source and additional sidedress in Hastings, FL in 2004 and 2005 2004 2005 Main Effects Ca TKN Ca TKN Datey (D)
0 WAP 14.7 64.4 abz 7.4 66.3
2 WAP 13.4 61.2 bc 8.1 61.8
4 WAP 14.7 68.2 a 8.4 62.4
8 WAP 12.2 56.8 c 7.1 62.1
12 WAP 12.4 55.2 c 7.5 62.4
Fertilizerx (F)
CRF 15.0 a 66.8 a 9.4 a 68.7 a
AN 12.0 b 54.9 b 6.1 b 57.2 b
Sidedress (S)
0.0 kg N ha-1 13.0 63.1 7.6 64.8
34.0 kg N ha-1 13.8 60.0 7.8 61.8
Interaction effectsw
D*F ns ** ns ns D*S ns ns ns ns F*S ns ns ns ns D*S*F ns ns ns ns zMeans followed by a different letter within columns are significantly different at the p≤ 0.05 using Tukey’s studentized range test. yWAP = weeks after planting. xCRF = controlled release fertilizer, AN = ammonium nitrate. wns, *, **, *** non-significant or significant at p≤ 0.05, 0.01, 0.001, respectively using ANOVA.

194
Table F-6. SPAD leaf chlorophyll values under varying staged leaching irrigation treatments, fertilizer source and additional sidedress in Hastings, FL in 2004 and 2005
2004 (DAP) 2005 (DAP) Main Effects 42 60 73 85 38 51 68 84 Datey (D) 0 WAP 43.4 43.6 bcz 52.9 33.3 47.4 a 77.0 47.1 36.4
2 WAP 43.3 45.1 a 36.1 36.4 43.2 c 50.1 48.3 37.6
4 WAP 43.0 43.4 bc 34.9 34.9 42.9 c 50.2 48.4 37.3
8 WAP 42.3 42.4 c - - 45.0 b 50.3 46.5 37.1
12 WAP 42.2 43.9 b 34.6 34.6 44.9 b 50.6 46.7 37.8
Fertilizerx (F)
CRF 41.9 b 42.4 b 46.7 34.6 47.1 a 59.8 46.6 b 36.1 b
AN 43.8 a 44.9 a 34.9 35.0 42.2 b 51.5 48.2 a 38.3 a
Sidedress (S)
0.0 kg N ha-1 - 43.6 34.0 34.2 - 50.2 469 36.7 b
34.0 kg N ha-1 - 43.7 48.8 35.7 - 69.1 48.2 37.9 a

195
Table F-6. Continued 2004 2005
42 60 73 85 38 51 68 84 Interaction effectsw D*F ns ns ns ns ns ns ns ns D*S ns ns ns ns ns ns ns ns F*S ns ns ns ns ns ns ns ns D*S*F ns ns ns ns ns ns ns ns zMeans followed by a different letter within columns are significantly different at the p≤ 0.05 using Tukey’s studentized range test. yWAP = weeks after planting. xCRF = controlled release fertilizer, AN = ammonium nitrate. wns, *, **, *** non-significant or significant at p≤ 0.05, 0.01, 0.001, respectively using ANOVA.

196
Table F-7. 2004 ANOVA table for leaf tissue 36 DAP Type III Mean Squarez
Source of Variation DF P K Ca TKN
Replication 3 0.02** 0.01 0.02 0.01*
Treatment 4 0.00 0.00 0.09** 0.01
Replication*Treatment 12 0.00 0.00 0.00 0.00
Fert 1 0.01 0.00 0.01 0.02
Treatment*Fertilizer 4 0.00 0.00* 0.00 0.00
Replication*Treatment *Fertilizer
15 0.00 0.00 0.00 0.00
z*Significant at Type I error<0.05 **Significant at Type I error < 0.01

197
Table F-8. 2004 ANOVA table for leaf tissue 51 DAP Type III Mean Squarez
Source of Variation DF P K Ca TKN
Replication 3 0.14** 0.02* 0.06** 0.05**
Treatment 4 0.00 0.00 0.00 0.00
Replication*Treatment 12 0.00 0.00 0.00 0.00**
Fertilizer 1 0.01 0.10** 0.00 0.04**
Treatment*Fertilizer 4 0.01 0.00 0.01 0.00
Replication*Treatment *Fertilizer
15 0.01** 0.00 0.01 0.00
Side 1 0.00 0.00 0.00 0.01*
Treatment*Side 2 0.00 0.00 0.00 0.00
Fertilizer*Side 1 0.00 0.00 0.00 0.00
Treatment*Fertilizer *Side
2 0.00 0.01 0.00 0.00
z*Significant at Type I error<0.05 **Significant at Type I error < 0.01

198
Table F-9. 2004 ANOVA table for leaf tissue 67 DAP Type III Mean Squarez
Source of Variation DF P K Ca TKN
Replication 3 0.04** 0.05** 0.09** 0.05**
Treatment 4 0.01** 0.02** 0.12** 0.00
Replication*Treatment 12 0.00 0.00 0.01 0.00
Fertilizer 1 0.00 0.10** 0.09** 0.02*
Treatment*Fertilizer 4 0.00 0.00 0.00 0.01*
Replication*Treatment *Fertilizer
15 0.00 0.00 0.00 0.00
Side 1 0.00 0.00 0.02 0.00
Treatment*Side 2 0.00 0.00 0.00 0.00
Fertilizer*Side 1 0.00 0.00 0.00 0.00
Treatment*Fertilizer *Side
2 0.00 0.01 0.00 0.00
z*Significant at Type I error<0.05 **Significant at Type I error < 0.01

199
Table F-10. 2004 ANOVA table for full flower haulm Type III Mean Squarez
Source of Variation DF P K Ca TKN
Replication 3 0.17 0.02 0.20 8.70
Treatment 4 0.17 0.22 0.22 249.61
Replication*Treatment 12 0.12 0.15 0.12 128.44
Fertilizer 1 0.72* 0.44 0.32 873.39*
Treatment*Fertilizer 4 0.52* 0.56* 0.38 367.30
Replication*Treatment *Fertilizer
15 0.14 0.15 0.19 172.02
Side 1 0.36 0.13 0.52 175.88
Treatment*Side 3 0.07 0.15 0.11 24.82
Fertilizer*Side 1 0.00 0.12 0.00 5.144
Treatment*Fertilizer *Side
3 0.13 0.10 0.15 227.23
z*Significant at Type I error<0.05

200
Table F-11. 2004 ANOVA table for tuber tissue at harvest Type III Mean Squarez
Source of Variation DF P K Ca TKN
Replication 3 0.19** 0.12* 0.11 0.19**
Treatment 4 0.26** 0.16** 0.19* 0.08*
Replication*Treatment 12 0.02 0.02 0.04 0.02
Fertilizer 1 0.01 0.00 0.00 0.00
Treatment*Fertilizer 4 0.02 0.03 0.05 0.03
Replication*Treatment *Fertilizer
15 0.02 0.04 0.07 0.04
Side 1 0.01 0.00 0.08 0.04
Treatment*Side 3 0.00 0.01 0.01 0.00
Fertilizer*Side 1 0.01 0.02 0.22 0.00
Treatment*Fertilizer *Side
3 0.12 0.09 0.11 0.02
z*Significant at Type I error<0.05 **Significant at Type I error < 0.01

201
Table F-12. 2005 ANOVA table for leaf tissue 41 DAP Type III Mean Squarez
Source of Variation DF Ca TKN P K
Replication 3 0.11** 0.00 - -
Treatment 4 0.09** 0.00 - -
Replication*Treatment 12 0.01 0.00 - -
Fertilizer 1 0.04 0.01* - -
Treatment*Fertilizer 4 0.00 0.00 - -
Replication*Treatment *Fertilizer
15 0.02 0.00 - -
z*Significant at Type I error<0.05 **Significant at Type I error < 0.01

202
Table F-13. 2005 ANOVA table for leaf tissue 74 DAP Type III Mean Squarez
Source of Variation DF Ca TKN P K
Replication 3 0.00 0.01*** - -
Treatment 4 0.02* 0.00 - -
Replication*Treatment 12 0.00 0.00 - -
Fertilizer 1 0.00 0.03*** - -
Treatment*Fertilizer 4 0.01* 0.00 - -
Replication*Treatment *Fertilizer
15 0.01 0.00
Side 1 0.02 0.00
Treatment*Side 3 0.00 0.00
Fertilizer*Side 1 0.00 0.00
Treatment*Fertilizer *Side
3 0.00 0.00 - -
z*Significant at Type I error<0.05 **Significant at Type I error < 0.01 ***Significant at Type I error < 0.001

203
Table F-14. 2005 ANOVA table for full flower haulm tissue Type III Mean Squaresz
Source of Variation DF Ca TKN P K
Replication 3 0.14*** 0.00 - -
Treatment 4 0.08*** 0.00 - -
Replication*Treatment 12 0.00 0.00 - -
Fertilizer 1 0.70*** 0.01* - -
Treatment*Fertilizer 4 0.00 0.00 - -
Replication*Treatment*Fertilizer
15 0.01* 0.00
Side 1 0.07*** 0.00
Treatment*Side 3 0.01 0.00
Fertilizer*Side 1 0.00 0.00
Treatment*Fertilizer *Side
3 0.00 0.00 - -
z*Significant at Type I error<0.05 **Significant at Type I error < 0.01 ***Significant at Type I error< 0.001

204
Table F-15. 2005 ANOVA table for nutrient tuber tissue Type III Mean Squarez
Source of Variation DF Ca TKN P K
Replication 3 0.10 1.88* - -
Treatment 4 0.03 0.78 - -
Replication*Treatment 12 0.04 0.20 - -
Fertilizer 1 0.04 0.04 - -
Treatment*Fertilizer 4 0.02 0.78 - -
Replication*Treatment*Fertilizer
15 0.01 0.67
Side 1 0.00 0.56
Treatment*Side 3 0.03 0.04
Fertilizer*Side 1 0.00 0.80
Treatment*Fertilizer *Side
3 0.00 1.02 - -
z*Significant at Type I error<0.05
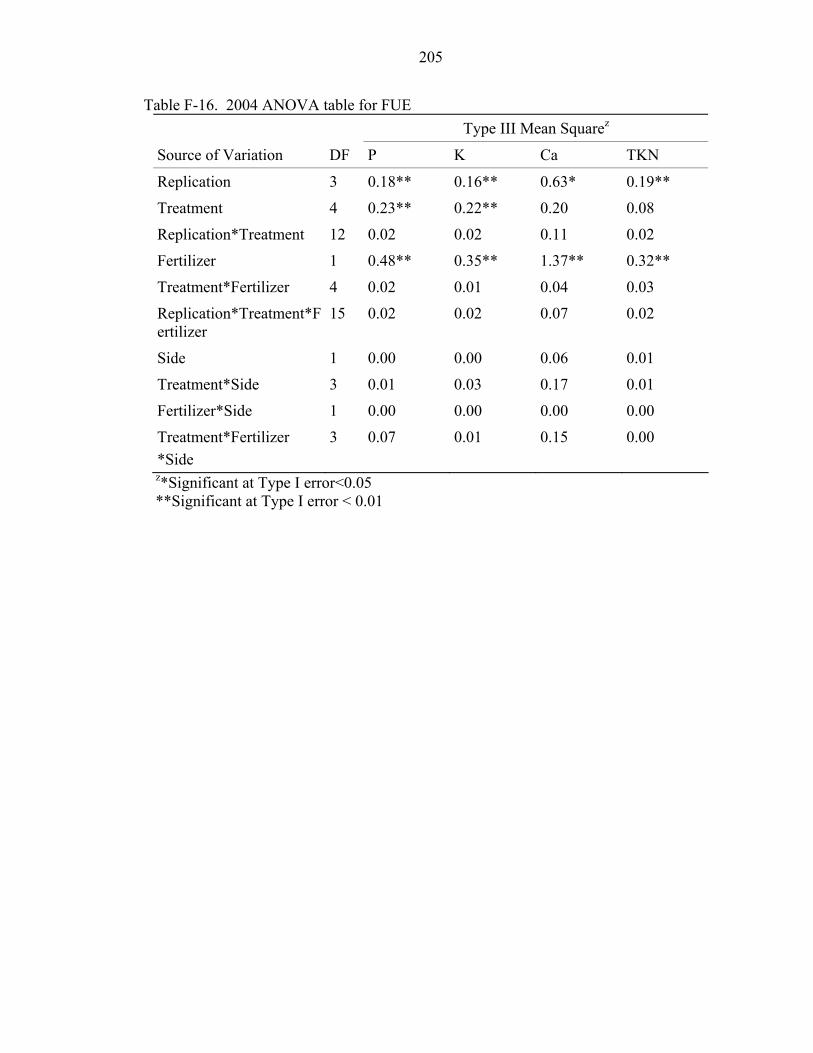
205
Table F-16. 2004 ANOVA table for FUE Type III Mean Squarez
Source of Variation DF P K Ca TKN
Replication 3 0.18** 0.16** 0.63* 0.19**
Treatment 4 0.23** 0.22** 0.20 0.08
Replication*Treatment 12 0.02 0.02 0.11 0.02
Fertilizer 1 0.48** 0.35** 1.37** 0.32**
Treatment*Fertilizer 4 0.02 0.01 0.04 0.03
Replication*Treatment*Fertilizer
15 0.02 0.02 0.07 0.02
Side 1 0.00 0.00 0.06 0.01
Treatment*Side 3 0.01 0.03 0.17 0.01
Fertilizer*Side 1 0.00 0.00 0.00 0.00
Treatment*Fertilizer *Side
3 0.07 0.01 0.15 0.00
z*Significant at Type I error<0.05 **Significant at Type I error < 0.01

206
Table F-17. 2005 ANOVA table for FUE Type III Mean Squarez
Source of Variation DF Ca TKN P K
Replication 3 0.01*** 0.06* - -
Treatment 4 0.00 0.00 - -
Replication*Treatment 12 0.00 0.01 - -
Fertilizer 1 0.07*** 0.28*** - -
Treatment*Fertilizer 4 0.00 0.01 - -
Replication*Treatment*Fertilizer
15 0.00 0.01
Side 1 0.00 0.01
Treatment*Side 3 0.00 0.00
Fertilizer*Side 1 0.00 0.01
Treatment*Fertilizer *Side
3 0.00 0.01 - -
z*Significant at Type I error<0.05 **Significant at Type I error < 0.01 ***Significant at Type I error< 0.001

207
Table F-18. 2004 ANOVA table for SPAD 2004 and 2005 Type III Mean Squarez
Source of Variation DF 2004 2005
Replication 3 16.37 11.83
Treatment 8 29.47* 10.09
Replication*Treatment 24 9.34 4.59
Fertilizer 1 136.71* 14.52
Treatment*Fertilizer 8 13.88 3.48
Replication*Treatment*Fertilizer
27 19.52** 4.93
Time 3 1441.04** 2403.60**
Treatment*Time 20 9.13 13.43* z*Significant at Type I error<0.05 **Significant at Type I error < 0.01

208
208
APPENDIX G ADDITIONAL DATA AND ANOVA TABLES FOR SOIL NUTRIENT
CONCENTRATION
In this appendix are reported additional data tables and ANOVA tables for soil nutrient concentrations at post harvest and pre/post irrigation events. The data tables include soil nutrient concentrations at post harvest of Ca, NO3-N and NH4N. The ANOVA tables include soil nutrient concentrations at post harvest of P, K, Ca, Mg, NO3-N, NH4N, EC, pH, and OM.

209
Table G-1. Post harvest soil nutrient concentration Ca, NH4-N, and NO3-N (mg kg -1) under varying staged leaching irrigation treatments, fertilizer source and additional sidedress in Hastings, FL in 2004 and 2005
2004 2005 Main Effects Ca NH4-N NO3-N Ca NH4-N NO3-N Datey (D) 0 WAP 503.0 9.6 9.9 326.3 1.6 1.6 bz
2 WAP 517.5 8.8 10.5 326.1 1.3 1.7 b
4 WAP 476.1 10.2 9.2 293.3 1.3 1.7 b
8 WAP 471.6 8.2 9.7 306.2 1.3 2.6 ab
12 WAP 484.5 7.9 6.5 296.6 1.5 3.4 a
Fertilizerx (F)
CRF 498.5 9.0 9.6 319.2 1.8 a 2.8 a
AN 482.2 8.8 8.5 299.9 1.1 b 1.6 b
Sidedress (S)
0.0 kg N ha-1 488.1 10.1 a 11.2 a 305.3 1.4 1.8
34.0 kg N ha-1 491.7 8.2 b 7.8 b 312.2 1.5 2.4
Interaction effectsw D*F ns ns ns ns ns ns D*S ns * ns ns ns ns F*S ns ns ns ns ns ns D*S*F ns ns ns ns ns ns zMeans followed by a different letter within columns are significantly different at the p≤ 0.05 using Tukey’s studentized range test. yWAP = weeks after planting. xCRF = controlled release fertilizer, AN = ammonium nitrate. wns, *, **, *** non-significant or significant at p≤ 0.05, 0.01, 0.001, respectively using ANOVA.

210
210
Table G-2. 2004 ANOVA table for post harvest soil nutrient concentration 106 DAP Type III Mean Squarez
Source DF P C M NH4N NO3-N EC pH OM
Replication 3 0.18** 0.04* 0.17** 0.70** 0.21 0.96** 0.76** 0.01
Treatment 4 0.00 0.02 0.05 0.12 0.24 0.05** 0.00 0.04
Replication*Treatment 12 0.00 0.00 0.02 0.07 0.08 0.00 0.05 0.017
Fertilizer 1 0.00 0.02 0.04 0.00 0.32 0.03 0.01 0.00
Treatment*Fertilizer 4 0.00 0.00 0.00 0.08 0.13 0.11 0.11 0.02
Replication*Treatment *Fertilizer
15 0.01 0.00 0.02 0.07 0.14 0.07 0.08 0.01
Side 1 0.01 0.00 0.03 0.55 1.07 0.00 0.00 0.01
Treatment*Side 3 0.03 0.01 0.02 0.22 0.04 0.11 0.08 0.01
Fertilizer*Side 1 0.00 0.00 0.00 0.14 0.00 0.01 0.01 0.00
Treatment*Fertilizer *Side
3 0.02 0.01 0.07 0.09 0.03 0.05 0.00 0.01
z*Significant at Type I error<0.05 **Significant at Type I error < 0.01

211
211
Table G-3 2005 NOVA table for post harvest soil nutrient concentration 106 DAP Type III Mean Squarez
Source DF Ca NH4N NO3-N pH Ec
Replication 3 0.28*** 0.07 0.18 0.77*** 0.04**
Treatment 4 0.04** 0.14 1.32*** 0.06 0.01
Replication*Treatment 12 0.00 0.17 0.19 0.01 0.00
Fertilizer 1 0.06** 4.74*** 5.65*** 0.06 0.02
Treatment*Fertilizer 4 0.04** 0.18 0.15 0.04 0.00
Replication*Treatment *Fertilizer
15 0.07*** 0.26 0.16 0.08** 0.00
Side 1 0.03 0.04 0.11 0.20** 0.00
Treatment*Side 3 0.01 0.34 0.17 0.00 0.02
Fertilizer*Side 1 0.00 0.14 0.02 0.01 0.00
Treatment*Fertilizer *Side
3 0.01 0.22 0.09 0.00 0.01
z*Significant at Type I error<0.05 **Significant at Type I error < 0.01 ***Significant at Type I error<0.001

212
Table G-4. 2004 Equality of variances for pre-post soil nutrient concentration at irrigation treatment 2 WAP
Equality of Variances
Variable Method Numerator DF
Denominator DF
F Value Pr>F
P Folded F 3 3 5.36 0.2016
K Folded F 3 3 12.77 0.0650
Ca Folded F 3 3 4.00 0.2850
Mg Folded F 3 3 2.09 0.5596
EC Folded F 3 3 13.89 0.0579
pH Folded F 3 3 2.84 0.4145
NH4N Folded F 3 3 1.95 0.5976
NO3-N Folded F 3 3 1.62 0.7009
OM Folded F 3 3 10.21 0.0880

213
Table G-5. 2004 Equality of variances for pre-post soil nutrient concentration at irrigation treatment 8 WAP
Equality of Variances
Variable Method Numerator DF
DenominatorDF
F Value Pr>F
P Folded F 3 3 3.80 0.3017
K Folded F 3 3 6.45 0.1601
Ca Folded F 3 3 1.04 0.9767
Mg Folded F 3 3 1.42 0.7802
EC Folded F 3 3 6.23 0.1673
pH Folded F 3 3 6.81 0.1493
NH4N Folded F 3 3 2.07 0.5648
NO3-N Folded F 3 3 2.04 0.5740
OM Folded F 3 3 2.23 0.5268

214
Table G-6. 2004 Equality of variances for pre-post soil nutrient concentration at irrigation treatment 12 WAP
Equality of Variances
Variable Method Numerator DF
DenominatorDF
F Value Pr>F
P Folded F 3 3 10.06 0.0897
K Folded F 3 3 1.30 0.8336
Ca Folded F 3 3 4.38 0.2565
Mg Folded F 3 3 2.70 0.4358
EC Folded F 3 3 1.52 0.7392
pH Folded F 3 3 10.55 0.0843
NH4N Folded F 3 3 1.91 0.6073
NO3N Folded F 3 3 2.26 0.5205
OM Folded F 3 3 1.34 0.8142

215
Table G-7. 2005 Equality of variances for pre-post soil nutrient concentration at irrigation treatment 2 WAP
Equality of Variances
Variable Method Numerator DF
DenominatorDF
F Value Pr>F
P Folded F 3 3 2.28 0.5167
K Folded F 3 3 4.65 0.2388
Ca Folded F 3 3 2.02 0.5780
Mg Folded F 3 3 1.06 0.9617
NH4N Folded F 3 3 5.09 0.2144
NO3-N Folded F 3 3 7.43 0.1336

216
Table G-8. 2005 Equality of variances for pre-post soil nutrient concentration at irrigation treatment 4 WAP
Equality of Variances
Variable Method Numerator DF
DenominatorDF
F Value Pr>F
P Folded F 3 3 2.78 0.4239
K Folded F 3 3 50.90 0.0090
Ca Folded F 3 3 2.15 0.5466
Mg Folded F 3 3 1.25 0.8574
NH4N Folded F 3 3 2.45 0.4804
NO3-N Folded F 3 3 7.47 0.1328

217
Table G-9. 2005 Equality of variances for pre-post soil nutrient concentration at irrigation treatment 8 WAP
Equality of Variances
Variable Method Numerator DF
DenominatorDF
F Value Pr>F
P Folded F 3 3 6.20 0.1684
K Folded F 3 3 1.42 0.7809
Ca Folded F 3 3 1.72 0.6662
Mg Folded F 3 3 1.37 0.8014
NH4N Folded F 3 3 3.63 0.3181
NO3-N Folded F 3 3 3.77 0.3048

218
Table G-10. 2005 Equality of variances for pre-post soil nutrient concentration at irrigation treatment 12 WAP
Equality of Variances Variable Method Numerator
DF Denominator DF
F Value Pr > F
P Folded F 3 3 2.64 0.4457
K Folded F 3 3 1.95 0.5959
Ca Folded F 3 3 1.15 0.9127
Mg Folded F 3 3 1.88 0.6161
NH4N Folded F 3 3 415.17 0.0004
NO3-N Folded F 3 3 2.62 0.4492

219
LIST OF REFERENCES
Bailey, G.W., and T.E. Wadell. 1979. Best management practices for agriculture and silviculture: An integrated overview. p. 33-56. In R.C. Loehr et al. (ed.) Best management practices for agriculture and silviculture. Science Publishers, Ann Arbor, MI.
Beltsville Agricultural Research Center. 2004. Vegetable lab news. ww.barc.usda.gov. (last accessed Apr. 2005).
Burton, W.G. 1989a. The origin and spread of the potato pp 1-34. In The Potato 3rd (ed.) New York: John Wiley & Sons. 1989.
Burton, W. G. 1989b. Specific gravity as a guide to the content of dry matter and of starch in potato tubers, p. 599-601. In: W. G. Burton, 3rd (ed.), The Potato. John Wiley and Sons, Inc., New York.
Burton, W. G. 1989c. Yield and content of dry matter:1. pp. 85-155. In: W. G. Burton, 3rd (ed.), The Potato. John Wiley and Sons, Inc., New York.
Cantwell, M. 1996. A review of important facts about potato glycoalkaloids. Perishables handling newsletter. August 87:26-27.
Clough, G.H. 1994. Potato tuber yield, mineral concentration and quality after calcium fertilization. J. Amer. Soc. of Hort. Sci. 119:175-179.
Dufault, R. J. 1997. Determining heat unit requirements for broccoli harvest in coastal South Carolina. J. Amer. Soc. Hort. Sci. 122(2):169-174.
Elkashif, M.E., and S.J. Locascio. 1983. Isobutylidene diurea and sulfur-coated urea as N sources for potatoes. J. of Amer. Soc. of Hort. Sci. 108(4):523-526.
Environmental Protection Agency. Non-point source pollution: The nations largest water quality problem. Pointer No. 1. Website: www.epa.gov (last accessed 02/15/06).
Errebhi, M., C. J. Rosen, S. C. Gupta, and D. E. Birong. 1998. Potato yield response and nitrate leaching as influenced by nitrogen management. Agron. J. 90 (1) 10-15 Jan/Feb.
Folsom, D. 1945. Potato varieties: The newly named, the commercial, and some that are useful in breeding. Amer. Potato J. 22:229-242.

220
Gunter, C., S. Ozgen, B. Karlsson and J. P. Paltoa. 2000. Calcium application at pre-emergence and during bulking may improve tuber quality and grade. HortSci. 35:498.
Hawkins, A. 1967. From Lake Titicaca to New England – The trail of the ‘Irish’ potato to its new national monument. Amer. Potato J. 44:224-226.
Henninger, M.R., S. B. Sterrett and K. G. Haynes. 2000. Broad-sense heritability and stability of internal heat necrosis and specific gravity in tetraploid potatoes. Crop Sci. 40:977-984.
Hensel, D. R. 1964. Irrigation of potatoes at Hastings, Florida. Soil and Crop Sci. Soc. of Florida. 24: 105-110.
Hochmuth, G., E. Hanlon, G. Kidder, D. Hensel, W. Tilton, J. Dilbeck, and D. Schrader. 1993. Fertilization demonstrations for the Tri-County potato production area of Northeast Florida. Proceedings of the Florida State Horticultural Society. 106: 190-198.
Hochmuth G., E. Hanlon, B. Hochmuth, G. Kidder, and D. Hensel. 1993. Field fertility research with P and K for vegetables – interpretations and recommendations. Soil Crop Science Society Florida Proceedings 52:95-101.
Hoover, M. W. 1955. Some effects of temperature upon the growth of southern peas. Proc. Amer. Soc. Hort. Sci. 668:308-314.
Hutchinson, C.M., J.M. White, and D.P. Weingartner. 2002. Chip potato varieties for commercial production in Northeast Florida. . EDIS, Florida Cooperative Extension Service Publication HS878. http://edis.ifas.ufl.edu/cv280 (last accessed 01/02/06).
Hutchinson, C. M., W. A. Tilton, P. K. Livingston-Way, and G. J. Hochmuth. 2002. Best management practices for potato production in Northeast Florida. EDIS, Florida Cooperative Extension Service Publication HS877. Last accessed 01/02/06.
Hutchinson C. M., and E. H. Simonne. 2003. Controlled-release fertilizer opportunities and costs for potato production in Florida. EDIS, Florida Cooperative Extension Service Publication HS-941.
Hutchinson, C. M., E. H. Simonne, G. J. Hochmuth, D. N. Maynard, W.M. Stall, T. A. Kucharek, Se. E. Webb, T. G. Taylor, and S. A. Smith. 2004. Potato production in Florida, p. 259-272. In: Vegetable production handbook for Florida.
Hutchinson, C. M. 2005. Influence of a controlled release nitrogen fertilizer program on potato (Solanum tuberosum L.) on tuber yield and quality. ActaHort. 684:99-102.

221
Iritani, W. M., L. D. Weller, and N. R. Knowles. 1984. Factors influencing incidence of internal brown spot in Russet Burbank potatoes. Amer. Potato J. 61:335-343
Lee, G. S., S. B. Sterrett, and M. R. Henninger. 1992. A heat-sum model to determine yield and onset of internal heat necrosis for Atlantic potato. Amer. Potato J. 69:353-362.
Larson, R. H., and A. R. Albert. 1949. Relation of potato varieties to incidence of physiological internal tuber necrosis. Amer. Potato J. 26:427-431.
Lu, Hsiu-Ying, Chun-Tang Lu, Lit-Fu Chan, and Meng-Li Wei. 2001. Seasonal variation in linear increase of taro harvest index explained by growing degree days. Agron. J. 93:1136-1141.
Maynard, D. N., and O. A. Lorenz. 1979. Controlled-release fertilizers for horticultural crops. Horticultural Reviews. 1:79-140.
Mengel, K. and E. A. Kirkby. 1987. Calcium. In Mendel and Kirbys(4th ed). Principles of Plant Nutrition (pp 455-480). International Potash Institute. Bern, Switzerland
Munoz, F. 2004. Improving nitrogen management in potatoes through crop rotation and enhanced uptake. Ph.D Dissertation.
Mylavarapu, R.S., and E.S. Kennelley. 2002. UF/IFAS Extension Soil Testing Laboratory (ESTL) Analytical procedures and training manual. University of Florida, IFAS. Extension Circular 1248. 18pp
National Potato Council. The potato. Website: http://www.nationalpotatocouncil.org. (last accessed April 2004).
Novak, V.J.,G. D. Mann, and G. N. Schradter. 1986. Effects of age at harvest and irrigation near maturity on the incidence of internal brown fleck in potato tubers. Aust. J. Exp Agric. 26:129-132.
Ojala, J.C., J.C. Stark, and G. E. Kleinkopf. 1990. Influence of irrigation and nitrogen management on potato yield and quality. Amer. Potato J. 67: 29-43.
Ozgen, S. B., H. Karlsson, and J. P. Palta. 2006. Response of potatoes (cv. Russet Burbank) to supplemental calcium applications under field conditions: Tuber calcium, yield and cncidence of internal brown spot. Amer. J. of Potato Res. 83:195-204.
Palta J. P. 1996. Role of calcium in plant responses to stresses: Linking basic research to the solution of practical problems. HortSci. 31(1):51-57.
Perry K. B., T. C. Wehner, and G. L. Johnson. 1986. Comparison of 14 methods to determine heat unit requirements for cucumber harvest. HortSci. 21(3):419-423.

222
Peterson, R. L. W. G. Barker, and M. J. Howarth. 1985. Development and structure of tubers. In Potato Physiology pp 123-152. Academic Press, Inc., London.
Sands, P. J., C. Hackett, and H. A. Nix. 1979. A model of the development and bulking of potatoes (Solanum tuberosum L.). I. Derivation from well-managed field crops. Field Crops Res. 2:309-331.
SAS Institue. 2004. SAS/STAT statistical analysis system manual (V. 9.0) SAS Inst., Cary, N.C.
Shoji, S., and A. T. Gandeza. 1992. Controlled Release Fertilizers with Polyolefin Resin Coating, Development, Properties and Utilization. Konno Printing Co., Ltd. Japan. pp.92.
Silva, G.H., R. W. Chase, R. Hammerschmidt, M. L. Vitosh, and R. B. Kitchen. 1991. Irrigation, nitrogen and gypsum effects on specific gravity and internal defects of Atlantic potatoes. Amer. Potato J. 68:751-765
Singleton, V.D. 1990. Investigation of potato water use in the Tri-County area of Putnam, St. Johns, and Flagler Counties, Florida. St. Johns River Water Management District Technical Publication SJ 90-13.
Sterrett, S. B., M. R. Henninger, and G. S. Lee. 1991. Relationship of internal heat necrosis of potato to time and temperature after planting. J. Amer. Soc. Hort. Sci 116(4):697-700.
Sterrett, S.B., G. L. Lee, M. R. Henninger, and M. Lentner 1991. Predictive model for onset and development of internal heat necrosis of ‘Atlantic’ potato. J. Amer Soc. Hort. Sci. 116(4):701-705.
Sterrett, S.B., and M.R. Henninger. 1991. Influence of calcium on internal heat necrosis of Atlantic potato. Amer. Potato J. 68:467-477.
Sterrett, S.B., and C.P. Savage. 1993. Yield and development of internal heat necrosis affected by foliar fertilization. Amer. Potato J. 70:844 (Abstract)
Sterrett, S.B., and M.R. Henninger. 1997. Internal heat necrosis in the MidAtlantic region – influence of environment and cultural management. Am. Potato J. 74: 233-243.
Sterrett. S. B., K. G. Haynes, G. C. Yencho, M. R. Henninger and B. T. Vinyard. 2006. 4x-2x potato clones with resistance or susceptibility to internal heat necrosis differ in tuber mineral status. Crop Science. 46: 1471-1478.
Stevenson, W.R., R. Loria, G.D. Franc, and D.P. Weingartner. 2001. Physiological disorders of tubers: Internal symptoms. In Compendium of potato diseases 2nd ed. Minnesota: American Phytopathological Society.

223
Tisdale S.L., W. L. Nelson, J. D. Beaton, and J. L. Havlin. 1993. Soil Fertility and Fertilizers. Prentice-Hall, Englewood Cliffs, NJ. pp90-91.
Trenkel, M. E. 1997. Controlled-release and stabilized fertilizers in agriculture. In Improving Fertilizer Use Efficiency. International Fertilizer Industry Association. Paris. pp151.
Tzeng, K.C., A. Kelman, K.E. Simmons, and K.A. Kelling. 1986. Relationship of calcium nutrition to internal brown spot of potato tubers and sub-apical necrosis of sprouts. Amer. Potato J. 63: 87-97.
United States Department of Agriculture. 1978. United States standards for grades of potatoes for chipping http://www.ams.usda.gov/standards/potatoch.pdf (last accessed Apr 2005).
U. S. Department of Agriculture (USDA). 1983. Soil survey St. Johns County, Soil Conservation Service. 196 pp.
Varvel, G. E., and T. A. Peterson. 1991. Nitrogen fertilizer recovery by grain sorghum in monoculture and rotation Systems. Agron. J. 83(3):617-622.
Waddell, J. T., S. C. Gupta, J. F. Moncrief, C. J. Rosen, and D. D. Steele. 1999. Irrigation and nitrogen management effects on potato yield, tuber quality, and nitrogen uptake. Agron. J. 91(6) 991-997 November/December.
Wang, F. L., and A. K. Alva. 1996. Leaching of nitrogen from slow-release urea sources in sandy soils. Soil Science Society of America. Journal. 60: 1454-1458.
Wannamaker, M.J., and W.W. Collins. 1992. Effect of year, location and harvest on susceptibility of cultivars to internal heat necrosis in North Carolina. Amer. Potato J. 69: 221-228.
Webb, R.E., D. R. Wilson, J.R. Shumaker, B. Graves, M.R. Henninger, J. Watts, J.A. Frank, and H.J. Murphy. 1978. Atlantic: A new potato variety with high solids, good processing quality, and resistance to pests. Amer. Potato J. 55:141-145.
Weingartner, D.P., and D.R. Hensel. 2003. History and agricultural contributions o f the University of Florida, IFAS, Hastings Research and Education Center, 1923 to 2002. Proc. Fla. State Hort. Soc. 116:143-151.
Winkler, E. 1971. Kartoffelbau in Tirol. II. Photosynthesevermögen and respiration von verschiedenen Kartoffelsorten. Potato Res. 14:1-18.
Witzig, J.D., and N.L. Pugh. 2004. Florida Agricultural Statistics Service. Quick stats – vegetables. Website: http://www.nass.usda.gov/fl (last accessed 05/04)

224
Zvomuya, F, C. J. Rosen, M. P. Russelle, and S. C. Gupta. 2003. Nitrate leaching and nitrogen recovery following application of polyolefin-coated urea to potato. J. Env. Qual 32(2) 480-489 Mar/Apr.

225
BIOGRAPHICAL SKETCH
Christine M. Worthington was born in Omaha, Nebraska, on August 15, 1964. In
1983 she completed high school in Hewitt, Texas. Soon after high school she married
and had two children: Ashley, born in 1984, and Jevin, born in 1986. In 1989 she was
divorced with two small children. She made the decision to go back to college in 1994 at
Richland Community College in Dallas, Texas, from 1994 to 1996. She was accepted to
Texas A & M University in College Station, Texas, in 1996, where she received a B. S. in
agronomy in 1999. She moved to Canyon, Texas, in December of 1999 to pursue a
Master of Science in agriculture. She received her M.S. in environmental soil and plant
science from West Texas A & M University in 2001. Upon graduation from West Texas
A & M, she and her children moved to Gainesville, Florida, to pursue a Doctor of
Philosophy in horticultural sciences. After getting her degree, she plans to continue her
professional career in agricultural and environmental research.