Time Spent in Household Management: Evidence and Implicationswinklera/JFIE 2008 final June...
36
Time Spent in Household Management: Evidence and Implications Anne E. Winkler and Thomas R. Ireland University of Missouri-St. Louis June 16, 2008 Resubmitted to Journal of Family and Economic Issues (version with tables attached) The authors thank Michael T. Allison for programming assistance. In addition, the authors are grateful for comments on earlier versions from Reed Olsen, Sabrina Pabilonia, Robert Pollak, David Rose, Leslie Stratton, and participants at the Washington University seminar on Work, Family and Public Policy. Author Affiliations: Anne E. Winkler, Professor of Economics, U.M.-St. Louis and Thomas R. Ireland, Professor Emeritus, U.M. St. Louis. Address for both authors: Department of Economics, University of Missouri-St. Louis, One University Boulevard, St. Louis, MO 63121. E-mail: [email protected] and [email protected].
-
Upload
truongtuong -
Category
Documents
-
view
213 -
download
0
Transcript of Time Spent in Household Management: Evidence and Implicationswinklera/JFIE 2008 final June...
Time Spent in Household Management:
Evidence and Implications
Anne E. Winkler and Thomas R. Ireland
University of Missouri-St. Louis
June 16, 2008
Resubmitted to Journal of Family and Economic Issues
(version with tables attached)
The authors thank Michael T. Allison for programming assistance. In addition, the
authors are grateful for comments on earlier versions from Reed Olsen, Sabrina
Pabilonia, Robert Pollak, David Rose, Leslie Stratton, and participants at the Washington
University seminar on Work, Family and Public Policy.
Author Affiliations: Anne E. Winkler, Professor of Economics, U.M.-St. Louis and
Thomas R. Ireland, Professor Emeritus, U.M. St. Louis. Address for both authors:
Department of Economics, University of Missouri-St. Louis, One University Boulevard,
St. Louis, MO 63121. E-mail: [email protected] and [email protected].

1
Time Spent in Household Management: Evidence and Implications
Abstract This study investigates time spent in household management, an important
"missing ingredient" in time use studies, using data from the American Time Use Survey
(ATUS). These data indicate that adults spend an average of just over 1.5 hours per week
in this function. This figure is likely an underestimate of total management time because
1) management is often done in small blocks, and hence, may be missed; and 2) the
ATUS fails to capture secondary activities. Thus, efforts to value time spent in
household management using these data will similarly produce a low valuation of the
household manager role. Notably, measured management time is found to be much more
equally distributed among spouses than time spent in core housework tasks.
Keywords: Economics of the Family, Household Management, Household Production,
Time Use

2
Introduction
Households purchase or produce a range of goods and services including meals,
clean clothes, gardening, bill paying, and child care. In time use studies, the amounts of
time that family members spend on these tasks are well-captured (e.g. Bianchi, et al.
2000; Sayer 2005). The ―missing ingredient‖ is the process by which a family
determines the quality and quantity of various goods and services to be provided, by
whom, and how adequate provision will be monitored. Household management is much
more than just ―paying bills.‖ It plays an over-arching role in all household production.
The critical role of household management as part of household production has received
considerable attention in family economics, including the publication of the
seminal text by Deacon and Firebaugh, Family Resource Management (1988) and in
empirical research, including a recent paper by Orrange, Firebaugh, & Heck (2003). At
the same time, this function has been virtually ignored in the time use literature with the
exception of Mederer (1993).
The conceptualization of household management described here was recognized
as early as 1861 in Isabella Beeton’s The Book of Household Management. She wrote:
―AS WITH THE COMMANDER OF AN ARMY, or the leader of any enterprise, so it is
with the mistress of a house.‖ Similarly, in Bridenstine v. Iowa City Electric Railway
Company (1917), the Iowa Supreme Court, ruling on how damages should be determined
in the death of a homemaker, said that juries should provide:
―fair consideration of all the evidence tending to show the condition, capacity and
efficiency of the deceased in the discharge of her domestic duties, not only as a
laborer performing menial service, but also as the housewife and head and
administrator of the internal affairs of her home.‖

3
The critical function of a household manager is also recognized in the commercial
marketplace of 2007. Firms and individuals offer such services under the occupational
title of ―Personal Assistant,‖ ―Personal Concierge Service,‖ or ―Professional Organizer.‖
These firms advertise the time savings that can be realized by hiring an outside person to
perform such household managerial functions as making travel arrangements, event
planning, filing, scheduling a painter, and finding a dog kennel. The presence of a
national organization, the National Association of Professional Organizers, is an indicator
of the maturation of this industry. Full-time organizers appear to earn anywhere from
$25,000-$120,000 per year, though some specific services are available at an hourly rate
of $30-$50 an hour (Bick 2006; Buntic 2007).
This study seeks to fill the gap in the time use literature by taking advantage of
newly available data from the American Time Use Survey (ATUS), initiated by the U.S.
Bureau of Labor Statistics in 2003. These data provide the best-available national
estimates of time spent in household management. This study has implications for a
number of areas of research including the gender division of time spent in household
labor, and ongoing efforts to place a dollar value on time spent in household activities,
including household management.
Related Time Use Literature
The literature devoted to time use in household production tasks is large and burgeoning.
Social scientists have examined social and economic factors associated with the
distribution of housework tasks in married-couple and cohabiting families (e.g. Bittman
et al. 2003; Blair and Lichter 1991; Bonke et al. 2007; Estes et al. 2007; Hersch and

4
Stratton 1997; and South and Spitze 1994;), trends in the gender division of housework
(e.g. Bianchi et al. 2000; Sayer 2005), and the impact of specialization in household tasks
on a range of outcomes including wages, divorce, self-employment, and stress (e.g.
Hundley, 2000; MacDonald et al. 2005; Stratton 2001; and Weagley et al. 2007). A
common feature of these studies is that they focus on household production tasks. While
―paying bills‖ may be included as a task, these studies fail to capture time spent in
household management, broadly defined.
The one important exception is Mederer (1993). Her study explicitly focused on
the critical distinction between time spent in the household managerial function versus
time spent performing tasks. She defined household tasks as those that are performed on
behalf of household members (cooking and laundry) and activities required to keep up
the household itself (cleaning, yard work, paying bills). Household management activities
referred to time allocated to planning meals, getting things ready for the next day,
scheduling appointments for household members and for household services and repairs,
and making ―money decisions.‖ Using data from a 1989 survey of state of Rhode Island
employees, her paper explored gender differences in time spent in management versus
time spent in production tasks and perceptions of fairness regarding time allocation.
Direct comparisons with her empirical work, unfortunately, are limited by the fact that
survey respondents were asked to provide information about who undertook specific
management activities and household tasks (wife always, wife usually, equally divided
between respondent, spouse and/or children, spouse usually, spouse always) rather than
length of time in various activities, information collected in standard time use surveys
such as the ATUS.

5
A few studies have utilized some of the information on household management
time provided in the ATUS for the explicit purpose of valuing time spent in this function.
They offer no discussion, however, about correlates with time spent in this function, what
insights these data might provide regarding the gender division of labor, nor an
assessment of whether these data are adequate for their intended purpose – valuation of
time spent in this function. For instance, Landefeld et al. (2005) included a very narrow
measure of time spent in household management, basically the record-keeping function,
in estimates of nonmarket activity that are subsequently incorporated into ―satellite‖
national accounts. Time spent in household production as well as a value placed on this
function has also been calculated in the publication called Dollar Value of a Day
(Expectancy Data 2005), a data source for forensic economists.1 Finally, in their study
on valuing child care time, Folbre and Yoon (2005) included time spent in household
management on children’s behalf, though again, this function is not the focus of their
paper.2 The detailed data examination undertaken here has important implications for
these valuation studies, as will be discussed.
1 Forensic economists are those called upon to testify in the case of wrongful death or permanent disability.
U.S. courts have long held that household services, broadly defined, can be reasonably included as an
element in damages resulting from a personal injury or wrongful death, though most studies neglect this
factor (Ireland 1997). One example is provided in the decision of the U.S. Supreme Court in a very early
decision under the Federal Employer’s Liability Act (FELA), the case of Michigan Central Railroad
Company v. Vreeland, 227 U.S. 59 (1913). The Supreme Court held that a broad interpretation of
household services is in order when calculating damages, but that the calculations must be based on some
standard and must not include emotional losses, but only pecuniary losses of the surviving spouse. Under
the Vreeland decision, the loss of household services may be recoverable if they meet two criteria: (1) the
service must be valuable even if provided by a stranger (third party); and (2) the service must have a market
equivalent in the commercial market (Ireland 1997). Household management meets these ―tests.‖ 2 Craig (2007) also includes some aspects of management-related child care such as communication with
child care workers, but she does not make an explicit distinction between time spent in management-related
activities vs. production tasks.
6
The Household Management Function
A family can be viewed as a production unit, akin to a firm that functions in the
commercial marketplace (Becker 1991). As discussed in Deacon and Firebaugh (1988),
the household manager combines household inputs to provide household outputs.
Managing involves a series of steps involving setting goals, planning, implementing, and
evaluating results obtained.3 Among the decisions to be made, the household manager
must determine which services will be provided in-house by family members and which
services are going to be purchased from the commercial marketplace.4
The existing research literature sheds light on expected patterns regarding time
spent in household management. As will be seen shortly, a large proportion of household
management time is spent on financial affairs. Time use evidence on the narrower
financial category of ―bill paying‖ indicates that financial management tends to be a
fairly gender neutral activity. For instance, Blair and Lichter (1991) and Bianchi et al.
(2000) found ―bill paying‖ to be much less sex-typed than household cleaning and
laundry, which are strongly ―female tasks,‖ or car maintenance, a strongly ―male‖ task.
These authors, among others, suggest that factors including gender role ideology and
relative economic resources of spouses are important explanatory factors behind the sex-
typing of household activities. The literature on how couples manage money, though not
focused on time use per se, similarly suggests that money management is not sex-typed.
While husbands tend to be in charge of financial affairs in traditional families, wives tend
3 A leading textbook in the field of management (Robbins and DeCenzo, 2005) provides a similar
description of business management: planning (defining goals and how to achieve them), organizing
(identifying set of tasks to be done and by whom), leading (motivating and resolving conflicts), and
controlling (monitoring). 4 While not the focus of this study, the management role is even more complex in families operating their
own businesses. See Avery et al. (2000), Duncan et al. (2000), Fitzgerald et al. (2001), Lee et al. (2006a),
Lee et al. (2006b), and Philbrick and Fitzgerald (2007).

7
to control family finances in lower-income families, and in higher income families,
wives’ financial role in the household increases with her own earnings (Mano-Negrin and
Katz 2003; and Pahl 2000). Thus, it is expected that the gender division of time in
household management will be more equal than for core housework activities.
In addition to managing financial affairs, household management time also
includes time spent outsourcing activities, such as child care and house cleaning.
Outsourcing, while important, is not typically captured in time use analyses. This
omission is important because outsourcing may be an important explanation behind
recent declines in time spent performing housework tasks (Bianchi et al. 2000). That is,
it may not be that houses are (much) dirtier, but rather that someone outside of the
household is doing the cleaning. Ideally, to fully investigate recent trends, one would
want a data set that includes information on both expenditures on outsourcing and time
devoted to it, but no such data set exists. However, information on time spent purchasing
household services such as cleaning services and child care, as captured in the ATUS,
provides at least some insight into households’ outsourcing activities, alongside time
spent performing production tasks. Previous researchers examining expenditures on
outsourced goods and services found that that families with greater household resources
(as measured by income and/or educational attainment) spent significantly more money
on these activities given their greater financial means (De Ruijter et al. 2005). Similarly,
one would expect such households to spend more time outsourcing, at least to some
degree.
While all households must allocate at least some time to management during the
course of a week, a study by Hochschild (1997) on the time bind suggests that household

8
management is especially critical to the successful operation of dual-earner households
juggling paid work and family. In her book, she referred to the management function
required in these families as the ―third shift.‖ Consistent with Hoschschild’s argument,
Orrange et al. (2003) found that the level of household management in dual-earner
couples, as gauged by the score on a management scale developed in earlier research, was
positively and significantly associated with spouses’ work hours and the presence of
small children. One would similarly expect a positive association between these factors
and time spent in household management.
It is possible to speculate on other likely correlates with household management
time, as well. For instance, time spent in household management is expected to be higher
among retirees than those in their twenties, both because they have more financial affairs
to manage, and also because they have more available time to do so. In addition, older
Americans may have difficulties undertaking some specific household tasks themselves
such as cleaning gutters, raking leaves, and shoveling snow, which would increase time
spent outsourcing these activities.
The relationship between education and household management is theoretically
ambiguous. On the one hand, highly-educated individuals have more valuable assets to
manage and/or superior management skills that they can put to this task. Further, more
highly-educated individuals tend to have greater resources and so are financially able to
outsource more tasks, which in turn requires some management time. On the other hand,
these same individuals are also more likely to use time-saving technology such as on-line
banking (Kolodinsky et al. 2004), and would also be expected to be more efficient
managers of time, given the higher opportunity cost for the use of their time.

9
Measuring Time Spent in Household Management
This section examines the usefulness of available data sets in providing information on
time spent in management and provides best available estimates. U.S. time use surveys,
with the exception of the American Time Survey (ATUS), whether based on a time diary
or direct question format, provide only limited information on this topic. For instance, the
Panel Study of Income Dynamics (PSID), which is the basis for much of the analysis on
gender differences in housework, asks respondents a very broad, direct question: ―About
how much time do you spend on housework in the average week—I mean time spent
cooking, cleaning and other work around the house?‖ Responses may or may not include
time spend in the household management function since it is not part of the example.
Moreover, with such a general question, respondents’ perceptions of what constitutes
―housework‖ likely differ considerably. The National Survey of Families and
Households (NSFH) takes a slightly more nuanced approach and asks direct questions
about nine specific household tasks including laundry, cleaning house, and paying bills.
While one might regard paying bills as part of the management function, this activity
constitutes only a small part of this set of activities.
Time diary methods are generally regarded as the superior method for obtaining
information on time use, though again, prior surveys have incompletely captured time
spent on household management. In a time diary survey, respondents are asked to report
on their activities and how long they engaged in them over a recent period.5 Well-known
time diary surveys include those conducted by the University of Michigan (1965, 1975,
5 For discussions regarding time use data sets and methodology, see Marini and Shelton (1993), National
Research Council (2000), and Robinson (1996).

10
1981-82) and subsequently by the University of Maryland (1985, 1992-94, 1995, 1997-
98). These survey data are coded using the categories set forth by Szalai (1972). Szalai
created 96 detailed codes including code 19, ―dealing with bills and various other
papers.‖ A recent study by Bianchi et al. (2000), which used data from the 1965, 1975,
1985, and 1995 time diary surveys, reported information on this very narrow category
separately and included it as part of total household time.
The richest data set on information on time spent in household management in the
U.S. is the American Time Use Survey (ATUS), conducted by the Bureau of Labor
Statistics. This ongoing survey, initiated in 2003, reflects the U.S. government’s first-ever
effort to systematically collect information on how Americans spend their time.
The ATUS sample is collected as follows: one randomly selected individual (age 15+) is
interviewed from selected households completing the 8th
(final) month of the Current
Population Survey. At the ATUS interview, which occurs 2 to 5 months after the final
CPS interview, each ATUS respondent completes a time diary, in which he or she records
activities completed, as well as their duration, over the course of the prior 24-hour
period.6 The respondent systematically records information on primary activities, as well
as time spent in secondary child care, defined as having ―a child under age 13 in one’s
care while doing other things‖ (US Bureau of Labor Statistics 2006).
The scheme used by the ATUS to code time diary reports most closely follows the
scheme used in the 1997 Australian Survey, and provides a much finer level of detail than
Szalai’s (Shelley 2005): It has 17 major categories (coded with 2 digits), 105 second tier
activities (coded with 4 digits), and 438 third tier activities (coded with 6 digits). The
6 Specifically, the respondent reports on activities that took place from 4:00 a.m. on the day prior to the
ATUS interview through 4:00 a.m. on the day of the ATUS interview.
11
first tier category of Household Activities (02) includes 2nd
tier activities such as
Housework (0201) and Food and Drink Prep (0202), and most notably, Household
Management (0209).
This study examines three definitions of household management using data from
the ATUS, for purposes of sensitivity testing. The narrowest is titled ―ATUSmanage‖
and employs the same definition as in published reports by the Bureau of Labor Statistics
(BLS 2005; BLS 2006). This definition includes the following third tier categories
within Household Management: Financial Management, Household Personal Planning
and Organization and Household Security but excludes time spent on Personal and
Household Mail and E-mail. Appendix A provides details.
A second, somewhat broader measure, is titled DVDmanage. This measure
replicates the categories included in the definition of household management from the
publication The Dollar Value of a Day (also called, DVD, Expectancy Data, 2005). This
measure is defined as ATUSmanage plus handling Household and Personal Mail and
Messages, Using Paid Child Care Services, Using Banking and other Financial Services,
Using Legal Services, Activities related to Real Estate, and Using Social Services.
The third and broadest measure is titled ExpandedDVD. This measure includes
categories contained in DVDmanage plus other management activities identified in the
ATUS but not previously included: Organizing and Planning for Household Children
and Household Adults, Comparison Shopping, Purchasing Household Services, and Calls
related to Purchasing Household Services and Child-Related Services.
In addition to the three measures of household management, this study also
examines two broader measures of household activities, labeled here as ALLHH and

12
FAMILYCARE. ALLHH is defined as household tasks (principally housework) plus
associated management time, and FAMILYCARE is defined as ALLHH plus time spent
shopping and caring for household family members, plus associated management time.7
Appendix A provides detailed definitions and codes for all five measures.
Despite the usefulness of the ATUS in better identifying management activities
than in past U.S. surveys, these data nevertheless provide a conservative estimate of time
spent managing the household for two reasons. First, the ATUS asks about primary
activities only. Thus, it will miss secondary management time. For instance, an
individual who is scheduling appointments on the phone while loading the dishwasher
may report, ―loading the dishwasher‖ as the primary activity. The focus on primary
activities is perhaps even more problematic in calculating time spent in household
management for paid workers, to the extent that they ―organize their lives‖ at the remote
or home office. The ATUS would likely capture the primary activity as, ―at paid
employment‖ but completely miss time at work spent surfing the internet to plan
vacations or time spent on the phone scheduling home repairs or interviewing nannies.
And with the advent of cell phones, individuals may be driving around and scheduling
their appointments at the same time (National Research Council 2005, p. 49).
A second difficulty in fully capturing time spent in management is that this
activity, albeit important, is often done throughout the day in very small blocks of time.
Like any activity of short duration, it may not be counted and/or may be forgotten. In
other instances, you need a large block of time, such as when managing financial affairs.
7 While household management time is included in these aggregates, such time is very low as a proportion
of the total. Thus, they largely reflect time spent in household production tasks.

13
Thus, it is not all too surprising that individuals either report spending zero minutes on
this activity on a given interview day, or as much as an hour.8
Another limitation of the ATUS data, which is characteristic of the majority of
time diary data sets, is that they provide information on just one respondent per
household (Winkler 2002). Nonetheless, these data can be used to draw inferences about
the average amount of time that husbands and wives, though not married to one another,
spend in management and household tasks.9
Evidence on Time Spent in Household Management from the ATUS
This section analyzes data on time spent in household management from the combined
2003 and 2004 ATUS surveys to gauge the sensitivity of estimates obtained to the
definition used and to identify key correlates. The primary sample consists of any adult
respondent in the ATUS who is age 18 and over and is 1) the reference person of their
household; or 2) the spouse of the reference person; or 3) an unmarried partner of the
reference person. The sample thereby excludes 19 year olds who live in their parents’
household as well as married persons who head subfamilies living in the household of
another family. The total sample size is 30,032 based on data from the ATUS 2003 and
2004 surveys. When the data is broken out by marital status, the sample is further
restricted to couples where both spouses are ages 20 or older to eliminate teen couples.
8 For an excellent discussion of the challenges of measuring and interpreting how individuals spend their
time, see Fenstermaker (1996). 9 For further discussion, see Schwartz et al. (2002). Alternatively, Connelly and Kimmel (2007) utilize a
matching process to produce ―synthetic couples,‖ thereby permitting a comparison of time usage on a given
interview day of a matched wife and husband. This approach is not without its drawbacks, including the
issue of whether the interview day is representative of the two partners’ time use patterns, especially for
tasks that are performed irregularly.

14
For each ATUS respondent, the following information is available: 1) time diary
data that is collected at the ATUS interview; 2) data on usual hours worked and other
variables from the set of CPS questions administered at the time of the ATUS interview;
and 3) data on usual hours worked and educational attainment from the linked CPS
survey administered 2-5 months prior to the ATUS survey.
The ATUS collects information on time use, measured in minutes per day, for
both weekdays and weekend days. In a number of the tables presented here, these data
are converted into average weekly hours, since this is the standard unit of time reported in
the time use literature and permits a direct comparison. Average weekly hours are
calculated as a weighted sum that counts weekdays as five-sevenths and weekends as
two-sevenths of the weekly total. Figures are weighted using ATUS survey weights. In
addition, multivariate models of household management time are estimated using
individual-level data on minutes spent per day in this function. These models are
estimated using Tobit. This estimation technique is preferred to the method of ordinary
least squares because of the censoring of the dependent variable: some individuals do not
report any time use in household management on a given day.10
Table 1 provides information on the key variable of interest, average hours per
week in household management activities, using the three alternative definitions as well
as information on time spent in all household activities and in family care. The most
striking, but perhaps not unexpected finding given the prior discussion, is that average
weekly hours spent in household management is quite low, even when broadly defined,
as compared to time spent in other household activities. As reported in Table 1, adults
10
For other recent applications of Tobit in time use analyses, see Bianchi et al. (2005), Kalenkoski et al.
(in press), and Connelly and Kimmel (2007).
15
spend 1.04 hours per week in household management based on the narrowest measure,
ATUSmanage, which largely reflects time spent in financial management, and as much as
1.64 hours per week when measured using the broadest measure analyzed here,
ExpandedDVD.11
As shown in Table 1, average weekly hours are considerably larger
among those who report spending at least some time in these activities, around 5.6 to a
little over 6 hours per week, depending on the measure considered.
Table 2 provides more detailed information on average weekly hours spent in
household management by specific management activity for selected subgroups of
interest. For instance, time spent managing financial affairs, as largely captured by
ATUSmanage, is significantly higher among older (age 55+) versus younger individuals
(age 18-34): 1.32 versus .65 hours per week. Table 2 reveals other interesting patterns, as
demonstrated by looking at time spent in household management using the broadest
definition, ExpandedDVD. For instance, time spent in household management is
positively and significantly associated with education. Highly-educated women, defined
as those with four years of college or more, spend nearly twice as much time in
management (2.4 hours per week), as less-educated women, defined as those who
completed high school or less education (1.4 hours per week). A similar pattern is found
for men, though not displayed in Table 2.
Table 2 also reveals that employed women spend significantly less time in
management, as well as all household activities. Specifically, employed women spend
1.5 hours per week in management, while non-employed women spend 2.3 hours per
11
For adults age 18+, the mean of ExpandedDVD (1.64) is the sum of: ATUSmanage (1.04), HH &
Personal Mail (.23), Purchasing Household & Childcare Services (.152), Banking & Legal & Real Estate
(.12), Obtaining Social Services (.002), Organizing and Planning for Children and Adults (.038), Calls to
Household and Childcare Providers (.045), and Comparison Shopping (.007).

16
week in this activity. One explanation is that employed women have less available time
for all nonmarket activities. The low amounts of management time reported may also
result from the fact that employed persons are likely to report paid work as their primary
activity during the work day though they may spend some of this time organizing their
personal lives. The cross-tabulations presented in Table 2 also indicate that management
time is significantly lower when a pre-school age child is present (1.5 vs. 2.1 hours per
week), a finding that is contrary to what one might expect given the potential role of
management as a strategy to overcome the ―time bind.‖
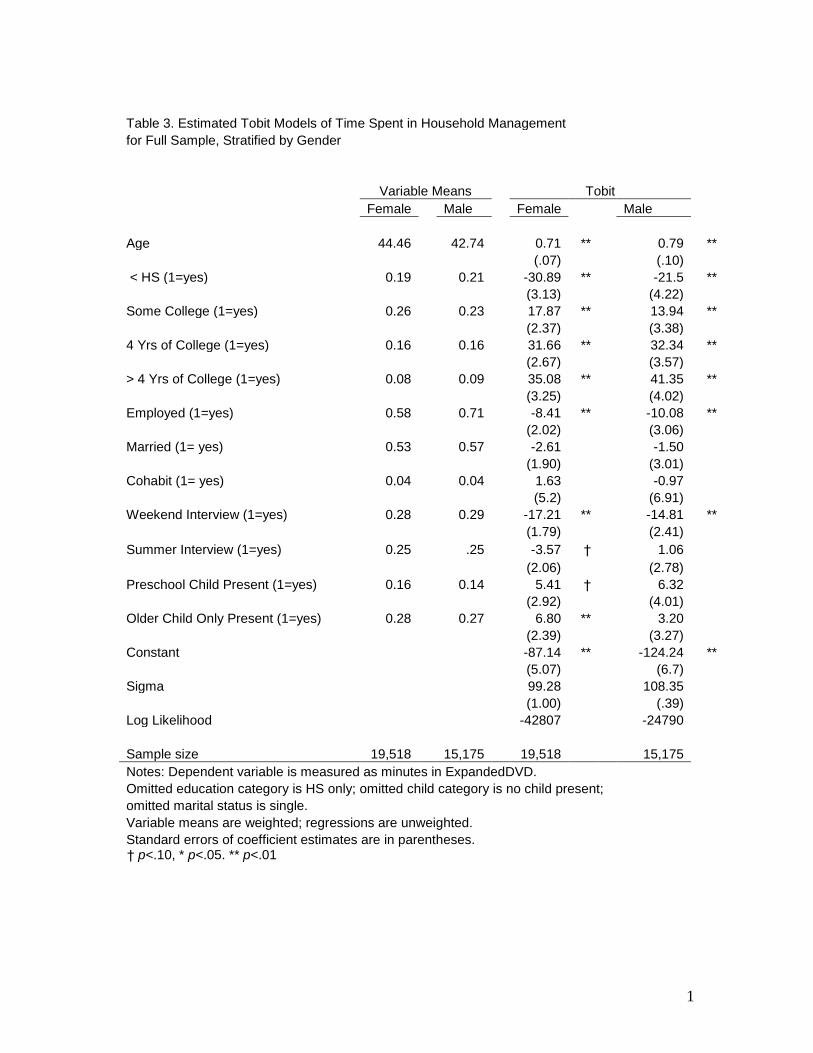
Table 3 provides results from a multivariate Tobit estimation, where the
dependent variable is minutes per day spent in household management, based on the
broadest definition. The covariates included in the model reflect time availability and
household resources following earlier multivariate work on time spent on household
production tasks and analysis of correlates with household management (see,
respectively, Bianchi et al. 2000 and Orrange et al. 2003).12
As discussed earlier, wives’
time is especially likely to be limited in households where they are employed, and
especially where children are present. Employment is included as an indicator variable,
where it is coded as 1 if the individual is employed and 0 otherwise. The presence of
children is modeled as a three category variable: preschool child is present, only an older
child is present, or no child is present, where the latter group is omitted. Household
resources are captured using two variables: age, which is a continuous variable, and
educational attainment, a five category dummy variable. For education, the omitted
12
Studies of time spent in production tasks, including Bianchi et al. (2000), also include a measure of
gender ideology since many tasks are sex-typed based on custom. A measure of gender ideology is not
available in the ATUS, but as discussed earlier, management is generally regarded as a more ―neutral‖
activity relative to specific production tasks.

17
category is those who completed high school only. Finally, the analysis controls for
differences in family structure using a three-category dummy: married, cohabiting, and
single, where the latter group is omitted.
The Tobit regressions largely confirm the descriptive patterns identified in Table
2.13
Results from these models show that controlling for other sociodemographic factors,
time in household management has a positive significant relationship with education and
age, and a significant negative relationship with employment status (for all results, p <
.01). Contrary to the descriptive findings of Table 2, the Tobit estimation indicates an
expected positive relationship between female management time and the presence of a
preschool age child, but this association is only marginally statistically significant (p <
.10).
Table 4 provides figures on average weekly time use for wives and husbands by
the couple’s employment status.14
Figures for all husbands and wives, regardless of
employment status, are also included from Table 1 for comparison purposes. It is
important to keep in mind that these spouses are not married to one another given that the
ATUS only provides one report per household. Rather, for instance, this table compares
the average time use of a husband in a dual-earner family with the average time use of a
wife in a dual-earner family. The figures in Table 4 show several interesting patterns.
Among these, dual-earner wives spend significantly less time in all household activities,
whether management or task-related, than non-employed wives. This result mirrors the
13
In looking at Table 3, the focus of the discussion is on the sign of the Tobit coefficient and the
coefficient’s statistical significance. Unlike OLS coefficients, Tobit coefficients do not directly indicate
marginal effects. Marginal effects for continuous variables, such as age, are calculated using the following
formula: (B x PDF(BX/sigma)). For discrete variables, the formula is somewhat more complicated. For
further discussion, see Wooldridge (2006). 14
For a discussion of this approach, see Schwartz et al. (2002).

18
significant negative relationship between employment and measured management time
for all women identified previously in Tables 2 and 3.
The figures in Table 4 further show that time spent in household activities,
whether management or task-related are more equally shared in dual-earner than in
husband-only employed families. For instance, in dual-earner vs. husband-only
employed families, the ratio of wives’ to husbands’ management time (ExpandedDVD)
is 1.3 vs. 2.1 and the ratio of time spent in all core housework activities is 1.57 vs. 3.04,
respectively. Regardless of couple’s employment type, these figures also suggest a much
more equal distribution of time on management-related activities versus housework and
childcare.
Table 5 presents multivariate Tobit regression results of time spent in household
management for the set of dual-earner wives and husbands. These models are estimated
for this narrower group given particular interest in how dual-earner spouses manage the
―time bind.‖ The definition of the independent variables in these models are largely the
same as those for the full sample presented in Table 3, with a few exceptions. For one,
these models include indicator variables for the level of educational attainment for both
wives and husbands. Second, since the sample is restricted to dual-earners, the
employment variable indicates whether both spouses are employed full-time or both are
not.
In the most time-constrained couples, those where both spouses are employed
full-time, results in Table 5 show that wives’ management time is significantly lower than
for less time-constrained couples. This result, consistent with findings in prior tables,
suggests that wives in such families are performing fewer of all activities, whether

19
management or task-related.15
An important qualification mentioned earlier but worth
repeating is that the ATUS only captures primary management time: During some of the
time reported as paid work, organizing personal affairs may be a secondary activity.
For dual-earner wives, the presence of a preschool age child is positively and
significantly associated with management time, as would be expected as a strategy to
juggle the time bind. For dual-earner husbands, there is no significant relationship.
Implications for Valuing Household Management
Recent efforts to value household management have followed the standard approach used
for household production activities like housecleaning and lawn care: they multiplied
time spent in the activity by a relevant commercial wage rate for the activity. Landefeld
et al. (2005) estimated household management time of about one hour per week of time
in this activity, close to the value of figures reported in Table 1 for ATUSmanage. They
then valued this category in a number of ways, including use of a quality-adjusted
―specialist‖ wage rate for business and professional services of $13 per hour.16
Similarly, the Dollar Value of a Day publication (Expectancy Data, 2005) multiplied a
somewhat broader measure of management time by a weighted wage rate based on
commercial management services of approximately $12 per hour. The obvious concern,
raised by this paper, is that the time use estimates in these calculations considerably
15
As a strategy to manage the time bind, one might speculate that dual-earner wives may be more likely
than non-employed wives to undertake management, but then spend less time in this function given time
constraints. This possibility, however, is not supported with the ATUS data. In results not reported here,
these data show that dual-earner wives are significantly less likely to undertake household management and
spend significantly less time on this activity, conditional on participation.
16
This figure is the $17.46 reported in their Appendix 2 multiplied by .75 to reflect the authors’ assumption
that the quality of this task is not as high as if performed by a specialist.

20
underestimated time spent in this function, thereby yielding low valuations of the
household manager role.
To fully understand the challenges of valuing time spent in household
management it is useful to compare it with valuing child care, since the two activities
share an important characteristic.17
Both activities are highly personalized in nature,
though child care services and household management services can be purchased in the
private market with varying degrees of substitutability. Nevertheless, the measurement
and valuation of household management is much more problematic using the ATUS.
First, as noted, household management is much more likely to be done in very small
blocks of time, and hence go unreported. Second, much of what is generally regarded as
―child care‖ consists of specific tasks, such as giving a bath or providing a meal, rather
than management per se, and is more likely to be captured as a primary activity.18
Finally, the ATUS systematically captures time spent in what researchers refer to as
―secondary,‖ ―passive‖ or ―supervisory‖ child care, but not time in other secondary
activities. Thus, the ATUS data are more likely to underestimate time spent in household
management than total child care time.19
Conclusion
17
Regarding child care, see Folbre and Yoon (2005). 18
As noted earlier, Folbre and Yoon (2005) define child care very broadly to include some management-
related activities. Nevertheless, time devoted to this activity is very small in comparison to time in tasks. 19
Instead of using time use data, an alternative method of valuation would be to look for a shadow price for
the household management function as a whole. As of 2006, a full-time household manager earned
anywhere from $25,000-$120,000 per year (Bick 2006; Buntic 2007). This figure is substantially higher
than 1 to 1.5 hours per week multiplied by a commercial wage rate of $12 -$13, as assumed in earlier
studies. Such a method would, however, substantially overstate the value of household management per se
because individuals hired for this function are likely to simultaneously or sequentially perform other tasks
in the household.

21
This study used newly available data from the American Time Use Survey (ATUS) to
investigate time spent in household management, a critical function in the household
production process. Time spent planning, monitoring, and coordinating are ongoing
activities that occur over the course of the whole day, though often performed while
―doing something else.‖ Data from the ATUS are the most detailed available on this
topic, but they nevertheless yield extremely conservative estimates of time spent in this
function: about 1 – 1.5 hours per week. One chief reason is that time spent in secondary
activities, apart from time spent being responsible for children, is not included in the
ATUS time diary. Further, even when management is the primary activity it may be
done in such small blocks of time that it goes unrecorded.
Despite the inadequacies of the ATUS data, several expected patterns are
identified. Among these, measured time spent in household management appears to
significantly increase with age and educational attainment. For dual-earner wives,
management time is also significantly higher when a preschool-age child is present. This
result is consistent with management serving as strategy to overcome the time bind.
The results also indicate that time spent in management is more equally distributed
between husbands and wives than core household tasks, in line with previous research on
couples’ money management patterns. Interestingly, employed women are found to
spend significantly less time in measured management time. A simple interpretation is
that time-constrained women have less time for this activity, but a firm assessment
requires a fuller reporting of how paid workers spend their work day.
In sum, ATUS data have proven fruitful for many purposes, including deepening
our understanding of how much time individuals report that they work when asked about

22
―usual hours‖ versus how much time they actually work as captured in a time diary
(Frazis and Stewart 2004). As mentioned, these data also contain rich information on
child care time. The lack of information on secondary activities, apart from supervisory
child care, however, is an important deficiency of the ATUS design. One implication of
this study, relevant to recent efforts to place a value on household activities, is that
calculations based on these data will yield a substantially understated lower bound on the
value of the household management function.

23
References
Avery, R.J., Haynes, D.C. & Cornell, G.W. (2000). Managing work and family: The
decision to outsource child care in families engaged in family-owned businesses.
Journal of Family and Economic Issues, 21(3), 227-258.
Becker, G. (1991). A treatise on the family (enlarged edition). Cambridge: Harvard
University Press.
Beeton, I. (1861). The book of household management. Retrieved on May 26, 2006 from
www.mrsbeeton.com.
Bianchi, S. M., Milkie, M.A., Sayer, L.C., & Robinson, J.P. (2000). Is anyone doing the
housework? Trends in the gender division of household labor. Social Forces,
79(1), 191-228.
Bianchi, S.M., Wright, V., & Raley, R.K. (2005). Maternal employment and family
caregiving: rethinking time with children in the ATUS. Paper presented for ATUS
Early Results Conference.
Bick, J. (2006, February 19). Free to be yourself (by hiring a personal assistant). New
York Times.
Bittman, M., England, P., Sayer, L., Folbre, N., & Matheson, G. (2003). When does
gender trump money? Bargaining and time in household work. American Journal
of Sociology, 109, 186-214.
Blair, S. L. & Lichter, D.T. (1991). Measuring the division of household labor. Journal of
Family Issues, 12(1), 91-113.
Bonke, J., Deding, M., & Lausten, M., & Stratton, L.S. (2007). Intrahousehold
specialization in housework in the United States and Denmark.
IZA Discussion Paper 2777.
Bridenstine v. Iowa City Electric Railway Company, 181 Iowa 1124, 165 N.W. 435
(1917).
Buntic, T. (2007). Hire a concierge or personal assistant to increase your business
efficiency. Retrieved January 20, 2007 from www.ezinearticles.com.
Connelly, R. & Kimmel, J. (2007). Spousal influences on parents’ non-market time
choices. Paper Presented at ASSA Meetings, Chicago, IL.
Craig, Lyn (2007). How employed mothers in Australia find time for both market work
and childcare. Journal of Family and Economic Issues, 28(1), 69-87.
Deacon, R.E. & Firebaugh, F.M.. (1988). Family resource management: principles and
applications. Boston: Allyn and Bacon.
De Ruijter, E., Treas, J.K., & Cohen, P.N. (2005). Outsourcing the gender factor: Living
arrangements and service expenditures on female and male tasks. Social Forces,
84(1), 305-322.
Duncan, K., Zuiker, V., & Heck, R. (2000). The importance of household management
for the business-owning family. Journal of Family and Economic Issues, 21(3),
287-312.
Estes, S. B., Noonon, M.C., & Maume, D.J. (2007). Is work-family policy use related to
the gendered division of housework? Journal of Family and Economic Issues,
28(4), 527-545.
Expectancy Data (2005). The dollar value of a day: 2003 dollar valuation. Sawnee
Mission, Kansas.

24
Fenstermaker, S. (1996). The dynamics of time use: Context and meaning. Journal of
Family and Economic Issues, 17(3/4), 231-244.
Fitzgerald, M.A., Winter, M., Miler, N.J., & Paul, J. (2001). Adjustment strategies in the
family business: Implications of gender and management role. Journal of Family
and Economic Issues, 22(3), 265-291.
Folbre, N. & Yoon, J. (2005). The value of unpaid child care in the U.S. in 2003.
Working Paper, University of Massachusetts-Amherst.
Frazis, H. & Stewart, J. (2004). What can time-use data tell us about hours of work?
Monthly Labor Review, 127(12), 3-9.
Hersch, J. & Stratton, L.S. (1997). Housework, fixed effects, and wages of married
workers. Journal of Human Resources, 32, 285-307.
Hochschild, A. (1997). The time bind. New York: Metropolitan Books.
Hundley, G. (2000). Male/female differences in self-employment: The effects of
marriage, children, and the household division of labor. Industrial and Labor
Relations Review, 54(1), 95-114.
Ireland, T. R. (1997). Compensable nonmarket services in wrongful death litigation:
Legal definitions and measurement standards. Journal of Legal Economics,
7(2), 15-34.
Kalenkoski, C., Ribar, D., & Stratton, L. (in press). The effect of family structure
on parents’ child care time in the United States and the United Kingdom. Review
of Economics of the Household.
Kolodinsky, J. M., Hogarth, J.M., & Hilgert, M.A. (2004). The adoption of electronic
banking technologies by U.S. consumers. The International Journal of Bank
Marketing, 22(4), 238-259.
Landefeld, J. S., Fraumeni, B.M., & Vojtech, C.M. (2005). Accounting for nonmarket
production: A prototype satellite account using the American time use survey.
BEA Working Paper.
Lee, Y.G., Hong G., Rowe, B.R. (2006a). Third shift women in business-owning
families. Journal of Family and Economic Issues 27(1), 72-91.
Lee, Y.G., Danes, S.M., & Shelley II, M.C. (2006b). Work roles, management and
perceived well-being for married women within family businesses. Journal of
Family and Economic Issues, 27(3), 523-541.
MacDonald, M., Phipps, S., and Lethbridge, L. (2005). Taking its toll: The influence of
paid and unpaid work on women’s well-being. Feminist Economics, 11(1), 63-94.
Marini, M. M. & Shelton, B.A. (1993). Measuring household work: Recent experience
in the United States. Social Science Research, 22, 361-382.
Mederer, H. J. (1993). Division of labor in two-earner homes: Task accomplishment
versus household management as critical variables in perceptions about family
work. Journal of Marriage and the Family, 55(1), 133-145.
Mano-Negrin, R. & Katz, R. (2003). Money management patterns of dual-earner
families in Israel. Journal of Family and Economic Issues, 24(1), 49-72.
Michigan Central Railroad Company v. Vreeland, 227 U.S. 59 (1913).
National Research Council (2000). Time-use measurement and research: Report of a
workshop. Washington, DC: National Academy Press.
National Research Council (2005). Beyond the market: Designing nonmarket accounts
for the United States. Washington: National Academies Press.
25
Orrange, R. M., Firebaugh, F.M., & Heck, R.K. (2003). Managing households. In P.
Moen (Ed.), It’s about time: Couples and career. ILR Press: Ithaca and London.
Pahl, J. (2000). Couples and their money: Patterns of accounting and accountability in the
domestic economy. Accounting, Auditing & Accountability Journal, 13(4), 502-
510.
Philbrick, C.A., & Fitzgerald, M.A. (2007). Women in business-owning families: A
comparison of roles, responsibilities and predictors of family functionality.
Journal of Family and Economic Issues, 28(4), 618-634.
Robbins, S. P. & Decenzo, D.A. (2005). Fundamentals of management, 3rd
edition.
Saddle River: Prentice Hall.
Robinson, J. P. (1996). Time, housework, and the rest of life. Journal of Family and
Economic Issues 17(3/4), 213-230.
Sayer, L.C. (2005). Gender, time and inequality: Trends in women’s and men’s paid
work, unpaid work and free time. Social Forces, 84(1), 285-303.
Schwartz, L. K., Herz, D., & Frazis, H. (2002). Measuring intrahousehold
allocation of time: Response to Anne E. Winkler. Monthly Labor Review, 125(2),
53-59.
Shelley, K. J. (2005). Developing the American time use survey activity classification
system. Monthly Labor Review, 128(June), 3-15.
South, S. J. & Spitze, G. (1994). Housework in marital and nonmarital households.
American Sociological Review, 59(3), 327-347.
Szalai, A., ed. (1972). The use of time: Daily activities of urban and surburban
populations in twelve countries. The Hague: Mouton and Co.
Stratton, L. S. (2001). Why does more housework lower women’s wages? Testing
hypotheses involving job effort and hours flexibility. Social Science Quarterly,
82(1), 67-76.
US Bureau of Labor Statistics and US Census Bureau (2006). ATUS user’s guide.
US Bureau of Labor Statistics (2005). ATUS –2004 results announced by BLS. USDL
05-1766 (September 20).
Weagley, R.W., Chan, M., & Yan, J. (2007). Married couples’ time allocation decisions
and marital stability. Journal of Family and Economic Issues, 28(3), 507-516.
Winkler, A. E. (2002). Time use in multiple-person households. Monthly Labor Review,
125(2), 45-52.
Wooldridge, J. M. (2006). Introductory econometrics. 3rd edition. Thompson South-
Western.

26
Table 1. Average Hours Per Week Spent in Household Management Activities, Comparison
of Measures, 2003-2004 ATUS
Single-Person HH Married Married
All, Women, Men, Women, Men, Women, Men,
age 18+ age 18+
age 18+
Age 20+
Age 20+ age 20+
age 20+
ATUSmanage
Total Hours 1.04 1.18 0.88 1.49 0.86 1.17 0.91
% with Hrs>0 16.9% 19.1% 14.4% 20.8% 14.1% 19.4% 14.9%
Hrs|Hrs >0 6.15 6.16 6.14 6.12 6.15 6.06 6.12
Total Hours/Total ALLHH 7.3% 6.7% 8.4% 10.1% 8.9% 6.0% 8.2%
DVDmanage
Total Hours 1.45 1.63 1.23 2.17 1.27 1.59 1.26
% with Hrs>0 26.1% 29.6% 22.2% 34.8% 23.2% 29.1% 22.6%
Hrs|Hrs >0 5.59 5.58 5.62 5.66 5.59 5.54 5.66
ExpandedDVD
Total Hours 1.64 1.86 1.38 2.41 1.43 1.85 1.40
% with Hrs>0 29.0% 33.3% 22.2% 37.3% 25.0% 33.2% 24.6%
Hrs|Hrs >0 5.69 5.65 5.74 5.76 5.80 5.63 5.76
Total Hrs/Total FAMILYCARE 6.6% 6.1% 7.5% 11.3% 9.6% 5.5% 7.1%
ALLHH (All Household Activities)
Total Hours 14.31 17.64 10.53 14.82 9.66 19.36 11.06
% with Hrs>0 78.9% 88.4% 68.1% 83.7% 69.7% 90.9% 68.4%
Hrs|Hrs >0 18.14 19.96 15.44 16.11 13.90 21.30 16.11
FAMILYCARE (ALLHH+ Shop + HH Care)
Total Hours 24.72 30.31 18.36 21.40 14.96 33.74 19.62
% with Hrs>0 88.7% 94.6% 82.0% 89.6% 79.9% 96.3% 83.1%
Hrs|Hrs >0 27.87 32.06 22.36 23.59 18.73 35.05 23.59
ATUS Paid Work
Total Hours 24.82 19.49 30.90 16.47 25.62 19.05 31.95
% with Hrs>0 46.1% 39.1% 54.2% 31.7% 45.1% 38.9% 56.1%
Total Sample Size 30,032 17,199 12,833 4,183 2,729 9,674 8,753
Notes: All figures are weighted. Participation figures are for given interview day.
Definitions are provided in Appendix A.

27

Table 2. Average Hours Per Week in Household Activities, For Selected Groups
Females, Ages 18+
By Age By HH Income By Education By Employment By Presence of Child
18-34 55+
$0-$40K
$40K+ Low-Ed
High-Ed Emp.
Not Emp.
Pre-K Child
w/No Child
ATUSmanage 0.65 1.32 ** 0.82 1.15 ** 0.89 1.51 ** 0.98 1.45 ** 0.90 1.34 **
ExpandedDVD 1.04 2.17 ** 1.36 1.79 ** 1.43 2.41 ** 1.53 2.33 ** 1.52 2.09 **
ALLHH 10.92 16.86 ** 14.51 13.67 ** 19.43 15.61 ** 14.09 22.67 ** 18.33 17.20 **
FAMILYCARE 24.56 24.03 † 24.04 24.96 ** 30.67 30.72 26.32 35.97 ** 45.18 24.49 **
Sample Size 6,236 10,340 11,929 14,299 7,224 5,015 10,149 7,050 3,458 9,522
Notes: All figures are weighted.
Low-ed if completed high school or less; high-ed if completed four years of college or more. Adults with some college omitted.
Adults with HH income missing omitted. p-value indicates whether difference in means is statistically different. † p<.10, * p<.05. ** p<.01

1
Table 3. Estimated Tobit Models of Time Spent in Household Management
for Full Sample, Stratified by Gender
Variable Means
Tobit
Female
Male
Female
Male
Age 44.46
42.74
0.71 **
0.79 **
(.07)
(.10)
< HS (1=yes) 0.19
0.21
-30.89 **
-21.5 **
(3.13)
(4.22)
Some College (1=yes) 0.26
0.23
17.87 **
13.94 **
(2.37)
(3.38)
4 Yrs of College (1=yes) 0.16
0.16
31.66 **
32.34 **
(2.67)
(3.57)
> 4 Yrs of College (1=yes) 0.08
0.09
35.08 **
41.35 **
(3.25)
(4.02)
Employed (1=yes) 0.58
0.71
-8.41 **
-10.08 **
(2.02)
(3.06)
Married (1= yes) 0.53
0.57
-2.61
-1.50
(1.90)
(3.01)
Cohabit (1= yes) 0.04
0.04
1.63
-0.97
(5.2)
(6.91)
Weekend Interview (1=yes) 0.28
0.29
-17.21 **
-14.81 **
(1.79)
(2.41)
Summer Interview (1=yes) 0.25
.25
-3.57 †
1.06
(2.06)
(2.78)
Preschool Child Present (1=yes) 0.16
0.14
5.41 †
6.32
(2.92)
(4.01)
Older Child Only Present (1=yes) 0.28
0.27
6.80 **
3.20
(2.39)
(3.27)
Constant
-87.14 **
-124.24 **
(5.07)
(6.7)
Sigma
99.28
108.35
(1.00)
(.39)
Log Likelihood
-42807
-24790
Sample size 19,518 15,175 19,518 15,175 Notes: Dependent variable is measured as minutes in ExpandedDVD.
Omitted education category is HS only; omitted child category is no child present; omitted marital status is single.
Variable means are weighted; regressions are unweighted. Standard errors of coefficient estimates are in parentheses. † p<.10, * p<.05. ** p<.01

2
Table 4. Average Hours Per Week in Household Management, Husbands and Wives, ages 20+
By Couple's Employment Status
Husband
All Employed Only Dual-Earner
Wives' Average Time Use
ATUSmanage 1.17 1.46 0.99 **
ExpandedDVD 1.85 2.37 1.57 **
ALLHH 19.40 25.42 15.48 **
FAMILYCARE 33.81 46.21 29.50 **
Paid Work (diary) 19.04 0.15 31.86 **
sample size 9,607 2,264 5,073
Husbands' Average Time Use
ATUSmanage 0.91 0.82 0.78
ExpandedDVD 1.41 1.15 1.21
ALLHH 11.07 8.36 9.84 **
FAMILYCARE 19.62 17.42 17.99
Paid Work (diary) 31.96 42.03 42.08
sample size 8,713 2,248 4,445
Wives' Average Time/Husbands' Average Time (calculated from above)
ATUSmanage 1.29 1.78 1.27
ExpandedDVD 1.31 2.06 1.30
ALLHH 1.75 3.04 1.57
FAMILYCARE 1.72 2.65 1.64
Paid Work (diary) 0.60 0.00 0.76
Notes: All figures are weighted. Definitions are in Appendix A.
Couple's employment status defined using information on usual hours worked. p-value indicates whether difference in means for wives’ (husbands’) time use by employment type is statistically significant.
† p<.10, * p<.05. ** p<.01

3
Table 5. Estimated Tobit Models of Time Spent in Household Management for Dual-Earner
Wives and Husbands, Ages 20+
Variable Means
Tobit
Wives
Husbands
Wives
Husbands
Own Age 42.41
44.33
0.87 **
1.08 **
Wife's Education
(.20)
(.23) < HS (1=yes) 0.05
0.07
-22.06 **
-5.45
(10.68)
(11.35)
Some College (1=yes) 0.29
0.29
11.6 **
-1.85
(4.55)
(5.58)
4 Yrs of College (1=yes) 0.24
0.24
20.44 **
4.28
(5.07)
(6.06)
> 4 Yrs of College (1=yes) 0.12
0.13
18.61 **
7.96
(6.02)
(7.31)
Husband's Education < HS (1=yes) 0.07
0.07
-15.99 †
-31.6 **
(8.49)
(11.23)
Some College (1=yes) 0.28
0.27
-0.97
7.75
(4.54)
(5.6)
4 Yrs of College (1=yes) 0.24
0.23
8.82 †
19.6 **
(4.93)
(7.11)
> 4 Yrs of College (1=yes) 0.13
0.13
12.7 *
19.51 **
(5.88)
(7.11)
Both Full-Time Employed (1=yes) 0.61
0.65
-11.45 **
-5.03
(3.27)
(4.04)
Weekend Interview (1=yes) 0.28
0.29
-5.34 †
-4.75
(3.18)
(3.89)
Summer Interview (1=yes) 0.26
0.26
-5.19
-1.88
(3.68)
(4.52)
Preschool Child Present (1=yes) 0.22
0.23
11.02 *
9.37
(5.00)
(5.96)
Older Child Only Present (1=yes) 0.32
0.31
12.30 **
1.17
(3.91)
(4.83)
Constant
-96.09 **
-129.8 **
(11.32)
(14.05)
Sigma
91.62
97.13
(1.75)
(2.41)
Log Likelihood
-11517.83
-7637.24
Sample size 5,073 4,445
5,073
4,445 Notes: Dependent variable is measured as minutes in ExpandedDVD.
Omitted education category is HS only; omitted child category is no child present. Variable means are weighted; regressions are unweighted.
Standard errors of coefficient estimates are in parentheses. † p<.10, * p<.05. ** p<.01

4

Appendix A. Codes from 2003-2004 ATUS
Measure Verbal Definition ATUS Codes
Household Management Measures
ATUSmanage Household management as reported in BLS published 020901-020999 (except 020903 and 020304).
tables. Includes Financial Management, Household and
Personal Organizing and Planning,
Home Security, HH Management, NEC.
Excludes HH & Personal Mail & Messages
as well as HH & Personal E-mail.
DVDmanage ATUSmanage plus: ATUSmanage codes plus 020303, 029999, 080101-080399,
HH & Personal Mail and Messages, Purchases 080601-080699, 100102.
of Child Care, Banking, Legal, Real Estate, and
Social Services. Also includes HH activities, NEC.
includes HH activities, NEC.
Expanded DVD DVDmanage plus: DVDmanage codes plus 030108, 030502, 070201-070299,
Org. & Planning for Children, Org. & Planning 080100-080199, 090101-099999, 160103-160108
for Adults, Purchasing HH Services, Calls to Child Care less 029999.
and HH Service Providers, Comparison
Shopping. Excludes HH activities, NEC.
All Household Activities (ALLHH) Household activities as reported in BLS published 020000-020902,020905,020999,029999,170201-170299.
tables.Thus, includes associated travel time but
excludes HH and Personal E-mail and Mail.
Family Care (FAMILYCARE) AllHH plus Shopping, and Caring for HH members, ALLHH codes plus

1
including associated travel and management time. 070000-099999, 100101-100199,100301-100302,
100399, 100400-100999, 170700-170799,
170800-170899, 170900-171003, 171099,
030100-039999, 170300-170399.
Paid Work Time spent on primary and secondary jobs. 050100-050200.