
Time series databases
80
@SrcMinistry @MariuszGil Time series databases Data processing
-
Upload
source-ministry -
Category
Software
-
view
414 -
download
0
Transcript of Time series databases

@SrcMinistry @MariuszGil
Time series databases
Data processing


We are developers

Code

Write it

Test it

Release it

Where does our responsibility end?

Devs vs SysAdmins

No man’s land


Context…

The story

One app 10+ servers Millions of users

Infra monitoring

Pro blems

What’s going on?

You can't manage what you can't measure
W. Edwards Deming

Gather

2016-04-11 02:00:00 45 2016-04-11 03:00:00 42 2016-04-11 04:00:00 30 2016-04-11 05:00:00 46 2016-04-11 06:00:00 70 2016-04-11 07:00:00 120

Store

Present


React

Low resolution No context

Metrics

Metrics, values that change over time
Matches everything

What should be measured?

Everything what is important for you

TechCPU / PV / reqs / resp_time

BusinessKPIs / PV / UU

Why it should be measured?

Insights

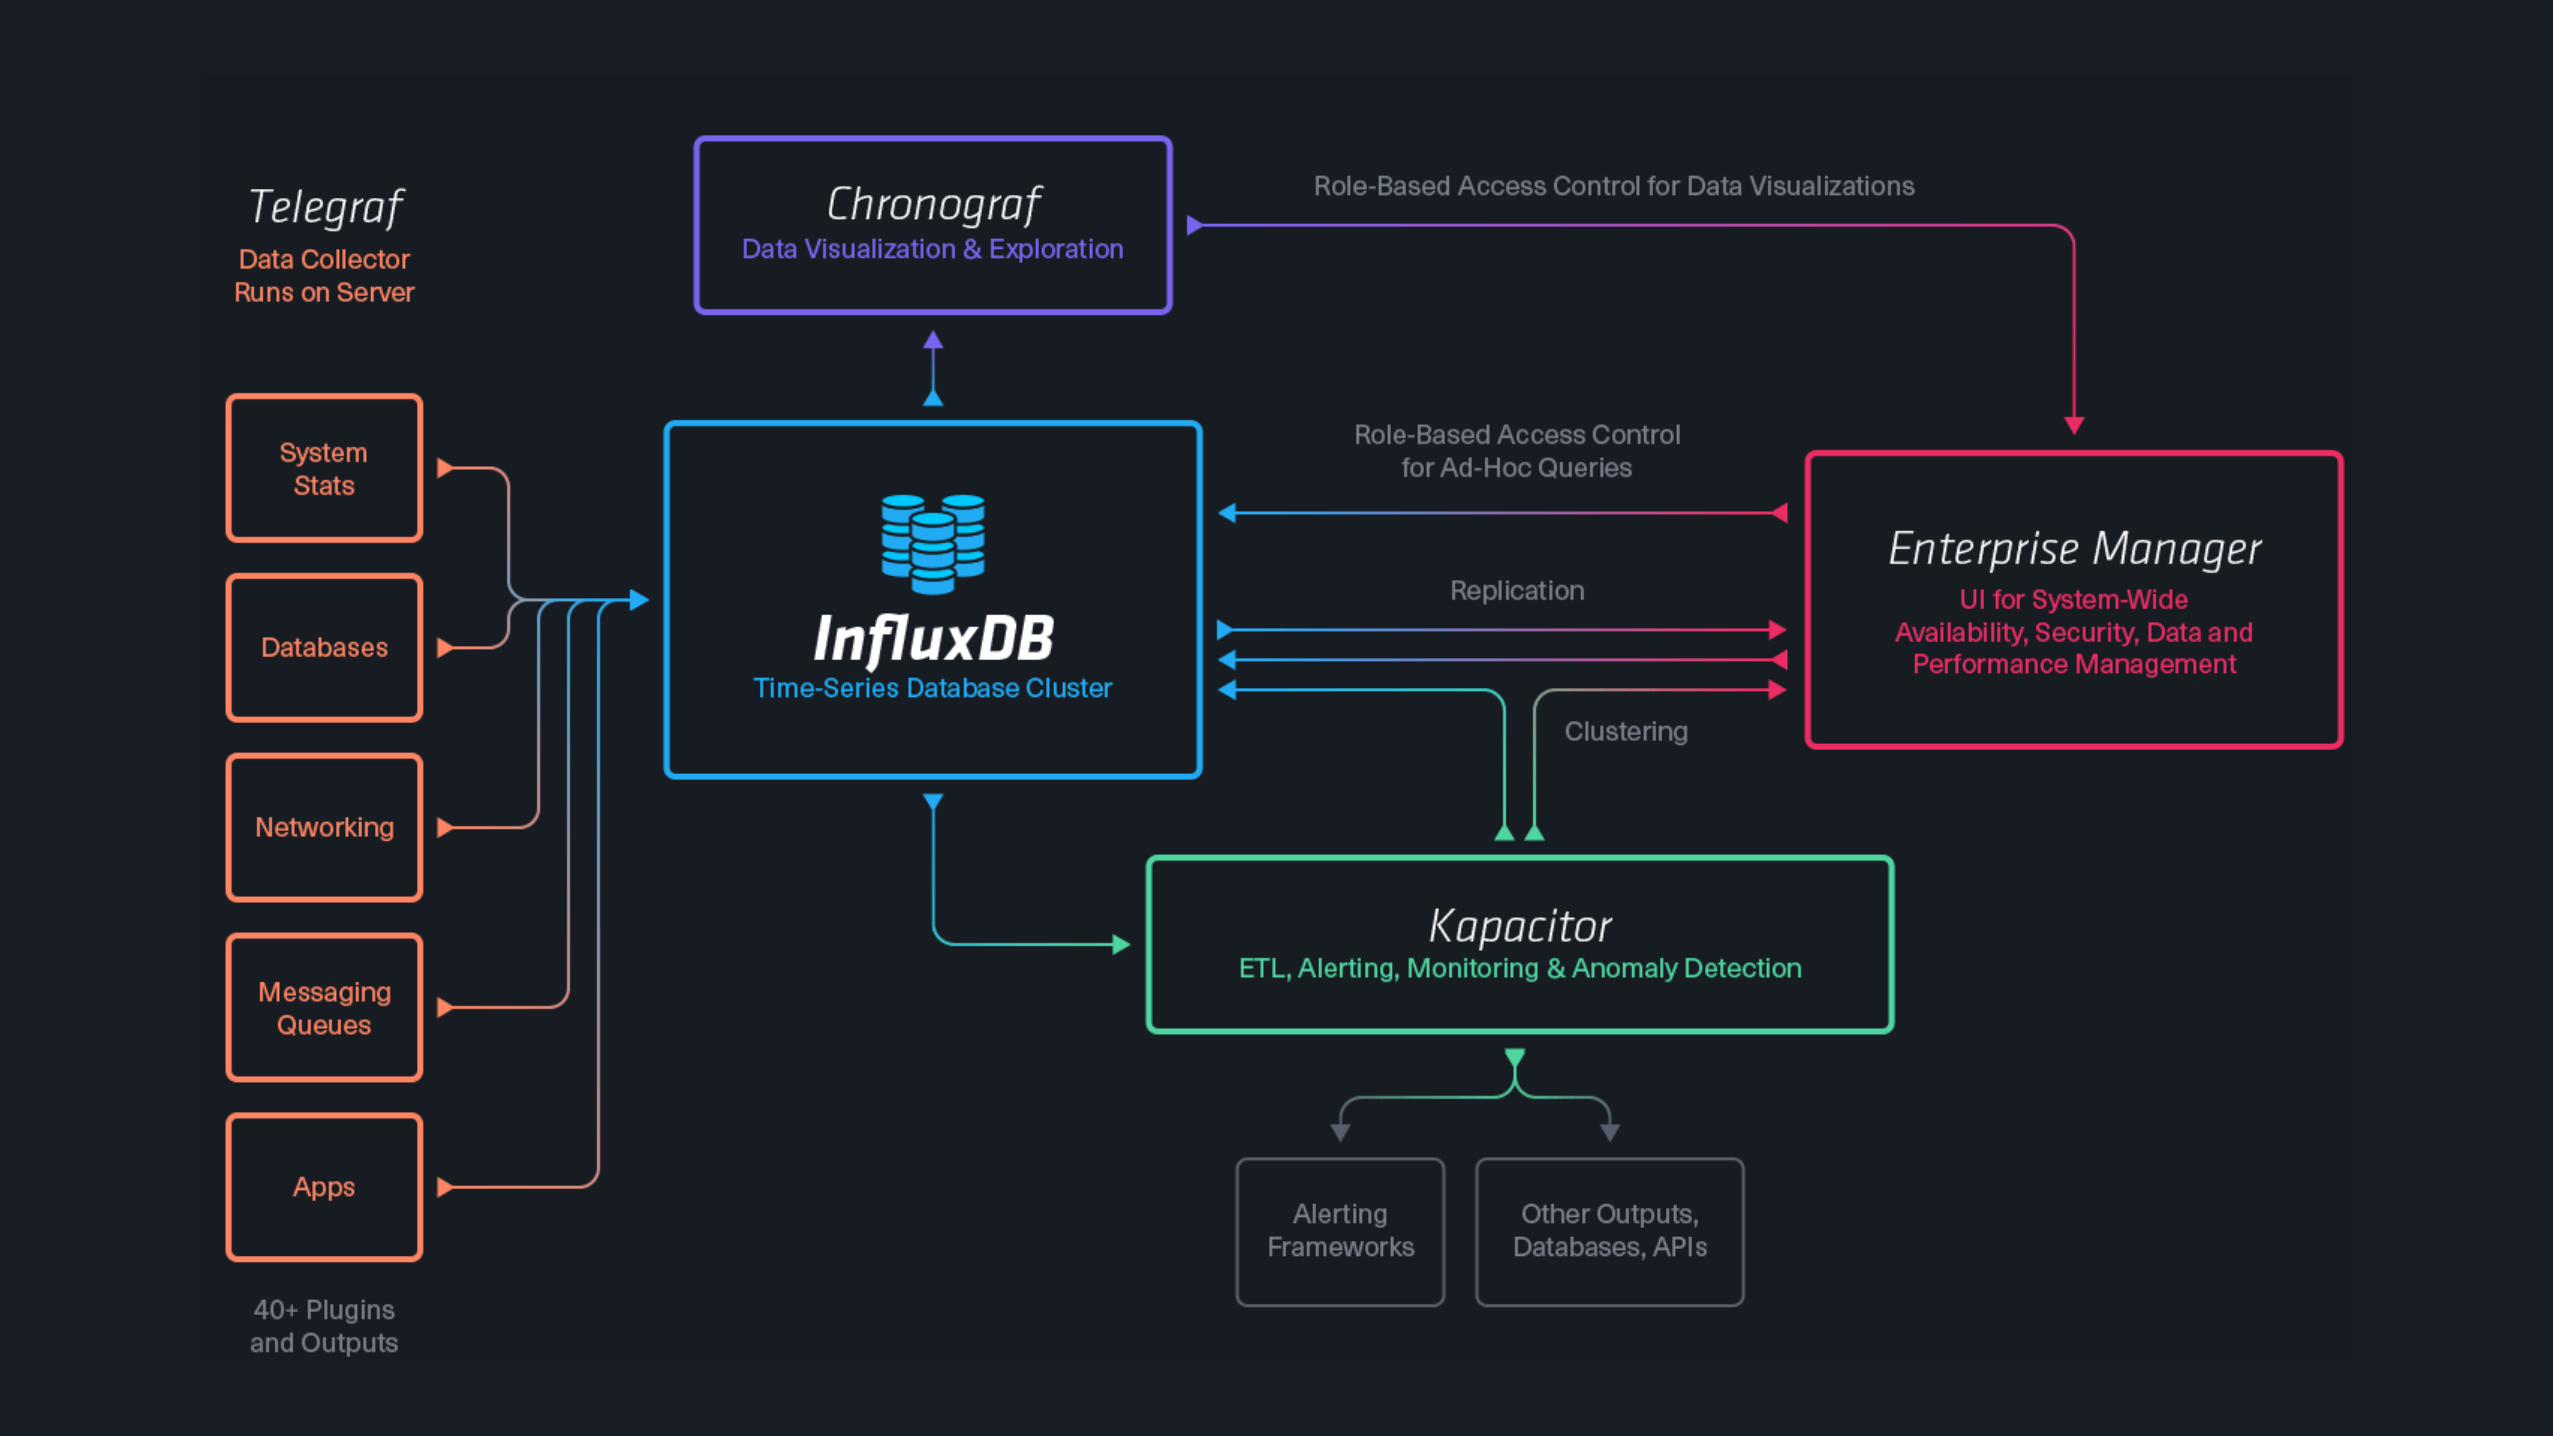
Time series databases

Software system that’s optimized for handling arrays of numbers indexed by time
Wikipedia definition

Many solutions…


Hello world

CREATE DATABASE test

SHOW DATABASES name: databases --------------- name _internal test

USE test Using database test

INSERT clicks,type=cpc,source=ad-partner-1,paid=yes,widget=promo-box value=0.43INSERT clicks,type=cpc,source=ad-partner-2,paid=yes,widget=promo-box value=0.50INSERT clicks,type=cpc,source=ad-partner-1,paid=yes,widget=top value=0.62INSERT clicks,type=cpm,source=ad-partner-1,paid=yes,widget=top value=0.80

SELECT * FROM clicks name: clicks ------------ time paid source type value widget 1459850636770890539 yes ad-partner-1 cpc 0.43 promo-box 1459850643866389522 yes ad-partner-2 cpc 0.50 promo-box 1459850656407067481 yes ad-partner-1 cpc 0.62 top 1459850668781668282 yes ad-partner-1 cpm 0.80 top

SELECT COUNT(value), MEAN(value), MEDIAN(value) FROM clicks WHERE time > NOW() - 2m GROUP BY time(5s) name: clicks ------------ time count mean median 1459851275000000000 0 1459851280000000000 0 1459851285000000000 3 0.330 0.33 1459851290000000000 0 1459851295000000000 2 0.420 0.420 1459851300000000000 2 0.365 0.365 1459851305000000000 3 0.446 0.43 1459851310000000000 0 1459851315000000000 0

SELECT COUNT(value), MEAN(value), MEDIAN(value) FROM clicks WHERE time > NOW() - 2m GROUP BY time(5s) FILL(0) name: clicks ------------ time count mean median 1459851275000000000 0 0 0 1459851280000000000 0 0 0 1459851285000000000 3 0.330 0.33 1459851290000000000 0 0 0 1459851295000000000 2 0.420 0.420 1459851300000000000 2 0.365 0.365 1459851305000000000 3 0.446 0.43 1459851310000000000 0 0 0 1459851315000000000 0 0 0

FunctionsAggregrations COUNT DISTINCT INTEGRAL MEAN MEDIAN SPREAD SUM
Selectors BOTTOM FIRST LAST MAX PERCENTILE TOP
Transformations CEILING DERIVATIVE DIFFERENCE FLOOR HISTOGRAM MOVING_AVERAGE STDDEV


Real world

Writing data

AppHTTP API
Graphite protocol Collectd protocol
JSON+UDP

curl -i -XPOST 'http://localhost:8086/write?db=test' --data-binary 'cpu_load_short,host=server01,region=us-west value=0.64 1434055562000000000’
HTTP/1.1 204 No Content Request-Id: 02e7757f-fb1e-11e5-809d-000000000000 X-Influxdb-Version: 0.11.0 Date: Tue, 05 Apr 2016 11:03:22 GMT

curl -G 'http://localhost:8086/query' --data-urlencode "db=test" --data-urlencode "q=SELECT value FROM cpu_load_short WHERE region='us-west'"
{"results":[{"series":[{"name":"cpu_load_short","columns":["time","value"],"values":[["2015-06-11T20:46:02Z",0.64]]}]}]}
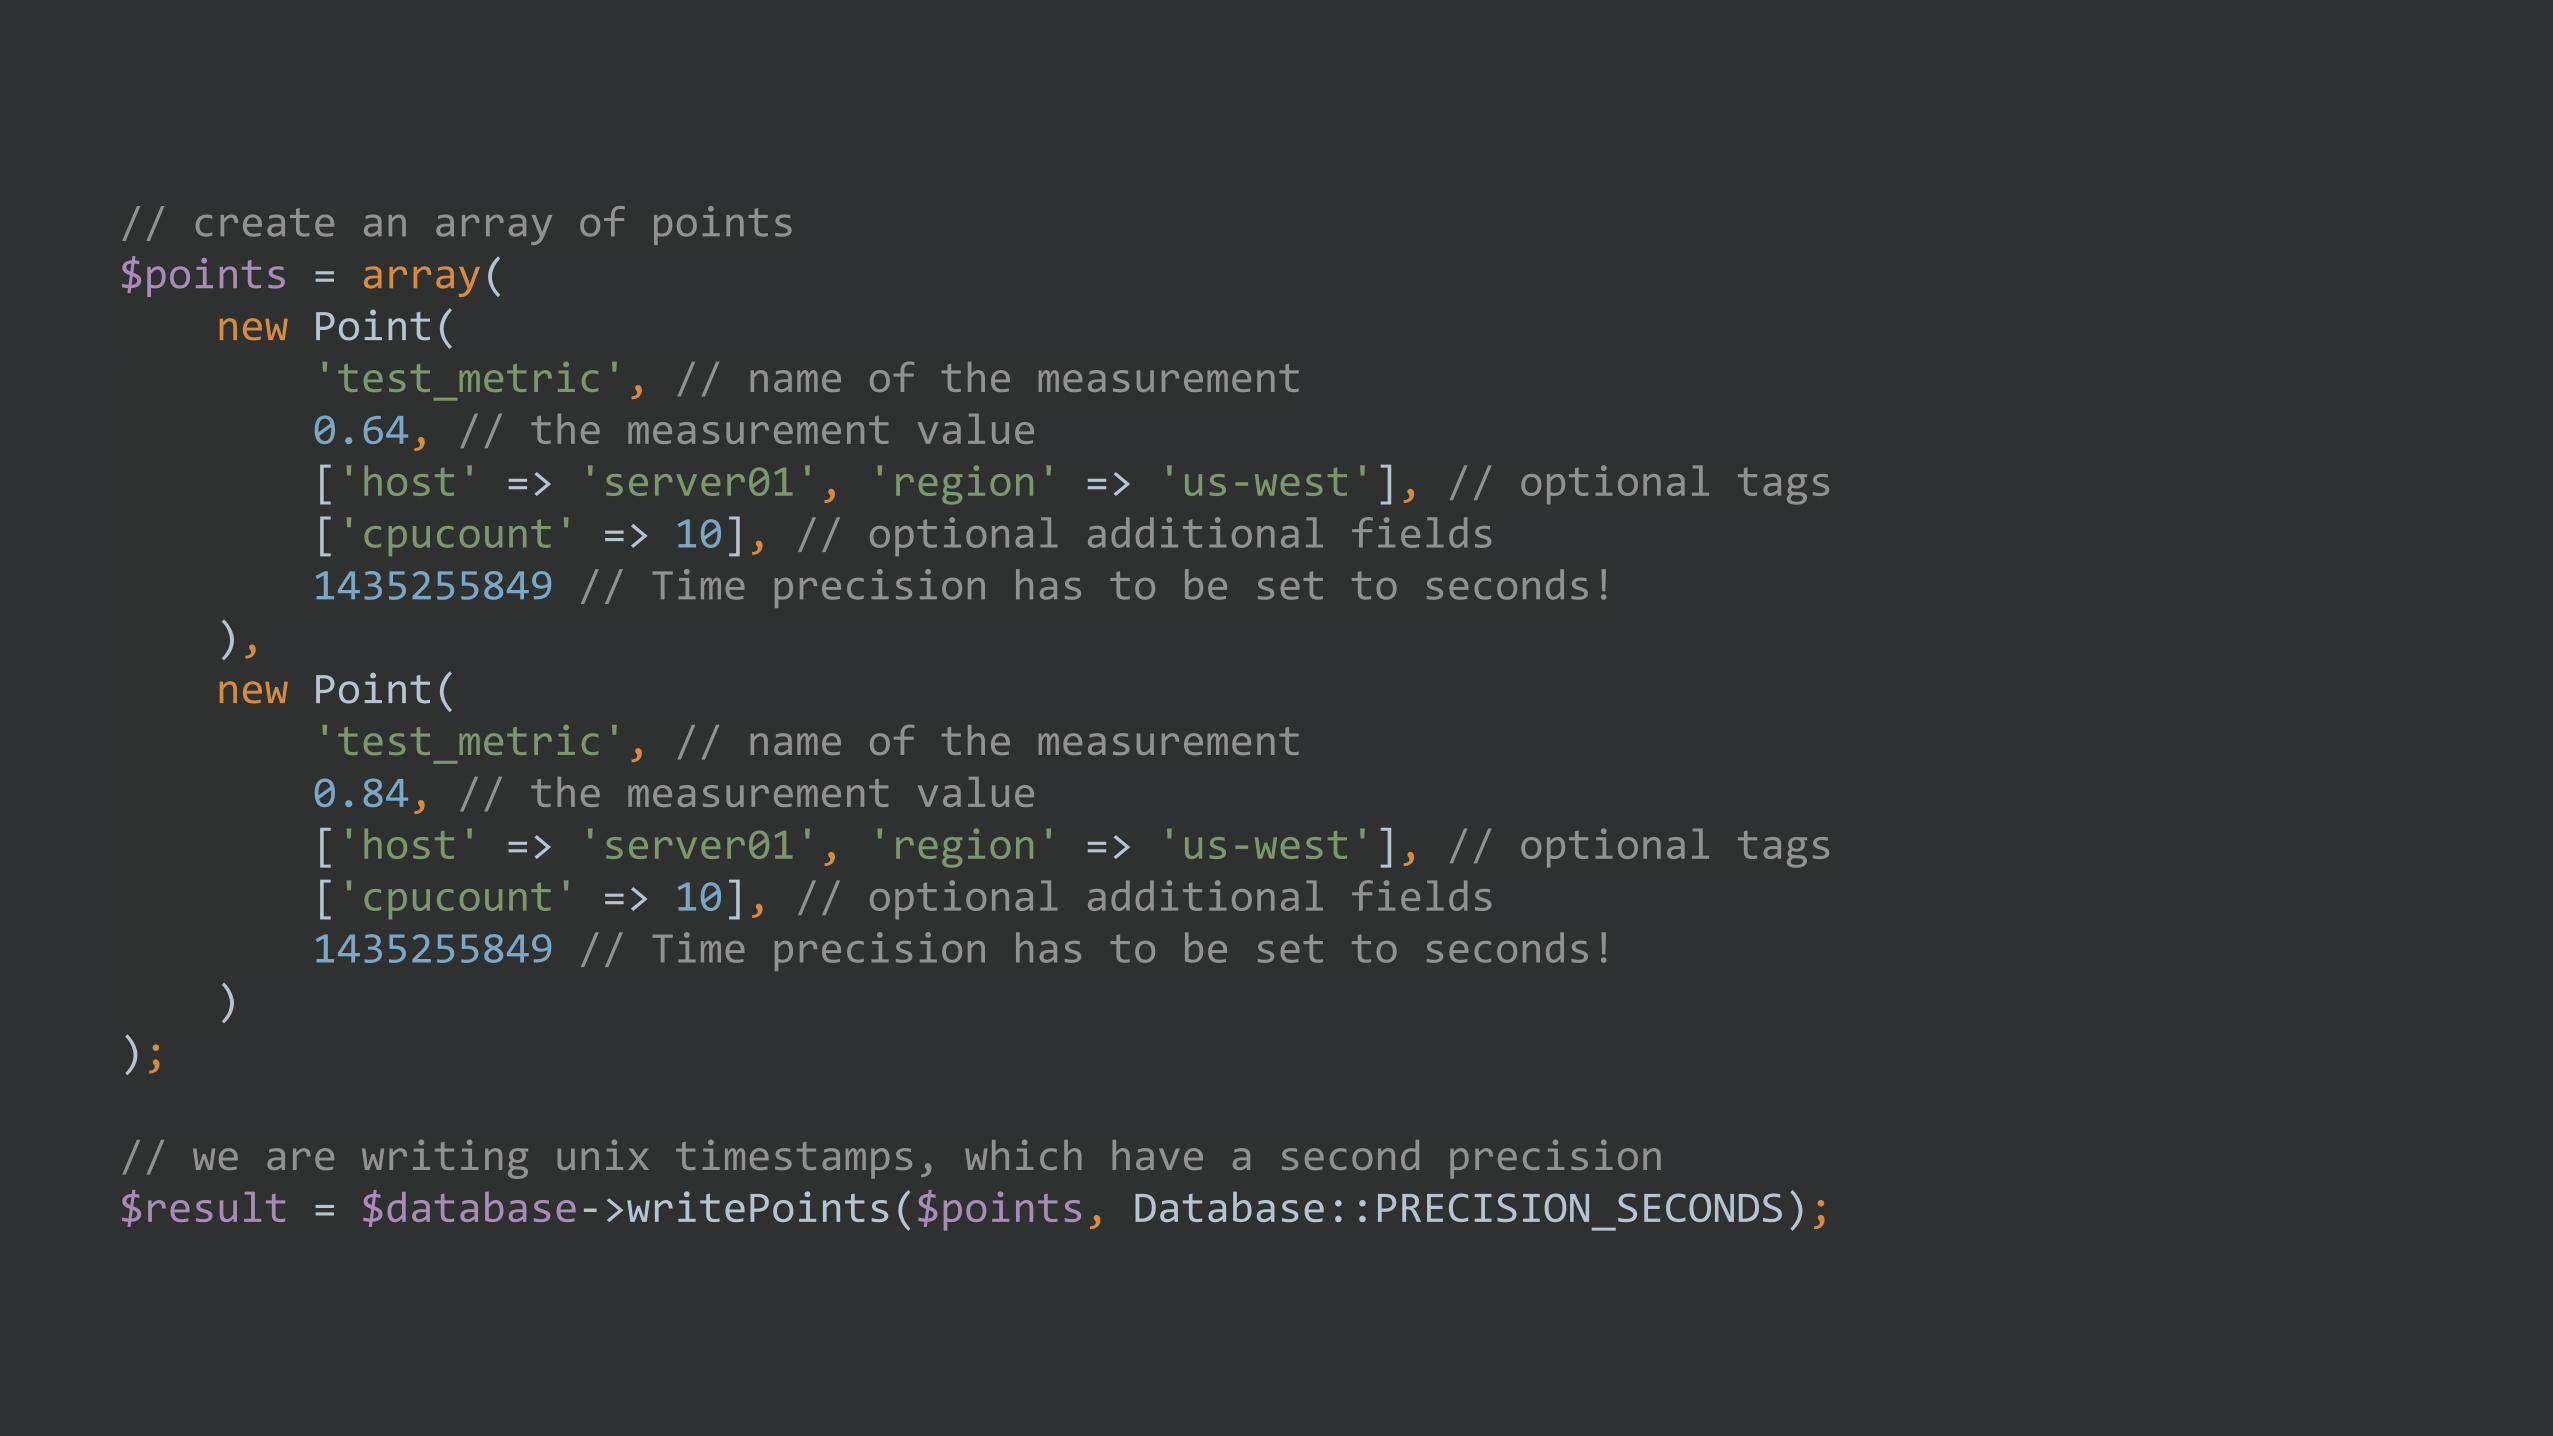
// create an array of points$points = array( new Point( 'test_metric', // name of the measurement 0.64, // the measurement value ['host' => 'server01', 'region' => 'us-west'], // optional tags ['cpucount' => 10], // optional additional fields 1435255849 // Time precision has to be set to seconds! ), new Point( 'test_metric', // name of the measurement 0.84, // the measurement value ['host' => 'server01', 'region' => 'us-west'], // optional tags ['cpucount' => 10], // optional additional fields 1435255849 // Time precision has to be set to seconds! ));// we are writing unix timestamps, which have a second precision $result = $database->writePoints($points, Database::PRECISION_SECONDS);

Data model

$statsd = new League\StatsD\Client();$statsd->increment('web.pageview');$statsd->decrement('storage.remaining');$statsd->increment(array( 'first.metric', 'second.metric'), 2);$statsd->increment('web.clicks', 1, 0.5);
Counters

$statsd = new League\StatsD\Client();$statsd->gauge('api.logged_in_users', 123456);
Gauges

$statsd = new League\StatsD\Client();$statsd->timing('api.response_time', 23.1);
Timers

$statsd = new League\StatsD\Client();$userID = 23;$statsd->set('api.unique_logins', $userID);
Sets

Data volume


CREATE CONTINUOUS QUERY <cq_name> ON <database_name> [RESAMPLE [EVERY <interval>] [FOR <interval>]] BEGIN SELECT <function>(<stuff>)[,<function>(<stuff>)] INTO <different_measurement> FROM <current_measurement> [WHERE <stuff>] GROUP BY time(<interval>)[,<stuff>] END

Rsyslog

Rsyslog

Rsyslog

Possibilities!

App heart beat

Anomaly detection


Monitoring with existing stack


Alternatives

Gather. Store. Present. React.

No rocket science

Only rocket fuel

@SrcMinistry
Thanks!
@MariuszGil

![Constraint Based Periodicity Mining in Time Series Databases · time series [35], and hence would lead to more effective decision making. The goal of time series analysis is to find](https://static.fdocuments.us/doc/165x107/5f07e50c7e708231d41f4a84/constraint-based-periodicity-mining-in-time-series-time-series-35-and-hence-would.jpg)


![7, Temporal and Real-Time Databases: A Surveyrts/pubs/TKDEAug95.pdfdeveloped in temporal databases. A series of five bibliographies concerning temporal data- bases [29], [142], [201],](https://static.fdocuments.us/doc/165x107/60417bb9e7be4b58d3219a63/7-temporal-and-real-time-databases-a-survey-rtspubstkdeaug95pdf-developed-in.jpg)
