Time-series analysis of vibrational nuclear wave-packet ... · Time-series analysis of vibrational...
12
Time-series analysis of vibrational nuclear wave-packet dynamics in D 2 + Uwe Thumm, 1,2, * Thomas Niederhausen, 1 and Bernold Feuerstein 2 1 James R. Macdonald Laboratory, Kansas State University, Manhattan, Kansas 66506-2604, USA 2 Max-Planck-Institut für Kernphysik, D-69029 Heidelberg, Germany Received 3 December 2007; published 3 June 2008 We discuss the extent to which measured time-dependent fragment kinetic energy release KER spectra and calculated nuclear probability densities can reveal 1 the transition frequencies between stationary vibrational states, 2 the nodal structure of stationary vibrational states, 3 the ground-state adiabatic electronic potential curve of the molecular ion, and 4 the progression of decoherence induced by random interactions with the environment. We illustrate our discussion with numerical simulations for the time-dependent nuclear motion of vibrational wave packets in the D 2 + molecular ion caused by the ionization of its neutral D 2 parent molecule with an intense pump laser pulse. Based on a harmonic time-series analysis, we suggest a general scheme for the full reconstruction, up to an overall phase factor, of the initial wave packets based on measured KER spectra. We apply this scheme in a numerical simulation for vibrational wave packets in D 2 + molecular ions and show how this reconstruction allows the clear distinction between commonly assumed stationary vibra- tional state distributions of the molecular ion following the ionization of D 2 . DOI: 10.1103/PhysRevA.77.063401 PACS numbers: 42.50.Md, 33.20.Tp, 82.37.Np I. INTRODUCTION The anticipated efficient catalysis and control of chemical reactions with laser light has been the motivation for many detailed theoretical and experimental investigations over the past two decades 1–3. Within the past few years, intense laser pulses with durations below the vibrational period of even small molecules became available, and the time evolu- tion of nuclear wave packets is now routinely imaged in several laboratories world wide 4 –11. The time-dependent nuclear motion is detected by combining a femtosecond pump-probe experiment with the Coulomb explosion CE imaging of the molecular fragments 12–17. In this type of pump-probe experiment, the first pump pulse ionizes a neu- tral molecule and generates a coherent nuclear wave packet in the molecular ion. A second delayed probe pulse detects the wave packet at the pump-probe delay time by dissociat- ing or rapidly ionizing the molecular ion. Ionization in the probe pulse leads to nearly instant fragmentation of the mo- lecular ion by CE. By recording the KER of those fragments that were produced by CE as a function of the delay time, the evolution of the coherent and decohering nuclear motion can be monitored in great detail, in particular for diatomic molecules 5,6,8,9,11. Due to their simple structure, the KER following the CE of diatomic molecules can be accu- rately mapped on a distribution of internuclear distances R at a time immediately preceding ionization thereby allowing for the direct and time-resolved observation of molecular exci- tation, bond breaking, temporary bond formation, ionization, and vibrational-state-resolved dissociation 9,11,16,18–21. In contrast to other pump-probe schemes, such as, e.g., “pump-dump” interrogations of molecular potential curves with two-color stimulated Raman scattering 22, and de- pending on the realization of the probe-ionization step, pump-probe CE imaging provides information about the nuclear wave packet, simultaneously over a large interval of internuclear distances, as indicated in Fig. 1. Computationally, small molecules, in particular H 2 ,H 2 + , and their isotopes, have become accessible to realistic nu- merical modeling and, therefore have bench-marking poten- tial. The comparison with measured KER spectra allows for increasingly severe tests of quantum mechanical wave- packet propagation WPP calculations 9,11,16, and, more specifically, for a critical assessment of control protocols suggested by such numerical simulations 23–26. For ex- ample, the coherent nuclear motion in D 2 + was recently ob- served over several picoseconds 23 and was found to accu- rately reproduce theoretically predicted details 16, such as the occurrence of partial and full vibrational revivals after many vibrational periods T vib 22 fs in D 2 + . Recent ex- periments with fs laser pulses and WPP calculations show an * [email protected] FIG. 1. Color online Schematic diagram of the pump-probe setup. A first laser pulse launches a nuclear wave packet on the D 2 + 1s g + potential curve and starts the molecular clock. After a certain delay time, an intense short probe pulse promotes the nuclear wave packet onto the 2D + repulsive 1 / R Coulomb-explosion curve and allows for the detection of the fragment-kinetic-energy distribution. PHYSICAL REVIEW A 77, 063401 2008 1050-2947/2008/776/06340112 ©2008 The American Physical Society 063401-1
Transcript of Time-series analysis of vibrational nuclear wave-packet ... · Time-series analysis of vibrational...

Time-series analysis of vibrational nuclear wave-packet dynamics in D2+
Uwe Thumm,1,2,* Thomas Niederhausen,1 and Bernold Feuerstein2
1James R. Macdonald Laboratory, Kansas State University, Manhattan, Kansas 66506-2604, USA2Max-Planck-Institut für Kernphysik, D-69029 Heidelberg, Germany
�Received 3 December 2007; published 3 June 2008�
We discuss the extent to which measured time-dependent fragment kinetic energy release �KER� spectra andcalculated nuclear probability densities can reveal �1� the transition frequencies between stationary vibrationalstates, �2� the nodal structure of stationary vibrational states, �3� the ground-state adiabatic electronic potentialcurve of the molecular ion, and �4� the progression of decoherence induced by random interactions with theenvironment. We illustrate our discussion with numerical simulations for the time-dependent nuclear motion ofvibrational wave packets in the D2
+ molecular ion caused by the ionization of its neutral D2 parent moleculewith an intense pump laser pulse. Based on a harmonic time-series analysis, we suggest a general scheme forthe full reconstruction, up to an overall phase factor, of the initial wave packets based on measured KERspectra. We apply this scheme in a numerical simulation for vibrational wave packets in D2
+ molecular ionsand show how this reconstruction allows the clear distinction between commonly assumed stationary vibra-tional state distributions of the molecular ion following the ionization of D2.
DOI: 10.1103/PhysRevA.77.063401 PACS number�s�: 42.50.Md, 33.20.Tp, 82.37.Np
I. INTRODUCTION
The anticipated efficient catalysis and control of chemicalreactions with laser light has been the motivation for manydetailed theoretical and experimental investigations over thepast two decades �1–3�. Within the past few years, intenselaser pulses with durations below the vibrational period ofeven small molecules became available, and the time evolu-tion of nuclear wave packets is now routinely imaged inseveral laboratories world wide �4–11�. The time-dependentnuclear motion is detected by combining a femtosecondpump-probe experiment with the Coulomb explosion �CE�imaging of the molecular fragments �12–17�. In this type ofpump-probe experiment, the first �pump� pulse ionizes a neu-tral molecule and generates a coherent nuclear wave packetin the molecular ion. A second delayed �probe� pulse detectsthe wave packet at the pump-probe delay time by dissociat-ing or rapidly ionizing the molecular ion. Ionization in theprobe pulse leads to nearly instant fragmentation of the mo-lecular ion by CE. By recording the KER of those fragmentsthat were produced by CE as a function of the delay time, theevolution of the coherent �and decohering� nuclear motioncan be monitored in great detail, in particular for diatomicmolecules �5,6,8,9,11�. Due to their simple structure, theKER following the CE of diatomic molecules can be accu-rately mapped on a distribution of internuclear distances R ata time immediately preceding ionization thereby allowing forthe direct and time-resolved observation of molecular exci-tation, bond breaking, temporary bond formation, ionization,and vibrational-state-resolved dissociation �9,11,16,18–21�.In contrast to other pump-probe schemes, such as, e.g.,“pump-dump” interrogations of molecular potential curveswith two-color stimulated Raman scattering �22�, and de-pending on the realization of the probe-ionization step,pump-probe CE imaging provides information about the
nuclear wave packet, simultaneously over a large interval ofinternuclear distances, as indicated in Fig. 1.
Computationally, small molecules, in particular H2, H2+,
and their isotopes, have become accessible to realistic nu-merical modeling and, therefore have bench-marking poten-tial. The comparison with measured KER spectra allows forincreasingly severe tests of quantum mechanical wave-packet propagation �WPP� calculations �9,11,16�, and, morespecifically, for a critical assessment of control protocolssuggested by such numerical simulations �23–26�. For ex-ample, the coherent nuclear motion in D2
+ was recently ob-served over several picoseconds �23� and was found to accu-rately reproduce theoretically predicted details �16�, such asthe occurrence of partial and full vibrational revivals aftermany vibrational periods �Tvib�22 fs in D2
+�. Recent ex-periments with fs laser pulses and WPP calculations show an
FIG. 1. �Color online� Schematic diagram of the pump-probesetup. A first laser pulse launches a nuclear wave packet on the D2
+
1s�g+ potential curve and starts the molecular clock. After a certain
delay time, an intense short probe pulse promotes the nuclear wavepacket onto the 2D+ repulsive 1 /R Coulomb-explosion curve andallows for the detection of the fragment-kinetic-energy distribution.
PHYSICAL REVIEW A 77, 063401 �2008�
1050-2947/2008/77�6�/063401�12� ©2008 The American Physical Society063401-1

increasing amount of control in steering the bound and dis-sociating motion in molecules by tuning laser pulse param-eters �duration, intensity, and shape� or by adding one �ormore� control laser pulses in between the pump-probe se-quence �9,26,27�.
In the present paper, we outline a scheme for probing andreconstructing the dynamics of moving wave packets. Thesuggested method is general in the sense that it may be ap-plied to the analysis of electronic, rotational and vibrationalwave packets. In Sec. II we will illustrate our discussion withreference to the concrete example of laser-excited coherentnuclear vibrational motion in D2
+ molecular ions. This al-lows us to numerically simulate the analysis of the primarydata provided by pump-probe experiments, pump-probe-delay-dependent KER spectra, and to demonstrate how ourscheme reveals information about �1� the beat frequenciesbetween vibrational states, �2� the nodal structure of D2
+ sta-tionary vibrational states, �3� the ground-state adiabatic elec-tronic potential curve of D2
+, �4� light-induced molecularpotentials that may allow for the formation of transientlytrapped molecular states �so-called “bond-hardening” states�,and �5� the coherent stationary vibrational-state compositionof the vibrational wave packet in D2
+. Before presenting ourconclusions, we shall briefly discuss in Sec. III an extensionof our scheme for analyzing R-dependent KER data by �6�allowing for the loss of coherence due to random interactionswith the environment. Even though our numerical examplesare limited to the coherent motion in D2
+, our method maybe extended to larger molecules and offer a way to quantifythe progression of decoherence due to couplings to the ex-perimental environment in polyatomic molecules and sys-tems of interest for application in emerging quantum infor-mation technologies. We assume atomic units throughout thiswork, unless indicated otherwise, and designate the vibra-tional ground states of D2 and D2
+ with the index �=0 andexcited states with ��1.
II. COHERENT WAVE PACKET DYNAMICS
A. Bound nuclear motion
1. Generation and evolution of nuclear wave packet
In order to efficiently generate a coherent vibrationalwave packet in D2
+, the pump laser pulse has to satisfy sev-eral requirements. Its intensity needs to be sufficiently largeto singly ionize the parent D2 molecule and small enough toavoid instant Coulomb explosion following double ioniza-tion. Its pulse length should be short enough for its spectralband width to be of the order of �or larger than� the typicalfrequency difference of neighboring vibrational states. If twoor more stationary vibrational states �� of D2
+ satisfy thisrequirement, their coherent superposition
��R,t� = ��=0
N
a�e−i��t���R� �1�
forms a moving wave packet. After the pump pulse haspassed, this wave packet freely propagates on the 1s�g
+ po-tential curve of D2
+. In the absence of further external inter-
actions �and disregarding molecular rotation� it undergoescycles of dephasing and revivals �10,11,16,27,28� withoutchanging its vibrational-state distribution �a��0�= �����R , t=0��. Its probability density ��R , t�2 �Fig.2�a�� is directly related to the Coulomb explosion image ofthe measurable time-dependent KER.
D2+ vibrational wave packets are generated in the pump
laser pulse by ionization of neutral D2 molecules out of theirvibrational �and electronic� ground state. The rate for ioniza-tion of the neutral molecule increases rapidly with the inter-nuclear distance R �29�, such that the often-used Franck-Condon �FC� approximation provides a rather poor model ofthe ionization process and is known to generate a vibrationalstate distribution �a�� in D2
+ that overestimates the popula-tion of higher excited vibrational states �30�. In our numeri-cal examples, we model the ionization of D2 based either onthe FC approximation or on molecular Ammosov-Delone-Krainov �ADK� tunneling ionization rates �ADK�R , I��26,31�. The molecular ADK rate is derived from the originalrate for tunneling ionization of �one-electron� atoms in astatic electric field �32� and owes its dependence on R to theimplicit generalization of the atomic ionization potential tothe vertical �at a given value of R� energy gap between theadiabatic energies of the neutral diatomic molecule and itsdaughter molecular ion in their respective ground electronicstates. For the remainder of this paper, we will refer to theresulting D2
+ wave packets as either “FC-wave packets” or“ADK-wave packets.” Similarly, we will address their initialstationary vibrational state distributions �a�� as “FC” or“ADK distribution,” respectively.
While within the FC approximation the population of aspecific vibrational state � in D2
+ is obtained simply by pro-jecting the vibrational ground state of the neutral molecule��=0
D2 onto �� and thus does not depend on the laser param-
FIG. 2. �Color online� �a� Time evolution of an initial Franck-Condon D2
+ vibrational packet. Probability density �logarithmiccolor scale� and expectation value of the internuclear distance �R�thick line�. �b�,�c� Squared Fourier transform �power spectrum� ofthe evolution of the probability density as a function of the internu-
clear distance R, d�R ,� ;T�2. The sampling times are T=3 ps �b�and 10 ps �c�. Inset in �b�: First experimental evidence by Feuer-stein et al. �23� for T=3 ps. Hyphenated pairs of quantum numbersindicate the beating stationary vibrational states. All graphs showthe beat frequency f =� / �2�� on the horizontal axis.
THUMM, NIEDERHAUSEN, AND FEUERSTEIN PHYSICAL REVIEW A 77, 063401 �2008�
063401-2
eters, molecular-ADK rates depend on the pump-laser inten-sity. We note that for arbitrary orientation of the moleculerelative to the laser electric field, orientation-dependent mo-lecular ADK rates �33� would be more accurate. However,since the molecular orientation can be determined experi-mentally �5�, we disregard the orientation dependence of mo-lecular ionization. The pump laser is assumed to launch thevibrational wave packet at time t=0, thereby starting a “mo-lecular clock.” Including the partial depletion of the initialvibrational state of the D2 molecule by the pump pulse, wemodel the nuclear wave function of the neutral molecule af-ter the pump pulse as
�pumpD2 �R� = ��=0
D2 �R�exp�− 0
dt�ADK�R,I�t��/2� �2�
and obtain the normalized initial wave packet in D2+
��R,t = 0� = ���=0D2 − �pump
D2 �/���=0D2 − �pump
D2 � . �3�
The initial vibrational-state distribution �a��0�� changes ifthe molecular ion interacts with a laser pulse. Allowing forlaser-induced Raman transitions between the two lowestadiabatic potential curves in D2
+, we switch to a convenienttwo-component representation of the nuclear wave functionand adopt a two-state model for the propagation of thenuclear wave packet
��t� = ��g�t��u�t� � �4�
on the 1s�g and 2p�u potential curves
id
dt��g
�u� = �T + V + Hc���g
�u� . �5�
The initial condition for the nuclear wave packet componentson the D2
+ potential curves of gerade and ungerade symme-try �34� are given by
�g�R,t� = ��=0
N
a��0�e−i��t���R� , �6�
�u�R,t� = 0. �7�
The kinetic energy operator T= p2 / �2� includes the reducedmass =1835 of the two nuclei. The adiabatic 1s�g and2p�u electronic potential curves of D2
+ �34� form the diago-nal elements of the potential matrix
V = �Vg�R� 0
0 Vu�R�� . �8�
The laser-induced dipole coupling between the gerade andungerade potential curves in D2
+ is included in the off-diagonal elements of the coupling operator
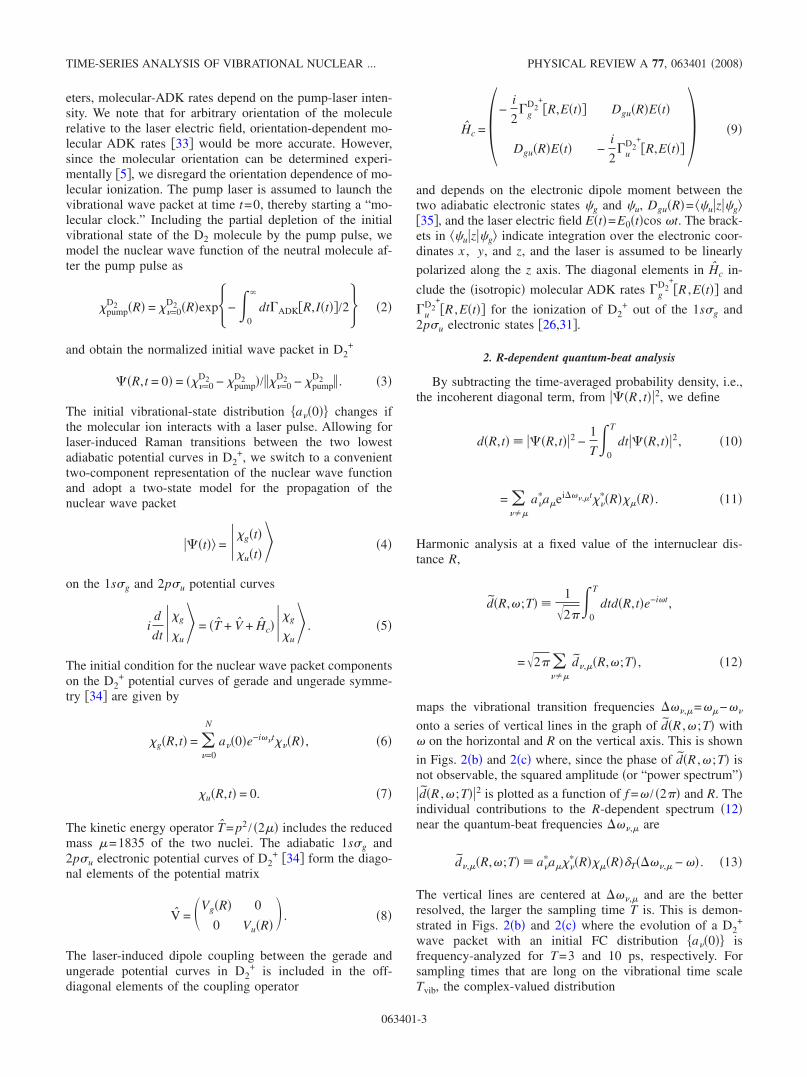
Hc =�−i
2�g
D2+�R,E�t�� Dgu�R�E�t�
Dgu�R�E�t� −i
2�u
D2+�R,E�t�� � �9�
and depends on the electronic dipole moment between thetwo adiabatic electronic states �g and �u, Dgu�R�= ��uz�g�35�, and the laser electric field E�t�=E0�t�cos �t. The brack-ets in ��uz�g indicate integration over the electronic coor-dinates x , y, and z, and the laser is assumed to be linearly
polarized along the z axis. The diagonal elements in Hc in-
clude the �isotropic� molecular ADK rates �gD2
+�R ,E�t�� and
�uD2
+�R ,E�t�� for the ionization of D2
+ out of the 1s�g and2p�u electronic states �26,31�.
2. R-dependent quantum-beat analysis
By subtracting the time-averaged probability density, i.e.,the incoherent diagonal term, from ��R , t�2, we define
d�R,t� � ��R,t�2 −1
T
0
T
dt��R,t�2, �10�
= ���
a��aei���,t��
��R���R� . �11�
Harmonic analysis at a fixed value of the internuclear dis-tance R,
d�R,�;T� �1
�2�
0
T
dtd�R,t�e−i�t,
=�2� ���
d�,�R,�;T� , �12�
maps the vibrational transition frequencies ���,=�−��
onto a series of vertical lines in the graph of d�R ,� ;T� with� on the horizontal and R on the vertical axis. This is shown
in Figs. 2�b� and 2�c� where, since the phase of d�R ,� ;T� isnot observable, the squared amplitude �or “power spectrum”�d�R ,� ;T�2 is plotted as a function of f =� / �2�� and R. Theindividual contributions to the R-dependent spectrum �12�near the quantum-beat frequencies ���, are
d�,�R,�;T� � a��a��
��R���R� T����, − �� . �13�
The vertical lines are centered at ���, and are the betterresolved, the larger the sampling time T is. This is demon-strated in Figs. 2�b� and 2�c� where the evolution of a D2
+
wave packet with an initial FC distribution �a��0�� isfrequency-analyzed for T=3 and 10 ps, respectively. Forsampling times that are long on the vibrational time scaleTvib, the complex-valued distribution
TIME-SERIES ANALYSIS OF VIBRATIONAL NUCLEAR ... PHYSICAL REVIEW A 77, 063401 �2008�
063401-3
T��� �1
2�
0
T
dtei�t, �14�
=1
�ei�T/2sin��T/2�
��15�
in Eq. �13� approaches the real-valued delta “function” T���→ ��� up to the irrelevant overall phase factor ei�T/2,
and d�R ,� ;T� approaches its limit of infinite energy reso-
lution d�R ,� ;�. The strength of all vertical lines in thepower spectrum is proportional to T�0�2= �T / �2���2. Theseproperties of T��� imply that the R-dependent structure inthe wave-function product ��
��R���R� appears most clearly
in the finite-time-Fourier-transformation spectrum d�R ,� ;T�for large sampling times and for ��0, i.e., near the beatfrequencies ���,. In order to resolve adjacent beat frequen-cies in the spectrum �12�, the sampling time needs to besufficiently large to guarantee that
���,�+1 � ��T �4�
T. �16�
A few examples for the dependence of the frequency reso-
lution in d�R ,� ;T� on T are given in Table I. As the tableshows, a sampling time of 800 fs is barely large enough toresolve beats of adjacent stationary vibrational eigenstates inD2
+, while they can be resolved for T�3 ps.
Each series of vertical lines in d�R ,� ;T� is defined by aspecific vibrational gap ��. Due to the specific anharmonic-ity of the 1s�g
+ potential curve of D2+, lines in the ��=1
series are ordered as ��0,1���1,2���2,3�¯. Similarly,the ��=2 series consists of vertical lines at the beat frequen-
cies ��0,2���1,3���2,4�¯ in the graph of d�R ,� ;T�versus R and � �Fig. 3�b��.
Closer inspection of Eq. �12� reveals that the R-dependent
structure in each vertical line in d�R ,� ;T�2 maps the nodesof the stationary vibrational wave functions �Figs. 2�b� and2�c��. The intensities of the lines at ���, are proportional tothe products ��
��R���R�2, and each line displays a certainnumber of nodes which is equal to the sum �+ of the nodesof the two vibrational states �� and �. Due to the largeoverlap of the probability between successive stationary vi-brational states in Eq. �12�, lines of the ��=1 series aremapped with the largest intensities, while larger values of ��lead to a less intense portrait of the R-dependency in theproduct ��
��R���R� �Figs. 3�b� and 3�c��.
3. Imaging molecular potential curves
Ultrashort pump pulses generate vibrational wave packetsas a linear combination of many bound stationary vibrationalstates ����. Since each wave function ���R� retraces the in-terface between classically allowed and forbidden internu-clear distances by the onset of the exponentially decayingprobability density, R-dependent power spectra offer the pos-sibility to map the shape of molecular potential curves. In-deed, our simulations in Figs. 2�b� and 2�c� show contoursthat resemble the shape of the 1s�g
+ potential curve of D2+.
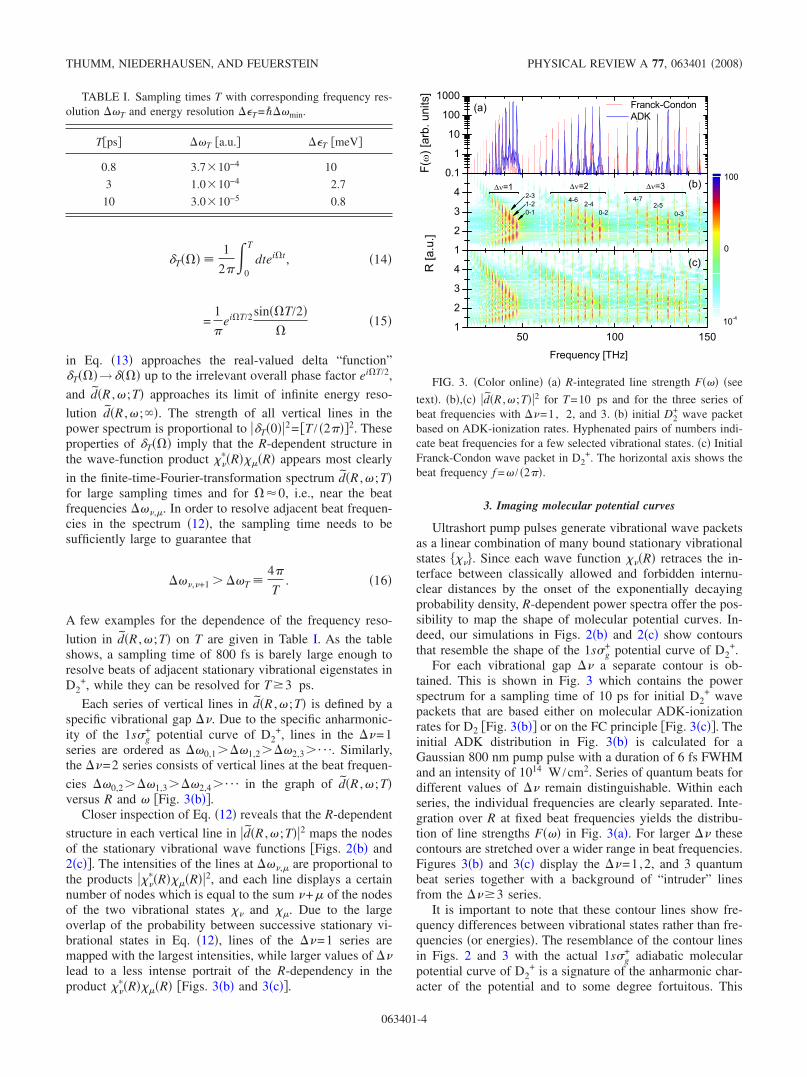
For each vibrational gap �� a separate contour is ob-tained. This is shown in Fig. 3 which contains the powerspectrum for a sampling time of 10 ps for initial D2
+ wavepackets that are based either on molecular ADK-ionizationrates for D2 �Fig. 3�b�� or on the FC principle �Fig. 3�c��. Theinitial ADK distribution in Fig. 3�b� is calculated for aGaussian 800 nm pump pulse with a duration of 6 fs FWHMand an intensity of 1014 W /cm2. Series of quantum beats fordifferent values of �� remain distinguishable. Within eachseries, the individual frequencies are clearly separated. Inte-gration over R at fixed beat frequencies yields the distribu-tion of line strengths F��� in Fig. 3�a�. For larger �� thesecontours are stretched over a wider range in beat frequencies.Figures 3�b� and 3�c� display the ��=1,2, and 3 quantumbeat series together with a background of “intruder” linesfrom the ���3 series.
It is important to note that these contour lines show fre-quency differences between vibrational states rather than fre-quencies �or energies�. The resemblance of the contour linesin Figs. 2 and 3 with the actual 1s�g
+ adiabatic molecularpotential curve of D2
+ is a signature of the anharmonic char-acter of the potential and to some degree fortuitous. This
TABLE I. Sampling times T with corresponding frequency res-olution ��T and energy resolution ��T=���min.
T�ps� ��T �a.u.� ��T �meV�
0.8 3.7�10−4 10
3 1.0�10−4 2.7
10 3.0�10−5 0.8
FIG. 3. �Color online� �a� R-integrated line strength F��� �see
text�. �b�,�c� d�R ,� ;T�2 for T=10 ps and for the three series ofbeat frequencies with ��=1, 2, and 3. �b� initial D2
+ wave packetbased on ADK-ionization rates. Hyphenated pairs of numbers indi-cate beat frequencies for a few selected vibrational states. �c� InitialFranck-Condon wave packet in D2
+. The horizontal axis shows thebeat frequency f =� / �2��.
THUMM, NIEDERHAUSEN, AND FEUERSTEIN PHYSICAL REVIEW A 77, 063401 �2008�
063401-4
becomes immediately obvious by considering a harmonicpotential curve. Since all energy eigenvalues �n+0.5��HO ofthe harmonic oscillator are equally spaced, all quantum beatfrequencies for two levels of a given �� series collapse on asingle line at frequency ���HO in the beat spectrum. In orderto obtain the actual molecular potential curves, the beat fre-quencies, together with all corresponding vertical lines of theR-dependent quantum beat spectrum, need to be mappedonto the sequence ���
recon� of the reconstructed stationary vi-brational state energies according to
��recon = �
=1
�
��,−1 + �ref. �17�
This simple transformation provides the molecular potentialenergy curve up to an undetermined reference energy �ref.
4. Amplitude reconstruction
In order to reconstruct the initial vibrational wave packet,the complex expansion coefficients �a��0� ,�=1, . . . ,N� inEq. �1� need to be obtained based on the information con-tained in the KER spectrum. Each coefficient a�= a�ei�� isdetermined by its amplitude a� and phase ��. In this sub-section we will describe how the amplitudes a� can be ex-tracted from the KER spectra.
While the reconstruction of the expansion coefficients �upto an undetermined global phase factor� could be achievedby a direct fit of the probability density that is given by thesquared absolute value of Eq. �1� to the corresponding CE-imaged probability density derived from a measured KERspectrum, the Fourier-transformation method we going to ap-ply appears to be more accurate for the following reasons. �i�A direct fit would be nonlinear since the probability densityis quadratic in the expansion coefficients. Therefore, startingwith the definition of a chi-squared merit function, the bestfit to the set of N complex amplitudes �ak� had to be deter-mined iteratively. This iterative procedure is prone to desta-bilization, lack of convergence, and loss of precision �36�.�ii� A direct fit would not take advantage of the periodicity intime of the bound probability density that originates in beat-ing vibrational components while Fourier transformation re-veals time-periodic structures efficiently.
Continuing with the investigation of the Fourier-transformed probability density, we note that for large sam-pling times T, satisfying the condition �16�, individual beat
terms d�,�R ,� ;T� in the R-dependent spectrum �12� do notoverlap, such that the power spectrum simplifies to the inco-herent sum
d�R,�;T�2 = �,�
d,��R,�;T�2. �18�
The reconstruction of the amplitudes is then convenientlycarried out with the help of the definitions
F����k� � 0
dRRkd�R,�;T�2
= 2�a�2a2 T����, − ��2R�,�k� � I�,
�k� , �19�
R�,�k� �
0
dRRk����R���R�2, �20�
I�,�k� �
1
2�
���,−�/2
���,+�/2
d�I�,�k� , �21�
=2�a�2a2R�,�k� D�,��� , �22�
and
D�,��� �1
2�
���,−�/2
���,+�/2
d� T����, − ��2
=cos��T
2 � − 1
�2�2 +T
2��2Si��T
2� . �23�
Note that due to �i� our assumption of a sampling time that islarge enough to satisfy Eq. �16�, i.e., large enough to fullyresolve the beat spectrum and �ii� the anharmonicity of theground-state adiabatic potential curve of D2
+ �that results innonequal ���,�+�� within a given �� series�, only one termof the sum �18� contributes to Eq. �19� at any given beat
frequency �. The parameter � in the frequency average I�,�k�
is determined by the experimental frequency resolution andneeds to be smaller or equal than the level spacings. Theoverlap integral R�,
�k� can be calculated from the numericallyknown vibrational D2
+ wave functions. The integrals D�,���are known analytically, in terms of the sine-integral functionSi�x���0
xdxsinx /x.With these definitions, the recipe for the reconstruction of
the amplitudes �a� ,�=1. . .N� consists of the followingsteps: �i� measure the KER spectrum as a function of thepump-probe delay by CE imaging, �ii� derive the time-delay-dependent nuclear probability density d�R , t� from the KERspectrum, �iii� for a given sampling time interval T of time
delays, Fourier transform d�R , t� to obtain d�R ,� ;T�, �iv�compute I�,
�k� from d�R ,� ;T� and R�,�k� from the numerically
known vibrational eigenstates ����, in order to obtain the setof real and positive numbers
K�,�k� �
I�,�k�
2�R�,�k� D�,���
, �24�
�v� solve the system of equations
a�2a2 = K�,�k� . �25�
The amplitude reconstruction can be performed based on anyk�0—moment R�,
�k� . The exact reconstruction of the ampli-tudes does not depend on k. Thus, performing the amplitudereconstruction separately for several orders k, the depen-dence of the reconstructed amplitudes on k is indicative forthe achieved accuracy. Obviously, the larger k is, the moreemphasis is put on large R, i.e., on small values of the KER,and vice versa. This leaves some flexibility for adjusting theamplitude reconstruction to the finite range in KER �that isR� values that are accurately measured �37�. The preferredvalue of k emphasizes the range in internuclear distances Rthat are most accurately extracted by CE mapping from the
TIME-SERIES ANALYSIS OF VIBRATIONAL NUCLEAR ... PHYSICAL REVIEW A 77, 063401 �2008�
063401-5
measured KER. Instead of simply using a power of the in-ternuclear distance Rk as weight factor in the definition �20�,the amplitudes can also be reconstructed for more physicallymotivated weight factors such as, e.g., the molecular ADKrate for the ionization of the molecular ion.
In practise a subset of either N−1 or N equations of thesystem of N2 Eqs. �25� will be selected, depending onwhether dissociation occurs or not, respectively. If dissocia-tion can be neglected, one additional equation is provided bythe conservation of the wave-packet norm ��a�2=1. Aguide for the appropriate selection of a subset of equations isgiven by the magnitude of the numbers K�,
�k� that is related tothe experimental count rate. Equations with the largest right-hand sides K�,
�k� are expected to be the best choice, leading tothe most accurate reconstruction of �a� ,�=1, . . . ,N�.
For our numerical example, we chose the frequency-resolution parameter � equal to the average spacing betweenthe relevant neighboring beat frequencies within the ��=1series. The area under a peak in Fig. 3�a� that is centered at
���, is given by I�,�k� �22�. In order to reconstruct the wave
packet amplitudes from the simulated R-dependent powerspectrum in Fig. 3, we chose the lowest moment �k=0� in
Eqs. �20� and �22�. We then calculated R�,�+1�0� , I�,�+1
�0� , andK�,�+1
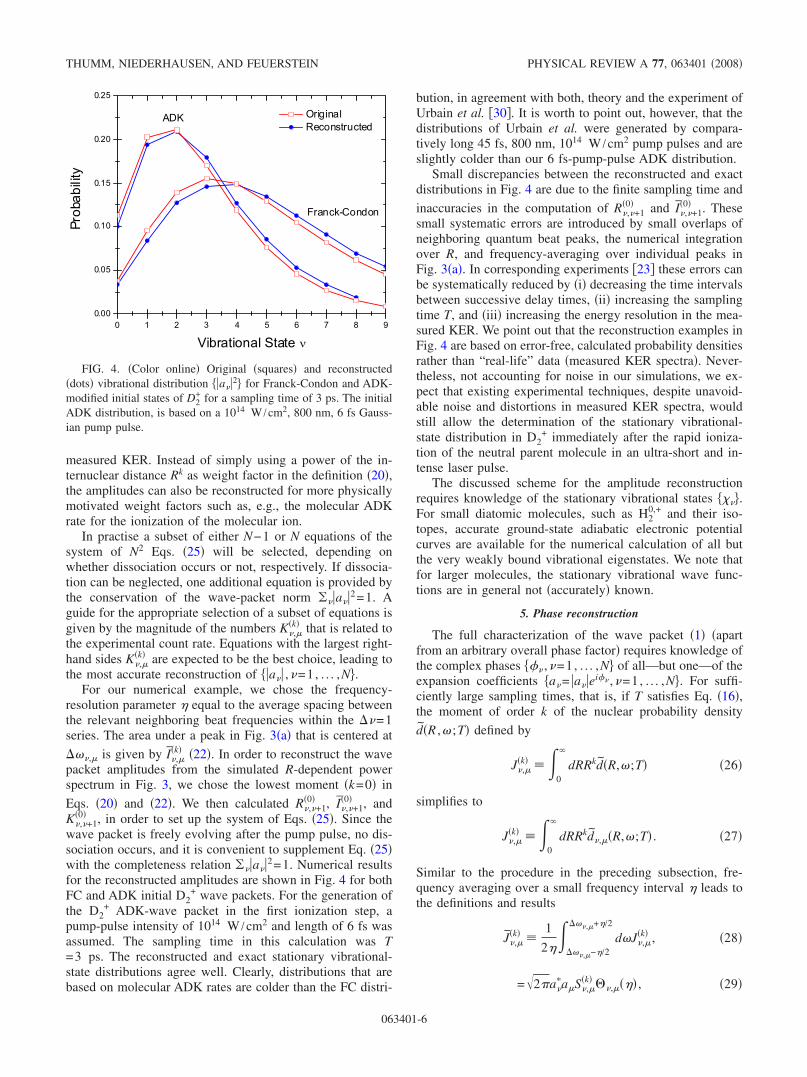
�0� , in order to set up the system of Eqs. �25�. Since thewave packet is freely evolving after the pump pulse, no dis-sociation occurs, and it is convenient to supplement Eq. �25�with the completeness relation ��a�2=1. Numerical resultsfor the reconstructed amplitudes are shown in Fig. 4 for bothFC and ADK initial D2
+ wave packets. For the generation ofthe D2
+ ADK-wave packet in the first ionization step, apump-pulse intensity of 1014 W /cm2 and length of 6 fs wasassumed. The sampling time in this calculation was T=3 ps. The reconstructed and exact stationary vibrational-state distributions agree well. Clearly, distributions that arebased on molecular ADK rates are colder than the FC distri-
bution, in agreement with both, theory and the experiment ofUrbain et al. �30�. It is worth to point out, however, that thedistributions of Urbain et al. were generated by compara-tively long 45 fs, 800 nm, 1014 W /cm2 pump pulses and areslightly colder than our 6 fs-pump-pulse ADK distribution.
Small discrepancies between the reconstructed and exactdistributions in Fig. 4 are due to the finite sampling time and
inaccuracies in the computation of R�,�+1�0� and I�,�+1
�0� . Thesesmall systematic errors are introduced by small overlaps ofneighboring quantum beat peaks, the numerical integrationover R, and frequency-averaging over individual peaks inFig. 3�a�. In corresponding experiments �23� these errors canbe systematically reduced by �i� decreasing the time intervalsbetween successive delay times, �ii� increasing the samplingtime T, and �iii� increasing the energy resolution in the mea-sured KER. We point out that the reconstruction examples inFig. 4 are based on error-free, calculated probability densitiesrather than “real-life” data �measured KER spectra�. Never-theless, not accounting for noise in our simulations, we ex-pect that existing experimental techniques, despite unavoid-able noise and distortions in measured KER spectra, wouldstill allow the determination of the stationary vibrational-state distribution in D2
+ immediately after the rapid ioniza-tion of the neutral parent molecule in an ultra-short and in-tense laser pulse.
The discussed scheme for the amplitude reconstructionrequires knowledge of the stationary vibrational states ����.For small diatomic molecules, such as H2
0,+ and their iso-topes, accurate ground-state adiabatic electronic potentialcurves are available for the numerical calculation of all butthe very weakly bound vibrational eigenstates. We note thatfor larger molecules, the stationary vibrational wave func-tions are in general not �accurately� known.
5. Phase reconstruction
The full characterization of the wave packet �1� �apartfrom an arbitrary overall phase factor� requires knowledge ofthe complex phases ��� ,�=1, . . . ,N� of all—but one—of theexpansion coefficients �a�= a�ei�� ,�=1, . . . ,N�. For suffi-ciently large sampling times, that is, if T satisfies Eq. �16�,the moment of order k of the nuclear probability density
d�R ,� ;T� defined by
J�,�k� �
0
dRRkd�R,�;T� �26�
simplifies to
J�,�k� �
0
dRRkd�,�R,�;T� . �27�
Similar to the procedure in the preceding subsection, fre-quency averaging over a small frequency interval � leads tothe definitions and results
J�,�k� �
1
2�
���,−�/2
���,+�/2
d�J�,�k� , �28�
=�2�a��aS�,
�k� ��,��� , �29�
FIG. 4. �Color online� Original �squares� and reconstructed�dots� vibrational distribution �a�2� for Franck-Condon and ADK-modified initial states of D2
+ for a sampling time of 3 ps. The initialADK distribution, is based on a 1014 W /cm2, 800 nm, 6 fs Gauss-ian pump pulse.
THUMM, NIEDERHAUSEN, AND FEUERSTEIN PHYSICAL REVIEW A 77, 063401 �2008�
063401-6
S�,�k� � dRRk���R����R� , �30�
and
��,��� �1
2�
���,−�/2
���,+�/2
d� T����, − �� =1
2��Si��T
2� .
�31�
As for the amplitude reconstruction, � is determined by theexperimental frequency resolution and needs to be smallerthan all relevant level spacings. The integrals S�,
�k� and��,��� are known numerically and analytically, respec-tively. Note that J�,
�0� � �,, due to the orthogonality of thevibrational wave functions. Thus, in contrast to the amplitudereconstruction, the k=0 moment cannot be used for the phasereconstruction. The phase reconstruction can be performedbased on any k�0—moment J�,
�k� . As for the amplitude re-construction, the preferred value for k depends on the rangein internuclear distances R that are most conveniently ex-tracted from the measured KER by Coulomb explosion map-ping. Note further, that all wave functions ���R�, and thusS�,
�k� , can be assumed to be real valued.In analogy to the amplitude reconstruction, a recipe for
the reconstruction of the phase information in the superposi-tion �1� is now easily compiled. Steps �i�–�iii�, leading to the
compilation of d�R ,� ;T� from the KER spectrum, are iden-
tical and will not be repeated: �iv� compute J�,�k� from
d�R ,� ;T� and S�,�k� from the numerically known vibrational
eigenstates ����, in order to obtain the set of complex num-bers
L�,�k� �
J�,�k�
�2�S�,�k� ��,���
�32�
and �v� solve the system of equations
a��a = L�,
�k� . �33�
At this point several strategies can be applied in order toextract all complex expansion coefficients �a� ,�=1, . . . ,N�.Assuming that the amplitudes �a� ,�=1, . . . ,N� have alreadybeen reconstructed, Eq. �33� is best rewritten as
a�aei���−�� = L�,�k� , �34�
which, since ��,����0, implies that
�� − � = � arg J�,�k� for � S�,
�k� � 0, �35�
where “arg” designates the argument of a complex number.Since the exact reconstruction of the phases does not dependon k, the dependence of the reconstructed phases on k isindicative for the achieved accuracy.
An alternative strategy for reconstructing the initial wavepacket �1� consist in selecting a total number of 2N−1 equa-tions from the set of amplitude and phase reconstructionequations �25� and �33�, and the normalization condition inorder to determine all N complex expansion coefficients upto one overall phase factor. We note that knowledge of thestationary vibrational states in principle would also allow for
the reconstruction of amplitudes �and all relative phases� byleast-square fitting the time- and R-dependent probabilitydensity. However, this fit would be difficult to perform inpractice and less accurate than the procedure we suggest. Theadvantage of the suggested phase- and amplitude-reconstruction scheme is that it relies on a Fourier analysiswhich efficiently extracts the harmonics constituents given atthe vibrational beat frequencies.
B. Dissociation
1. R-dependent Fourier analysis
The time-dependent nuclear probability density d�r , t� im-ages the dissociating part of the wave packet as jetlike struc-tures that extend to large R within a short time near the peakvalues of the oscillating laser-electric force, while the delay-dependent KER spectrum shows dissociation as monotoni-cally decreasing energy releases for increasing delay times�6,10,28�. While we focused in Sec. II A on bound nuclearmotion in the D2
+ molecule, we now turn our attention todissociation which, strongly dependent on the intensity andshape of pump and probe laser pulses, will distort the timeevolution of the bound wave packet to a variable degree.Allowing for dissociation, we generalize Eq. �1� by includingcontinuum states �E of energy E of D2
+,
��R,t� = ��=0
N
a�e−i��t���R� + 0
dEaEe−iEt�E�R� . �36�
Including continuum states, the harmonic analysis of �yields two distinct terms in addition to Eq. �12�. In the limitof large sampling times �T→� we find
d�R,�;� = �2�� ��,=0
N
a��a��
��R���R� ����, − ��
+ ��=0
N 0
dE����R��E�R��a�
�aE ��� − E − ��
+ aE�a� �E − �� − ���
+ 0
dEdE�aE�aE��E
��R��E��R� �E − E� − ��� .
�37�
The last term is diffuse in R and � and appears as an back-ground at larger internuclear distances in d�R ,� ;�. Thesecond term is less diffuse in � than the third term and maymap some of the nodal structure of higher excited boundvibrational states.
2. Bond-hardened and bond-softened states
Laser-induced molecular dissociation and transientlytrapped molecular states, such as bond-softening �BS��2,18,19,38–40�, bond-hardening �BH� �2,20,21,39–41�, orabove threshold dissociation �17,42�, are often and conve-niently explained within the Floquet picture �43� in terms of�laser-electric-field-� dressed molecular potential curves. For
TIME-SERIES ANALYSIS OF VIBRATIONAL NUCLEAR ... PHYSICAL REVIEW A 77, 063401 �2008�
063401-7

sufficiently long and intense laser pulses, transiently trappedstates may exist in the shallow well of a dressed potentialcurve of a molecule or molecular ion �20,23�. For a diatomicmolecule, we expect the nodes of vibrational-state contribu-tions to these “bond-hardened” states to emerge most distinc-
tively in the ��=1 series in d�R ,� ;T� at larger values of R.Compared to the vibrational-state contributions of a boundnuclear wave packet, transient bond-hardened states are ex-pected to appear fainter and somewhat blurred near �=���,�+1, due to dissociation. As one might expect, for theultrashort pump pulses and the free wave-packet propagationunderlying the results shown in Figs. 2 and 3, we find noevidence for bond-hardened states.
Our goal in this subsection is to illustrate that theR-dependent Fourier analysis introduced in Sec. II A is alsosuitable for observing dynamical characteristics of a movingwave packet that is exposed to a laser field. Our numericalsimulations in Sec. II have illustrated this method for theimaging of the ground-state molecular potential curve ofD2
+. Here the question arises, under which conditions dy-namic features such as dressed, bond-hardened and -softenedstates emerge and how clearly they can be analyzed with thehelp of our R-dependent Fourier transformation-imagingscheme.
An intuitive answer might be that they do not emerge atall in fs laser pulses since the Floquet approach is based onthe periodicity of the laser-electric field and thus restricted tocomparatively long pulses, while highly resolvedR-dependent Fourier imaging requests pump and probepulses that are short on the time scale of the nuclear motion.However, the addition of a comparatively weak and long“background” intensity profile may allow these states toevolve such that dressed potential curves can be imaged.Following up on this speculation, we note that ultrashortfew-fs pulses produced in the laboratory appear to sit onrather long pedestals. These pedestals are typically around100 fs long at 5% of the peak intensity for 7 fs laser pulses�10,37,44�. They are long enough to validate the Floquetpicture during the motion of the nuclear wave packet be-tween the fs pump pulse and the leading edge of the fs probepulse, weak enough to prevent severe dissociative losses, butstrong enough to lead to a noticeable distortion �dressing� offield-free potential curves.
In order to illustrate the mapping of the nuclear dynamicsin dressed potentials, we numerically investigated the influ-ence of a pedestal at the probe pulse in wave-packet-propagation simulations. Figure 5�a� shows our results for 50fs, 800 nm, 5�1013 W /cm2 Gaussian pedestals. The pedes-tal is centered at the probe pulse. This means that the vibra-tional wave packet is propagated through the first half of theprobe-pulse pedestal up to the given pump-probe delay im-mediately preceding the probe step. Performing many sepa-rate propagation calculations for pump-probe delay times be-tween 0 and T, we obtained the time series d�R , t� andFourier transformed it. The actual shape of the fs probe pulseis not included. We thus implicitly assume an ideal probepulse that instantaneously ionizes the molecular ion, withoutfurther distorting its vibrational-state distribution and at-tribute any change of the vibrational distribution by the
probe process solely to the leading half of the probe-pulsepedestal. For simplicity and in order to have higher vibra-tional states populated, an initial FC distribution is assumed.
Compared to the field-free propagation of the initial FCwave packet �see Fig. 3�c�� Fig. 5�a� shows several interest-ing features. A significant part of the nuclear probability den-sity of the wave packet appears in the classically forbiddenregion at large R for frequencies between f �30 and 40 THz.In addition, trapped states emerge at R�6 near 20 THz. Inthe Floquet picture �42�, the field-free 1s�g and the photon-energy shifted 2p�u potential curves combine to form thefield-dressed adiabatic potential curves. These dressed poten-tial curves enable BS and BH and correspond to the darkcontour lines indicated in Fig. 5�a�, while the diabaticdressed potential curve is represented by the white contourline �see Sec. II A 3 for the correspondence between contourlines in the quantum beat spectrum and potential curves�. BSis responsible for the dissociation of the higher vibrationalstates, and is imaged in Fig. 5�a� as vertical lines that extendto large internuclear separations in the avoided crossing re-gion. As the electric field increases during the pulse, the gapbetween the adiabatic potential curves increases and allowsfor the over-the-barrier dissociation and tunnel ionization oflower vibrational states. The figure maps the lowest light-induced potential well and shows a second light-induced po-tential well that causes the transient trapping of a small partof the nuclear probability density, i.e., BH.
The shape of short laser pulses can be determined usingthe Spectral Phase Interferometry for Direct Electric-fieldReconstruction �SPIDER� technique �45�. The SPIDER-analyzed intensity profile of the pulses used in the experi-ment �23� shown in the inset of Fig. 2�a� is reproduced in theinset of Fig. 5�b�. It exhibits a pedestal of approximately 100fs length as well as a pronounced prepulse before the mainpeak. We started the wave-packet propagation calculations inFig. 5�b� with an initial ADK wave packet in D2
+ that wasprovided by a 6 fs Gaussian pump pulse with a peak inten-
FIG. 5. �Color online� Power spectrum as a function of thefrequency f and the internuclear distance R. �a� Propagation of aninitial Franck-Condon wave packet with the inclusion of a 5�1013 W /cm2, 50 fs �full width at half maximum �FWHM�� ped-estal at the probe pulse causing “bond hardening” �BH� and “bondsoftening” �BS�. The wave packet is sampled at the center of theprobe pedestal. �b� Initial ADK-populated wave packet after aGaussian 3�1014 W /cm2, 6 fs pump pulse. The pedestal of a mea-sured laser pulse profile �inset� is added for the propagation duringthe remainder of the pump pulse and preceding the Coulomb explo-sion by the probe pulse. Both graphs show the beat frequency f=� / �2�� along the horizontal axis.
THUMM, NIEDERHAUSEN, AND FEUERSTEIN PHYSICAL REVIEW A 77, 063401 �2008�
063401-8

sities of 3�1014 W /cm2. The wave packet was subse-quently propagated through the second half of the measuredSPIDER pulse profile, starting at time t=0. Immediately pre-ceding the probe-pulse-delay time it was propagated underthe influence of the first half of the SPIDER pulse. The Cou-lomb explosion of D2
+ from the 1s�g and 2p�u channelsduring the probe pulse is modeled by �i� the R-dependent
molecular ADK rates �gD2
+�R ,E�t�� and �u
D2+�R ,E�t�� and by
�ii� incoherently adding the probabilities for ionization out ofthese two channels
�CE�R� = −
�1 − e−�gD2
+�R,E�t��t��g�R,t�2dt
+ −
�1 − e−�uD2
+�R,E�t��t��u�R,t�2dt . �38�
In this model �and throughout this paper� we neglect thekinetic energy of the wave packet at the time of the ioniza-tion, but include the R-dependent ionization rates leading tothe Coulomb explosion. The spectrum agrees reasonablywell with the experimental data shown in the inset of Fig.2�b�. The vertical lines between f =30 and 40 THz extendingto large R are caused by dissociation in the SPIDER-pulsepedestal, while no evidence is found for the occurrence ofbond hardening states at the given laser parameters. Thenodal structure disappears, even for the lowest bound vibra-tional states.
3. Pulse length and intensity dependenceof bond softening and hardening
While the proposed R-dependent imaging method is gen-eral and can, in principle, be applied to any kind of electronicor nuclear dynamics, it may be employed to question thephysical significance of dressed states and the validity of theFloquet interpretation as a function of the laser pulse lengthsand intensities. With this in mind, we carried out a series ofsimulations in which the lengths and intensities of the probe-pulse pedestals were varied. The propagation calculationswere performed for Gaussian pedestals and provide thequantum-beat spectrum that an ideal superimposed probepulse would detect. The probe pulse is thus assumed to in-stantaneously ionize the molecular ion. As in the previoussubsection, only the leading half of the probe-pulse pedestal,not the probe pulse itself, is included in the simulations, i.e.,we propagated the molecular wave function up to the peakintensity of the pedestal. As for the results shown in Fig.5�a�, no pump-pulse pedestal is included.
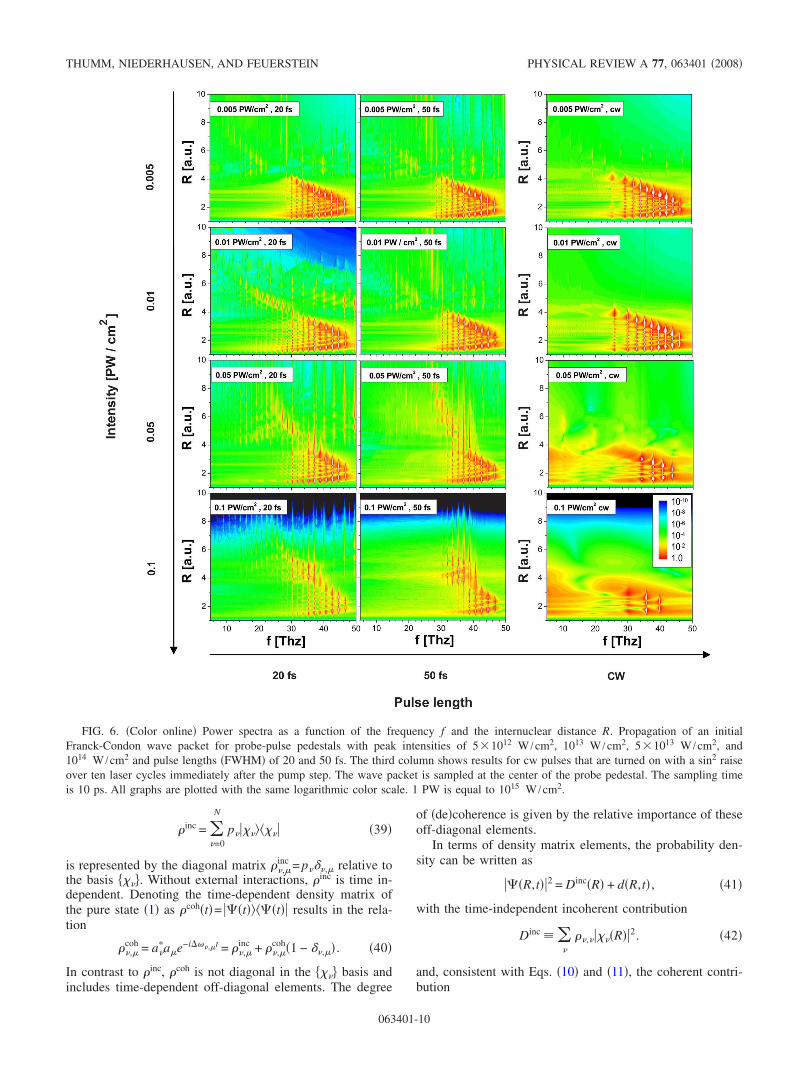
The graphs in Fig. 6 are ordered as a matrix with pedestalintensities increasing from 5�1012 W /cm2 �top row� to1014 W /cm2 �bottom row�. The pedestal lengths �FWHM�are 20 fs �first column� and 50 fs �second column�. The thirdcolumn shows the limit of long probe pedestals �cw�. The cwpulses were turned on over 10 optical cycles with a sine-squared envelope function immediately after the pump step.The color coding is the same for all graphs and extends over10 orders of magnitude. BS appears as vertical stripes that“shoot out” of the undisturbed ��=1—beat spectrum of thelowest adiabatic potential curve. For higher peak intensities
of the probe-pulse pedestal, BS depletes the highest vibra-tional levels which tends to prevent the population of BHstates.
For a pedestal length of 50 fs and pedestal intensities upto 5�1013 W /cm2, BS across the 1−� barrier and BH inthe 1−� BH well are easily visible in Fig. 6. The 1−� BHstates appear at frequencies below 25 THz at internucleardistances between approximately 4 and 8. At the two highestintensities, dissociation across the 3−� barrier and weak evi-dence for BH in the 3−� BH well of the dressed D2
+ adia-batic Floquet potential are imaged. At the highest shown in-tensity �1014 W /cm2� and for 50 fs probe pedestals, allhigher lying vibrational states are removed by BS before thepeak intensity of the probe pulse pedestal is reached, and BHat the 1−� crossing has completely disappeared.
We note that BS appears as probability density outside theclassically allowed regime of the laser-field-free potential inthe two left columns of Fig. 6 �and also in Fig. 5�a��. This isdue to intensity averaging in the following sense. Since asampling time of 10 ps was used in Fig. 6, by far most timedelays are long enough for the molecular wave packet topropagate freely most of the time. This leads to the imagingof �part of� the field-free ground-state molecular potentialcurves in the two left columns of Fig. 6. However, immedi-ately before the probe pulse destroys the molecular ion, itevolves through the probe-pulse pedestal and dissociates intothe 1−� channel at lower intensities and into the 1−� and3�2�−� channels at the highest shown pedestal intensities.Thus, since the Fourier analysis integrates over both, freepropagation and propagation with BS in the probe-pulse ped-estal, BS in Figs. 6 and 5�a� is mapped with superimposedfree-propagation characteristics, i.e., in the classically forbid-den region of the laser-field-free potential curve.
In the long pulse limit, for cw probe pedestals, the wid-ening of the field-dressed 1s�g molecular potential curvewith increasing laser intensity explains the shift towardlower beat frequencies in Fig. 6. Due to the comparativelylarge pulse energy, BH states do not appear. As for the finite-length pulses, dissociation by BS depletes the boundvibrational-states distribution from above. However, BS doesnot appear as vertical stripes in the power spectra, as onemight expect, since it happens early on in the cw pulse and,in the average over the entire time series, long before the endof the propagation interval.
III. DECOHERENCE
The time-series analysis of KER data can be extended andused in order to quantify the degree of coherence in a nuclearvibrational wave packet. With this goal in mind, we extendour analysis by allowing for both, coherent and incoherentmixtures �p� ,��� of bound vibrationally excited states. Forthe clarity of the presentation only, we do not include con-tinuum states ��E�R�� of the molecular ion in this section.The numbers p�= a�2 represent the probabilities for findinga given stationary vibrational state �� in the statistical mix-ture. The corresponding density operator
TIME-SERIES ANALYSIS OF VIBRATIONAL NUCLEAR ... PHYSICAL REVIEW A 77, 063401 �2008�
063401-9
�inc = ��=0
N
p������ �39�
is represented by the diagonal matrix ��,inc = p� �, relative to
the basis ����. Without external interactions, �inc is time in-dependent. Denoting the time-dependent density matrix ofthe pure state �1� as �coh�t�= ��t����t� results in the rela-tion
��,coh = a�
�ae−i���,t = ��,inc + ��,
coh�1 − �,� . �40�
In contrast to �inc, �coh is not diagonal in the ���� basis andincludes time-dependent off-diagonal elements. The degree
of �de�coherence is given by the relative importance of theseoff-diagonal elements.
In terms of density matrix elements, the probability den-sity can be written as
��R,t�2 = Dinc�R� + d�R,t� , �41�
with the time-independent incoherent contribution
Dinc � ��
��,����R�2. �42�
and, consistent with Eqs. �10� and �11�, the coherent contri-bution
FIG. 6. �Color online� Power spectra as a function of the frequency f and the internuclear distance R. Propagation of an initialFranck-Condon wave packet for probe-pulse pedestals with peak intensities of 5�1012 W /cm2, 1013 W /cm2, 5�1013 W /cm2, and1014 W /cm2 and pulse lengths �FWHM� of 20 and 50 fs. The third column shows results for cw pulses that are turned on with a sin2 raiseover ten laser cycles immediately after the pump step. The wave packet is sampled at the center of the probe pedestal. The sampling timeis 10 ps. All graphs are plotted with the same logarithmic color scale. 1 PW is equal to 1015 W /cm2.
THUMM, NIEDERHAUSEN, AND FEUERSTEIN PHYSICAL REVIEW A 77, 063401 �2008�
063401-10
d�R,t� = ���
��,coh�t���
��R���R� . �43�
In the harmonic analysis the incoherent contribution Dinc at��0 is imaged as a diffuse background over the entire rangeof classically allowed internuclear distances and is subtractedin the definition d�R ,� ;T� in Eq. �11�.
The continuous loss of coherence of the vibrational wavepacket due to weak randomly fluctuating external forces canbe imaged as a sequence of finite-time Fourier transforma-tions �12� for a series of increasing sampling times Ti. Morespecifically, by modeling decoherence in terms of an addi-tional random phase factor in each expansion coefficient ofthe wave packet, i.e., by replacing the set of complex num-bers �a�� that characterize the coherent wave packet by�a��t��a� exp�i���t��� with random phases ���t�, the har-monic analysis of Eq. �41� for finite T results in
d�R,�;T� =1
�2����
����R���R�
� 0
T
dta���t�a�t�ei����,−��t. �44�
The coherent contributions in Eq. �41� disappear in the limitof very large time intervals �0,T�, such that for increasing
sampling times lines in d�R ,� ;T� at frequencies ���,�0eventually fade away. Thus, as T becomes much larger thanthe typical decoherence time Td of the molecules in theirenvironment, only the incoherent contribution Dinc to Eq.�41� remains, while
d�R,�;T � Td� → 0. �45�
The time series of spectra �d�R ,� ,Ti�T1�T2�¯�, ob-tained by measuring the kinetic energy release over a rangeof pump-probe delays of the order of Td constitutes a meansto quantify the degree of �de�coherence in the nuclear mo-tion. This is of possible interest to quantum information stor-age and quantum computing. As an integrated measure forthe degree of decoherence, we suggest to relate the totalcoherent intensity
F � d�F����k� = ���
I�,�k� �46�
to total incoherent contribution
Dinc � 0
dRDinc�R�2. �47�
The function �coh�T�� F / Dinc then provides a measure forthe progression of decoherence for increasing T. Clearly, forvery large T, random-phase fluctuations imply that �coh�T�→0.
IV. CONCLUSIONS
R-dependent Fourier transformation imaging has been ap-plied to analyze the nuclear motion in D2
+. This imagingmethod displays the nodal structure of bound vibrationalstates of the lowest adiabatic potential curve of the molecularion and the corresponding vibrational transition energies.Furthermore it offers the prospect of imaging laser-dressedmolecular potential curves based on a time series of mea-sured kinetic energy release spectra. Extensions of thismethod include �i� the full reconstruction of the initial wavepacket and �ii� the quantitative analysis of the progression ofdecoherence in the nuclear motion due to couplings with theenvironment.
The imaging scheme proposed in this work is based onCE explosion mapping of the nuclear motion in molecules.As CE mapping requests instant ionization, one may betempted to conclude that our analysis relies on ideal, ul-trashort laser pulses in order to validate CE mapping. Byincluding a relative long, low intensity pedestal in probe-pulse profile, our simulations indicate how a “real life” probepulse may distort an ideal CE image.
At what level of accuracy field-free and field-dressed po-tential curves can be deduced from measured KER spectra asdiscussed in this work remains to be investigated in futureexperiments. First experiments �23� are encouraging.
ACKNOWLEDGMENTS
We are grateful to Artem Rudenko, Thorsten Ergler, andRobert Moshammer for many stimulating discussions. Wealso thank Joachim Ullrich for his careful review of an earlyversion of this manuscript and valuable suggestions. One ofus �U.T.� acknowledges the hospitality of the Max-PlanckInstitute for Nuclear Physics in Heidelberg where part of thiswork was performed. This work was supported by the NSFand the Division of Chemical Sciences, Office of Basic En-ergy Sciences, Office of Energy Research, and U.S. DOE.
�1� A. H. Zewail, J. Phys. Chem. A 104, 5660 �2000�.�2� J. H. Posthumus, Rep. Prog. Phys. 67, 623 �2004�.�3� I. V. Hertel and W. Radloff, Rep. Prog. Phys. 69, 1897 �2006�.�4� T. Brixner, G. Krampert, T. Pfeifer, R. Selle, G. Gerber, M.
Wollenhaupt, O. Graefe, C. Horn, D. Liese, and T. Baumert,Phys. Rev. Lett. 92, 208301 �2004�.
�5� A. S. Alnaser, X. M. Tong, T. Osipov, S. Voss, C. M. Mahar-jan, P. Ranitovic, B. Ulrich, B. Shan, Z. Chang, C. D. Lin, and
C. L. Cocke, Phys. Rev. Lett. 93, 183202 �2004�.�6� A. S. Alnaser, B. Ulrich, X.M. Tong, I. V. Litvinyuk, C.M.
Maharjan, P. Ranitovic, T. Osipov, R. Ali, S. Ghimire, Z.Chang, C.D. Lin, and C.L. Cocke, Phys. Rev. A 72, 030702�R��2005�.
�7� A. Bhattacharjee and K. R. Dastidar, Phys. Rev. A 72, 023419�2005�.
�8� T. Ergler, A. Rudenko, B. Feuerstein, K. Zrost, C. D. Schröter,
TIME-SERIES ANALYSIS OF VIBRATIONAL NUCLEAR ... PHYSICAL REVIEW A 77, 063401 �2008�
063401-11
R. Moshammer, and J. Ullrich, Phys. Rev. Lett. 95, 093001�2005�.
�9� T. Ergler, B. Feuerstein, A. Rudenko, K. Zrost, C. D. Schröter,R. Moshammer, and J. Ullrich, Phys. Rev. Lett. 97, 103004�2006�.
�10� A. Rudenko, T. Ergler, B. Feuerstein, K. Zrost, C. D. Schröter,R. Moshammer, and J. Ullrich, Chem. Phys. 329, 193 �2006�.
�11� H. Niikura, D. M. Villeneuve, and P. B. Corkum, Phys. Rev. A73, 021402�R� �2006�.
�12� J. H. Posthumus, J. Plumridge, P. F. Taday, J. H. Sanderson, A.J. Langley, K. Codling, and W. A. Bryan, J. Phys. B 32, L93�1999�.
�13� C. Trump, H. Rottke, and W. Sandner, Phys. Rev. A 59, 2858�1999�.
�14� S. Chelkovski and A. D. Bandrauk, Phys. Rev. A 65, 023403�2002�.
�15� B. Feuerstein and U. Thumm, Phys. Rev. A 67, 043405�2003�.
�16� B. Feuerstein and U. Thumm, Phys. Rev. A 67, 063408�2003�.
�17� A. Staudte, D. Paviçic, S. Chelkowski, D. Zeidler, M. Meckel,H. Niikura, M. Schöffler, S. Schössler, B. Ulrich, P. P. Rajeev,T. Weber, T. Jahnke, D. M. Villeneuve, A. D. Bandrauk, C. L.Cocke, P. B. Corkum, and R. Dörner, Phys. Rev. Lett. 98,073003 �2007�.
�18� A. D. Bandrauk and L. M. Sink, J. Chem. Phys. 74, 1110�1981�.
�19� P. H. Bucksbaum, A. Zavriyev, H. G. Muller, and D. W. Schu-macher, Phys. Rev. Lett. 64, 1883 �1990�.
�20� L. J. Frasinski, J. H. Posthumus, J. Plumridge, K. Codling, P. F.Taday, and A. J. Langley, Phys. Rev. Lett. 83, 3625 �1999�.
�21� L. J. Frasinski, J. Plumridge, J. H. Posthumus, K. Codling, P. F.Taday, E. J. Divall, and A. J. Langley, Phys. Rev. Lett. 86,2541 �2001�.
�22� H. Schwoerer, P. Pausch, M. Heid, and W. Kiefer, Chem. Phys.Lett. 285, 240 �1998�.
�23� B. Feuerstein, T. Ergler, A. Rudenko, K. Zrost, C. D. Schröter,R. Moshammer, J. Ullrich, T. Niederhausen, and U. Thumm,Phys. Rev. Lett. 99, 153002 �2007�.
�24� H. Niikura, D. M. Villeneuve, and P. B. Corkum, Phys. Rev.Lett. 92, 133002 �2004�.
�25� D. S. Murphy, J. McKenna, C. R. Calcert, I. D. Williams, andJ. F. McCann, New J. Phys. 9, 260 �2007�.
�26� T. Niederhausen and U. Thumm, Phys. Rev. A 77, 013407�2008�.
�27� J. McKenna, W. A. Bryan, C. R. Calvert, E. M. L. English, J.Wood, D. S. Murphy, I. C. E. Turcu, J. M. Smith, K. G. Ertel,O. Chekhlov, E. J. Divali, J. F. McCann, W. R. Newell, and I.D. Williams, J. Mod. Opt. 54, 1127 �2007�.
�28� T. Ergler, A. Rudenko, B. Feuerstein, K. Zrost, C. D. Schröter,R. Moshammer, and J. Ullrich, Phys. Rev. Lett. 97, 193001�2006�.
�29� A. Saenz, J. Phys. B 33, 4365 �2000�.�30� X. Urbain, B. Fabre, E. M. Staicu-Casagrande, N. de Ruette, V.
M. Andrianarijaona, J. Jureta, J. H. Posthumus, A. Saenz, E.Baldit, and C. Cornaggia, Phys. Rev. Lett. 92, 163004 �2004�.
�31� J. P. Brichta, W.-K. Liu, A. A. Zaidi, A. Trottier, and J. H.Sanderson, J. Phys. B 39, 3769 �2006�.
�32� M. V. Ammosov, N. B. Delone, and V. P. Krainov, Zh. Eksp.Teor. Fiz. 91, 2008 �1986�; M. V. Ammosov, N. B. Delone,and V. P. Krainov, Sov. Phys. JETP 64, 1191 �1986�.
�33� X. M. Tong, Z. X. Zhao, and C. D. Lin, Phys. Rev. A 66,033402 �2002�.
�34� D. R. Bates, K. Ledsham, and A. L. Stewart, Philos. Trans. R.Soc. London, Sect. A 246, 215 �1953�.
�35� K. C. Kulander, F. H. Mies, and K. J. Schafer, Phys. Rev. A53, 2562 �1996�.
�36� W. H. Press, S. A. Teukolsky, W. T. Vetterling, and B. P. Flan-nery, Numerical Recipes �Cambridge University Press, Cam-bridge, England, 1992�.
�37� R. Moshammer �private communication�.�38� I. D. Williams, P. McKenna, B. Srigengan, I. M. G. Johnston,
W. A. Bryan, J. H. Sanderson, A. El-Zein, T. R. J. Goodworth,W. R. Newell, P. F. Taday, and A. J. Langley, J. Phys. B 33,2743 �2000�.
�39� K. Sändig, H. Figger, and T. W. Hänsch, Phys. Rev. Lett. 85,4876 �2000�.
�40� H. Abou-Rachid, T. T. Nguyen-Dang, and O. Atabek, J. Chem.Phys. 114, 2197 �2001�.
�41� A. Giusti-Suzor and F. H. Mies, Phys. Rev. Lett. 68, 3869�1992�.
�42� A. Giusti-Suzor, X. He, O. Atabek, and F. H. Mies, Phys. Rev.Lett. 64, 515 �1990�.
�43� S. R. Barone, M. A. Narcowich, and F. J. Narcowich, Phys.Rev. A 15, 1109 �1977�.
�44� F. Légaré and F. K. Lee, I. V. Litvinyuk, P. W. Dooley, A. D.Bandrauk, D. M. Villeneuve, and P. B. Corkum, Phys. Rev. A72, 052717 �2005�.
�45� C. Iaconis and A. Walmsley, Opt. Lett. 23, 792 �1998�.
THUMM, NIEDERHAUSEN, AND FEUERSTEIN PHYSICAL REVIEW A 77, 063401 �2008�
063401-12