Time-Based Joining Method for Generating Phylogenetic...
12
Time-Based Joining Method for Generating Phylogenetic Trees of Architectural Plans Sungil Ham, Ph.D. 1 ; and Ghang Lee, Ph.D. 2 Abstract: A method has been developed for automatically generating a phylogenetic tree of architectural plans based on graph theory, according to the properties of the plans and the timing of their appearance. A phylogenetic tree of architectural plans is a branching diagram that shows transitions of the architectural plans by period. In previous studies, researchers analyzed structural similarities and differences between architectural plans by comparing one floor plan to another. Such manual classification processes sometimes result in inconsistent classifications and are inefficient, especially when a large number of plans are compared and analyzed. In this paper, a new algorithmic approach is proposed, termed the time-based joining (TBJ) method, for quantitatively evaluating structural similarities between architectural plans and creating a phylogenetic tree of the analyzed architectural plans. The validity and consistency of the TBJ method’ s results were tested by generating a phylogenetic tree of 422 collective housing unit plans in Seoul, South Korea, constructed from 1970 to 2010. DOI: 10.1061/ (ASCE)CP.1943-5487.0000626. © 2016 American Society of Civil Engineers. Author keywords: Phylogenic tree; Time-based joining method; Spatial similarity. Introduction A phylogenetic tree of architectural plans is a branching diagram that shows transitions in architectural plans by period, considering topological spatial relationships and the times at which various types appeared. For a long time, many studies have been conducted to generate a phylogenetic tree or a classification of architectural plans, especially in the context of architectural history and theo- ries (Alexander 1979; Caniggia and Maffei 2001; Franck and Schneekloth 1994; Madge 2007; Rapoport 1969). As biological terms are commonly used to describe concepts and elements of hierarchical structures in many fields of study, such as inheritance, class, family, child node, and parent node in computer science, the previous studies on phylogenetic trees and classifications of ar- chitectural plans also commonly borrow terms from biology, such as genotype (Bafna 2001; Dahabreh 2006; Gero and Ding 1997), ancestor, decedent, child, and parent. Early architectural-plan studies often compared one floor plan to another based on the researchers’ judgment regarding the characteristics of floor plans. Such manual analysis processes are time-consuming and may produce biased or inconsistent results. To overcome these limitations, several efforts have been under- taken for developing a quantitative floor plan analysis (Manum 2005; Markus 1993) and classification method (Bafna 2001; Bandyopadhyay and Merchant 2006; Bustard 1999; Dahabreh 2006; Guney and Wineman 2008; Hanson 2003; Hillier and Hanson 1984; Lee 2004; Seo 2005). Still, the generation of a phy- logenetic tree of architectural plan types in these efforts also depended primarily on the qualitative judgment of researchers and was also time-consuming. This study proposes a new graph theory–based algorithmic approach, the time-based joining (TBJ) method. In this method, structural similarities and differences between architectural plans are quantitatively evaluated, plans are categorized by type, and a phylogenetic tree of the analyzed architectural plan types is gen- erated. In assessing the similarity of tree structures, several algorithms are commonly deployed, such as the unweighted pair group method with arithmetic mean (UPGMA) (Sokal and Michener 1958), the transformed distance method that supplements UPGMA (Farris 1977), the neighbor’ s relation method (Sattath and Tversky 1977), and the neighbor-joining (NJ) method (Saitou and Nei 1987); these are also commonly used in creating biological phylogenetic trees (Bergstrom and Dugatkin 2011). The authors preliminarily tried to adopt these phylogenetic tree generation algorithms. However, these methods returned trees that were nonsensical in terms of the timing of the appearance of the architectural plans, because the algorithms rely only on the simi- larity of subjects’ features and do not include the timing of their appearance as a factor. Thus, in the TBJ method, the timing of the appearance of the architectural plans was added as a key addi- tional factor in analyzing the similarities between architectural plans—hence, the naming of the newly proposed method as the time-based joining (TBJ) method. This study focuses especially on the transitional history of ar- chitectural plans for collective housing in South Korea. Collective housing is the main residential building type in South Korea, exceeding 70% of housing types in 2010 (Statistics Korea 2010); the detached house is the main type of residential building in most countries. This unique culture was initiated in the 1970s by the Korean government, which tried to supply a large amount of fine- quality residences in the shortest time possible to the people who had lost their houses during the Korean War in the early 1950s. In Korea, collective housing units are called apartments, whether they are rented or owned by the occupants. As a research subject, collective housing is an interesting res- idential building type, because it reflects the culture of the times better than any other type of residential building, especially because 1 Research Professor, Dept. of Interior Architecture and Built Environ- ment, Yonsei Univ., Seoul, Korea. E-mail: [email protected] 2 Professor, Dept. of Architectural Engineering, Yonsei Univ., A512 Engineering Hall I, 50 Yonsei-ro, Seodaemun-Gu, Seoul 120-749, Korea (corresponding author). E-mail: [email protected] Note. This manuscript was submitted on June 20, 2015; approved on June 29, 2016; published online on September 26, 2016. Discussion period open until February 26, 2017; separate discussions must be submitted for individual papers. This paper is part of the Journal of Computing in Civil Engineering, © ASCE, ISSN 0887-3801. © ASCE 04016055-1 J. Comput. Civ. Eng. J. Comput. Civ. Eng., 04016055 Downloaded from ascelibrary.org by Yonsei University Library on 11/03/16. Copyright ASCE. For personal use only; all rights reserved.
Transcript of Time-Based Joining Method for Generating Phylogenetic...
Time-Based Joining Method for GeneratingPhylogenetic Trees of Architectural Plans
Sungil Ham, Ph.D.1; and Ghang Lee, Ph.D.2
Abstract: A method has been developed for automatically generating a phylogenetic tree of architectural plans based on graph theory,
according to the properties of the plans and the timing of their appearance. A phylogenetic tree of architectural plans is a branching diagram
that shows transitions of the architectural plans by period. In previous studies, researchers analyzed structural similarities and differences
between architectural plans by comparing one floor plan to another. Such manual classification processes sometimes result in inconsistent
classifications and are inefficient, especially when a large number of plans are compared and analyzed. In this paper, a new algorithmic
approach is proposed, termed the time-based joining (TBJ) method, for quantitatively evaluating structural similarities between architectural
plans and creating a phylogenetic tree of the analyzed architectural plans. The validity and consistency of the TBJ method’s results were tested
by generating a phylogenetic tree of 422 collective housing unit plans in Seoul, South Korea, constructed from 1970 to 2010. DOI: 10.1061/
(ASCE)CP.1943-5487.0000626. © 2016 American Society of Civil Engineers.
Author keywords: Phylogenic tree; Time-based joining method; Spatial similarity.
Introduction
A phylogenetic tree of architectural plans is a branching diagram
that shows transitions in architectural plans by period, considering
topological spatial relationships and the times at which various
types appeared. For a long time, many studies have been conducted
to generate a phylogenetic tree or a classification of architectural
plans, especially in the context of architectural history and theo-
ries (Alexander 1979; Caniggia and Maffei 2001; Franck and
Schneekloth 1994; Madge 2007; Rapoport 1969). As biological
terms are commonly used to describe concepts and elements of
hierarchical structures in many fields of study, such as inheritance,
class, family, child node, and parent node in computer science,
the previous studies on phylogenetic trees and classifications of ar-
chitectural plans also commonly borrow terms from biology, such
as genotype (Bafna 2001; Dahabreh 2006; Gero and Ding 1997),
ancestor, decedent, child, and parent.
Early architectural-plan studies often compared one floor plan
to another based on the researchers’ judgment regarding the
characteristics of floor plans. Such manual analysis processes are
time-consuming and may produce biased or inconsistent results.
To overcome these limitations, several efforts have been under-
taken for developing a quantitative floor plan analysis (Manum
2005; Markus 1993) and classification method (Bafna 2001;
Bandyopadhyay and Merchant 2006; Bustard 1999; Dahabreh
2006; Guney and Wineman 2008; Hanson 2003; Hillier and
Hanson 1984; Lee 2004; Seo 2005). Still, the generation of a phy-
logenetic tree of architectural plan types in these efforts also
depended primarily on the qualitative judgment of researchers
and was also time-consuming.
This study proposes a new graph theory–based algorithmic
approach, the time-based joining (TBJ) method. In this method,
structural similarities and differences between architectural plans
are quantitatively evaluated, plans are categorized by type, and a
phylogenetic tree of the analyzed architectural plan types is gen-
erated. In assessing the similarity of tree structures, several
algorithms are commonly deployed, such as the unweighted
pair group method with arithmetic mean (UPGMA) (Sokal and
Michener 1958), the transformed distance method that supplements
UPGMA (Farris 1977), the neighbor’s relation method (Sattath and
Tversky 1977), and the neighbor-joining (NJ) method (Saitou and
Nei 1987); these are also commonly used in creating biological
phylogenetic trees (Bergstrom and Dugatkin 2011).
The authors preliminarily tried to adopt these phylogenetic tree
generation algorithms. However, these methods returned trees that
were nonsensical in terms of the timing of the appearance of the
architectural plans, because the algorithms rely only on the simi-
larity of subjects’ features and do not include the timing of their
appearance as a factor. Thus, in the TBJ method, the timing of
the appearance of the architectural plans was added as a key addi-
tional factor in analyzing the similarities between architectural
plans—hence, the naming of the newly proposed method as the
time-based joining (TBJ) method.
This study focuses especially on the transitional history of ar-
chitectural plans for collective housing in South Korea. Collective
housing is the main residential building type in South Korea,
exceeding 70% of housing types in 2010 (Statistics Korea 2010);
the detached house is the main type of residential building in most
countries. This unique culture was initiated in the 1970s by the
Korean government, which tried to supply a large amount of fine-
quality residences in the shortest time possible to the people who
had lost their houses during the Korean War in the early 1950s.
In Korea, collective housing units are called apartments, whether
they are rented or owned by the occupants.
As a research subject, collective housing is an interesting res-
idential building type, because it reflects the culture of the times
better than any other type of residential building, especially because
1Research Professor, Dept. of Interior Architecture and Built Environ-
ment, Yonsei Univ., Seoul, Korea. E-mail: [email protected], Dept. of Architectural Engineering, Yonsei Univ., A512
Engineering Hall I, 50 Yonsei-ro, Seodaemun-Gu, Seoul 120-749, Korea
(corresponding author). E-mail: [email protected]
Note. This manuscript was submitted on June 20, 2015; approved on
June 29, 2016; published online on September 26, 2016. Discussion period
open until February 26, 2017; separate discussions must be submitted for
individual papers. This paper is part of the Journal of Computing in Civil
Engineering, © ASCE, ISSN 0887-3801.
© ASCE 04016055-1 J. Comput. Civ. Eng.
J. Comput. Civ. Eng., 04016055
Dow
nloa
ded
from
asc
elib
rary
.org
by
Yon
sei U
nive
rsity
Lib
rary
on
11/0
3/16
. Cop
yrig
ht A
SCE
. For
per
sona
l use
onl
y; a
ll ri
ghts
res
erve
d.

collective housing is designed and built according to the utilitarian
philosophy of “the greatest happiness of the greatest number”
rather than according to personal preferences.
The next section reviews previous studies on the theories related
to space phylogenetic trees, the similarity analysis methods in
graph theory, and algorithms that are commonly used for generat-
ing phylogenetic tress. Then, the TBJ algorithm is described and
validated by comparing the analysis results between TBJ and the
NJ method, the most commonly used phylogenetic-tree generation
method.
Previous Studies
In this section, the basic premise of space phylogenetic tree studies
based on existing theories is discussed first. Second, previous
studies focusing on quantitative analyses of architectural plans
are reviewed; a broader review regarding qualitative analyses of
transitions of architectural plans is impractical because these have
been a key topic in architectural history, theory, and criticism, and
thus are too numerous to review with both coherence and brevity.
Third, methods are described for evaluating similarities between
graphs. Finally, existing studies on phylogenetic tree generation
algorithms based on graph similarity are reviewed.
Premise of Space Phylogenetic Tree Studies
Buildings are social objects (Markus 1993) and tend to change over
time, reflecting the sociocultural changes. However, the basic
premise of a space phylogenetic tree is that building design tends
to remain consistent, especially for residential buildings within
a region. With very few exceptions, designs do not randomly or
radically change according to immediate demands, but tend to con-
form to factors that do not easily change, such as natural environ-
ment, customs, and traditions. Generation after generation, the
principles of spatial structure and social and cultural factors affect
how designs change, but the modified principles of spatial structure
are never completely new—they are modifications of previous prin-
ciples. This is because there are basic principles of spatial structure
to which any modifications in design must adhere. Bafna (2001)
defined these principles as genotypes. Genotypes represent socio-
logical principles and structures of spatial structure in architecture
that cannot be changed arbitrarily. An architectural space changes
and develops as it forms a type. A plan type is a category of archi-
tectural plans that shares common topological characteristics. Such
changes and transitions create a family. A family is a certain group
of architectural plan types that share similar topological character-
istics (Simpson 2010).
The tree diagram produced through studying families has been
used as a basic categorization method not only in biology but also
in the humanities, sociology, and computer science. Although the
phylogenetic approach has been recognized for providing a new
framework for thinking as it was applied to fields other than
biological evolution, it has also received a lot of criticism and
discussion about the appropriateness of applying it to various other
fields. However, it has contributed greatly to establishing many
hypotheses and to explaining transitional processes of change
and development.
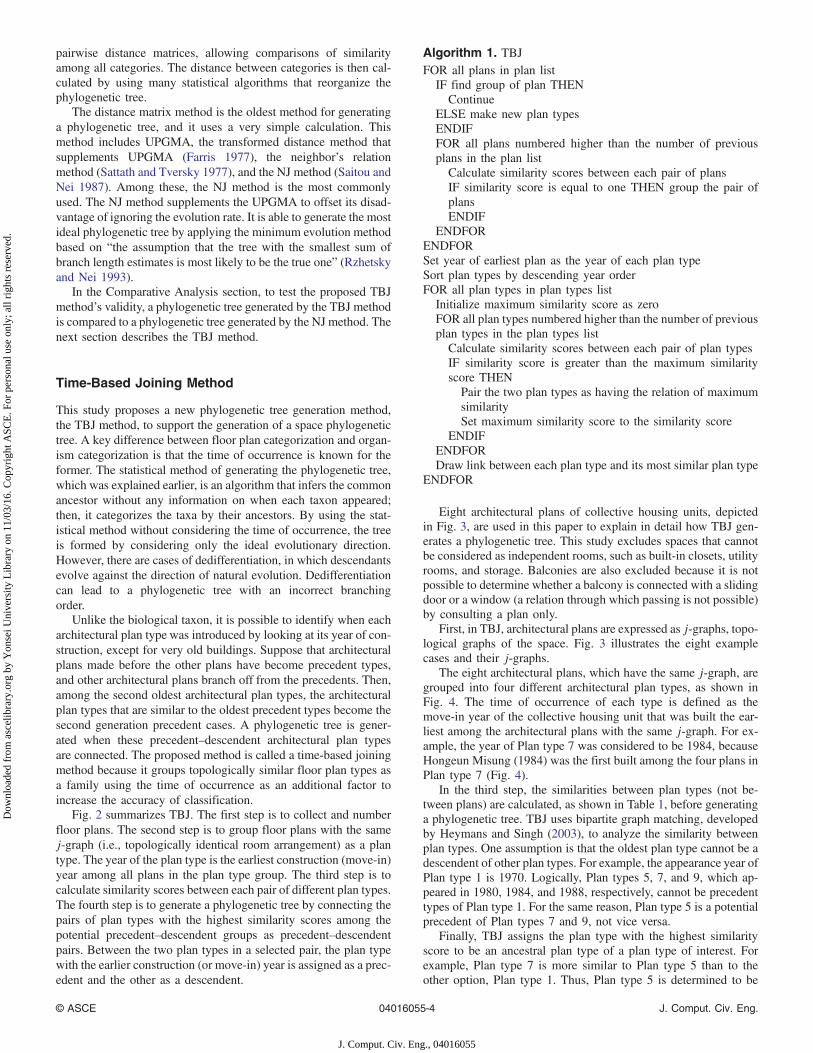
Previous studies use many terms and concepts related with the
phylogenetic tree. This study also adopted them. The definitions of
terms frequently used in this paper are listed in Fig. 1 with an illus-
trated example. A graph consists of objects and their relations. An
object is often represented as a circle or polygon, and a relation as a
line between objects. A graph can be divided into many subgraphs.
In architecture, graphs have commonly been used to represent
the topological relationships between spaces (rooms) rather than
representing the transitional relationships between floor plan
types. The topological relationships between spaces (rooms) are
generally referred to as a plan type. The transitional relationships
between floor plan types are referred to as a space phyloge-
netic tree.
A plan type is the minimum unit (object, node) that constitutes a
space phylogenetic tree. The connection in a space phylogenetic
tree represents the transitional relationships between plan types.
A plan type is often expressed in the form of a justified graph
(j-graph) (Hillier and Hanson 1984). An example of a plan type
is a plan.
A family is generated by finding the most similar plan types and
connecting them to one another. A space phylogenetic tree is com-
posed of families of similar plan types. Members of the same family
branch out from preceding plan types in a space phylogenetic tree
similar to the branching of a person’s family tree.
Quantitative Analyses of Architectural Plans
Quantitative studies of architectural plan types are generally based
on graph theory (Carpenter 1959; Mitchell 1990). The architectural
type is determined by, among other things, “details like the shapes
and peculiar forms of the rooms” (Kourouniotes et al. 1933).
Quantitative analytical studies on spatial structures and types
became active when “Ideas are in things: An application of the
space syntax method to discovering house genotypes” was pub-
lished in 1987 (Hillier et al. 1987). This study analyzed the archi-
tectural plans of 17 residential buildings in Normandy, France,
using j-graphs. The findings showed that there is a certain pattern
by which architectural plans can be categorized by type, and that a
study can be conducted on genotypes of space construction using
this pattern.
Based on this methodology, a study was conducted on collective
housing units in Ankara, Turkey, from 1920 to 1990 (Guney and
Wineman 2008), reporting that a specific arrangement is found
when architectural plans are categorized by the mean depth and
integration values using relative asymmetry (RA) values of rooms
(Hillier and Hanson 1984). Bandyopadhyay and Merchant (2006)
studied residential buildings during the colonial era in India and
stated that there exists a consistent pattern in the real RA (RRA)
value (Hillier and Hanson 1984). In addition, in a study of residen-
ces in Chaco Canyon, New Mexico (Bustard 1999), the integration
value (Hillier and Hanson 1984), defined as the inverse of RRA
(1/RRA), of a room was found to differ by period, and each period
had its own space type. Dalton and Kirsan (2008) introduced a
more developed methodology in which they deleted, inserted,
and substituted the points and lines that represent the relationship
between spaces to calculate the cost, which is the number of mod-
ifications required for one space graph to become the same as
another. To validate their algorithm, they analyzed the similarities
of architectural plans of residential buildings in Cyprus and
obtained a type.
In summary, previous studies used the network distance be-
tween certain rooms (j-graph and mean depth), integration of
rooms (RA and RRA), and the geometric cost of transforming
one plan to another. The methods proposed in previous studies have
many advantages in deriving the common factors (genes) between
spatial structural patterns (plan types) as well as the relationship
between plan types. However, there are other broadly used graph
similarity analysis methods and phylogenetic tree generation
methods. The next section reviews these methods.
© ASCE 04016055-2 J. Comput. Civ. Eng.
J. Comput. Civ. Eng., 04016055
Dow
nloa
ded
from
asc
elib
rary
.org
by
Yon
sei U
nive
rsity
Lib
rary
on
11/0
3/16
. Cop
yrig
ht A
SCE
. For
per
sona
l use
onl
y; a
ll ri
ghts
res
erve
d.
Graph Similarity Analysis
Graphs have been used in various fields, not only in architecture but
also, for example, for data modeling, geographic information sys-
tems, and chemistry, and to study the timeline of human evolution.
Several mathematical and statistical approaches for analyzing
graph similarity have been developed for various purposes (Bunke
1997; Bunke et al. 2000; Fernandez and Valiente 2001; Stevens
1957). This section reviews the iterative method used for graph
similarity analysis and phylogenetic tree generation methods.
The iterative method (Jeh and Widom 2002; Kleinberg 1999;
Melnik et al. 2002) is the most commonly used graph similarity
analysis method. It has a special characteristic in that it analyzes
the relationship between nodes by not only calculating the distance
between them, but also assigning weights to neighboring nodes.
Based on the iterative method, bipartite graph matching
(Heymans and Singh 2003) evaluates the similarity between fam-
ilies by comparing the similarity between metabolic pathways. This
approach has the advantage of having an analysis library and graph
comparative metabolic pathway tool (PWComp) (Adelman 2003).
The bipartite (similarity) score between graphs G1 and G2 is
calculated through the following process (Heymans and Singh
2003): The bipartite score of all node pairs (a, b) in which a ∈ G1
and b ∈ G2 is calculated by repeating the calculation process.
The similarity between two nodes (a, b) can be computed by
adding the similarity of connected nodes and then subtracting
the difference. In the second stage, the obtained bipartite score
is used to find the best matching between graphs. In this way, bi-
partite graphs are formed and mutual graph matching is performed.
Once the G1’s set V1 and G2’s set V2 are obtained, the bipartite
graph G ¼ ðV1;V2; SÞ, containing similarity matrix S, can be gen-
erated. In the third stage, the bipartite evaluations between all pairs
of compared nodes are recalculated. The similarity score can be
obtained through the optimal matching that was previously derived
from graphs G1 and G2. Finally, the bipartite score of the two
graphs is calculated by summing up the bipartite scores of com-
pared nodes and standardizing the resultant values. For details
on the bipartite graph-matching algorithm, refer to Heymans and
Singh (2003).
Phylogenetic Tree Generation Methods
Graph similarity analysis methods do not generate phylogenetic
trees. Developed from traditional phylogenetic studies in biology,
computer-based statistical methods are used for phylogenetic
studies in molecular biology for comparing deoxyribonucleic acid
(DNA), genes, and metabolic routes. Very complex arithmetic op-
erations are required to calculate which phylogenetic tree best
explains the evolutionary process based on similarities between
categories. Grouping and categorizing objects based on similarity
is called clustering or distance calculation. This technique generates
Architecture
Spatial phylogenic treeGraph
Subgraph Family
Plan typeObject
PlanInstance
Example
Fig. 1. Terms used in the spatial phylogenetic tree
© ASCE 04016055-3 J. Comput. Civ. Eng.
J. Comput. Civ. Eng., 04016055
Dow
nloa
ded
from
asc
elib
rary
.org
by
Yon
sei U
nive
rsity
Lib
rary
on
11/0
3/16
. Cop
yrig
ht A
SCE
. For
per
sona
l use
onl
y; a
ll ri
ghts
res
erve
d.
pairwise distance matrices, allowing comparisons of similarity
among all categories. The distance between categories is then cal-
culated by using many statistical algorithms that reorganize the
phylogenetic tree.
The distance matrix method is the oldest method for generating
a phylogenetic tree, and it uses a very simple calculation. This
method includes UPGMA, the transformed distance method that
supplements UPGMA (Farris 1977), the neighbor’s relation
method (Sattath and Tversky 1977), and the NJ method (Saitou and
Nei 1987). Among these, the NJ method is the most commonly
used. The NJ method supplements the UPGMA to offset its disad-
vantage of ignoring the evolution rate. It is able to generate the most
ideal phylogenetic tree by applying the minimum evolution method
based on “the assumption that the tree with the smallest sum of
branch length estimates is most likely to be the true one” (Rzhetsky
and Nei 1993).
In the Comparative Analysis section, to test the proposed TBJ
method’s validity, a phylogenetic tree generated by the TBJ method
is compared to a phylogenetic tree generated by the NJ method. The
next section describes the TBJ method.
Time-Based Joining Method
This study proposes a new phylogenetic tree generation method,
the TBJ method, to support the generation of a space phylogenetic
tree. A key difference between floor plan categorization and organ-
ism categorization is that the time of occurrence is known for the
former. The statistical method of generating the phylogenetic tree,
which was explained earlier, is an algorithm that infers the common
ancestor without any information on when each taxon appeared;
then, it categorizes the taxa by their ancestors. By using the stat-
istical method without considering the time of occurrence, the tree
is formed by considering only the ideal evolutionary direction.
However, there are cases of dedifferentiation, in which descendants
evolve against the direction of natural evolution. Dedifferentiation
can lead to a phylogenetic tree with an incorrect branching
order.
Unlike the biological taxon, it is possible to identify when each
architectural plan type was introduced by looking at its year of con-
struction, except for very old buildings. Suppose that architectural
plans made before the other plans have become precedent types,
and other architectural plans branch off from the precedents. Then,
among the second oldest architectural plan types, the architectural
plan types that are similar to the oldest precedent types become the
second generation precedent cases. A phylogenetic tree is gener-
ated when these precedent–descendent architectural plan types
are connected. The proposed method is called a time-based joining
method because it groups topologically similar floor plan types as
a family using the time of occurrence as an additional factor to
increase the accuracy of classification.
Fig. 2 summarizes TBJ. The first step is to collect and number
floor plans. The second step is to group floor plans with the same
j-graph (i.e., topologically identical room arrangement) as a plan
type. The year of the plan type is the earliest construction (move-in)
year among all plans in the plan type group. The third step is to
calculate similarity scores between each pair of different plan types.
The fourth step is to generate a phylogenetic tree by connecting the
pairs of plan types with the highest similarity scores among the
potential precedent–descendent groups as precedent–descendent
pairs. Between the two plan types in a selected pair, the plan type
with the earlier construction (or move-in) year is assigned as a prec-
edent and the other as a descendent.
Algorithm 1. TBJ
FOR all plans in plan list
IF find group of plan THEN
Continue
ELSE make new plan types
ENDIF
FOR all plans numbered higher than the number of previous
plans in the plan list
Calculate similarity scores between each pair of plans
IF similarity score is equal to one THEN group the pair of
plans
ENDIF
ENDFOR
ENDFOR
Set year of earliest plan as the year of each plan type
Sort plan types by descending year order
FOR all plan types in plan types list
Initialize maximum similarity score as zero
FOR all plan types numbered higher than the number of previous
plan types in the plan types list
Calculate similarity scores between each pair of plan types
IF similarity score is greater than the maximum similarity
score THEN
Pair the two plan types as having the relation of maximum
similarity
Set maximum similarity score to the similarity score
ENDIF
ENDFOR
Draw link between each plan type and its most similar plan type
ENDFOR
Eight architectural plans of collective housing units, depicted
in Fig. 3, are used in this paper to explain in detail how TBJ gen-
erates a phylogenetic tree. This study excludes spaces that cannot
be considered as independent rooms, such as built-in closets, utility
rooms, and storage. Balconies are also excluded because it is not
possible to determine whether a balcony is connected with a sliding
door or a window (a relation through which passing is not possible)
by consulting a plan only.
First, in TBJ, architectural plans are expressed as j-graphs, topo-
logical graphs of the space. Fig. 3 illustrates the eight example
cases and their j-graphs.
The eight architectural plans, which have the same j-graph, are
grouped into four different architectural plan types, as shown in
Fig. 4. The time of occurrence of each type is defined as the
move-in year of the collective housing unit that was built the ear-
liest among the architectural plans with the same j-graph. For ex-
ample, the year of Plan type 7 was considered to be 1984, because
Hongeun Misung (1984) was the first built among the four plans in
Plan type 7 (Fig. 4).
In the third step, the similarities between plan types (not be-
tween plans) are calculated, as shown in Table 1, before generating
a phylogenetic tree. TBJ uses bipartite graph matching, developed
by Heymans and Singh (2003), to analyze the similarity between
plan types. One assumption is that the oldest plan type cannot be a
descendent of other plan types. For example, the appearance year of
Plan type 1 is 1970. Logically, Plan types 5, 7, and 9, which ap-
peared in 1980, 1984, and 1988, respectively, cannot be precedent
types of Plan type 1. For the same reason, Plan type 5 is a potential
precedent of Plan types 7 and 9, not vice versa.
Finally, TBJ assigns the plan type with the highest similarity
score to be an ancestral plan type of a plan type of interest. For
example, Plan type 7 is more similar to Plan type 5 than to the
other option, Plan type 1. Thus, Plan type 5 is determined to be
© ASCE 04016055-4 J. Comput. Civ. Eng.
J. Comput. Civ. Eng., 04016055
Dow
nloa
ded
from
asc
elib
rary
.org
by
Yon
sei U
nive
rsity
Lib
rary
on
11/0
3/16
. Cop
yrig
ht A
SCE
. For
per
sona
l use
onl
y; a
ll ri
ghts
res
erve
d.

Fig. 3. Example architectural plans of collective housing units and j-graphs for generating a phylogenetic tree
Fig. 2. Process of generating a phylogenetic tree by using the TBJ method: (a) collection of architectural plan cases; (b) grouping of architectural
plans with the same j-graphs into types; (c) calculation of similarity scores for each pair of architectural plan types; (d) pairs of plan types with the
highest similarity scores are assigned as precedent–descendent pairs
© ASCE 04016055-5 J. Comput. Civ. Eng.
J. Comput. Civ. Eng., 04016055
Dow
nloa
ded
from
asc
elib
rary
.org
by
Yon
sei U
nive
rsity
Lib
rary
on
11/0
3/16
. Cop
yrig
ht A
SCE
. For
per
sona
l use
onl
y; a
ll ri
ghts
res
erve
d.

the precedent of Plan type 7. Plan type 9 is the most similar to Plan
type 5 among the three precedent options (Plan types 1, 5, and 7).
Thus, both Plan types 7 and 9 become descendants of Plan type 5,
as shown in Fig. 5.
Comparative Analysis
To validate TBJ, phylogenetic trees were generated from 442 ar-
chitectural plans in South Korea from 1970 to 2010: one by using
TBJ and one by using the NJ method described in “Previous
Studies.”
The j-graph of 422 apartment unit plans from 1970 to 2010 used
in the analysis was prepared using the plan images in Sejin-Gihoek
(Editorial Department 2006) (from 1970 to 2006) and KB (2016)
(from 2006 to 2010).
Using these plan images as backgrounds, the drawings were
prepared using a computer-aided design software application.
These drawings were prepared pursuant to the rules of the space-
connector model so that they could be analyzed through the
program. A space-connector model (Ham and Lee 2010) is a sim-
plified spatial map on which spaces are represented as closed poly-
gons based on the inside dimensions of a space, and the relation
between the spaces are represented by the various types of connec-
tors (doors, windows, and virtual boundaries) with different geo-
metric and property values. The space-connector model enables
researchers to analyze not only relationships between spaces but
also physical attributes of spaces, such as the areas of spaces, dis-
tances between them, and the strength of connection (e.g., the width
of a door). Nevertheless, the present study required only j-graphs
that show topological relationships between spaces. As the final
step, j-graphs were extracted from the space-connector maps that
were created in the previous steps. Fig. 6 illustrates this j-graph
generation process using an example.
The subjects of the analysis included architectural plans of
collective housing units that were built for the past 40 years:
between 1970, when South Korea started to build large apartment
complexes, and 2010. For consistency, subjects (422 cases) were
selected to exclude rare apartment unit types and include only
the most common apartment unit type in South Korea, i.e., the
three-bay, two-unit staircase-type (as opposed to multiple-unit
corridor-type) collective housing plans in Seoul, with a floor usa-
ble area of 85 m2. A three-bay unit is a unit whose main area
is composed of three bays, typically a living room between two
bedrooms. A two-unit staircase-type plan is a type of collective
housing floor plan in which two units on the same floor share a
staircase and often also an elevator shaft. The floor usable area
excludes common service areas such as stairs, corridors, and park-
ing lot space.
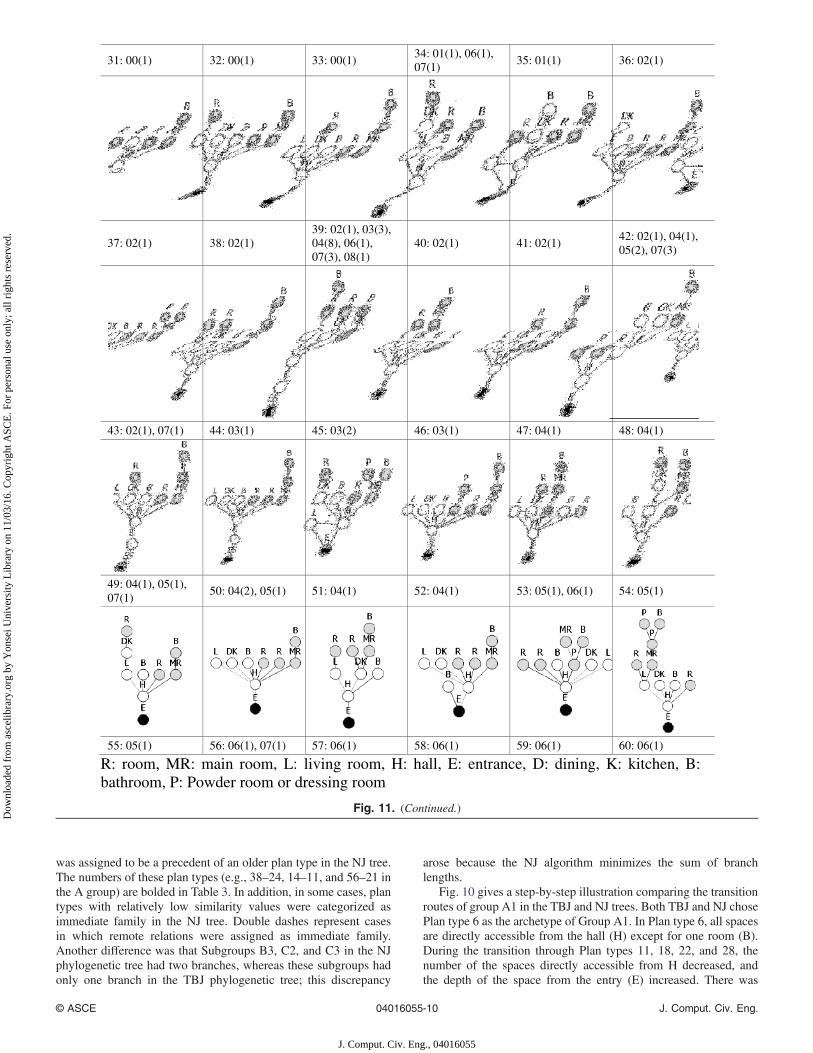
A total of 422 architectural plans were grouped into 60 different
plan types, as shown in the Fig. 11. A phylogenetic tree of the
60 plan types was generated using TBJ (Fig. 7). To generate a
Plan type 1 (1970) Plan type 5 (1980) Plan type 7 (1984) Plan type 9 (1988)
Ichon Hangang (1970) Myeongil Samik Green
(1980)
Daechi Sunkyung I (1983)
Hongeun Misung (1984)
Myeongil Hanyang (1986)
Ssangmun Dongik (1987)
Beondong Jugong I (1991)
Hagye Hyundai (1988)
Fig. 4. Plan type groups with the same spatial structure and j-graphs that represent them
Table 1. Similarities between Plan Types
Descendent Similarity score Possible precedents
Plan type 5 (1980) 0.85 Plan type 1 (1970)
Plan type 7 (1984) 0.88 Plan type 1 (1970)
0.89 Plan type 5 (1980)
Plan type 9 (1988) 0.77 Plan type 1 (1970)
0.89 Plan type 5 (1980)
0.79 Plan type 7 (1984)
Note: Plan types with earlier move-in years are candidates for precedent
plan types.
Descendent Similarity
score Ancestor Phylogenetic tree
Plan type 5
(1980) 0.85
Plan type 1
(1970)
Plan type 7
(1984) 0.88
Plan type 5
(1980)
Plan type 9
(1988) 0.89
Plan type 5
(1980)
Fig. 5. Phylogenetic tree completed based on precedent–descendent relationships between architectural plan types
© ASCE 04016055-6 J. Comput. Civ. Eng.
J. Comput. Civ. Eng., 04016055
Dow
nloa
ded
from
asc
elib
rary
.org
by
Yon
sei U
nive
rsity
Lib
rary
on
11/0
3/16
. Cop
yrig
ht A
SCE
. For
per
sona
l use
onl
y; a
ll ri
ghts
res
erve
d.

phylogenetic tree using NJ, a phylogeny-inferring program
(PHYLIP) (Felsenstein 1989) was used, and the resultant NJ phylo-
genetic tree was visualized by using a program named TreeView
(Page 1996) (Fig. 8).
The plan types categorized by TBJ and NJ can be grouped
into Groups A, B, and C (Figs. 7 and 8). Generally, plan types were
categorized similarly by the two methods, but certain differences
existed between the TBJ and NJ methods. Table 2 lists plan types
in each group and lists the types that were not grouped the same
way by both TBJ and NJ.
The order of transition of each group was also compared.
Without modification, the TBJ tree shown in Fig. 7 was used to
Fig. 7. TBJ phylogenetic tree of 60 plan types generated from 422 apartment unit plans in Seoul, South Korea, from 1970 to 2010
Fig. 8. Rooted phylogenetic tree generated by NJ, using the same data set as that used in the TBJ phylogenetic tree
Fig. 6. Steps to create a space-connector map and a j-graph: (a) select a plan to analyze; (b) extract interior lines; (c) add connectors; (d) create a
simplified space-connector map; (e) extract a j-graph (except balconies)
© ASCE 04016055-7 J. Comput. Civ. Eng.
J. Comput. Civ. Eng., 04016055
Dow
nloa
ded
from
asc
elib
rary
.org
by
Yon
sei U
nive
rsity
Lib
rary
on
11/0
3/16
. Cop
yrig
ht A
SCE
. For
per
sona
l use
onl
y; a
ll ri
ghts
res
erve
d.

analyze the order of transition of each group. However, the NJ tree
had to be reanalyzed first, because, as mentioned previously, NJ
does not consider the occurrence time of a plan type as a classifi-
cation factor, and the orders of branching off in NJ did not follow
the order of the occurrence times.
To learn which plan types are closer to the archetype, the lengths
of branches, which mean the degrees of transition, were analyzed
along with the orders of branching off in the unrooted phylogenetic
tree shown in Fig. 9. For analytical purposes, cases with short
branches that branched off in the beginning were assumed to be
common precedent types.
Table 3 lists the inferred precedent–descendent relationships.
The transition routes of the two trees were very similar in general.
However, several nonsensical cases were observed in the transition
routes of the NJ tree. In eight instances, the more recent plan type
Fig. 9. NJ unrooted phylogenetic tree generated by NJ, using the same data set as that used in the TBJ phylogenetic tree
Table 3. Comparison of the Transition Routes in TBJ and NJ Phylogenetic
Group
Transition routes
in the TBJ tree
Transition routes
in the NJ tree
A1 6-11-18-22-28-34-38 6-11-38-34-22-28
A2 6-11-14-17-20 6-14-11-17-20
A3 6-8-21-56 6-56-21-8
B1 2-3-12-37 3-2-12-37
B2 2-3-13-19-30-54 3-2–13-19-30–54
B3 2-3-13-19-24-31-45 3-2–13-19-24
3-2–13-31-45
C1 5-9-16-25 5-16-9-25
C2 5-9-15-42-44-60 5-9-15
5-42-44-60
C3 5-9-15-39-49 5-9-15-49
5-39
Table 2. Groupings and Mismatches between Phylogenetic Trees Generated by TBJ and NJ
Group TBJ plan types NJ plan types Discording types
Group A 6, 8, 11, 14, 17, 18, 20, 21, 22, 28, 32,
34, 38, 41, 48, 56, 57
8, 11, 14, 17, 20, 21, 22, 28, 32, 34,
38, 42, 44, 48, 56, 60
6, 18, 42, 44, 57, 60
Group B 2, 3, 4, 10, 12, 13, 19, 23, 24, 26, 27,
29, 30, 31, 36, 37, 40, 45, 46, 53, 54, 55
2, 3, 4, 12, 13, 18, 19, 23, 24, 26,
27, 29, 30, 31, 36, 37, 39, 40, 41,
45, 46, 47, 51, 53, 54, 55, 57
10, 18, 39, 41, 47, 51, 57
Group C 5, 7, 9, 15, 16, 25, 33, 35, 39, 42, 43,
44, 47, 49, 50, 51, 52, 58, 59, 60
9, 10, 15, 16, 25, 33, 35, 43, 49, 50,
52, 58, 59
5, 7, 10, 39, 42, 44, 47, 51, 60
MR R R B DK
R
H
E
LL DK B R
H
E
R MR
B
MRRBDK
R
H
E
L
B
TBJ Method
NJ Method
Plan Type 6 Plan Type 11 Plan Type 18 Plan Type 22 Plan Type 28
Plan Type 38 Plan Type 34
0.85 0.84 0.77 0.80
0.89 0.89
0.76
0.89
L DK
B
R
H
E
R MR
B
L
DK
B R
H
E
R MR
B
L DK B R
H
E
R MR
MRRBDK
R
H
E
L
B
Fig. 10. Comparison of the NJ and TBJ methods regarding the transition routes of Group A1
© ASCE 04016055-8 J. Comput. Civ. Eng.
J. Comput. Civ. Eng., 04016055
Dow
nloa
ded
from
asc
elib
rary
.org
by
Yon
sei U
nive
rsity
Lib
rary
on
11/0
3/16
. Cop
yrig
ht A
SCE
. For
per
sona
l use
onl
y; a
ll ri
ghts
res
erve
d.
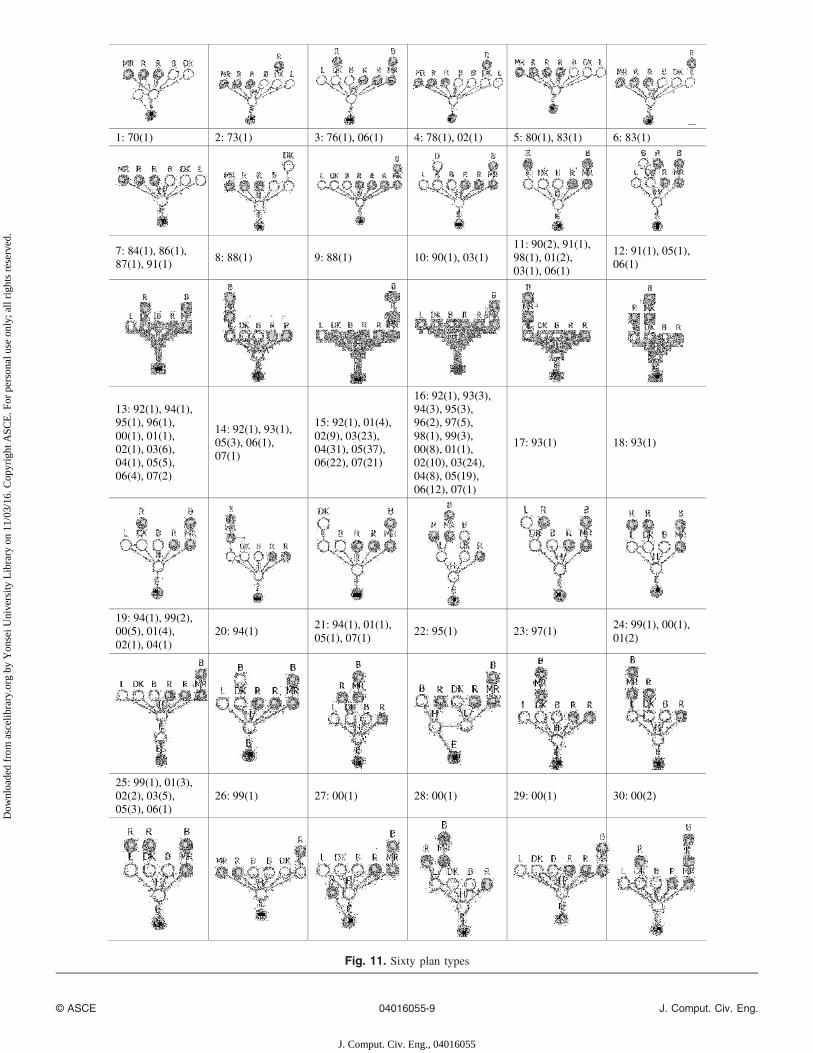
1: 70(1) 2: 73(1) 3: 76(1), 06(1) 4: 78(1), 02(1) 5: 80(1), 83(1) 6: 83(1)
7: 84(1), 86(1),
87(1), 91(1)8: 88(1) 9: 88(1) 10: 90(1), 03(1)
11: 90(2), 91(1),
98(1), 01(2),
03(1), 06(1)
12: 91(1), 05(1),
06(1)
13: 92(1), 94(1),
95(1), 96(1),
00(1), 01(1),
02(1), 03(6),
04(1), 05(5),
06(4), 07(2)
14: 92(1), 93(1),
05(3), 06(1),
07(1)
15: 92(1), 01(4),
02(9), 03(23),
04(31), 05(37),
06(22), 07(21)
16: 92(1), 93(3),
94(3), 95(3),
96(2), 97(5),
98(1), 99(3),
00(8), 01(1),
02(10), 03(24),
04(8), 05(19),
06(12), 07(1)
17: 93(1) 18: 93(1)
19: 94(1), 99(2),
00(5), 01(4),
02(1), 04(1)
20: 94(1)21: 94(1), 01(1),
05(1), 07(1)22: 95(1) 23: 97(1)
24: 99(1), 00(1),
01(2)
25: 99(1), 01(3),
02(2), 03(5),
05(3), 06(1)
26: 99(1) 27: 00(1) 28: 00(1) 29: 00(1) 30: 00(2)
Fig. 11. Sixty plan types
© ASCE 04016055-9 J. Comput. Civ. Eng.
J. Comput. Civ. Eng., 04016055
Dow
nloa
ded
from
asc
elib
rary
.org
by
Yon
sei U
nive
rsity
Lib
rary
on
11/0
3/16
. Cop
yrig
ht A
SCE
. For
per
sona
l use
onl
y; a
ll ri
ghts
res
erve
d.
was assigned to be a precedent of an older plan type in the NJ tree.
The numbers of these plan types (e.g., 38–24, 14–11, and 56–21 in
the A group) are bolded in Table 3. In addition, in some cases, plan
types with relatively low similarity values were categorized as
immediate family in the NJ tree. Double dashes represent cases
in which remote relations were assigned as immediate family.
Another difference was that Subgroups B3, C2, and C3 in the NJ
phylogenetic tree had two branches, whereas these subgroups had
only one branch in the TBJ phylogenetic tree; this discrepancy
arose because the NJ algorithm minimizes the sum of branch
lengths.
Fig. 10 gives a step-by-step illustration comparing the transition
routes of group A1 in the TBJ and NJ trees. Both TBJ and NJ chose
Plan type 6 as the archetype of Group A1. In Plan type 6, all spaces
are directly accessible from the hall (H) except for one room (B).
During the transition through Plan types 11, 18, 22, and 28, the
number of the spaces directly accessible from H decreased, and
the depth of the space from the entry (E) increased. There was
31: 00(1) 32: 00(1) 33: 00(1)34: 01(1), 06(1),
07(1)35: 01(1) 36: 02(1)
37: 02(1) 38: 02(1)
39: 02(1), 03(3),
04(8), 06(1),
07(3), 08(1)
40: 02(1) 41: 02(1)42: 02(1), 04(1),
05(2), 07(3)
43: 02(1), 07(1) 44: 03(1) 45: 03(2) 46: 03(1) 47: 04(1) 48: 04(1)
49: 04(1), 05(1),
07(1)50: 04(2), 05(1) 51: 04(1) 52: 04(1) 53: 05(1), 06(1) 54: 05(1)
55: 05(1) 56: 06(1), 07(1) 57: 06(1) 58: 06(1) 59: 06(1) 60: 06(1)
R: room, MR: main room, L: living room, H: hall, E: entrance, D: dining, K: kitchen, B:
bathroom, P: Powder room or dressing room
Fig. 11. (Continued.)
© ASCE 04016055-10 J. Comput. Civ. Eng.
J. Comput. Civ. Eng., 04016055
Dow
nloa
ded
from
asc
elib
rary
.org
by
Yon
sei U
nive
rsity
Lib
rary
on
11/0
3/16
. Cop
yrig
ht A
SCE
. For
per
sona
l use
onl
y; a
ll ri
ghts
res
erve
d.
discordance between TJB and NJ regarding Plan types 34 and 38:
these types must be placed after Plan type 28 because Plan types 34,
38, and 28 appeared in 2001, 2002, and 2000, respectively, despite
the fact that Plan type 34 resembled Plan type 11 more than Plan
type 28 (see Fig. 11 for the earliest year of each plan type). How-
ever, NJ categorized Plan types 34 and 38 as precedent types of
Plan type 28 because NJ groups similarly structured plan types
closely regardless of the appearance year. Such errors are analogous
to the error of reversing a mother–daughter relationship when the
daughter resembles her grandmother more than the daughter resem-
bles her mother.
In summary, because the NJ method does not use information on
the time of occurrence for each case, it generates phylogenetic trees
by following the direction of transition that can be best explained
by evolutionary theory. However, sometimes the direction of tran-
sition can be inverted. For this reason, the time of occurrence has
been added as a factor in TBJ. Comparing the TBJ method with the
existing NJ method demonstrates that their results are not radically
different; however, the new method improves on the existing
method by addressing its dedifferentiation errors.
Conclusions
Many quantitative and qualitative research methods have been used
to analyze types and phylogenies of architectural spaces. However,
an algorithmic approach for generating a full space phylogenetic
tree has not been previously undertaken. In this paper, a new phylo-
genetic tree generation method was proposed based on phyloge-
netic tree generation concepts and adding the year of occurrence
as an additional factor. Previous studies were examined that dealt
with quantitative analysis of the similarity between spatial struc-
tures of floor plans, graph similarity analysis, and phylogenetic tree
generation algorithms. The proposed method, TBJ, was developed
based on these.
To validate TBJ, 422 architectural plans of collective housing
units in Seoul, South Korea, constructed between 1970 and 2010
were analyzed. The analysis results of TBJ were compared with
those of NJ, a phylogenetic tree generation algorithm commonly
used in biology. The results of this comparison demonstrated that
TBJ could reduce nonsensical dedifferentiation errors caused by
failing to consider plan types’ times of occurrence.
Despite the promising results of this study, the TBJ method has
limitations that warrant follow-up studies. An improved method
would take into account the importance of each space, spatial struc-
ture, and the location of the structure, as well as neighboring
relations, visual relations, and location changes.
The automatically derived phylogenetic tree of architectural
plans per se does not provide sociocultural interpretation of the
changes in architectural plans. Nevertheless, the proposed algo-
rithm has scientific contributions in that it opens a possibility of
mass-processing a large amount of architectural plan types, and that
it provides a basis for further sociocultural analyses.
The phylogenetic trees generated by the proposed method are
not limited to unit plans of collective housing; it also provides a
framework that can be used to analyze the relationship between
types and factors of change in categorizing architectural space
types and tracking changes in other building types.
In total, 60 plan types were derived from 422 architectural plans
of collective housing units with an exclusively usable area of
85 m2, of the three-bay, two-unit staircase type. The move-in years
were between 1970 and 2010. In Fig. 11, 70(1) refers to a plan with
a move-in year of 1970, of case number 1.
References
Adelman, J. L. (2003). “PWComp.” ⟨∼http://www.ocf.berkeley.edu
/∼jadelman/pwcomp/index.html⟩ (Feb. 2, 2013).
Alexander, C. (1979). The timeless way of building, Oxford University
Press, Cambridge, U.K.
Bafna, S. (2001). “Geometrical intuitions of genotypes.” 3rd Space Syntax,
Symp. College of Architecture, Georgia Institute of Technology,
Atlanta.
Bandyopadhyay, A., and Merchant, A. N. (2006). “Space syntax analysis
of colonial houses in India.” Environ. Plann. B: Plann. Des., 33(6),
923–942.
Bergstrom, C. T., and Dugatkin, L. A. (2011). Evolution, W. W. Norton,
New York.
Bunke, H. (1997). “On a relation between graph edit distance and
maximum common subgraph.” Pattern Recognit. Lett., 18(8),
689–694.
Bunke, H., Jiang, X., and Kandel, A. (2000). “On the minimum common
supergraph of two graphs.” Computing, 65(1), 13–25.
Bustard, W. (1999). “Space, evolution, and function in the houses of Chaco
Canyon.” Environ. Plann. B: Plann. Des., 26(2), 219–240.
Caniggia, G., and Maffei, G. L. (2001). Architectural composition and
building typology: Interpreting basic building, Alinea Editrice,
Florence, Italy.
Carpenter, R. (1959). The esthetic basis of Greek art of the fifth and fourth
centuries BC, Indiana University Press, Bloomington, IN.
Dahabreh, S. M. (2006). “The formulation of design: The case of the Islip
Courthouse by Richard Meier.” Ph.D. dissertation, Georgia Institute of
Technology, Atlanta.
Dalton, R. C., and Kirsan, C. (2008). “Small-graph matching and building
genotypes.” Environ. Plann. B: Plann. Des., 35(5), 810–830.
Editorial Department. (2006). “Apartment encyclopedia.” Sejin-Gihoek,
Seoul.
Farris, J. S. (1977). “On the phenetic approach to vertebrate classification.”
Major patterns in vertebrate evolution, M. K. Hecht, P. C. Goody, and
B. M. Hecht, eds., Plenum Press, New York, 823–850.
Felsenstein, J. (1989). “PHYLIP.” ⟨http://evolution.genetics.washington
.edu/phylip.html⟩ (Jul. 29, 2016).
Fernandez, M.-L., and Valiente, G. (2001). “A graph distance metric
combining maximum common subgraph and minimum common
supergraph.” Pattern Recognit. Lett., 22(6–7), 753–758.
Franck, K. A., and Schneekloth, L. H. (1994). Ordering space: Types in
architecture and design, Van Nostrand Reinhold, New York.
Gero, J. S., and Ding, L. (1997). “Learning emergent style using an
evolutionary approach.” Int. Conf. on Computational Intelligence
and Multimedia Applications, Griffith Univ., Gold Coast, Australia,
171–175.
Guney, Y. I., andWineman, J. (2008). “The evolving design of 20th-century
apartments in Ankara.” Environ. Plann. B: Plann. Des., 35(4),
627–646.
Ham, S.-I., and Lee, G. (2010). “Space-connector model for repre-
senting spatial relations in a quantitative space analysis.” Int. Conf.
on Computing in Civil and Building Engineering (ICCCBE), ISCCBE,
Nottingham, U.K., 375–380.
Hanson, J. (2003). Decoding homes and houses, Cambridge University
Press, Cambridge, U.K.
Heymans, M., and Singh, A. K. (2003). “Deriving phylogenetic trees
from the similarity analysis of metabolic pathways.” Bioinformatics,
19(Suppl1), i138–i146.
Hillier, B., and Hanson, J. (1984). The social logic of space, Cambridge
University Press, Cambridge, U.K.
Hillier, B., Hanson, J., and Graham, H. (1987). “Ideas are in things:
An application of the space syntax method to discovering house
genotypes.” Environ. Plann. B: Plann. Des., 14(4), 363–385.
Jeh, G., and Widom, J. (2002). “SimRank: A measure of structural-context
similarity.” Proc., 8th ACM SIGKDD Int. Conf. on Knowledge Discov-
ery and Data Mining, ACM, New York, 538–543.
KB (Kookmin Bank). (2016). “The market price of real estate.” ⟨http://
nland.kbstar.com/⟩ (Jan. 4, 2016).
© ASCE 04016055-11 J. Comput. Civ. Eng.
J. Comput. Civ. Eng., 04016055
Dow
nloa
ded
from
asc
elib
rary
.org
by
Yon
sei U
nive
rsity
Lib
rary
on
11/0
3/16
. Cop
yrig
ht A
SCE
. For
per
sona
l use
onl
y; a
ll ri
ghts
res
erve
d.

Kleinberg, J. M. (1999). “Authoritative sources in a hyperlinked
environment.” J. ACM, 46(5), 604–632.
Kourouniotes, K., Thompson, H. A., Robertson, D., Dinsmoor, W. B., and
Gjerstad, E. (1933). “Replies to book reviews.” Am. J. Archaeol., 37(4),
652–659.
Lee, D. (2004). “Spatial configuration characteristics of apartment units
by plan size using genotype analysis method.” Ph.D. dissertation,
Yonsei Univ., Seoul.
Madge, J. (2007). “Type at the origin of architectural form.” J. Archit.,
12(1), 1–34.
Manum, B. (2005). “Generality versus specificity: A study on the interior
space of apartments.” 5th Int. Space Syntax Symp., Purdue University
Press, West Lafayette, IN, 3–13.
Markus, T. A. (1993). Buildings and power: Freedom and control in the
origin of modern building types, Routledge, London.
Melnik, S., Garcia-Molina, H., and Rahm, E. (2002). “Similarity flooding:
A versatile graph matching algorithm and its application to schema
matching.” 18th Int. Conf. on Data Engineering (ICDE), IEEE,
New York, 117–128.
Mitchell, W. J. (1990). The logic of architecture: Design, computation, and
cognition, MIT Press, Cambridge, MA.
Page, R. D. M. (1996). “TreeView: An application to display phylogenetic
trees on personal computers.” Comput. Appl. Biosci., 12(4), 357–358.
Rapoport, A. (1969). House form and culture, Prentice-Hall, Englewood
Cliffs, NJ.
Rzhetsky, A., and Nei, M. (1993). “Theoretical foundation of the
minimum-evolution method of phylogenetic inference.” Mol. Biol.
Evol., 10(5), 1073–1095.
Saitou, N., and Nei, M. (1987). “The neighbor-joining method: A new
method for reconstructing phylogenetic trees.” Mol. Biol. Evol., 4(4),
406–425.
Sattath, S., and Tversky, A. (1977). “Additive similarity trees.”
Psychometrika, 42(3), 319–345.
Seo, K. W. (2005). “Spatial interpretation of housing: The role of topologi-
cal intuition in the evolution of the houses in Seoul.” Ph.D.
dissertation, Univ. College London, London.
Simpson, M. G. (2010). Plant systematics, Elsevier, Burlington, MA.
Sokal, R. R., and Michener, C. D. (1958). A statistical method for
evaluating systematic relationships, Univ. of Kansas, Lawrence,
KS.
Statistics Korea. (2010). “Population and housing census.” ⟨http://kosis.kr
/statHtml/statHtml.do?orgId=101&tblId=DT_1JU0001&conn_path=I2⟩
(Jul. 30, 2016).
Stevens, S. S. (1957). “On the psychophysical law.” Psychol. Rev., 64(3),
153–181.
© ASCE 04016055-12 J. Comput. Civ. Eng.
J. Comput. Civ. Eng., 04016055
Dow
nloa
ded
from
asc
elib
rary
.org
by
Yon
sei U
nive
rsity
Lib
rary
on
11/0
3/16
. Cop
yrig
ht A
SCE
. For
per
sona
l use
onl
y; a
ll ri
ghts
res
erve
d.