time and improve output signal - Faculty Server...
22
Variations on Polarography • Can apply different types of electrical signals to electrochemical cells to modify and improve output signal 1) Alternating Current (AC) Polarography time E AC component on a linear voltage scan
Transcript of time and improve output signal - Faculty Server...
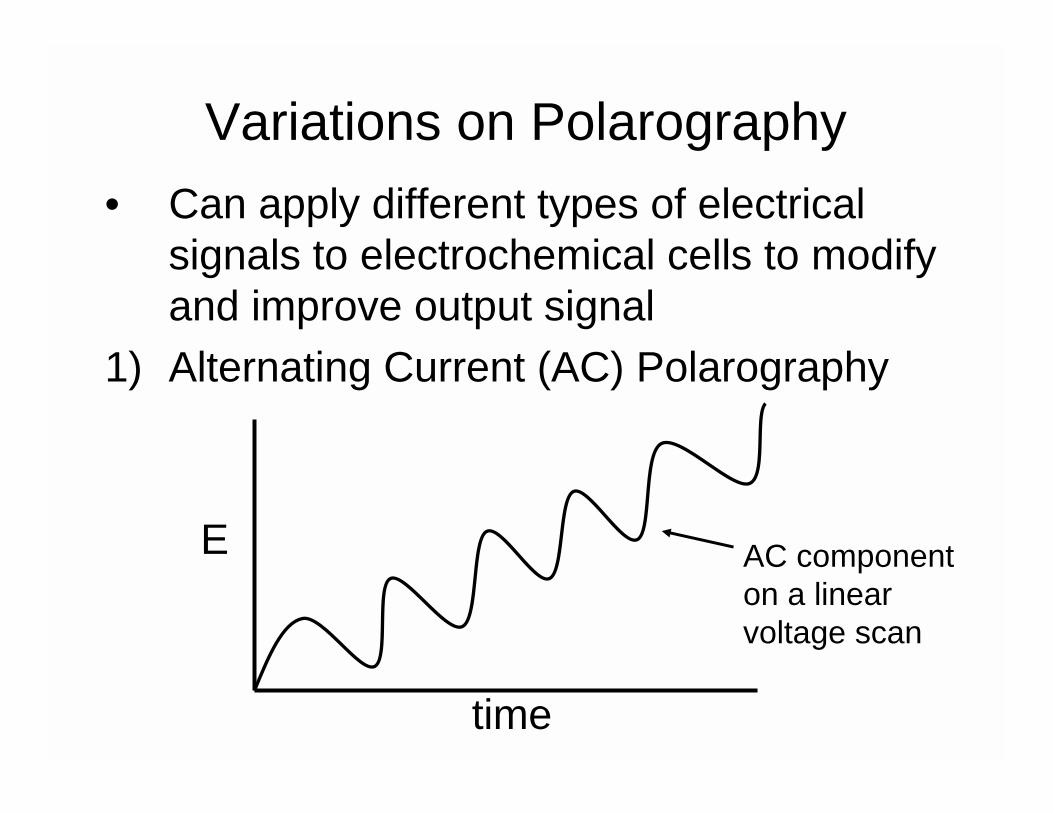
Variations on Polarography• Can apply different types of electrical
signals to electrochemical cells to modify and improve output signal
1) Alternating Current (AC) Polarography
time
E AC componenton a linearvoltage scan
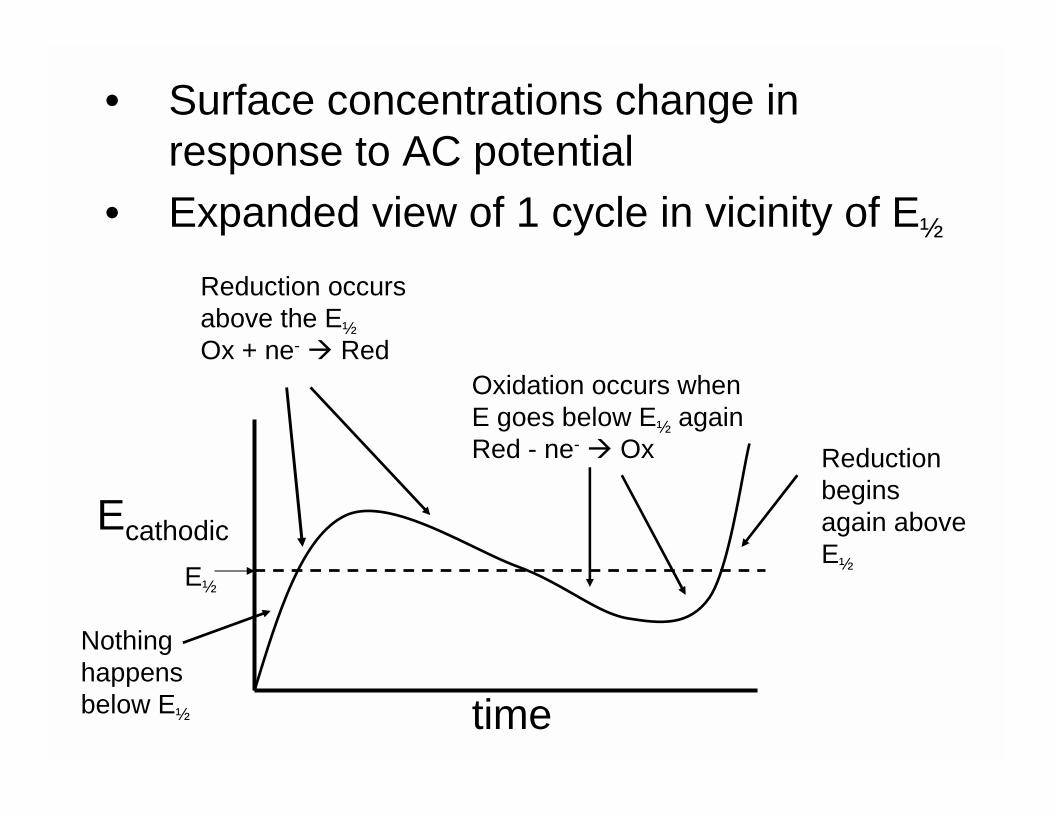
• Surface concentrations change in response to AC potential
• Expanded view of 1 cycle in vicinity of E½
time
Ecathodic
Reduction occursabove the E½Ox + ne- � Red
E½
Nothinghappensbelow E½
Oxidation occurs whenE goes below E½ againRed - ne- � Ox Reduction
beginsagain aboveE½

• Measure AC component of current • Current fluctuates in the vicinity of the E½
because a positive or reduction current is produced above the E½ and a negative or oxidation is produced below the E½
• A peak is generated only near the E½ because it is only in this region that the current fluctuates (giving an AC component) as the potential goes above and below the E½ value
• Early in the experiment, no current is generated• Late in the experiment, at potentials above the
E½, the total current is relatively constant and there is no AC component of the current to be measured so the AC signal flattens out

AC polarography
DC polarography
CyclicVoltammetry
Normal orIntegral
A typical pulsedwaveform

• Frequency of AC voltage component typically 60 – 100 Hz
• The higher the frequency � the faster the electron transfer rate must be to keep up with potential changes and give an appreciable AC current � related to time-scale of the measurement
• Irreversible processes generate no AC wave
• Magnitude of the applied AC voltage is typically 10 mV peak to peak
Advantages of AC Polorography• Detection limits slightly better than DC
polarography, but still limited by capacitive current
• Capacitive current produces an AC component associated with charging and discharging of the electrode surface
• AC polarography produces peaks which solves problem of small wave on top of big wave
• Multiple components gives multiple peaks• Can use solid electrodes instead of DME
with AC applied potential waveform
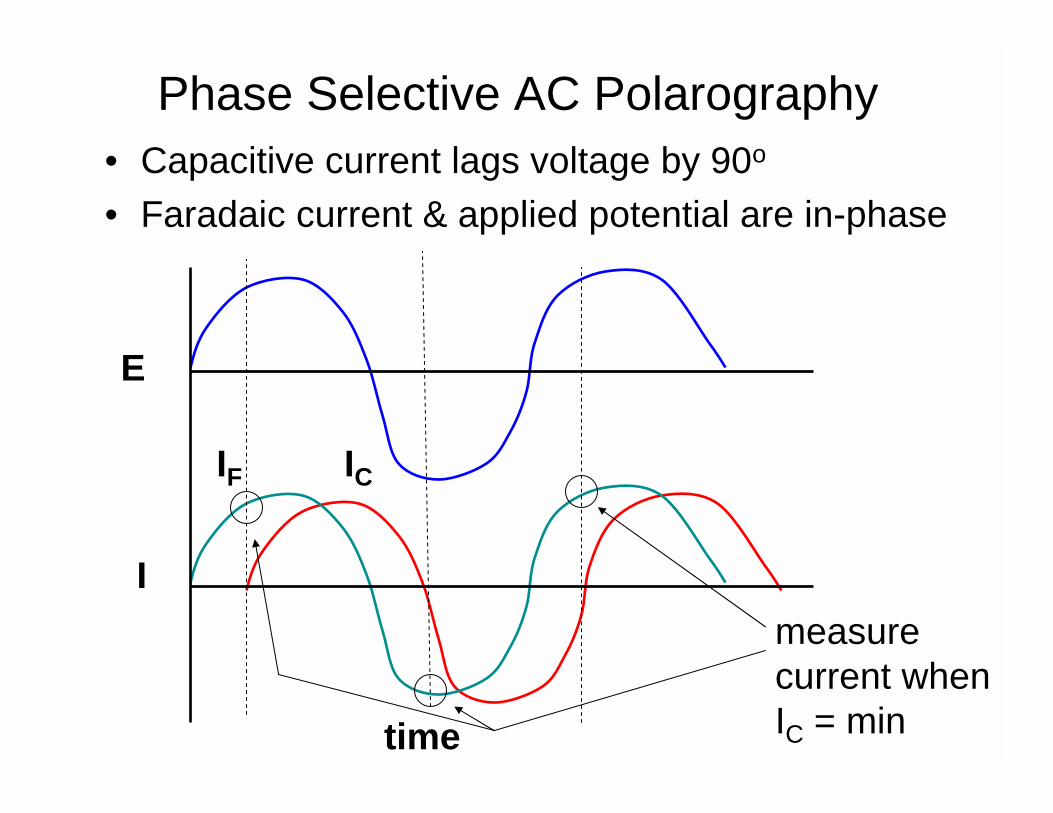
Phase Selective AC Polarography• Capacitive current lags voltage by 90o
• Faradaic current & applied potential are in-phase
E
I
time
IF IC
measurecurrent whenIC = min

• Instead of measuring total AC current, measure current only at the selected points in the cycle when IC = min & IF = max
• Selectively measuring IF in the presence of IC improves detection limits by about 10X
• This represents the case for applied potential in the form of a sine wave in Phase-Selective AC Polarography and Phase-Selective AC Voltammetry
• The same is true for the digitized version of a sine wave or a pulsed waveform
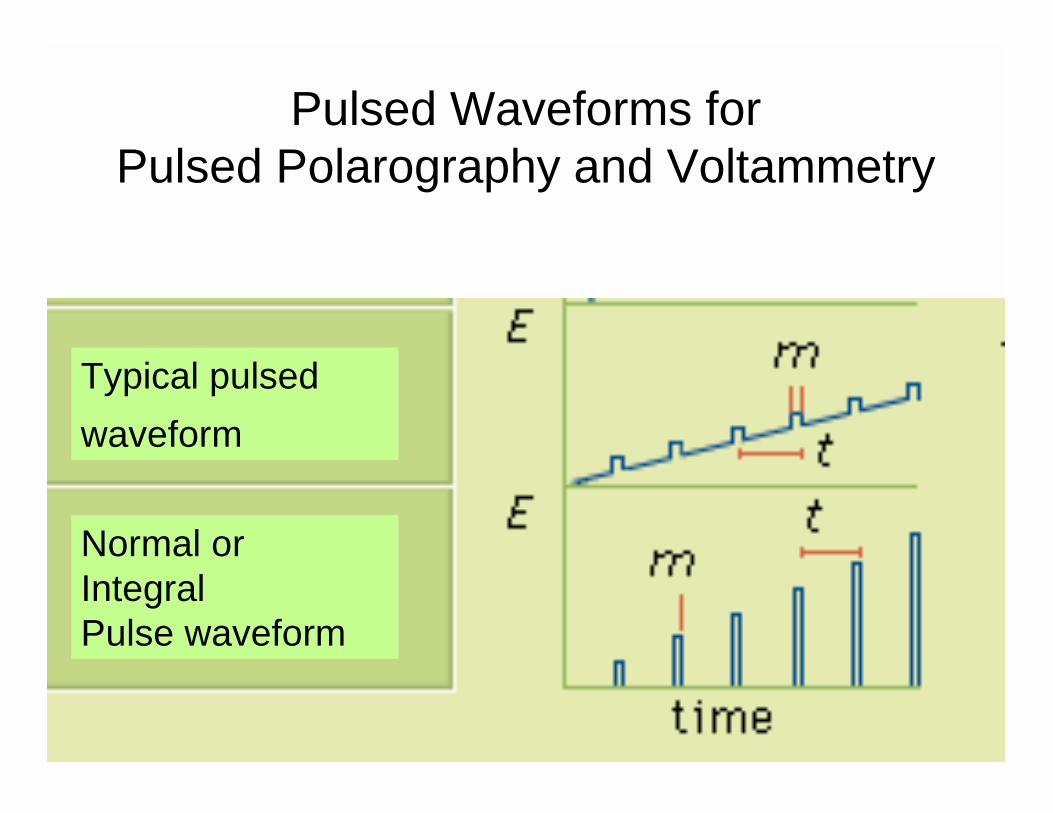
Pulsed Waveforms for Pulsed Polarography and Voltammetry
Normal orIntegralPulse waveform
Typical pulsedwaveform
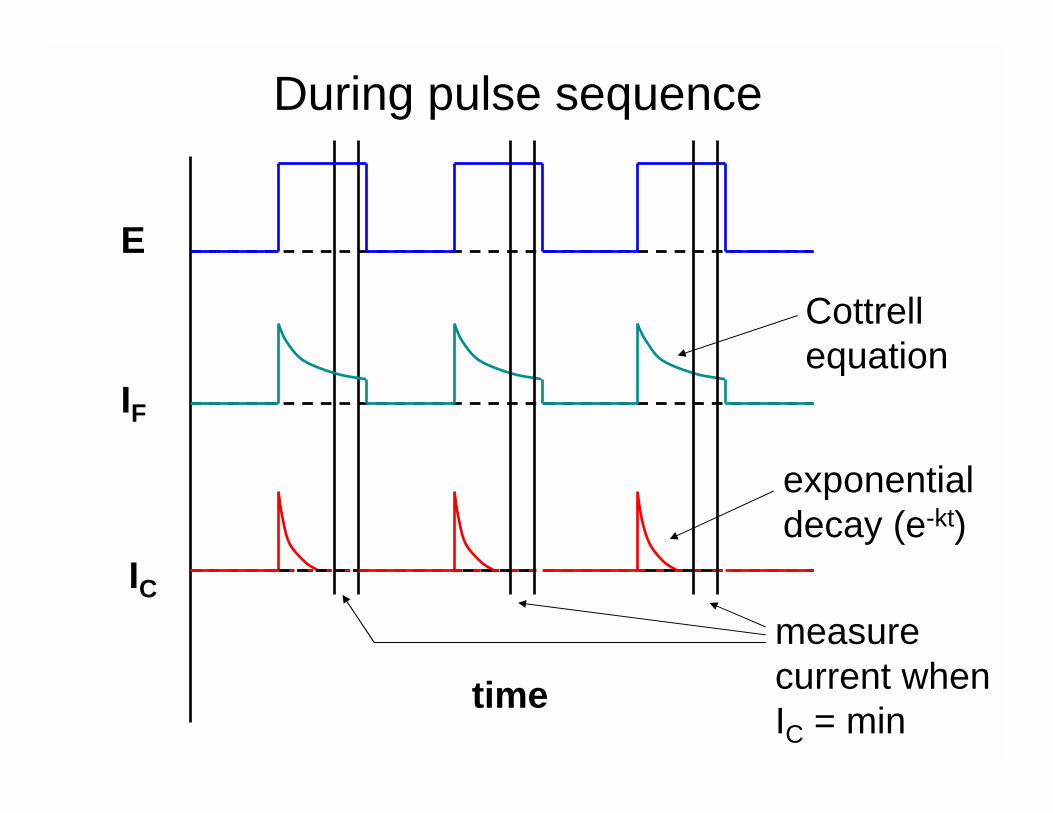
During pulse sequence
E
time
IF
ICmeasurecurrent whenIC = min
exponentialdecay (e-kt)
Cottrellequation
Pulsed Polarography
• Only measure current during the later part of the pulse
• Take advantage of the fact that IC decays more rapidly than IF
• Improves detection limits to 10-7 M or slightly lower
• Easy to accomplish with modern electronic instrumentation

Normal Pulse Polarographyor Integral Pulse Polarography
Normal orIntegral Pulsewaveform
Typical
pulsed waveform
A very widely used form of polarography
E
time
IF
IC
exponentialdecay (e-kt)
Cottrellequation
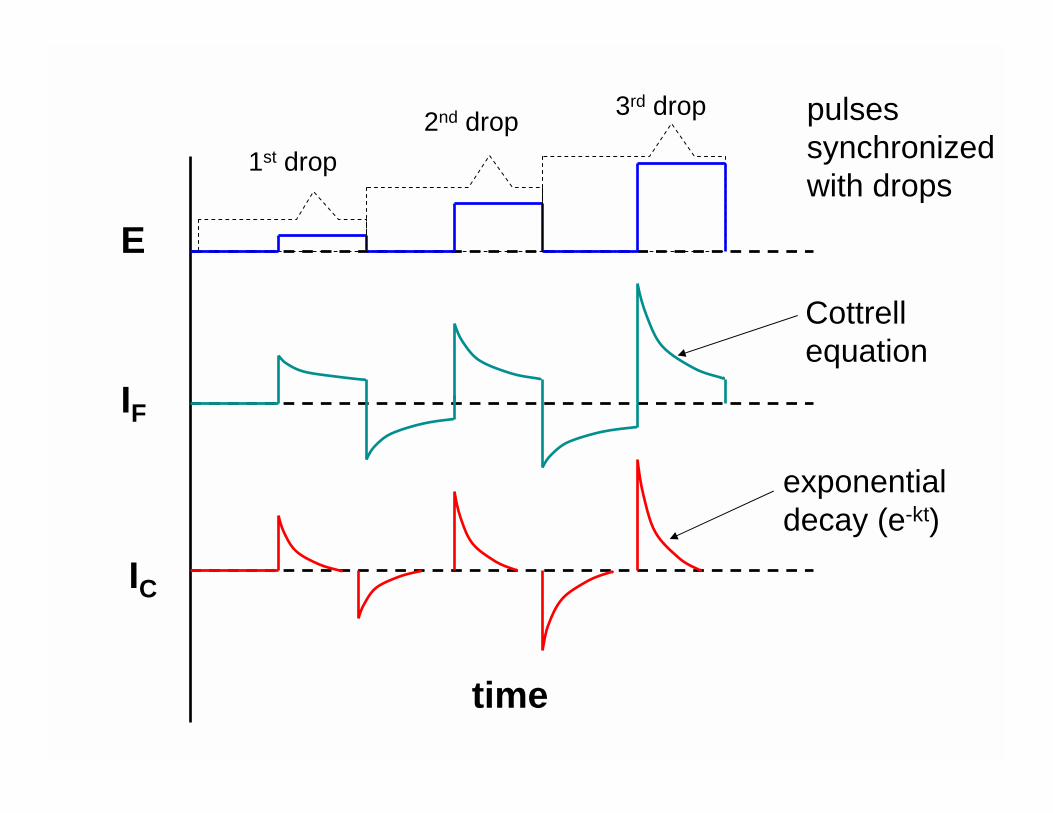
1st drop2nd drop 3rd drop pulses
synchronizedwith drops

• Synchronize Hg drop with applied pulse by using an electronically actuated drop dislodger or drop knocker
• Input signal is a square voltage pulse approx. 40 – 100 msec long applied late in the DME drop life
• Point of measurement is at the end of applied pulse when IC has fallen off

• Pulse amplitude increases with time eventually reaching the E½ value and exceeding it
• At the end of the pulse the applied signal returns to the baseline level (zero)
• Resulting output signal is a wave
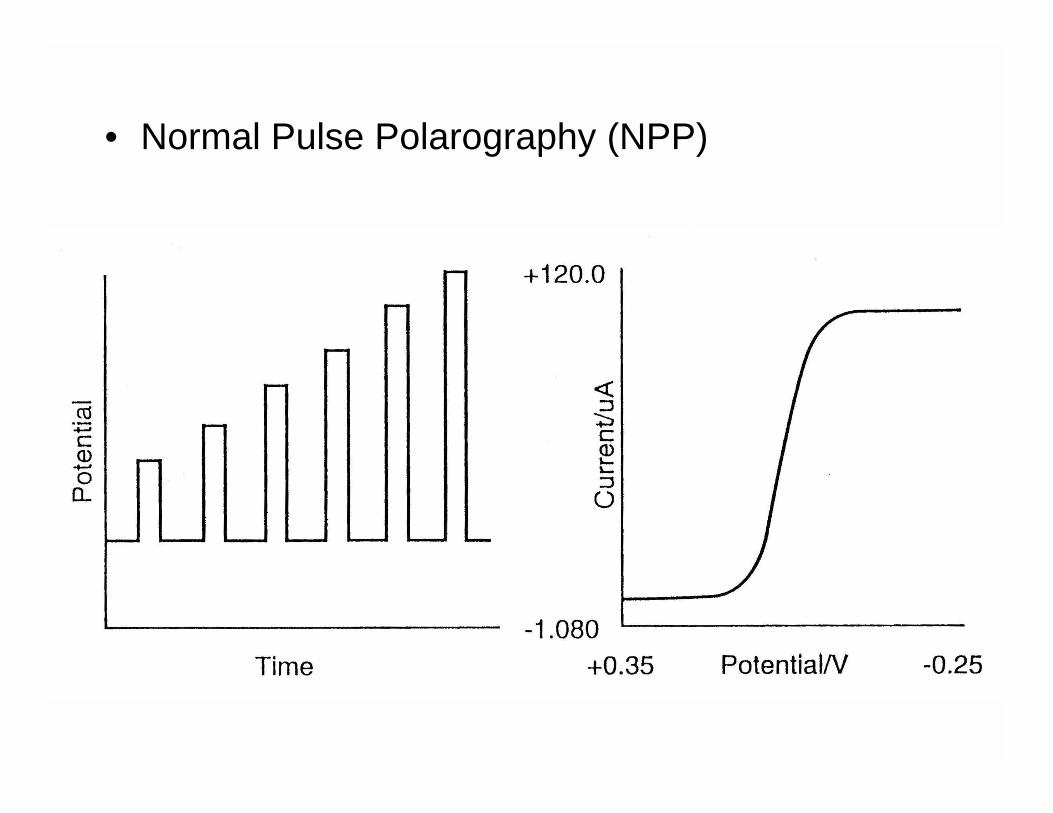
• Normal Pulse Polarography (NPP)

DC Polarography
NPP showingsteps in wave
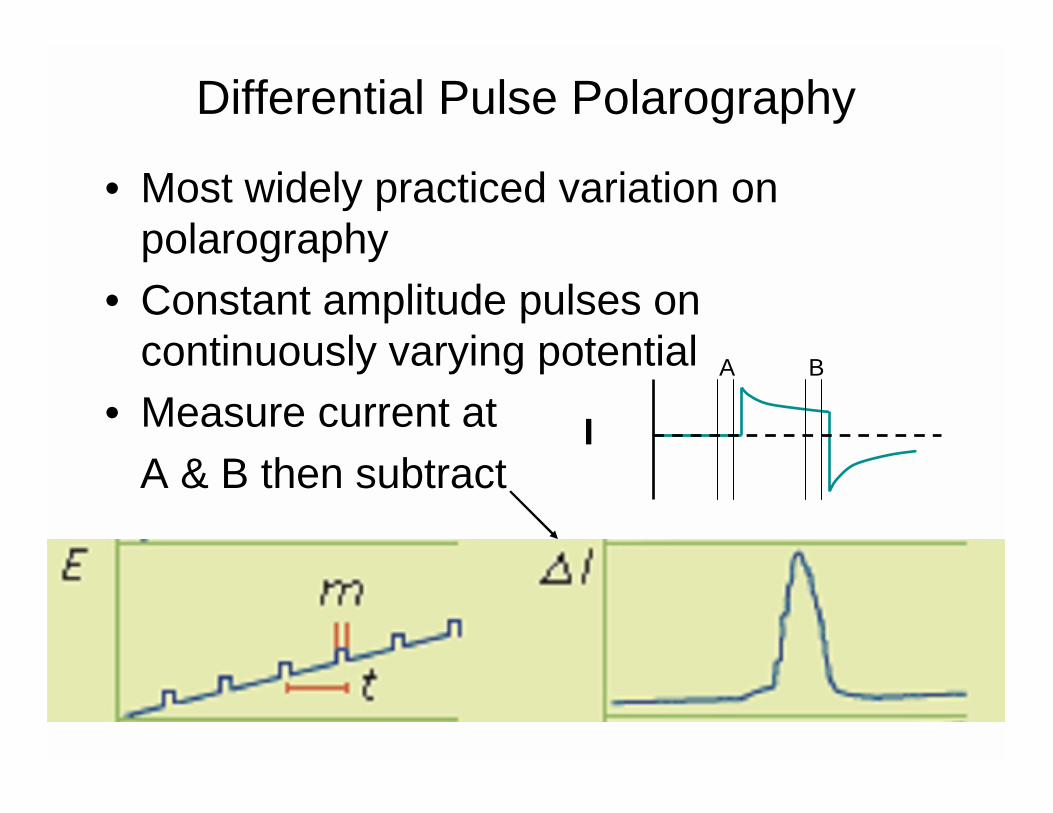
Differential Pulse Polarography
• Most widely practiced variation on polarography
• Constant amplitude pulses on continuously varying potential
• Measure current atA & B then subtract
I
A B
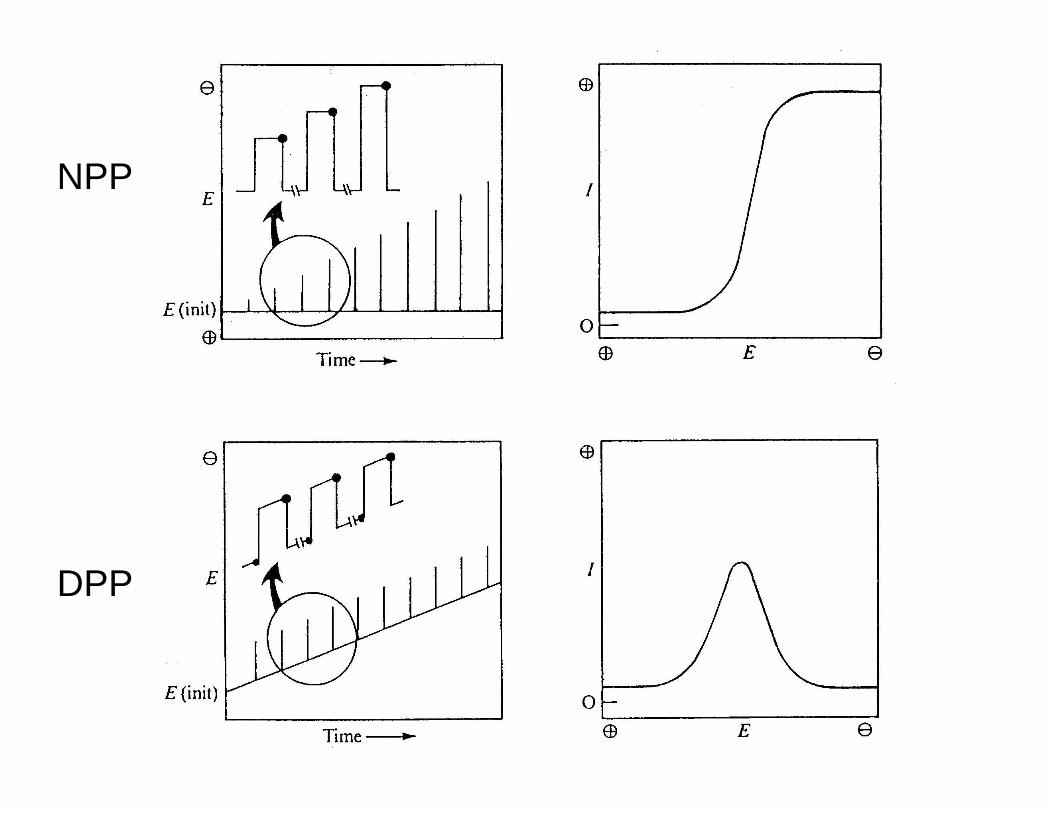
– DPP & NPP
NPP
DPP

DPP for lowconcentrationsample showing ahint of the steps inthe peak

Applied potentialwaveform for DPP
Linear potentialramp
Pulses on rampshowing pulseduration andsampling timesbefore & at theend of pulse
Current behaviorduring pulse
Advantages of DPP
• DPP gives a well resolved peak allowing the determination of species that have E½values as close as 40 mV to be measured
• Detection limits to approx. 10-8 M• Relatively fast with modern DME’s and
scan rates in the 10 – 50 mV/sec range• Instrumentation costs are comparatively
low in the $5K to $10K range