NABE, AUBER & You Michael J. Skordeles Chief Market Strategist Senior Vice President.

Tim S. NichollsSenior Vice President & Chief Financial Officer
JPMorganBasics and Industrials Conference
June 2008

2
Forward-Looking Statements
These slides and statements made during this presentation contain forward-looking statements. These statements reflect management's current views and are subject to risks and uncertainties that could cause actual results to differ materially from those expressed or implied in these statements. Factors which could cause actual results to differ relate to: (i) our ability to realize the expected benefits of our proposed acquisition of the containerboard, packaging and recycling business of Weyerhaeuser Company in light of integration difficulties and other challenges; (ii) increases in interest rates and our ability to meet our debt service obligations; (iii) industry conditions, including but not limited to changes in the cost or availability of raw materials and energy, transportation costs, competition we face, the company's product mix, demand and pricing for its products; (iv) global economic conditions and political changes, particularly in Latin America, Russia, Europe and Asia, including but not limited to changes in currency exchange rates, credit availability, pension and health care costs and the company's credit ratings issued by recognized credit rating organizations; (v) unanticipated expenditures related to the cost of compliance with environmental and other governmental regulations and to actual or potential litigation; (vi) whether we experience a material disruption at one of our manufacturing facilities; and (vii) the company's ability to realize anticipated profit improvement from its transformation plan. We undertake no obligation to publicly update any forward-looking statements, whether as a result of new information, future events or otherwise. These and other factors that could cause or contribute to actual results differing materially from such forward looking statements are discussed in greater detail in the company's Securities and Exchange Commission filings.

3
During the course of this presentation, certain non-U.S. GAAP financial information will be presented.A reconciliation of those figures to U.S. GAAP financial measures is available on the company’s website at “www.internationalpaper.com” under Investors.
Non-GAAP Statements
4
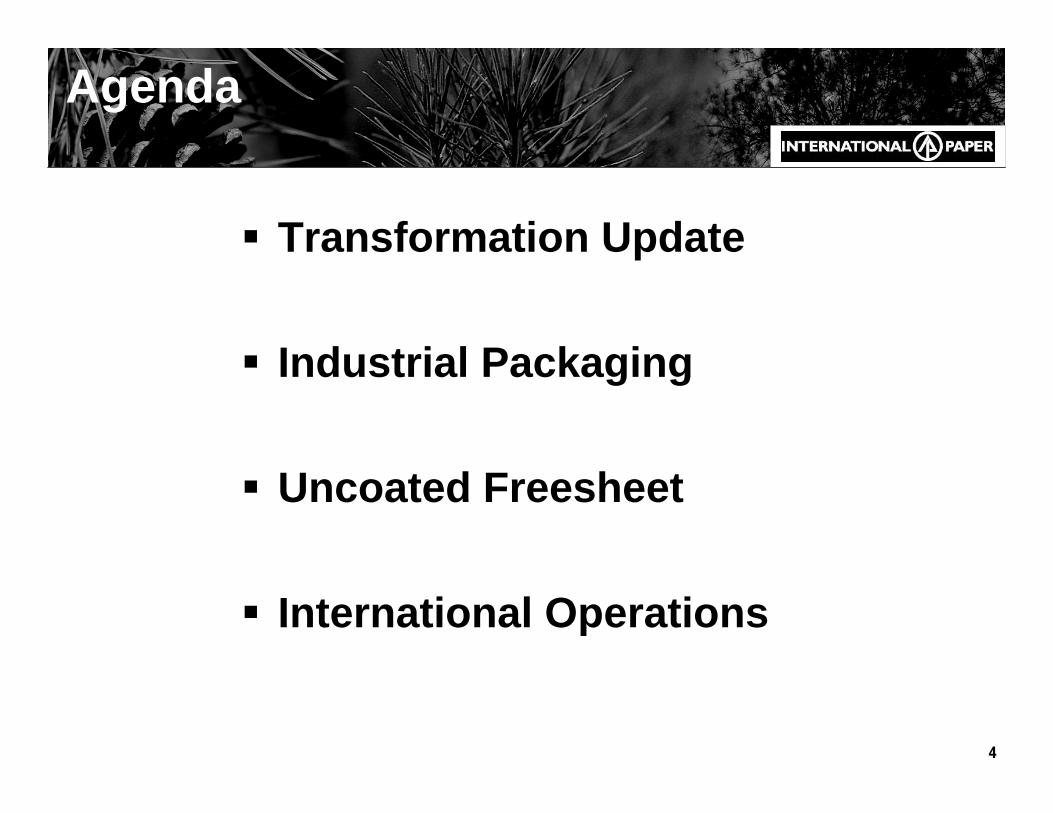
Agenda
Transformation Update
Industrial Packaging
Uncoated Freesheet
International Operations

5
International Paper Overview
Leading global paper & packaging company$22 Billion in 2007 revenues50,000+ employeesOperations in 20 countriesExecuting major transformation
6
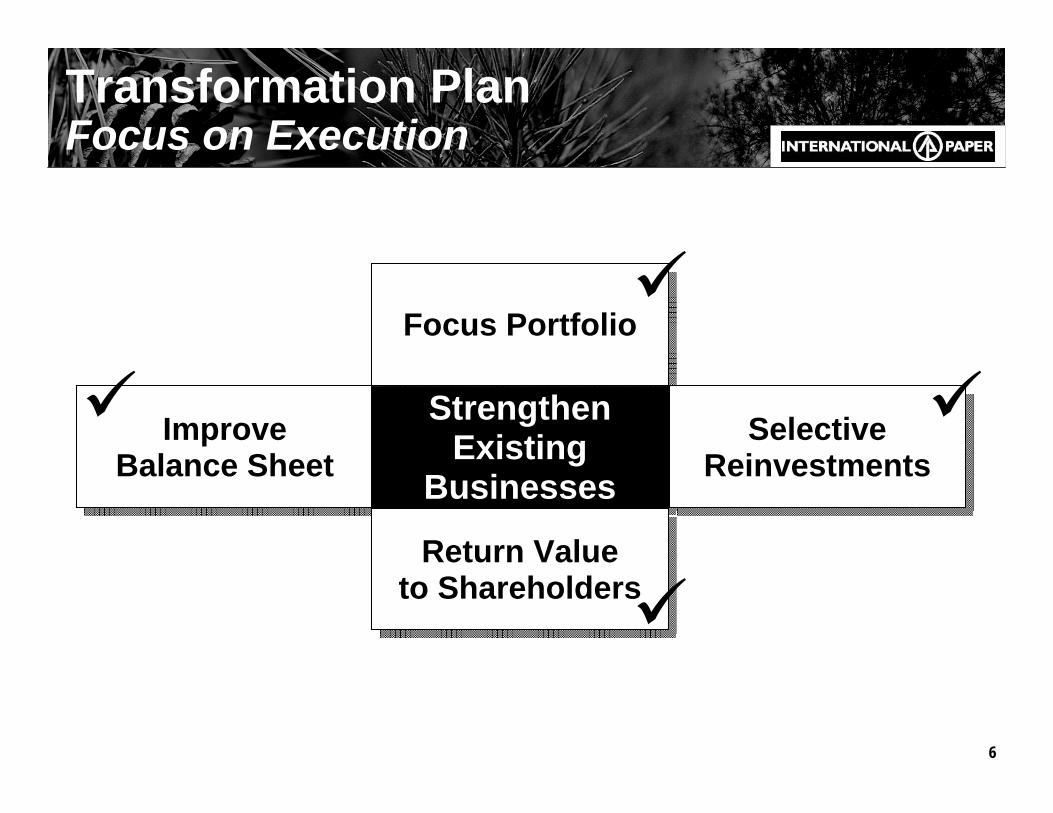
Focus Portfolio
Improve Balance Sheet
Strengthen Existing
BusinessesSelective
Reinvestments
Return Valueto Shareholders
Transformation PlanFocus on Execution

7
Focused Business PortfolioPro Forma Sales Revenue
Printing Papers
Packaging
xpedx
Carter Holt HarveyKraft Papers
Arizona ChemicalKraft Packaging
Coated PapersWood Products
Forestland
Printing Papers
Packaging
xpedx
Forest Resources
Forest Resources
2005 - $24.1B 2007 - $27.1B
2007 revenue figures include Weyerhaeuser CBPR revenues

8
$1.33
$2.22
$0.70
2005 2006 2007
Transformation Plan ScorecardEarnings Per Share
Earnings from continuing operations before special itemsA reconciliation to GAAP EPS is available at www.internationalpaper.com under the Investors tab at presentations

9
$1.3$1.1
$1.0$1.1 $1.1
$1.6
2007 2008P 2009P
Capex Depreciation & Amortization
Transformation Plan ScorecardCapex % of Depreciation
2009P depreciation includes $200 million in capex for the Weyerhaeuser assets and $500 million in incremental depreciation for the Weyerhaeuser assets
118% 100% 63%

10
First Quarter 2008 Highlights
VolumesWeakened in North AmericaHeld up outside NA
PricesImproved globally
Input CostsEscalated globally
Improved free cash flow
Lower Forest Products earnings
Ilim’s 4Q07 earnings on track
$0.30$0.41 $0.37
$0.15
$0.28
$0.04
1Q07 4Q07 1Q08Forest Products EPSOperating Business EPS
$0.45$0.41
$0.69
Earnings from continuing operations before special items

Industrial Packaging

12
Weyerhaeuser CBPR Acquisition Status Update
On Track3rd-Quarter Closing
In ProcessForeign Regulatory Approvals
Hart-Scott-Rodino Approval
Financing
Integration Planning
In ProcessTransitional Services

13
Weyerhaeuser Acquisition Financing
Original Financing Plan
$2 Billion5-Year Term Loan
$2.5 Billion5-Year Term Loan
$4 Billion18-Month Bridge Loan
$3.0 BillionBond Offering
$0.5 BillionCash
Current Financing Plan
14
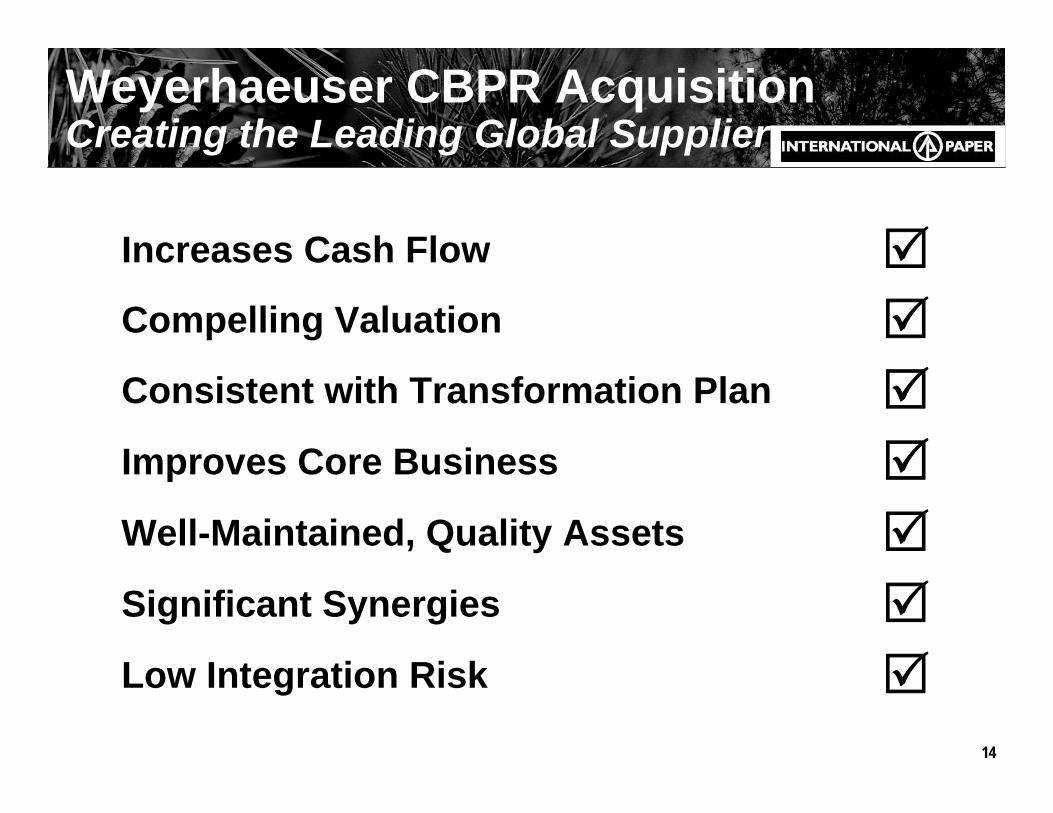
Weyerhaeuser CBPR Acquisition Creating the Leading Global Supplier
Increases Cash Flow
Compelling Valuation
Well-Maintained, Quality Assets
Consistent with Transformation Plan
Significant Synergies
Low Integration Risk
Improves Core Business

15
Strengthening International PaperHigher Earnings on Reduced Capital
12.8%
$20.2
$2.8
$21.9
IP 2007
11.6%
$27.5
$2.8
$24.1
Pre-Transformation
IP 2005(1)
14.4%(3)
$26.2
$3.9(3)
$27.1
2007 IP + WY with Run Rate
Synergies
EBITDA(2)
Margin
Capital Employed($ Billion)
EBITDA(2)
($ Billion)
Sales($ Billion)
(1) Before Transformation Plan discontinued operations(2) Excludes special items(3) Calculated as IP 2007 EBITDA of $2.8 billion plus CBPR 2007 EBITDA of $0.7 billion plus $0.4 billion in run-rate
synergies

16
Weyerhaeuser CBPR Acquisition Improving Earnings Quality
2005EBITDA - $2.8B
2007 Pro Forma with Weyerhaeuser Assets
EBITDA - $3.9B(1)
Printing Papers
Packaging
Forest Products
Distribution
Arizona Chemical
Coated Papers
Wood Products
Beverage Packaging
Printing Papers
Packaging
Forest Products
Distribution(1) Calculated as IP 2007 EBITDA of $2.8 billion plus CBPR 2007 EBITDA of $0.7 billion plus $0.4 billion in run-rate
synergies
17
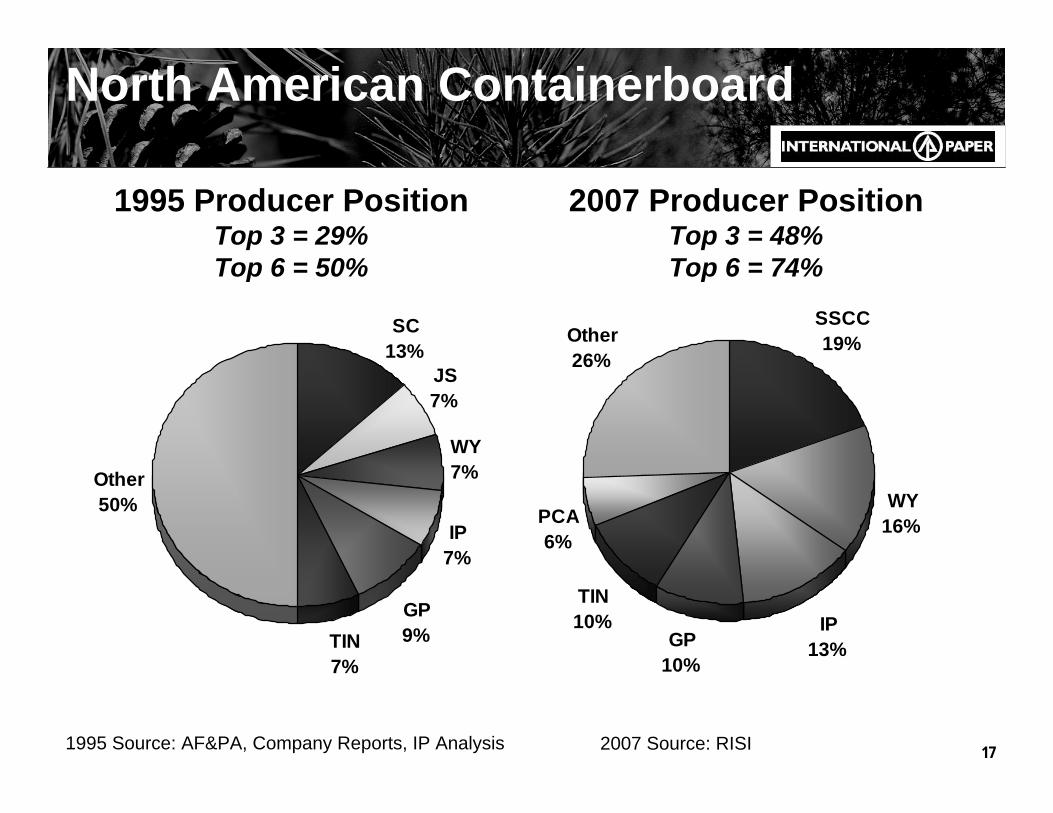
North American Containerboard
JS7%
WY7%
IP7%
GP9%TIN
7%
Other50%
SC13%
SSCC19%
IP13%
TIN10%
PCA6%
Other26%
GP10%
WY16%
1995 Source: AF&PA, Company Reports, IP Analysis
1995 Producer PositionTop 3 = 29%Top 6 = 50%
2007 Producer PositionTop 3 = 48%Top 6 = 74%
2007 Source: RISI

18
Source: Pöyry CostTrac – 4th Quarter, 200742# and 26# Global Kraft Linerboard cash cost per ton delivered to ChicagoHenderson, Savannah 8, Mansfield 3 and Pensacola based on 26#
0
200
400
600
800
1000
Industry Capacity (tons)
Prattville 2Prattville 1
Mansfield 3Mansfield 1
VicksburgPineville
Savannah 6Pensacola
Savannah 8
Cedar Rapids Campti 2Valliant 1
Campti 1Pine Hill 1 Valliant 3
Henderson Albany 3Albany 2
Springfield
WY MillIP Mill
$/ton
Combined Containerboard System 85% of Capacity in 1st & 2nd Quartiles

19
310
360
410
460
510
560
610
$ / T
on
2002 2003 2004 20072000 2001 2005 2006
North American Industry Selling Prices42 lb. Kraft Linerboard
Sources: Selling Prices - RISI U.S. data, Margins – International Paper Industrial Packaging
Quarterly average sales price Trendline price
2008
18% Margin10% Margin
8% Margin

20
($150)
($100)
($50)
$0
$50
$100
$150
$200
$250
2003 vs. 2002 2004 vs. 2003 2005 vs. 2004 2006 vs. 2005 2007 vs. 2006 1Q08 vs. 1Q07
Millio
n
Price Increases / Decreases Input Cost Increases
IP Cost Inflation vs. Price RealizationNorth American Industrial Packaging

21
Vicksburg MillRepairing Recovery Boiler
Savannah
Prattville
Mansfield
Pensacola Vicksburg
Pineville
IP Containerboard System5.1 million tons
11%

Uncoated Freesheet

23
Global Leader in Uncoated PapersLeading Positions Across the Globe
Brazil 0.8 MM tpy
N. America 3.4 MM tpy
W. Europe0.6 MM tpy E. Europe & Russia
0.7 MM tpy
Uncoated paper mill
Capacity in short tons; does not include Ilim joint venture paper capacity

24
North American Uncoated FreesheetStructural Changes
GP17%
IP12%
Boise9%
Champion9%Willamette
9%
WY8%
Other36%
Domtar32%
IP26%
Boise10%
GP7%
Glatfelter4%
Wausau3%
Other18%
1998 Source: Company Reports, IP Analysis
1998 Producer PositionTop 3 = 38%Top 6 = 64%
2007 Producer PositionTop 3 = 68%Top 6 = 82%
2007 Source: RISI

25
Uncoated Freesheet Cost Curve94% of Capacity in 1st & 2nd Quartiles
0
200
400
600
800
1000
1200
1400
0 3,000 6,000 9,000 12,000 15,000 18,000 21,000 24,000 27,000 30,000 33,000Cummulative Annual Capacity (000 Short Tons)
Man
ufac
turi
ng C
osts
($/S
hort
Ton
)
Cash + Delivery to Chicago
Georgetown 1
Based on Poyry’s 2007 CostTrac model at 1st Quarter, 2008, Prices and Exchange Rates.
Franklin 3
Franklin 4
Eastover 2
Eastover 1
Courtland 35
Courtland 30, 34
Franklin 5Franklin 6
Riverdale 16
Riverdale 15
Ticonderoga 7
Ticonderoga 8
26
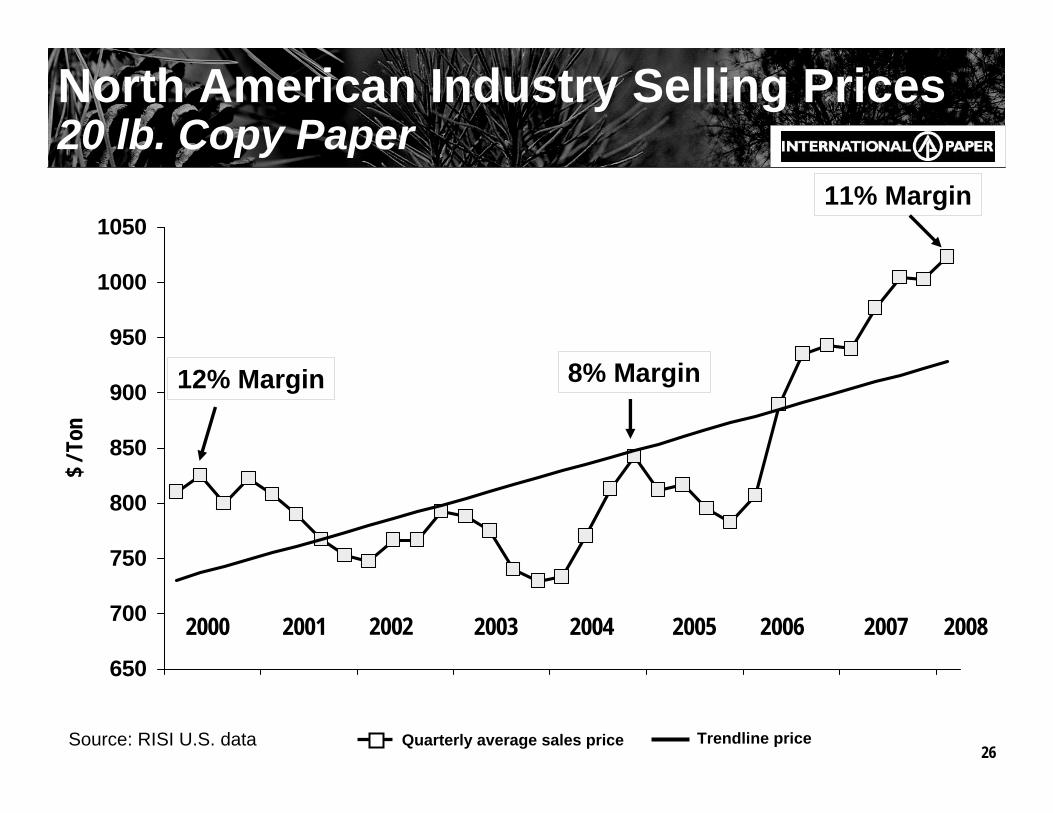
650
700
750
800
850
900
950
1000
1050
$ / T
on
2002 2003 20042000 2001 2005 2006
North American Industry Selling Prices20 lb. Copy Paper
Source: RISI U.S. data Quarterly average sales price Trendline price
2007 2008
12% Margin 8% Margin
11% Margin

27
($50)
$0
$50
$100
$150
$200
$250
2003 vs. 2002 2004 vs. 2003 2005 vs. 2004 2006 vs. 2005 2007 vs. 2006 1Q08 vs. 1Q07
Millio
n
Price Increases / Decreases Input Cost Increases
IP Cost Inflation vs. Price RealizationNorth American Printing Papers

International Operations

29
Sun Paper Joint Venture
2 machines - 470,000 TPY
3rd machine - 355,000 TPY
High demand growth region
Low-cost manufacturing
New Sun Coated Paperboard Machine
IP-Sun JV,Yanzhou

30
0
200
400
600
800
1000
1200
1400
1600
0 1,000 2,000 3,000 4,000 5,000 6,000 7,000 8,000Cummulative Annual Capacity (000 Metric Tonnes)
Man
ufac
turi
ng C
osts
($/M
etri
c T
onne
)
Total Costs + Delivery to Shanghai
Based on Poyry’s 2007 CostTrac model at 1st Quarter, 2008, Prices and Exchange Rates.Sun JV costs are from IP estimates. Delivery includes $44 per metric ton for imports into China.
JV 17
JV 18
Coated Paperboard Global Cost CurveFolding Carton

31
IP Brazil Transforming Earnings and Margins
32%
$217
$684
2005
32%
$272
$850
2007
27%
$135
$495
2006
EBITDA Margin
EBITDA
Sales Revenue
Note: 2005 results include sales and earnings from divested business
High demand growthLow-cost manufacturingLeading market position

32
0
200
400
600
800
1000
1200
1400
1600
0 3,000 6,000 9,000 12,000 15,000 18,000 21,000 24,000 27,000 30,000Cummulative Annual Capacity (000 Metric Tonnes)
Man
ufac
turi
ng C
osts
($/M
etri
c T
onne
)
Cash + Delivery to Buenos Aires
Based on Poyry’s 2007 CostTrac model at 1st Quarter, 2008, Prices and Exchange Rates.
Luiz Antonio
Mogi Guaçu
Global Uncoated Freesheet Cost Curve50 lb. Rolls

33
Ust-Ilimsk
Bratsk
KotlasKPK
♦ 50% of Ilim for ~$620MM
♦ Enterprise value ~ $1.6B
♦ EBITDA multiple < 4.0
♦ Strong market presence in Russia and China
Ilim Joint VentureLow-Cost, Well-Positioned

34
Global Cost CurveBleached Softwood Kraft Market Pulp
0
200
400
600
800
1000
0 2,000 4,000 6,000 8,000 10,000 12,000 14,000 16,000 18,000 20,000 22,000Cummulative Annual Capacity (000 Metric Tonnes)
Man
ufac
turi
ng C
osts
($/M
etri
c To
nne) Cash + Delivery to Shanghai
Based on Poyry’s 2007 CostTrac model at 3rd Quarter, 2007, Prices and Exchange Rates.
Ust-Ilimsk
Bratsk

35
Ilim Joint Venture
Strong end-use markets in Russia & ChinaSolid economic growthHigh demand growth
Low-Cost Manufacturing
Business performing ahead of planProducing at full capacity20%+ EBITDA margins
Ilim board of directors has approved $350 million 2008 capital plan
Ilim EBITDA margin is on a 100% basis before IP adjustments and IP NA margins excludes Forest Products and xpedx

36
International Operations SummaryIngredients for Success
High Demand GrowthLow-Cost ManufacturingMarket-Leading PositionsAttractive Margins and Increasing Earnings
Ex-North America EBITDA Growth

37
Management PrioritiesExecution
Continue to strengthen core businesses’earnings and cash flows
Integrate Weyerhaeuser CBPR assets to drive increased earnings and cash flow
Execute global operations plans
Strengthen balance sheet via debt reduction

38