Tilburg University Using short tests and questionnaires for making … · developed a 12-item form...
173
Tilburg University Using short tests and questionnaires for making decisions about individuals Kruyen, P.M. Publication date: 2012 Link to publication Citation for published version (APA): Kruyen, P. M. (2012). Using short tests and questionnaires for making decisions about individuals: When is short too short. Ridderkerk: Ridderprint. General rights Copyright and moral rights for the publications made accessible in the public portal are retained by the authors and/or other copyright owners and it is a condition of accessing publications that users recognise and abide by the legal requirements associated with these rights. - Users may download and print one copy of any publication from the public portal for the purpose of private study or research - You may not further distribute the material or use it for any profit-making activity or commercial gain - You may freely distribute the URL identifying the publication in the public portal Take down policy If you believe that this document breaches copyright, please contact us providing details, and we will remove access to the work immediately and investigate your claim. Download date: 07. Apr. 2020
Transcript of Tilburg University Using short tests and questionnaires for making … · developed a 12-item form...

Tilburg University
Using short tests and questionnaires for making decisions about individuals
Kruyen, P.M.
Publication date:2012
Link to publication
Citation for published version (APA):Kruyen, P. M. (2012). Using short tests and questionnaires for making decisions about individuals: When is shorttoo short. Ridderkerk: Ridderprint.
General rightsCopyright and moral rights for the publications made accessible in the public portal are retained by the authors and/or other copyright ownersand it is a condition of accessing publications that users recognise and abide by the legal requirements associated with these rights.
- Users may download and print one copy of any publication from the public portal for the purpose of private study or research - You may not further distribute the material or use it for any profit-making activity or commercial gain - You may freely distribute the URL identifying the publication in the public portal
Take down policyIf you believe that this document breaches copyright, please contact us providing details, and we will remove access to the work immediatelyand investigate your claim.
Download date: 07. Apr. 2020

Peter Kruyen
Using short tests and questionnaires for making decisions about individuals:


Using Short Tests and Questionnaires for Making Decisions about Individuals:
When is Short too Short?
Peter Mathieu Kruyen

Cover design by Roos Verhooren ([email protected]) Printed by Ridderprint BV, Ridderkerk, the Netherlands © Peter Mathieu Kruyen, 2012 No part of this publication may be reproduced or transmitted in any form or by any means, electronically or mechanically, including photocopying, recording or using any information storage and retrieval system, without the written permission of the author, or, when appropriate, of the publisher of the publication. ISBN/EAN: 978-90-5335-614-2
This research was supported by a grant from the Netherlands Organisation for Scientific Research (NWO), grant number 400-05-179.

Using Short Tests and Questionnaires for Making Decisions about Individuals:
When is Short too Short?
Proefschrift ter verkrijging van de graad van doctor
aan Tilburg University
op gezag van de rector magnificus,
prof. dr. Ph. Eijlander,
in het openbaar te verdedigen ten overstaan van een
door het college voor promoties aangewezen commissie
in de aula van de Universiteit
op vrijdag 14 december 2012 om 14:15 uur
door
Peter Mathieu Kruyen,
geboren op 26 juli 1983 te Dordrecht

Promotor: Prof. dr. K. Sijtsma
Copromotor: Dr. W. H. M. Emons
Overige leden van de Promotiecommissie:
Prof. dr. M. Ph. Born
Prof. dr. R. R. Meijer
Prof. dr. M. J. P. M. van Veldhoven
Dr. L. A. van der Ark
Dr. A. V. A. M. Evers
.

Contents
1. Introduction ............................................................................................................................. 1
1.1 Test length and individual decision-making ........................................................................... 3 1.2 Preliminaries: Test length and measurement precision .......................................................... 6 1.3 Overview of the thesis .......................................................................................................... 12
2. On the shortcomings of shortened tests: A literature review ........................................... 15
2.1 Introduction ........................................................................................................................... 17 2.2 Research questions ................................................................................................................ 18 2.3 Technical terms ..................................................................................................................... 19 2.4 Method .................................................................................................................................. 26 2.5 Results ................................................................................................................................... 29 2.6 Discussion ............................................................................................................................. 40 Appendix: Coding scheme .......................................................................................................... 44
3. Test length and decision quality: When is short too short? .............................................. 47
3.1 Introduction ........................................................................................................................... 49 3.2 Background ........................................................................................................................... 50 3.3 Method .................................................................................................................................. 53 3.4 Results ................................................................................................................................... 63 3.5 Discussion ............................................................................................................................. 71
4. Assessing individual change using short tests and questionnaires ................................... 75
4.1 Introduction ........................................................................................................................... 77 4.2 Theory ................................................................................................................................... 79 4.3 Method .................................................................................................................................. 82 4.4 Results ................................................................................................................................... 87 4.5 Discussion ............................................................................................................................. 94
5. Shortening the S-STAI: Consequences for research and individual decision-making ... 99
5.1 Introduction ......................................................................................................................... 101 5.2 Background: Pitfalls of shortening the S-STAI .................................................................. 103 5.3 Method ................................................................................................................................ 108 5.4 Results ................................................................................................................................. 112 5.5 Discussion ........................................................................................................................... 117 Appendix: Explanation of strategies used to shorten the S-STAI ............................................ 119
6. Conclusion and discussion .................................................................................................. 121
6.1 Conclusion .......................................................................................................................... 123 6.2 Discussion ........................................................................................................................... 128
References ................................................................................................................................ 131

Summary .................................................................................................................................. 143
Samenvatting (Summary in Dutch) ....................................................................................... 149
Woord van dank (Acknowledgments in Dutch) ................................................................... 157

1
Chapter 1: Introduction

Chapter 1
2

Introduction
3
1.1 Test Length and Individual Decision-Making
Psychological tests and questionnaires play an important role in individual
decision-making in areas such as personnel selection, clinical assessment, and educational
testing. To make informed decisions about individuals, psychologists are interested in
constructs like motivation, anxiety, and reading level, which have been shown to be valid
predictors of criteria such as job success, suitability for therapy, and mastery of reading
skills. These unobservable constructs are measured by a collection of items comprising a
test. Addition of the scores on the items provides a respondent’s total score or test score,
which reflects the respondent’s level on the construct of interest. Total scores are used to
decide, for example, which applicant to hire for a job, whether a patient benefited from a
treatment, or to determine if a particular student needs additional reading help.
Before using a test for individual decision-making, tests users need to be certain to
a particular extent that decisions for individual respondents do not depend on one
particular test administration (e.g., Emons, Sijtsma, & Meijer, 2007, p. 133; Hambleton &
Slater, 1997). When total scores vary considerable across different (hypothetical) test
administrations due to random influences like mood and disturbing noises during the test
administration, the risk of incorrect individual decisions may be substantial. As a result,
test users may reject a suited applicant, continue an unsuccessful treatment, or deny
additional help to a student with a low reading level. Incorrect decisions may have
important negative consequences such as a decline of the well-being of individual
respondents and the waste of organizational resources.
In this PhD thesis, the focus is on the influence of random measurement error or
total-score unreliability on test performance in relation to individual decision-making.
Special attention is given to test length in relation to reliability, which is a group
characteristic, and measurement precision, which pertains to measurement of individuals.
Chapter 1
4
Throughout, we concentrate on reliability issues in decision-making about individuals, and
for the sake of simplicity assume that tests are valid. Validity is a highly important topic
that cannot be addressed in passing and justifies a PhD study on its own.
Generally, tests consisting of many items, say, at least 40 items, are more reliable
than tests consisting of only a few items, say, 15 or fewer items. Specifically, psychometric
theory—the theory of psychological measurement—shows that the more items respondents
answer, the smaller the relative influence of random errors on total scores (e.g., Allen &
Yen, 1979, pp. 85-88; Nunnally & Bernstein, 1994, pp. 230-233). However, extending test
length with the purpose of minimizing the relative influence of random errors encounters
numerous practical objections. For example, filling out long tests may result in high
administration costs. In other applications, test users do not want to trouble respondents
with many questions, for example, when critically-ill patients need to be assessed. To
summarize, test users and test constructors often do not appreciate long tests and
questionnaires and rather prefer tests that are as short as possible, often within the limits of
particular psychometric constraints.
Hence, short tests—including shortened versions of previously developed longer
tests—are abound in practice. In personnel psychology, for example, researchers
developed a 12-item form of the Raven Advanced Progressive Matrices test (originally 36
items, Arthur & Day, 1994) and a scale measuring focus of attention by means of 10 items
(Gardner, Dunham, Cummings, & Pierce, 1989). In clinical psychology, examples include
a 13-item version of the Beck Depression Inventory (originally 21 items, Beck & Beck,
1972) and a 3-item version of the Brief Pain Inventory (originally 11 items, Krebs et al.,
2009). In personality psychology, we can find, for example, a 10-item and a 5-item
questionnaire allegedly measuring the complete Big Five construct (Gosling, Rentfrow, &

Introduction
5
Swann, 2003). For the purpose of comparison, the NEO PI-R contains 240 items to
measure the Big Five (Costa & McCrae, 1992).
One way or another, psychologists need to deal with the consequences of using
short tests for the risk of making incorrect decisions about individuals. The goal of this
thesis is to assess whether, based on psychometric considerations, short tests may be used
for making decisions about individuals. Total scores can be reliable, but if a test designed
to measure reading level also measures another construct such as anxiety, scores will be
interpreted incorrectly. In this thesis, we focus on the relationship between test length and
reliability, because reliability is a necessary (although not a sufficient) condition for tests to
be valid (Nunnally & Bernstein, 1994, p. 214); that is, poor test performance that is mostly
due to random measurement error does not reflect the influence of the construct of interest,
and a reliable test may or may not measure the intended construct. Validity should be
studied on its own but for practical reasons is simply assumed here.
We answer the following research questions:
1. To what extent do psychologists pay attention to the consequences of using short
tests for making decisions about individuals?
2. How should one assess the risk of making incorrect individual decisions?
3. To what extent does test shortening increase the risk of making incorrect individual
decisions?
4. What are minimal test-length requirements for making decisions about individuals
with sufficient certainty?

Chapter 1
6
1.2 Preliminaries: Test Length and Measurement Precision
Often reliability is assessed by coefficient alpha or the test-retest correlation
(Nunnally & Bernstein, 1994, pp. 251-255). A test is deemed suited for individual
decision-making if the total-score reliability exceeds a minimum value that is recognized
as a rule of thumb. However, for psychologists interested in individual decision-making,
measurement precision is more important than reliability (Harvill, 1991; Mellenbergh,
1996; Nunnally & Bernstein, 1994, p. 260; Sijtsma & Emons, 2011).
In this section, we show that the reliability coefficient conveys insufficient
information to assess whether the total score is precise enough to be useful for individual
decision-making. Specifically, we show that total-score reliability as estimated by
coefficient alpha can be acceptable for short tests but that meanwhile measurement
precision of the test is much lower and even unacceptably low.
1.2.1 Theory
We studied the relationship between test length and measurement precision from
the perspective of classical test theory (CTT). CTT assumes that a total score, which is the
sum of the scores on the items in the test, and which is denoted 𝑋 , equals the sum of true
score 𝑇 and random measurement error 𝐸 : 𝑋 = 𝑇 + 𝐸 . The statistical model of CTT
assumes that the same test is administered an infinite number of times to a particular
respondent and that these administrations are independent so that different administrations
can be considered to be replications. Due to random processes reflected by the error
component, replications produce a distribution of total scores, also known as the propensity
distribution (Lord & Novick, 1968, pp. 29-30). The mean of the propensity distribution is
defined as the respondent’s true score and the dispersion is the respondent’s measurement-

Introduction
7
Figure 1.1: Example of propensity distributions for two respondents with different true scores and error variances.
error variance. Figure 1.1 shows for two respondents their hypothetical propensity
distribution, which are different with respect to true score and error variance. Thus, CTT
assumes that different respondents are measured with different precision.
In the real world, instead of a propensity distribution only one total score is
available for each respondent. Hence, in practice one uses the sample of total scores from
all individuals to estimate one common error variance, which may be considered the mean
of all the error variances of the unobserved propensity distributions (Lord & Novick, 1968,
p. 35). The mean standard deviation, which is known as the standard error of measurement
(SEM), is used for quantifying measurement precision for each individual. Let 𝑆 denote
0.0
0.1
0.2
0.3
0.4
0.5D
ensi
ty
Total scores (X +)
True scoreRespondent 1 True scoreRespondent 2
0 2 4 6 8 10 12 14

Chapter 1
8
the total-score variance in the sample, 𝑆 the unobservable true-score variance, and 𝑆 the
measurement-error variance. Given the definition of random measurement error, it can be
shown that 𝑆 = 𝑆 + 𝑆 . Using this result, in the sample total-score reliability is defined
as 𝑟 = 𝑆 /𝑆 = 1 − 𝑆 /𝑆 . The SEM can be derived to be equal to 𝑆 =𝑆 1 − 𝑟 (Allen & Yen, 1979, p. 89), and 𝑟 may be substituted by coefficient
alpha when the SEM is estimated from the data.
The SEM is used to estimate confidence intervals (CIs) for true score 𝑇 (Allen &
Yen, 1979, p. 89). The narrower the CI, the more precise is the estimate of 𝑇. CIs are
computed as follows. An observed total score 𝑋 is taken as an estimate of true score 𝑇
such that 𝑇 = 𝑋 , and it is assumed that the SEM is the standard error of a normal
distribution with mean 𝑇. When a 95% CI is taken, the respondent’s true score 𝑇 lies in the
interval 𝑋 ± 1.96𝑆 in 95% of the hypothetical test replications. However, in certain
practical settings such as in personnel selection, “few organizations can wait to be 95%
sure of success” (Smith & Smith, 2005, p. 126). Apart from the incorrect interpretation of
CIs expressed here, the result is that in these settings a lower confidence level is often
chosen (e.g., 68% CI meaning 𝑋 ± 𝑆 ), implying that organizations are willing to take a
higher risk of making an incorrect decision for individual respondents.
1.2.2 Method
We did a computational study to illustrate the relation between test length,
reliability and measurement precision. Let 𝐽 be the number of items in the test, and let the
score on item 𝑗 be denoted by 𝑋 . Items may be dichotomously scored (i.e., 0 for an
incorrect answer and 1 for a correct answer), or polytomously scored (e.g., 0, 1, …, 𝑚 for
rating-scale items). We define the range of the scale as the difference between the
maximum possible total score and the minimum possible total score. For 𝐽 dichotomous

Introduction
9
items, the scale range equals 𝐽, and for 𝐽 rating-scale items the scale range equals 𝐽 × 𝑚.
For dichotomous items, we studied how the ratio of the CI and the scale range, henceforth
denoted relative CI, relates to test length.
For 1,000 respondents, item scores were simulated using the item response model
known as the Rasch model (Embretson & Reise, 2000, p. 67; Rasch, 1980). The Rasch
model is defined as follows. Instead of a true score, the model uses a latent variable,
denoted 𝜃, as the person variable of interest. Without much loss of generality, we assumed
that 𝜃 has a standard normal distribution. Items are characterized by their difficulty, here
denoted 𝛿 , which is expressed on the same scale as the latent person variable 𝜃. The Rasch
model expresses the probability of a 1 score on dichotomous item 𝑗 as a function of the
latent variable 𝜃 and the difficulty 𝛿 of the item as
𝑃 𝑋 = 1 𝜃, 𝛿 = exp [𝑎 𝜃 − 𝛿 ]1 + exp [𝑎 𝜃 − 𝛿 ] . (1.1)
Constant 𝑎 expresses the common discrimination power of the 𝐽 items in the test. The
higher 𝑎, the higher the probability that a respondent with a low 𝜃 value relative to the item
location 𝛿 scores 0 and a respondent with a high 𝜃 value relative to 𝛿 scores 1. Because
an increase of 𝑎 in all items causes an increase of total-score reliability, in a simulation
study 𝑎 can be used to manipulate the reliability of the total-score.
For 𝐽 = 40, we chose item difficulty values between –1.5 and 1.5 such that
distances between adjacent values were equal throughout. Item 1 is the easiest item
implying that out of all 40 items it has the highest probability of a 1 score for each 𝜃 value,
and item 40 is the most difficult item implying the lowest probability for each 𝜃 value. By
choosing 𝑎 = 2.9, we found that for 𝐽 = 40 the reliability estimated by coefficient alpha
equaled .96. This is high but not unrealistic for a 40-item test. Next, to obtain tests
consisting of 20, 15, 10, and 5 items, we removed items from the 40-item test, such that in

Chapter 1
10
each test the item difficulties of the remaining items were spread at approximately equal
distances between –1.5 and 1.5.
1.2.3 Results
Table 1.1 shows coefficient alpha as an estimate of total-score reliability, the SEM,
the width of the 68% CI and the 95% CI, and the relative CIs. The table shows that
removing items from the test caused coefficient alpha to decrease from .96 for 𝐽 = 40,
to .70 for 𝐽 = 5. The latter alpha value is still acceptable for some practical applications
(Kline, 2000, p. 524). The SEM and the width of the CI also decreased as the test grew
shorter. For example, for 𝐽 = 40 the SEM was 2.12 and the 95% CI covered a range of 8.27
scale points, but for 𝐽 = 5 the SEM was 0.74 and the 95% CI covered only 2.92 scale
points.
Table 1.1: Test length and measurement precision for five test lengths.
Confidence level Coefficient 68% 95% 𝐽 Alpha SEM CI Relative CI CI Relative CI
40 .96 2.12 4.22 .11 8.27 .21 20 .92 1.49 2.98 .15 5.85 .29 15 .90 1.31 2.62 .17 5.13 .34 10 .85 1.06 2.12 .21 4.16 .42 5 .70 0.74 1.49 .30 2.92 .58
Smaller SEMs and CIs suggest greater measurement precision but this would be the
wrong conclusion, which is shown by the relative CIs which increased substantially as
scale range decreased. Figure 1.2 shows the relative CI at the midpoints of the scale. As 𝐽
decreases a larger part of the scale becomes unreliable. This means that only if respondents
differ to a large degree will their differences on the scale be significant. However, the vast

Introduction
11
majority of respondents cannot be distinguished reliably; the scale simply is too short. We
conclude that short tests measure respondents with less precision than longer tests.
1.2.4 Conclusion
The simulation study showed that as a test is shortened, a larger part of the resulting
shorter scale is unreliable. This means that only if respondents differ to a large degree will
their differences on the scale be significant. The vast majority of respondents cannot be
distinguished reliably because the scale simply is too short. We conclude that short tests
Figure 1.2: Confidence intervals located at the scale midpoints for two confidence levels
and five test lengths.
0 10 20 30 40
Total scores (X +)
CI68%
CI95%
J =
CI68%
CI95%
J =
CI68%
CI95%
J =
CI68%
CI95%
J =
CI68%
CI95%
J =
40
20
15
10
5

Chapter 1
12
measure respondents with less precision than longer tests.
It may be noted that a discrimination constant (𝑎) equal to 2.9 is unrealistically high,
but in the simulation study this value was necessary to obtain sufficiently high total-score
reliability. Values in the range [0.5; 2] are more realistic, but for the 5-item test result in a
reliability which is approximately .50. Using realistic values thus results in even lower
measurement precision for the short tests.
1.3 Overview of the Thesis
In Chapter 2, we present the results of an extensive literature review on the
prevalence of shortened tests in the psychological literature. We explored recent trends in
the use of short tests and examined in depth how and to what extent test constructors and
test users addressed reliability, validity issues and other potential consequences of using
short tests. The sample consisted of 164 shortened tests found in the period 2005-2010 in
six peer-reviewed psychological journals that regularly publish on test construction and
practical test use.
In Chapter 3 and Chapter 4, we investigated the consequences of different test
lengths for the risk of making incorrect individual decisions in the context of personnel
selection and the assessment of treatment outcomes. Using simulated data, we studied how
test shortening affected test performance and how many items were needed to ensure an
acceptable small risk of decision errors. In Chapter 3, we studied the effects of test
shortening on selection decisions about applicants in different personnel selection
strategies: top-down selection, cut-score selection, and selection based on score profiles. In
Chapter 4, we investigated the consequences of test shortening on assessment in clinical
contexts: reliable change, clinically important change, and recovery.

Introduction
13
Chapter 5 is devoted to the relationship between test length and the risk of making
incorrect decisions for the State scale of the State-Trait Anxiety Inventory (S-STAI,
Spielberger, Gorsuch, & Lushene, 1970; Spielberger, Gorsuch, Lushene, Vagge, & Jacobs,
1983). The S-STAI is a widely used measure of anxiety in both scientific research and
clinical practice. Various test constructors considered the original 20-item S-STAI too long
for practical applications and, for that reason, developed several shortened S-STAI
versions. We used empirical data to assess the consequences of shortening the S-STAI for
statistical results in research and making decisions about individuals.
In Chapter 6, we formulate answers to the four research questions stated previously.
We also suggest future research themes that the research reported in this PhD thesis
suggested.

Chapter 1
14

15
Chapter 2: On the shortcomings of shortened tests: A literature review*
* This chapter has been accepted for publication as: Kruyen, P. M., Emons, W. H. M., & Sijtsma, K. (in press). On the shortcomings of shortened tests: A literature review. International Journal of Testing.

Chapter 2
16
Abstract To efficiently assess multiple psychological constructs and to minimize the
burden on respondents, psychologists increasingly use shortened versions of existing tests.
However, compared to the longer test, a shorter test version may have a substantial impact
on the reliability and the validity of the test scores in psychological research and individual
decision-making. In this study, we reviewed the psychological literature for recent trends
in the use of short tests and examined in depth how and to what extent test constructors and
test users addressed reliability, validity, and other potential consequences of using short
tests. The sample consisted of shortened tests found in six peer-reviewed psychological
journals in the period 2005-2010. Based on our review, we provided recommendations for
psychologists considering test shortening.∗
∗ The authors would like to thank Stéfanie André for her research support.

On the shortcomings of shortened tests
17
2.1 Introduction
Psychological tests and questionnaires are widely used in psychological research
and individual decision-making in areas such as clinical, health and medical psychology
and personnel selection. To meet practical limitations on available time and resources,
psychologists increasingly resort to shortened tests to increase efficiency of testing (e.g.,
Burisch, 1997; Shrout & Yager, 1989; Stanton, Sinar, Balzer, & Smith, 2002). Examples
include a 64-item and a 32-item versions of the Inventory of Interpersonal Problems
(Alden, Wiggins, & Pincus, 1990; Soldz, Budman, Demby, & Merry, 1995), the Mini-
Markers, which is a 40-item version of the Unipolar Big-Five Markers (Saucier, 1994), and
the 53-item and 18-item Brief Symptom Inventories, both derived from the Symptom
Checklist-90-Revised (Derogatis, 2001; Derogatis & Melisaratos, 1983). Short forms exist
even for tests that already included only a limited number of items, like the 13-item Beck
Depression Inventory items (originally 21 items, Beck & Beck, 1972), the 10-item
Marlowe-Crowne Social Desirability Scale (originally 33 items, Strahan & Gerbasi, 1972),
and the 21-item Depression Anxiety Stress Scales (originally 42 items, Lovibond &
Lovibond, 1995).
Shortened test may be more efficient from a practical viewpoint, but their use goes
against the old psychometric wisdom that many items are needed for reliable and valid
measurement (e.g., Anastasi, 1982, p. 192; Nunnally, 1978, p. 243). This is the reason why
the original psychological tests consisted of large numbers of items, often forty items or
more. Moreover, these long tests were carefully constructed such that every item
contributed to test-score reliability, and the items provided sufficient construct coverage.
Omitting items from a psychometrically sound test almost inevitably results in lower test-
score reliability and poorer construct coverage.
Chapter 2
18
This loss in measurement quality may create bias in the estimated group means and
correlations (Nicewander & Price, 1983; Sijtsma & Emons, 2011) and impair individual
decision-making (Emons, Sijtsma, & Meijer, 2007; Kruyen, Emons, & Sijtsma, 2012). The
question is whether the current practice of leaving out items that are of good psychometric
quality with the purpose to meet efficiency requirements lowers measurement quality to an
unacceptable extent (e.g., Allen & Yen, 1979, p. 87; Lord & Novick, 1968, pp. 112, 114;
Smith, McCarthy, & Anderson, 2000).
The purpose of this literature study is to explore current practices in test shortening
and assess to what extent test shortening affects measurement quality. We reviewed the
literature on test shortening published between 2005 and 2010 in six leading psychological
journals that publish articles about psychological tests. This article is organized as follows.
First, we present the research questions. Second, we discuss test-shortening strategies and
define technical terms, including reliability, measurement precision, and validity. Third,
we discuss the results from the literature study. Fourth, we provide recommendations with
respect to the use of shortened tests.
2.2 Research Questions
The next three research questions were investigated on the basis of a literature
search:
1. What is the current practice of using shortened tests? This includes: How often do
researchers use shortened tests; what motivates researchers to use shortened tests;
how much shorter are shortened tests compared to the original, longer versions;
and how are shortened tests constructed?
2. What are the differences between reliability, construct-related validity, and
prediction-related validity of the shortened test and the longer test?

On the shortcomings of shortened tests
19
3. To which extent do researchers pay attention to the potential advantages and
potentially negative implications of using shorter tests for their own research?
2.3 Technical Terms
2.3.1 Test-Shortening Strategies
To shorten tests, test constructors use statistics-driven strategies, a judgmental
strategy, an ad hoc strategy, or a combination of these strategies (Coste, Guillemin,
Pouchot, & Fermanian, 1997; Stanton et al., 2002, p. 44). Following a statistics-driven
strategy, items are removed based on statistical criteria. A widely used statistical strategy is
to produce a shorter test that has a test-score reliability that is close to the reliability of the
longer test. Classical test theory (CTT) approaches maintain reliability at approximately
the same level as in the longer test. This is achieved by keeping the items in the shortened
version that have the highest correlations with the test score on the longer version
(including the item under consideration) or the corrected test score (excluding the item).
Factor analytic approaches select items with the highest factor loadings. Item-response-
theory methods select the items that have larger item-information functions than other
items. The first items contribute most to the test-information function, thus producing an
estimated latent variable that enables the greatest measurement precision along the scale.
Using these statistical strategies, the best items are selected (or, equivalently, the worst
items are removed) even if their quality is not very good but there are no other items from
which one can choose.
Test constructors also use statistics-driven strategies to maintain test validity at the
same level as in the longer test version. For example, tests constructors select items having
the highest correlation with another test measuring the same construct or with an
interesting external criterion. Factor analysis may be used to remove items that have cross-

Chapter 2
20
loadings or that are involved in correlated errors as they may measure collateral constructs
not deemed relevant for the test. Another possibility is to compare the specificity and the
sensitivity of the short test with those of the longer test. Test-shortening is considered
successful when correlations with the other test are substantial or the classification
accuracy is not much lower for the short test relative to the longer test.
The judgmental strategy amounts to selecting items on the basis of expert judgment
of the contents of the items. Experts decide which items best cover the construct of interest.
The judgment may also include a decision on the relevance of particular items for construct
measurement in particular subgroups or an assessment of the appropriateness of the
contents of items, for example, with respect to language use, or both. Examples include the
work of Lawing, Frick, and Cruise (2010) who shortened the Impulsive/Antisocial
Behavior scale of the Juvenile Sex Offender Assessment Protocol-II by excluding two
items they considered irrelevant for the target population; and Scheier and Carver (1992)
who shortened the Ironson–Woods Spirituality/Religiousness Index by selecting items that
they judged the most important based on respondent interviews.
The ad hoc strategy has many appearances that have in common that neither
statistics nor content play a role in selecting or removing items. Examples are the selection
of the uneven numbered items or retaining the first ten items for the shortened test.
Another possibility is to select items based on their format without considering their
content, such as when the researchers aim at maintaining a balanced number of positively
and negatively worded items in the short test.
Several authors recommend to combine statistics-driven strategies and a judgmental
approach in shortening the test (e.g., Coste et al., 1997; Smith et al., 2000). First, the
definition of the construct needs to be such that the most important items for assessing the
construct can be identified. Using this definition, multiple experts should assess the

On the shortcomings of shortened tests
21
validity of each item and statistical methods should assess experts’ degree of agreement
(see also American Educational Research Association, American Psychological
Association, & National Council on Measurement in Education, 1999, p. 19). Second, test
constructors should decide which items to include in the shortened test based on the
judgment of these experts and additional statistical evidence with respect to the
contribution of every item to the reliability and the validity of the test. An example of such
combined strategy include the work of Paap et al. (2011) who used item response theory to
derive shortened scales from the SCL-90-R, where each scale was built upon two items
that content experts identified as best reflecting the attribute of interest.
2.3.2 Reliability and Measurement Precision
As CTT still is the dominating approach to test construction, we explain reliability
and measurement precision from this perspective. Reliability is defined as follows. Let 𝑋 be the test score on a test containing 𝐽 items. CTT assumes that test score 𝑋 is the sum
of a true score 𝑇 and a random measurement error 𝐸, such that 𝑋 = 𝑇 + 𝐸. Test-score
reliability is defined as the proportion of true-score variance in the group relative to the
test-score variance, such that 𝜌 = 𝜎 /𝜎 . Estimates of test-score reliability include
test-retest reliability, split-half reliability, coefficient alpha (Nunnally & Bernstein, 1994,
pp. 251-255), and the greatest lower bound to the reliability (Bentler & Woodward, 1980;
Sijtsma, 2009b; Ten Berge & Sočan 2004).
Researchers assume that a test score that has a reliability in excess of a particular
minimum is suited for research purposes or individual decision-making (Charter, 2003).
For research purposes in which group means and correlations are of interest, a minimum
reliability of .80 is considered adequate. In contrast, a minimum reliability of .90 is often
considered necessary for drawing inferences about individuals based on their test scores

Chapter 2
22
(Kline, 2000, p. 13; Nunnally & Bernstein, 1994, p. 265). Interestingly, Clark and Watson
(1995) found that some test constructors considered reliabilities in the range .60 to .70 to
be sufficient.
However, reliability is a group characteristic, but the reliability is not informative
for making decisions about individuals (Mellenbergh, 1996). Knowing that a test score has
reliability equal to, say, .85, helps little to make a decision as to whether John should be
assigned to a therapy group on the basis of his fallible test score. Instead, practitioners need
the standard error of measurement (SEM), which is deduced from the definition of the
reliability by first noting that 𝜎 = 𝜎 + 𝜎 , using this result to rewrite reliability as 𝜌 = 1 − 𝜎 /𝜎 , and then rewriting such that SEM results,
SEM = 𝜎 = 𝜎 1 − 𝜌 . (2.1)
The SEM is used to compute confidence intervals (CIs) for true scores. The smaller
the CI, the higher the measurement precision. For example, we assume that the test score 𝑋 is an estimate of the true score 𝑇, such that 𝑇 = 𝑋 , and that random measurement error
is normally distributed with mean equal to 𝑇 and variance 𝜎 , such that 𝐸~𝑁(𝑇, 𝜎 ).
Given the standard deviation of the test-score distribution ( 𝑆 ) and the estimated
reliability coefficient (𝑟 ), the sample value for SEM, denoted 𝑆 , is computed by
𝑆 = 𝑆 1 − 𝑟 . (2.2)
Then, a 95% CI for 𝑇 is obtained as [𝑋 − 1.96𝑆 ; 𝑋 + 1.96𝑆 ]. This CI can be used, for
example, to test at a 5% significance level whether John’s test score is significantly
different from a particular cut-score, 𝑋 . If cut-score 𝑋 is inside the estimated CI, then the
test score does not differ significantly from the cut-score.
To investigate how measurement precision is affected as the test grows shorter, the
scale length needs to be considered as well (Sijtsma, 2009a). The scale length is the
maximum possible test score minus the minimum possible test score. As items are

On the shortcomings of shortened tests
23
removed, CIs are narrower but the scale length also is shorter and shrinks at a larger pace
(Sijtsma, 2009a). Consequently, CIs for the shortened test may encompass a larger
proportion of the scale length than those for longer tests, thus leaving less room for test
scores to differ significantly. To study the relationship between measurement precision and
test length, we defined measurement precision by the ratio of the 95% CI and the scale
length, which we called the relative 95% CI. The larger the relative 95% CI, the less
precise measurements are relative to the scale length.
Finally, most textbooks use the Spearman-Brown formula to relate reliability to test
length (e.g., Allen & Yen, 1979, p. 85; Lord & Novick, 1968, p. 112). The formula predicts
the reliability of a shortened test under the ideal circumstance that the test consists of
parallel items. In practice, items are not parallel and the reliability of the shortened test is
different from what the Spearman-Brown formula predicts. Therefore, the question to what
extent the reliability and measurement precision of a real test reduces when the test is
shortened is an empirical issue.
2.3.3 Validity
Validity is not unambiguously defined (Borsboom, Mellenbergh, & Van Heerden,
2004; Lissitz, 2009; Sijtsma, 2009a). Basically, there are two types of validity, construct-
related validity and prediction-related validity (Evers, Sijtsma, Lucassen, & Meijer, 2010).
Next, we discuss these two types of validity and possible effects of test shortening on the
two types of validity.
Construct-related validity entails the degree to which a test measures the construct
of interest, and is sometimes assumed to also include content validity. Construct validity is
often ascertained by means of factor analysis so as to assess the internal structure of a test,
and the correlations of the test scores with scores on tests that are assumed to measure the

Chapter 2
24
same construct, which establishes convergent validity, or a different construct, which
establishes divergent validity. An unfortunate test-shortening that results in a poor or an
incomplete construct representation impairs construct-related validity. The statistics-driven
strategy is particularly vulnerable to this problem as this strategy is ‘blind’ to item content,
and the way some statistical methods select items may bias the shortened test’s validity. In
particular, strategies that select items on the basis of their correlation with other items have
a tendency to select items that are similar in content, so that the content domain of the
shortened test may be unintentionally narrowed (Clark & Watson, 1995; Stanton et al.,
2002). Item selection based on high factor loadings in explorative factor analysis tends to
produce the same bias, with shortened tests that no longer fully cover the content of the
original scales (Coste et al., 1997; Reise, Waller, & Comrey, 2000). Such a shift in
meaning may produce instrumentation bias (Cook & Campbell, 1979, p. 52).
Prediction-related validity refers to the degree to which test scores accurately
predict a criterion. Prediction-related validity is often assessed by correlating test scores
with scores on a criterion measure or by studying the test score’s classification accuracy.
Assuming that the items in the longer test all measure the same construct and that removal
of items leads to lower test-score reliability, prediction-related validity decreases as the
greater influence of random measurement error lowers the correlation of the resulting test
score and the criterion score (Allen & Yen, 1979, p. 98). However, if test shortening leads
to construct misrepresentation then the influence of the misrepresentation on the test-
criterion correlation is difficult to predict. If the items that represent particular aspects of
the construct correlating with the criterion measure are left out, then the resulting test score
correlates lower with the criterion. If items are removed that do not correlate with
important aspects of the criterion measure, then the test-criterion correlation might even
increase, provided unreliability does not drive the correlation downward.

On the shortcomings of shortened tests
25
Evidence for the validity of the original test does not automatically transfer to the
shortened test version (Smith et al., 2000). Validity of the shortened test therefore needs to
be demonstrated in additional validation research, also if the longer version had adequate
validity. Previous reviews (Coste et al., 1997; Levy, 1968; Smith et al., 2000) suggested
that test constructors tend to take the validity of the shortened tests for granted and refrain
from additional validation research at all.
The validity of the shortened test may be judged by experts or investigated by
means of statistical-driven strategies. In practical test-shortening studies, statistical
validation studies are performed using the following types of data samples (Smith et al.,
2000). First, statistical analyses can be done by reanalyzing the data which was also used
to construct the shortened test or by reanalyzing data collected by means of the longer test
in a different sample but without the deleted items. However, results from the reduced data
set are vulnerable to chance capitalization due to item selection, especially, if the sample
size was modest. Also, answers to items included in the shortened test may have been
influenced by answers to the deleted items. This influence would have been absent if only
the shortened test version would have been administered. Second, both test versions may
be administered to the same respondents but here validation results may be confounded by
memory and learning effects because the same items were administered twice to the same
persons. The best strategy is to validate the shortened test in a new, independent sample
drawn from the target population, but this strategy is rarely used in practice (Coste et al.,
1997; Smith et al., 2000; Stanton et al., 2002). In the present study, we investigate to what
extent validity issues related to test shortening are studied and if so, which validation
strategies are used.

Chapter 2
26
2.4 Method
2.4.1 Sample
The sample consisted of shortened tests reported in articles published in six peer-
reviewed psychological journals. The unit of analysis was test pairs (longer tests and
shortened tests) and the unit of observation was research articles. The journals included in
our review were selected as follows. We screened a large number of leading peer-reviewed
psychology journals for the presence of research using tests or questionnaires. Of all
journals regularly reporting on test and questionnaire construction, we chose six journals
such that four major areas in psychology were covered. For four journals, Journal of
Personality Assessment (personality psychology: 6 issues per year), Personnel Psychology
(personnel psychology: 4 issues per year), International Journal of Selection and
Assessment (personnel psychology: 4 issues per year), and Psychological Assessment
(clinical psychology: 4 issues per year), we listed all shortened tests found in articles
starting in 2005 and up to and including 2010. The fifth and sixth journal, Personality and
Individual Differences (personality psychology: 16 issues per year) and Journal of
Psychosomatic Research (medical psychology: 12 issues per year), published a
considerably larger number of issues compared to the other reviewed journals. For both
journals, we included only issues that appeared in 2009 and 2010 and added four randomly
drawn issues from the previous period (2005-2008) to prevent these two journals from
dominating the results.
To identify shortened tests, we looked for all references to tests that mentioned the
adjectives “abbreviated”, “abridged”, or “shortened”, or were referred to as “short form”.
This search strategy may have excluded shortened tests that were not explicitly labeled as
such but a pilot study suggested such cases to be rare. Some reviewed articles contained

On the shortcomings of shortened tests
27
references to short tests as possible alternatives to the measures used in the study but these
tests were not actually used; hence, we did not include them in our review.
If different shortened versions of the same test were found, each version was
included as a separate shortened test in the sample. Shortened tests that were used in
multiple articles were only included once in our analyses. When information about the
reliability and validity of a test was provided in multiple articles, this information was
combined to obtain a better picture of the psychometric properties of the test. Some
shortened tests were constructed without a reference to the longer test, but they were
presented instead as a shortened version of a previously shortened test. In these instances,
we considered the initially shortened form as the original test and compared the properties
of both shortened versions with each other.
The selection criteria resulted in the exclusion of some commonly used shortened
tests. For example, the NEO-FFI includes a number of items that were not incorporated in
the original NEO-PI-R (Costa & McCrae, 1992); the Short Form Health Survey consists of
36 items taken from various longer tests (Ware, Kosinski, & Keller, 1996); both the 100-
and 50-item version of the International Personality Item Pool were derived from the same
2000+ item pool (Goldberg, 1992); and the shortened 370-item version of the Minnesota
Multiphasic Personality Inventory (MMPI)—2 contains all the original scales from the
MMPI (Butcher & Hostetler, 1990).
The first author (PK) screened all articles for the relevant information. For this
purpose, he used a detailed coding scheme, which was developed in a pilot study. After
two months, all articles were coded a second time to secure consisting coding. If the
required information was not reported in the reviewed article, PK consulted the article or
the book that presented the longer test or the shortened form to obtain the necessary data.
Chapter 2
28
2.4.2 Variables
The Appendix lists all studied variables, which were selected on the basis of a
review of the psychometric literature and a pilot study that we performed, and the
Appendix also lists the variables’ operationalizations. A few remarks are in order. First,
some tests are a composite of separately used subtests, each measuring a different construct.
For example, the shortened Depression Anxiety Stress Scales yields two scale scores that
should be interpreted separately (Lovibond & Lovibond, 1995). We considered a test to be
a composite if the authors indicated that test scores should be reported and interpreted at
the subtest level. For composite tests, we studied the magnitude of test shortening and the
effects of test shortening on reliability and measurement precision at the subtest level.
Second, different methods for estimating test-score reliability may produce
different reliability values, and therefore cannot be used interchangeably (American
Educational Research Association et al., 1999, p. 32). Our pilot study showed that most
studies report coefficient alpha and rarely other estimates such as test-retest reliability.
Therefore, to study the effects of test shortening on reliability we rely on the reported
coefficient alphas.
Third, test-score reliability has different values in different populations for the same
test. For example, reliability is lower in homogeneous populations (i.e., small true-score
variance) than in heterogeneous populations (i.e., large true-score variance) (Allen & Yen,
1979, pp. 34-36). Hence, we only compared reliability and measurement precision of tests
pairs for which we could assume that these properties were estimated in random samples
from the same population. We made this assumption when both samples came from either
a general population or a clinical population and both tests were administered in the same
language, which was often English. We did not further distinguish clinical subpopulations.
On the shortcomings of shortened tests
29
Fourth, our pilot study revealed instances of test shortening in which the items from
all scales were pooled and a selection of these items was used to form one or more new
subtests. An example is the 24-item Locus of Control Scale, which comprises three
subtests each covering one of three dimensions, whereas the shortened 9-item version is
based on a clustering of items from the three subtests into one general test (Levenson, 1973;
Noone, Stephens, & Alpass, 2010). As a result, the items in the shortened subtests came
from different longer subtests. Such a redistribution of items into smaller scales confounds
the effect of test-shortening on test-score reliability and measurement precision. Therefore,
we only compared test length, reliability, and measurement precision of subtest pairs for
which all items in the short subtests came from the corresponding longer subtests.
2.5 Results
2.5.1 Research Question 1: What is the current practice of using shortened tests?
Short-test use. Among 2,273 reviewed articles, we found 164 shortened tests
reported in 170 articles. The longer tests comprised 380 subtests (range was 1-22 subtests
per test) and the shortened tests 346 subtests (range was 1-20 subtests per tests). We
identified 281 pairs of subtests, coming from 133 tests, for which all items of the shortened
version came from the corresponding longer subtest. For the other 31 shortened tests, the
number of subtests varied between the short and the long versions or insufficient
information was available to determine whether all items in the short subtests came from
the corresponding longer subtests.
In Psychological Assessment and Personnel Psychology we found the highest
percentages articles in which shortened tests were reported but percentages varied little
among the six journals (Table 2.1). One-hundred-and-forty-six tests were reported in one

Chapter 2
30
Table 2.1: Prevalence of shortened tests.
Articles Journal # Reviewed # Shortened tests included Percentage
Journal of Personality Assessment 406 20 4.93 Personnel Psychology 160 14 8.75 International Journal of Selection and Assessment 230 13 5.65 Psychological Assessment 366 42 11.48 Personality and Individual Differences 764 63 8.25 Journal of Psychosomatic Research 347 18 5.19 Total reviewed 2273 170 7.48
reviewed article and 18 tests were reported in at least two articles. Frequently used
shortened tests included the shortened 30-item Trait Emotional Intelligence Questionnaire
(Cooper & Petrides, 2010, 153 items included in the longer form, used in 7 studies), the
Mini-markers (40 items), which is a reduced version of Goldenberg’s 100-item Unipolar
big-five markers (Saucier, 1994, used in 6 studies); and the 12-item Health Survey (Ware
et al., 1996, 36 items included in the longer form, used in 5 studies).
Among the 164 shortened tests, 7 tests measured mental abilities, 56 tests measured
personality traits, 53 interests, values, or attitudes, and 48 tests measured psychopathology.
Among all shortened tests, 27 tests were proposed as an alternative to the longer version
but not applied in empirical research, 57 tests were constructed and used for empirical
research in the same article, and 80 tests were used for empirical research but developed in
another study (including all tests which were found in multiple articles). For 114 shortened
tests, we had access to the article or the book in which the longer form was presented. For
55 shortened tests that were developed in another study, we were able to retrieve the
publication in which the shortened test was presented.
Motivations to construct and use shortened tests. Motivations for test shortening
could be traced for 70 tests. Motivations for constructing a shortened test in the reviewed
articles were the following. Twenty-one short tests were constructed in the reviewed

On the shortcomings of shortened tests
31
articles to achieve savings in time and increased efficiency; 22 tests were shortened
because test constructors believed that the shortened tests had superior psychometric
properties (i.e., improved reliability and validity) compared to the longer version; and 10
tests were shortened because some items had inappropriate content for the target
population. For example, McCarthy, S. L. Pedersen, and D’Amico (2009) found it
inappropriate to ask children about sexual behavior and therefore removed two items from
the 15-item short form of the Comprehensive Effects of Alcohol questionnaire (Ham,
Stewart, Norton, & Hope, 2005). Motivations for using a shortened test that was developed
in another study included: savings in time (mentioned 5 times), superior psychometric
properties compared to the longer version (mentioned 6 times), investigating the
psychometric properties of the shortened test (mentioned 14 times), and proven useful in
previous research (mentioned 9 times).
Magnitude of test shortening. For 201 subtests coming from 106 test pairs, we
were able to retrieve the number of items for both the longer and the shortened versions.
Figure 2.1 shows test lengths for the shortened and longer tests, and Figure 2.2 shows the
frequency distribution of test-shortening factor 𝐾 (i.e., the ratio of the novel test length and
the original test length) by which the test was shortened. The mean number of items
reduced from 19.28 to 9.36. Most subtests were shortened by removing 40% to 60% of the
items. However, Figure 2.2 also shows that for 21 subtests test shortening involved a
reduction in items of 80% or more. For these tests, the mean number of items decreased
from 29.86 to 6.33. We did not find a relationship between the magnitude of the decrease
in test length and the psychological domain.
Test-shortening strategies. We were able to retrieve information about the test-
shortening strategy used for 111 tests. A statistics-driven strategy was used for 92 tests, the
judgmental approach was used for 45 tests, and the ad hoc strategy was used for 17 tests.

Chapter 2
32
Figure 2.1: Comparison of test length of the longer tests and the shortened tests.
Table 2.2: Frequencies of statistics-driven strategies used to shorten tests and validate the
shortened tests.
Item-selection purpose
Strategy Maintainingreliability
Maintaining validity Both Validation
Classical test theory 44 2 10 115 Item response theory 10 0 0 8 Factor analysis 32 4 26 54 Regression analysis 1 1 0 23 Classification accuracy 0 1 0 11
0 20 40 60 80 100 120 140
0
20
40
60
80
100
120
140
Items longer tests
Item
s sh
orte
ned
test
s

On the shortcomings of shortened tests
33
Figure 2.2: Test shortening factor 𝐾 for the shortened tests.
Single strategies shortened 76 tests, combining two strategies shortened 27 tests and
combining all three strategies shortened eight tests. For 53 shortened tests, information
about the test-shortening strategy was absent.
Table 2.2 (columns 1-3) shows that among the statistical strategies, classical-test-
theory strategies and factor analysis were dominant. For only ten tests item response theory
was used to remove items. This is a remarkably low number given the growing popularity
of item response theory in area psychological assessment nowadays. Most statistics-driven
strategies removed items that contributed the least to the reliability and thus minimizing
reliability reduction.
Change (K )
Freq
uenc
y
0
10
20
30
40
50
60
70
0 0.1 0.2 0.3 0.4 0.5 0.6 0.7 0.8 0.9 1

Chapter 2
34
When statistical procedures were used, either to optimize reliability or validity, the
final decision about which items to remove was often somewhat arbitrary. For example, it
remains unclear why Tangirala and Ramanujam (2008) selected the five items with the
highest factor loadings from Mael and Ashforth’s (1992) identification scale and not, for
example, four items.
A combination of a statistics-driven strategy and a judgmental strategy was used for
28 tests. However, for most of the shortened tests the procedure was not performed as
thoroughly as advised in the literature (Coste et al., 1997; Smith et al., 2000). Exceptions
included the SKILLSCOPE® (Kaiser, Lindberg, & Craig, 2007) and the Material Values
Scale (Richins, 2004). For example, items for the shortened SKILLSCOPE® were selected
as follows. First, three experts had to judge the relevance of all items in an iterative
procedure based on background information about the measured constructs. Next, Kaiser et
al. (2007) determined which items to include in the shortened version using the opinion of
these experts and the results of several statistical analyses. In general, when test
constructors used a judgmental approach, they typically reported that they decided which
items to retain on the basis of the items’ perceived relevance (e.g., Mason, Linney, &
Claridge, 2005).
2.5.2 Research Questions 2: What are the differences between reliability, construct-
related validity, and prediction-related validity of the shortened test and the longer
test?
Reliability. Coefficient alpha was reported for 291 subtests included in 116
shortened tests. The reliabilities of these subtests ranged from .09 to .96 with a mean equal
to .78; 129 subtests had a reliability below .80 and 47 subtests had a reliability below .70.
For 137 pairs of longer subtests and shortened subtests coming from 62 tests, coefficient

On the shortcomings of shortened tests
35
alphas were available for the same type of population (i.e., either a general population or a
clinical population). For these pairs, Figure 2.3 shows the relationship between the
reliability of the original subtests and the reliability of the shortened subtests. Ignoring the
tests that were shortened to improve the psychometric properties of the test (triangles in
Figure 2.3), reliability decreased as a result of removing items for 102 subtests, was similar
for 5 subtests, and improved for 17 subtests (mean improvement was .03).
Figure 2.3: Difference between reliability of the longer tests and reliability of the shortened
tests.
Note. Triangles represent subtests shortened to improve the psychometric properties of the original version; dots represent all other subtests. The solid line is the identity line; subtest pairs at the solid line have equal reliability. The dashed line represents a difference in reliability of .10; the difference between the reliability of the longer and shortened test was more than .10 for subtest pairs below the dashed line.
0.6 0.7 0.8 0.9 1.0
0.0
0.2
0.4
0.6
0.8
1.0
Reliability longer tests
Rel
iabi
lity
shor
ter t
ests

Chapter 2
36
Test shortening caused mean reliability to reduce from .84 to .77 (Table 2.3,
columns 3-4). For 33 original tests, reliability was below .80 and of these 6 original tests
had a reliability below .70. Test shortening resulted in 31 additional tests with reliability
below .80 of which 18 tests had a reliability below .70. Among the 110 subtests that had
lower reliability, 36 subtests showed a reduction in reliability that was less than .05, 35
subtests showed a reduction between .05 and .10, and 39 subtests showed a reduction in
excess of .10. The largest decrease was found for the subtest Unassuming-Ingenuous Scale
of the Battery of Interpersonal Capabilities (Hofsess & Tracey, 2005). For this subtest,
which was shortened from sixteen to two items, reliability decreased from .80 to .09. The
effect of separate test-shortening strategies on reliability could not be assessed. For most
pairs of longer and shortened subtests for which coefficient alphas were available, either a
statistical-driven strategy or a combination of at least two of the strategies was used to
shorten the tests and, moreover, the mean 𝐾 varied between .43 and .68 across strategies.
Table 2.3: Overview of the test-shortening strategies and reliability of the longer tests and
the shortened tests.
Reliability Mean Standard deviation Minimum Maximum 𝑟 < .8 𝑟 < .7
Strategy Freq 𝐾 L S L S L S L S L S L S S 44 .52 .84 .80 0.06 0.08 .69 .57 .95 .92 12 18 1 4 J 3 .68 .86 .75 0.05 0.10 .80 .63 .89 .82 0 2 0 1 A 1 .60 .90 .89 .90 .89 .90 .89 0 0 0 0 S & J 37 .52 .80 .75 0.10 0.12 .67 .50 .97 .92 20 21 5 11 S & A 13 .43 .86 .74 0.04 0.06 .80 .68 .93 .88 0 10 0 2 J & A 0 S & J & A 13 .47 .89 .85 0.03 0.02 .85 .80 .94 .88 0 0 0 0 Unknown 26 .36 .89 .73 0.05 0.20 .77 .09 .97 .93 1 13 0 6 Total 137 .49 .84 .77 0.07 0.12 .67 .09 .97 .93 33 64 6 24 Note. Freq = Pairs of subtests; 𝐾 = Mean 𝐾; L = Longer test; S = Shorter test; S = Statistics-driven strategy; J = Judgmental strategy; A= ad hoc strategy.

On the shortcomings of shortened tests
37
Measurement precision. For 21 pairs of longer subtests and shortened subtests
coming from 15 tests, we computed the relative 95% CI for both subtests. For all others
tests, we lacked complete information about the scale range, coefficient alpha, and the
standard deviation of the test scores. Table 2.4 shows descriptive statistics for the relative
95% CIs (mean 𝐾 was .49). Measurement precision decreased little, and on average the
CIs covered about one-third of the test-score scale. The 95% CI of the shortened version of
the social desirability scale of the Revised Junior Eysenck Personality Questionnaire
(George, Connor, Gullo, & Young, 2010) extended even across more than half of the scale
range (i.e., a relative 95% CI of .54). However, given the small number of subtests for
which information was available, caution should be exercised in generalizing these results
to other shortened tests.
Table 2.4: Measurement precision of the longer tests and the shortened tests (for 17 pairs
of subtests).
Relative 95% CI Statistic Longer test Shorter test Mean .26 .32 Standard deviation .07 .11 Minimum .15 .16 Maximum .41 .54 Note. Relative 95% CI equals the ratio of the width of the 95% CI and scale length.
Validity. For 100 tests it was reported that the validity of the shortened version had
been studied. Detailed information about the validation strategies followed was available
for 92 tests (Table 2.5). For the other eight tests, test users provided references to
validation research without providing information about validation strategies they followed.
Construct-related validity evidence was reported for 90 tests, while prediction-related

Chapter 2
38
validity evidence was only available for 23 tests. This is interesting because tests are often
used to predict particular outcomes (e.g., behavior, employee success). For 49 of the 57
shortened tests that were constructed and used to collect data for research, evidence
supporting their validity was absent. As these tests were nevertheless used in empirical
research, this result suggests that the researchers took the validity for granted.
For the 92 tests for which validation strategies were reported, validity of the
shortened test was always assessed by applying statistics-driven strategies. However,
validation studies showed much variation with respect to the number of different statistical
strategies used. Twenty-two tests were validated on the basis of only one class of statistical
strategies, and three tests using all five of the statistical strategies listened in Table 2.2.
Most validation studies were based on a comparison of psychometric properties of the
shortened test and the longer version using classical test theory statistics and factor
analysis (Table 2.2, fourth column). According to the test constructors, the higher the value
of the statistic (e.g., the correlation between test scores of the short and the longer versions)
or the more similar the statistic for both test versions (e.g., the factor solution), the stronger
the evidence that test shortening did not affect validity.
Table 2.5: Frequencies of validity evidence for the shortened tests.
Status of the shortened test
Source of the validity evidence Constructed
only Constructed and
used Used only Total
Construct-related validity 16 8 45 69 Prediction-related validity 1 0 1 2 Both construct-related validity and prediction-related validity 8 0 13 21 Only references in the reviewed article — — 8 8 No validity evidence given 2 49 13 64 Total 27 57 80 164

On the shortcomings of shortened tests
39
Information about the samples used for validation was given for 89 tests. Forty-
three tests were validated using the data that were also used to construct the shortened
version. For 46 shortened tests, validity was investigated by reanalyzing data of the longer
version obtained in a different sample. For two shortened tests, new data on the shortened
test were obtained in a sample of respondents who had previously completed the longer
version. Forty-three tests were validated in a new sample that completed the shortened test
but not the longer test.
2.5.3 Research Question 3: To which extent do researchers pay attention to the
potential advantages and potentially negative implications of using shorter tests for
their own research?
For all 22 tests that were shortened to improve reliability and validity, the
advantages of test shortening for the reliability and the validity were mentioned. For 11 of
the 26 tests that were shortened to have more efficient instruments to be used in empirical
research, the pay-off between efficiency gain and potential loss of reliability and validity
was discussed. Conditions were discussed under which psychologists could use the
shortened test instead of the longer version. Actual time savings were only reported for 6
of the tests that were shortened with the aim to save administration time. For example, for
the Short Children’s Behavior Questionnaire, which includes of 94 of the 177 items of the
original version, testing time was reduced by 30 minutes (Putnam & Rothbart, 2006). For
the shortened version of the Profile of Moods States, testing time was reduced by about
one half (Shacham, 1983). For the other 125 shortened tests, authors of reviewed articles
did not discuss realized advantages and potential disadvantages of using shortened versions
or possible pay-offs if the longer version would have been used.

Chapter 2
40
2.6 Discussion
We reviewed 2,273 articles that appeared in six leading journals (2005-2010), and
identified 164 shortened tests in 170 articles. Most shortened tests were found in the non-
cognitive domain (e.g., personality traits and psychopathology). Given the huge number of
psychological tests that are available nowadays, a total of 164 shortened tests may not give
the impression that test-shortening is a significant trend, but one should keep in mind that
the reviewed journals do not have as their goal to publish shortened tests. A quick-scan of
other psychological journals confirmed that the use of shortened tests is quite common.
Moreover, we found numerous translations of shortened tests but ignored these tests due to
the specific problems associated with translated tests. Hence, we believe that the finding of
164 shortened tests suggests a significant trend rather than an incident, and this trend needs
further scrutiny.
With the exception of a few tests, for most tests the shortened version had a
reliability that was only little lower than that of the longer version, and still satisfied
minimum reliability as required in the psychometric literature. However, it was particularly
striking that that shortened tests were derived from longer tests that often had only modest
reliability to begin with. The literature often did not provide reasons for test shortening
when initial reliability was already modest and one can only guess why researchers
shortened their tests. We speculate that researchers tend to report reliability more as a ritual
and by default consider a modest reliability, say, between .70 and .80, high enough for the
application envisaged, and therefore readily accept losing half of the items for reasons of
practical efficiency.
We further speculate that many researchers are unaware of the important distinction
between the group-level characteristic of reliability and the individual-level characteristic
of measurement precision. Because only 15 out of 164 tests allowed us to compare

On the shortcomings of shortened tests
41
measurement precision between the longer version and the shortened version, we believe
researchers often do not realize that shortening their modest-reliability test to only half or
less than half its length while losing only little reliability does not mean that measurement
precision remains the same. On the contrary, measurement precision tends to be impaired
considerably when the test grows shorter and a reliability that drops only little does not
show this (Emons et al., 2007; Sijtsma & Emons, 2011). Loss of measurement precision
means that decisions about individuals are more uncertain to a degree that uncertainty may
become unacceptable for many decisions. The result may be a large number of decision
errors (Emons et al., 2007; Kruyen et al., 2012).
Another concern with respect to low measurement precision is that test users
increasingly are required to report scores per subdomain in addition to total scores so as to
provide diagnostic information to the client. Sinhary, Puhan, and Haberman (2010) showed
that the diagnostic value of subdomain scores often is limited because subdomain scores
are based on a few items and, as a result, they are unreliable. Shortening a test may results
in even fewer items per subdomain and thus further diminishes the diagnostic value of
domain scores, and this happens even though reliability reduces just a little.
The literature review revealed that statistics-driven strategies were often used,
sometimes in combination with other strategies, to maximize coefficient alpha of the
shortened test. As highly correlating items produce high alphas, the selected items
probably correlated highly whereas items correlating lowly were not selected. Items
correlating highly often have similar content and, consequently, selecting items such items
tends to narrow construct coverage (e.g., Reise & Waller, 2009). Another problem is that
the shortened test may consist of similarly worded items. Consequently, respondents
noticing these similarities may purposively but incorrectly match the responses from
different items to ensure response consistency. This response strategy reduces the number

Chapter 2
42
of items that effectively contribute to measurement, and reliability of the shortened test
based on coefficient alpha is artificially high. For tests that were shortened using a
judgmental approach, the selection of items was typically informal and based on perceived
relevance. When an ad hoc selection strategy was used, construct coverage was not
considered at all.
Given the importance of using valid tests, it is remarkable that validity evidence
was only available for half of the shortened tests. For the other tests, researchers ignored
validity issues or assumed that validity evidence for the longer test transferred to the
shortened test. These results are consistent with previous reviews (Coste et al., 1997; Levy,
1968; Smith et al., 2000). Studies that did investigate short-test validity suffered from
methodological shortcomings, mostly related to using the same sample that also had been
used for item selection rather than relying on a new sample. Because validity of the longer
test does not automatically transfer to the shortened test, we conclude that test constructors
and test users should give more attention to validity issues, both from a substantive and a
methodological perspective.
Ignoring reliability and validity issues, an important and complex question is what
the practical implications are of using shortened tests to address substantive research
questions. This question does not have a single answer, but an important concern is
whether test-shortening produces bias in the statistical outcomes of psychological research.
For example, we know from CTT that estimates of associations by means of the correlation
coefficient become more biased when less reliable measurements are used (Lord & Novick,
1968, pp. 114-118). Sijtsma and Emons (2011) provided several numerical examples
showing, for example, that if the population correlation is .60, the sample correlation
coefficient reduces from .54 to .36 if the reliability of the variables reduces from .80 to .60.
Reduced and therefore biased construct-related validity may further distort product-

On the shortcomings of shortened tests
43
moment correlations. However, the effects of reduced reliability on the power of statistical
tests seem to less problematic. For example, Sijtsma and Emons (2011) found little effect
of lowered reliability on the power of the Student’s 𝑡-test even when reliability decreased
from .90 to .70. Thus, the effect of lowered reliability on statistical results should be
considered separately for each statistical problem.
We provide four recommendations. First, it seems that researchers who shorten
their test often aim at arriving at the minimum reliability prescribed by rules of thumb, thus
assuming that this is a safe value for test applications. We recommend researchers to aim
higher so as to provide the best possible quality for the persons who are tested. Second,
without exception it seems that researchers are unaware that aiming for particular
reliability values is a ritual, and that for individual decision-making one rather needs to
know the test’s measurement precision. Information about measurement precision was
scarce but should be standard in test reports (American Educational Research Association
et al., 1999, pp. 29, 31). Third, we recommend researchers not to automatically transfer
validity results for the longer test version to the shorter test version, but to investigate the
validity of shorter test in a separate sample. Fourth, we recommend researchers who
consider the use of a shortened test to gauge the implications for the statistical analyses in
the application envisaged and appraise the pay-off between gained practical efficiency and
losses in statistical accuracy.

Chapter 2
44
Appendix: Coding Scheme
Category Explanation Function of the shortened test in the reviewed article
Constructed only The authors constructed the shortened test, but
did not use the test for empirical research Constructed and used The authors constructed the shortened test and
used the test for empirical research Used only The authors used an available shortened test for
empirical research Psychological domain
Mental abilities e.g., intelligence Personality traits e.g., extraversion Interests, values, and attitudes e.g., disgust Psychopathology e.g., depression
Motivation to develop or use a shortened test instead of the longer form in the reviewed article Savings in time and increased efficiency Investigating the psychometric properties The validity and the reliability of the shorter test
were investigated Improved psychometric properties The shortened test was considered better than
the longer test Inappropriate content of some items in the longer Test Shortened test was effectively used in previous Research No motivation given
Test length of the longer form and shortened form Number of items and scale length Per subtest for composite tests. We considered a
test to be a composite if authors indicate that scores should be interpreted at the subtest level
Scale range Difference between the maximum possible test- score and the minimum possible test-score
Test- shortened strategy Statistics-driven strategy Judgmental strategy Ad hoc strategy Unknown The information was neither reported in the
reviewed article nor the article presenting the shortened form

On the shortcomings of shortened tests
45
Statistics-driven strategy (if applicable) Classical test theory e.g., coefficient alpha, correlations, proportions,
shape of the test-score distribution Item response theory e.g., test information Factor analysis e.g., loadings, model fit Regression analysis e.g., regression weights Classification accuracy e.g., Cohen’s 𝜅, sensitivity
Purpose of the statistics-driven strategy (if applicable) Maintaining test-score reliability close to the test- score reliability of the longer test
e.g., removing items with the lowest loadings in factor analysis
Maintaining validity close to the validity of the longer test
e.g., removing items with cross-loadings in factor analysis
Reliability and measurement precision of the longer form and the shortened form Sample used to estimate test-score reliability General population versus clinical population Language in which the test was administered Method used to estimate test-score reliability Coefficient alpha Standard deviation of the test-score distribution (𝑆 )
Estimate of the standard measurement error (𝑆 ) Included information We applied the following rules when multiple
reliability estimates were given for the same population (i.e. general versus clinical):
- When coefficient alpha and 𝑆 or 𝑆 were reported for various samples of either a general or clinical population (e.g., males and females), we took the mean values. Differences between reported values for these samples were smaller than .05;
- When coefficient alpha was reported for various samples, but either 𝑆 or 𝑆 was reported for only a subset of these samples, we considered only those samples for which coefficient alpha and either 𝑆 or 𝑆 were resported;
- When coefficient alpha was reported for multiple time points or replications in a single article, we took the first value for which either 𝑆 or 𝑆 was given. If neither 𝑆 nor 𝑆 were reported, we included the first reported coefficient alpha.

Chapter 2
46
Types of evidence given for the validity of the shortened test Construct-related validity Evidence given both in the reviewed article and
the article presenting the shortened form Prediction-related validity Evidence given both in the reviewed article and
the article presenting the shortened form Only references in the reviewed article No evidence given, but the reviewed article
states that the shortened test “has excellent psychometric properties”, “is a valid measure” and so on, and cites validation studies
No validity evidence No evidence given and the reviewed article does not refer to validation studies
Statistics-driven strategy used to investigate the validity of the shortened test (if applicable) Classical test theory Item response theory Factor analysis Regression analysis Classification accuracy
Sample used to investigate the validity of the shortened test (if applicable) Using the data that were also used to construct the shortened version
Reanalyzing data of the longer version obtained in a different sample
New data on the shortened test obtained in a sample of respondents who had previously completed the longer version
New sample, which filled out the shortened test but not the longer test
Discussion pay-off advantages versus losses in reliability and validity in the reviewed article Discussion advantages realized Discussion of pay-off

47
Chapter 3: Test length and decision quality in personnel selection: When is short too short?*
* This chapter has been published as: Kruyen, P. M., Emons, W. H. M., & Sijtsma, K. (2012). Test Length and decision quality in personnel selection: When is short too short? International Journal of Testing, 12, 321-344.

Chapter 3
48
Abstract Personnel selection shows an enduring need for short stand-alone tests
consisting of, say, 5 to 15 items. Despite their efficiency, short tests are more vulnerable to
measurement error than longer test versions. Consequently, the question arises to what
extent reducing test length deteriorates decision quality due to increased impact of
measurement error. A distinction was made between decision quality at the group level and
the individual level. Using simulations, we found that short tests had a large negative
impact on individual-level decision quality, in particular for selecting suited candidates
when base rates or selection ratios are low. Negative effects on group-level decision
quality were smaller than those for individual-level decision quality. Results were similar
for dichotomous-item tests and rating-scale tests, and also for top-down and cut-score
selection.

Test length and decision quality in personnel selection
49
3.1 Introduction
Personnel selection shows the increasing tendency to use short tests consisting of,
say, 5 to 15 items, for making decisions about individuals applying for a job (e.g., Drasgow,
Nye, & Tay, 2010, p. 33; Kline, 2000, p. 41; Martin, Moore, Sloan, & Legree, 2007; Segall,
2001). Since the days of Spearman (1910) and Brown (1910), psychometricians have been
aware of the influence of test length on test-score reliability under idealized conditions of
parallel test parts, which are often individual items but in fact any test parts (like subsets of
items) that are parallel. The message of the Spearman-Brown prophecy formula is that
reliability increases as the test grows longer but the reverse message is that reliability
decreases as the test grows shorter. Although somewhat weaker, these trends are also
effective if test parts are not parallel, which is common in real tests.
Given this century-old knowledge, the trend of using short tests is intriguing, and
the question how the use of short and, hence, less-reliable test scores affects the quality of
decision making thus becomes paramount. Emons, Sijtsma, and Meijer (2007) investigated
this question for cut-score selection in a computational study and concluded that as test
length decreases, the certainty by which one makes the right decisions about individuals
can be impaired and become worrisome. Here, we extended their study to include
interesting results at the group level in addition to the individual level. Group level is
important because hiring many unsuited applicants causes high organizational costs.
Individual level needs to be considered because incorrectly selected applicants
may gain bad work experiences, while incorrectly rejected applicants may decide to sue the
organization for being rejected on the basis of inadequate testing procedures. Assessing
group-level and individual-level decision quality requires different perspectives, as we
point out later. We studied the influence of test shortening on decision quality for groups
and individuals in five selection scenarios that are regularly discussed in the literature on

Chapter 3
50
personnel selection. Our study sheds light on the issue whether short tests can be used
responsibly in personnel selection and if so, under which conditions this is possible.
3.2 Background
Short tests take little time and are cheap to administer (Smits & Vorst, 2007;
Stanton, Sinar, Balzer, & Smith, 2002), relieve the applicants’ burden (Burisch, 1997;
Netemeyer, Pulling, & Bearden, 2003), and have a simple lay-out facilitating computer-
based administration (Forsythe, Grose, & Ratner, 1998). A recent example of the use of
short tests comes from distance testing at the international labor market, where a Chinese
company may test potential employees in India via the Internet and uses short tests that are
efficient, fast and cheap (Bartram & Hambleton, 2006; Cook, 2009, pp. 8-9; Konradt,
Hertel, & Joder, 2003).
We found that 15% of the articles in five recent volumes of six leading
psychological journals used abbreviated tests to collect data either for research purposes or
individual decision-making in clinical, educational and personnel selection contexts. Short
tests developed for personnel selection include a 12-item form of the Raven Advanced
Progressive Matrices test (Arthur & Day, 1994), a 20-item numerical-reasoning test (Baron
& Austin, 2000), a scale measuring self-evaluation by means of 12 items (Judge, Erez,
Bono, & Thoresen, 2003), a 10-item test measuring focus of attention (Gardner, Dunham,
Cummings, & Pierce, 1989), and 10-item and 5-item questionnaires allegedly measuring
the complete Big Five construct (Gosling, Rentfrow, & Swann, 2003). Some authors even
argue in favor of the use of single-item scales (e.g., Gardner, Cummings, Dunham, &
Pierce, 1998; Mosel, 1953; Wanous & Hudy, 2001).
Several psychometric studies investigated properties of short tests (Burisch, 1997;
Gardner et al., 1998; Levy, 1968; G. T. Smith, McCarthy, & Anderson, 2000; Stanton et al.,

Test length and decision quality in personnel selection
51
2002) but did not take decision quality into consideration. Research in educational testing
and clinical assessment addressed decision quality in the context of classification (e.g.,
pass-fail decisions, assigning treatments), which is formally similar to cut-score selection
(Berk, 1986; Emons et al., 2007; Ercikan & Julian, 2002). Common in personnel selection,
however, is top-down selection (e.g., Born & Scholarios, 2005; Murphy, 1994), including
selection using score profiles (Guion, 1976, p. 809). Moreover, studies on decision quality
focus on making decisions using a single test (e.g., Emons et al., 2007). In practice, a test
battery is often used to select applicants, where each test included in the battery measures a
different trait or ability (Campbell, 1979, p. 185; Van Iddekinge & Ployhart, 2008). In this
study, we related test length to cut-score selection and top-down selection, in both cases
using either a single test or a test battery.
Another feature of this study was that for each selection scenario we investigated
decision quality in groups and for individuals. In groups (Study 1), we drew a sample of
simulated data based on a particular test and a particular true-score distribution, used a cut
score to determine the part of the distribution eligible for rejection and the part eligible for
selection, and then generated observable test scores, denoted 𝑋 , that were used to actually
reject or select people. Based on a large number of repeated samples, we estimated the
specificity and the sensitivity of the procedures, and the negative and positive prediction
values. For individuals (Study 2), we investigated the question that is pervasive in statistics:
What would happen if we could do it all over again? For measurement, this question means
repeating the same test procedure for the same applicants consistent with Lord and
Novick’s (1968, p. 35) propensity distribution—the hypothetical distribution of test scores
obtained in a large number of test repetitions, of which the mean is the individual’s true
score 𝑇 and the variance is random measurement error variance. For example, given that
applicant 𝐵’s true score 𝑇 is located to the right of a particular cut score 𝑋 (i.e., 𝑇 > 𝑋 ;

Chapter 3
52
Figure 3.1: Decision quality at the group level and at the individual level.
Figure 3.1), we estimated the area under 𝐵’s propensity distribution that corresponds with
this event. This gave us the probability of a correct decision for applicant 𝐵, which is to
select him. Applicant 𝐴’s true score is located far to the left of the cut score, and repeated
testing yields the result that this person is always correctly rejected.
One might argue that the group results are more realistic as they are based on one
test administration consistent with real testing, whereas the individual results are based on
an unobservable propensity distribution. However, given that one always should want to
know what would happen to someone’s test score if he could be retested, the simulation
design allows us to generate a propensity distribution for each individual and estimate the
probability that the individual is classified correctly across a large number of repetitions of
the administration procedure. This leads to results concerning test length that may be
helpful in real testing where applicants are assessed only once.
TX CT A T B
Probability of a correct decision (p)
Probability of a correct decision (p)

Test length and decision quality in personnel selection
53
This article is organized as follows. First, we discuss the method of the simulation
study and, second, the results. Third, we discuss the findings and provide recommendations
on minimum requirements for test length in the context of personnel selection.
3.3 Method
The main objectives of the simulation studies were to examine the impact of test-
length reduction on decision quality and to derive minimum test-length requirements in
personnel selection. The advantage of a simulation study is that the applicants’ 𝑇 values
are known and, consequently, that it is known which applicants are correctly rejected or
selected on the basis of their test score 𝑋 . We studied five well known personnel-selection
scenarios. In Study 1, for each of these scenarios we determined the specificity and the
sensitivity, and the negative and positive prediction values of the procedure for the whole
group, and in Study 2, we determined the repeatability of the decision based on the
propensity distributions of individual applicants. The Method section first discusses design
issues that are the same for Study 1 and Study 2, and then the design issues that are
different for both studies.
For each scenario, we considered five test lengths (𝐽 denotes the number of items in
a test): 𝐽 = 40, 20, 15, 10, and 5. Each shorter test contained a subset of items from the
previous, longer test, so that shorter tests were nested in longer tests. Different selection
scenarios necessitated somewhat different strategies for removal of items to obtain a
shorter test version. We also considered tests consisting of dichotomous items and tests
consisting of rating-scale items, and different base rates and selection ratios. Next, we
discuss the four design factors used in Study 1 and Study 2, which are the five personnel-
selection scenarios, followed by test length, item scores, and base rate / selection ratio.
After that, we discuss the dependent variables and the data generation procedure.

Chapter 3
54
3.3.1 Personnel-Selection Scenarios
Scenario 1: Top-down selection using a single test. Applicants were ranked on their
single-test 𝑋 scores, and a fixed percentage having the highest 𝑋 scores was selected
(Guion, 1976, p. 806). As tests used for top-down selection should be able to deal with
different selection percentages, they should measure precisely at different locations on the
scale. To realize this goal for different test lengths, items were removed such that the
difficulties of the remaining items were equidistant along the scale but at greater mutual
distance. It may be noted that for this type of selection, the cut score depends on the test-
score distribution, and when different data sets are generated based on different samples of
true scores, cut scores may vary across these samples.
Scenario 2: Selecting applicants using a cut-score on a single test. Applicants were
selected whose 𝑋 score was at least equal to an a priori chosen cut score. Thus, across
different samples the same cut score is used. An a priori fixed cut score represents an
absolute level of an ability or a trait deemed necessary for, for example, the successful
performance in a job. To maximize decision quality, we kept items in the reduced test
versions that had their difficulty closest to the cut score.
Scenario 3: Top-down selection using a compensatory score system. A test battery
consisted of five equal-length subtests. To mimic the practical requirement that each
subtest should contribute a unique ability or trait to the other subtests, subtest scores
correlated rather low; that is, less than .2. Selection and rejection were based on the
compensatory total score 𝑌 , which was the sum of the five subtest scores. A fixed
percentage of applicants having the highest 𝑌 score was selected (Guion, 1976, p. 806). As
with Scenario 1, the cut score based on 𝑌 varied across different samples. The difference
with Scenario 1 was the use of a compensatory total score based on five lowly correlating
subtest scores rather than one subtest score.

Test length and decision quality in personnel selection
55
Test length reduction referred to subtests: For 𝐽 = 40, 20, 15, 10, and 5, total score
Y was based on 200, 100, 75, 50, and 25 items, respectively. Items were removed from
subtests to produce shorter subtests, and for each subtest length items had equidistant
difficulties. It is important to notice that due to the small correlation between subtests,
items from different subtests have low inter-item correlations, as they should when they
measure different attributes. Hence, rejection or selection based on 𝑌 was expected to
produce more classification errors than when a test based on items all measuring the same
attribute had been used.
Scenario 4: Selecting applicants using a disjunctive score system. A disjunctive
score system, also known as a multiple cut-score model, is used when a job requires an
applicant to simultaneously pass a set of minimum requirements (Campbell, 1979, p. 185).
Again we used test batteries consisting of five subtests. Applicants who obtained subtest
scores at least equal to the a priori defined cut scores on each of the five subtests were
selected; failing to pass at least one cut score led to rejection. Similar to Scenario 2, all
tests included in the battery had item difficulties near the cut score.
Scenario 5: Top-down selection using score profiles. This was the third scenario in
which a battery of five subtests was used. Test-length reduction again referred to the
shortening of the subtests from 40 to 5 items within each subtest. The difference with the
preceding four scenarios was that there were no cut scores. Instead, using score profiles
particular combinations of subtest scores are considered typical of, for example, a specific
personality type (Costa & McCrae, 1992) or ability for leadership (Dilchert, 2007). Thus,
subtest scores on the five subtests were interpreted simultaneously (M. Smith & Smith,
2005, p. 313). Applicants were ranked on a much-used similarity measure that compared
their profiles to the profile of the ideal employee, and a fixed percentage of whom the
profile matched the ideal profile best was selected (Caldwell & O'Reilly III, 1990; Dalen,

Chapter 3
56
Stanton, & Roberts, 2001). Tests used to construct profiles have to distinguish applicants at
different ranges of the scale; hence, item difficulties were equidistant.
3.3.2 Test Length
In Scenario 1 and Scenario 2, each involving one test for rejection/selection
decisions, test lengths were 𝐽 = 40, 20, 15, 10, and 5. In the scenarios 3-5, each involving
five subtests, subtest length was 𝐽 = 40, 20, 15, 10, and 5. Choices were based on a
preliminary literature review (Arthur & Day, 1994; Crowder & Michael, 1991; Gosling et
al., 2003). Obviously, shorter tests produce more classification errors, but the question is to
which extent. This is the question we considered here.
3.3.3 Item Scores
The 2-parameter logistic item response theory model was used to generate
dichotomous (0,1) item scores and the graded response model was used to generate
polytomous items with five ordered scores (details are provided below). For cut-score
selection using a single test (i.e., Scenario 1), Emons et al. (2007) found that dichotomous-
item tests and polytomous-item tests had similar effects on the relationship between test
length and decision quality. The question was whether this result generalizes to the other
scenarios that we considered here.
3.3.4 Base Rate and Selection Ratio
The base rate is the proportion of candidates in the whole group that are suited for
the job, and the selection ratio is the proportion of selected candidates. For cut-score
selection (i.e., scenarios 2 and 4), we fixed the base rate at 50%, 25%, and 10%. For base
rate of 50%, we chose a cut score at the 50th percentile of the true-score distribution. If one
could identify applicants on the basis of their true scores, it would be possible to select

Test length and decision quality in personnel selection
57
only suited applicants. However, in real testing one has to rely on the error-laden test
scores and, as a result, several unsuited applicants (i.e., having their true scores below the
cut score) are selected and several suited applicants (i.e., having true scores above the cut
score) rejected.
As tests grow shorter, the influence of random measurement error increases, so that
more unsuited applicants are selected and more suited applicants rejected; thus, decision
quality deteriorates. For selecting suited applicants, we expected larger effects of test
shortening for lower base rates than for higher base rates because at low base rates the cut
score is in the tail of the true score distribution (see Figure 3.1) and many suited applicants
have a true score close to 𝑋 . For rejecting unsuited applicants we expected larger effects
of test shortening for higher base rates than for lower base rates because for lower base
rates few applicants have a true score close to 𝑋 .
For top-down selection (scenarios 1, 3, and 5), we fixed the selection ratio at 50%,
25%, and 10%. For selection ratio of 50% we considered the highest 50% of the true scores
to represent suited applicants. Again, shorter tests cause more classification errors and we
expected the same effects as for the base rate.
3.3.5 Dependent Variables: Study 1, Group Level
Specificity and sensitivity. In Study 1, samples of equal size were drawn from the
applicant distribution (discussed under data generation), and in each sample the proportion
of correctly classified unsuited candidates and the proportion of correctly classified suited
candidates were determined. The mean of the first proportion across samples yielded the
specificity and the mean of the second proportion yielded the sensitivity (Glaros & Kline,
1988) of a particular selection scenario and particular choices for test length, number of

Chapter 3
58
item scores (dichotomous versus polytomous scoring), and choices for base rate and
selection ratio.
Predictive values. Other quality indices for personnel selection are the negative
predictive value (NPV) and the positive predictive value (PPV) (Cascio, 1980; Glaros &
Kline, 1988; Schmidt & Hunter, 1998; Schmidt, Hunter, McKenzie, & Muldrow, 1979).
NPV is the proportion of unsuited applicants in the pool of rejected applicants. PPV is also
known as the success ratio, and equals the proportion of suited applicants in the pool of
selected applicants. Both proportions were computed for each sample and averaged across
all samples. Taylor-Russell (1939) tables were inappropriate to determine NPVs and PPVs
as the predictions based on these tables assume test scores and true scores are bivariate
normally distributed. This assumption is violated for short tests of, say, 5 to 10 items, and
tests consisting of highly discriminating, dichotomous items (e.g., Lord & Novick, 1968,
pp. 388-391). We obtained exact values of NPVs and PPVs without assuming bivariate
normality, thus avoiding biased estimates. Because in top-down selection (scenarios 1, 3,
and 5) the proportion of suited candidates is equal to the selection ratio, specificity equals
NPV and sensitivity equals PPV (Meehl & Rosen, 1955).
3.3.6 Dependent Variables: Study 2, Individual Level, Classification Consistency
For individuals, we addressed the classical statistical question whether a particular
sample result is repeatable in a new sample. For measurement, repeatability refers to re-
administering the same test to the same individuals a great number of times, and then
determining to which degree the same conclusion about an individual was drawn. Figure
3.1 shows two propensity distributions (the small distributions) and the corresponding
proportions 𝑝 of correct classification—rejection for person 𝐴 and selection for person 𝐵.
Obviously, proportion 𝑝 is larger as someone’s true score is located further away from the
cut score, and the question is whether short tests produce too many small 𝑝 values; that is,

Test length and decision quality in personnel selection
59
too many applicants on either side of the cut score that would be misclassified too often
based on repeated observation of their test performance.
Emons et al. (2007) suggested that organizations set a lower bound to 𝑝, so that
they make explicit what they think is the minimally acceptable certainty one requires for
decisions about an individual. For example, an organization could require 𝑝 to be at least .9,
meaning that upon repetition an individual may be not be misclassified more often than in
10% of the test repetitions. Thus, for the propensity distribution on the right in Figure 3.1
the unshaded area must cover no more than 10% of the total area. The quality of a
particular personnel-selection scenario and a particular test or test battery may be measured
by the proportion of unsuited individuals (for whom 𝑇 < 𝑋 ) that have 𝑝 values of .9 or
higher; this is called classification consistency, and denoted 𝐶𝐶 − (the minus sign refers to
the rejection area). Likewise, the classification consistency 𝐶𝐶 + for the selection area
could be determined. Large 𝐶𝐶 values suggest that the personnel-selection scenario and the
test or test battery used produce certainty about individual decisions for many applicants.
The question is whether 𝐶𝐶 − and 𝐶𝐶 + are large enough when short tests are used. We
studied 𝐶𝐶 − and 𝐶𝐶 + for lower bound values 𝑝 = .7 and 𝑝 = .9.
Hambleton and Slater (1997) and Ercikan and Julian (2002) discussed similar
approaches to rejection/selection problems but used different outcome measures; see
Emons et al. (2007) for a critical discussion of their approaches. The latter authors
concluded that the classification consistency measures 𝐶𝐶 − and 𝐶𝐶 + are more
comprehensive than alternative measures because they consider the whole propensity
distribution.

Chapter 3
60
3.3.7 Data Generation and Computational Details
The 2-parameter logistic model (Embretson & Reise, 2000, pp. 51-53) was used to
simulate dichotomous item scores and the graded response model (Embretson & Reise,
2000, pp. 97-102; Samejima, 1969) to simulate rating-scale item scores under controlled
and realistic conditions. For this purpose, for each single-test scenario we drew 1,000
latent-variable (denoted 𝜃 ) values from a standard normal distribution. Test batteries
consisted of five tests. Each test measured a different 𝜃. For each applicant we drew 5 𝜃
values from a standard-normal multivariate distribution. To obtain test scores that
correlated less than .2, 𝜃s correlated .2.
For dichotomous 40-item tests, item difficulties were equidistant between [–1.5; 1.5] (Figure 3.2), and for rating-scale 40-item tests, mean item-difficulties were equidistant
between [–1.5; 1.5]. Rating-scale items had step difficulties located at –1.75, .75, .75 and
1.75 units distance relative to the mean item difficulty. Item discrimination parameters
were drawn randomly from a uniform distribution [0.5; 2] typical of applied research (e.g.,
Candell & Drasgow, 1988; Cohen, Kim, & Baker, 1993; Embretson & Reise, 2000, pp.
69, 101; Fraley, Waller, & Brennan, 2000; Harwell & Janosky, 1991) and recommended
by the reviewers. Combined with a standard normal 𝜃 , these discrimination values
produced corrected mean item-total correlations equal to .41 and coefficient alpha equal
to .90 for 40 items, approximately .70 for 10 items and ranging from .50 to .55 for 5
items, depending on the selection scenario. As alphas below .70 are deemed too low for
practical use (Charter, 2003), we did additional simulations with less realistic—that is, too
high—item-discrimination parameters and found that for a 5-item test these parameters
must be at least 1.6 to 2.9 to obtain alpha values of at least .70. Thus, realistic item
discrimination yielded low alphas and unrealistically high item discrimination produced
alphas acceptable in test practice. We decided to use realistic discrimination values, as the

Test length and decision quality in personnel selection
61
Figure 3.2: Latent variable distribution (𝜃) and location of item difficulties (𝛿 ) for a test
consisting of 40 dichotomous items.
reviewers recommended, but also studied parameter choices producing acceptable alphas.
For test batteries (scenarios 3, 4 and 5), we assumed that the five tests were replicates of
one another. For each of the 150 design cells, 1,000 data sets were simulated, each time
using a fresh sample of 1,000 𝜃s. The complete design was replicated 20 times, each time
using a different set of randomly drawn item discrimination parameters.
We transformed latent variable 𝜃 to true score 𝑇. True scores were used for error-
free selection representing the ideal outcome, and test score 𝑋 to reject and select
applicants thus representing realistic selection involving measurement error. Cut scores
-3 -2 -1 0 1 2 3
0.0
0.1
0.2
0.3
0.4
Latent variable (θ)
Den
sity
δ1= -1.5 δ40= 1.5

Chapter 3
62
were determined as follows. For single-test Scenario 2, we first determined a continuous
true-score cut off value denoted 𝑇 equal to the percentile rank that corresponded to the
base rate. In practice, integer-valued test score 𝑋 is used rather than continuous 𝑇 ; hence, 𝑇 was rounded to the integer value 𝑋 that best left the base rate intact. For cut-score
selection using multiple tests and a disjunctive scoring rule (Scenario 4), we used the
multivariate distribution of 𝜃 to derive the multivariate 𝑇 distribution. The cut scores were
five equal 𝑇 values, chosen such that the probability that a randomly selected applicant had 𝑇 values in excess of the corresponding cut score equaled the base rate.
For top-down selection using score profiles (Scenario 5), the ideal score profile
equaled the five mean 𝜃 scores that were transformed to true scores and test scores in order
to have ideal scores for 𝑇 and 𝑋 . Similarity index 𝐷 was used for selection (Cronbach &
Gleser, 1953; Edwards, 1993). Index 𝐷 is the sum of the squared differences between an
applicant’s test scores and the ideal test scores. Applicants with the smallest 𝐷 values
were selected until the required proportion of applicants was obtained.
For each applicant, given their 𝜃 value error-laden test scores have a distribution
denoted 𝑃(𝑋 |𝜃); this conditional distribution is needed to determine the person-specific
correct-classification probability 𝑝 . The conditional test-score distributions follow a
compound binomial (dichotomous items) or compound multinomial (rating-scale items)
distribution that can be generated using a recursion algorithm (Lord & Wingersky, 1984;
Thissen, Pommerich, Billeaud, & Williams, 1995). The algorithm could not be used to
compute correct-classification probability for the continuously distributed 𝐷 (Scenario 5).
Here, we simulated 1,000 test scores for each applicant keeping 𝜃 fixed. The correct
classification probability was the proportion of correct classifications given the applicant’s 𝜃 value. 𝐶𝐶 + is the proportion of respondents for whom 𝑇 > 𝑇 and 𝑝 ≥ .9 . Other
classification indices were computed likewise.

Test length and decision quality in personnel selection
63
3.4 Results
Results were stable across replications; therefore, we report mean outcome values
but no standard deviations. As results of test shortening for rating-scale item tests were
similar to those for dichotomous-item tests, only the latter are discussed. Table 3.1 through
3.5 show both the group-level and individual-level results. Across the five scenarios,
shorter tests caused lower decision quality when suited candidates had to be selected from
groups having low base rates or selection rates. The effect was weaker for rejecting
unsuited candidates. Below we discuss the group-level (Study 1) and individual-level
(Study 2) results in depth.
3.4.1 Results for Study 1: Group-Level Results
Scenarios 1 and 2. As test length decreased, both specificity and NPV decreased,
but the decrease was smaller as base rate and selection ratio were smaller. The largest
decline in specificity and NPV was .14 (Scenario 1, base rate 50%). For 𝐽 = 5, the
minimum value for both specificity and NPV was .76. Sensitivity and PPV also decreased
as tests grew shorter but at a faster pace, in particular when the base rate or the selection
ratio was smaller. For example, the largest decrease in PPV was found in Scenario 1 and a
selection ratio of 10%. Here the PPV was .76 for the 40-item test and reduced to .46 for the
5-item test. This means that a test-length reduction of 40 to 5 items produced a
considerable reduction of suited candidates in the selected group.
Scenarios 3 and 4. For these scenarios the general trends of test shortening were
comparable to those for single-test scenarios. Test-length reduction led to small decrease in
decision quality for rejecting unsuited applicants. The lowest value for specificity was .79
(Scenario 3, base rate 50%) and for NPV the lowest value was .70 (Scenario 4, base rate
50%). Test shortening had larger effects on group-level decision quality for selecting suited

Chapter 3
64
Table 3.1: Decision quality for Scenario 1, for dichotomous items, five test lengths and
three selection ratios.
Study 1: Group Level Study 2: Individual Level Specificity / Sensitivity / 𝐶𝐶 − 𝐶𝐶 +𝐽 Alpha NPV PPV .7 .9 .7 .9
Selection ratio 50%
40 .90 .90 .90 .86 .69 .87 .68 20 .82 .87 .87 .83 .58 .83 .59 15 .77 .85 .85 .79 .52 .78 .53 10 .68 .81 .81 .75 .40 .74 .42 5 .51 .76 .76 .64 .26 .64 .25
Selection ratio 25%
40 .90 .95 .84 .94 .82 .75 .52 20 .81 .93 .78 .92 .75 .66 .35 15 .77 .91 .74 .91 .70 .58 .26 10 .68 .90 .71 .91 .66 .52 .20 5 .51 .87 .62 .89 .55 .34 .07
Selection ratio 10%
40 .90 .97 .76 .98 .91 .60 .34 20 .81 .96 .65 .97 .89 .38 .16 15 .77 .96 .61 .97 .84 .30 .10 10 .68 .95 .57 .97 .83 .30 .06 5 .50 .94 .46 .97 .79 .15 .02
Note. 𝐽 = Number of items; Alpha = Coefficient alpha; NPV = Negative predictive value; PPV = Positive predictive value; 𝐶𝐶 = Classification consistency for unsuited applicants (𝐶𝐶 −) and suited applicants (𝐶𝐶 +) for lower bound 𝑝 = .7 and 𝑝 = .9, respectively.
candidates. Both in scenarios 3 and 4, the sensitivity reduced with .28 when the base rate
or the selection ratio was 10%. This means that compared to 40-item tests, 5-item tests
additionally rejected 28% of all suited applicants. The PPV decreased by .28 (Scenario 3)
and .20 (Scenario 4), meaning that the proportion of suited candidates in the selected group
is considerable smaller if 5-item tests were used.
Scenario 5. Group-level results were comparable to the other scenarios. As tests
grew shorter, the largest decrease of specificity and NPV was found for a selection ratio of

Test length and decision quality in personnel selection
65
Table 3.2: Decision quality for Scenario 2, for dichotomous items, five test lengths and
three base rates.
Actual Study 1: Group Level Study 2: Individual Level Base Selection 𝐶𝐶 − 𝐶𝐶 +𝐽 Alpha rate ratio Specificity NPV Sensitivity PPV .7 .9 .7 .9
Base rate 50%
40 .90 .52 .52 .90 .90 .91 .91 .87 .69 .88 .71 20 .84 .55 .55 .88 .87 .89 .90 .83 .60 .85 .65 15 .80 .52 .52 .87 .86 .87 .88 .82 .57 .83 .59 10 .72 .60 .58 .83 .80 .86 .88 .75 .43 .81 .56 5 .57 .51 .51 .80 .79 .81 .81 .71 .35 .72 .37
Base rate 25%
40 .90 .27 .28 .94 .95 .87 .84 .92 .80 .81 .57 20 .83 .29 .30 .92 .94 .85 .81 .90 .74 .78 .51 15 .79 .27 .29 .91 .93 .83 .78 .89 .71 .75 .45 10 .71 .32 .34 .88 .91 .81 .77 .85 .61 .72 .40 5 .56 .29 .33 .85 .89 .76 .67 .80 .48 .61 .24
Base rate 10%
40 .90 .11 .12 .96 .98 .82 .74 .96 .88 .74 .43 20 .83 .12 .13 .96 .97 .81 .71 .95 .86 .71 .39 15 .78 .12 .14 .95 .97 .80 .68 .94 .84 .68 .35 10 .70 .15 .18 .93 .96 .78 .66 .92 .76 .65 .31 5 .55 .12 .16 .91 .96 .73 .53 .91 .72 .53 .18
Note. 𝐽 = Number of items; Alpha = Coefficient alpha; NPV = Negative predictive value; PPV = Positive predictive value; 𝐶𝐶 = Classification consistency for unsuited applicants (𝐶𝐶 −) and suited applicants (𝐶𝐶 +) for lower bound 𝑝 = .7 and 𝑝 = .9, respectively.
50%; Both specificity and NPV decreased from .88 for 𝐽 = 40 to .71 for 𝐽 = 5. The largest
decrease of sensitivity and PPV was found for a selection ratio of 10%. Here sensitivity
and PPV dropped from .68 (𝐽 = 40) to .34 (𝐽 = 5).
3.4.2 Results for Study 2: Individual-Level Results
Scenarios 1 and 2. Test shortening had a larger negative impact on decision quality
at the individual level than at the group level (Study 1), in particular for selecting suited
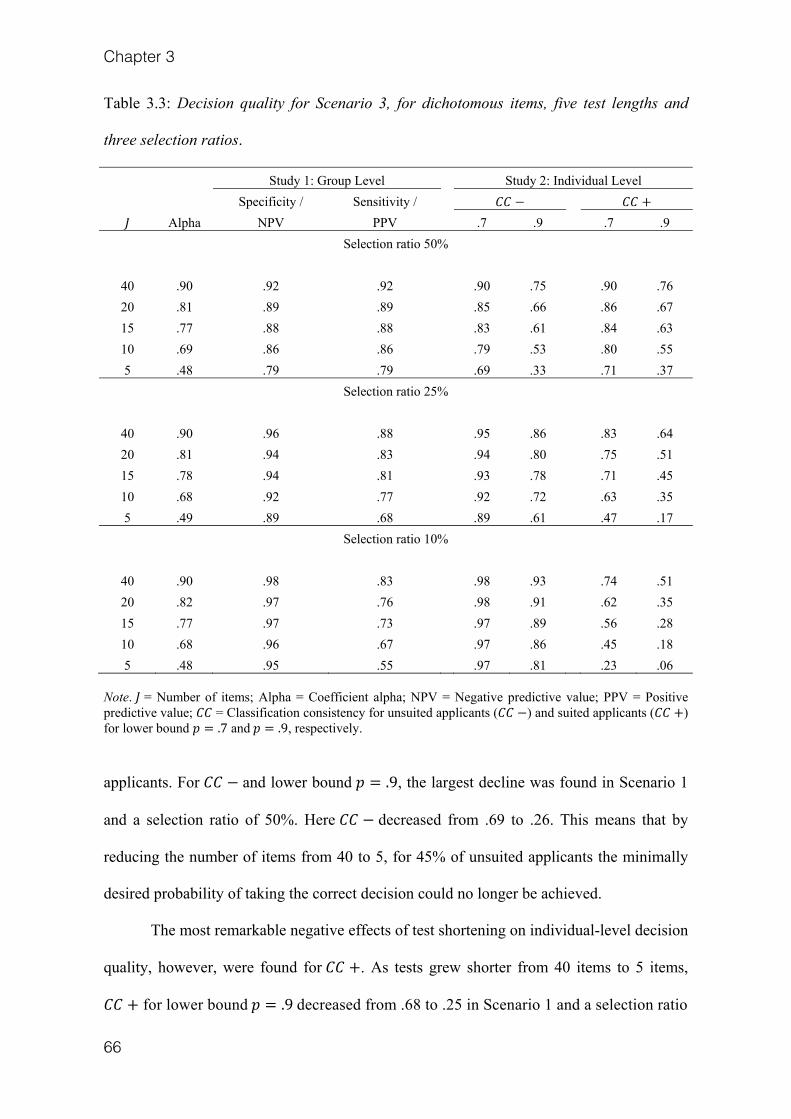
Chapter 3
66
Table 3.3: Decision quality for Scenario 3, for dichotomous items, five test lengths and
three selection ratios.
Study 1: Group Level Study 2: Individual Level Specificity / Sensitivity / 𝐶𝐶 − 𝐶𝐶 + 𝐽 Alpha NPV PPV .7 .9 .7 .9
Selection ratio 50%
40 .90 .92 .92 .90 .75 .90 .76 20 .81 .89 .89 .85 .66 .86 .67 15 .77 .88 .88 .83 .61 .84 .63 10 .69 .86 .86 .79 .53 .80 .55 5 .48 .79 .79 .69 .33 .71 .37
Selection ratio 25%
40 .90 .96 .88 .95 .86 .83 .64 20 .81 .94 .83 .94 .80 .75 .51 15 .78 .94 .81 .93 .78 .71 .45 10 .68 .92 .77 .92 .72 .63 .35 5 .49 .89 .68 .89 .61 .47 .17
Selection ratio 10%
40 .90 .98 .83 .98 .93 .74 .51 20 .82 .97 .76 .98 .91 .62 .35 15 .77 .97 .73 .97 .89 .56 .28 10 .68 .96 .67 .97 .86 .45 .18 5 .48 .95 .55 .97 .81 .23 .06
Note. 𝐽 = Number of items; Alpha = Coefficient alpha; NPV = Negative predictive value; PPV = Positive predictive value; 𝐶𝐶 = Classification consistency for unsuited applicants (𝐶𝐶 −) and suited applicants (𝐶𝐶 +) for lower bound 𝑝 = .7 and 𝑝 = .9, respectively.
applicants. For 𝐶𝐶 − and lower bound 𝑝 = .9, the largest decline was found in Scenario 1
and a selection ratio of 50%. Here 𝐶𝐶 − decreased from .69 to .26. This means that by
reducing the number of items from 40 to 5, for 45% of unsuited applicants the minimally
desired probability of taking the correct decision could no longer be achieved.
The most remarkable negative effects of test shortening on individual-level decision
quality, however, were found for 𝐶𝐶 +. As tests grew shorter from 40 items to 5 items, 𝐶𝐶 + for lower bound 𝑝 = .9 decreased from .68 to .25 in Scenario 1 and a selection ratio

Test length and decision quality in personnel selection
67
Table 3.4: Decision quality for Scenario 4, for dichotomous items, five test lengths and
three base rates.
Actual Study 1: Group Level Study 2: Individual Level Base Selection 𝐶𝐶 − 𝐶𝐶 +𝐽 Alpha rate ratio Specificity NPV Sensitivity PPV .7 .9 .7 .9
Base rate 50%
40 .91 .50 .47 .91 .85 .84 .90 .90 .68 .76 .54 20 .83 .50 .45 .90 .83 .81 .89 .89 .64 .71 .47 15 .78 .48 .43 .90 .81 .78 .88 .89 .63 .67 .39 10 .71 .56 .49 .87 .74 .76 .89 .87 .54 .64 .35 5 .56 .51 .38 .88 .70 .64 .85 .91 .55 .42 .14
Base rate 25%
40 .89 .25 .23 .95 .93 .78 .83 .95 .82 .66 .40 20 .83 .25 .23 .94 .91 .73 .81 .95 .80 .59 .30 15 .79 .26 .23 .94 .90 .70 .79 .95 .77 .53 .25 10 .72 .21 .18 .94 .90 .62 .74 .96 .79 .38 .14 5 .54 .27 .20 .93 .84 .53 .73 .97 .73 .23 .06
Base rate 10%
40 .90 .10 .09 .97 .97 .72 .77 .98 .91 .53 .31 20 .84 .10 .09 .97 .96 .66 .72 .98 .91 .43 .19 15 .80 .10 .09 .97 .96 .61 .69 .98 .89 .35 .12 10 .72 .10 .09 .97 .96 .51 .60 .99 .90 .21 .05 5 .56 .08 .06 .96 .94 .44 .57 .99 .87 .10 .01
Note. 𝐽 = Number of items; Alpha = Coefficient alpha; NPV = Negative predictive value; PPV = Positive predictive value; 𝐶𝐶 = Classification consistency for unsuited applicants (𝐶𝐶 −) and suited applicants (𝐶𝐶 +) for lower bound 𝑝 = .7 and 𝑝 = .9, respectively.
equal to 50%. The decline in 𝐶𝐶 + was even greater for lower selection ratios. At a 10%
selection ratio, 𝐶𝐶 + at 𝑝 = .9 was only .34 for 𝐽 = 40, but for 𝐽 ≤ 15, 𝐶𝐶 + dropped even
below .10. Thus, for 𝐽 ≤ 15 at most 10% of the suited applicants had a probability of .9 or
higher to be selected. Even if one accepts 𝑝 = .7 as the lower bound, a satisfactory 𝐶𝐶 +
value was not obtained when tests with less than 15 items were used.
Scenarios 3 and 4. Test shortening had the largest effect on 𝐶𝐶 − in Scenario 3
for lower bound 𝑝 = .9 and a selection ratio of 50%. Starting with the 40-item test, 𝐶𝐶 −

Chapter 3
68
Table 3.5: Decision quality for Scenario 5, for dichotomous items, five test lengths and
three selection ratios.
Study 1: Group Level Study 2: Individual Level Specificity / Sensitivity / 𝐶𝐶 − 𝐶𝐶 + 𝐽 Alpha NPV PPV .7 .9 .7 .9
Selection ratio 50%
40 .90 .88 .88 .84 .64 .84 .64 20 .81 .84 .84 .78 .51 .78 .51 15 .77 .81 .81 .74 .43 .74 .42 10 .68 .78 .78 .68 .33 .68 .32 5 .49 .71 .71 .53 .14 .53 .10
Selection ratio 25%
40 .90 .93 .79 .92 .79 .68 .44 20 .82 .91 .73 .90 .71 .58 .28 15 .78 .90 .70 .90 .66 .51 .20 10 .68 .88 .64 .87 .58 .39 .10 5 .49 .84 .53 .84 .40 .12 .00
Selection ratio 10%
40 .90 .96 .68 .98 .89 .49 .22 20 .81 .95 .58 .97 .84 .31 .08 15 .77 .95 .55 .97 .82 .25 .03 10 .68 .94 .47 .96 .78 .10 .01 5 .49 .93 .34 .96 .70 .00 .00
Note. 𝐽 = Number of items; Alpha = Coefficient alpha; NPV = Negative predictive value; PPV = Positive predictive value; 𝐶𝐶 = Classification consistency for unsuited applicants (𝐶𝐶 −) and suited applicants (𝐶𝐶 +) for lower bound 𝑝 = .7 and 𝑝 = .9, respectively.
reduced by .42 to become .33 for the 5-item test. For 𝐶𝐶 + for lower bound 𝑝 = .9 the
largest effect of test shortening was also found in Scenario 3 but at a base rate of 10%; 𝐶𝐶 + decreased from .51 (𝐽 = 40) to .06 (𝐽 = 5). For the disjunctive scoring system
(Scenario 4), due to small variations in the actual base rate 𝐶𝐶s were sometimes slightly
higher for the 5-item or 10-item test than for the 15-item test.
Compared to Scenario 1, Scenario 3 had comparable decision quality at all test-
length levels, both at the group and the individual level. This ineffectiveness of test

Test length and decision quality in personnel selection
69
batteries contradicts common knowledge (Guion, 1976, p. 806) but can be explained from
the equal weighing of lowly correlating test scores. A multiple regression model could
improve results but was beyond the scope of this study. Comparison of Scenario 2 with
Scenario 4 showed that under Scenario 4 test shortening had a larger effect on individual-
level decision quality for selecting suited candidates and a smaller effect for rejecting
unsuited candidates.
Scenario 5. The decrease of individual-level decision quality as tests grew shorter
was not only considerable for 𝐶𝐶 + but, in contrast to the other selection scenarios, also for 𝐶𝐶 − for lower bound 𝑝 = .9. Individual decision quality dropped drastically at selection
ratios of 50%; both 𝐶𝐶 + and 𝐶𝐶 − for lower bound 𝑝 = .9 were less than .43 for tests for
which 𝐽 ≤ 15. Thus, both rejecting unsuited applicants and selecting suited applicants
based on ideal score profiles is highly problematic when short tests are used.
3.4.3 Results for 5-Item Tests and Minimum Reliability of .70.
To achieve a minimum reliability of .70 for tests consisting of five dichotomous
items, discrimination parameters had to be unrealistically high: 1.6 (Scenario 4, base rate
10%) and 2.9 (scenarios 1, 2, and 3). For both group-level and individual-level results,
trends were similar to the results for tests with lower but realistic discrimination
parameters. For tests consisting of at least ten items, results were similar to tests with
realistic discrimination; hence, Table 3.6 only shows the results for the 5-item tests. For
those conditions in which decision quality was already high at both the group level and
individual level for 5-item tests with reliability of .50—say values above .75—decision
quality did not improve much by using more-reliable tests. For conditions in which
decision quality was low decision quality improved considerably when a higher-reliability
test was used. Even though at the individual level decision quality increased, absolute levels

Chapter 3
70
Table 3.6: Decision quality for all scenarios, for dichotomous 5-item tests and three base
rates or selection ratios given that reliability is .70.
Study 1: Group Level Study 2: Individual Level 𝐶𝐶 − 𝐶𝐶 +
Suited 𝑎 Specificity NPV Sensitivity PPV .7 .9 .7 .9 Scenario 1
.50 2.9 .86 .86 .86 .86 .80 .54 .81 .52 .25 2.9 .92 .92 .77 .77 .92 .73 .64 .33 .10 2.9 .96 .96 .63 .63 .97 .85 .27 .11
Scenario 2
.50 1.7 .85 .85 .86 .86 .79 .50 .80 .53
.25 1.8 .91 .93 .81 .75 .88 .69 .72 .40
.10 2.0 .95 .97 .78 .65 .95 .85 .65 .32 Scenario 3
.50 2.9 .88 .88 .88 .88 .78 .59 .78 .59 .25 2.9 .94 .94 .81 .81 .89 .77 .63 .41 .10 2.9 .97 .97 .72 .72 .95 .88 .47 .26
Scenario 4
.50 1.8 .89 .87 .75 .77 .88 .58 .62 .32
.25 1.7 .93 .88 .64 .77 .95 .74 .43 .15
.10 1.6 .97 .95 .54 .65 .98 .88 .25 .06 Scenario 5
.50 2.9 .80 .80 .80 .80 .68 .38 .73 .32 .25 2.9 .88 .88 .64 .64 .87 .56 .33 .04 .10 2.9 .94 .94 .48 .48 .97 .77 .04 .00
Note. Suited = Selection ratio or Base rate, depending on the scenario envisaged; 𝑎 = Required discrimination parameter; NPV = Negative predictive value; PPV = Positive predictive value; 𝐶𝐶 = Classification consistency for unsuited applicants (𝐶𝐶 −) and suited applicants (𝐶𝐶 +) for lower bound 𝑝 = .7 and 𝑝 = .9, respectively.
may still be too low for practical applications when base rates or selection ratios are low.
For example, in Scenario 1 𝐶𝐶 + for lower bound 𝑝 = .9 was only .11 at a selection ratio
of 10%. Thus, even if short tests satisfy minimum- reliability requirements recommended
in standard textbooks, individuals may run a high risk to be incorrectly rejected or accepted.

Test length and decision quality in personnel selection
71
3.5 Discussion
Test shortening has a negative impact on decision quality in personnel selection.
The magnitude of the impact depends on the base rate and the selection ratio, and differs
for rejecting applicants and selecting applicants. A lower base rate produced a smaller
decrease in decision quality of rejecting applicants but a larger decrease in decision quality
of selecting applicants. Base rate is low when jobs are specialized and the number of suited
candidates is small, and then short tests involve large risks of selecting an unsuited
candidate and rejecting more appropriate candidates. In contrast, short tests often lead to
the rejection of unsuited candidates. These results were found in all selection scenarios and
for both dichotomous-item tests and rating-scale item tests.
Short tests are less problematic when the focus is on the group rather than the
individual applicant. However, short tests seriously compromise decision quality if a high
certainty of making correct decisions about every single individual is deemed important
(Emons et al., 2007). Reliable decisions for individuals are important because the two
types of decision errors—rejecting a suited candidate or accepting an unsuited candidate—
may have serious consequences for the applicants. Being unjustly denied for a job is unfair,
and being selected for a job for which one is not suited causes the applicant to “… go
through the nightmare of failure and dismissal” (M. Smith & Smith, 2005, p. 1). Adopting
the organization’s perspective, each suited applicant must have an equally fair chance to be
selected (American Educational Research Association, American Psychological
Association, & National Council on Measurement in Education, 1985; Arvey & Renz,
1992; Borsboom, Romeijn, & Wicherts, 2008). Thus, striving for high success ratios is not
the organization’s only concern, and securing fair selection should also be taken into
account.

Chapter 3
72
For Scenario 4 (disjunctive scoring system), test shortening caused a remarkably
large decrease of decision quality for selecting applicants. The large decrease was due to
applicants having to score above a cut score on five tests, and the probability of failing at
least one test increases rapidly as tests grow shorter. For example, assume that on each test
a suited applicant scores in excess of the cut score with probability .90. Then, if tests are
independent the probability of the correct decision equals . 90 ≈ .59 whereas single-test
selection would involve a probability of .90. In contrast, decision quality for rejecting
applicants was high. This is due to a low probability that an unsuited applicant accidently
obtains sufficiently high scores on all five tests. For example, if an unsuited applicant had
probability .30 of passing the cut score on each test, the risk of incorrect acceptance
equals .305 ≈ .002.
For Scenario 5 (profile-score selection using 𝐷 ), test shortening had a large
negative effect on selecting applicants. The effect was due to 𝐷 being based on squared
differences, which had the effect of assigning the same 𝐷 value to different patterns of
deviation scores. For example, deviation patterns (−1, 1, −1, −1, −1) and (1, 0, 0, 2, 0)
both produce 𝐷 = 5. As a result, the 𝐷 distribution was skewed to the right and many 𝐷
values were equal or almost equal, and selecting, say, the 10% lowest 𝐷 values likely
produced unreliable selection results. Thus, test shortening had a negative impact on
profile-score selection using 𝐷 .
The highly similar results for dichotomous items and rating-scale items (Emons et
al., 2007) can be explained from Figure 3.3, for simplicity assuming absence of
measurement errors. A 5-point rating-scale cuts the latent trait (𝜃) scale into five intervals
but as selection decisions only require the 𝜃 scale to be split into two regions, the lowest
representing the rejection region and the highest the selection region, a well-chosen
dichotomous item perfectly matching the required subdivision of the scale might be used

Test length and decision quality in personnel selection
73
instead. A rating-scale item dissects the two regions into more intervals but they provide
more information on between-individual differences, but not on the required dichotomy.
Real items are liable to measurement error but this does not affect the principle that rating-
scale items involve distinctions that are irrelevant to the selection problem.
Figure 3.3: Taking selection decisions with rating-scale items.
We used realistic item discrimination parameters producing reliability close to .50
for 5-item tests, and higher and somewhat unrealistic parameters that produced reliability
close to .70, a value recommended for individual decision-making. Interestingly, both
choices produced the same decreasing trends in decision-quality and, for short tests,
decision quality for selecting applicants remained low for higher reliability. In addition, we
tried different strategies for producing short tests than the strategy we used here (selecting
optimal item subsets from the longer test), but this did not lead to results much different
from the results presented here.
For all practical purposes, we advise test users to use long tests for personnel
selection that contain at least 20 items to have acceptable decision quality at the group
level, and at least 40 items if correct decisions on the individual level are required. An
exception is selection when the base rate is high and incorrect inclusion of unsuited
applicants is of less concern. This provides some justification for the use of short tests for
recruiting applicants via the Internet. The incidence of false negatives among the rejected
0 1 2 3 4
Reject Select
θc
θ
x j=
Item scores (X j)

Chapter 3
74
applicants is of major concern because an organization does not want to miss potentially
good candidates. Our study suggests that the combination of short tests and high base rates
is efficient to pre-select candidates for further testing.
We focused on stand-alone tests as they are more frequently used in practice than
computer adaptive testing (CAT), which optimally tailors the test to the specific individual.
Compared to stand-alone tests, CAT applications reduce the number of items for some
applicants. We expect that for applicants whose true score is close to the cutoff, CAT still
needs a large number of items to obtain high correct-classification probabilities. Moreover,
CAT applications introduce other intricacies such as the need for calibrated item pools and
the choice of stopping rules.
Incorrect selection decisions cannot be banned completely but reliable tests help to
reduce the problem. However, it must be emphasized that, in practice, test validity is the
most important test characteristic for personnel selection (American Educational Research
Association et al., 1985, p. 9; M. Smith & Smith, 2005, p. 133). Also when short tests are
used, trait or ability coverage may change, affecting both construct validity and predictive
validity. Removing the least reliable items from the test may result in a small decrease in
total-score reliability but a great loss of trait coverage (Reise & Waller, 2009). Thus, when
short tests are considered, validity must be considered in addition to reliability.

75
Chapter 4: Assessing individual change using short tests and questionnaires*
* This chapter has been submitted for publication.

Chapter 4
76
Abstract Tests and questionnaires play an important role in evaluating clinical
interventions. Based on the difference between clients’ post-treatment and pre-treatment
scores, clinicians and researchers decide about the degree to which clients benefited from a
treatment. These decisions influence choices about future treatment trajectories and health
policies. Because time is limited, short tests consisting of, say, at most 15 items are
preferred over longer tests to measure change in clients. However, a shorter test results in a
decrease of measurement precision. Using simulations, we found that the use of short tests
leads to a substantial higher risk of making incorrect decisions about change in individual
clients. Although short tests may be more efficient, we advise to use long tests to
investigate treatment outcomes.

Assessing individual change
77
4.1 Introduction
The call for evidence-based practices in areas such as clinical psychology and
medicine has resulted in an increased reliance on tests and questionnaires (e.g., Garland,
Kruse, & Aarons, 2003; Schmitt & Di Fabio, 2004). Clinicians and researchers use clients’
change scores to assess the degree to which clients benefited from a treatment. This
information influences choices about subsequent treatment trajectories, health policies, and
funding (e.g., Finkelman, Weiss, & Kim-Kang, 2010; Jacobson, Follette, & Revenstorf,
1984; Meier, 2008). Tests used to measure change in clients are incorporated in large-scale
research projects, including the Patient-Reported Outcomes Measurement Information
System (PROMIS; Cella et al., 2007) and the Cochrane Collaboration (Higgins & Green,
2011).
When testing clients, short administration time is desirable because clients often do
not feel well, tests are part of a large test battery, and clinicians work under time pressure.
Hence, to measure change short tests consisting of, say, at most 15 items are preferred over
longer tests (e.g., Guyatt, Water, & Norman, 1987; Meier, 2008, p. 177; Paterson, 1996).
Especially for those interventions where clinicians repeatedly measure multiple constructs,
such as in routine outcome measurement (Evans et al., 2002; Slade, Hornicroft, & Glover,
1999), short tests are appreciated.
Examples of short tests developed to decide about the degree to which clients
benefited from a treatment include the 14-item York Angina Beliefs Questionnaire (Furze,
Bull, Lewin, & Thompson, 2003), a brief 11-item version of the Mississippi Scale for
Combat-Related Posttraumatic Stress Disorder (Fontana & Rosenheck, 1994), a short 10-
item version of the Questionnaire of Smoking Urges (Cox, Tiffany, & Christen, 2001), and
a 10-item depression scale (Montgomery & Åsberg, 1979).

Chapter 4
78
Although short tests result in short administration sessions, it is well-known that
shorter tests are more vulnerable to measurement error than longer tests, even when total-
score reliability is considered to be sufficient according to well-accepted rules of thumb
(e.g., Allen & Yen, 1979, p. 87; Lord & Novick, 1968, p. 115). Shorter tests suffer from
decreased measurement precision (Sijtsma, 2009a). Since measurement error is present in
both pre-treatment scores and post-treatment scores, change scores tend to be less precise
than the constituent pretest scores and posttest scores (Allen & Yen, 1979, p. 209; Lord,
1956, p. 429). Consequently, compared to longer tests the use of short tests may
substantially increase the risk of making an incorrect decision about a client’s individual
change. Despite their efficiency, the question thus arises whether short tests are suited for
evaluating clinical interventions.
The present study examines the relationship between test length and individual
change assessment. We addressed the following two research questions. First, to which
degree does shortening a test increase the risk of making incorrect decisions about
individual change? Second, what are minimal test-length requirements for making reliable
decisions about individual treatment outcomes? For decisions based on single test
administrations, such as pass-fail decisions and ranking problems, research has shown that
decision quality is substantially lower for short tests than for long tests. Consequently,
authors argued against using short tests for individual decision-making (e.g., Emons,
Sijtsma, & Meijer, 2007; Ercikan & Julian, 2002). We expect that reducing test length also
results in a large increase in the risk of making incorrect decisions about clients who have
improved or deteriorated, and that it is better to use long tests to assess individual treatment
outcomes.
This study was organized as follows. We discuss how tests are used to make
decisions about individual change. Next, we discuss the details of our simulation study.

Assessing individual change
79
Then, we investigate how the removal of items affects the risk of making incorrect
decisions about individual change. Lastly, we provide recommendations to clinicians and
researchers who consider using tests and questionnaires to make decisions about treatment
outcomes.
4.2 Theory
4.2.1 Assessing Individual Change
To assess the degree to which a client changes in the course of a treatment, the
same test or questionnaire is administered before and after the client receives the treatment.
Tests often consist of rating-scale items. Let 𝑋 be the score on item 𝑗 and let 𝐽 be the
number of items in the test (𝑗 = 1, … , 𝐽). Each item is scored from 0 (e.g., totally disagree)
to m (e.g., totally agree), so that 𝑥 = 0, … , 𝑚. The pre-treatment total-score (𝑋 ) and the
post-treatment total-score (𝑋 ) both equal the sum of the 𝐽 item scores. For every client,
change score 𝐷 is the difference between 𝑋 and 𝑋 , so that 𝐷 = 𝑋 − 𝑋 .
The true change or the true difference score 𝑇 is the difference between the post-
treatment true score (𝑇 ) and the pre-treatment true score (𝑇 ), so that 𝑇 = 𝑇 − 𝑇 (Allen
& Yen, 1979, p. 209; Cronbach & Furby, 1970). If it were possible to administer both the
pre-test and the post-test an infinite number of times under identical circumstances to the
same clients, we could observe for every client an individual change-score distribution
with mean 𝑇 and a dispersion that reflects measurement-error variance. If we had access
to 𝑇 , we could make the correct decision about individual change with 100% certainty. In
practice, for each client we only have an error-laden difference score 𝐷 and it is this
difference score that is used for decision-making. Thus, the probability that an incorrect
decision is made is positive.

Chapter 4
80
4.2.2 Clinical Interpretation of Change Scores
The risk of making incorrect decisions about individual change may depend on how
one defines treatment outcomes. We investigated three criteria clinicians commonly use to
evaluate the degree of change in individual clients.
Criterion 1: Statistically significant change. Clinicians are advised against taking
decisions about treatment outcomes using plain difference scores without significance
testing (e.g., Jacobson et al., 1984). Assuming that a positive true-change score (i.e., 𝑇 > 𝑇 − 𝑇 ) reflects an improvement, clinicians should only decide that a client
benefited from a treatment if a positive change-score D is significantly larger than zero.
Likewise, one should only decide that a client deteriorated when a negative change score D
is significantly smaller than zero. When the change score does not differ significantly from
0, clinicians are advised to collect more information before they draw the final conclusion.
The standard error of measurement of change scores, denoted 𝑆𝐸𝑀 , plays an
important role in deciding if a change score reflects a true change instead of measurement
error (Jacobson et al., 1984; Jacobson & Truax, 1991). The 𝑆𝐸𝑀 is the standard
deviation of the individual’s hypothetical change score distribution obtained if the
individual were tested an infinite number of times under identical circumstances.
Assuming equal total-score variance (𝑆 = 𝑆 = 𝑆 ) and equal total-score reliability
(𝑟 = 𝑟 = 𝑟 ) in the group (Jacobson & Truax, 1991), 𝑆𝐸𝑀 is defined as
𝑆𝐸𝑀 = √2𝑆 (1 − 𝑟 ). (4.1)
To decide whether the difference score D reflects a true change instead of
measurement error, Jacobson et al. (1984) introduced the reliable change index (RC; see
also Jacobson & Truax, 1991; Maassen, 2004). The 𝑅𝐶 is given by
𝑅𝐶 = 𝐷𝑆𝐸𝑀 . (4.2)

Assessing individual change
81
Assuming a normally distributed 𝑅𝐶, using a two-tailed z-test and a 5% significance level
clinicians may conclude that a client improved if 𝑅𝐶 ≥ 1.96 or deteriorated if 𝑅𝐶 ≤ −1.96.
Criterion 2: Clinically important change. The minimal important difference (𝑀𝐼𝐷)
is the smallest true-score change that clients or experts perceive as a meaningful change in
a clients’ functioning (Bauer, Lambert, & Nielsen, 2004; Norman, Sloan, & Wyrwich,
2003; Schmitt & Di Fabio, 2004). Clients whose true-score change is at least equal to the 𝑀𝐼𝐷 have shown a clinically important change, while changes smaller than the MID are
deemed too small to be practically important. In practice, the MID is often defined as half a
standard deviation of the total-score distribution (Norman et al., 2003).
When the 𝑀𝐼𝐷 is used to assess individual change, clinicians normally do not take
the unreliability of the change score into account. Instead, they consider a change score to
be clinically important if the absolute value of the change score 𝐷 exceeds a particular
magnitude—that is |𝐷| ≥ 𝑀𝐼𝐷 (and 𝑀𝐼𝐷 > 0)—regardless of whether the change score
differs significantly from zero or the 𝑀𝐼𝐷. However, some authors recommend to also take
measurement error into account when assessing clinically important change (e.g., Jacobson
et al., 1984; Wise, 2004) and suggest to consider individual change to be clinically
important if |𝐷| ≥ 𝑀𝐼𝐷 and D differs significantly from zero. This criterion ensures that
decisions about clinical change are based on reliable change only.
A clinician can even be more conservative by deciding that a client only showed a
clinically important change if |𝐷| is significantly larger than the 𝑀𝐼𝐷. This amounts to
testing 𝐻 : |𝑇 | ≤ 𝑀𝐼𝐷 against H1: |𝑇 | > 𝑀𝐼𝐷 . The choice of the significance level α
determines the risk one is willing to take to incorrectly conclude that a client’s true change
exceeded the 𝑀𝐼𝐷. We studied test-length requirements for all three rules for deciding
about clinically important change: (𝑎) |𝐷| ≥ 𝑀𝐼𝐷; (𝑏) |𝑅𝐶| ≥ 1.96 and |𝐷| ≥ 𝑀𝐼𝐷; and
(𝑐) |𝐷| ≥ (𝑀𝐼𝐷 + 1.96𝑆𝐸𝑀 ).

Chapter 4
82
Criterion 3: Recovery. Jacobson et al. (1984) combined information about the 𝑅𝐶
and the post-treatment total-score 𝑋 to make decisions about treatment outcomes (also, see
Atkins, Bedics, McGlinchey, & Beauchaine, 2005; Wise, 2004). In particular, a cut score 𝑋 is established that separates the population that functions psychologically well—the
functional population—from the dysfunctional population. Jacobson and Truax (1991)
suggested various methods for establishing a meaningful cut score that are based on
comparing score distributions for functional and dysfunctional populations. A client is
recovered if the change is reliable, that is 𝑅𝐶 ≥ 1.96, and unlike 𝑋 , post-treatment score 𝑋 is in the functional range; that is, the client is no longer part of the dysfunctional
population. In practice, clinicians may not always take measurement error into account and
declare a client to be recovered if his/her total score moves from the dysfunctional to the
functional range, regardless of whether the change is significant. We studied test-length
requirements for both decision rules: (a) 𝑋 < 𝑋 and 𝑋 ≥ 𝑋 ; and (b) 𝑋 < 𝑋 and 𝑅𝐶 ≥ 1.96 and 𝑋 ≥ 𝑋 .
4.3 Method
4.3.1 Data Generation
We used simulated data to answer the research questions. Data simulation allows
the exact computation of the proportion of incorrect decisions about individual change. We
simulated data using item response theory (IRT; Embretson & Reise, 2000). Let 𝜃 denote
the latent person variable from IRT. Clients’ true pre-treatment and post-treatment scores
can be expressed on the 𝜃-scale, where the true pre-treatment score is denoted 𝜃 , the true
post-treatment score 𝜃 , and the true change 𝛿, so that 𝜃 = 𝜃 + 𝛿. In turn, 𝜃 , 𝜃 , and 𝛿 can be easily converted to 𝑇 , 𝑇 , and 𝑇 , respectively (Lord & Novick, 1968, p. 387).

Assessing individual change
83
We simulated pre-treatment scores and post-treatment scores by means of the
graded response model (Embretson & Reise, 2000, pp. 97-102; Samejima, 1969). The
graded response model defines the probability of obtaining at least a particular score 𝑥 on
item 𝑗 , denoted by 𝑃 𝑋 ≥ 𝑥 𝜃 , 𝑥 = 1, … , 𝑚 [ 𝑃 𝑋 ≥ 0|𝜃 = 1 by definition]. This
probability depends on the client’s 𝜃 value, a location or difficulty parameter ( 𝑏 )
representing the 𝜃 value for which the probability of obtaining at least item score 𝑥 equals .5, and the slope or discrimination parameter (𝑎 ), such that
𝑃 𝑋 ≥ 𝑥 𝜃, 𝑎 , 𝑏 = exp [𝑎 (𝜃 − 𝑏 )]1 + exp [𝑎 (𝜃 − 𝑏 )] . (4.3)
In our design, we simulated data for rating-scale items with five ordered scores. For
items with five ordered scores, by definition four item-step difficulties 𝑏 (except 𝑏 )
have to be defined (Samejima, 1969). The higher 𝑏 , the less likely it is that clients
produce an item score 𝑥 or a higher item score. The higher 𝑎 , the better the item
discriminates low 𝜃 values and high 𝜃 values relative to the 𝛿 values. Given the response
functions in Equation (4.3), the probability that a client scores exactly 𝑥 on item 𝑗 can be
computed for each client and each possible item score 𝑥 (Embretson & Reise, 2000, p. 99).
4.3.2 Independent Variables
Test length. We studied individual change assessment for tests consisting of 40, 20,
15, 10, and 5 items. We considered a 40-item test to be long, and a test consisting of at
most 15 items to be short. A test used to measure individual change must effectively
distinguish clients at a wide variety of different locations on the scale (Finkelman et al.,
2010; Liang, 2000; Meier, 2004). Thus, the test must have sufficient discrimination power
along the 𝜃-scale. To realize sufficient discrimination along the shortened scale, test length
was reduced by removing items such that the locations or difficulties of the remaining

Chapter 4
84
items were equally spread at greater but equal mutual distances (Allen & Yen, 1979, p.
122). In our design, we used the same tests to simulate pre-treatment scores 𝑋 and the
post-treatment scores 𝑋 .
Item-step difficulties. Let 𝑏 the mean item-step difficulty for item j. We considered
tests for which the 𝑏 s are spread at equal distances between –1.5 and 1.5. The item-step
difficulties within the same test were located either at –.30, –.15, .15, and .30 units from 𝑏 (Emons et al., 2007), referred to as small-dispersion item-step difficulties, or at
–1.75, –.75, .75, and 1.75 units from 𝑏 (Kruyen, Emons, & Sijtsma, 2012), referred to as
large-dispersion item-step difficulties. A small increase of the true score results in a larger
increase of the response probability for items of which the item-step difficulties are close
together relative to items of which the item-step difficulties are far apart. Hence, we
expected that items of which the item-step difficulties are close together better to detect
small true-score changes than items of which the item-step difficulties are far apart.
Discrimination parameters. We sampled the item discrimination parameters (𝑎 )
randomly from a uniform distribution 𝑎 ~𝑈[0.5; 2], which represents the typical range of
a-values in applied research given a standard normal 𝜃 -distribution (e.g., Candell &
Drasgow, 1988; Cohen, Kim, & Baker, 1993; Embretson & Reise, 2000, pp. 69, 101;
Harwell & Janosky, 1991). For these item discrimination parameters, coefficient alpha
was .49 for 5-item tests with small-dispersion item-step difficulties and .58 for 5-item tests
with large-dispersion item-step difficulties.
In practice, a reliability of .80 is generally considered a bare minimum for
individual decision-making (Atkins et al., 2005; Kline, 2000, p. 13; Nunnally & Bernstein,
1994, p. 265). We therefore also investigated the risk of incorrect decisions when the
reliability of the shortened tests was close to this minimum level. To obtain a reliability
of .80 for the 5-item tests, we had to fix all 𝑎 s at 1.9 for the tests with large-dispersion
Assessing individual change
85
item-step difficulties. Discrimination parameters larger than 10 were needed to obtain
reliabilities close to .80 for the 5-item tests with small-dispersion item-step difficulties. We
fixed all 𝑎 s to 3.4 (admittedly unrealistic) for this type of tests, which resulted in a
reliability of .72 for the 5-item tests (higher values for 𝑎 s resulted in a marginal increase in
reliability). We refer to tests with randomly drawn item-discrimination parameters as
medium-discrimination tests and we refer to tests with fixed discrimination parameters as
high-discrimination tests.
Magnitude of individual change. We studied 𝜃 > 𝜃 (i.e., 𝛿 > 0) and assumed that
a positive true-score change 𝛿 reflects an improvement. The results for the opposite
situation 𝜃 < 𝜃 , which reflects deterioration, are formally comparable (but substantially
different). We considered nine combinations of pre-treatment scores and true-score
changes for statistically significant change (Criterion1) and clinically important change
(Criterion 2). To the values 𝜃 = –2, –1, and 0, we added a true change of 𝛿 = .5, 1.0, and
1.5, resembling a small, medium, and large true-score change (Finkelman et al., 2010).
For detecting recovery (Criterion 3), we considered a true change of 𝛿 = .5, 1.0,
and 1.5 around 𝑋 . In practice, cut score 𝑋 is obtained using either total-score
distributions of the dysfunctional population and the functional population, or both
(Jacobson et al., 1984). Because we did not have access to these distributions, we arbitrary
set 𝑋 at two-fifth of the scale range, where the scale range was the difference between the
maximum possible total score and the minimum possible total score. To simulate data
reflecting recovery, we converted 𝑋 to 𝜃 and we chose 𝜃 = 𝜃 −.5𝛿 and 𝜃 = 𝜃 +.5𝛿.
4.3.3 Dependent Variables
Reliability. We reported total-score reliability (coefficient alpha) of both the pre-
treatment tests and the post-treatment tests.

Chapter 4
86
Detection rate. For each combination of test length, dispersion of item-step
difficulties, and item discrimination level, we replicated 50,000 change scores for each of
the nine combinations of 𝜃 and 𝜃 . The detection rate is defined as the proportion of
replications for which the correct decision is made. In particular, for Criterion 1 the
detection rate is the proportion of D scores larger than 1.96. For Criterion 2, the different
detection rates are the proportion of D scores above the MID (rule a), proportion of D
scores larger than 1.96 and above the MID (rule b), and the proportion of D scores
significantly larger than the MID (rule c). For Criterion 3, we computed three different
detection rates. First, we determined the proportion of clients correctly assigned to the
dysfunctional population, that is, for whom 𝑋 < 𝑋 . Second, we computed the proportion
of clients with a pre-treatment total-score in the dysfunctional range and a post-treatment
total-score in the functional range (i.e., for whom 𝑋 < 𝑋 and 𝑋 ≥ 𝑋 ) (rule a). Third,
we computed the proportion of clients with a pre-treatment total-score in the dysfunctional
range and who recovered (i.e., for whom 𝑋 < 𝑋 and 𝑅𝐶 ≥ 1.96 and 𝑋 ≥ 𝑋 ) (rule b).
The detection rates express the certainty with which correct decisions about
individuals can be made. Thus, the higher the detection rate, the smaller the risk that an
incorrect decision is made about individual change. When important irreversible decisions
about individuals have to be made, detection rates as high as .90 may be required (Emons
et al., 2007). Because in practice tests and questionnaires are often used in combination
with other sources of information, we consider detection rates of .80 or larger to be
adequate for most practical applications.
4.3.4 Computational Details
Clinicians need 𝑆𝐸𝑀 to decide about treatment outcomes. For each test
length, we obtained 𝑆𝐸𝑀 in a simulated sample of total scores for 10,000 randomly

Assessing individual change
87
drawn clients from a normal 𝜃 distribution. The mean of the 𝜃 distribution was equal to –1,
because we assumed that clients who require a treatment on average have a low pre-
treatment total score. The variance of the 𝜃 distribution was equal to 1. We also used the
simulated sample to determine the MID. Following common practice, the MID was chosen
to be half a standard deviation of the total-score distribution (Norman et al., 2003).
For the medium-discrimination tests, the discrimination parameters were randomly
drawn from a uniform distribution. However, different random selections of the item-
discrimination parameters may result in different total-score reliabilities, which in turn may
produce different detection rates. Therefore, we repeated the study ten times using the
same design but with different randomly sampled item-discrimination parameters. We only
discuss the mean results across replications. For the tests with the fixed discrimination
parameters replications of the design were not needed.
4.4 Results
4.4.1 Criterion 1: Statistically Significant Change
Table 4.1 shows the detection rates for detecting individual change using RC for
medium-discrimination tests and Table 4.2 shows the detection rates for high-
discrimination tests. High-discrimination tests produced higher detection rates than
medium-discrimination tests; and larger true-score changes produced higher detection rates
than small true-score changes. In contrast to what we expected, the dispersion of item-step
difficulties had minor effects on the detection rates. We discuss only the results for item-
step difficulties with small dispersion.
Detection rates decreased when tests grew shorter, but the extent to which detection
rates decreased varied across pre-treatment scores 𝜃 and degree of true-score change 𝛿.
For all test lengths, detection rates were considerably lower for 𝜃 = –2 than for 𝜃 = –1

Chapter 4
88
Table 4.1: Detection rates for detecting reliable change for medium-discrimination tests.
Item-step difficulties Small dispersion Large dispersion 𝐽 𝑟 𝜃 𝛿: .5 1 1.5 𝑟 .5 1 1.5
40 .90 -2 .09 .47 .89 .92 .18 .66 .96 -1 .26 .73 .97 .28 .78 .99 0 .30 .73 .95 .31 .78 .97
20 .81 -2 .06 .25 .60 .86 .10 .38 .75 -1 .15 .44 .76 .17 .50 .83 0 .17 .45 .72 .18 .50 .80
15 .78 -2 .05 .20 .50 .82 .09 .30 .63 -1 .14 .38 .67 .14 .39 .70 0 .15 .36 .59 .15 .39 .67
10 .68 -2 .04 .14 .34 .74 .07 .21 .46 -1 .10 .26 .48 .11 .29 .55 0 .11 .25 .43 .12 .29 .51
5 .49 -2 .03 .09 .20 .58 .05 .12 .25 -1 .07 .14 .25 .08 .17 .32 0 .07 .12 .20 .08 .17 .29
Note. Small Dispersion = Dispersion of item-step difficulties that are located at −.30, −.15, .15, and . 30 units from the mean item difficulty; Large Dispersion = Dispersion of item-step difficulties that are located at −1.75, −.75, .75, and 1.75 units from the mean item difficulty.
and 0, but the differences decreased as tests grew shorter. This result shows that
measurement tends to be less precise in the tails of the 𝜃 distribution than in the middle
ranges, a property that is most pronounced when tests are long. Decreasing test length had
little impact on detecting small true-score changes (𝛿 = .5) but a large impact on detecting
large true-score changes (𝛿 = 1.5). For example, for 𝜃 = –1 (Table 4.1, columns 3-5),
decreasing test length from 40 to 5 items reduced the detection rate from .26 to .07 for 𝛿 = .5, but from .97 to .25 for 𝛿 = 1.5. The decrease in detection rates as a result of removing
items was similar across differences in item discrimination level (medium-discrimination
tests versus high-discrimination tests).
For medium-discrimination tests, detection rates were only above .80 for 𝐽 = 40
and 𝛿 = 1.5. Results improved for high-discrimination tests, which produced detection rates

Assessing individual change
89
Table 4.2: Detection rates for detecting reliable change for high-discrimination tests.
Item-step difficulties Small dispersion Large dispersion 𝐽 𝑟 𝜃 𝛿: .5 1 1.5 𝑟 .5 1 1.5
40 .97 -2 .06 .93 1.00 .97 .44 .98 1.00 -1 .77 1.00 1.00 .63 .99 1.00 0 .81 1.00 1.00 .67 .99 1.00
20 .94 -2 .03 .64 1.00 .94 .18 .74 .99 -1 .44 .97 1.00 .33 .88 1.00 0 .48 .97 1.00 .36 .88 1.00
15 .92 -2 .01 .40 .97 .93 .21 .71 .97 -1 .34 .93 1.00 .32 .82 .99 0 .39 .90 1.00 .35 .82 .98
10 .87 -2 .01 .28 .86 .89 .11 .46 .86 -1 .17 .68 .97 .20 .62 .92 0 .22 .70 .95 .23 .62 .90
5 .72 -2 .01 .15 .56 .80 .06 .24 .55 -1 .08 .33 .68 .12 .37 .69 0 .08 .31 .63 .14 .37 .64
Note. Small Dispersion = Dispersion of item-step difficulties that are located at −.30, −.15, .15, and . 30 units from the mean item difficulty; Large Dispersion = Dispersion of item-step difficulties that are located at −1.75, −.75, .75, and 1.75 units from the mean item difficulty.
above .80 for 𝐽 = 15 and 𝛿 = 1; and for J = 10 and 𝛿 = 1.5. However, even a high-
discrimination test of 40 items did not detect small changes in more than 80% of the
replications. The detection rates in Table 4.1 and Table 4.2 thus show that the commonly
used standard of .80 for total-score reliability did not guarantee reliable individual-change
assessment, in particular when tests were short. For example, for 𝐽 = 15, detection rates
were about .30 for small true-score changes.
4.4.2 Criterion 2: Clinically Important Change
Tables 4.3 and 4.4 present the detection rates for clients who showed a clinically
important true–score change for medium- and high-discrimination tests, respectively. A
few remarks are in order. First, we only tabulated the results for decision rules (𝑎) 𝐷 ≥ 𝑀𝐼𝐷

Chapter 4
90
Table 4.3: Detection rates for detecting clinically important change for medium-
discrimination tests.
Item-step difficulties Small dispersion Large dispersion 𝛿: .5 1 1.5 .5 1 1.5 𝐽 𝑟 𝑀𝐼𝐷 𝜃 a c a C a c 𝑟 𝑀𝐼𝐷 a C a C a c
40 .90 14.80 -2 .79 .10 .98 .53 .92 12.30 .86 .18 .99 .68-1 .55 .04 .92 .34 1.00 .80 .53 .03 .92 .33 1.00 .820 .59 .06 .92 .34 .99 .72 .55 .04 .92 .33 1.00 .78
20 .81 7.60 -2 .71 .06 .92 .28 .86 6.25 .76 .10 .95 .39-1 .52 .03 .82 .18 .96 .49 .83 .19 .97 .530 .54 .05 .82 .19 .95 .43 .51 .04 .83 .19 .96 .48
15 .78 6.04 -2 .68 .05 .90 .22 .82 4.87 .76 .08 .93 .30-1 .52 .03 .79 .16 .94 .40 .80 .14 .95 .400 .14 .78 .14 .92 .31 .80 .14 .94 .35
10 .68 4.14 -2 .62 .04 .82 .15 .74 3.38 .67 .06 .87 .20-1 .71 .11 .87 .27 .73 .11 .90 .290 .71 .10 .85 .22 .73 .10 .88 .25
5 .49 2.33 -2 .59 .04 .75 .10 .58 1.85 .65 .04 .80 .11-1 .62 .07 .76 .14 .68 .07 .82 .160 .60 .06 .72 .10 .68 .07 .81 .14
Note. 𝑎 = Proportion of clients that showed a clinically important change using decision rule 𝐷 ≥ 𝑀𝐼𝐷; c = Proportion of clients that showed a clinically important change using decision rule 𝐷 ≥ 𝑀𝐼𝐷 +1.96𝑆𝐸𝑀 ).
and (𝑐) 𝐷 ≥ (𝑀𝐼𝐷 + 1.96𝑆𝐸𝑀 ). The results for decision rule (𝑏) 𝑅𝐶 ≥ 1.96 and 𝐷 ≥ 𝑀𝐼𝐷, were comparable to those for Criterion 1 (see tables 4.1 and 4.2; differences ≤ .05) because clients showing a statistically significant change also had a change that was at
least equal to the 𝑀𝐼𝐷. Second, for some combinations of 𝜃 and 𝛿, the true-score change 𝑇 was smaller than the 𝑀𝐼𝐷. Consequently, for these combinations the detection rate was
not defined and the corresponding cells were left empty. Third, small true-score changes
(𝛿 = .5) mean that the clients’ true-score change was close to the 𝑀𝐼𝐷. As a result, the
distribution of 𝐷 scores is centered at the 𝑀𝐼𝐷 and equals the change score distribution
postulated under the null hypothesis tested using rule (c). Therefore, for small true-score

Assessing individual change
91
Table 4.4: Detection rates for detecting clinically important change for high-
discrimination tests.
Item-step difficulties Small dispersion Large dispersion 𝛿: .5 1 1.5 .5 1 1.5 𝐽 𝑟 𝑀𝐼𝐷 𝜃 a c a c A c 𝑟 𝑀𝐼𝐷 a c a c a C
40 .97 18.46 -2 .91 .08 1.00 .98 .97 13.39 .97 .41 1.00 .98-1 .73 .07 1.00 .93 1.00 1.00 .57 .04 .99 .71 1.00 1.000 .78 .10 1.00 .93 1.00 1.00 .61 .06 .99 .71 1.00 .99
20 .94 9.12 -2 .84 .05 1.00 .81 .94 6.71 .91 .23 1.00 .83-1 .64 .05 .99 .64 1.00 .99 .57 .05 .96 .47 1.00 .940 .67 .07 .99 .67 1.00 .98 .60 .06 .96 .47 1.00 .91
15 .92 7.19 -2 .77 .02 1.00 .62 .93 5.25 .86 .16 .99 .67-1 .63 .04 .99 .58 1.00 .98 .51 .03 .92 .31 1.00 .810 .67 .06 .98 .49 1.00 .88 .53 .04 .92 .31 1.00 .76
10 .87 4.68 -2 .82 .03 .99 .47 .89 3.50 .81 .14 .98 .55-1 .60 .03 .95 .32 1.00 .84 .52 .04 .88 .28 .99 .710 .65 .04 .96 .34 1.00 .75 .54 .05 .88 .28 .98 .65
5 .72 2.33 -2 .76 .01 .95 .12 .80 1.79 .76 .05 .93 .22-1 .52 .01 .83 .07 .97 .28 .55 .02 .82 .12 .96 .360 .50 .01 .82 .06 .96 .23 .57 .03 .82 .12 .95 .30
Note. 𝑎 = Proportion of clients that showed a clinically important change using decision rule 𝐷 ≥ 𝑀𝐼𝐷; c = Proportion of clients that showed a clinically important change using decision rule 𝐷 ≥ 𝑀𝐼𝐷 +1.96𝑆𝐸𝑀 ).
changes, we expected detection rates close to .50 for decision rule (a) and close to the
nominal significance level of .05 for decision rule (c).
The results in columns 5-6 and columns 13-14 showed that, at all test lengths, for
small true-score changes the detection rates for decision rule (a) were indeed close to .50
and for decision rule (c) close to .05. For medium and large true-score changes, we found
the same effect of test shortening on the detection rates as those for detecting reliable
change (Criterion 1). As tests grew shorter, detection rates decreased sharply and the
decrease was most pronounced for large individual changes. Differences between large and
small dispersion of item-step difficulties and between medium-discrimination tests and
high-discrimination tests again were small.

Chapter 4
92
For decision rule (a), detection rates for medium change were about .80 or higher
for medium-discrimination tests consisting of at least 15 items. Detection rates improved
for high-discrimination tests. For medium change, detection rates of .80 or higher were
also found for the 5-item and the 10-item tests. For decision rule (c) and medium-
discrimination tests, only the 40-item test had sufficient power to detect significant
clinically important change in clients who changed more than twice the 𝑀𝐼𝐷. Reducing the
test to 20 items resulted in detection rates below .80. This means that one needs many
items to assess whether change is significantly larger than the 𝑀𝐼𝐷 . For high-
discrimination tests, 20 items had acceptable detection rates for detecting large true-score
changes, but for small and medium true-score changes detection rates were too low, even
for 40-item high-discrimination tests.
4.4.3 Criterion 3: Recovery
Tables 4.5 and 4.6 show the results for detecting recovery for medium- and high-
discrimination tests, respectively. Similar to results for the first two criteria, the dispersion
of item-step difficulties had minor effects on the detection rates. Hence, also here we
discuss only the results for item-step difficulties with small dispersion. As tests grew
shorter, the proportion of clients correctly assigned to the dysfunctional population at
pretest measurement decreased sharply (Columns 8 and 15), even for respondents whose
true score on the pre-treatment test was relatively far away from cut score 𝑋 . For example,
for 𝛿 = 1.5, meaning that 𝜃 was 0.75 standard deviations below cut score 𝜃 , the 40-item
medium-discrimination test correctly classified 99% of the clients in the dysfunctional
range, whereas the shortened 5-item test only classified 66% correctly (Table 4.5, column
8). These results are consistent with Emons et al. (2007).

Assessing individual change
93
Table 4.5: Detection rates for detecting recovery for medium-discrimination tests.
Item-step difficulties Small dispersion Large dispersion 𝛿 𝐽 𝑋 𝑟 𝜃 𝑇 𝑇 Treat 𝑎 𝑏 𝑟 𝜃 𝑇 𝑇 Treat 𝑎 𝑏
.5 40 64 .90 -.44 55.26 73.03 .80 .65 .28 .93 -.59 57.47 70.69 .81 .69 .30 20 32 .82 -.45 28.27 37.03 .68 .52 .17 .87 -.60 28.78 35.41 .72 .56 .19 15 24 .78 -.51 21.27 28.02 .64 .48 .15 .83 -.65 21.6 26.56 .68 .51 .14 10 16 .67 -.50 14.50 18.62 .57 .42 .10 .76 -.62 14.48 17.76 .63 .46 .11 5 8 .49 -.51 7.50 9.45 .45 .33 .06 .58 -.62 7.05 8.71 .59 .41 .09
1 40 64 .90 -.44 47.01 82.18 .95 .92 .74 .93 -.59 51.17 77.47 .97 .94 .79 20 32 .82 -.45 24.13 41.49 .85 .78 .46 .87 -.60 25.62 38.81 .89 .83 .53 15 24 .78 -.51 18.11 31.47 .81 .72 .38 .83 -.65 19.22 29.09 .85 .77 .41 10 16 .67 -.50 12.54 20.47 .71 .61 .25 .76 -.62 12.92 19.43 .78 .68 .29 5 8 .49 -.51 6.55 10.44 .55 .46 .13 .58 -.62 6.26 9.56 .72 .58 .21
1.5 40 64 .90 -.44 39.43 91.26 .99 .99 .96 .93 -.59 45.15 84.27 1.00 1.00 .98 20 32 .82 -.45 20.27 45.91 .95 .92 .76 .87 -.60 22.6 42.22 .97 .96 .85 15 24 .78 -.51 15.19 34.88 .91 .88 .66 .83 -.65 16.94 31.64 .94 .92 .72 10 16 .67 -.50 10.69 22.85 .83 .77 .45 .76 -.62 11.42 21.12 .89 .84 .55 5 8 .49 -.51 5.64 11.42 .66 .59 .23 .58 -.62 5.51 10.41 .83 .74 .38
Note. Treat = Proportion of clients that were classified to be in need of a treatment (i.e., 𝑋 < 𝑋 ); a = Proportion of clients having a pre-treatment total-score in the dysfunctional range and a post-treatment total-score in the functional range; b = Proportion of clients showing a reliable change and pre-treatment and post-treatment total-scores in the dysfunctional and function range, respectively.
The relationship between test length and detection rates showed similar patterns as
those for Criteria 1 and 2 for decision rule (a) 𝑋 < 𝑋 and 𝑋 ≥ 𝑋 and (b) 𝑋 < 𝑋 and 𝑅𝐶 ≥ 1.96 and 𝑋 ≥ 𝑋 . Detection rates decreased with decreasing test length, but the
decrease was smaller when recovery involved a small true-score change (𝛿 = .5; upper
panel) than a medium (𝛿 = 1.0; middle panel) or large true-score change (𝛿 = 1.5; lower
panel). For decision rule (b), detection rates got rapidly worse as tests grew shorter and
detection rates dropped far below .80, even in the condition with the largest individual
change. To understand this result, we point out that the detection rates for decision rule (b)
depended on the magnitude of clients’ true-score change and their position relative to 𝑋 before and after the treatment. To obtain acceptable detection rates, the test must make
reliable decisions both about whether clients belonged to the dysfunctional population or the

Chapter 4
94
Table 4.6: Detection rates for detecting recovery for high-discrimination tests.
Item-step difficulties Small dispersion Large dispersion 𝛿 𝐽 𝑋 𝑟 𝜃 𝑇 𝑇 Treat 𝑎 𝑏 𝑟 𝜃 𝑇 𝑇 Treat 𝑎 𝑏
.5 40 64 .97 -.31 51.42 76.76 .97 .96 .79 .97 -.52 56.49 71.71 .93 .88 .64 20 32 .94 -.32 26.00 38.03 .90 .84 .47 .94 -.51 28.26 35.86 .83 .74 .34 15 24 .92 -.36 19.01 29.15 .88 .81 .40 .93 -.57 21.19 26.87 .78 .68 .32 10 16 .87 -.36 13.14 18.95 .78 .69 .19 .89 -.54 14.14 17.92 .72 .60 .21 5 8 .73 -.42 6.68 9.31 .60 .52 .08 .79 -.55 7.07 8.95 .61 .49 .13
1 40 64 .97 -.31 39.32 89.56 1.00 1.00 1.00 .97 -.52 49.25 79.52 1.00 1.00 .99 20 32 .94 -.32 20.12 44.11 1.00 .99 .97 .94 -.51 24.66 39.76 .98 .97 .87 15 24 .92 -.36 14.34 34.31 .99 .99 .94 .93 -.57 18.48 29.78 .96 .94 .81 10 16 .87 -.36 10.34 22.00 .96 .94 .69 .89 -.54 12.36 19.86 .91 .87 .61 5 8 .73 -.42 5.35 10.61 .82 .79 .32 .79 -.55 6.22 9.91 .79 .73 .36
1.5 40 64 .97 -.31 28.17 102.26 1.00 1.00 1.00 .97 -.52 42.37 87.33 1.00 1.00 1.00 20 32 .94 -.32 14.59 50.23 1.00 1.00 1.00 .94 -.51 21.25 43.67 1.00 1.00 1.00 15 24 .92 -.36 10.14 39.29 1.00 1.00 1.00 .93 -.57 15.87 32.69 1.00 .99 .98 10 16 .87 -.36 7.64 25.08 1.00 .99 .97 .89 -.54 10.67 21.81 .98 .98 .91 5 8 .73 -.42 4.05 11.91 .94 .93 .68 .79 -.55 5.41 10.88 .91 .89 .65
Note. Treat = Proportion of clients that were classified to be in need of a treatment (i.e., 𝑋 < 𝑋 ); a = Proportion of clients having a pre-treatment total-score in the dysfunctional range and a post-treatment total-score in the functional range; b = Proportion of clients showing a reliable change and pre-treatment and post-treatment total-scores in the dysfunctional and function range, respectively.
functional population at pre- and post-test measurements and also whether the change was
significant. The results show that many items were needed to ensure both reliable
classification and to assess reliable change. To summarize, the results for decision rules (a)
and (b) suggest that long tests were required if recovery based on small to medium changes
had to be detected.
4.5 Discussion
The simulation study showed that test shortening resulted in an increased risk of
making incorrect decisions about individual change. In particular, when changes were
large, say, more than 1.5 standard deviation, shortening a test from 40 to 5 items lowered

Assessing individual change
95
the proportion of correct decisions on average by .40. Short tests consisting of, say, 10 to
15 highly discriminating items, thus having high total-score reliabilities, consistently
detected large changes, but even such unrealistic, high-reliable tests often left small to
medium changes undetected. In real-life clinical settings, clients showing small to medium
changes constitute the majority. We conclude that one should be cautious in using short
tests for assessing individual change.
Some authors claim that test shortening is justified as long as one retains the items
with optimal characteristics, such that the loss in reliability is minimized (e.g., Fu, Liu, &
Yip, 2007; Marteau & Bekker, 1992; Olatunji et al., 2010). We manipulated two key
characteristics of the items: discrimination and dispersion of the item-step difficulties.
Increasing item-discrimination parameters and, consequently, increasing total-score
reliability, resulted in a considerable higher proportion of correct decisions. However,
unrealistically high discrimination parameters had to be chosen to obtain an acceptable
total-score reliability for short tests. Interestingly, even for short tests with high total-score
reliabilities a correct decision was made in less than 80% of the replications. Thus, high
total-score reliabilities do not guarantee reliable individual-change assessment.
For different dispersions of item-step difficulties, we found minor effects on the
risk of incorrect decisions. The spread of the item-step functions of all items together
explains this result. Whether items had steps close to each other or further apart, the item-
step difficulties of all items together were in both conditions equally spread throughout the
latent variable scale 𝜃. This means that anywhere along the 𝜃 scale there were always item
steps available, either from the same item or from different items, to pick up local changes
in 𝜃. Hence, the spread of the item-step difficulties within items had a minor effect on the
risk of incorrect decisions.

Chapter 4
96
In clinical practice, clinicians use the MID to define changes that have important
consequences for clients’ functioning. Clinicians often choose the MID equal to half the
standard deviation of the total-score distribution (Norman et al., 2003). Interestingly, we
found that 95% confidence intervals around observed change scores D were often wider
than the MID, in particular when tests grew shorter. This means that it was impossible to
exclude the option that a true-score change equal to the MID was due to measurement error.
Therefore, we advise clinicians only to evaluate clinical importance of the change if the
change score differs significantly from zero.
The simulation study also reported detection rates when statistical tests were not
used to decide about change. The detection rates were always higher than those for criteria
involving statistical testing such as testing whether an observed change score was
significantly different from zero. A naive test user may conclude that it is better to not
statistically test individual change. However, statistical tests are important because they
control the probability of incorrectly deciding that the person has changed due to
measurement error (i.e., Type I error). In practice, clinicians often want to minimize the
risk that a treatment is erroneously considered to be successful, thus resulting in the
incorrect termination of a treatment program. When a change score is non-significant this
means that the information available is insufficient to decide about individual change with
enough certainty, and this is more likely to happen as the test grows shorter. To secure
decision certainty, it is better to use a longer test or to include auxiliary information than
simply ignore the uncertainty by relying on naive decision rules.
This study was limited to individual change assessment in pre-test post-test designs,
which is the design most frequently used in practice. However, some authors criticize the
usefulness of such designs because clients’ views, values, and expectations may change
during a treatment, which may yield biased change scores (e.g., Howard & Dailey, 1979;

Assessing individual change
97
Schwartz & Sprangers, 1999). To prevent this method bias, clinicians sometimes assess
change using a retrospective design in which both pre-treatment and post-treatment
information is collected after the treatment is completed (Betz & Hill, 2005). However, in
retrospective designs researchers also have to rely on error-laden change scores and our
results also apply to such retrospective designs.

98

99
Chapter 5: * Shortening the S-STAI: Consequences for research and individual decision-making*
* This chapter has been submitted for publication.

Chapter 5
100
Abstract Several authors proposed a shortened version of the State scale of the State-
Trait Anxiety Inventory (S-STAI, Spielberger, Gorsuch, & Lushene, 1970; Spielberger,
Gorsuch, Lushene, Vagge, & Jacobs, 1983) to obtain a more efficient measurement
instrument. Psychometric theory shows that test shortening makes a total score more
vulnerable to measurement error, and this may result in biased research results and an
increased risk of making incorrect decisions about individuals. The goal of this study was
to investigate whether shortened versions of the S-STAI are suited for psychological
research and making decisions about individuals. For 12 shortened S-STAI versions that
were reported in the psychological literature, we assessed the consequences of test
shortening for research results such as power and effect size and for the risk of making
incorrect decisions about individuals. We used data collected from 376 patients and 373 of
their family members (often patients’ partners) in a longitudinal study in the Netherlands.∗
Analyses were performed using classical test theory statistics. The effect of test shortening
on total-score reliability was small, the effect on measurement precision was large, and the
effect on individual diagnosis and assessment of individual change was ambiguous. We
conclude that shortened versions of the S-STAI are acceptable for research purposes, but
may be problematic for making decisions about individuals.
∗ We would like to thank Prof. dr. Susanne S. Pedersen for providing the data set. The data was collected in a study in part supported with a VENI (451-05-001) from the Netherlands Organization for Scientific Research (NWO) and a VIDI grant (91710393) from the Netherlands Organization for Health Research and Development (ZonMw) to Prof. dr. Susanne S. Pedersen, The Hague, The Netherlands. We also would like to thank Agnes Muskens-Heemskerk for inclusion of the patients into the study and Simone Traa, Martha van den Berg, and Belinda de Lange for their help with data management.

Shortening the S-STAI
101
5.1 Introduction
This study investigated the extent to which shortened versions of the State scale of
the State-Trait Anxiety Inventory (S-STAI, Spielberger, Gorsuch, & Lushene, 1970;
Spielberger, Gorsuch, Lushene, Vagge, & Jacobs, 1983) are suited for use in psychological
research and individual decision-making. The state anxiety scale is one of the two scales of
the STAI and measures how much worry and tension a person experiences at the moment
of measurement. The other scale is the trait questionnaire (T-STAI), which measures a
person’s general anxiety level. The S-STAI is one of the most widely used measures of
state anxiety, both in scientific research and clinical practice (Lonner & Ibrahim, 1989;
Spielberger et al., 1983; Tluczek, Henriquest, & Brown, 2009). For example, scores on the
S-STAI are used to identify individuals in need of clinical intervention and to monitor
individuals’ anxiety level in the course of a treatment program (e.g., Compare et al., 2006,
p. 460; Feeney, Egan, & Gasson, 2005; Feske, 2001).
Several shortened versions of the original 20-item S-STAI were proposed, where
the number of items varies from 4 through 10 (e.g., Bennett Johnson, Baughcum,
Carmichael, She, & Schatz, 2004; Fioravanti-Bastos, Cheniaux, & Landeria-Fernandez,
2011). Shortened S-STAI versions may be preferred relative to the 20-item S-STAI for
several reasons of which we mention the following. The 20-item S-STAI may be too
demanding for individuals suffering from severe medical conditions such as hospitalized
respiratory patients (Perpiñá-Galvañ, Richart-Martínez, & Cabañero-Martínez, 2011).
Clinicians who need to regularly assess anxiety, often in combination with the assessment
of other psychosocial risk indicators, prefer to limit total testing time (Abed, Hall, & Moser,
2011). Also, in large-scale psychological research the S-STAI may be included in the test
booklet and to increase response rates and keep the administration time within reasonable

Chapter 5
102
limits, researchers may resort to shortened S-STAI versions. Finally, one may find it
unethical to entrust respondents with more questions than strictly necessary.
Short scales have obvious practical advantages, but it is a well-known psychometric
fact that as tests grow shorter, the total score becomes more vulnerable to measurement
error (e.g., Allen & Yen, 1979, p. 87; Brown, 1910; Lord & Novick, 1968, p. 115;
Spearman, 1910). Test shortening thus may save testing time and alleviate the respondent’s
burden but comes at the expense of a lower reliability. Lower reliability means that
decisions have to be made on the basis of less precise information. Consequently, using
shortened S-STAI versions for individual decision-making may substantially increase the
risk of making decision errors. This higher risk can be substantial even if total-score
reliability for the shortened tests appears acceptable (Emons, Sijtsma, & Meijer, 2007;
Kruyen, Emons, & Sijtsma, 2012; Sijtsma, 2009a). For shortened S-STAI versions, thus far
the negative consequences for individual decision-making have received little attention.
The goal of this study was to investigate to what extent shortened S-STAI versions
allow individuals to be measured with enough precision. In particular, we addressed the
following research questions:
1. What are the differences between the total-score reliability of the original 20-item
S-STAI and the total-score reliabilities of the shortened S-STAI versions?
2. What are the differences between measurement precision of the original 20-item S-
STAI and measurement precision of the shortened S-STAI versions?
3. To what extent do the shortened S-STAI versions increase the risk of drawing
incorrect conclusions about an individual’s state anxiety?
We used empirical S-STAI data to address the three research questions. Pedersen,
Theuns, Jordaens, and Kupper (2010) collected the data in a longitudinal study in
Rotterdam, the Netherlands. Participants were cardiac patients who received an

Shortening the S-STAI
103
implantable cardioverter-defibrillator (ICD) between 2003 and 2008, and for each patient
one of their family members (often their partner). Patients and their family members who
are confronted with an ICD may suffer from temporary high levels of anxiety, which may
have a negative impact on their quality of life, their health, and clinical outcomes
(Pedersen, Van Domburg, Theuns, Jordaens, & Erdman, 2004). Hence, it is important to
monitor the anxiety level of patients and their family members. Next, we first define total-
score reliability and measurement precision and discuss possible consequences of S-STAI
shortening for reliability in research and measurement precision in clinical practice.
5.2 Background: Pitfalls of Shortening the S-STAI
5.2.1 Reliability and Measurement Precision
We use classical test theory (CTT; Lord & Novick, 1968) to define reliability and
measurement precision. CTT decomposes the total score (𝑋 ) into the sum of the true score
(𝑇) and the random measurement error (𝐸); that is, 𝑋 = 𝑇 + 𝐸. Let the sample variance of
the total score be denoted 𝑆 , the sample variance of the true score 𝑆 , and the sample
variance of the measurement error 𝑆 . The sample reliability of the total score,
denoted 𝑟 , is defined as the proportion of observable total-score variance that is due to
true-score variance or, equivalently, 1 minus the proportion of observable total-score
variance that is attributable to error variance; that is,
𝑟 = 𝑆𝑆 = 1 − 𝑆𝑆 . (5.1)
Low reliability means that only a small proportion of the total-score variance is true-score
variance; hence, a substantial part of the total-score variance is due to random
measurement error. It may be noted that reliability describes variance components at the
group level but not for individuals (Mellenbergh, 1996). This means that a reliability of .80

Chapter 5
104
does not guarantee that reliable decisions can be made about individuals (Sijtsma, 2009a).
To assess the impact of measurement error at the individual level, we consider the concept
of measurement precision expressed by the standard error of measurement (SEM).
The SEM (Allen & Yen, 1979, p. 63) expresses the precision of total score 𝑋 as an
estimator of true score 𝑇 . The SEM can be derived from the definition of total-score
reliability in Equation (5.1) as
SEM = 𝑆 = 𝑆 1 − 𝑟 . (5.2)
The SEM is an estimate of the variability of a person’s total score in the hypothetical
situation that the person would be repeatedly tested under the same conditions by means of
the same instrument (Sijtsma & Emons, 2011); that is, across replications. The SEM can be
used to answer the important question: “What happens if I would test the same person
again?” A large SEM means that retesting the person produces highly different total scores,
and that different test administrations might result in different decisions about that person.
In practice, SEMs are used to compute confidence intervals (CIs) for true scores 𝑇 .
Assuming normally distributed measurement errors, the 90% CI ( CI % ) for true
score 𝑇 equals 𝑋 ± 1.64SEM. The 90% CI reflects the error margins users have to take
into account when they draw conclusions about the individual’s true score but more
stringent or more lenient CIs are possible where more important decisions require more
stringency.
5.2.2 Consequences of Shortened S-STAIs in Research in Clinical Practice
To evaluate the possible negative effects of test shortening on reliability and
measurement precision, we take the three purposes for which S-STAI scores are used into
account. First, S-STAI scores are used in scientific research to study the relationship
between state anxiety and other variables of interest. For example, Dailey, Humphris, and

Shortening the S-STAI
105
Lennon (2002) used the S-STAI to evaluate the effectiveness of an intervention to reduce
dental anxiety. Second, S-STAI scores are used in clinical practice to diagnose highly-
anxious individuals who are in need for special treatment. For this purpose, the S-STAI is
used to classify individuals into one of two groups separated by a cut score 𝑋 ; individuals
whose total score is at or above the cut score 𝑋 are classified as highly anxious. For
example, Millar, Jelicic, Bonke, and Asbury (1995) used the S-STAI to provide tailored
care to non-anxious and anxious patients awaiting treatment of breast cancer. Third, S-
STAI scores are used in routine outcome measurement (e.g., Deady, 2009), where the
interest is in individual change in anxiety during treatment. The treatment can be
psychotherapy, but also medical therapy (e.g., heart surgery) in which peaks in anxiety
may be a risk factor of adverse effects (e.g., Luttik, Jaarsma, Sanderman, & Fleer, 2011).
Each of these three purposes places different demands on total-score reliability and
measurement precision, as we discuss next.
Using shortened S-STAI versions in research. Researchers who use the S-STAI
usually seek to know how differences in anxiety relate to differences on other variables of
interest. To reduce the influence of measurement error on the research outcomes with
respect to state anxiety, adequate total-score reliability is essential. As tests grow shorter,
total-score reliability reduces (Brown, 1910; Spearman, 1910). The resulting lower
reliability may have two consequences on results in scientific research. First, statistical
tests based on data obtained from shortened tests may have less power for hypothesis
testing, for example, with respect to testing group-mean differences (Sijtsma & Emons,
2011) and testing hypotheses about correlations (Ellis, 2012, pp. 66-67). For psychological
research, this reduction of power may not be a serious concern as the reduction can be
compensated by taking a larger sample. Second, a lower reliability produces smaller effect-
size measures, such as correlations and standardized group-mean differences (Cohen, 1988,
Chapter 5
106
pp. 535-537). As a result, the use of shortened S-STAI versions may lead to the systematic
underestimation of the effects of interest. This attenuation of effects cannot be
compensated by increasing the sample size and, thus, poses a more serious concern than a
loss of power (Sijtsma & Emons, 2011). Although corrections for attenuation are available
for most effect-size measures (Muchinsky, 1996; Nunnally & Bernstein, 1994, p. 241),
their use is debatable (Grissom & Kim, 2012, p. 121). The corrected effect sizes only give
a prediction for the hypothetical case that measurement is error-free and should not be
conceived as effect sizes resulting from real research (Allen & Yen, 1979, p. 257; Sijtsma
& Emons, 2011). Hence, researchers should strive for the highest possible reliability
achievable to obtain the most accurate results from their research.
Using shortened S-STAI versions for individual diagnosis. To evaluate the
usefulness of shortened S-STAI versions for making decisions about individuals, we first
need to assess how test shortening affects measurement precision (Harvill, 1991;
Mellenbergh, 1996; Nunnally & Bernstein, 1994, p. 260; Sijtsma & Emons, 2011). To
appreciate the relationship between measurement precision and test length, it is important
to take the scale length into account (Sijtsma, 2009a). The scale length is the maximum
possible total score minus the minimum possible total score. Removing items from a test
reduces both the SEM and the scale length, but the scale length decreases at a greater speed
(Sijtsma, 2009a). Hence, the SEM becomes large relative to scale length and measurement
precision decreases. The relative CI (Sijtsma & Emons, 2011) is defined by the length of
the CI divided by the scale length. As tests grow shorter, the relative CI is larger meaning
that the total score 𝑋 provides a less precise estimate of the true score 𝑇 (Sijtsma, 2009a;
Sijtsma & Emons, 2011). When a cut score is used to classify persons into two groups, the
increase of the relative CI means that the CI of more persons includes the cut score
(Sijtsma, 2012). Hence, for the shortened S-STAI versions we expect that the proportion of

Shortening the S-STAI
107
persons that cannot be classified with enough confidence increases. This proportion can
become unacceptably high if important treatment decisions have to be made about
individuals (Emons et al., 2007; Kruyen et al., 2012).
Using shortened S-STAI versions for assessing individual change. Let the S-STAI
score at the pretest be denoted 𝑋 and at the posttest 𝑋 . An individual’s change score,
denoted 𝐷, is defined by 𝐷 = 𝑋 − 𝑋 . When measuring individual change, the question
arises whether the individual’s total score shows a significant change, either in the desired
direction (improvement) or the undesired direction (deterioration). This question is usually
addressed by means of the reliable change (RC) index (Jacobson & Truax, 1991). Using
the SEM for pretest scores, and assuming an equal SEM for both measurements, the RC is
defined as follows
𝑅𝐶 = 𝐷√2SEM. (5.3)
Because a higher S-STAI total score reflects a higher level of state anxiety, reduced
anxiety is reflected by a S-STAI posttest score that is lower than the pretest score, so
that 𝑅𝐶 ≤ −1.96 indicates a significant improvement. A higher posttest score reflects more
anxiety, so that 𝑅𝐶 ≥ 1.96 indicates a significant deterioration (two-tailed test at the 5%
level). Change scores are based on two error-laden total scores and the resulting SEM for
change scores (the numerator in Equation 5.3) is √2 times as large as its constituent SEMs
(Allen & Yen, 1979, p. 209; Lord, 1956, p. 429). Thus, for assessing individual-change
measurement precision is even more critical than if classification based on one test score is
pursued. Therefore, we expect that using a shortened S-STAI version substantially
increases the risk of drawing incorrect conclusions about individual change.

Chapter 5
108
5.3 Method
5.3.1 Participants
We used data from a Dutch longitudinal study (Pedersen et al., 2010). The patient
sample consisted of 434 respondents who received an ICD (343 males; 91 females; mean
age = 57.95 years, age ranges from 17 to 81 years). The partner sample consisted of 437
respondents (95 males; 342 females; mean age = 58.42 years, age ranges from 27 to 80
years). Patients and partners who had insufficient knowledge of the Dutch language were
excluded from the study. Patients were also excluded when they were on the waiting list
for heart transplantation, had a life expectancy of less than a year, or when they had a
history of psychiatric illness other than affective anxiety disorders. All respondents
provided written informed consent and the study was approved by the ethical commission
of the Erasmus Medical Center in Rotterdam.
The respondents filled out several tests and questionnaires at five time points: one
day before ICD implantation, and ten days, three months, six months, and a year after the
implantation. Because more than 50% of the respondents did not complete the S-STAI at
all five measurement occasions, we only used data collected at the first two time points
(i.e., one day before and ten days after the ICD implantation). For these two time points,
we had access to data from 376 patients and 373 partners. Few respondents had missing
item scores; 0.51% of the scores in the patient sample were missing, and 0.36% in the
partner sample. We used two-way imputation to estimate missing item scores (Van Ginkel,
Van der Ark, & Sijtsma, 2007).
5.3.2 Measures
Original 20-item S-STAI. The first version of the S-STAI was released in 1970
(Form X). A revised version was published in 1983 (Form Y); in this revision, six items from

Shortening the S-STAI
109
Tabl
e 5.
1: S
hort
ened
ver
sion
s of t
he S
-STA
I.
Test
-sho
rteni
ng st
rate
gyd
Odd
-num
bere
d ite
ms
Odd
-num
bere
d ite
ms
Reg
ress
ion
anal
ysis
Reg
ress
ion
anal
ysis
Reg
ress
ion
anal
ysis
Cla
ssic
al-te
st st
atis
tics
Neg
ativ
ely
wor
ded
item
s
Posi
tivel
y w
orde
d ite
ms
Reg
ress
ion
anal
ysis
Reg
ress
ion
anal
ysis
Reg
ress
ion
anal
ysis
Cla
ssic
al-te
st st
atis
tics
Posi
tivel
y an
d ne
gativ
ely
wor
ded
item
s
Item
s fro
m C
hlan
et a
l. (2
003)
Ju
dgm
ent o
f tar
get p
opul
atio
n
Cla
ssic
al-te
st st
atis
tics
Cla
ssic
al-te
st st
atis
tics
Posi
tivel
y an
d ne
gativ
ely
wor
ded
item
s
Judg
men
t of t
est c
onst
ruct
ors
Expl
orat
ory
fact
or a
naly
sis
Expl
orat
ory
fact
or a
naly
sis
Posi
tivel
y an
d ne
gativ
ely
wor
ded
item
s C
lass
ical
-test
stat
istic
s
Cla
ssic
al-te
st st
atis
tics
Posi
tivel
y an
d ne
gativ
ely
wor
ded
item
s
Regr
essi
on a
naly
sis
Com
mon
item
s in
Spie
lber
ger e
t al.
(198
3)
and
Mic
alle
f et a
l.a (1
998)
C
lass
ical
-test
stat
istic
s
Not
e. S
horte
ned
vers
ions
prin
ted
in it
alic
wer
e ex
clud
ed fr
om th
is st
udy.
a A
lette
r (a-
f) w
as a
dded
to th
e te
st n
ame
whe
n in
the
sam
e ar
ticle
dev
elop
men
t of m
ultip
le sh
orte
ned
vers
ions
was
repo
rted.
b C
oeff
icie
nt a
lpha
the
test
con
stru
ctor
s rep
orte
d fo
r the
targ
et p
opul
atio
n. A
bed
et a
l. (2
011)
, Ben
nett
John
son
et a
l. (2
004)
, Mic
alle
f et a
l. (1
998)
, and
Ram
anai
ah e
t al.
(198
3) re
porte
d m
ultip
le e
stim
ates
; w
e ta
bula
ted
the
mea
n va
lue
(diff
eren
ces b
etw
een
estim
ates
wer
e at
mos
t .06
). c St
anda
rd d
evia
tion
the
test
con
stru
ctor
s rep
orte
d fo
r the
targ
et p
opul
atio
n. M
ical
lef e
t al.
(199
8) re
porte
d m
ultip
le e
stim
ates
; we
tabu
late
d th
e m
ean
valu
e (d
iffer
ence
s bet
wee
n es
timat
es w
ere
at m
ost 1
.50)
. d Te
st-s
horte
ning
stra
tegi
es a
re e
xpla
ined
in th
e A
ppen
dix.
𝑆c
4.8/
5.
5 3.6
3.6/
3.
4
𝑟b
.89
.88
.89
.92 .86
.85
.87
.87/
.8
9
.83
.86
.82
.78
.83
.75
.86/
.8
4
Targ
et p
opul
atio
n
Gen
eral
Gen
eral
Clin
ical
Gen
eral
Clin
ical
Clin
ical
Clin
ical
Clin
ical
Clin
ical
Gen
eral
Clin
ical
Gen
eral
/ C
linic
al
Clin
ical
Gen
eral
Gen
eral
Clin
ical
Clin
ical
Gen
eral
Gen
eral
Gen
eral
/ C
linic
al
Gen
eral
Lang
uage
Engl
ish
Engl
ish
Dut
ch
Dut
ch
Dut
ch
Engl
ish
Engl
ish
Engl
ish
Dut
ch
Dut
ch
Dut
ch
Fren
ch
Span
ish
Engl
ish
Engl
ish
Engl
ish
Engl
ish
Port
ugue
se
Japa
nese
Fren
ch
Engl
ish
Item
s inc
lude
d
1, 3
, 5, 7
, 9, 1
1, 1
3, 1
5, 1
7, 1
9
1, 3
, 5, 7
, 9, 1
1, 1
3, 1
5, 1
7, 1
9
1, 4
, 5, 7
, 8, 1
0, 1
2, 1
5, 1
6, 1
9
2, 4
, 5, 7
, 8, 1
1, 1
2, 1
5, 1
7, 1
8
2, 3
, 4, 8
, 11,
12,
15,
17,
19,
20
3, 4
, 6, 7
, 9, 1
2, 1
3, 1
4, 1
7, 1
8
1, 2
, 5, 8
, 10,
11,
15,
16,
19,
20
4, 5
, 7, 1
0, 1
2, 1
5, 1
6, 1
9
2, 4
, 8, 1
1, 1
2, 1
5, 1
7, 1
8
3, 4
, 11,
12,
15,
17,
19,
20
3, 5
, 12,
15,
16,
17,
18,
20
1, 5
, 9, 1
0, 1
2, 1
7, 2
0
1, 3
, 5, 6
, 12,
15,
17
1, 3
, 6, 1
5, 1
6, 1
7
5, 9
, 10,
12,
17,
20
5, 6
, 9, 1
2, 1
5, 1
6
X: 1
4, 1
8 / Y
: 3, 1
2, 1
7, 1
8
3, 5
, 12,
15,
17
1, 4
, 17,
20
# Ite
ms
10
10
10
10
10
10
10
10
8 8 8 8 7 7 6 6 6 6 5 5 4
Form
X Y
Y
Y
Y Y X X Y
Y
Y
Y
Y
X X Y
Y
X/Y Y
X
Test
nam
ea
Smith
et a
l. (1
983)
Spie
lber
ger e
t al.
(198
3)
Van
Kni
ppen
berg
et a
l.-a
(199
0)
Van
Kni
ppen
berg
et a
l.-b
(199
0)
Van
Kni
ppen
berg
et a
l.-c
(199
0)
Benn
ett J
ohns
on e
t al.
(200
4)
Bech
et a
l.-a
(200
9)
Bech
et a
l.-b
(200
9)
Van
Kni
ppen
berg
et a
l.-d
(199
0)
Van
Kni
ppen
berg
et a
l.-e
(199
0)
Van
Kni
ppen
berg
et a
l.-f (
1990
)
Mic
alle
f et a
l.-a
(199
8)
Perp
iñá-
Gal
vañ
et a
l. (2
011)
Ram
anai
ah e
t al.
(198
3)
Mar
teau
& B
ekke
r (19
92)
Chl
an e
t al.
(200
3)
Abe
d et
al.
(201
1)
Fior
avan
ti-Ba
stos
et a
l. (2
011)
Koi
zum
i et a
l. (1
998)
Mic
alle
f et a
l.-b
(199
8)
O'N
eil e
t al.
(196
9)

Chapter 5
110
Form X were replaced by new items. The six items from the original S-STAI were
replaced because some items had a stronger relation to depression than to anxiety and
because in certain populations other items had poor psychometric properties (Spielberger
et al., 1983). Both 20-item forms are still used in practice today (e.g., Chlan, Savik, &
Weinert, 2003; Marteau & Bekker, 1992). The data we used in our study were collected by
means of a Dutch translation of Form Y (Van der Ploeg, Defares, & Spielberger, 1980).
Both forms comprise ten items that assess state anxiety (e.g., “I feel tense”) and ten items
that are counter-indicative of state anxiety (e.g., “I feel calm”). Respondents have to rate
their answer on a 4-point scale ranging from 1 (i.e., not at all) to 4 (i.e., very much so).
Shortened versions of the S-STAI. A literature review yielded 21 different shortened
S-STAI versions, in Table 5.1 ranked from longest to shortest (column heading “# Items”).
In Google Scholar (scholar.google.com on April 20, 2012), we first searched for articles
which, in addition to “State-Trait Inventory”, included at least one of the terms “shortened”
“abbreviated”, or “short” in their title. This search resulted in six hits. Three articles
proposed a new shortened S-STAI version and described the shortened version’s
development, and the other three articles investigated the psychometric properties of a
shortened S-STAI version that was proposed elsewhere. Inspection of the references these
six articles provided revealed another 15 shortened S-STAI versions, each of which was
presented as a reliable and valid alternative to the 20-item S-STAI.
For each shortened S-STAI version, Table 5.1 also shows the form (X or Y) from
which the items were selected, the number of items selected, the items included in the short
version, the language, the target population, the reported reliability, the reported standard
deviation of the total-score distribution, and the strategy followed to arrive at the shortened
test version. The Appendix provides a brief description of the test-shortening strategies.

Shortening the S-STAI
111
Bennett Johnson et al. (2004) did not provide information about the specific items
included in their 10-item version, and neither did Koizumi (1998) for his 5-item version.
Since we needed this information to answer the research questions, we excluded these two
shortened versions from our study. From Form X, six shortened versions were derived.
Because Pedersen et al. (2010) used Form Y to collect their data and we used their data in
this study, we also excluded these six versions from our analysis. Finally, the 6-item
version Fioravanti-Bastos et al. (2011) proposed included several items from both forms
and was also excluded from our study. Thus, we addressed the research questions for 12
shortened S-STAI versions.
5.3.3 Data Analysis
For each of the 12 shortened versions used in this study (italicized in Table 5.1), we
selected the relevant items from the 20-item version, and at each of the first two time
points used coefficient alpha and Guttman’s (1945) lambda2 to estimate total-score
reliability for the particular shortened version (research question 1). In the same way, we
obtained the SEM estimates and the corresponding relative CI90%s (research question 2).
Because measurement properties such as reliability depend on the population in which the
test is used (Allen & Yen, 1979, pp. 34-36), we analyzed the shortened S-STAI versions
separately for the patients and their partners.
To study research question 3, we compared the degree of consistency to which
individuals were correctly classified into one of two diagnostic categories, and the power
to detect reliable individual change between the first two time points. To compare the
degree of consistency to which individuals were correctly classified into a diagnostic
category, we estimated the classification consistency (Emons et al., 2007). Emons et al.
(2007) defined classification consistency as the expected proportion of individuals for

Chapter 5
112
whom the test produces a correct classification in at least 90% of independent hypothetical
test replications. The estimate of the classification consistency we used is the proportion of
individuals in the sample whose CI % excludes the cut score. Different authors proposed
different cut scores for the 20-item S-STAI, ranging from cut score 40 (Pedersen et al.,
2010) to cut score 54 (Kvaal, Ulstein, Nordhus, & Engedal, 2005). Consistent with
Pedersen et al.’s (2010) study of ICD patients, we used a cut score equal to 40.
For each S-STAI version, classification consistency was estimated as follows. First,
a cut score for the shortened test was determined such that the proportion of individuals
classified into the diagnostic category was similar to the proportion for the 20-item version.
Second, using the SEM that was obtained for the shortened version, we computed for each
individual the CI90% and obtained the proportion of individuals whose CI90% excluded the
cut score.
To study the power to detect reliable individual change, we computed for each
shortened S-STAI version the corresponding SEM and for each individual his/her RC
index based on the two time points. Using the RCs, we obtained the proportion of
individuals who showed a significant change; that is, for whom 𝑅𝐶 ≤ −1.96 or 𝑅𝐶 ≥ 1.96. Changes of the classification consistency and the proportion of significant change
indicate the degree to which test shortening affects the usefulness of shortened S-STAI
versions for individual-decision making (research question 3).
5.4 Results
Table 5.2 provides the item means and the item-rest correlations (i.e., correlations
between the item score, say, on item 𝑗, and the total score on the remaining items except
item 𝑗; item-rest correlations ranged from .44 to .84). For each shortened S-STAI version,
for the patient sample Table 5.3 shows the total-score reliability (alpha, lambda2; research

Shortening the S-STAI
113
Table 5.2: Item mean scores and item-rest correlations for the 20-item S-STAI.
Patient sample Partner sample Time point 1 Time point 2 Time point 1 Time point 2 𝑗 Mean Item-rest Mean Item-rest Mean Item-rest Mean Item-rest
1 2.00 .78 1.84 .74 2.20 .81 2.00 .77 2 1.90 .71 1.74 .77 1.94 .73 1.81 .77 3 1.75 .71 1.50 .72 1.92 .76 1.73 .75 4 1.72 .74 1.51 .70 1.84 .72 1.71 .74 5 2.14 .73 1.90 .75 2.27 .75 1.95 .80 6 1.21 .47 1.20 .47 1.22 .54 1.20 .45 7 1.72 .66 1.53 .59 1.97 .60 1.79 .61 8 2.43 .72 2.22 .73 2.46 .75 2.26 .77 9 1.57 .67 1.39 .65 1.72 .63 1.58 .61
10 2.36 .72 2.14 .76 2.41 .77 2.17 .81 11 2.31 .77 2.14 .74 2.39 .79 2.15 .80 12 1.63 .70 1.49 .70 1.84 .77 1.65 .74 13 1.65 .71 1.44 .65 1.81 .76 1.61 .72 14 1.43 .48 1.38 .53 1.54 .44 1.52 .47 15 2.32 .79 2.09 .77 2.49 .81 2.28 .79 16 2.18 .72 2.00 .81 2.25 .77 2.05 .79 17 1.86 .69 1.68 .64 2.19 .73 2.00 .71 18 1.44 .59 1.36 .47 1.79 .66 1.66 .61 19 2.34 .65 2.16 .72 2.41 .76 2.23 .74 20 2.27 .82 2.06 .82 2.35 .84 2.20 .80
Note. Time point 1 = one day before ICD implantation of the patient; Time point 2 = 10 days after ICD implantation; 𝑗 = item number; Mean = Item mean; Item-rest = Item-rest score correlation.
question 1), measurement precision (SEM, CI, relative CI; research question 2),
classification consistency (CC) and individual-change statistics (Change; research question
3), and Table 5.4 shows these results for the partner sample. Shortening the S-STAI from
20 to 5 items led coefficients alpha and lambda2 (research question 1) to decrease from
approximately .96 to .85 across samples (tables 5.3 and 5.4). Following common rules of
thumb (Kline, 2000, p. 13; Nunnally & Bernstein, 1994, p. 265), researchers may consider
even the 5-item S-STAI, for which lambda2 = .86, suited for their research purposes.
Although SEMs were smaller and CIs shorter for shorter S-STAI versions than for longer

Chapter 5
114
Tabl
e 5.
3: T
est l
engt
h an
d re
liabi
lity
(Alp
ha, L
ambd
a2),
mea
sure
men
t pre
cisi
on (
SEM
, CI,
Rel C
I), a
nd c
lass
ifica
tion
cons
iste
ncy
(CC
) an
d
indi
vidu
al-c
hang
e (C
hang
e) fo
r sho
rten
ed S
-STA
I ver
sion
s (pa
tient
sam
ple)
.
Cha
nge
.33
.25
.25
.21
.24
.25
.21
.26
.23
.19
.24
.14
.22
Not
e. 𝐽= Te
st le
ngth
; Mea
n =
Mea
n S-
STA
I sco
re; A
lpha
= C
oeff
icie
nt a
lpha
; Lam
bda2
= G
uttm
an’s
Lam
bda2
; SEM
= S
tand
ard
erro
r of m
easu
rem
ent;
CI =
leng
th o
f 90%
co
nfid
ence
int
erva
l; R
el C
I =
Rel
ativ
e CI %;
𝐶𝐶 = Pro
porti
on o
f in
divi
dual
s w
hose
CI % ex
clud
ed 𝑋; Ch
ange
= P
ropo
rtion
of
indi
vidu
als
who
sho
wed
a s
igni
fican
t ch
ange
.
Afte
r IC
D im
plan
tatio
n
𝐶𝐶 .79
.77
.77
.77
.81
.73
.70
.75
.72
.66
.62
.62
.72
Rel
CI
.13
.18
.18
.19
.19
.21
.21
.21
.20
.21
.23
.23
.24
CI
8.22
5.72
5.59
5.92
5.82
5.33
5.23
5.16
5.03
4.67
4.38
4.44
3.82
SEM
2.50
1.74
1.70
1.80
1.77
1.62
1.59
1.57
1.53
1.42
1.33
1.35
1.16
Lam
bda2
.96
.91
.93
.91
.93
.91
.89
.91
.91
.90
.88
.87
.85
Alp
ha
.95
.91
.93
.90
.92
.90
.88
.90
.90
.89
.87
.85
.85
Mea
n
34.7
7
17.6
7
18.8
9
17.6
7
18.6
0
14.8
3
14.2
4
14.6
4
14.0
9
12.5
1
10.6
6
10.0
8
8.66
Bef
ore
ICD
impl
anta
tion
𝐶𝐶 .72
.62
.64
.72
.64
.68
.65
.69
.66
.62
.58
.52
.46
Rel
CI
.15
.19
.20
.19
.20
.22
.21
.21
.22
.23
.24
.25
.27
CI
8.85
6.02
6.28
5.92
6.15
5.59
5.30
5.26
5.43
5.00
4.64
4.84
4.24
SEM
2.69
1.83
1.91
1.80
1.87
1.70
1.61
1.60
1.65
1.52
1.41
1.47
1.29
Lam
bda2
.96
.92
.92
.92
.93
.90
.90
.91
.91
.90
.87
.86
.86
Alp
ha
.95
.92
.92
.92
.92
.90
.90
.91
.90
.89
.87
.84
.85
Mea
n
38.2
7
19.6
8
20.8
5
19.4
9
20.5
5
16.4
2
15.6
3
16.2
1
15.6
1
13.8
4
11.8
4
11.0
6
9.70
𝐽 20
10
10
10
10
8 8 8 8 7 6 6 5
Test
nam
e
Spie
lber
ger e
t al.
(198
3)
Spie
lber
ger e
t al.
(198
3)
Van
Kni
ppen
berg
et a
l.-a
(199
0)
Van
Kni
ppen
berg
et a
l.-b
(199
0)
Van
Kni
ppen
berg
et a
l.-c
(199
0)
Van
Kni
ppen
berg
et a
l.-d
(199
0)
Van
Kni
ppen
berg
et a
l.-e
(199
0)
Van
Kni
ppen
berg
et a
l.-f (
1990
)
Mic
alle
f et a
l.-a
(199
8)
Perp
iñá-
Gal
vañ
et a
l. (2
011)
Chl
an e
t al.
(200
3)
Abe
d et
al.
(201
1)
Mic
alle
f et a
l.-b
(199
8)

Shortening the S-STAI
115
Tabl
e 5.
4: T
est l
engt
h an
d re
liabi
lity
(Alp
ha, L
ambd
a2),
mea
sure
men
t pre
cisi
on (
SEM
, CI,
Rel C
I), a
nd c
lass
ifica
tion
cons
iste
ncy
(CC
) an
d
indi
vidu
al-c
hang
e (C
hang
e) fo
r sho
rten
ed S
-STA
I ver
sion
s (pa
rtne
r sam
ple)
.
Cha
nge
.32
.28
.33
.21
.28
.23
.20
.22
.24
.20
.23
.22
.18
Not
e. 𝐽= Te
st le
ngth
; Mea
n =
Mea
n S-
STA
I sco
re; A
lpha
= C
oeff
icie
nt a
lpha
; Lam
bda2
= G
uttm
an’s
Lam
bda2
; SEM
= S
tand
ard
erro
r of m
easu
rem
ent;
CI =
leng
th o
f 90%
conf
iden
ce i
nter
val;
Rel
CI
= R
elat
ive
CI %; 𝐶𝐶 = P
ropo
rtion
of
indi
vidu
als
who
se CI %
excl
uded
𝑋; Chan
ge =
Pro
porti
on o
f in
divi
dual
s w
ho s
how
ed a
sig
nific
ant
chan
ge.
Afte
r IC
D im
plan
tatio
n
𝐶𝐶 .79
.72
.75
.73
.73
.69
.68
.66
.66
.61
.54
.51
.65
Rel
CI
.13
.18
.17
.18
.17
.20
.20
.19
.20
.21
.22
.23
.24
CI
7.80
5.72
5.40
5.43
5.23
4.90
5.00
4.80
5.07
4.64
4.15
4.38
3.78
SEM
2.37
1.74
1.64
1.65
1.59
1.49
1.52
1.46
1.54
1.41
1.26
1.33
1.15
Lam
bda2
.96
.93
.94
.93
.94
.92
.91
.92
.92
.91
.89
.87
.88
Alp
ha
.96
.92
.94
.93
.94
.92
.91
.92
.91
.90
.89
.86
.87
Mea
n
37.4
5
19.3
1
20.0
8
19.2
6
19.9
2
15.8
2
15.5
1
15.8
5
15.4
4
13.4
7
11.4
7
10.7
1
9.61
Bef
ore
ICD
impl
anta
tion
𝐶𝐶 .78
.73
.68
.66
.76
.73
.70
.70
.72
.62
.57
.55
.69
Rel
CI
.14
.19
.20
.20
.18
.22
.21
.19
.21
.22
.24
.25
.25
CI
8.32
5.82
6.05
6.22
5.59
5.43
5.33
4.87
5.20
4.74
4.47
4.67
3.95
SEM
2.53
1.77
1.84
1.89
1.70
1.65
1.62
1.48
1.58
1.44
1.36
1.42
1.20
Lam
bda2
.96
.93
.94
.93
.94
.92
.91
.93
.92
.91
.89
.87
.88
Alp
ha
.96
.93
.93
.92
.94
.91
.91
.93
.92
.91
.89
.86
.88
Mea
n
41.0
2
21.3
7
22.1
4
21.1
8
21.8
2
17.4
8
16.9
4
17.4
1
17.0
8
14.9
8
12.7
7
11.7
9
10.6
9
𝐽 20
10
10
10
10
8 8 8 8 7 6 6 5
Test
nam
e
Spie
lber
ger e
t al.
(198
3)
Spie
lber
ger e
t al.
(198
3)
Van
Kni
ppen
berg
et a
l.-a
(199
0)
Van
Kni
ppen
berg
et a
l.-b
(199
0)
Van
Kni
ppen
berg
et a
l.-c
(199
0)
Van
Kni
ppen
berg
et a
l.-d
(199
0)
Van
Kni
ppen
berg
et a
l.-e
(199
0)
Van
Kni
ppen
berg
et a
l.-f (
1990
)
Mic
alle
f et a
l.-a
(199
8)
Perp
iñá-
Gal
vañ
et a
l. (2
011)
Chl
an e
t al.
(200
3)
Abe
d et
al.
(201
1)
Mic
alle
f et a
l.-b
(199
8)

Chapter 5
116
versions, relative CI % s (research question 2) increased sharply for all samples (tables 5.3
and 5.4). For the 20-item test, relative CI % s covered approximately one-seventh of the
scale range, whereas for the 5-item test they covered approximately one-quarter of the
scale range.
Shortening the S-STAI also resulted in a lower classification consistency (CC in
tables 5.3 and 5.4; research question 3), but the magnitude of the decrease varied
considerably across samples (tables 5.3 and 5.4). For the 20-item S-STAI, before ICD
implantation (time point 1) 72% of the patients were classified with sufficient certainty as
non-anxious or anxious and this percentage reduced to 46% for the 5-item S-STAI.
However, after ICD implantation (time point 2) classification consistency for the patients
was ambiguous. As the S-STAI versions grew shorter, classification consistency tended to
decrease but not monotonically; classification consistency was higher for the 5-item S-
STAI (Grissom & Kim, 2012) than for some of the longer S-STAI versions. For the
partners, at both measurement occasions shortening the S-STAI from 20 to 6 items resulted
in a decrease of classification consistency from 78% to 55% (time point 1) and from 79%
to 51% (time point 2), but for the 5-item S-STAI classification consistency was equal to 69%
(time point 1) and 65% (time point 2). Thus, also for the partners the 5-item S-STAI
produced better classification consistency than some of the longer S-STAI versions but
worse results than the longest S-STAI version.
The proportion of individuals who showed a significant change was rather small for
all S-STAI versions and, as expected, shorter S-STAI versions (research question 3)
produced even smaller proportions of individuals who showed a significant change (tables
5.3 and 5.4). For example, using the 20-item S-STAI, approximately 33% of the patients
and their partners showed a significant change, but for the shortened versions this
percentage was approximately 23%.

Shortening the S-STAI
117
The proportion of individuals who showed a significant change was larger for some
shorter versions than for some longer versions. For example, after the ICD implantation the
6-item S-STAI version Abed et al. (2011) developed suggested 14% of the patients
changed significantly but the 5-item version Micallef et al. (1998) developed suggested 22%
of the patients changed significantly.
5.5 Discussion
In this study, we examined the measurement properties of 12 shortened S-STAI
versions. The effect of test shortening on total-score reliability was small (research
question 1), the effect on measurement precision was large (research question 2), and the
effect on individual diagnosis and assessment of individual change was ambiguous
(research question 3). Implications for the practical use of shortened S-STAI versions are
the following.
First, using shortened S-STAI versions for research purposes has negligible effects
on statistical power and attenuation bias in effect-size estimates. All shortened versions
had adequate reliability in excess of .85, and none suffered from a substantial loss of
reliability compared to the original 20-item version. For example, when two groups are
compared with respect to mean test scores based on perfectly reliably measured state
anxiety, a Cohen’s d (Cohen, 1988, p. 20) value equal to .50 reduces to .49 when reliability
drops to .95, and d further reduces to .45 when reliability further drops to .85. Using the
conventional rules of thumb for Cohen’s d (Cohen, 1988, p. 40), this extra bias does not
lead do different substantive conclusions.
Second, with respect to the usefulness of shortened S-STAI versions results varied
for diagnosing highly-anxious individuals and measuring individual change. Shortened
versions tended to produce higher risks of erroneous decision-making compared to the 20-

Chapter 5
118
item version, but we did not find a monotone relation with test length. For example, for the
Micallef et al. (1998) 5-item version the proportion of individuals that can be reliably
classified as either anxious or non-anxious was higher than for several longer S-STAI
versions. The classification consistency for one of Knippenberg’s (1990) 10-item tests was
as good as or even slightly better than for the 20-item version.
For individual decision-making the effect of test shortening was found to depend on
the set of selected items. Results also show that precision of individual decision-making
cannot be inferred from total-score reliability, but must be investigated separately in the
target population. The analysis should take into account whether time savings justify the
increased number of erroneous decisions.
Removing S-STAI items may also negatively affect validity of anxiety
measurement. Anxiety is a complex psychological attribute, composed of different facets
including restlessness and feelings of fear and concern. To have adequate construct
coverage the total score has to represent all facets. When items are selected on the basis of
statistical criteria, such as high inter-correlations, the result may be a scale that measures
one specific anxiety facet possibly resulting in questionable construct validity. Narrowing
anxiety may also negatively affect the scale’s predictive validity.
To conclude, the reliability of shortened S-STAI versions is acceptable for research
purposes, but measurement precision may be problematic for individual decision-making.
Before one selects a shortened version of the S-STAI for diagnosing highly-anxious
individuals and measuring individual change, test users should consider the potential
higher risk of making incorrect decisions about individuals in the target population. In
general, because we believe that psychologists should opt for tests that have good
reliability, measurement precision, and validity, the 20-item S-STAI is the best choice.

Shortening the S-STAI
119
Appendix: Description of Strategies Used to Shorten the S-STAI
Test-shortening strategy (in alphabetic order) Description Classical test statistics Selecting items using classical test theory statistics (e.g., selecting items that
have the highest item-rest correlations) Exploratory factor analysis Selecting items using exploratory factor analysis (e.g., selecting items that
have the highest factor loadings) Judgment of test constructors
Selecting items that best represent state anxiety according to the test constructors
Judgment of target population
Selecting items that best represent state anxiety according to members of the target population
Negatively worded items Selecting the items that assess state anxiety Odd-numbered items Selecting the odd-numbered items Positively and negatively worded items
Selecting an equal number of indicative and counter-indicative items
Positively worded items Selecting the items that are counter indicative of state anxiety Regression analysis Selecting items using regression analysis (e.g., selecting items with the largest
regression weights)

Chapter 5
120

121
Chapter 6: Conclusion and discussion

Chapter 6
122

Conclusions and discussion
123
6.1 Conclusion
Several test users prefer psychological tests and questionnaires that are as short as
possible containing, say, at most 15 items. However, test shortening makes total scores
more vulnerable to measurement error and the question arises whether short tests are suited,
in particular, for making decisions about individuals. In this PhD thesis, we investigated to
what extent test shortening impairs the quality of individual decision-making. We
conducted a literature review (Chapter 2), several simulation studies (chapters 1, 3 and 4),
and we reanalyzed an empirical data set collected by means of an anxiety test of which
several shortened versions have been reported in the literature (Chapter 5). Based on our
research, the following answers can be provided to the four research questions stated in
Chapter 1.
1. To what extent do psychologists pay attention to the consequences of using short tests
for making decisions about individuals?
Among 2,273 reviewed articles in six psychological journals, 164 shortened tests
were reported (Chapter 2). On average, these shortened tests were half the length of the
original versions. In Chapter 5, we reviewed several shortened versions of the 20-item
State scale of State-Trait Anxiety Inventory (S-STAI, Spielberger, Gorsuch, & Lushene,
1970; Spielberger, Gorsuch, Lushene, Vagge, & Jacobs, 1983) consisting of four through
ten items. We concluded that authors generally considered a test suited for individual
decision-making if the reliability exceeded a particular lower bound that is generally
accepted as a rule of thumb (e.g., Kline, 2000, p. 13; Nunnally & Bernstein, 1994, p. 265).
Test constructers and test users often do not realize that reliability is a group
characteristic and bears little information about the precision with which individual
persons are measured and decisions about individuals on the basis of their total scores are

Chapter 6
124
made (Mellenbergh, 1996; Sijtsma, 2009a). Knowing that the reliability of the total score
equals, say, .90, helps little to decide if a particular student needs additional reading help or
if a patient benefited from a treatment on the basis of their fallible total scores (chapters 3,
4 and 5). Also, psychologists may be interested in the proportion of persons for which the
correct decision was made in a particular test administration (i.e., expressed by the
specificity, sensitivity, or predictive values), but also this proportion conveys insufficient
information about the risk of making incorrect decisions about individuals (Chapter 3).
2. How should one assess the risk of making incorrect individual decisions?
The usefulness of a test for making decisions about individuals depends on the
test’s measurement precision (Harvill, 1991; Mellenbergh, 1996; Nunnally & Bernstein,
1994, p. 260; Sijtsma & Emons, 2011). Measurement precision refers to the precision of a
total score as an estimate of the true score. The standard error of measurement, denoted
SEM and derived from total-score reliability and the standard deviation of the total-score
distribution in the group under consideration, is often used in a classical test theory context
to express measurement precision. For a fixed test length, the smaller the SEM, the more
precise is the total score as an estimate of an individual’s true score expressed by the
confidence interval for the true score and, consequently, the smaller is the risk of making
incorrect decisions about individuals (see Chapter 1 and Chapter 5).
The risk of making decision errors varies across persons. In particular, the closer
the true score is to the cut score used in a decision problem, the higher is the risk of making
an incorrect decision (Chapter 3). For each person, we can derive the detection rate, which
is defined as the proportion of (hypothetical) test replications for which the correct
decision about the individual is made. For detecting individual change between two test
administrations, detection rates express the power of drawing the correct conclusions about

Conclusions and discussion
125
an individual’s true-score change. We used item response theory to simulate test
replications, and studied individual-level detection rates to assess whether short tests are
suited for detecting individual change in clinical applications (Chapter 4).
If classification of individuals is pursued, psychologists using a particular test may
be interested in the proportion of persons for whom the risk of making an incorrect
decision is acceptably low, say, below .10. This proportion is referred to as the
classification consistency (Emons, Sijtsma, & Meijer, 2007). Again, we used item response
theory to simulate test replications and used classification consistency to study the
suitability of short tests in personnel selection (Chapter 3).
3. To what extent does test shortening increase the risk of making incorrect individual
decisions?
Throughout this thesis, for short tests we found that total-score reliability can
appear to be high enough according to accepted rules of thumb but that simultaneously the
corresponding measurement precision may be low and lead to unacceptable large numbers
of incorrect decisions about individuals based on their total scores (chapters 1, 2, and 5). In
general, detection rates and classification consistency dropped considerably as tests grew
shorter. Test shortening led to the selection of fewer suited applicants especially when base
rates or selection ratios were low (Chapter 3). In pre-treatment post-treatment designs, we
found that test shortening resulted in a higher risk of concluding that a client, who actually
improved or deteriorated, remained stable in the course of a treatment also when his true-
score change was large (Chapter 4).
The increased risk of making incorrect individual decisions as a result of test
shortening can be illustrated by comparing SEM and scale length (Sijtsma, 2009a). SEM
and scale length both depend on the number of items, and removing items from a test
Chapter 6
126
reduces both SEM and scale length but SEM reduces more slowly than scale length. As a
result, total-score differences (that are larger as the scale grows longer) are sooner found to
be significant on a longer scale than on a shorter scale (chapters 1, 2, and 5). Test
shortening produced lower detection rates and classification consistency because
measurement precision decreased and because true scores were closer to the cut score on
short scales tests than they were on long scales (Chapter 3 and Chapter 4).
4. What are minimal test-length requirements for making decisions about individuals with
sufficient certainty?
We found that using short tests instead of long tests may result in an unacceptable
high risk of making incorrect decisions for a large number of individuals tested. As a rule,
we propose to use tests containing at least 20 items to keep the risk of making incorrect
decisions at acceptable levels for the vast majority of individuals. We advise psychologists
to investigate the consequences of test shortening for individual decision-making before
using a particular test in practice. In particular, we recommend assessing the consequences
of test shortening for measurement precision, detection rates, and classification consistency.
Some authors claim that test shortening is justified when one retains the items that
have optimal psychometric properties in the test, thus resulting in a total-score reliability
that has reduced as little as possible (e.g., Fu, Liu, & Yip, 2007; Marteau & Bekker, 1992;
Olatunji et al., 2010). In the simulation studies reported in Chapter 3 and Chapter 4, we
manipulated three item properties. The item properties were item scoring (dichotomous
versus polytomous), item discrimination (medium versus high) and dispersion of the item-
step difficulties (small versus large). Furthermore, we kept items in the shorter test
versions of which the item difficulties were optimal for the particular decision problem; for
example, we maintained items with difficulties close to or equal to the cut score. Lastly, we

Conclusions and discussion
127
investigated the risk of misclassifications and incorrect decisions about individual change
for different shortened S-STAI versions that had an equal length but contained (partly)
different item subsets (Chapter 5).
In the simulation studies, we found that the relationship between test length and the
risk of making incorrect individual decisions was independent of the item properties
(Chapter 3 and Chapter 4). The risk of making decision errors for short test was
considerably higher than for long tests even if item difficulties were close to the cut score
or otherwise adapted to the selection problem at hand. In the empirical study using the S-
STAI, we also found in general a higher risk of making mistakes for shortened S-STAI
versions than for the original version, but the magnitude varied across samples and
shortened versions (Chapter 5). The empirical S-STAI study showed that the measurement
properties of shortened tests always need to be investigated with respect to the application
envisaged.
Psychologists may disagree about the risk of making incorrect decisions they are
willing to take. Utility plays a central role in distinguishing tolerable and intolerable risks.
That is, expected benefits and costs of incorrect of correct decisions for the tested
individual, the testing organization and society should be considered. However, we
emphasize that psychologists have the ethical obligation to make decisions about
individuals based on reliable data irrespective of other considerations (e.g., American
Educational Research Association, American Psychological Association, & National
Council on Measurement in Education, 1999, p. 120; International Test Commission, 2000,
p. 12). To summarize, we believe that test users should opt for tests that have maximum
reliability and measurement precision, and therefore we recommend using long tests of at
least 20 items for individual decision-making.

Chapter 6
128
6.2 Discussion
Short tests are not only used in individual diagnostics but also in scientific research
to study general behavioral laws involving group means and relationships between group
characteristics. In the literature review (Chapter 2), we found that some researchers
considered shortened tests with reliabilities lower than .60 suited for empirical research.
However, previous research showed that low-reliability tests may bias group results, and
this bias can often not be compensated by using larger samples (Hutcheon, Chiolero, &
Hanley, 2010; Sijtsma & Emons, 2011). For example, Sijtsma and Emons (2011) found
that the observed correlation between two tests decreased from .54 to .44 when the
reliability of one of the tests dropped from .90 to .60 (given that the true-score correlation
was .60. and that the reliability of the other test remained .90).
Given the practical need for short tests, further research may explore computer
adaptive testing (CAT) as an alternative to short stand-alone tests that are the same to each
tested person. For each person, based on the answers to the previous items CAT determines
which item should next be selected from the item bank and administered to the tested
person. Because the item set is tailored to the person’s scale level, CAT may result in tests
that are considerably shorter than standard tests. We encourage researchers to investigate if
detection rates and classification consistency are higher for CATs than for short stand-
alone tests that have the same length as a CAT. One may ask whether sufficiently many
items can be constructed to obtain acceptable measurement precision for all persons,
especially for those individuals with extreme true scores.
The question arises whether alternatives are available that help to decrease some
researchers’ and practitioners’ aversion against long psychological tests and questionnaires.
For example, researchers found that people decide to participate in clinical research,
epidemiologic studies and survey research by balancing the anticipated burden of

Conclusions and discussion
129
cooperating and the expected psychical and emotional benefits (e.g., Galea & Tracy, 2007;
Verheggen, Nieman, & Jonkers, 1998). Increasing the perceived benefit of participation
may also result in an increase of persons’ willingness to fill out longer tests and
questionnaires.

130

131
References

132

References
133
Abed, M. A., Hall, L. A., & Moser, D. K. (2011). Spielberger's State Anxiety Inventory: Development of a shortened version for critically ill patients. Issues in Mental Health Nursing, 32, 220-227.
Alden, L. E., Wiggins, J. S., & Pincus, A. L. (1990). Construction of circumplex scales for the Inventory of Interpersonal Problems. Journal of Personality Assessment, 55, 521-536.
Allen, M. J., & Yen, W. M. (1979). Introduction to measurement theory. Monterey, CA.: Brooks/Cole.
American Educational Research Association, American Psychological Association, & National Council on Measurement in Education. (1985). Standards for educational and psychological testing. Washington, DC: American Educational Research Association.
American Educational Research Association, American Psychological Association, & National Council on Measurement in Education. (1999). Standards for educational and psychological testing. Washington, DC: American Educational Research Association.
Anastasi, A. (1982). Psychological testing (5th ed.). New York: Macmillan. Arthur, W., & Day, D. V. (1994). Development of a short-form for the Raven Advanced
Progressive Matrices. Educational and Psychological Measurement, 54, 394-403. Arvey, R. D., & Renz, G. L. (1992). Fairness in the selection of employees. Journal of
Business Ethics, 11, 331-340. Atkins, D. C., Bedics, J. D., McGlinchey, J. B., & Beauchaine, T. P. (2005). Assessing
clinical significance: Does it matter which method we use? Journal of Consulting and Clinical Psychology, 73, 982-989.
Baron, H., & Austin, J. (2000). Measuring ability via the Internet: Opportunities and issues. Paper presented at the Annual Conference of the Society for Industrial and Organizational Psychology, New Orleans, LA.
Bartram, D., & Hambleton, R. K. (Eds.). (2006). Computer-based testing and the Internet: Issues and advances. West Sussex, England: Wiley & Sons.
Bauer, S., Lambert, M. J., & Nielsen, S. L. (2004). Clinical significance methods: A comparison of statistical techniques. Journal of Personality Assessment, 82, 60-70.
Bech, P., Gormsen, L., Loldrup, D., & Lunde, M. (2009). The clinical effect of clomipramine in chronic idiopathic pain disorder revisited using the Spielberger State Anxiety Symptom Scale (SSASS) as outcome scale. Journal of Affective Disorders, 119, 43-51.
Beck, A. T., & Beck, R. W. (1972). Screening depressed patients in family practice. A rapid technic. Postgraduate Medicine, 52, 81-85.
Bennett Johnson, S. B., Baughcum, A. E., Carmichael, S. K., She, J. X., & Schatz, D. A. (2004). Maternal anxiety associated with newborn genetic screening for type 1 diabetes. Diabetes Care, 27, 392-397.
Bentler, P. A., & Woodward, J. A. (1980). Inequalities among lower bounds to reliability: With applications to test construction and factor analysis. Psychometrika, 45, 249-267.
Berk, R. A. (1986). A consumer’s guide to setting performance standards on criterion-referenced tests. Review of Educational Research, 56, 137-172.
Betz, D. L., & Hill, L. G. (2005). Revisiting the retrospective pretest. American Journal of Evaluation, 26, 501-517.
Born, M., & Scholarios, D. (2005). Decision making in selection. In A. V. A. M. Evers, N. Anderson & O. O. Smit-Voskuijl (Eds.), The Blackwell handbook of selection (pp. 267-290). Malden, MA: Blackwell.

134
Borsboom, D., Mellenbergh, G. J., & Van Heerden, J. (2004). The concept of validity. Psychological Review, 111, 1061-1071.
Borsboom, D., Romeijn, J., & Wicherts, J. M. (2008). Measurement invariance versus selection invariance: Is fair selection possible? Psychological Methods, 13, 75-98.
Brown, W. (1910). Some experimental results in the correlation of mental abilities. British Journal of Psychology, 3, 296–322.
Burisch, M. (1997). Test length and validity revisited. European Journal of Personality, 11, 303-315.
Butcher, J. N., & Hostetler, K. (1990). Abbreviating MMPI item administration: What can be learned from the MMPI for the MMPI—2? Psychological Assessment, 2, 12-21.
Caldwell, D. F., & O'Reilly III, C. A. (1990). Measuring person-job fit with a profile-comparison process. Journal of Applied Psychology, 75, 648-657.
Campbell, J. P. (1979). Problems and new directions for industrial psychology. In M. D. Dunnette (Ed.), Handbook of industrial and organizational psychology (pp. 185-222). Chicago, IL: Rand McNally.
Candell, G. L., & Drasgow, F. (1988). An iterative procedure for linking metrics and assessing item bias in item response theory. Applied Psychological Measurement, 12, 253-260.
Cascio, W. F. (1980). Responding to the demand for accountability: A critical analysis of three utility models. Organizational Behavior and Human Performance, 25, 32-45.
Cella, D., Yount, S., Rothrock, N., Gershon, R., Cook, K., Reeve, B., et al. (2007). The Patient-Reported Outcomes Measurement Information System (PROMIS): Progress of an NIH Roadmap cooperative group during its first two years. Medical Care, 45, S1-S11.
Charter, R. A. (2003). A breakdown of reliability coefficients by test type and reliability method, and the clinical implications of low reliability. The Journal of General Psychology, 130, 290-304.
Chlan, L., Savik, K., & Weinert, C. (2003). Development of a shortened state anxiety scale from the Spielberger State-Trait Anxiety Inventory (STAI) for patients receiving mechanical ventilatory support. Journal of Nursing Measurement, 11, 283-293.
Clark, L. A., & Watson, D. (1995). Constructing validity: Basic issues in objective scale development. Psychological Assessment, 7, 309-319.
Cohen, A. S., Kim, S. H., & Baker, F. B. (1993). Detection of differential item functioning in the Graded Response Model. Applied Psychological Measurement, 17, 335-350.
Cohen, J. (1988). Statistical power analysis for the behavioral sciences (2nd ed.). New York: Psychology Press.
Compare, A., Molinari, E., Bellardita, L., Villani, A., Branzi, G., Malfatto, G., et al. (2006). Cardiological and psychological mobile care through telematic technologies for heart failure patients: ICAROS Project. In E. Molinari, A. Compare & G. Parati (Eds.), Clinical psychology and heart disease (pp. 181-206). New York: Springer.
Cook, M. (2009). Personnel selection: Adding value through people (5th ed.). London: Wiley-Blackwell.
Cook, T. D., & Campbell, D. T. (1979). Quasi-experimentation: Design and analysis for field settings. Chicago, Il: Rand McNally.
Cooper, A., & Petrides, K. V. (2010). A psychometric analysis of the Trait Emotional Intelligence Questionnaire-Short Form (TEIQue-SF) using Item Response Theory. Journal of Personality Assessment, 92, 449-457.
Costa, P. T., & McCrae, R. R. (1992). The NEO PI/FFI manual supplement. Odessa, FL: Psychological Assessment Resources.

References
135
Coste, J., Guillemin, F., Pouchot, J., & Fermanian, J. (1997). Methodological approaches to shortening composite measurement scales. Journal of Clinical Epidemiology, 50, 247-252.
Cox, L. S., Tiffany, S. T., & Christen, A. G. (2001). Evaluation of the brief questionnaire of smoking urges (QSU-brief) in laboratory and clinical settings. Nicotine & Tobacco Research, 3, 7-16.
Cronbach, L. J., & Furby, L. (1970). How we should measure "change"—Or should we? Psychological Bulletin, 74, 68-80.
Cronbach, L. J., & Gleser, G. C. (1953). Assessing similarity profiles. Psychological Bulletin, 50, 456-473.
Crowder, B., & Michael, W. B. (1991). The development and validation of a short form of a multidimensional self-concept measure for high technology employees. Educational and Psychological Measurement, 51, 447-454.
Dailey, Y. M., Humphris, G. M., & Lennon, M. A. (2002). Reducing patients' state anxiety in general dental practice: A randomized controlled trial. Journal of Dental Research, 81, 319-322.
Dalen, L. H., Stanton, N. A., & Roberts, A. D. (2001). Faking personality questionnaires in personnel selection. The Journal of Management Development, 20, 729-741.
Deady, M. (2009). A review of screening, assessment and outcome measures for drug and alcohol settings. Retrieved June 11, 2012, from http://www.ntcoss.org.au/sites/www.ntcoss.org.au/files
Derogatis, L. R. (2001). Brief Symptom Inventory (BSI): 18 Administration, scoring and procedures manual. Minneapolis, MN: NCS Pearson.
Derogatis, L. R., & Melisaratos, N. (1983). The Brief Symptom Inventory: An introductory report. Psychological Medicine, 13, 595-605.
Dilchert, S. (2007). Peaks and valleys: Predicting interests in leadership and managerial positions from personality profiles. International Journal of Selection and Assessment, 15, 317-334.
Drasgow, F., Nye, C. D., & Tay, L. (2010). Indicators of quality assessment. In J. C. Scott & D. H. Reynolds (Eds.), Handbook of workplace assessment: Evidence-based practices for selecting and developing organizational talent (pp. 27-60). San Francisco, CA: Jossey-Bass.
Edwards, J. R. (1993). Problems with the use of profile similarity indexes in the study of congruence in organizational research. Personnel Psychology, 46, 641-665.
Ellis, P. D. (2010). The essential guide to effect sizes: Statistical power, meta-analysis, and the interpretation of research results. Cambridge, United Kingdom: Cambridge University.
Embretson, S. E., & Reise, S. P. (2000). Item response theory for psychologists. Mahwah, N.J.: Erlbaum Associates.
Emons, W. H. M., Sijtsma, K., & Meijer, R. R. (2007). On the consistency of individual classification using short scales. Psychological Methods, 12, 105-120.
Ercikan, K., & Julian, M. (2002). Classification accuracy of assigning student performance to proficiency levels: Guidelines for assessment design. Applied Measurement in Education, 15, 269 - 294.
Evans, C., Connell, J., Barkham, M., Margison, F., McGrath, G., Mellor-Clark, J., et al. (2002). Towards a standardised brief outcome measure: Psychometric properties and utility of the CORE—OM. The British Journal of Psychiatry, 180, 51-60.
Evers, A. V. A. M., Sijtsma, K., Lucassen, W., & Meijer, R. R. (2010). The Dutch review process for evaluating the quality of psychological tests: History, procedure and results. International Journal of Testing, 10, 295-317.

136
Feeney, F., Egan, S., & Gasson, N. (2005). Treatment of depression and anxiety in Parkinson’s Disease: A pilot study using group cognitive behavioural therapy. Clinical Psychologist, 9, 31-38.
Feske, U. (2001). Treating low-income and African-American women with posttraumatic stress disorder: A case series. Behavior Therapy, 32, 585-601.
Finkelman, M. D., Weiss, D. J., & Kim-Kang, G. (2010). Item selection and hypothesis testing for the adaptive measurement of change. Applied Psychological Measurement, 34, 238-254.
Fioravanti-Bastos, A. C. M., Cheniaux, E., & Landeria-Fernandez, J. (2011). Development and validation of a short-form version of the Brazilian state-trait anxiety inventory. Psicologia: Reflexão e Crítica, 24, 485-494.
Fontana, A., & Rosenheck, R. (1994). A short form of the Mississippi scale for measuring change in Combat-Related PTSD. Journal of Traumatic Stress, 7, 404-414.
Forsythe, C., Grose, E., & Ratner, J. (1998). Human factors and Web development. Mahwah, N.J.: Erlbaum Associates.
Fraley, R. C., Waller, N. G., & Brennan, K. A. (2000). An item response theory analysis of self-report measures of adult attachment. Journal of Personality and Social Psychology, 78, 350-365.
Fu, K., Liu, K. Y., & Yip, P. S. F. (2007). Predictive validity of the Chinese version of the Adult Suicidal Ideation Questionnaire: Psychometric properties and its short version. Psychological Assessment, 19, 422-429.
Furze, G., Bull, P., Lewin, R. J. P., & Thompson, D. R. (2003). Development of the York Angina Beliefs Questionnaire. Journal of Health Psychology, 8, 307-315.
Galea, S., & Tracy, M. (2007). Participation rates in epidemiologic studies. Annals of Epidemiology, 17, 643-653.
Gardner, D. G., Cummings, L. L., Dunham, R. B., & Pierce, J. L. (1998). Single-item versus multiple-item measurement scales: An empirical comparison. Educational and Psychological Measurement, 58, 898-915.
Gardner, D. G., Dunham, R. B., Cummings, L. L., & Pierce, J. L. (1989). Focus of attention at work: Construct definition and empirical validation. Journal of Occupational Psychology, 62, 61-77.
Garland, A., Kruse, M., & Aarons, G. (2003). Clinicians and outcome measurement: What's the use? The Journal of Behavioral Health Services and Research, 30, 393-405.
George, S. M., Connor, J. P., Gullo, M. J., & Young, R. M. (2010). A prospective study of personality features predictive of early adolescent alcohol misuse. Personality and Individual Differences, 49, 204-209.
Glaros, A. G., & Kline, R. B. (1988). Understanding the accuracy of tests with cutting scores: The sensitivity, specificity, and predictive value model. Journal of Clinical Psychology, 44, 1013-1023.
Goldberg, L. R. (1992). The development of markers for the Big-Five Factor Structure. Psychological Assessment, 4, 26-42.
Gosling, S. D., Rentfrow, P. J., & Swann, Jr., W. B. (2003). A very brief measure of the Big-Five personality domains. Journal of Research in Personality, 37, 504-528.
Grissom, R. J., & Kim, J. J. (2012). Effect sizes for research: Univariate and multivariate applications (2nd ed.). New York: Routledge.
Guion, R. M. (1976). Recruiting, selection, and job placement. In M. D. Dunnette (Ed.), Handbook of industrial and organizational psychology (pp. 777-828). Chicago, IL: Rand McNally.

References
137
Guttman, L. (1945). A basis for analyzing test-retest reliability. Psychometrika, 10, 255-282.
Guyatt, G., Water, S., & Norman, G. (1987). Measuring change over time: Assessing the usefulness of evaluative instruments. Journal of Chronic Diseases, 40, 171-178.
Ham, L. S., Stewart, S. H., Norton, P. J., & Hope, D. A. (2005). Psychometric assessment of the Comprehensive Effects of Alcohol Questionnaire: Comparing a brief version to the original full scale. Journal of Psychopathology and Behavioral Assessment, 27, 141-158.
Hambleton, R. K., & Slater, S. C. (1997). Reliability of credentialing examinations and the impact of scoring models and standard-setting policies. Applied Measurement in Education, 10, 19-38.
Harvill, L. M. (1991). An NCME instructional module on standard error of measurement. Educational Measurement: Issues and Practices, 10, 33-41.
Harwell, M. R., & Janosky, J. E. (1991). An empirical study of the effects of small datasets and varying prior variances on item parameter estimation in BILOG. Applied Psychological Measurement, 15, 279-291.
Higgins, J. P. T., & Green, S. (Eds.). (2011). Cochrane handbook for systematic reviews of interventions: Version 5.1.0 [updated March 2011]. The Cochrane Collaboration. Available from www.cochrane-handbook.org.
Hofsess, C. D., & Tracey, T. J. G. (2005). The interpersonal circumplex as a model of interpersonal capabilities. Journal of Personality Assessment, 84, 137-147.
Howard, G. S., & Dailey, P. R. (1979). Response-shift bias: A source of contamination of self-report measures. Journal of Applied Psychology, 64, 144-150.
Hutcheon, J. A., Chiolero, A., & Hanley, J. A. (2010). Random measurement error and regression dilution bias. British Medical Journal, 340, 1402-1406.
International Test Commission. (2000). International guidelines for test use. Retrieved June 4, 2012, from www.intestcom.org
Jacobson, N. S., Follette, W. C., & Revenstorf, D. (1984). Psychotherapy outcome research: Methods for reporting variability and evaluating clinical significance. Behavior Therapy, 15, 336-352.
Jacobson, N. S., & Truax, P. (1991). Clinical significance: A statistical approach to defining meaningful change in psychotherapy research. Journal of Consulting and Clinical Psychology, 59, 12-19.
Judge, T. A., Erez, A., Bono, J. E., & Thoresen, C. J. (2003). The core self-evaluations scale: Development of a measure. Personnel Psychology, 56, 303-331.
Kaiser, R. B., Lindberg, J. T., & Craig, S. B. (2007). Assessing the flexibility of managers: A comparison of methods. International Journal of Selection and Assessment, 15, 40-55.
Kline, P. (2000). The handbook of psychological testing (2nd ed.). London: Routledge. Koizumi, N., Fujita, D., Ninomiya, R., & Nakamoto, N. (1998). Screening test by
statistically reducing the number of the State-Trait Anxiety Inventory (STAI) items. Sangyo Eiseigaku Zasshi, 40, 107-112.
Konradt, U., Hertel, G., & Joder, K. (2003). Web-based assessment of call center agents: Development and validation of a computerized instrument. International Journal of Selection and Assessment, 11, 184-193.
Krebs, E. E., Lorenz, K. A., Bair, M. J., Damush, T. M., Wu, J., Sutherland, J. M., et al. (2009). Development and initial validation of the PEG, a three-item scale assessing pain intensity and interference. Journal of General Internal Medicine 24, 733-738.

138
Kruyen, P. M., Emons, W. H. M., & Sijtsma, K. (2012). Test Length and decision quality in personnel selection: When is short too short? International Journal of Testing, 12, 321-344.
Kvaal, K., Ulstein, I., Nordhus, I. H., & Engedal, K. (2005). The Spielberger State-Trait Anxiety Inventory (STAI): the state scale in detecting mental disorders in geriatric patients. International Journal of Geriatric Psychiatry, 20, 629-634.
Lawing, K., Frick, P. J., & Cruise, K. R. (2010). Differences in offending patterns between adolescent sex offenders high or low in callous–unemotional traits. Psychological Assessment, 22, 298-305.
Levenson, H. (1973). Multidimensional locus of control in psychiatric patients. Journal of Consulting and Clinical Psychology, 41, 397-404.
Levy, P. (1968). Short-form tests: A methodological review. Psychological Bulletin, 69, 410-416.
Liang, M. H. (2000). Longitudinal construct validity: Establishment of clinical meaning in patient evaluative instruments. Medical Care, 38, II-84-II-90.
Lissitz, R. W. (2009). The concept of validity: revisions, new directions, and applications. Charlotte, NC: Information Age Publishing.
Lonner, W. J., & Ibrahim, F. A. (1989). Assessment in cross-cultural counseling. In P. B. Pedersen, J. C. Draguns, W. J. Lonner & J. E. Trimble (Eds.), Counseling across cultures (3rd ed.). Honolulu, HI: Univeristy of Hawaii Press.
Lord, F. M. (1956). The measurement of growth. Educational and Psychological Measurement, 16, 421-437.
Lord, F. M., & Novick, M. R. (1968). Statistical theories of mental test scores. Reading, MA: Addison-Wesley.
Lord, F. M., & Wingersky, M. S. (1984). Comparison of IRT true-score and equipercentile observed-score “equatings”. Applied Psychological Measurement, 8, 453– 461.
Lovibond, S. H., & Lovibond, P. F. (1995). Manual for the Depression Anxiety Stress Scales (2nd ed.). Sydney: Psychology Foundation.
Luttik, M. L. A., Jaarsma, T., Sanderman, R., & Fleer, J. (2011). The advisory brought to practice Routine screening on depression (and anxiety) in coronary heart disease; consequences and implications. European Journal of Cardiovascular Nursing, 10, 228-233.
Maassen, G. H. (2004). The standard error in the Jacobson and Truax Reliable Change Index: The classical approach to the assessment of reliable change. Journal of the International Neuropsychological Society, 10, 888-893.
Mael, F. A., & Ashforth, B. E. (1992). Alumni and their alma mater: A partial test of the reformulated model of organizational identification. Journal of Organizational Behavior, 13, 103-123.
Marteau, T. M., & Bekker, H. (1992). The development of a six-item short-form of the state scale of the Spielberger State-Trait Anxiety Inventory (STAI). British Journal of Clinical Psychology, 31, 301-306.
Martin, D. E., Moore, C. F., Sloan, L., & Legree, P. J. (2007). Personnel selection: An application of the unobtrusive knowledge test. Journal of Business and Behavioral Sciences, 16, 4-16.
Mason, O., Linney, Y., & Claridge, G. (2005). Short scales for measuring schizotypy. Schizophrenia Research, 78, 293-296.
McCarthy, D. M., Pedersen, S. L., & D’Amico , E. (2009). Analysis of item response and differential item functioning of alcohol expectancies in middle school youths. Psychological Assessment, 21, 444-449.

References
139
Meehl, P. E., & Rosen, A. (1955). Antecedent probability and the efficiency of psychometric signs, patterns, or cutting scores. Psychological Bulletin, 52, 194-216.
Meier, S. T. (2004). Improving design sensitivity through intervention-sensitive measures. American Journal of Evaluation, 25, 321-334.
Meier, S. T. (2008). Measuring Change in Counseling and Psychotherapy. New York: The Guilford Press.
Mellenbergh, G. J. (1996). Measurement precision in test score and item response models. Psychological Methods, 1, 293-299.
Micallef, J., Glangeaud-Freudenthal., N. M., Aurran, Y., & Julian-Reynier, C. (1998). [Mesure en population féminine de l'état d'anxiété: Une forme courte d'échelle.] Measure of state anxiety in women: A short form scale. Revue d'épidémiologie et de santé publique, 46, 383-389.
Millar, K., Jelicic, M., Bonke, B., & Asbury, A. J. (1995). Assessment of preoperative anxiety: Comparison of measures in patients awaiting surgery for breast cancer. British Journal of Anaesthesia, 74, 180-183.
Montgomery, S. A., & Åsberg, M. (1979). A new depression scale designed to be sensitive to change. British Journal of Psychiatry, 134, 382-389.
Mosel, J. N. (1953). Single-item tests for personnel screening. Educational and Psychological Measurement, 13, 179-192.
Muchinsky, P. M. (1996). The correction for attenuation. Educational and Psychological Measurement, 56, 63-67.
Murphy, K. R. (1994). Potential effects of banding as a function of test reliability. Personnel Psychology, 47, 477-495.
Netemeyer, R. G., Pulling, C., & Bearden, W. O. (2003). Observations on some key psychometric properties of paper-and-pencil measures. In A. G. Woodside & E. M. Moore (Eds.), Advances in business marketing and purchasing: Essays by distinguished scholars (pp. 115-138). New York: Elsevier Science.
Nicewander, W. A., & Price, J. M. (1983). Reliability of measurement and the power of statistical tests: Some new result. Psychological Bulletin, 94, 52-533.
Noone, J. H., Stephens, C., & Alpass, F. (2010). The Process of Retirement Planning Scale (PRePS): Development and validation. Psychological Assessment, 22, 520-531.
Norman, G. R., Sloan, J. A., & Wyrwich, K. W. (2003). Interpretation of changes in health-related quality of life: The remarkable universality of half a standard deviation. Medical Care, 41, 582-592.
Nunnally, J. C. (1978). Psychometric theory (2nd ed.). New York: McGraw-Hill. Nunnally, J. C., & Bernstein, I. H. (1994). Psychometric theory (3rd ed.). New York:
McGraw-Hill. O'Neil, H. F., Spielberger, C. D., & Hansen, D. N. (1969). Effects of state anxiety and task
difficulty on computer-assisted learning. Journal of Educational Psychology, 60, 343-350.
Olatunji, B. O., Sawchuk, C. N., Moretz, M. W., David, B., Armstrong, T., & Ciesielski, B. G. (2010). Factor structure and psychometric properties of the Injection Phobia Scale–Anxiety. Psychological Assessment, 22, 167-179.
Paap, M. C. S., Meijer, R. R., Van Bebber, J., Pedersen, G., Karterud, S., Hellem, F. M., et al. (2011). A study of the dimensionality and measurement precision of the SCL-90-R using item response theory. International Journal of Methods Psychiatric Research, 20, e39-e55.
Paterson, C. (1996). Measuring outcomes in primary care: A patient generated measure, MYMOP, compared with the SF-36 health survey. British Medical Journal, 312, 1016-1020.

140
Pedersen, S. S., Theuns, D. A. M. J., Jordaens, L., & Kupper, N. (2010). Course of anxiety and device-related concerns in implantable cardioverter defibrillator patients the first year post implantation. Europace, 12, 1119-1126.
Pedersen, S. S., Van Domburg, R. T., Theuns, D. A., Jordaens, L., & Erdman, R. A. M. (2004). Type D personality is associated with increased anxiety and depressive symptoms in patients with an implantable cardioverter defibrillator and their partners. Psychosomatic Medicine, 66, 714-719.
Perpiñá-Galvañ, J., Richart-Martínez, M., & Cabañero-Martínez, M. J. (2011). Reliability and validity of a short version of the STAI anxiety measurement scale in respiratory patients. Archivos de Bronconeumología, 47, 184-189.
Putnam, S. P., & Rothbart, M. K. (2006). Development of short and very short forms of the Children's Behavior Questionnaire. Journal of Personality Assessment, 87, 103-113.
Ramanaiah, N. V., Franzen, F., & Schill, T. (1983). A psychometric study of the State-Trait Anxiety Inventory. Journal of Personality Assessment, 47, 531-535.
Rasch, G. (1980). Probabilistic models for some intelligence and attainment tests (revised and expanded ed.). Chicago: The University of Chicago Press.
Reise, S. P., & Waller, N. G. (2009). Item response theory and clinical measurement. Annual Review of Clinical Psychology, 5, 27-48.
Reise, S. P., Waller, N. G., & Comrey, A. L. (2000). Factor analysis and scale revision. Psychological Assessment, 12, 287-297.
Richins, M. L. (2004). The material values scale: Measurement properties and development of a short form. Journal of Consumer Research, 31, 209-219.
Samejima, F. (1969). Estimation of latent ability using a response pattern of graded scores. Psychometric Monograph, No. 17.
Saucier, G. (1994). Mini-Markers: A brief version of Goldberg's Unipolar Big-Five Markers. Journal of Personality Assessment, 63, 506-516.
Scheier, M. F., & Carver, C. S. (1992). Effects of optimism on psychological and physical well-being: Theoretical overview and empirical update. Cognitive Therapy and Research, 16, 201-228.
Schmidt, F. L., & Hunter, J. E. (1998). The validity and utility of selection methods in personnel psychology: Practical and theoretical implications of 85 years of research findings. Psychological Bulletin, 124, 262-274.
Schmidt, F. L., Hunter, J. E., McKenzie, R. C., & Muldrow, T. W. (1979). Impact of valid selection procedures on work-force productivity. Journal of Applied Psychology, 64, 609-626.
Schmitt, J. S., & Di Fabio, R. P. (2004). Reliable change and mimimum important difference (MID) proportions facilitated group responsiveness comparisons using individual threshold criteria. Journal of Clinical Epidemiology, 57, 1008-1018.
Schwartz, C. E., & Sprangers, M. A. G. (1999). Methodological approaches for assessing response shift in longitudinal health-related quality-of-life research. Social Science & Medicine, 48, 1531-1584.
Segall, D. O. (2001). General ability measurement: An application of multidimensional item response theory. Psychometrika, 66, 79-97.
Shacham, S. (1983). A shortened version of the Profile of Mood States. Journal of Personality Assessment, 47, 305-306.
Shrout, P. E., & Yager, T. J. (1989). Reliability and validity of screening scales: Effects of reducing scale length. Journal of Clinical Epidemiology, 42, 69-78.
Sijtsma, K. (2009a). Correcting fallacies in validity, reliability, and classification. International Journal of Testing, 9, 167 - 194.

References
141
Sijtsma, K. (2009b). On the use, the misuse, and the very limited usefulness of Cronbach's alpha. Psychometrika, 74, 107-120.
Sijtsma, K. (2012). Future of psychometrics: Ask what psychometrics can do for psychology. Psychometrika, 77, 4-20.
Sijtsma, K., & Emons, W. H. M. (2011). Advice on total-score reliability issues in psychosomatic measurement. Journal of Psychosomatic Research, 70, 565-572.
Sinharay, S., Puhan, G., & Haberman, S. (2010). Reporting diagnostic scores in educational testing: Temptations, pitfalls, and some solutions. Multivariate Behavioral Research, 45, 1-21.
Slade, M., Hornicroft, G., & Glover, G. (1999). The feasibility of routine outcome measures in mental health. Social Psychiatry and Psychiatric Epidemiology, 34, 243-249.
Smith, G. T., McCarthy, D. M., & Anderson, K. (2000). On the sins of short-form development. Psychological Assessment, 12, 102-111.
Smith, M., & Smith, P. C. (2005). Testing people at work: Competencies in psychometric testing. Malden, MA: BPS Blackwell.
Smith, T. W., Ingram, R. E., & Brehm, S. S. (1983). Social anxiety, anxious self-preoccupation, and recall of self-relevant information. Journal of Personality and Social Psychology, 44, 1276-1283.
Smits, N., & Vorst, H. C. M. (2007). Reducing the length of questionnaires through structurally incomplete designs: An illustration. Learning and Individual Differences, 17, 25-34.
Soldz, S., Budman, S., Demby, A., & Merry, J. (1995). A short form of the Inventory of Interpersonal Problems Circumples Scales. Assessment, 2, 53-63.
Spearman, C., C. (1910). Correlation calculated from faulty data. British Journal of Psychology, 3, 271–295.
Spielberger, C. D., Gorsuch, R. L., & Lushene, R. (1970). Manual for the State-Trait Anxiety Inventory. Palo Alto, CA: Consulting Pyschologists Press.
Spielberger, C. D., Gorsuch, R. L., Lushene, R., Vagge, P. R., & Jacobs, G. A. (1983). Manual for the State-Trait Anxiety Inventory. Palo Alto, CA: Consulting Pyschologists Press.
Stanton, J. M., Sinar, E. F., Balzer, W. K., & Smith, P. C. (2002). Issues and strategies for reducing the length of self-report scales. Personnel Psychology, 55, 167-194.
Strahan, R., & Gerbasi, K. C. (1972). Short, homogeneous versions of the Marlow-Crowne (sic) social desirability scale. Journal of Clinical Psychology, 28, 191-193.
Tangirala, S., & Ramanujam, R. (2008). Employee silence on critical work issues: The cross level effects of procedural justice climate. Personnel Psychology, 61, 37-68.
Taylor, H. C., & Russell, J. T. (1939). The relationship of validity coefficients to the practical effectiveness of tests in selection: Discussion and tables. Journal of Applied Psychology, 23, 565-578.
Ten Berge, J. M. F., & Sočan , G. (2004). The greatest lower bound to the reliability of a test and the hypothesis of unidimensionality. Psychometrika, 69, 613-625.
Thissen, D., Pommerich, M., Billeaud, K., & Williams, V. S. L. (1995). Item response theory for scores including polytomous items with ordered responses. Applied Psychological Measurement, 19, 39-49.
Tluczek, A., Henriquest, J. B., & Brown, R. L. (2009). Support for the reliability and validity of a six-item State Anxiety Scale derived from the State-Trait Anxiety Inventory. Journal of Nursing Measurement, 17, 19-28.
Van der Ploeg, H. M., Defares, P. B., & Spielberger, C. D. (1980). [Handleiding bij de Zelf-Beoordelings Vragenlijst (ZBV): Een Nederlandstalige bewerking van de

142
Spielberger State-Trait Anxiety Inventory.] Manual for the ZBV: A Dutch-language adaptation of the Spielberger State-Trait Anxiety Inventory. Lisse, The Netherlands: Swets & Zeitlinger.
Van Ginkel, J. R., Van der Ark, L. A., & Sijtsma, K. (2007). Multiple imputation of item scores in test and questionnaire data, and influence on psychometric results. Multivariate Behavioral Research, 42, 387-414.
Van Iddekinge, C. H., & Ployhart, R. E. (2008). Developments in the criterion-related validation of selection procedures: A critical review and recommendations for practice. Personnel Psychology, 61, 871-925.
Van Knippenberg, F. C. E., Duivenvoorden, H. J., Bonke, B., & Passchier, J. (1990). Shortening the State-Trait Anxiety Inventory. Journal of Clinical Epidemiology, 43, 995-1000.
Verheggen, F. W. S. M., Nieman, F., & Jonkers, R. (1998). Determinants of patient participation in clinical studies requiring informed consent: Why patients enter a clinical trail. Patient Eductation and Counseling, 35, 111-125.
Wanous, J. P., & Hudy, M. J. (2001). Single-item reliability: A replication and extension. Organizational Research Methods, 4, 361-375.
Ware, J. E., Kosinski, M., & Keller, S. D. (1996). A 12-Item Short-Form Health Survey: Construction of scales and preliminary tests of reliability and validity. Medical Care, 34, 220-233.
Wise, E. A. (2004). Methods for analyzing psychotherapy outcomes: A review of clinical significance, reliable change, and recommendations for future directions. Journal of Personality Assessment, 82, 50-59.

143
Summary

144

Summary
145
In this PhD thesis, we investigated the effect of test shortening on the risk of
making incorrect decisions about individuals. To meet practical demands, test users may
prefer short psychological tests and questionnaires consisting of, say, at most 15 items for
individual decision-making. Applications of using total scores for individual decision-
making include the selection or the rejection of applicants in personnel selection,
personality assessment in psychodiagnostics, and the monitoring of clients when they
receive treatment. However, reducing the number of items produces total scores that are
more vulnerable to measurement error and, as a consequence, the risk of making incorrect
individual decisions are higher for short tests than for long tests. The main research
question was: To what extent does test shortening impair the quality of individual decision-
making? In Chapter 1, we specialized the main research question into four specific research
questions: (1) To what extent do psychologists pay attention to the consequences of using
short tests for making decisions about individuals? (2) How should one assess the risk of
making incorrect individual decisions? (3) To what extent does test shortening increase the
risk of making incorrect individual decisions? (4) What are minimal test-length
requirements for making decisions about individuals with sufficient certainty? Using
classical test theory, we explained that the utility of a test for making decisions about
individuals depends on measurement precision and cannot be inferred from total-score
reliability. A simulation study was done to illustrate the relationship between test length,
reliability, and measurement precision. We concluded that although the reliability of short
test may be acceptable, short tests measure individuals with considerable smaller precision
than long tests.
In Chapter 2, we discussed the results of a literature study of current practices in
test shortening in four main domains of psychology, and the impact of test shortening on

146
measurement quality. A review of 2,273 articles in six peer-reviewed psychological
journals that appeared between 2005 and 2010 revealed 164 shortened tests. The majority
of the tests were considerably shorter—halving the test was not exceptional—but the
decrease of the total-score reliability was modest. A remarkable result was the lack of
information authors provided with respect to measurement precision, validity, and the
anticipated practical payoffs of the test shortening. Only for 15 tests, authors reported
sufficient information to investigate the consequences of test shortening for measurement
precision. Effects of test shortening on test validity were discussed for only half of the
shortened tests. Actual time savings were reported for only six tests and possible practical
pay-offs for only 39 shortened tests. The literature study suggested that researchers tend to
conform to minimum reliability prescribed by rules of thumb and to take the validity of the
shortened test for granted, thus ignoring the validity issue.
In Chapter 3, we investigated the consequences of test shortening for making
incorrect selection decisions in five selection scenarios that are common in personnel
selection. A distinction was made between decision quality at the organization level and
decision quality at the individual level. At the organization level, we assessed the risk of
making incorrect decisions by means of specificity, sensitivity, and predictive values. For
different test lengths, we used classification consistency to assess individual-level risks of
an incorrect rejection or selection decision; classification consistency is the proportion of
applicants for whom the probability of a correct decision was at least equal to .7 or .9.
Based on simulated data, we found that shortening a 40-item test to fewer than 20 items
substantially increased the risk of making decision errors—even if total-score reliability
was still acceptable—in particular for selecting suited applicants when base rates or
selection ratios were low. Effects at the organization level were smaller than those at the
individual level. Results were similar for dichotomous and polytomous items; for selection

Summary
147
based on a single test and for selection based on test batteries; and also for top-down
selection, cut-score selection, and selection based on score profiles. We concluded that test
shortening has a considerable negative impact on decision quality in personnel selection.
In Chapter 4, we studied the effects of test shortening on the risk of making
incorrect decisions about individual change in pre-test post-test designs. This study
connected to the trend of using shortened test for evaluating treatment outcomes by
routinely testing clients. We studied test shortening for three different definitions of
individual treatment outcomes: reliable change, clinically important change, and recovery.
We defined detection rate as the proportion of correct conclusions if the person were tested
an infinite number of times under identical conditions. For varying magnitudes of
individual change, we used simulated data to investigate the detection rate as a function of
test length. Tests containing fewer than 20 items had substantially lower detection rates
than longer tests, in particular when individual change was large. We found minor
differences across criteria to assess treatment outcomes. Likewise, results were similar
across tests having different item properties. We concluded that the use of short test for
individual-change assessment is unjustified.
In Chapter 5, we compared the measurement properties of twelve shortened
versions of the 20-item State scale of the State-Trait Anxiety Inventory (S-STAI,
Spielberger, Gorsuch, & Lushene, 1970; Spielberger, Gorsuch, Lushene, Vagge, & Jacobs,
1983). We used data from a Dutch longitudinal study on anxiety factors in cardiac patients
and their partners in the Netherlands (Pedersen, Theuns, Jordaens, & Kupper, 2010) to
compare total-score reliability and measurement precision between different shortened S-
STAI versions. We also compared the risks of drawing incorrect conclusions with respect
to the question whether an individual qualifies as highly anxious and whether an
individual’s anxiety level changes between two measurement occasions. We found that the

148
effect of test shortening on total-score reliability was small, but on measurement precision
it was large. The impact of test shortening on individual decision-making varied between
patients and their partners and across different shortened test versions. In some conditions,
shortening the S-STAI did not have consequences for the quality of individual-decision
making, but in other situations the risk of making incorrect decisions was considerably
larger for shortened versions than for the original version. We concluded that shortened
versions of the S-STAI are acceptable for research purposes, but may be problematic for
making decisions about individuals.
In Chapter 6, we answered the research questions stated in Chapter 1 and suggested
topics for future research. The main conclusions and recommendations can be summarized
as follow. First, several psychologists consider a shortened test suited for individual
decision-making as long as the reliability exceeds a lower bound of, say, .8 or .9. However,
the simulation studies and the empirical (S-STAI) example showed that test shortening had
modest effects on total-score reliability, but considerable effects on measurement precision
and the risks of making incorrect decisions about individuals. Following this result, we
recommend that test users resorting to shortened test should consider measurement
precision, detection rates, and classification consistency before they actually use the
shortened test in practice. We propose that as a general rule test users should strive for
using tests containing at least 20 items to ensure that decisions about individuals can be
made with sufficient certainty. Subjects for future research include the use of short tests in
scientific research and advantages and disadvantages of computer adaptive testing as an
alternative to short standardized tests for individual decision-making. Attention should also
be given to means other than test shortening to decrease the aversion many professionals
have against (long) psychological tests and questionnaires.

149
Samenvatting (Summary in Dutch)

150

Samenvatting
151
In dit proefschrift onderzoeken wij of testverkorting leidt tot een verhoogd risico op
het nemen van verkeerde beslissingen over individuen. Vanwege praktische voordelen
hebben testgebruikers vaak een voorkeur voor korte psychologische tests en
vragenlijsten—bestaande uit, zeg, hooguit 15 items—voor het nemen van beslissingen over
individuen. Voorbeelden van toepassingen waarin op basis van testscores beslissingen over
individuen worden genomen zijn het selecteren of afwijzen van kandidaten in
personeelselectie, persoonlijkheidsbeoordeling in psychodiagnostiek, en het volgen van
cliënten tijdens een behandeling. Het verminderen van het aantal items maakt testscores
wel gevoeliger voor meetfouten. Als gevolg hiervan neemt de kans op het nemen van
verkeerde beslissingen toe. De centrale onderzoeksvraag luidt: In welke mate tast
testverkorting de kwaliteit van individuele besluitvorming aan?
In Hoofdstuk 1 wordt de hoofdvraag nader uitgewerkt in vier deelvragen: (1) In
hoeverre besteden psychologen aandacht aan de gevolgen voor individuele besluitvorming
die aan het gebruik van korte tests kleven? (2) Hoe dient men risico’s op het nemen van
onjuiste beslissingen over individuen in te schatten? (3) Hoe groot is de invloed van
testverkorting op het risico op het nemen van verkeerde beslissingen over individuen? en
(4) Hoeveel items zijn minimaal nodig om met voldoende zekerheid besluiten te kunnen
nemen over individuen? Met behulp van de klassieke testtheorie wordt aangetoond dat de
bruikbaarheid van tests voor het nemen van individuele beslissingen afhankelijk is van
meetprecisie en niet afgeleid kan worden van de betrouwbaarheid. Een simulatieonderzoek
illustreert de relatie tussen testlengte, betrouwbaarheid, en meetprecisie. Wij concluderen
dat personen met aanzienlijk minder precisie worden gemeten door korte tests dan door
lange tests, zelfs wanneer de betrouwbaarheid van de korte test acceptabel is.
Hoofdstuk 2 betreft een literatuuronderzoek naar het gebruik van verkorte tests
binnen vier belangrijke domeinen van de psychologie, en de gevolgen van testverkorting

152
voor de psychometrische kwaliteiten van de test. In totaal werden 164 verkorte tests
aangetroffen in 2.273 artikelen in zes peer-reviewed psychologische tijdschriften die
verschenen tussen 2005 en 2010. De meeste tests waren aanzienlijk ingekort—een
halvering van het aantal items was geen uitzondering. Echter, de betrouwbaarheid liet
slechts een kleine daling zien. Een opvallend resultaat uit het literatuuronderzoek was dat
over meetprecisie, validiteit, en praktische winst nauwelijks gerapporteerd werd. Slechts
voor 15 verkorte test was er voldoende informatie beschikbaar om de gevolgen van
testverkorting voor de meetprecisie te onderzoeken. Testvaliditeit werd slechts voor de
helft van de verkorte tests in kaart gebracht. Ten slotte werd voor slechts zes verkorte tests
de feitelijke tijdsbesparing vermeld en werden voor 39 tests de mogelijke voor- en nadelen
van het gebruik van de verkorte versie besproken. Het literatuuronderzoek suggereert dat
onderzoekers (a) algemene richtlijnen voor de minimale waarden voor de betrouwbaarheid
zoals aanbevolen in de literatuur als norm hanteren en (b) onterecht menen dat de
ondersteuning voor de validiteit van de lange test automatisch geldt voor de verkorte test.
In Hoofdstuk 3 worden de gevolgen van testverkorting voor het risico op het nemen
van foutieve selectiebeslissingen in vijf veelgebruikte selectiescenario’s in
personeelsselectie onderzocht. Hierbij maken we een onderscheid tussen gevolgen bezien
vanuit het perspectief van organisaties en gevolgen bezien vanuit het perspectief van de
geteste personen. Vanuit het perspectief van organisaties wordt gekeken naar
veranderingen in de sensitiviteit, specificiteit, en predictive values. Op individueel niveau
wordt voor verschillende testlengtes gekeken naar het risico op onjuiste
selectiebeslissingen; dit risico wordt uitgedrukt in de classificatieconsistentie, dat is
gedefinieerd als de proportie kandidaten voor wie de kans op een correcte beslissing
minimaal 0,70 of 0,90 is. Onderzoek met gesimuleerde gegevens laat een aanzienlijke
toename zien van het risico op het nemen van verkeerde beslissingen voor tests die van 40

Samenvatting
153
naar minder dan 20 items zijn verkort, zelfs wanneer de betrouwbaarheid van de verkorte
tests acceptabel blijft. Deze trend is het duidelijkst bij het vinden van geschikte kandidaten
bij lage toevalskansen (base rates) en lage selectieratio’s. Het simulatieonderzoek laat
verder zien dat testverkorting minder grote gevolgen heeft voor organisaties dan voor het
individu. Resultaten zijn vergelijkbaar voor dichotome en polytome items; voor selectie op
basis van een enkele test en op basis van testbatterijen, en voor top-down selectie, cut-
score selectie en selectie op basis van scoreprofielen. Wij concluderen dat testverkorting
een aanzienlijke negatieve impact heeft op de kwaliteit van individuele besluitvorming in
personeelsselectie.
In Hoofdstuk 4 wordt onderzocht in welke mate testverkorting van invloed is op het
risico op het nemen van verkeerde beslissingen over individuele verandering in pre-test
post-test designs. Dit hoofdstuk sluit aan bij de trend in de geestelijke gezondheidszorg,
waarin door het routinematig testen van een cliënt de uitkomsten van behandelingen
worden geëvalueerd. Voor drie veelgebruikte criteria om individuele veranderingen vast te
stellen—betrouwbare veranderingen, klinisch belangrijke veranderingen en herstel—wordt
gekeken in hoeverre testverkorting de kans op het nemen van een verkeerde beslissing
vergroot. Door middel van gesimuleerde gegevens wordt voor verschillende gradaties van
individuele verandering tussen twee meetmomenten de relatie tussen testlengte en
detectieratio bestudeerd (detectieratio is de proportie juiste conclusies wanneer een
individu onbeperkt onder identieke omstandigheden getest zou worden).
Simulatieonderzoek laat zien dat voor tests korter dan 20 items individuele veranderingen
veel vaker ten onrechte onopgemerkt blijven dan voor de langere testversies, vooral bij het
vaststellen van grote individuele veranderingen. De resultaten zijn vergelijkbaar voor de
drie criteria die gebruikt worden om individuele veranderingen te beoordelen, en tussen

154
tests met verschillende itemkenmerken. Wij concluderen dat korte tests ongeschikt zijn om
in de klinische praktijk individuele veranderingen vast te stellen.
In Hoofdstuk 5 worden psychometrische eigenschappen van twaalf verkorte versie
van de 20-item State schaal van de State-Trait Anxiety Inventory (S-STAI, Spielberger,
Gorsuch, & Lushene, 1970; Spielberger, Gorsuch, Lushene, Vagge, & Jacobs, 1983) met
elkaar vergeleken. Voor dit hoofdstuk is gebruik gemaakt van longitudinale data uit een
Nederlands onderzoek naar angstfactoren onder hartpatiënten en hun partners (Pedersen,
Theuns, Jordaens, & Kupper, 2010). Er werd gekeken naar de betrouwbaarheid, de
meetprecisie, en het risico op classificatiefouten voor diagnose van angst en het meten van
individuele veranderingen in angst. Het inkorten van de S-STAI heeft een geringe invloed
op de betrouwbaarheid, dit in tegenstelling tot de meetprecisie die voor verkorte versies
van de S-STAI aanzienlijk slechter is. De gevolgen van testverkorting voor individuele
besluitvorming variëren voor patiënten en hun partners en tussen verschillende verkorte
versies. Voor sommige gevallen heeft testverkorting geen gevolgen voor de kwaliteit van
de individuele besluitvorming, terwijl voor andere gevallen de kans op het nemen van
foute beslissingen aanzienlijk groter is voor verkorte versies van de S-STAI dan voor de
originele versie. Wij concluderen dat verkorte versies van de S-STAI acceptabel zijn voor
onderzoeksdoelen, maar veelal problematisch voor het nemen van besluiten over
individuen.
In hoofdstuk 6 worden de vier deelvragen uit Hoofdstuk 1 beantwoord en enkele
algemene suggesties gedaan. De belangrijkst conclusies en aanbevelingen kunnen als volgt
worden samengevat. Ten eerste beschouwen vele psychologen testverkorting als
acceptabel zolang de betrouwbaarheid hoger blijft dan, zeg, 0,8 of 0,9, ook als de test
wordt gebruikt om besluiten te nemen over individuen. De simulatieonderzoeken en het
empirisch voorbeeld (S-STAI) laten zien dat testverkorting vaak een klein effect heeft op

Samenvatting
155
de betrouwbaarheid, maar een groot effect op meetprecisie, en dat daarmee het gebruik van
verkorte tests een groter risico oplevert voor het nemen van verkeerde besluiten over
individuen. Testgebruikers die overwegen verkorte tests te gebruiken wordt geadviseerd
om meer aandacht te besteden aan meetprecisie, detectieratio’s, en classificatieconsistentie.
Ten tweede bevelen we aan per test tenminste 20 items te gebruiken opdat voor de meeste
geteste personen besluiten met voldoende zekerheid kunnen worden genomen. Toekomstig
onderzoek kan zich toespitsen op de gevolgen van het gebruik van korte test in
wetenschappelijk onderzoek en de voor- en nadelen van adaptief testen met behulp van
computers als alternatief voor korte gestandaardiseerde tests om beslissingen te nemen
over individuen. Verder verdient het aanbeveling om te zoeken naar andere mogelijkheden
dan testverkorting om de aversie van velen tegen (lange) psychologische tests en
vragenlijsten te verminderen.

156

157
Woord van dank (Acknowledgments in Dutch)

158

Woord van dank
159
Wie juli 2008 aan mij had verteld dat ik vlak voor kerst 2012 een proefschrift over
een psychometrisch onderwerp zou verdedigen, zou ik vol verbazing hebben aangestaard.
Uitgeput van mijn afstudeeronderzoek twijfelde ik sterk of ik nog verder wilde in de
academische wereld, en bovendien, ik had nog nooit van psychometrie gehoord. Ik was
bestuurskundige en organisatiewetenschapper en vroeg ik mij af of ik wel in de wieg
gelegd was voor de wetenschap.
Dat dit proefschrift hier nu ligt heb ik allereerst te danken aan Klaas Sijtsma, mijn
promotor, en Wilco Emons, mijn copromotor. Ik ben jullie dankbaar dat jullie mij dit
onderzoek toevertrouwden, dat jullie mij de rust en ruimte gaven om de psychometrie te
ontdekken, en dat jullie mij tegelijkertijd dwongen om vlot en accuraat te werk te gaan.
Klaas, je bemoedigende, geruststellende, en soms noodzakelijke strenge woorden kon ik
altijd waarderen. Wilco, zonder je kalmte en geduld had ik mijn wanhopige momenten
nooit doorstaan. Beste Klaas, beste Wilco, jullie scherpte, betrokkenheid, en bevlogenheid,
ik ga jullie missen.
Hendrik Straat, de afgelopen jaren waren wij strijdmakkers. Samen doorstonden wij
alle hobbels en bobbels, hoogte- en dieptepunten van het promotietraject, hoewel het ons
toch lukte om zelfs op de meest spannendste momenten het koffieapparaat te bereiken.
Zonder jou waren de afgelopen jaren zeker weten anders gelopen. Al was het maar omdat
ik zonder jouw aanstekelijke enthousiasme en heldere uitleg over psychometrie nooit
gesolliciteerd had bij het departement Methoden en Technieken van Onderzoek (MTO).
Hendrik, dank voor dit alles.
Dank aan mijn collega’s bij MTO die mij met raad en daad bijstonden, in het
bijzonder Marcel van Assen, John Gelissen, Luc van Baest, Wobbe Zijlstra, Miloš
Kankaras, Natalia Kieruj, Pieter Oosterwijk, Marieke Timmermans en Liesbeth Bluekens.
Een speciaal woord van dank aan Stéfanie André die mij veel werk uit handen nam door

160
vele bronartikelen op te sporen noodzakelijk voor hoofdstuk 2 en Andries van der Ark die
mij introduceerde in de beginselen van de psychometrie en de kleinste fouten in mijn
teksten corrigeerde.
Dank aan Susanne Pedersen voor het beschikbaar stellen van de data voor
hoofdstuk 5. Roos Verhooren, geweldig dat je mijn manuscript om wist te toveren tot dit
prachtige boek! Content ben ik met alle ondersteuning geboden door de Nederlandse
Organisatie voor Wetenschappelijk Onderzoek (NWO), de Interuniversity Graduate School
of Psychometrics and Sociometrics (het IOPS), en de Graduate School van de Tilburg
School of Social and Behavioral Sciences. Veel waardering heb ik voor de leden van mijn
promotiecommissie. Ik kijk ernaar uit om met u van gedachten te wisselen over de
boeiende wereld van de testdiagnostiek.
Arjen Mosselman, Marin de Feijter, Mirjam Kort, en Carolien Vis, wat vliegt de
tijd toch snel. De Tilburg University Cantus (TUC), ons avontuur, ligt alweer meer dan
twee jaar achter ons. Al die organisatiestress en –plezier was, kan ik in eerlijkheid zeggen,
in zijn geheel niet bevorderlijk voor dit proefschrift. Maar wat zou er van mij geworden
zijn als wij niet samen met de TUC aan de slag waren gegaan?
Mijn dank gaat naar allen die mij hielpen en helpen mijn passies te ontdekken en te
beoefenen. Naast de reeds genoemde personen, een bijzonder woord van dank aan Patrick
Kenis, Keith Provan, Jelte Krist, Ilse de Haan, Peter de Boer, Nienke Plasmeijer, Lianne de
Kok, Jef van de Sande, Ruud Vreeman, Hein van Oorschot, Liesbeth Leijssen, Aafke
Raaijmakers, Gertjan Lucas, en mijn collega’s van Promovendi Netwerk Nederland.
Taco Brandsen en Michiel de Vries, ik ben enorm blij dat jullie mij de kans gaven
aan de slag te gaan bij het departement Bestuurskunde te Nijmegen. Ik heb veel zin in de
samenwerking met mijn nieuwe collega’s en hoop een bescheiden bijdrage te mogen
leveren aan de Organisatie- en Bestuurswetenschappen.

Woord van dank
161
Lieve familieleden, jullie weten als geen ander hoe grappig irritant ik soms kan zijn.
Papa, Mama, Carin & Bossinks, en Maaslands: dank voor alle support, steun, en
gezelligheid. Thijs en Anneke, wat ben ik toch enorm trots dat ik met jullie aan mijn zijde
dit proefschrift mag verdedigen.
Wie juli 2008 aan mij had verteld dat ik vlak voor kerst 2012 al ruim twee jaar
samen zou zijn met Anke zou ik vol verbazing hebben aangestaard. Anke, in welke ivoren
toren zou ik zijn beland als jij mij niet gevonden had? Wat bof ik toch!
Peter Kruyen
Mechelen, november 2012

162