Tilburg University From IT-Business Strategic Alignment to ...
237
Tilburg University From IT-Business Strategic Alignment to Performance Alhuraibi, Adel Publication date: 2017 Document Version Publisher's PDF, also known as Version of record Link to publication in Tilburg University Research Portal Citation for published version (APA): Alhuraibi, A. (2017). From IT-Business Strategic Alignment to Performance: A Moderated Mediation Model of Social Innovation, and Enterprise Governance of IT. [s.n.]. General rights Copyright and moral rights for the publications made accessible in the public portal are retained by the authors and/or other copyright owners and it is a condition of accessing publications that users recognise and abide by the legal requirements associated with these rights. • Users may download and print one copy of any publication from the public portal for the purpose of private study or research. • You may not further distribute the material or use it for any profit-making activity or commercial gain • You may freely distribute the URL identifying the publication in the public portal Take down policy If you believe that this document breaches copyright please contact us providing details, and we will remove access to the work immediately and investigate your claim. Download date: 29. Jan. 2022
Transcript of Tilburg University From IT-Business Strategic Alignment to ...

Tilburg University
From IT-Business Strategic Alignment to Performance
Alhuraibi, Adel
Publication date:2017
Document VersionPublisher's PDF, also known as Version of record
Link to publication in Tilburg University Research Portal
Citation for published version (APA):Alhuraibi, A. (2017). From IT-Business Strategic Alignment to Performance: A Moderated Mediation Model ofSocial Innovation, and Enterprise Governance of IT. [s.n.].
General rightsCopyright and moral rights for the publications made accessible in the public portal are retained by the authors and/or other copyright ownersand it is a condition of accessing publications that users recognise and abide by the legal requirements associated with these rights.
• Users may download and print one copy of any publication from the public portal for the purpose of private study or research. • You may not further distribute the material or use it for any profit-making activity or commercial gain • You may freely distribute the URL identifying the publication in the public portal
Take down policyIf you believe that this document breaches copyright please contact us providing details, and we will remove access to the work immediatelyand investigate your claim.
Download date: 29. Jan. 2022

From IT-Business Strategic Alignment to Performance:
A Moderated Mediation Model of Social Innovation
and Enterprise Governance of IT
PROEFSCHRIFT
ter verkrijging van de graad van doctor
aan Tilburg University
op gezag van de rector magnificus,
prof. dr. E.H.L. Aarts,
in het openbaar te verdedigen ten overstaan van een
door het college voor promoties aangewezen commissie
in de Ruth First zaal van de Universiteit
op dinsdag 26 september 2017 om 14.00 uur
door
Adel Alhuraibi
geboren op 30 januari 1967 te Nitra, Slowakije

Promotores: Prof. dr. H.J. van den Herik
Prof. dr. B.A. Van de Walle
Copromotor: Dr. S. Ankolekar
Beoordelingscommissie:
Prof. dr. W.J.A.M. van den Heuvel
Prof. dr. E. O. Postma
Prof. dr. M. E. M. van Reisen
Prof. dr. J. N. Kok
Dr. V. Feltkamp
This research was partially funded by the Netherlands Organization for International Co-
operation in Higher Education (NUFFIC).
SIKS Dissertation Series no. 2017-29
The research reported in this thesis has been carried out under the auspices of SIKS, the Dutch
Research School for Information and Knowledge Systems.
TICC Ph.D. Series No. 54
ISBN 978-94-6295-708-4
© Adel Alhuraibi
iii
Preface
The issue why IT and Business aligned strategies fail to achieve the desired goals has been often
brought up for discussion by my EMBA (Executive Master of Business Administration) students. I
am privileged to teach them organizational performance and management information systems. The
rich experience as a consultant in the design and implementation of strategic performance systems
enabled me to show the students the intricacies of their question. The main controversial decisions
are taken in the period between (1) having reached a consensus of aligned strategies, specifically
concerning business and IT strategies, and (2) the implementation of the aligned strategies by the
organization.
As a result of both professions (teacher and consultant), I stumbled into an interesting and significant
issue. First, I observed that firms in their daily practice had several theoretical techniques available
for aligning their business and IT strategies (e.g., the Balanced Score Card cascading and the
matching matrix of business and IT processes). Then I saw that those techniques generated aligned
strategies (in theory). However, many firms fail to implement them satisfactorily. Thus, two
prevailing questions remained: (1) Why does the implementation fail? and (2) What factors could
lead to the realization of a higher performance and a higher rate of return on IT investments? This
continuous inquiry in the area connecting practice and academia has been the main source of
inspiration underlying this PhD study.
The Enterprise Governance of IT (EGIT) as it is known today and defined in this study is a relatively
new and unexplored concept. In addition, Innovation is an important and well established antecedent
factor of organizational performance. In the literature, there are only a few studies performed at the
departmental level combining strategy alignment, EGIT, social innovation, and performance.
Consequently, I was inspired to take on the challenge and explore the interesting combination of these
performance factors.
Adel Alhuraibi
Tilburg, April 2017

iv
This page is intentionally left blank
v
Table of contents
PREFACE ......................................................................................................................................... III
LIST OF ABBREVIATIONS ........................................................................................................................... IX
LIST OF DEFINITIONS .................................................................................................................................. XI
LIST OF FIGURES ...................................................................................................................................... XIII
LIST OF TABLES ........................................................................................................................................ XV
CHAPTER 1 INTRODUCTION ............................................................................................................. 1
1.1 IT Investments and a Firm’s Performance ............................................................................... 2
1.2 IT Business Strategic Alignment (ITBSA) ................................................................................... 3
1.3 Three Different Types of Innovation ........................................................................................ 4
1.4 The Problem Statement ........................................................................................................... 9
1.5 Four Research Questions ....................................................................................................... 11
1.6 Research Methodology .......................................................................................................... 14
1.7 The Aim of the Study ............................................................................................................. 17
1.8 The Significance of the Study ................................................................................................. 17
1.8.1 Theoretical Contributions ................................................................................................... 18
1.8.2 Practical Contributions ....................................................................................................... 19
1.9 Structure of the Thesis ........................................................................................................... 20
CHAPTER 2 BACKGROUND AND DEFINITIONS ........................................................................ 21
2.1 IT Business Strategic Alignment ............................................................................................. 21
2.1.1 The Evolution of the IT Strategy ......................................................................................... 21
2.1.2 The Integration of the IT Strategy into the Business Strategy ............................................ 25
2.2 Enterprise Governance of IT .................................................................................................. 34
2.2.1 IT Governance and Corporate Governance ........................................................................ 34
2.2.2 IT Governance and EGIT ...................................................................................................... 36
2.3 Social Innovation at Work (SIW) ............................................................................................ 36
2.3.1 Importance and Background of Innovation in General ...................................................... 37
2.3.2 The Social Innovation Concept and Definition .................................................................... 38
2.3.3 Inter-Departmental Collaboration on SIW .......................................................................... 41
CHAPTER 3 LITERATURE REVIEW ............................................................................................... 45
3.1 IT Business Strategic Alignment and a Firm’s Performance ................................................... 45
3.1.1 The IT Value for Organizational Performance and Growth ................................................. 46
3.1.2 ITBSA, an Enabler of Organizational Performance from IT ................................................. 48
3.2 SIW: The Facilitator between ITBSA and Performance .......................................................... 51
3.2.1 SIW and Performance ......................................................................................................... 52
3.2.2 Inter-Departmental Collaboration on SIW .......................................................................... 54
3.2.3 ITBSA and SIW ..................................................................................................................... 59
3.3 The Enterprise Governance of IT ............................................................................................ 60
3.3.1 The Components of the Enterprise Governance of IT ........................................................ 61
3.3.2 EGIT and SIW....................................................................................................................... 62

vi Table of Contents
3.3.3 EGIT and ITBSA .................................................................................................................... 63
3.3.4 Chapter Conclusion ............................................................................................................. 64
CHAPTER 4 THE CONCEPTUAL MODEL ..................................................................................... 65
4.1 The Theoretical Background of the Mediating and Moderating Models ................................ 65
4.1.1 The Mediating Model ......................................................................................................... 65
4.1.2 The Moderating Model ....................................................................................................... 66
4.2 The Significance of the Departmental-Level Analysis ............................................................. 68
4.2.1 The BSC and the Importance of the Departmental Level ................................................... 68
4.2.2 The IT Engagement Model .................................................................................................. 72
4.3 Criteria and Selection of the Model ....................................................................................... 74
4.3.1 The Base Model ITBSA, SIW, and Performance ................................................................... 74
4.3.2 Incorporation of EGIT into the Base Model ........................................................................ 76
4.3.3 Five Reasons in Favor of the Moderator Positioning .......................................................... 78
4.4 How to Balance Mediation & Moderation ............................................................................. 80
4.4.1 The Mediated Moderation ................................................................................................. 80
4.4.2 The Moderated Mediation ................................................................................................. 81
4.4.3 Comparisons ....................................................................................................................... 81
4.5 Our Conceptual Model ........................................................................................................... 82
4.5.1 Five combinations of Mediation and Moderation .............................................................. 82
4.5.2 The Complete Conceptual Model ....................................................................................... 83
CHAPTER 5 FIELD WORK AND DATA COLLECTION .............................................................. 85
5.1 Operationalization of the Constructs ..................................................................................... 85
5.1.1 Operationalization of ITBSA ................................................................................................ 86
5.1.2 Operationalization of EGIT .................................................................................................. 87
5.1.3 Operationalization of SIW ................................................................................................... 88
5.1.4 Operationalization of Performance ..................................................................................... 89
5.2 Data Collection Instruments .................................................................................................. 91
5.2.1 Data Instrument ITBSA........................................................................................................ 92
5.2.2 Data Instrument EGIT ......................................................................................................... 92
5.2.3 Data Instrument SIW .......................................................................................................... 96
5.2.4 Data Instrument – Departmental Performance .................................................................. 98
5.3 Data Collection ...................................................................................................................... 99
5.3.1 The Data Collection Process ............................................................................................... 99
5.3.2 Considerations of the “Common Method Bias” ............................................................... 103
5.4 General Description of the Collected Data ........................................................................... 104
5.4.1 Data of ITBSA .................................................................................................................... 104
5.4.2 Data of EGIT ...................................................................................................................... 106
5.4.3 Data of Inter-Departmental Collaboration on SIW ........................................................... 108
5.4.4 Data of Departmental Performance .................................................................................. 110
From IT-Business Alignment to Performance vii
CHAPTER 6 DATA ANALYSIS AND RESULTS ........................................................................... 113
6.1 Why SEM? ........................................................................................................................... 113
6.1.1 SEM Defined ..................................................................................................................... 113
6.1.2 Advantages of Using SEM ................................................................................................. 115
6.1.3 Predictive Application vs. Theory Testing ......................................................................... 116
6.2 The Fit Indicators of the Model ............................................................................................ 117
6.2.1 The Choice for Absolute Fit Indices .................................................................................. 119
6.2.2 The Choice for Incremental Fit Indices ............................................................................. 120
6.2.3 The Choice for Parsimonious Fit Indices. .......................................................................... 121
6.2.4 Final Choice of Model Indices ........................................................................................... 121
6.3 CFA and Validity Analysis ..................................................................................................... 122
6.3.1 Confirmatory Factor Analysis ............................................................................................ 122
6.3.2 The Model Modification ................................................................................................... 123
6.3.3 Reliability and Validity Analysis ........................................................................................ 127
6.4 The Structural Models – Results and Discussions ................................................................. 130
6.4.1 The Direct Effect of ITBSA on SIW Model ......................................................................... 130
6.4.2 The Direct Effect of SIW on Performance Model .............................................................. 133
6.4.3 The Mediating Effect of SIW Model .................................................................................. 135
6.4.4 The Moderated Mediation Model .................................................................................... 140
CHAPTER 7 CONCLUSION ............................................................................................................. 147
7.1 Answers to the Research Questions ..................................................................................... 147
7.1.1 Answer to RQ1 .................................................................................................................. 147
7.1.2 Answer to RQ2 .................................................................................................................. 148
7.1.3 Answer to RQ3 .................................................................................................................. 149
7.1.4 Answer to RQ4 .................................................................................................................. 150
7.2 Answer to the Problem Statement ...................................................................................... 151
7.3 Observations and Personal Opinions ................................................................................... 152
7.4 Limitations of the Study ....................................................................................................... 153
7.5 Future Research ................................................................................................................... 154
REFERENCES ........................................................................................................................................ 157
APPENDICES ........................................................................................................................................ 185
DATA VALIDATION – TABLES & FIGURES ........................................................ 186
BIVARIATE CORRELATIONS MATRIX ............................................................... 189
INTERACTION VARIABLE CALCULATIONS ..................................................... 190
THE ITBSA QUESTIONNAIRE ............................................................................... 191
THE EGIT QUESTIONNAIRE .................................................................................. 192
THE SIW QUESTIONNAIRE .................................................................................... 195
THE DEPARTMENTAL PERFORMANCE QUESTIONNAIRE .......................... 196
SUMMARY ........................................................................................................................................ 197
SAMENVATTING ........................................................................................................................................ 201

viii Table of Contents
CURRICULUM VITAE .................................................................................................................................. 205
SPECIAL ACKNOWLEDGMENT ................................................................................................................ 207
SIKS PH.D. SERIES ........................................................................................................................................ 211
TICC PH.D. SERIES ........................................................................................................................................ 219
ix
List of Abbreviations
AMOS Analysis of Moment Structures - Statistical software
ANOVA Analysis of Variance
ARPAnet Advanced Research Projects Agency Network
BI Business Intelligence
BSC Balanced Score Card
CEO Chief Executive Officer
CFI Comparative Fit Index
CIO Chief Information Officer
CIS Community Innovation Survey
CISR Center for Information Systems Research
COBIT Control Objectives for Information and Related Technologies
CRM Customer Relationship Management
CS Corporate Sustainability
CSO Civil Society Organization
DBS Digital Business Strategy
DCT Dynamic Capabilities Theory
DJSI Dow Jones Sustainability Index
DSS Decision Support System
EC European Commission
EGIT Enterprise Governance of IT
EMBA Executive Master of Business Administration
ENIAC Electronic Numerical Integrator and Calculator
ERM Enterprise Risk Management
ERP Enterprise Resource Planning
ESS Executive Support System
GDP Gross Domestic Product
GLS Generalized Least Square
HRM Human Resource Management
IBM International Business Machines Co.
INTEL Integrated Electronics Co.
IS Information Systems
ISACA Information Systems Audit and Control Association
IT Information Technology
IT/IS Information Technology/Information Systems
ITAG IT Alignment and Governance Research Institute
ITBSA IT Business Strategic Alignment
ITGI IT Governance Institute

x List of Abbreviations
ITS IT Strategy
KM Knowledge Management
MAS Multi-Agent System
MIS Management Information Systems
MIT Massachusetts Institute of Technology
ML Maximum Likelihood
MNC Multi National Corporation
NFP Non-for Profit Organization
NGO Non-Governmental Organization
NNFI Non-Normed Fit Index
PC Personal Computer
PCFI Parsimonious Comparative Fit Index
PIMS Profit Impact of Marketing Strategies
PLS Partial Least Squares
PS Problem Statement
RM Research Methodology
RMSEA Root Mean Square Error of Approximation
RQ Research Question
SAM Strategic Alignment Model
SCM Supply Chain Management
SEM Structural Equation Modeling
SIS Strategic Information System
SIW Social Innovation at Work
SOX Sarbanes-Oxley Act of 2002
SP Social Performance
SRMR Standardized Root Mean square Residual
TBL Triple Bottom Line
TLI Tucker–Lewis Index
TPS Transaction Processing System
UAMS - ITAG University of Antwerp Management School - IT Alignment and
Governance Research Institute
VAL IT Value from IT
WLS Weighted Least Square
xi
List of Definitions
Definition 2-1 Information Technology ............................................................................................................................ 22
Definition 2-2 Information Systems ................................................................................................................................. 22
Definition 2-3 Strategy ..................................................................................................................................................... 23
Definition 2-4 Strategic Management ............................................................................................................................... 23
Definition 2-5 Strategic IT ................................................................................................................................................ 24
Definition 2-6 IT Strategy (ITS) ....................................................................................................................................... 25
Definition 2-7 Integration ................................................................................................................................................. 28
Definition 2-8 Alignment ................................................................................................................................................. 29
Definition 2-9 IT Business Strategic Alignment (ITBSA) ............................................................................................... 29
Definition 2-10 Social Alignment ..................................................................................................................................... 31
Definition 2-11 Governance ............................................................................................................................................. 34
Definition 2-12 Corporate Governance ............................................................................................................................ 35
Definition 2-13 IT Governance ......................................................................................................................................... 36
Definition 2-14 Enterprise Governance of IT ................................................................................................................... 36
Definition 2-15 Process Innovation .................................................................................................................................. 38
Definition 2-16 Product Innovation .................................................................................................................................. 39
Definition 2-17 Social Innovation .................................................................................................................................... 41
Definition 2-18 Workplace Innovation ............................................................................................................................. 41
Definition 2-19 Inter-Departmental Collaboration on SIW .............................................................................................. 43
Definition 3-1 IT Business Value ..................................................................................................................................... 46
Definition 4-1 Mediating Variable ................................................................................................................................... 65
Definition 4-2 Moderating Variable ................................................................................................................................. 66
Definition 4-3 The Balanced Score Card (BSC) ............................................................................................................... 68
Definition 6-1 Structural Equation Modeling ................................................................................................................. 113

xii
This page is intentionally left blank
xiii
List of Figures
Figure 1-1 IT investments-performance relationship .......................................................................................................... 3
Figure 1-2 IT investments-performance relationship including ITBSA in the value chain ................................................ 4
Figure 1-3 IT investments-performance relationship, ......................................................................................................... 7
Figure 1-4 The combination EGIT-SIW along the path of IT investments ........................................................................ 9
Figure 2-1 Basic framework of the alignment between IT and business strategies .......................................................... 31
Figure 2-2 Strategic alignment model SAM ..................................................................................................................... 32
Figure 3-1 The concepts and relationships to be explored in Chapter 3 ........................................................................... 45
Figure 3-2 Literature review of IT, ITBSA and performance ........................................................................................... 46
Figure 3-3 Literature review of SIW ................................................................................................................................ 52
Figure 3-4 Literature review of EGIT ............................................................................................................................... 60
Figure 4-1 Path diagram for the basic casual chain of a mediator model ......................................................................... 66
Figure 4-2 The conceptual depiction of a moderating relation between A & B ............................................................... 67
Figure 4-3 Path diagram for testing a moderating effect .................................................................................................. 67
Figure 4-4 The causal relationship in the BSC framework ............................................................................................... 70
Figure 4-5 Cascading the Balanced Score Card to the departmental level ....................................................................... 71
Figure 4-6 IT engagement model components ................................................................................................................. 73
Figure 4-7 IT engagement model linkages ....................................................................................................................... 73
Figure 4-8 Conceptual Model: ITBSA – SIW relationship .............................................................................................. 75
Figure 4-9 Conceptual Model: the SIW-Performance relationship – RQ2 ....................................................................... 75
Figure 4-10 Conceptual Model: the mediating effect of SIW ........................................................................................... 75
Figure 4-11 Conceptual Model: the formal mediating model of SIW .............................................................................. 76
Figure 4-12 Conceptual Model: EGIT as an antecedent to ITBSA .................................................................................. 77
Figure 4-13 Conceptual Model: the mediating effect of EGIT ......................................................................................... 77
Figure 4-14 Conceptual Model: the moderating effect of EGIT ....................................................................................... 78
Figure 4-15 Moderated mediation vs. mediated moderation ............................................................................................ 81
Figure 4-16 The complete conceptual model .................................................................................................................... 84
Figure 5-1 The conceptual model with references to subsections .................................................................................... 86
Figure 5-2 Average maturity levels of processes, structure and relational mechanisms ................................................. 108
Figure 6-1 CFA Before model modification ................................................................................................................... 124
Figure 6-2 CFA After model modification ..................................................................................................................... 128
Figure 6-3 SEM model - direct effect of ITBSA on SIW ............................................................................................... 131
Figure 6-4 Direct Effect of SIW on Performance ........................................................................................................... 133
Figure 6-5 Model 1, direct effect of ITBSA on Performance ......................................................................................... 136
Figure 6-6 Model 2, the mediation model of SIW .......................................................................................................... 139
Figure 6-7 SEM model of moderated mediation ............................................................................................................ 141
Figure 6-8 The complete moderated mediation SEM model .......................................................................................... 142

xiv
This page is left intentionally blank
xv
List of Tables
Table 1-1 The relation between chapters, PS and RQs, and research methodologies ....................................................... 17
Table 2-1 IT Evolution and strategic relevance ................................................................................................................ 26
Table 2-2 Six common types of alignment in literature and practice ............................................................................... 28
Table 2-3 Various definitions of ITBSA in the literature ................................................................................................. 30
Table 2-4 Social innovation categorization ...................................................................................................................... 40
Table 4-1 Five types of complex models combining mediation and moderation ............................................................. 83
Table 5-1 The six levels of EGIT maturity assessment .................................................................................................... 88
Table 5-2 Statements of the ITBSA questionnaire ........................................................................................................... 93
Table 5-3 Items used to evaluate the EGIT construct for processes ................................................................................. 94
Table 5-4 Items used to evaluate the EGIT construct for structures ................................................................................. 95
Table 5-5 Items used to evaluate the EGIT construct for Relational Mechanisms ........................................................... 96
Table 5-6 Operationalization statements for the SIW construct ....................................................................................... 98
Table 5-7 The performance data collection instrument .................................................................................................... 99
Table 5-8 Study response rate ......................................................................................................................................... 100
Table 5-9 Overview of the participating organizations in the survey ............................................................................. 103
Table 5-10 ITBSA data descriptive statistics .................................................................................................................. 106
Table 5-11 ITBSA scores by sector ................................................................................................................................ 106
Table 5-12 The basic distribution of the EGIT in the collected data ............................................................................. 107
Table 5-13 Descriptive statistics of the EGIT components ............................................................................................ 108
Table 5-14 Factors hampering innovation ...................................................................................................................... 109
Table 5-15 Descriptive statistics for the SIW collected data .......................................................................................... 110
Table 5-16 Descriptive statistics of the effect of SIW on departmental performance .................................................... 110
Table 6-1 Model fit indicators and threshold values ....................................................................................................... 121
Table 6-2 Results of initial CFA run............................................................................................................................... 125
Table 6-3 Reliability statistics ........................................................................................................................................ 128
Table 6-4 Convergent/discriminant validity and correlations ......................................................................................... 129
Table 6-5 Summary of the SEM models results ............................................................................................................. 145

xvi
This page is intentionally left blank
CHAPTER 1 INTRODUCTION
The relation between Information Technology (IT) investments and business performance is a
challenging topic of research. In the recent years, it has been investigated from many perspectives
(cf. Mithas & Rust, 2016). It is claimed that the stronger the strategic alignment of IT is with the
business strategy, the more gain a firm achieves from IT investments and the more profitable a firm
will be (cf. Luftman, 2015). Moreover, it is stated that about half of a firm’s profits can be explained
by IT alignment with the business strategy. However, only one-quarter of the firms achieve the aimed
alignment (and hence the desired profitability) (cf. Laudon & Laudon, 2014).
A modern line of research is studying IT governance which is nowadays seen as a serious player in
realizing the envisaged organizational values from the precious IT investments (see De Haes &
Grembergen, 2009; Coleman & Chatfield, 2011; Haghjoo, 2012; De Haes & Grembergen, 2013; Shin,
Lee, Kim, & Rhim, 2015). Researchers and practitioners currently understand quite well that the value
from the IT investments will mostly be created at the business side. By understanding the impact, we
are aware that some business values may lead to social changes. Those social changes may in turn
lead to social innovation at the departmental level, at the firm level, and even at a broader level, i.e.,
at national level and global level. Yet, the technological innovation will remain the main initiation
concerning IT involvement and IT investment. Therefore, we will start with a focus on the business
side and will examine the social dimension thereafter.
Following the recent societal development, researchers and practitioners initiated a shift in the
definition of IT governance by focusing on the business involvement. The shift resulted in the
occurrence of Enterprise Governance of IT (EGIT). This thesis will investigate (1) to what extent
business and its strategic involvement with IT is crucial for organizational performance and (2) how
this crucial relationship is affected by EGIT. Our research aim is to develop a framework for an IT-
strategy implementation. The effect and positioning of the implementation will be thoroughly
examined in terms of (a) Information Technology and Business Strategic Alignment (ITBSA), and
(b) the firm’s performance as signified by the Social Innovation at Work (SIW) and the departmental-
level performance.
The relation between IT governance and the productivity resulting from IT investments has received
much attention from researchers over the past ten years (cf. Haghjoo, 2012; Berghout & Tan, 2013;
Lunardi, Becker, Macada, & Dolci, 2014). Yet, the voices were diverse: they showed controversy

Cha
pter
1
xvi
This page is intentionally left blank
CHAPTER 1 INTRODUCTION
The relation between Information Technology (IT) investments and business performance is a
challenging topic of research. In the recent years, it has been investigated from many perspectives
(cf. Mithas & Rust, 2016). It is claimed that the stronger the strategic alignment of IT is with the
business strategy, the more gain a firm achieves from IT investments and the more profitable a firm
will be (cf. Luftman, 2015). Moreover, it is stated that about half of a firm’s profits can be explained
by IT alignment with the business strategy. However, only one-quarter of the firms achieve the aimed
alignment (and hence the desired profitability) (cf. Laudon & Laudon, 2014).
A modern line of research is studying IT governance which is nowadays seen as a serious player in
realizing the envisaged organizational values from the precious IT investments (see De Haes &
Grembergen, 2009; Coleman & Chatfield, 2011; Haghjoo, 2012; De Haes & Grembergen, 2013; Shin,
Lee, Kim, & Rhim, 2015). Researchers and practitioners currently understand quite well that the value
from the IT investments will mostly be created at the business side. By understanding the impact, we
are aware that some business values may lead to social changes. Those social changes may in turn
lead to social innovation at the departmental level, at the firm level, and even at a broader level, i.e.,
at national level and global level. Yet, the technological innovation will remain the main initiation
concerning IT involvement and IT investment. Therefore, we will start with a focus on the business
side and will examine the social dimension thereafter.
Following the recent societal development, researchers and practitioners initiated a shift in the
definition of IT governance by focusing on the business involvement. The shift resulted in the
occurrence of Enterprise Governance of IT (EGIT). This thesis will investigate (1) to what extent
business and its strategic involvement with IT is crucial for organizational performance and (2) how
this crucial relationship is affected by EGIT. Our research aim is to develop a framework for an IT-
strategy implementation. The effect and positioning of the implementation will be thoroughly
examined in terms of (a) Information Technology and Business Strategic Alignment (ITBSA), and
(b) the firm’s performance as signified by the Social Innovation at Work (SIW) and the departmental-
level performance.
The relation between IT governance and the productivity resulting from IT investments has received
much attention from researchers over the past ten years (cf. Haghjoo, 2012; Berghout & Tan, 2013;
Lunardi, Becker, Macada, & Dolci, 2014). Yet, the voices were diverse: they showed controversy

2 Introduction
and mixed findings (see, e.g., Syaiful, 2006; Bowen, Cheung & Rohde, 2007; Luftman & Ben-Zvi,
2009; Berghout & Tan, 2013). When going back into history, Solow (1987) was one of the first
researchers who asserted: “we see computers age everywhere, except in the productivity statistics”.
His assertion was based on a phenomenon that has puzzled many researchers up to then. It is
commonly known as the “Productivity Paradox”. It poses the question of why information
technologies have not provided a measurable value to the business world?
In this chapter, we provide some relevant background on the relationship between IT investments and
a firm’s performance (section 1.1). The role of IT-Business Strategic Alignment (in this thesis
referred to as ITBSA) on this relationship is described in section 1.2. Social innovation at work (SIW)
is addressed in section 1.3. EGIT as a major factor in the relationship between IT investments and
performance is introduced in section 1.4. Section 1.5 formulates the problem statement of this
research. Four research questions are given in section 1.6. Section 1.7 describes the research
methodologies. The aim of the study is described in section 1.8. Section 1.9 provides the significance
of the study and its main contributions. Finally, the structure of the thesis is described in section 1.10.
1.1 IT Investments and a Firm’s Performance
Information technology often entails large capital investments in organizations (cf. Almajali &
Dahalin, 2011; Berghout & Tan, 2013; Renaud, Walsh, & Kalika, 2016). In spite of the considerably
large investments in IT, only a few studies on this topic have revealed the desired positive impact (cf.
Schwarz, Kalika, Kefi, & Schwarz, 2010; Wong, Ngan, Chan, & Chong, 2012). Due to this fact, and
due to the recent global economic recessions, there is an increased pressure by senior management to
reduce IT spending and to simultaneously increase the business value from IT (cf. Coleman &
Chatfield, 2011). A majority of productivity indicators point to a stagnating productivity growth or
even a productivity slowdown at the aggregate level (see, e.g., in the past DeJager, 1995; more
recently, Almajali & Dahalin, 2011). The view is in agreement with Strassmann (1990) who indicated
that studies prior and during the 1980s found no direct relationship between IT investment and
productivity neither at the level of organizations and industries, nor at the level of the economy.
Historically, researchers have generated mixed results. For example, Brynjolfsson (1993) showed no
significant correlation between IT investment and firm performance. Other researchers have
supported this view by calling attention to the intermediate processes that benefit from IT rather than
claiming a direct link from IT to organizational value (see, e.g., Schwarz et al., 2010; Maçada,
Beltrame, Dolci, & Becker, 2012). In contrast, a third group of researchers have pointed to a positive
relationship between IT and organizational value (see, e.g., Rayner, 1995; Rai, Patnayakuni, &
From IT Business Strategic Alignment to Performance 3
Patnayakuni, 1997; Neirotti & Paolucci, 2007; Coleman & Chatfield, 2011; Lunardi et al., 2014). Of
course, such a controversy gave rise to a demand for further detailed research into assessing the IT-
related impact on the organizational value. By the observed diversity, it was clear that the required
research should have a fundamental nature. Therefore, it should examine the causal links between IT
and organizational performance (see Sabherwal & Chan, 2001; Chan, Sabherwal, & Tatcher, 2006).
The challenge was to identify the critical factors on the path from IT investments to a firm’s
performance (cf. Im, Dow, & Grover, 2001) as shown in Figure 1-1.
1.2 IT Business Strategic Alignment (ITBSA)
IT Business Strategic Alignment (ITBSA) is an ambiguous and a complex issue in strategy and (IT)
research (cf. Debreceny & Gray, 2011; Acur, Kandemir, & Boer, 2012; Coltman, Tallon, Sharma, &
Queiroz, 2015). In general, there is no consensus on (1) what exactly alignment is1, and (2) how it
could be defined or measured. With respect to measurement, academics and practitioners do not agree
what measures should be taken to maintain and improve the level of strategic alignment (cf. Silva,
Plazaola, & Ekstedt, 2006; Schwarz et al., 2010; Jorfi & Jorfi, 2011; Wong et al., 2012).
Research has explored at least six types of alignments, including (a) business alignment, (b) IT
alignment, (c) contextual alignment, (d) structural alignment, (e) strategic alignment, and (f) social
alignment. The focus of our research is on strategic alignment, viz. ITBSA as defined in Ch2,
Definition 2-9.
At the beginning of this century two alignment-related phenomena started to happen, (1) chief
executive officers (CEOs) started to be more involved in IT-strategy formulation, and (2) chief
information officers (CIOs) begun to be more active in organizational-strategy design and planning
(cf. Tam, 2007; Baker & Jones, 2008; Luftman & Ben-Zvi, 2010). As a result of (1) and (2) there has
been an increased interest in examining the ITBSA concept. Below we briefly discuss four groups of
researchers.
1 Chapter 2 will present various forms of alignment, see Table 2-2.
IT Investments Performance
Figure 1-1 IT investments-performance relationship
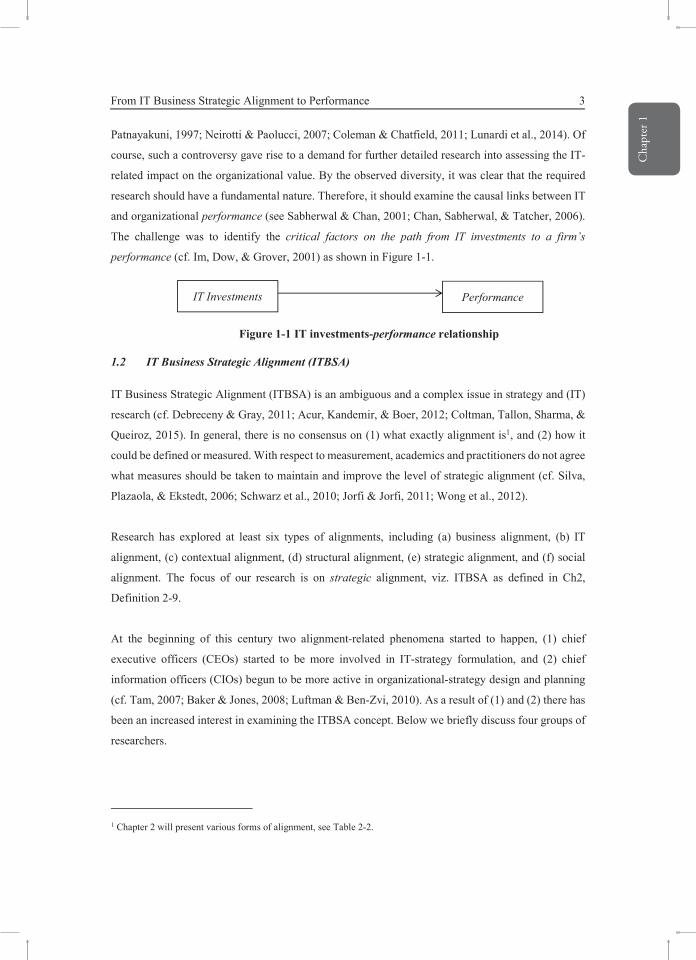
Cha
pter
1
2 Introduction
and mixed findings (see, e.g., Syaiful, 2006; Bowen, Cheung & Rohde, 2007; Luftman & Ben-Zvi,
2009; Berghout & Tan, 2013). When going back into history, Solow (1987) was one of the first
researchers who asserted: “we see computers age everywhere, except in the productivity statistics”.
His assertion was based on a phenomenon that has puzzled many researchers up to then. It is
commonly known as the “Productivity Paradox”. It poses the question of why information
technologies have not provided a measurable value to the business world?
In this chapter, we provide some relevant background on the relationship between IT investments and
a firm’s performance (section 1.1). The role of IT-Business Strategic Alignment (in this thesis
referred to as ITBSA) on this relationship is described in section 1.2. Social innovation at work (SIW)
is addressed in section 1.3. EGIT as a major factor in the relationship between IT investments and
performance is introduced in section 1.4. Section 1.5 formulates the problem statement of this
research. Four research questions are given in section 1.6. Section 1.7 describes the research
methodologies. The aim of the study is described in section 1.8. Section 1.9 provides the significance
of the study and its main contributions. Finally, the structure of the thesis is described in section 1.10.
1.1 IT Investments and a Firm’s Performance
Information technology often entails large capital investments in organizations (cf. Almajali &
Dahalin, 2011; Berghout & Tan, 2013; Renaud, Walsh, & Kalika, 2016). In spite of the considerably
large investments in IT, only a few studies on this topic have revealed the desired positive impact (cf.
Schwarz, Kalika, Kefi, & Schwarz, 2010; Wong, Ngan, Chan, & Chong, 2012). Due to this fact, and
due to the recent global economic recessions, there is an increased pressure by senior management to
reduce IT spending and to simultaneously increase the business value from IT (cf. Coleman &
Chatfield, 2011). A majority of productivity indicators point to a stagnating productivity growth or
even a productivity slowdown at the aggregate level (see, e.g., in the past DeJager, 1995; more
recently, Almajali & Dahalin, 2011). The view is in agreement with Strassmann (1990) who indicated
that studies prior and during the 1980s found no direct relationship between IT investment and
productivity neither at the level of organizations and industries, nor at the level of the economy.
Historically, researchers have generated mixed results. For example, Brynjolfsson (1993) showed no
significant correlation between IT investment and firm performance. Other researchers have
supported this view by calling attention to the intermediate processes that benefit from IT rather than
claiming a direct link from IT to organizational value (see, e.g., Schwarz et al., 2010; Maçada,
Beltrame, Dolci, & Becker, 2012). In contrast, a third group of researchers have pointed to a positive
relationship between IT and organizational value (see, e.g., Rayner, 1995; Rai, Patnayakuni, &
From IT Business Strategic Alignment to Performance 3
Patnayakuni, 1997; Neirotti & Paolucci, 2007; Coleman & Chatfield, 2011; Lunardi et al., 2014). Of
course, such a controversy gave rise to a demand for further detailed research into assessing the IT-
related impact on the organizational value. By the observed diversity, it was clear that the required
research should have a fundamental nature. Therefore, it should examine the causal links between IT
and organizational performance (see Sabherwal & Chan, 2001; Chan, Sabherwal, & Tatcher, 2006).
The challenge was to identify the critical factors on the path from IT investments to a firm’s
performance (cf. Im, Dow, & Grover, 2001) as shown in Figure 1-1.
1.2 IT Business Strategic Alignment (ITBSA)
IT Business Strategic Alignment (ITBSA) is an ambiguous and a complex issue in strategy and (IT)
research (cf. Debreceny & Gray, 2011; Acur, Kandemir, & Boer, 2012; Coltman, Tallon, Sharma, &
Queiroz, 2015). In general, there is no consensus on (1) what exactly alignment is1, and (2) how it
could be defined or measured. With respect to measurement, academics and practitioners do not agree
what measures should be taken to maintain and improve the level of strategic alignment (cf. Silva,
Plazaola, & Ekstedt, 2006; Schwarz et al., 2010; Jorfi & Jorfi, 2011; Wong et al., 2012).
Research has explored at least six types of alignments, including (a) business alignment, (b) IT
alignment, (c) contextual alignment, (d) structural alignment, (e) strategic alignment, and (f) social
alignment. The focus of our research is on strategic alignment, viz. ITBSA as defined in Ch2,
Definition 2-9.
At the beginning of this century two alignment-related phenomena started to happen, (1) chief
executive officers (CEOs) started to be more involved in IT-strategy formulation, and (2) chief
information officers (CIOs) begun to be more active in organizational-strategy design and planning
(cf. Tam, 2007; Baker & Jones, 2008; Luftman & Ben-Zvi, 2010). As a result of (1) and (2) there has
been an increased interest in examining the ITBSA concept. Below we briefly discuss four groups of
researchers.
1 Chapter 2 will present various forms of alignment, see Table 2-2.
IT Investments Performance
Figure 1-1 IT investments-performance relationship

4 Introduction
The first group of researchers (called academic researchers) studied the antecedents of the ITBSA
concept in various research projects such as those described by Sabherwal & Chan (2001), Chan et
al. (2006), Maçada et al. (2012), and Wu, Detmar, & Liang (2015).
The second group of researchers had a somewhat different orientation (called application-oriented
researchers). They explored the consequences of ITBSA (e.g., Kearns & Lederer, 2001; Kearns &
Sabherwal, 2006; Byrd, Lewis, & Bryan, 2006; Kathuria, Joshi, & Porth, 2007; Acur et al., 2012;
Luftman, 2015)2.
The third group of researchers (called organization-oriented researchers) suggested that ITBSA is a
construct that helps organizations improve the positive impact of IT investments on organizational
successes (see, Henderson & Venkatraman, 1993; Luftman, 2000; Sabherwal & Chan, 2001; Chan et
al., 2006; Kathuria et al., 2007; Dong, Liu & Yin, 2008; ITGI, 2008; Issa-Salwe, Ahmed, Aloufi, &
Kabir, 2010; Jorfi & Jorfi, 2011; Wu et al., 2015).
The fourth group (called environment-oriented researchers) even goes as far as asserting that (1)
alignment is important for organizational performance, and (2) that misalignment leads to losing
competitive advantage by increasing wasted effort and creating a negative environment for IT
investments (cf. Silva et al., 2006; Tallon, 2011). They consider (2) as equally important to (1).
Based on the studies mentioned above, Figure 1-2 depicts the proposed IT- investment value-chain
framework including the ITBSA concept.
1.3 Three Different Types of Innovation
This subsection focuses on the positioning of the social innovation concept within the relationship
between ITBSA and performance. Hence, we discuss three types of innovation, viz. technological
innovation, social innovation, and social innovation at the workplace (SIW). In order to achieve
significant results in information systems research, it was already a long time ago stated that there is
2 Section 3.4 describes in details some of the most noticeable studies of antecedents and consequences of ITBSA.
IT Investments Performance ITBSA
Figure 1-2 IT investments-performance relationship including ITBSA in the value chain
(a) (b)
From IT Business Strategic Alignment to Performance 5
a need to “identify the variables on which the technology is likely to have more direct impact” (Bakos,
1987). In line with this statement, we briefly discuss the European Commission. The idea was that
knowing the right variables could lead to a technology push, which, by turning the variable in the
right way, would either speed up delivery or improve the production and services. We show a first
linear path upwards.
Technological innovation
Technological innovation as the first type of identified innovation, was long thought to have a positive
impact on the effectiveness of IT investments, e.g., by increasing the speed (production and delivery)
and the availability of products and services with shorter lead times and more novelty (see, e.g., Licht
& Moch, 1999). In those times, IT-performance studies focused on the economic approach in
evaluating the IT outcomes (cf. Berghout & Tan, 2013). They used performance indicators such as
(1) profitability, (2) efficiency, and (3) growth (cf. Oh & Pinsonneault, 2007). In the period 2000-
2010, researchers have reached a consensus that only relying on any one of those traditional financial
indicators is not always efficient to assess the IT value for business (cf., e.g., Maçada et al., 2012).
Social Innovation
Currently, the evaluation of IT results is given from a socio-technical perspective (see, e.g., Bechor,
Neumann, Zviran, & Glezer, 2010; Koh, Gunasekaran, & Goodman, 2011; Li & Mao, 2012). This
consensus on a socio-technical approach has had two major effects.
(1) From the technical portion of the approach, it provided credibility to the view that ITBSA is
identified as one of the key preconditions for a successful innovation activity as previously
expressed by several authors (cf. Whitley, 2002; Petrovic, Mihic, & Stosic, 2009; Neubert,
Dominguez, & Ageron, 2011).
(2) From the social portion of the approach, mainly due to the shift towards knowledge-based
economies (see Oeij, Dhondt, & Kraan, 2012; Nichols, Phipps, Provençal, & Hewitt, 2013), there
was also a paradigm shift on innovation.
So, the technological innovation moved towards the recognition of social innovation. Here social
innovation was a newly identified innovation to be considered as a catalyst of sustainable economic
growth (cf. Dortmund/Brussels Declaration, 2012; EC, DG Regional & Urban Policy, 2013; Nichols
et al., 2013). The transition from pure technological innovation to social innovation was facilitated

Cha
pter
1
4 Introduction
The first group of researchers (called academic researchers) studied the antecedents of the ITBSA
concept in various research projects such as those described by Sabherwal & Chan (2001), Chan et
al. (2006), Maçada et al. (2012), and Wu, Detmar, & Liang (2015).
The second group of researchers had a somewhat different orientation (called application-oriented
researchers). They explored the consequences of ITBSA (e.g., Kearns & Lederer, 2001; Kearns &
Sabherwal, 2006; Byrd, Lewis, & Bryan, 2006; Kathuria, Joshi, & Porth, 2007; Acur et al., 2012;
Luftman, 2015)2.
The third group of researchers (called organization-oriented researchers) suggested that ITBSA is a
construct that helps organizations improve the positive impact of IT investments on organizational
successes (see, Henderson & Venkatraman, 1993; Luftman, 2000; Sabherwal & Chan, 2001; Chan et
al., 2006; Kathuria et al., 2007; Dong, Liu & Yin, 2008; ITGI, 2008; Issa-Salwe, Ahmed, Aloufi, &
Kabir, 2010; Jorfi & Jorfi, 2011; Wu et al., 2015).
The fourth group (called environment-oriented researchers) even goes as far as asserting that (1)
alignment is important for organizational performance, and (2) that misalignment leads to losing
competitive advantage by increasing wasted effort and creating a negative environment for IT
investments (cf. Silva et al., 2006; Tallon, 2011). They consider (2) as equally important to (1).
Based on the studies mentioned above, Figure 1-2 depicts the proposed IT- investment value-chain
framework including the ITBSA concept.
1.3 Three Different Types of Innovation
This subsection focuses on the positioning of the social innovation concept within the relationship
between ITBSA and performance. Hence, we discuss three types of innovation, viz. technological
innovation, social innovation, and social innovation at the workplace (SIW). In order to achieve
significant results in information systems research, it was already a long time ago stated that there is
2 Section 3.4 describes in details some of the most noticeable studies of antecedents and consequences of ITBSA.
IT Investments Performance ITBSA
Figure 1-2 IT investments-performance relationship including ITBSA in the value chain
(a) (b)
From IT Business Strategic Alignment to Performance 5
a need to “identify the variables on which the technology is likely to have more direct impact” (Bakos,
1987). In line with this statement, we briefly discuss the European Commission. The idea was that
knowing the right variables could lead to a technology push, which, by turning the variable in the
right way, would either speed up delivery or improve the production and services. We show a first
linear path upwards.
Technological innovation
Technological innovation as the first type of identified innovation, was long thought to have a positive
impact on the effectiveness of IT investments, e.g., by increasing the speed (production and delivery)
and the availability of products and services with shorter lead times and more novelty (see, e.g., Licht
& Moch, 1999). In those times, IT-performance studies focused on the economic approach in
evaluating the IT outcomes (cf. Berghout & Tan, 2013). They used performance indicators such as
(1) profitability, (2) efficiency, and (3) growth (cf. Oh & Pinsonneault, 2007). In the period 2000-
2010, researchers have reached a consensus that only relying on any one of those traditional financial
indicators is not always efficient to assess the IT value for business (cf., e.g., Maçada et al., 2012).
Social Innovation
Currently, the evaluation of IT results is given from a socio-technical perspective (see, e.g., Bechor,
Neumann, Zviran, & Glezer, 2010; Koh, Gunasekaran, & Goodman, 2011; Li & Mao, 2012). This
consensus on a socio-technical approach has had two major effects.
(1) From the technical portion of the approach, it provided credibility to the view that ITBSA is
identified as one of the key preconditions for a successful innovation activity as previously
expressed by several authors (cf. Whitley, 2002; Petrovic, Mihic, & Stosic, 2009; Neubert,
Dominguez, & Ageron, 2011).
(2) From the social portion of the approach, mainly due to the shift towards knowledge-based
economies (see Oeij, Dhondt, & Kraan, 2012; Nichols, Phipps, Provençal, & Hewitt, 2013), there
was also a paradigm shift on innovation.
So, the technological innovation moved towards the recognition of social innovation. Here social
innovation was a newly identified innovation to be considered as a catalyst of sustainable economic
growth (cf. Dortmund/Brussels Declaration, 2012; EC, DG Regional & Urban Policy, 2013; Nichols
et al., 2013). The transition from pure technological innovation to social innovation was facilitated

6 Introduction
by (a) the melt down of the boundaries between the private and social sectors (cf. Murray, Caulier-
Grice, & Mulgan, 2010) and (b) the commitment of EU Member States and institutions to pursuing
the Europe 2020 Strategy with the aim of transforming the EU into a sustainable economy and the
recognition that social innovation was to become an important prerequisite for achieving the 2020
goals (Dortmund/Brussels Position paper, 2012). We provide a full description and a formal definition
of social innovation in Chapter 2, subsection 2.3.2.
Workplace Innovation
Workplace Innovation is complimentary to both technological innovation (cf. Pot, Dhondt, de Korte,
Oeij, & Vaas, 2012) and social innovation (EC, DG Regional & Urban Policy, 2013). The cited
authors argue that it includes several managerial aspects, such as effective management, leadership,
the culture of working smarter, continuous improvement of skills and competencies, and mainly,
networking between and/or within organizations. On the service front, it includes service-oriented
aspects such as in-service products, new or improved ways of designing and producing services, and
the actual innovation of the service-oriented organizations. Furthermore, Pot et al. (2012) argue that
organizations can only gain the assumed benefits of technological innovation if it is effectively rooted
in a workplace innovation environment.
Hence social innovation is quite closely associated with Workplace Innovation (cf. Pot et al., 2012;
Dortmund/Brussels Position Paper, 2012). Workplace Innovation is considered the representation of
“Social Innovation at the organizational level”. For our study, we take the Workplace Innovation as
the third type of identified innovation. Immediately after this decision we remark that in the
Netherlands and Belgium the term social innovation is used to express workplace innovation (cf. EC,
DG Regional & Urban Policy, 2013). It is often expressed as social innovation at work (or at the
workplace) which covers the societal level (labor market innovation) and organizational level
(workplace innovation) (see Pot et al., 2012). Therefore, in the context of this thesis we will use the
term Social Innovation at Work (SIW) to represent Workplace Innovation3.
The European Commission
With regard to the relation between SIW and organizational performance, the European Commission
has for a long time acknowledged that (1) economies are increasingly dependent on knowledge and
3 Detailed discussion and definitions of workplace innovation and social innovation are provided in Chapter 2 (subsection
2.3.2).
From IT Business Strategic Alignment to Performance 7
information, and (2) innovative competence is considered a key driver of long-term competitiveness
and business success (see, EC, 2004; OECD Eurostat, 2005; European Commission, 2009).
Furthermore, research in the Netherlands has shown that social innovative organizations are ahead in
their performance compared to the non-social innovative ones (cf. Pot et al., 2012). This view concurs
with several previous examinations (see, e.g., Narayanan, 2001; Kleinknecht & Mohnen, 2002). The
authors of the publications have always supported the view of the positive relationship between an
innovative activity and a firm’s performance. Further discussion of this topic and a focused literature
review is presented in Chapter 3.
A first linear path upwards
Figure 1-3 demonstrates our conceptualization of the path from IT investments to a firm’s
performance in a linear format for conceptual demonstration purposes. At a later stage, we formulate
a model that demonstrates the actual relationships (moderating and/or mediating relationships) from
IT investments to a firm’s performance.
Enterprise Governance of IT (EGIT)
In this section, we are concerned with Enterprise Governance of IT (EGIT). The EGIT concept and
its positioning are discussed with regards to the relationship between ITBSA and SIW.
The relationship between ITBSA and performance is controversial. Tallon (2011) argues that the
relation is not a direct relation. Considering the relationship, we see two major opinions in the
literature. On the one hand, West & Schwenk (1996), Homburg, Krohmer & Workman (1999), and
Joshi, Kathuria & Porth (2003) are in favor of a variety of factor(s) mediating this relationship. On
the other hand, other researchers are opining the view that the relationship is moderated by a range
of another factor(s) (cf. Lindman, Callarman, Fowler, & McClathey, 2001; Tallon & Pinsonneault,
2011)4. In our research, moderating will play a major part and therefore we will speak of mediating
and moderating (in this order) effect.
4 For definitions and detailed explanation of mediating and moderating variables, please see Chapter 2.
IT Investments
Performance ITBSA SIW
Figure 1-3 IT investments-performance relationship, including ITBSA and SIW
(a) (b) (c)
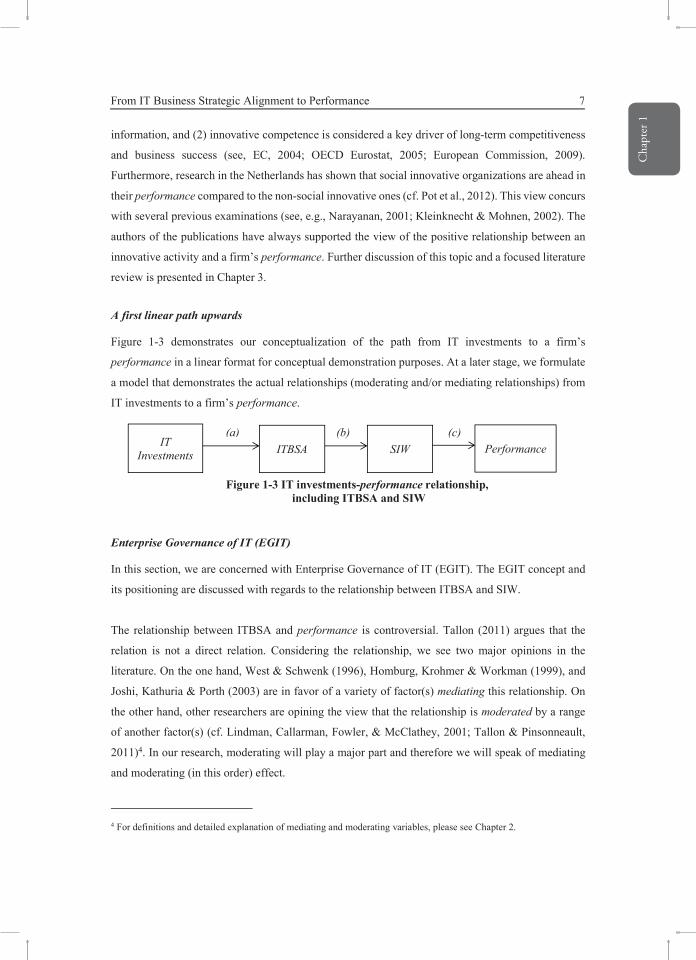
Cha
pter
1
6 Introduction
by (a) the melt down of the boundaries between the private and social sectors (cf. Murray, Caulier-
Grice, & Mulgan, 2010) and (b) the commitment of EU Member States and institutions to pursuing
the Europe 2020 Strategy with the aim of transforming the EU into a sustainable economy and the
recognition that social innovation was to become an important prerequisite for achieving the 2020
goals (Dortmund/Brussels Position paper, 2012). We provide a full description and a formal definition
of social innovation in Chapter 2, subsection 2.3.2.
Workplace Innovation
Workplace Innovation is complimentary to both technological innovation (cf. Pot, Dhondt, de Korte,
Oeij, & Vaas, 2012) and social innovation (EC, DG Regional & Urban Policy, 2013). The cited
authors argue that it includes several managerial aspects, such as effective management, leadership,
the culture of working smarter, continuous improvement of skills and competencies, and mainly,
networking between and/or within organizations. On the service front, it includes service-oriented
aspects such as in-service products, new or improved ways of designing and producing services, and
the actual innovation of the service-oriented organizations. Furthermore, Pot et al. (2012) argue that
organizations can only gain the assumed benefits of technological innovation if it is effectively rooted
in a workplace innovation environment.
Hence social innovation is quite closely associated with Workplace Innovation (cf. Pot et al., 2012;
Dortmund/Brussels Position Paper, 2012). Workplace Innovation is considered the representation of
“Social Innovation at the organizational level”. For our study, we take the Workplace Innovation as
the third type of identified innovation. Immediately after this decision we remark that in the
Netherlands and Belgium the term social innovation is used to express workplace innovation (cf. EC,
DG Regional & Urban Policy, 2013). It is often expressed as social innovation at work (or at the
workplace) which covers the societal level (labor market innovation) and organizational level
(workplace innovation) (see Pot et al., 2012). Therefore, in the context of this thesis we will use the
term Social Innovation at Work (SIW) to represent Workplace Innovation3.
The European Commission
With regard to the relation between SIW and organizational performance, the European Commission
has for a long time acknowledged that (1) economies are increasingly dependent on knowledge and
3 Detailed discussion and definitions of workplace innovation and social innovation are provided in Chapter 2 (subsection
2.3.2).
From IT Business Strategic Alignment to Performance 7
information, and (2) innovative competence is considered a key driver of long-term competitiveness
and business success (see, EC, 2004; OECD Eurostat, 2005; European Commission, 2009).
Furthermore, research in the Netherlands has shown that social innovative organizations are ahead in
their performance compared to the non-social innovative ones (cf. Pot et al., 2012). This view concurs
with several previous examinations (see, e.g., Narayanan, 2001; Kleinknecht & Mohnen, 2002). The
authors of the publications have always supported the view of the positive relationship between an
innovative activity and a firm’s performance. Further discussion of this topic and a focused literature
review is presented in Chapter 3.
A first linear path upwards
Figure 1-3 demonstrates our conceptualization of the path from IT investments to a firm’s
performance in a linear format for conceptual demonstration purposes. At a later stage, we formulate
a model that demonstrates the actual relationships (moderating and/or mediating relationships) from
IT investments to a firm’s performance.
Enterprise Governance of IT (EGIT)
In this section, we are concerned with Enterprise Governance of IT (EGIT). The EGIT concept and
its positioning are discussed with regards to the relationship between ITBSA and SIW.
The relationship between ITBSA and performance is controversial. Tallon (2011) argues that the
relation is not a direct relation. Considering the relationship, we see two major opinions in the
literature. On the one hand, West & Schwenk (1996), Homburg, Krohmer & Workman (1999), and
Joshi, Kathuria & Porth (2003) are in favor of a variety of factor(s) mediating this relationship. On
the other hand, other researchers are opining the view that the relationship is moderated by a range
of another factor(s) (cf. Lindman, Callarman, Fowler, & McClathey, 2001; Tallon & Pinsonneault,
2011)4. In our research, moderating will play a major part and therefore we will speak of mediating
and moderating (in this order) effect.
4 For definitions and detailed explanation of mediating and moderating variables, please see Chapter 2.
IT Investments
Performance ITBSA SIW
Figure 1-3 IT investments-performance relationship, including ITBSA and SIW
(a) (b) (c)

8 Introduction
In the next four paragraphs, we provide a brief overview leading to the need for a strategy
implementation framework. We conclude by proposing to involve EGIT with SIW to be an
appropriate factor in improving the performance.
Business Mission and IT Strategies
Every firm has its own business mission. In close connection with the business mission, the IT
strategies are formulated (see Lahdelma, 2010). ITBSA underlines the concurrence of the business
mission and the IT strategies. Moreover, ITBSA emphasizes the reciprocity. As a consequence,
planning and assimilation of the objectives need to be studied in depth. On the one side, we see the
missions’ assimilation of business and IT. On the other side, we see strategy assimilation of IT
objectives and strategic plans. Both Lahdelma (2010) and Tallon (2011) describe these two
observations and confirm their existence. They assert (1) that there exists a dual strategy and (2) that
a cross-referenced formal written business mission may coincide with IT plans. So, there is a need to
examine how the strategy is realized in practice in order to achieve the desired performance results.
Strategy Implementation
As early as in 1998 it was argued that the area of strategy implementation, which deals with the
operationalization of strategic plans, has been largely neglected (cf. Roberts & Gardiner, 1998). This
was later confirmed through an extensive literature review by Silva et al. (2006). They showed that
(1) approximately 60% of references to strategic alignment referred only to the strategic integration
(the external focus) and (2) approximately 40% of the references to strategic alignment referred only
to the functional integration (the internal focus). The trend with two different tracks continued as
confirmed by Cameron (2009) who argued as follows:
“The process for operationalizing strategic plans is still largely unexplored territory. It is difficult to
envision how successful strategic plans can be devised in the absence of knowledge about how they
are to be implemented.”
IT Governance
As a result of the repeated calls since the 1990s on the need for a strategy implementation framework,
we see that both tracks have been converging to one concept, viz. the concept of IT governance. This
concept has been emerging as a central issue gaining great attention in both business and IT domains
(see Syaiful, 2006; Coleman & Chatfield, 2011; Zarvic, Stolze, Boehm, & Thomas, 2012). Here, the
40% of the internal focus group took the lead. The components of the internal focus, such as
From IT Business Strategic Alignment to Performance 9
processes, metrics, structures, and governance (cf. Luftman & Kempaiah, 2008) have emerged and
are strongly proposed as supporting mechanisms to strategy implementation. The metrics component
was re-conceptualized into relational mechanisms in later models of EGIT. Chapter 2 provides a
detailed discussion and a definition of the EGIT concept.
EGIT and SIW
Figure 1-4 shows the proposed positioning of the EGIT concept in the IT investments - performance
relationship. Here we note again that the diagram does not depict a conceptual model in terms of the
mediating and moderating effects, it is merely a sequential picture of the involved concepts.
Therefore, both EGIT and SIW are in dotted lines. A detailed and scientific conceptualization of the
relation culminating in a model is given in Chapter 4.
A lack of research
In summary, we observe a lack of research along the path from ITBSA via EGIT and SIW to
performance ((b), (c) and (d)). However, our research will mainly explore the impact of the EGIT
and its components (processes, structures, and relational mechanisms) on the combined relationship
(b) + (c) (as given in Figure 1-4). The formulation of our problem statement will underline this
statement5.
1.4 The Problem Statement
As pointed out in section 1.1, Im, Dow, and Grover (2011) stated that the challenge is to identify
critical factors on the path from IT investments to a firm’s performance (which is (a), (b), (c), and (d)
in Figure 1-4). ITBSA was identified as a critical factor along the above mentioned causal path (see,
e.g., Kearns & Lederer 2000; Chan et al., 2006; Chan & Reich, 2007; Johnson & Lederer, 2010;
5 The relationship between SIW and performance (relationship (d) of figure 1-4) is investigated through the detailed
research questions, specifically, RQ2 & RQ3.
Figure 1-4 The combination EGIT-SIW along the path of IT investments
to a firm’s performance
IT Investments Performance ITBSA EGIT SIW
(a) (b)
(c) (d)

Cha
pter
1
8 Introduction
In the next four paragraphs, we provide a brief overview leading to the need for a strategy
implementation framework. We conclude by proposing to involve EGIT with SIW to be an
appropriate factor in improving the performance.
Business Mission and IT Strategies
Every firm has its own business mission. In close connection with the business mission, the IT
strategies are formulated (see Lahdelma, 2010). ITBSA underlines the concurrence of the business
mission and the IT strategies. Moreover, ITBSA emphasizes the reciprocity. As a consequence,
planning and assimilation of the objectives need to be studied in depth. On the one side, we see the
missions’ assimilation of business and IT. On the other side, we see strategy assimilation of IT
objectives and strategic plans. Both Lahdelma (2010) and Tallon (2011) describe these two
observations and confirm their existence. They assert (1) that there exists a dual strategy and (2) that
a cross-referenced formal written business mission may coincide with IT plans. So, there is a need to
examine how the strategy is realized in practice in order to achieve the desired performance results.
Strategy Implementation
As early as in 1998 it was argued that the area of strategy implementation, which deals with the
operationalization of strategic plans, has been largely neglected (cf. Roberts & Gardiner, 1998). This
was later confirmed through an extensive literature review by Silva et al. (2006). They showed that
(1) approximately 60% of references to strategic alignment referred only to the strategic integration
(the external focus) and (2) approximately 40% of the references to strategic alignment referred only
to the functional integration (the internal focus). The trend with two different tracks continued as
confirmed by Cameron (2009) who argued as follows:
“The process for operationalizing strategic plans is still largely unexplored territory. It is difficult to
envision how successful strategic plans can be devised in the absence of knowledge about how they
are to be implemented.”
IT Governance
As a result of the repeated calls since the 1990s on the need for a strategy implementation framework,
we see that both tracks have been converging to one concept, viz. the concept of IT governance. This
concept has been emerging as a central issue gaining great attention in both business and IT domains
(see Syaiful, 2006; Coleman & Chatfield, 2011; Zarvic, Stolze, Boehm, & Thomas, 2012). Here, the
40% of the internal focus group took the lead. The components of the internal focus, such as
From IT Business Strategic Alignment to Performance 9
processes, metrics, structures, and governance (cf. Luftman & Kempaiah, 2008) have emerged and
are strongly proposed as supporting mechanisms to strategy implementation. The metrics component
was re-conceptualized into relational mechanisms in later models of EGIT. Chapter 2 provides a
detailed discussion and a definition of the EGIT concept.
EGIT and SIW
Figure 1-4 shows the proposed positioning of the EGIT concept in the IT investments - performance
relationship. Here we note again that the diagram does not depict a conceptual model in terms of the
mediating and moderating effects, it is merely a sequential picture of the involved concepts.
Therefore, both EGIT and SIW are in dotted lines. A detailed and scientific conceptualization of the
relation culminating in a model is given in Chapter 4.
A lack of research
In summary, we observe a lack of research along the path from ITBSA via EGIT and SIW to
performance ((b), (c) and (d)). However, our research will mainly explore the impact of the EGIT
and its components (processes, structures, and relational mechanisms) on the combined relationship
(b) + (c) (as given in Figure 1-4). The formulation of our problem statement will underline this
statement5.
1.4 The Problem Statement
As pointed out in section 1.1, Im, Dow, and Grover (2011) stated that the challenge is to identify
critical factors on the path from IT investments to a firm’s performance (which is (a), (b), (c), and (d)
in Figure 1-4). ITBSA was identified as a critical factor along the above mentioned causal path (see,
e.g., Kearns & Lederer 2000; Chan et al., 2006; Chan & Reich, 2007; Johnson & Lederer, 2010;
5 The relationship between SIW and performance (relationship (d) of figure 1-4) is investigated through the detailed
research questions, specifically, RQ2 & RQ3.
Figure 1-4 The combination EGIT-SIW along the path of IT investments
to a firm’s performance
IT Investments Performance ITBSA EGIT SIW
(a) (b)
(c) (d)

10 Introduction
Luftman, 2015; Wu et al., 2015). The mentioned researchers have repeatedly called for more
investigation into the processes from ITBSA to enhanced business performance.
Linear models of innovation, as depicted in Figure 1-4 (i.e., (a), (b), (c), and (d)) assumed logical and
direct steps from the input (e.g., ITBSA or an even earlier stage such as IT investments) via EGIT to
a next stage such as SIW and then to performance. The proponents of linear models have overlooked
two main facts: (1) that firms may operate at different levels of efficiency and (2) that they operate
within a set of variable environmental factors which may state that higher levels of input might not
automatically imply higher levels of innovative output (cf. Klomp, 2001). These two facts may give
rise to study the importance of moderating variables (and/or a combination of mediators and
moderators), and to examine whether it is possible to better understand those relationships.
Many publications have pointed out that alignment is an ambiguous and complex concept.
Historically, strategic and integrated planning is considered by many authors as the most suitable
alignment approach to realize the impact of IT on business value (cf. Ward, Griffiths, & Whitmore,
1990; Earl, 1993; Weill & Broadbent, 1998). Magalhães (2004) and Schwarz et al. (2010) argue that
alignment is not only achieved by planning linkages but by emphasizing managerial actions and
enabling processes. Here, we see that IT governance creates a worthwhile distinction vis-à-vis the
daily management of all IT-related activities. Enterprise Governance of IT (EGIT) and its
components (processes, structures, and relational mechanisms), as mentioned in section 1.4 (see also
Chapter 2 for a detailed literature review on the EGIT concept) have emerged as the conceptualization
of what started as IT governance. EGIT is a relatively new concept that is concerned with integrating
processes, structures, and relational mechanisms. As a direct consequence, they enable both business
and IT departments to execute their responsibilities in creating value from IT-enabled business
investments (cf. Van Grembergen & De Haes, 2012; De Haes & Van Grembergen, 2013).
Currently, EGIT is gaining more interest in the academic and practitioner’s world. Its exact influence
on the causal chain from IT investments to a firm’s performance has not yet been firmly established.
In addition, IT investments seemed to be especially effective when innovations increase the delivery
speed and the spatial or temporal availability of service. Nowadays, SIW has been linked to
performance in several research papers in the literature6. It is considered an important actor along the
path from IT investments to a firm’s performance.
6 For detailed discussion of innovation and performance see section 3.2 in Chapter 3.
From IT Business Strategic Alignment to Performance 11
Previous studies have shown that internal cooperation on innovation is more effective than external
innovation (cf. Hochleitner, Arbussa, & Coenders, 2016), and most of innovation decisions are made
at the business-unit level and that firm data or industry-level data is too aggregate to provide a
reasonable measurement of innovative activity (cf. Holthausen, Larcker, & Sloan, 1995).
Furthermore, SIW is considered to be a multi-disciplinary knowledge-sharing collaborative approach
(cf. Xue, Ray, & Sambamurthy, 2012; EC, Guide to Social Innovation, 2013; Nichols et al., 2013).
Therefore, as described and justified in Chapter 4, we use inter-departmental collaboration on SIW
as a representation of social innovation, and “single departments” as our unit of analysis with the aim
to reach specific and realistic results.
In an effort to respond to the calls from well-known scholars on the issue of exploring the path from
IT investments to a firm’s performance, this research specifically explores the interaction of SIW and
EGIT in affecting the relationship between ITBSA and the performance at the departmental level
(i.e., the relations (b), (c), and (d) in Figure 1-4). So, we are now ready to formulate our problem
statement.
Problem Statement (PS):
To what extent can we make transparent the effects of Enterprise Governance of IT and SIW on the
relationship between IT Business Strategic Alignment and the Organizational Performance at the
departmental level?
We intend to answer the problem statement with the help of four research questions. They are
presented below.
1.5 Four Research Questions
From the problem statement, we read that there is a need to characterize the relationship between
ITBSA and performance. So far, this relationship per se (i.e., the combined relations (b), (c) and (d)
of Figure 1-4) had controversial results (cf. Silva et al., 2006). In the broader picture of the relation
between IT investments and a firm’s performance, we would like to refer to established scholars such
as Henderson & Venkatraman (1993), Sabherwal & Chan (2001), and to a more recent research by
Luftman & Kempaiah (2008), De Haes & Van Grembergen (2013), and Héroux & Fortin (2016).
They have demonstrated a positive effect of ITBSA on a firm’s performance along several
dimensions.

Cha
pter
1
10 Introduction
Luftman, 2015; Wu et al., 2015). The mentioned researchers have repeatedly called for more
investigation into the processes from ITBSA to enhanced business performance.
Linear models of innovation, as depicted in Figure 1-4 (i.e., (a), (b), (c), and (d)) assumed logical and
direct steps from the input (e.g., ITBSA or an even earlier stage such as IT investments) via EGIT to
a next stage such as SIW and then to performance. The proponents of linear models have overlooked
two main facts: (1) that firms may operate at different levels of efficiency and (2) that they operate
within a set of variable environmental factors which may state that higher levels of input might not
automatically imply higher levels of innovative output (cf. Klomp, 2001). These two facts may give
rise to study the importance of moderating variables (and/or a combination of mediators and
moderators), and to examine whether it is possible to better understand those relationships.
Many publications have pointed out that alignment is an ambiguous and complex concept.
Historically, strategic and integrated planning is considered by many authors as the most suitable
alignment approach to realize the impact of IT on business value (cf. Ward, Griffiths, & Whitmore,
1990; Earl, 1993; Weill & Broadbent, 1998). Magalhães (2004) and Schwarz et al. (2010) argue that
alignment is not only achieved by planning linkages but by emphasizing managerial actions and
enabling processes. Here, we see that IT governance creates a worthwhile distinction vis-à-vis the
daily management of all IT-related activities. Enterprise Governance of IT (EGIT) and its
components (processes, structures, and relational mechanisms), as mentioned in section 1.4 (see also
Chapter 2 for a detailed literature review on the EGIT concept) have emerged as the conceptualization
of what started as IT governance. EGIT is a relatively new concept that is concerned with integrating
processes, structures, and relational mechanisms. As a direct consequence, they enable both business
and IT departments to execute their responsibilities in creating value from IT-enabled business
investments (cf. Van Grembergen & De Haes, 2012; De Haes & Van Grembergen, 2013).
Currently, EGIT is gaining more interest in the academic and practitioner’s world. Its exact influence
on the causal chain from IT investments to a firm’s performance has not yet been firmly established.
In addition, IT investments seemed to be especially effective when innovations increase the delivery
speed and the spatial or temporal availability of service. Nowadays, SIW has been linked to
performance in several research papers in the literature6. It is considered an important actor along the
path from IT investments to a firm’s performance.
6 For detailed discussion of innovation and performance see section 3.2 in Chapter 3.
From IT Business Strategic Alignment to Performance 11
Previous studies have shown that internal cooperation on innovation is more effective than external
innovation (cf. Hochleitner, Arbussa, & Coenders, 2016), and most of innovation decisions are made
at the business-unit level and that firm data or industry-level data is too aggregate to provide a
reasonable measurement of innovative activity (cf. Holthausen, Larcker, & Sloan, 1995).
Furthermore, SIW is considered to be a multi-disciplinary knowledge-sharing collaborative approach
(cf. Xue, Ray, & Sambamurthy, 2012; EC, Guide to Social Innovation, 2013; Nichols et al., 2013).
Therefore, as described and justified in Chapter 4, we use inter-departmental collaboration on SIW
as a representation of social innovation, and “single departments” as our unit of analysis with the aim
to reach specific and realistic results.
In an effort to respond to the calls from well-known scholars on the issue of exploring the path from
IT investments to a firm’s performance, this research specifically explores the interaction of SIW and
EGIT in affecting the relationship between ITBSA and the performance at the departmental level
(i.e., the relations (b), (c), and (d) in Figure 1-4). So, we are now ready to formulate our problem
statement.
Problem Statement (PS):
To what extent can we make transparent the effects of Enterprise Governance of IT and SIW on the
relationship between IT Business Strategic Alignment and the Organizational Performance at the
departmental level?
We intend to answer the problem statement with the help of four research questions. They are
presented below.
1.5 Four Research Questions
From the problem statement, we read that there is a need to characterize the relationship between
ITBSA and performance. So far, this relationship per se (i.e., the combined relations (b), (c) and (d)
of Figure 1-4) had controversial results (cf. Silva et al., 2006). In the broader picture of the relation
between IT investments and a firm’s performance, we would like to refer to established scholars such
as Henderson & Venkatraman (1993), Sabherwal & Chan (2001), and to a more recent research by
Luftman & Kempaiah (2008), De Haes & Van Grembergen (2013), and Héroux & Fortin (2016).
They have demonstrated a positive effect of ITBSA on a firm’s performance along several
dimensions.

12 Introduction
Nevertheless, direct and linear relationship was not always established. In certain cases, it was even
rejected (see, e.g., Joshi et al., 2003). This rejection happened in favor of a moderating or mediating
effect of other factors (cf. West & Schwenk, 1996; Lindman et al., 2001; Tallon, 2011). Our research
aims to characterize the relationship between ITBSA and performance through the mediating effect
of SIW at the departmental level. A positive outcome of the mediating effect will allow us to consider
SIW as an important factor stimulating the firm’s performance (cf. Coad & Rao, 2008). With the aim
towards a mediating effect of SIW on the relationship between ITBSA and performance, we first
attempt to investigate the nature of the direct relationship between ITBSA and SIW. Hence, our first
research question is formulated as follows.
RQ1: What is the effect of IT Business Strategic Alignment on Social Innovation at Work (SIW) at the
departmental level?
Two of the relationships of Figure 1-4 are fundamental to this research, namely the relationship from
IT investments to ITBSA (relationship (a) in Figure 1-4) and the relationship from SIW to
performance at the departmental level (relationship (d) in Figure 1-4). Relationship (a), which
establishes ITBSA as an enabler of the relationship of the IT investments value, has been historically
well explored in the literature (see section 3.1 for a detailed review of this issue). Therefore, it will
not be empirically tested in this research. Relationship (d) of Figure 1-4, which deals with the effect
of SIW on the departmental performance, is a critical relationship to this research in the sense that it
establishes SIW as a mediator between ITBSA and performance at the departmental level. Moreover,
there is a controversy regarding this relationship in the literature. Therefore, this relationship is the
subject of our second research question as discussed in the following paragraphs.
In the past, Tsai & Ghoshal (1998) concluded that effective implementation of an innovation strategy
is significantly dependent on the extent of information sharing among different functional
departments. Even earlier, Daft & Lengel (1986) argued that the positive influence of inter-
departmental collaboration on SIW is due to the large amount of information that must be processed
across departmental boundaries which in turn facilitates the anticipation and mitigation of
downstream risks. Lately, this view has been supported by several scholars claiming a strong
connection between SIW, collaboration and information sharing (see, e.g., Pot et al., 2012; Xue et al.,
2012; Nichols et al., 2013; Arvanitis & Loukis, 2016)7.
7 For a definition on inter-departmental collaboration on innovation we refer to Definition 2-19.
From IT Business Strategic Alignment to Performance 13
In spite of the fact that inter-departmental collaboration is strongly motivated by its expected benefits
in terms of innovation performance (cf. Becker & Lillemark, 2006), it has been identified as source
of increased coordination cost (cf. Cuijpers, Guenter, & Hussinger, 2011) due to increased
coordination efforts that eventually cause project delays8. Bry, Vallée, & France (2011) in their
article on SIW assert that innovation teams do not deliver the expected results, even worse, they claim
that “most of the time team members don't even agree on what the team is supposed to be doing”.
Moreover, Homburg et al. (1999) have claimed that there is no direct relationship between ITBSA
and performance in terms of cost-leadership strategy; which gives rise to more controversy on the
topic. Given the three questions surrounding (1) the significance of the innovation process for the
relationship between ITBSA and performance, (2) the critical role of the inter-departmental
collaboration on the SIW process, and (3) the controversy regarding the effect of inter-departmental
collaboration on SIW on performance, we formulate our second research question, which reads as
follows.
RQ2: What is the role of Social Innovation at Work (SIW) on the departmental performance?
RQ1 and RQ2 are exploring components of the relationship between ITBSA and performance at the
departmental level, i.e., the individual components of Figure 1-3. The direct relationship between
SIW and a firm’s performance was the focus of several studies (e.g., Coad & Rao, 2008). Yet, there
was no study, to the best of our knowledge, which identified the actual role that the SIW plays in the
relationship between ITBSA and a firm’s performance at the departmental level. Here, we are
concerned with the combined relationship ( (b)+(c), and (d) ) of Figure 1-3. Hence, our third research
question reads as follows.
RQ3: How does the Social Innovation at Work at the departmental level affect the relationship
between the ITBSA and departmental performance?
ITBSA has at least three major components: (1) IT strategy, (2) business strategy, and (3) IT
governance factors (see Henderson & Venkatraman, 1993). A majority of researchers consider those
three factors as one entity simultaneously forming the “alignment” factor. However, in practice, most
enterprises concentrate on aligning the IT strategy with their business strategy. Those enterprises do
8 For details on controversies regarding inter-departmental collaboration see Chapter 3.

Cha
pter
1
12 Introduction
Nevertheless, direct and linear relationship was not always established. In certain cases, it was even
rejected (see, e.g., Joshi et al., 2003). This rejection happened in favor of a moderating or mediating
effect of other factors (cf. West & Schwenk, 1996; Lindman et al., 2001; Tallon, 2011). Our research
aims to characterize the relationship between ITBSA and performance through the mediating effect
of SIW at the departmental level. A positive outcome of the mediating effect will allow us to consider
SIW as an important factor stimulating the firm’s performance (cf. Coad & Rao, 2008). With the aim
towards a mediating effect of SIW on the relationship between ITBSA and performance, we first
attempt to investigate the nature of the direct relationship between ITBSA and SIW. Hence, our first
research question is formulated as follows.
RQ1: What is the effect of IT Business Strategic Alignment on Social Innovation at Work (SIW) at the
departmental level?
Two of the relationships of Figure 1-4 are fundamental to this research, namely the relationship from
IT investments to ITBSA (relationship (a) in Figure 1-4) and the relationship from SIW to
performance at the departmental level (relationship (d) in Figure 1-4). Relationship (a), which
establishes ITBSA as an enabler of the relationship of the IT investments value, has been historically
well explored in the literature (see section 3.1 for a detailed review of this issue). Therefore, it will
not be empirically tested in this research. Relationship (d) of Figure 1-4, which deals with the effect
of SIW on the departmental performance, is a critical relationship to this research in the sense that it
establishes SIW as a mediator between ITBSA and performance at the departmental level. Moreover,
there is a controversy regarding this relationship in the literature. Therefore, this relationship is the
subject of our second research question as discussed in the following paragraphs.
In the past, Tsai & Ghoshal (1998) concluded that effective implementation of an innovation strategy
is significantly dependent on the extent of information sharing among different functional
departments. Even earlier, Daft & Lengel (1986) argued that the positive influence of inter-
departmental collaboration on SIW is due to the large amount of information that must be processed
across departmental boundaries which in turn facilitates the anticipation and mitigation of
downstream risks. Lately, this view has been supported by several scholars claiming a strong
connection between SIW, collaboration and information sharing (see, e.g., Pot et al., 2012; Xue et al.,
2012; Nichols et al., 2013; Arvanitis & Loukis, 2016)7.
7 For a definition on inter-departmental collaboration on innovation we refer to Definition 2-19.
From IT Business Strategic Alignment to Performance 13
In spite of the fact that inter-departmental collaboration is strongly motivated by its expected benefits
in terms of innovation performance (cf. Becker & Lillemark, 2006), it has been identified as source
of increased coordination cost (cf. Cuijpers, Guenter, & Hussinger, 2011) due to increased
coordination efforts that eventually cause project delays8. Bry, Vallée, & France (2011) in their
article on SIW assert that innovation teams do not deliver the expected results, even worse, they claim
that “most of the time team members don't even agree on what the team is supposed to be doing”.
Moreover, Homburg et al. (1999) have claimed that there is no direct relationship between ITBSA
and performance in terms of cost-leadership strategy; which gives rise to more controversy on the
topic. Given the three questions surrounding (1) the significance of the innovation process for the
relationship between ITBSA and performance, (2) the critical role of the inter-departmental
collaboration on the SIW process, and (3) the controversy regarding the effect of inter-departmental
collaboration on SIW on performance, we formulate our second research question, which reads as
follows.
RQ2: What is the role of Social Innovation at Work (SIW) on the departmental performance?
RQ1 and RQ2 are exploring components of the relationship between ITBSA and performance at the
departmental level, i.e., the individual components of Figure 1-3. The direct relationship between
SIW and a firm’s performance was the focus of several studies (e.g., Coad & Rao, 2008). Yet, there
was no study, to the best of our knowledge, which identified the actual role that the SIW plays in the
relationship between ITBSA and a firm’s performance at the departmental level. Here, we are
concerned with the combined relationship ( (b)+(c), and (d) ) of Figure 1-3. Hence, our third research
question reads as follows.
RQ3: How does the Social Innovation at Work at the departmental level affect the relationship
between the ITBSA and departmental performance?
ITBSA has at least three major components: (1) IT strategy, (2) business strategy, and (3) IT
governance factors (see Henderson & Venkatraman, 1993). A majority of researchers consider those
three factors as one entity simultaneously forming the “alignment” factor. However, in practice, most
enterprises concentrate on aligning the IT strategy with their business strategy. Those enterprises do
8 For details on controversies regarding inter-departmental collaboration see Chapter 3.

14 Introduction
so, in theory, by taking business strategic goals and by placing them into the IT strategy guidelines
with the aim of creating a “fit” (see, e.g., Kearns & Lederer 2000; Silva et al., 2006).
Any strategic fit, in particular the perfect fit, runs the risk to remain on paper. As a direct consequence,
the envisioned alignment may be a potential success factor that is never realized in the absence of an
effective governing process and a governing structural support. Some researchers have identified and
categorized the most common IT governance mechanisms (see, e.g., Weill & Ross, 2004; Sohal &
Fitzpatric, 2002) but only a few have attempted to study the effect of those mechanisms on effective
governance, as did for example, Syaiful & Peter (2005) and De Haes & Van Grembergen (2009). Our
investigation aims to fill this research gap by conceptualizing the EGIT as an environmental variable
moderating the relationship between ITBSA and performance. In order to achieve this goal, we
formulate the fourth research question.
RQ4: How does EGIT affect the relationship between ITBSA, SIW and performance at the
departmental level?
1.6 Research Methodology
In this section, we define six research methodologies that are used in our research to answer the RQs
and the PS.
The nature of our research is exploratory/descriptive and to rather than predictive/hypothesis testing.
Our research is (a) Exploratory, in that we have explored the possible factors that “might” be present
along the path from IT investments to performance. And (b) descriptive, in the sense that we describe
the factors and their proposed role along the proposed path. Furthermore, we would like to mention
that explanatory models aim at “establishing” a causal relationships. And predictive models use those
causal relationships in predicting a future state of the independent (criterion) variables. We did not
conduct an explicit experimental causal analysis (see subsections 6.1.1. and 6.1.3 for detailed
discussion of causality and theory testing methodology). We do not consider our model to be formally
explanatory/predictive, nevertheless, since we based the relations among our studied factors on a
previously established theories, we claim that the results of our SEM analysis indicate a possible
“effects” and we can draw expectations of directional changes in the criterion variables based on
changes in the predictors, as proposed by our conceptual model.
From IT Business Strategic Alignment to Performance 15
Two reasons for this choice are: (1) research in the domain of IT governance implementations and its
relationship with ITBSA is in its infancy and (2) theoretical models are scarcely available.
The scientific methodology in unexplored areas is a mixed approach of qualitative and quantitative
research (for an extensive support of our choice we refer to Creswell, 2003). Therefore, we are
convinced that the current formulation of the PS and four RQs is an adequate start for our
investigation. Below we briefly summarize the characteristics of our choice before we list and
describe our research methodologies.
The research is qualitative in the sense that it solicits and evaluates expert attitudes and opinions with
regard to performance variables, such as (1) the level of strategic alignment between the various
departments and the IT department, and (2) the level of inter-departmental collaboration on
innovation through a qualitative, multidimensional approach. The research is also quantitative since
it utilizes quantitative methods in data analysis and establishes quantitative relationships between the
various concepts.
The research will be carried out using six specific methodologies.
RM1: Literature review. An extensive literature review is carried out to establish: (1) a detailed
knowledge about each concept involved in the studied relationship, and (2) thorough background
about the previously established relationships in the literature (if any) among the studied concepts.
RM2: Field-work Survey (questionnaires). The field work of our research is based on primary data
collection by using four separate surveys to establish (1) the IT Business Strategic Alignment, (2) the
EGIT level, (3) the level of collaboration on Social Innovation, and (4) the departmental performance.
IT Business alignment was measured using an instrument developed by Weill & Ross (2004).
Innovation, and departmental performance data was collected with the latest version of an instrument
developed and used by the European Commission (the updated OECD Oslo manual, third edition
(2005, 2011))9. EGIT maturity was measured using a survey instrument originally developed by the
IT Governance Institute (2001) and described in detail in Chapter 5 which provides a detailed
description of the data collection instruments and the field work process.
RM3: Data validation and analysis of the results. Data validation is performed using three main
techniques: (1) Cronbach’s Alpha analysis, (2) fit for SEM testing, and (3) factor analysis.
9 See subsection 4.1.2 for more details.

Cha
pter
1
14 Introduction
so, in theory, by taking business strategic goals and by placing them into the IT strategy guidelines
with the aim of creating a “fit” (see, e.g., Kearns & Lederer 2000; Silva et al., 2006).
Any strategic fit, in particular the perfect fit, runs the risk to remain on paper. As a direct consequence,
the envisioned alignment may be a potential success factor that is never realized in the absence of an
effective governing process and a governing structural support. Some researchers have identified and
categorized the most common IT governance mechanisms (see, e.g., Weill & Ross, 2004; Sohal &
Fitzpatric, 2002) but only a few have attempted to study the effect of those mechanisms on effective
governance, as did for example, Syaiful & Peter (2005) and De Haes & Van Grembergen (2009). Our
investigation aims to fill this research gap by conceptualizing the EGIT as an environmental variable
moderating the relationship between ITBSA and performance. In order to achieve this goal, we
formulate the fourth research question.
RQ4: How does EGIT affect the relationship between ITBSA, SIW and performance at the
departmental level?
1.6 Research Methodology
In this section, we define six research methodologies that are used in our research to answer the RQs
and the PS.
The nature of our research is exploratory/descriptive and to rather than predictive/hypothesis testing.
Our research is (a) Exploratory, in that we have explored the possible factors that “might” be present
along the path from IT investments to performance. And (b) descriptive, in the sense that we describe
the factors and their proposed role along the proposed path. Furthermore, we would like to mention
that explanatory models aim at “establishing” a causal relationships. And predictive models use those
causal relationships in predicting a future state of the independent (criterion) variables. We did not
conduct an explicit experimental causal analysis (see subsections 6.1.1. and 6.1.3 for detailed
discussion of causality and theory testing methodology). We do not consider our model to be formally
explanatory/predictive, nevertheless, since we based the relations among our studied factors on a
previously established theories, we claim that the results of our SEM analysis indicate a possible
“effects” and we can draw expectations of directional changes in the criterion variables based on
changes in the predictors, as proposed by our conceptual model.
From IT Business Strategic Alignment to Performance 15
Two reasons for this choice are: (1) research in the domain of IT governance implementations and its
relationship with ITBSA is in its infancy and (2) theoretical models are scarcely available.
The scientific methodology in unexplored areas is a mixed approach of qualitative and quantitative
research (for an extensive support of our choice we refer to Creswell, 2003). Therefore, we are
convinced that the current formulation of the PS and four RQs is an adequate start for our
investigation. Below we briefly summarize the characteristics of our choice before we list and
describe our research methodologies.
The research is qualitative in the sense that it solicits and evaluates expert attitudes and opinions with
regard to performance variables, such as (1) the level of strategic alignment between the various
departments and the IT department, and (2) the level of inter-departmental collaboration on
innovation through a qualitative, multidimensional approach. The research is also quantitative since
it utilizes quantitative methods in data analysis and establishes quantitative relationships between the
various concepts.
The research will be carried out using six specific methodologies.
RM1: Literature review. An extensive literature review is carried out to establish: (1) a detailed
knowledge about each concept involved in the studied relationship, and (2) thorough background
about the previously established relationships in the literature (if any) among the studied concepts.
RM2: Field-work Survey (questionnaires). The field work of our research is based on primary data
collection by using four separate surveys to establish (1) the IT Business Strategic Alignment, (2) the
EGIT level, (3) the level of collaboration on Social Innovation, and (4) the departmental performance.
IT Business alignment was measured using an instrument developed by Weill & Ross (2004).
Innovation, and departmental performance data was collected with the latest version of an instrument
developed and used by the European Commission (the updated OECD Oslo manual, third edition
(2005, 2011))9. EGIT maturity was measured using a survey instrument originally developed by the
IT Governance Institute (2001) and described in detail in Chapter 5 which provides a detailed
description of the data collection instruments and the field work process.
RM3: Data validation and analysis of the results. Data validation is performed using three main
techniques: (1) Cronbach’s Alpha analysis, (2) fit for SEM testing, and (3) factor analysis.
9 See subsection 4.1.2 for more details.

16 Introduction
Ad1 Survey instruments were tested for validity and integrity using Cronbach’s Alpha.
Ad2 The fit for SEM analysis was validated by testing: (a) Convergent validity, (b) discriminant
validity, (c) normality, and (d) collinearity.
Ad3 Constructs integrity was tested using factor analysis.
RM4: Establishing the effect scientifically (by analyzing, predicting, and validating). The
methodology uses two main techniques: (1) a mediating and moderating test, and (2) a direct effect
test.
Ad1 The mediating and mediating effects are tested, i.e., established and validated using the
methodology described in Baron & Kenny (1986) applied in the SEM environment. Their research
was cited 40,452 times and used by several authors to describe the process of testing moderating and
mediating effects (see, e.g., Frazier, Barron, & Tix, 2004; Hopwood, 2007; Hayes, 2012; Wu, Detmar,
& Liang, 2015). The Structural Equation Modeling (SEM) technique was used to test and validate
the proposed models (cf. Hopwood, 2007).
Ad2 The direct relationships (e.g., between ITBSA and SIW) were also established and validated
using SEM techniques.
RM5: Evaluation of the results. The results of the analyses described above are evaluated for
conceptual validity and alignment with the expectations and predictions from our extensive literature
review.
RM6: Drawing conclusions. Following the evaluation of the results, answers to the four research
questions are provided and conclusions on the PS are drawn.
Our research examines two direct, one mediating and one moderated mediation relationship. All data
analysis is performed using the SPSS and AMOS statistical software. Detailed data analysis and
implications are discussed in Chapter 6. In Table 1-1 we provide an overview of the relation between
chapters, PS and RQs, and research methodologies.
From IT Business Strategic Alignment to Performance 17
In Table 1-1 we see that the four RQs are closely related, in fact they are immediately derived from
the PS. This has clear consequences for our research and for the composition of the thesis.
PS RQ1 RQ2 RQ3 RQ4
Cha
pter
1 RM1 2 RM1 RM1 RM1 RM1 3 RM1 RM1 RM1 RM1 4 RM1 RM1 5 RM2 RM2 RM2 RM2 6 RM3-5 RM3-5 RM3-5 RM3-5 7 RM6 RM6 RM6 RM6 RM6
Table 1-1 The relation between chapters, PS and RQs, and research methodologies
For instance, the literature reviewed (RM1) in Chapters2, 3, is directly related to all four RQs. In
Chapter 4, the literature reviewed was focused on the mediation and moderation concepts concerning
RQ3 and RQ4. RM2 and RM3-5 are again related to all four RQs in Chapters 5 & 6. Hence, we see
that generally the four RQs can be considered as one block forming the main concept of this study.
This one main concept is distributed among four sub questions.
1.7 The Aim of the Study
The aim of our research is to provide a genuine contribution to the field of information technology
and management information systems through identifying mechanisms10 affecting the path from
ITBSA to a firm’s performance.
Here we would like to note that because both (1) research in the domain of IT governance
implementations, and (2) the relationship between ITBSA, Social Innovation, and performance are
in its early stages, and because (3) grounded theoretical models are scarcely available (cf. De Haes &
Grembergen, 2009), the nature of our research is exploratory/descriptive rather than normative.
1.8 The Significance of the Study
In the introductory paragraph of this chapter, it was highlighted that around half of a firm’s
profitability is explained by an effective strategic alignment of IT and business goals. The importance
10 The term mechanisms refer to the mediators and moderators affecting a relationship between constructs.

Cha
pter
1
16 Introduction
Ad1 Survey instruments were tested for validity and integrity using Cronbach’s Alpha.
Ad2 The fit for SEM analysis was validated by testing: (a) Convergent validity, (b) discriminant
validity, (c) normality, and (d) collinearity.
Ad3 Constructs integrity was tested using factor analysis.
RM4: Establishing the effect scientifically (by analyzing, predicting, and validating). The
methodology uses two main techniques: (1) a mediating and moderating test, and (2) a direct effect
test.
Ad1 The mediating and mediating effects are tested, i.e., established and validated using the
methodology described in Baron & Kenny (1986) applied in the SEM environment. Their research
was cited 40,452 times and used by several authors to describe the process of testing moderating and
mediating effects (see, e.g., Frazier, Barron, & Tix, 2004; Hopwood, 2007; Hayes, 2012; Wu, Detmar,
& Liang, 2015). The Structural Equation Modeling (SEM) technique was used to test and validate
the proposed models (cf. Hopwood, 2007).
Ad2 The direct relationships (e.g., between ITBSA and SIW) were also established and validated
using SEM techniques.
RM5: Evaluation of the results. The results of the analyses described above are evaluated for
conceptual validity and alignment with the expectations and predictions from our extensive literature
review.
RM6: Drawing conclusions. Following the evaluation of the results, answers to the four research
questions are provided and conclusions on the PS are drawn.
Our research examines two direct, one mediating and one moderated mediation relationship. All data
analysis is performed using the SPSS and AMOS statistical software. Detailed data analysis and
implications are discussed in Chapter 6. In Table 1-1 we provide an overview of the relation between
chapters, PS and RQs, and research methodologies.
From IT Business Strategic Alignment to Performance 17
In Table 1-1 we see that the four RQs are closely related, in fact they are immediately derived from
the PS. This has clear consequences for our research and for the composition of the thesis.
PS RQ1 RQ2 RQ3 RQ4 C
hapt
er
1 RM1 2 RM1 RM1 RM1 RM1 3 RM1 RM1 RM1 RM1 4 RM1 RM1 5 RM2 RM2 RM2 RM2 6 RM3-5 RM3-5 RM3-5 RM3-5 7 RM6 RM6 RM6 RM6 RM6
Table 1-1 The relation between chapters, PS and RQs, and research methodologies
For instance, the literature reviewed (RM1) in Chapters2, 3, is directly related to all four RQs. In
Chapter 4, the literature reviewed was focused on the mediation and moderation concepts concerning
RQ3 and RQ4. RM2 and RM3-5 are again related to all four RQs in Chapters 5 & 6. Hence, we see
that generally the four RQs can be considered as one block forming the main concept of this study.
This one main concept is distributed among four sub questions.
1.7 The Aim of the Study
The aim of our research is to provide a genuine contribution to the field of information technology
and management information systems through identifying mechanisms10 affecting the path from
ITBSA to a firm’s performance.
Here we would like to note that because both (1) research in the domain of IT governance
implementations, and (2) the relationship between ITBSA, Social Innovation, and performance are
in its early stages, and because (3) grounded theoretical models are scarcely available (cf. De Haes &
Grembergen, 2009), the nature of our research is exploratory/descriptive rather than normative.
1.8 The Significance of the Study
In the introductory paragraph of this chapter, it was highlighted that around half of a firm’s
profitability is explained by an effective strategic alignment of IT and business goals. The importance
10 The term mechanisms refer to the mediators and moderators affecting a relationship between constructs.

18 Introduction
of our study lays in the significant contributions it makes to both theory and practice in identifying
some of the significant factors along the path from ITBSA to a firm’s performance. The results of
our study have both cost and efficiency implications. The following two subsections will highlight
those contributions in two dimensions: the theoretical contributions in subsection 1.8.1 and the
practical contributions in subsection 1.8.2.
1.8.1 Theoretical Contributions
Our study is claimed to make four original contributions to the existing body of knowledge in the
area of IT governance and Management Information Systems. It does so by drawing upon existing
theory and literature from organizational and strategic management, knowledge management, and
information technology in investigating the relationship between ITBSA and performance at the
departmental level. The four contributions are as follows.
First, our research contributes to the literature of innovation by providing a model that sheds the light
on the importance of the collaborative actions on Social Innovation at Work on the link between
ITBSA and departmental performance.
Second, the developed complex model of a moderated mediation contributes to the literature field of
strategic studies, namely ITBSA, introducing a new theoretical approach of investigating the
relationship between ITBSA and organizational performance. It does so through exploring the
interaction of effect between ITBSA and the Enterprise Governance of IT EGIT on affecting
organizational performance.
Third, assuming that data on firm-level or industry-level is too aggregate to provide a reasonable
examination of any innovative activity, we performed empirical studies on the level of a department.
It is claimed that most innovation decisions are made at the level of the business unit. Since the
innovative activity of the business unit transpires to the department, we claim that social innovation
at work at the department level is measurable.
From IT Business Strategic Alignment to Performance 19
Fourth, our research contributes to the literature on the SAM (strategic alignment model) by shedding
a light on the relationship among three of the four components of the model, namely, IT strategy,
business strategy, and IT structures (in our research represented by EGIT)11.
1.8.2 Practical Contributions
Our thesis has three major practical contributions that aid managers in effectively focusing their
efforts and physical resources for improved organizational performance.
First contribution is based on the proposed mediation effect of SIW between ITBSA and performance.
This proposition emphasizes the importance of cross-departmental collaboration on innovation and
its efficiency outcome.
The second contribution relies on the ability to identify EGIT as a valid moderator to the relationship
between ITBSA and performance. This contribution demonstrates the importance of establishing
effective IT structures and processes in order to effectively capitalize on IT investments.
The third practical contribution of this research provides managers with a platform for implementing
change. According to Kingdon (2003), implementing a change is challenging and needs a policy
implementation window. Those windows could be either predictable (e.g. a scheduled event such as
management change or a quality certificate renewal), or unpredictable (e.g. organizational problems,
low financial performance). In either case, those windows provide for an opportunity to implement
organizational change. Major problems faced by managers in implementing changes (once a windows
is spotted) are (a) obtaining senior management’s approval, and (b) prioritize the proposed change
on the decisions agenda. Changes are prioritized when three main factors are present, (1) the problem,
(2) the change proposal, and (3) the political receptivity. Our model provides managers with a
guidance to satisfy the second and third conditions, viz. prepare effective change proposals and obtain
political receptivity. We do so by showing the performance implications of aligning IT and business
strategies and implementing proper processes and structures that aim towards collaborative
innovation. According to our results, proposals within those areas (e.g. strategy change proposals and
IT strategic expansions) lead to enhanced and sustainable performance. As a result, the third condition
11 See subsection 2.1.2 for description of the SAM model, and subsection 6.4.4 for the discussion of our results as related
to the model.

Cha
pter
1
18 Introduction
of our study lays in the significant contributions it makes to both theory and practice in identifying
some of the significant factors along the path from ITBSA to a firm’s performance. The results of
our study have both cost and efficiency implications. The following two subsections will highlight
those contributions in two dimensions: the theoretical contributions in subsection 1.8.1 and the
practical contributions in subsection 1.8.2.
1.8.1 Theoretical Contributions
Our study is claimed to make four original contributions to the existing body of knowledge in the
area of IT governance and Management Information Systems. It does so by drawing upon existing
theory and literature from organizational and strategic management, knowledge management, and
information technology in investigating the relationship between ITBSA and performance at the
departmental level. The four contributions are as follows.
First, our research contributes to the literature of innovation by providing a model that sheds the light
on the importance of the collaborative actions on Social Innovation at Work on the link between
ITBSA and departmental performance.
Second, the developed complex model of a moderated mediation contributes to the literature field of
strategic studies, namely ITBSA, introducing a new theoretical approach of investigating the
relationship between ITBSA and organizational performance. It does so through exploring the
interaction of effect between ITBSA and the Enterprise Governance of IT EGIT on affecting
organizational performance.
Third, assuming that data on firm-level or industry-level is too aggregate to provide a reasonable
examination of any innovative activity, we performed empirical studies on the level of a department.
It is claimed that most innovation decisions are made at the level of the business unit. Since the
innovative activity of the business unit transpires to the department, we claim that social innovation
at work at the department level is measurable.
From IT Business Strategic Alignment to Performance 19
Fourth, our research contributes to the literature on the SAM (strategic alignment model) by shedding
a light on the relationship among three of the four components of the model, namely, IT strategy,
business strategy, and IT structures (in our research represented by EGIT)11.
1.8.2 Practical Contributions
Our thesis has three major practical contributions that aid managers in effectively focusing their
efforts and physical resources for improved organizational performance.
First contribution is based on the proposed mediation effect of SIW between ITBSA and performance.
This proposition emphasizes the importance of cross-departmental collaboration on innovation and
its efficiency outcome.
The second contribution relies on the ability to identify EGIT as a valid moderator to the relationship
between ITBSA and performance. This contribution demonstrates the importance of establishing
effective IT structures and processes in order to effectively capitalize on IT investments.
The third practical contribution of this research provides managers with a platform for implementing
change. According to Kingdon (2003), implementing a change is challenging and needs a policy
implementation window. Those windows could be either predictable (e.g. a scheduled event such as
management change or a quality certificate renewal), or unpredictable (e.g. organizational problems,
low financial performance). In either case, those windows provide for an opportunity to implement
organizational change. Major problems faced by managers in implementing changes (once a windows
is spotted) are (a) obtaining senior management’s approval, and (b) prioritize the proposed change
on the decisions agenda. Changes are prioritized when three main factors are present, (1) the problem,
(2) the change proposal, and (3) the political receptivity. Our model provides managers with a
guidance to satisfy the second and third conditions, viz. prepare effective change proposals and obtain
political receptivity. We do so by showing the performance implications of aligning IT and business
strategies and implementing proper processes and structures that aim towards collaborative
innovation. According to our results, proposals within those areas (e.g. strategy change proposals and
IT strategic expansions) lead to enhanced and sustainable performance. As a result, the third condition
11 See subsection 2.1.2 for description of the SAM model, and subsection 6.4.4 for the discussion of our results as related
to the model.

20 Introduction
of “political receptivity” should be more attainable. The performance enhancement justification
should make a change proposal easier to lobby, prioritize, and implement.
1.9 Structure of the Thesis
Below we describe the structure of the thesis. Emphasis is placed on the relation between the chapters.
Chapter 1 provides an introduction to the study. A problem statement is formulated and four research
questions are derived. Research methodologies are presented. The significance of the study and its
contributions are mentioned. Finally, the structure of the study is described.
Chapter 2 presents background and definitions of the main concepts studied in this thesis.
Chapter 3 provides an extensive literature review of the main concepts of our research, namely,
ITBSA, EGIT, SIW, and the departmental performance.
Chapter 4 provides, based on the literature review performed in Chapter 3, the theoretical framework
and develops the conceptual models. It sets the stage for the field work performed and described in
Chapter 5.
Chapter 5 presents a detailed description and analysis of the field work performed. It provides the
fundamental information for the data analysis performed in Chapter 6.
Chapter 6 performs the statistical analysis of the relationship between the various concepts of the
study as described in the conceptual model developed in Chapter 4. It also provides a discussion and
analysis of the results.
Chapter 7 presents the answers to the RQs and the PS. Then, the conclusion of our research is given.
It also provides personal recommendations and describes the limitations of our study, as well as,
proposes a possible future research path.
CHAPTER 2 BACKGROUND AND DEFINITIONS
In this chapter, we aim to provide a common ground for the analysis and investigation of the
relationships between ITBSA, EGIT, and SIW. The chapter provides a literature-based background.
Moreover, definitions of all related concepts are gathered. The ITBSA concept is introduced and
defined in section 2.1. Section 2.2 provides an insight into the EGIT concept, its roots in the corporate
governance, its relationship to ITBSA, and a literature-based definition of EGIT. Social Innovation
at the work place and its relationship to process and product innovation is explored and defined in
section 2.3.
2.1 IT Business Strategic Alignment
IT Business Strategic Alignment (ITBSA) is an important factor for gaining competitive advantage
and enhancing organizational performance (cf. Jorfi & Jorfi, 2011). Having said this, we must observe
that it continues to challenge organizations as well as researchers (cf. Luftman & Ben-Zvi, 2009; Xue
et al., 2012).
There are two threads of research with respect to ITBSA. A first line of research considers IT systems
and strategies as an enabler of competitive advantage, while the second line, mainly in the
management science, concentrates on the business strategic practices and theories. But, as the saying
goes: “It takes two to tango”. For an enterprise to achieve a competitive edge, it is necessary to
integrate successfully the IT strategy with the corporate strategy and consider them of equal
importance (cf. Kahre, Hoffmann, & Ahlemann, 2017). Each of these two strategies has its own focus.
However, in the following sections we will show that there is a common ground in support for each
other’s stages of development.
In this section, we provide a background of the ITBSA by describing (1) the evolution of the IT
strategy and (2) the integration of the IT strategy into the business strategy.
2.1.1 The Evolution of the IT Strategy
This subsection provides a brief background on the main evolution stages of the IT strategy.
It is widely accepted that information technology is vital for today’s organizations. Organizations
need information technology to survive because it plays a critical role in assisting organizations to

Cha
pter
2
20 Introduction
of “political receptivity” should be more attainable. The performance enhancement justification
should make a change proposal easier to lobby, prioritize, and implement.
1.9 Structure of the Thesis
Below we describe the structure of the thesis. Emphasis is placed on the relation between the chapters.
Chapter 1 provides an introduction to the study. A problem statement is formulated and four research
questions are derived. Research methodologies are presented. The significance of the study and its
contributions are mentioned. Finally, the structure of the study is described.
Chapter 2 presents background and definitions of the main concepts studied in this thesis.
Chapter 3 provides an extensive literature review of the main concepts of our research, namely,
ITBSA, EGIT, SIW, and the departmental performance.
Chapter 4 provides, based on the literature review performed in Chapter 3, the theoretical framework
and develops the conceptual models. It sets the stage for the field work performed and described in
Chapter 5.
Chapter 5 presents a detailed description and analysis of the field work performed. It provides the
fundamental information for the data analysis performed in Chapter 6.
Chapter 6 performs the statistical analysis of the relationship between the various concepts of the
study as described in the conceptual model developed in Chapter 4. It also provides a discussion and
analysis of the results.
Chapter 7 presents the answers to the RQs and the PS. Then, the conclusion of our research is given.
It also provides personal recommendations and describes the limitations of our study, as well as,
proposes a possible future research path.
CHAPTER 2 BACKGROUND AND DEFINITIONS
In this chapter, we aim to provide a common ground for the analysis and investigation of the
relationships between ITBSA, EGIT, and SIW. The chapter provides a literature-based background.
Moreover, definitions of all related concepts are gathered. The ITBSA concept is introduced and
defined in section 2.1. Section 2.2 provides an insight into the EGIT concept, its roots in the corporate
governance, its relationship to ITBSA, and a literature-based definition of EGIT. Social Innovation
at the work place and its relationship to process and product innovation is explored and defined in
section 2.3.
2.1 IT Business Strategic Alignment
IT Business Strategic Alignment (ITBSA) is an important factor for gaining competitive advantage
and enhancing organizational performance (cf. Jorfi & Jorfi, 2011). Having said this, we must observe
that it continues to challenge organizations as well as researchers (cf. Luftman & Ben-Zvi, 2009; Xue
et al., 2012).
There are two threads of research with respect to ITBSA. A first line of research considers IT systems
and strategies as an enabler of competitive advantage, while the second line, mainly in the
management science, concentrates on the business strategic practices and theories. But, as the saying
goes: “It takes two to tango”. For an enterprise to achieve a competitive edge, it is necessary to
integrate successfully the IT strategy with the corporate strategy and consider them of equal
importance (cf. Kahre, Hoffmann, & Ahlemann, 2017). Each of these two strategies has its own focus.
However, in the following sections we will show that there is a common ground in support for each
other’s stages of development.
In this section, we provide a background of the ITBSA by describing (1) the evolution of the IT
strategy and (2) the integration of the IT strategy into the business strategy.
2.1.1 The Evolution of the IT Strategy
This subsection provides a brief background on the main evolution stages of the IT strategy.
It is widely accepted that information technology is vital for today’s organizations. Organizations
need information technology to survive because it plays a critical role in assisting organizations to

22 Background and Definitions
offer better products and services. Below we provide definitions of both IT and IS for the reader’s
reference. We start with the definition of IT.
Definition 2-1 Information Technology
Information technology (IT) is defined as “consisting of all the hardware and software that a firm needs to use in order to achieve its business objectives”. (Laudon & Laudon, 2014)
By definition, IT covers a large-scale area of technological needs of an organization including all
aspects of general-use hardware and software systems (storage, retrieval, archiving, and transaction
processing). The term information systems (IS) is used to express a more specific meaning that is
related to data management and information management with the aim of supporting management
decisions making. Next, we provide a definition of IS.
Definition 2-2 Information Systems
An information system is defined as “a set of interrelated components that collect (or retrieve), process, store, and distribute information to support decision making and control in an organization”. (Laudon & Laudon, 2014). In the literature, the terms information technology (IT) and information systems (IS) are commonly
used interchangeably. Since the focus of this thesis is on topics of a wider scope than IT and IS, they
could therefore be considered in the larger picture as belonging to the same class and for this class
the term IT will be used throughout the thesis.
Although we focus on Information Technology, and in particular on its evolution, it is wise to keep
in mind that the description of the evolution should be concerned with the disciplines of Management
Science and Business Strategy. The reason is that these disciplines have studied strategy as a concept
for a long time. Strategy is pivotal to the analysis process of this research; therefore, it is important
to provide a consensus definition for strategy. As early as 1987 Henry Mintzberg has claimed that
the field of strategic management “cannot afford to rely on a single definition of strategy” (cf.
Mintzberg, 1987). Favaro, Rangan, & Hirsh (2012) implicitly confirmed the fact that there is a
vigorous disagreement among scholars (even though they have provided a single definition as we
show later). Historically, the definitions of strategy went through a few major milestones. In 1979
George Steiner, in his book “Strategic Planning”, pointed out that there was little agreement on what
strategy was, and referred to strategic planning as the action to counter rival moves. He did not
provide a formal definition of strategy. Andrews (1980) and later Mintzberg (1987) and Mintzberg
(1994) have shifted the focus to aspects such as plans, patterns of action, and a specific perspective;
From IT Business Strategic Alignment to Performance 23
introducing the concept of strategic competitive position that reflects decisions concerning products,
services, markets, and locations (cf. Robert, 1997).
Michael Porter (1996) stated that strategy is about being different through “choosing a different set
of activities to deliver a unique mix of value”. Initially, Porter has stressed the concept of creating a
competitive position expressing a particular product/service for a specific market (as previously
proposed by Mintzberg, 1994). This view was later criticized, even by Porter himself, as being too
static for the currently dynamic world in which competitors could imitate at a very fast pace (cf.
Porter 1996). We choose to define strategy as put forward by Favaro et al. (2012).
Definition 2-3 Strategy
Strategy is defined as “the result of choices executives make, on where to play and how to win, to maximize long-term value”. (Favaro et al., 2012) Thus, the task of strategy is to maintain a dynamic, not a static balance. Organizations which use
strategic planning do not straightforwardly react to events in the present, but are pro-active in
considering and anticipating future events and deciding ahead on actions in order to achieve future
objectives (cf. Scot, 1997; Tang & Walters, 2009). Those organizations are known to practice
strategic management. In general terms, it is agreed that strategic management could be defined as
follows.
Definition 2-4 Strategic Management
Strategic management is defined as to be concerned with “managerial decisions and actions that determine the long-term prosperity of the organization”. (Tang & Walters, 2009)
As strategies and strategic management evolved along with their organizations, IT has become
critically indispensable to organizational strategic management practices, requiring a shift of the
general role of IT from merely a back office transactional support to a major player in shaping core
competencies.
So, the competencies of the organizations have evolved from organizational strategic management
through active integration into organizational strategies (cf. Tang & Walters, 2009).
The road towards the integration of IT into organizational strategy has gone through a long and
gradual journey. The following paragraphs provide a brief description of the major milestones of this
evolutionary process.
Cha
pter
2
22 Background and Definitions
offer better products and services. Below we provide definitions of both IT and IS for the reader’s
reference. We start with the definition of IT.
Definition 2-1 Information Technology
Information technology (IT) is defined as “consisting of all the hardware and software that a firm needs to use in order to achieve its business objectives”. (Laudon & Laudon, 2014)
By definition, IT covers a large-scale area of technological needs of an organization including all
aspects of general-use hardware and software systems (storage, retrieval, archiving, and transaction
processing). The term information systems (IS) is used to express a more specific meaning that is
related to data management and information management with the aim of supporting management
decisions making. Next, we provide a definition of IS.
Definition 2-2 Information Systems
An information system is defined as “a set of interrelated components that collect (or retrieve), process, store, and distribute information to support decision making and control in an organization”. (Laudon & Laudon, 2014). In the literature, the terms information technology (IT) and information systems (IS) are commonly
used interchangeably. Since the focus of this thesis is on topics of a wider scope than IT and IS, they
could therefore be considered in the larger picture as belonging to the same class and for this class
the term IT will be used throughout the thesis.
Although we focus on Information Technology, and in particular on its evolution, it is wise to keep
in mind that the description of the evolution should be concerned with the disciplines of Management
Science and Business Strategy. The reason is that these disciplines have studied strategy as a concept
for a long time. Strategy is pivotal to the analysis process of this research; therefore, it is important
to provide a consensus definition for strategy. As early as 1987 Henry Mintzberg has claimed that
the field of strategic management “cannot afford to rely on a single definition of strategy” (cf.
Mintzberg, 1987). Favaro, Rangan, & Hirsh (2012) implicitly confirmed the fact that there is a
vigorous disagreement among scholars (even though they have provided a single definition as we
show later). Historically, the definitions of strategy went through a few major milestones. In 1979
George Steiner, in his book “Strategic Planning”, pointed out that there was little agreement on what
strategy was, and referred to strategic planning as the action to counter rival moves. He did not
provide a formal definition of strategy. Andrews (1980) and later Mintzberg (1987) and Mintzberg
(1994) have shifted the focus to aspects such as plans, patterns of action, and a specific perspective;
From IT Business Strategic Alignment to Performance 23
introducing the concept of strategic competitive position that reflects decisions concerning products,
services, markets, and locations (cf. Robert, 1997).
Michael Porter (1996) stated that strategy is about being different through “choosing a different set
of activities to deliver a unique mix of value”. Initially, Porter has stressed the concept of creating a
competitive position expressing a particular product/service for a specific market (as previously
proposed by Mintzberg, 1994). This view was later criticized, even by Porter himself, as being too
static for the currently dynamic world in which competitors could imitate at a very fast pace (cf.
Porter 1996). We choose to define strategy as put forward by Favaro et al. (2012).
Definition 2-3 Strategy
Strategy is defined as “the result of choices executives make, on where to play and how to win, to maximize long-term value”. (Favaro et al., 2012) Thus, the task of strategy is to maintain a dynamic, not a static balance. Organizations which use
strategic planning do not straightforwardly react to events in the present, but are pro-active in
considering and anticipating future events and deciding ahead on actions in order to achieve future
objectives (cf. Scot, 1997; Tang & Walters, 2009). Those organizations are known to practice
strategic management. In general terms, it is agreed that strategic management could be defined as
follows.
Definition 2-4 Strategic Management
Strategic management is defined as to be concerned with “managerial decisions and actions that determine the long-term prosperity of the organization”. (Tang & Walters, 2009)
As strategies and strategic management evolved along with their organizations, IT has become
critically indispensable to organizational strategic management practices, requiring a shift of the
general role of IT from merely a back office transactional support to a major player in shaping core
competencies.
So, the competencies of the organizations have evolved from organizational strategic management
through active integration into organizational strategies (cf. Tang & Walters, 2009).
The road towards the integration of IT into organizational strategy has gone through a long and
gradual journey. The following paragraphs provide a brief description of the major milestones of this
evolutionary process.

24 Background and Definitions
During the 1950s and 1960s computers were merely used for data collection, processing and storage.
The MIS (Management Information Systems) came into development during the 1960s providing
managerial-support information through report-based output with limited decision support
capabilities. Before further discussion of the evolution stages of IT, which include the reference for
strategic decision support systems, we provide a formal definition of strategic IT.
Definition 2-5 Strategic IT
Strategic IT is defined as "an information system to support or change an enterprise's strategy and to assist in strategic decision making”. (Hemmatfar, Salehi, & Bayat, 2010)
The roots of the strategic relevance of IT systems have originated during the 1970s with the
appearance of the mainframe computers. The nature of the IS was transaction processing with a focus
on the efficiency of monitoring and control operations with limited decision support capabilities.
Those early systems provided support for solving complex problems, such as planning and
forecasting, with the help of a flexible user interface.
During the microcomputers stage (1980s and 1990s) Decision Support Systems (DSS) have
eventually evolved into systems for decision support of top management. The emergence of systems
such as executive support systems (ESS) and enterprise resource planning (ERP) has facilitated an
emphasis on effective problem solving functions during this era. Effectiveness became the motivation
behind the establishment of such systems. Moreover, during this era, the IT relevance and its
involvement with the business planning processes became apparent.
The emergence of the direct IT support for strategic initiatives and the recognition of its direct
involvement in organizational strategic value creation came about after the 1990s. More specifically,
the direct and timely support of IT to the business strategy was facilitated by the emergence of an
effective internet and networking systems. This era has shown the appearance of systems such as
supply chain management (SCM), customer relationship management (CRM), and knowledge
management (KM) (cf. Leidner & Elam, 1995; Applegate, Austin, & McFarlan, 2007; O'Brien, 2012,
Laudon & Laudon, 2014). This development was motivated mainly by the quest for a greater business
value and growth through organizational transformations.
Even though the period after the 1990s has witnessed an initial dis-integration of IT strategy (ITS)
from business strategic planning (mainly due to the recession), ITS has later returned to the business
mainline planning in search of competitive advantage with the business side taking ownership of the
From IT Business Strategic Alignment to Performance 25
ITS (cf. Ward, 2012). At a later time, this integration of ITS into the business strategy has led to the
emergence of the concept of IT and business strategic alignment (ITBSA) as will be discussed later.
The above described milestones of the relevance of IT and strategic management are summarized in
Table 2-1.
In Table 2-1, we see a cross tabulation of IT aspects such as: dominant technology, information
systems, IS motivation, and strategic management relevance, with major hardware categorization,
namely, (1) mainframe era, (2) microcomputer era, and (3) the internet networking era. This cross
tabulation provides an overview of the evolution stages of IT and their integration into the strategic
management field.
In order to effectively integrate the previously described IT technology and systems into business
operations, there is a need for an IT-related strategy that is to be aligned with a business value-creating
strategy. Below, we briefly provide a background and a definition of the IT strategy as it relates to
the evolution stages described in Table 2-1. Given the fact that IT strategy is not a very well-known
and well defined concept, we provide the following definition as it applies to our line of research.
Definition 2-6 IT Strategy (ITS)
IT strategy is defined as “activities directed toward (1) recognizing organizational opportunities for using information technology, (2) determining the resource requirements to exploit these opportunities, and (3) developing strategies and action plans for realizing these opportunities and for meeting the resource needs”. (cf. Boynton & Zmud, 1987)
2.1.2 The Integration of the IT Strategy into the Business Strategy
In this subsection, we explore the ITBSA concept by (A) providing a background and a definition of
the ITBSA concept, and (B) providing a basic literature-based framework for the ITBSA concept.
A: The ITBSA concept: background and definition
The start of the integration is situated in the diligent observation of the facts. What we see is the
following. Investors seek reward for the vast investments their companies channel into IT. Those
investments amount to approximately 20% to 40% of capital investments (cf. Berghout & Tan, 2013).
This fact imposes significant pressure on boards of directors to (a) attempt to reduce IT spending, (b)
closely monitor IT investments, and (c) develop a framework of policies that work towards best
utilization of those investments in realizing business strategic objectives (cf. Nolan & McFarlan,

Cha
pter
2
24 Background and Definitions
During the 1950s and 1960s computers were merely used for data collection, processing and storage.
The MIS (Management Information Systems) came into development during the 1960s providing
managerial-support information through report-based output with limited decision support
capabilities. Before further discussion of the evolution stages of IT, which include the reference for
strategic decision support systems, we provide a formal definition of strategic IT.
Definition 2-5 Strategic IT
Strategic IT is defined as "an information system to support or change an enterprise's strategy and to assist in strategic decision making”. (Hemmatfar, Salehi, & Bayat, 2010)
The roots of the strategic relevance of IT systems have originated during the 1970s with the
appearance of the mainframe computers. The nature of the IS was transaction processing with a focus
on the efficiency of monitoring and control operations with limited decision support capabilities.
Those early systems provided support for solving complex problems, such as planning and
forecasting, with the help of a flexible user interface.
During the microcomputers stage (1980s and 1990s) Decision Support Systems (DSS) have
eventually evolved into systems for decision support of top management. The emergence of systems
such as executive support systems (ESS) and enterprise resource planning (ERP) has facilitated an
emphasis on effective problem solving functions during this era. Effectiveness became the motivation
behind the establishment of such systems. Moreover, during this era, the IT relevance and its
involvement with the business planning processes became apparent.
The emergence of the direct IT support for strategic initiatives and the recognition of its direct
involvement in organizational strategic value creation came about after the 1990s. More specifically,
the direct and timely support of IT to the business strategy was facilitated by the emergence of an
effective internet and networking systems. This era has shown the appearance of systems such as
supply chain management (SCM), customer relationship management (CRM), and knowledge
management (KM) (cf. Leidner & Elam, 1995; Applegate, Austin, & McFarlan, 2007; O'Brien, 2012,
Laudon & Laudon, 2014). This development was motivated mainly by the quest for a greater business
value and growth through organizational transformations.
Even though the period after the 1990s has witnessed an initial dis-integration of IT strategy (ITS)
from business strategic planning (mainly due to the recession), ITS has later returned to the business
mainline planning in search of competitive advantage with the business side taking ownership of the
From IT Business Strategic Alignment to Performance 25
ITS (cf. Ward, 2012). At a later time, this integration of ITS into the business strategy has led to the
emergence of the concept of IT and business strategic alignment (ITBSA) as will be discussed later.
The above described milestones of the relevance of IT and strategic management are summarized in
Table 2-1.
In Table 2-1, we see a cross tabulation of IT aspects such as: dominant technology, information
systems, IS motivation, and strategic management relevance, with major hardware categorization,
namely, (1) mainframe era, (2) microcomputer era, and (3) the internet networking era. This cross
tabulation provides an overview of the evolution stages of IT and their integration into the strategic
management field.
In order to effectively integrate the previously described IT technology and systems into business
operations, there is a need for an IT-related strategy that is to be aligned with a business value-creating
strategy. Below, we briefly provide a background and a definition of the IT strategy as it relates to
the evolution stages described in Table 2-1. Given the fact that IT strategy is not a very well-known
and well defined concept, we provide the following definition as it applies to our line of research.
Definition 2-6 IT Strategy (ITS)
IT strategy is defined as “activities directed toward (1) recognizing organizational opportunities for using information technology, (2) determining the resource requirements to exploit these opportunities, and (3) developing strategies and action plans for realizing these opportunities and for meeting the resource needs”. (cf. Boynton & Zmud, 1987)
2.1.2 The Integration of the IT Strategy into the Business Strategy
In this subsection, we explore the ITBSA concept by (A) providing a background and a definition of
the ITBSA concept, and (B) providing a basic literature-based framework for the ITBSA concept.
A: The ITBSA concept: background and definition
The start of the integration is situated in the diligent observation of the facts. What we see is the
following. Investors seek reward for the vast investments their companies channel into IT. Those
investments amount to approximately 20% to 40% of capital investments (cf. Berghout & Tan, 2013).
This fact imposes significant pressure on boards of directors to (a) attempt to reduce IT spending, (b)
closely monitor IT investments, and (c) develop a framework of policies that work towards best
utilization of those investments in realizing business strategic objectives (cf. Nolan & McFarlan,

26 Background and Definitions
2005; Coleman & Chatfield, 2011; Ward, 2012). The pressure noted emphasizes the discussion that
we have provided in the previous subsection on strategic management and IT integration.
Tech Era
Evaluation Characteristics
(1) Mainframe Era 1950s – 1970s
(2) Microcomputer Era 1980s – early 1990s
(3) Internet & Networking era
1990s – to present
(a) Dominant technology
Mainframes Stand-alone
applications Centralized
databases
Microcomputers Workstations Stand-alone and
client-server applications
Networked microcomputers
Client-server applications
Internet technology Web browser Hypertext Hypermedia
(b) Information Systems
Transaction processing
Systems Management
information systems
Limited decision support systems
Comprehensive decision support system
Executive support systems
Enterprise resource planning
Business intelligence
Human resource management
Expert systems
Supply chain management
Customer relationship management
Knowledge management
Strategic information sys.
Multi-agent systems Mobile information
sys.
(c) IS motivation Efficiency Effectiveness Business value (d) Strategic management relevance
Provide information for monitoring and control of operations.
Provide information and decision support for problem solving
Support strategic initiatives to transform organizations and markets
(d) IT Strategy Relevance
Information provision Mainly organizational based
Perform comprehensive planning for all types of IS (above) investments and the start of the integration of ITS with business planning processes
Initially, disintegration of ITS and business strategy due to recession
Later on, IT-enabled business change and significant integration of ITS into business strategies
Business ownership of ITS
Table 2-1 IT Evolution and strategic relevance
Adapted from Applegate et al. (2007); Chen, Preston, Mocker, & Teubner (2010); Ward (2012)
From IT Business Strategic Alignment to Performance 27
Moreover, we here repeat that business value from IT investments will be created at the business side
and cannot be realized by IT alone (cf. Schwarz et al., 2010; Baker, Jones, Qing, & Jaeki, 2011). For
example, there will be no business value created even if IT delivers a new sales tracking or CRM
system application on time and within the budget. What should happen thereafter is that the business
integrates the new IT system into its business operations. Any business value will only be created
when new and adequate business processes are designed and executed, enabling the sales people of
the organization to increase turnover and profit.
In spite of the fact that the main IT responsibilities are at the business side, the IT management and
planning discussions remained mainly within the IT area (cf. Luftman & Kempaiah, 2008). Hence, a
discussion should time and again emerge on the importance of the IT/Business co-involvement which
we call alignment (cf. Luftman, 2015).
There are at least six common types of alignment in the literature. We summarize those common
types of alignment in Table 2-2.
Most of the research on IT is concerned with the fifth type of alignment, namely strategic alignment
(cf. Boynton & Zmud, 1987; Sabherwal & Chan, 2001; Chan & Reich, 2007; Oh & Pinsonneault,
2007). In our research, we choose for using strategic alignment in the design of our conceptual model
where this type of alignment fits best with our idea on ITBSA.
Over the years, ITBSA became a key issue for researchers and managers. It has been identified as
one of the main factors along the path from IT investment to realizing organizational competitive
advantage and the desired return on IT investment (cf. Papp, 1999; Sabherwal & Chan, 2001; Schwarz
et al., 2010). Organizations, which manage to align business and IT strategies, are able to use IT for
competitive advantage and perform better in general (cf. Sabherwal & Chan, 2001; Kearns & Lederer,
2004; Byrd et al., 2006; Kearns & Sabherwal, 2006; Tallon & Pinsonneault, 2011; Baker et al., 2011).

Cha
pter
2
26 Background and Definitions
2005; Coleman & Chatfield, 2011; Ward, 2012). The pressure noted emphasizes the discussion that
we have provided in the previous subsection on strategic management and IT integration.
Tech Era
Evaluation Characteristics
(1) Mainframe Era 1950s – 1970s
(2) Microcomputer Era 1980s – early 1990s
(3) Internet & Networking era
1990s – to present
(a) Dominant technology
Mainframes Stand-alone
applications Centralized
databases
Microcomputers Workstations Stand-alone and
client-server applications
Networked microcomputers
Client-server applications
Internet technology Web browser Hypertext Hypermedia
(b) Information Systems
Transaction processing
Systems Management
information systems
Limited decision support systems
Comprehensive decision support system
Executive support systems
Enterprise resource planning
Business intelligence
Human resource management
Expert systems
Supply chain management
Customer relationship management
Knowledge management
Strategic information sys.
Multi-agent systems Mobile information
sys.
(c) IS motivation Efficiency Effectiveness Business value (d) Strategic management relevance
Provide information for monitoring and control of operations.
Provide information and decision support for problem solving
Support strategic initiatives to transform organizations and markets
(d) IT Strategy Relevance
Information provision Mainly organizational based
Perform comprehensive planning for all types of IS (above) investments and the start of the integration of ITS with business planning processes
Initially, disintegration of ITS and business strategy due to recession
Later on, IT-enabled business change and significant integration of ITS into business strategies
Business ownership of ITS
Table 2-1 IT Evolution and strategic relevance
Adapted from Applegate et al. (2007); Chen, Preston, Mocker, & Teubner (2010); Ward (2012)
From IT Business Strategic Alignment to Performance 27
Moreover, we here repeat that business value from IT investments will be created at the business side
and cannot be realized by IT alone (cf. Schwarz et al., 2010; Baker, Jones, Qing, & Jaeki, 2011). For
example, there will be no business value created even if IT delivers a new sales tracking or CRM
system application on time and within the budget. What should happen thereafter is that the business
integrates the new IT system into its business operations. Any business value will only be created
when new and adequate business processes are designed and executed, enabling the sales people of
the organization to increase turnover and profit.
In spite of the fact that the main IT responsibilities are at the business side, the IT management and
planning discussions remained mainly within the IT area (cf. Luftman & Kempaiah, 2008). Hence, a
discussion should time and again emerge on the importance of the IT/Business co-involvement which
we call alignment (cf. Luftman, 2015).
There are at least six common types of alignment in the literature. We summarize those common
types of alignment in Table 2-2.
Most of the research on IT is concerned with the fifth type of alignment, namely strategic alignment
(cf. Boynton & Zmud, 1987; Sabherwal & Chan, 2001; Chan & Reich, 2007; Oh & Pinsonneault,
2007). In our research, we choose for using strategic alignment in the design of our conceptual model
where this type of alignment fits best with our idea on ITBSA.
Over the years, ITBSA became a key issue for researchers and managers. It has been identified as
one of the main factors along the path from IT investment to realizing organizational competitive
advantage and the desired return on IT investment (cf. Papp, 1999; Sabherwal & Chan, 2001; Schwarz
et al., 2010). Organizations, which manage to align business and IT strategies, are able to use IT for
competitive advantage and perform better in general (cf. Sabherwal & Chan, 2001; Kearns & Lederer,
2004; Byrd et al., 2006; Kearns & Sabherwal, 2006; Tallon & Pinsonneault, 2011; Baker et al., 2011).

28 Background and Definitions
Alignment type Common Description Source 1 Business Alignment
(Aligning organizational resources and strategy)
The organization’s structure and resources should evolve to support the strategic mission of the organization.
(Andrews, 1971) (Sabherwal, Hirschheim, & Goles, 2001)
2 IT alignment An organization is well-positioned to execute its IT strategy; the IT resource deployment is guided by that IT strategy.
(Sabherwal, Hirschheim, & Goles, 2001)
3 Contextual alignment Organizations are expected to align their organizational resources with their competitive context.
(Drazin & Van De Ven, 1985) (Sabherwal, Hirschheim, & Goles, 2001)
4 Structural alignment The resemblance between organizational resources and IT resources is structurally aligned.
(Henderson & Venkatraman, 1993) (Sabherwal, Hirschheim, & Goles, 2001)
5 Strategic alignment The link between IT strategy and organizational strategy is aligned.
(Sabherwal, Hirschheim, & Goles, 2001; other references are in the text)
6 Social alignment The state in which business and IT executives within an organizational unit understand and are committed to the business and IT mission, objectives, and plans.
(Reich & Benbasat, 2000).
Table 2-2 Six common types of alignment in literature and practice
At this point it is important to distinguish between two concepts that are sometimes used
interchangeably in the literature, viz. integration and alignment. To distinguish between integration
and alignment we provide the following two definitions indicating which researchers we take as
founding fathers of our investigations.
Integration is defined as “providing specific IS support for a specific business activity”. (Rockart & Short, 1989)
Integration usually refers to the functional focus (also called the internal focus). It implies the
utilization of IT with the aim of coordinating and integrating specific roles and functions of the firm’s
members within the value-chain activities (cf. Rockart & Short, 1989; Schwarz et al., 2010). An
Definition 2-7 Integration
From IT Business Strategic Alignment to Performance 29
example would be the usage of a centralized company knowledge database to allow maximum
information sharing among internal functions. In contrast, alignment is defined as follows.
Definition 2-8 Alignment
Alignment is defined as “the development of a generalizable IT/IS capability that is consistent with the general strategic directions of the organization”. (cf. Chan & Huff, 1993) As the definition implies, alignment refers to a technical capability of IT being exploited to serve one
or more strategic objectives on the business side. In the literature, many terms and dimensions have
been used to describe alignment including: linkage (Luftman & Brier, 1999), bridge (Peppard, 2001),
and harmony (Weill & Ross, 2004). Consequently, the level of alignment to be explored has been
extensively described in the literature.
The most prominent model of alignment is the SAM model (cf. Renaud et al., 2016). The SAM
model integrates both strategic and functional types of alignment. Schwarz et al. (2010) argue that
organizations are bi-focused, i.e., they simultaneously look at (a) operational efficiency and (b) the
utilization of IT as a driver of competitive advantage. Seen from this perspective, the various terms
used to describe alignment converge to the most common type of alignment (see Table 2-3 for
alternative definitions of alignment) the strategic alignment, which is the main concept used in the
IT research and practice (cf. Schwarz et al., 2010).
B: The ITBSA concept: a literature-based framework
Nowadays, CEOs focus more on IT and CIOs are taking a more intensive strategic role.
Consequently, strategic alignment has become an issue among the top concerns of executives and
managers (cf. Luftman, Kempaiah, & Nash, 2005; Chan & Reich, 2007; Luftman & Ben-Zvi, 2009;
Chang et al., 2011). All in all, we therefore define ITBSA as follows.
Definition 2-9 IT Business Strategic Alignment (ITBSA)
IT Business Strategic Alignment is defined as “The extent to which the IT mission and strategies support (and are supported by) the business mission and strategies”. (cf. Reich & Benbasat, 1996; Sabherwal & Chan, 2001; Chan, 2002) This definition of ITBSA closely describes the concept as related to this thesis. Nevertheless, to
provide a broader overview it is important to mention that there are several other definitions of ITBSA
in the literature. Table 2-3 shows nine of the other common definitions of ITBSA in the literature.
They are classified into seven classes. The emphasis is as follows.
Class 1: the relation internal - external

Cha
pter
2
28 Background and Definitions
Alignment type Common Description Source 1 Business Alignment
(Aligning organizational resources and strategy)
The organization’s structure and resources should evolve to support the strategic mission of the organization.
(Andrews, 1971) (Sabherwal, Hirschheim, & Goles, 2001)
2 IT alignment An organization is well-positioned to execute its IT strategy; the IT resource deployment is guided by that IT strategy.
(Sabherwal, Hirschheim, & Goles, 2001)
3 Contextual alignment Organizations are expected to align their organizational resources with their competitive context.
(Drazin & Van De Ven, 1985) (Sabherwal, Hirschheim, & Goles, 2001)
4 Structural alignment The resemblance between organizational resources and IT resources is structurally aligned.
(Henderson & Venkatraman, 1993) (Sabherwal, Hirschheim, & Goles, 2001)
5 Strategic alignment The link between IT strategy and organizational strategy is aligned.
(Sabherwal, Hirschheim, & Goles, 2001; other references are in the text)
6 Social alignment The state in which business and IT executives within an organizational unit understand and are committed to the business and IT mission, objectives, and plans.
(Reich & Benbasat, 2000).
Table 2-2 Six common types of alignment in literature and practice
At this point it is important to distinguish between two concepts that are sometimes used
interchangeably in the literature, viz. integration and alignment. To distinguish between integration
and alignment we provide the following two definitions indicating which researchers we take as
founding fathers of our investigations.
Integration is defined as “providing specific IS support for a specific business activity”. (Rockart & Short, 1989)
Integration usually refers to the functional focus (also called the internal focus). It implies the
utilization of IT with the aim of coordinating and integrating specific roles and functions of the firm’s
members within the value-chain activities (cf. Rockart & Short, 1989; Schwarz et al., 2010). An
Definition 2-7 Integration
From IT Business Strategic Alignment to Performance 29
example would be the usage of a centralized company knowledge database to allow maximum
information sharing among internal functions. In contrast, alignment is defined as follows.
Definition 2-8 Alignment
Alignment is defined as “the development of a generalizable IT/IS capability that is consistent with the general strategic directions of the organization”. (cf. Chan & Huff, 1993) As the definition implies, alignment refers to a technical capability of IT being exploited to serve one
or more strategic objectives on the business side. In the literature, many terms and dimensions have
been used to describe alignment including: linkage (Luftman & Brier, 1999), bridge (Peppard, 2001),
and harmony (Weill & Ross, 2004). Consequently, the level of alignment to be explored has been
extensively described in the literature.
The most prominent model of alignment is the SAM model (cf. Renaud et al., 2016). The SAM
model integrates both strategic and functional types of alignment. Schwarz et al. (2010) argue that
organizations are bi-focused, i.e., they simultaneously look at (a) operational efficiency and (b) the
utilization of IT as a driver of competitive advantage. Seen from this perspective, the various terms
used to describe alignment converge to the most common type of alignment (see Table 2-3 for
alternative definitions of alignment) the strategic alignment, which is the main concept used in the
IT research and practice (cf. Schwarz et al., 2010).
B: The ITBSA concept: a literature-based framework
Nowadays, CEOs focus more on IT and CIOs are taking a more intensive strategic role.
Consequently, strategic alignment has become an issue among the top concerns of executives and
managers (cf. Luftman, Kempaiah, & Nash, 2005; Chan & Reich, 2007; Luftman & Ben-Zvi, 2009;
Chang et al., 2011). All in all, we therefore define ITBSA as follows.
Definition 2-9 IT Business Strategic Alignment (ITBSA)
IT Business Strategic Alignment is defined as “The extent to which the IT mission and strategies support (and are supported by) the business mission and strategies”. (cf. Reich & Benbasat, 1996; Sabherwal & Chan, 2001; Chan, 2002) This definition of ITBSA closely describes the concept as related to this thesis. Nevertheless, to
provide a broader overview it is important to mention that there are several other definitions of ITBSA
in the literature. Table 2-3 shows nine of the other common definitions of ITBSA in the literature.
They are classified into seven classes. The emphasis is as follows.
Class 1: the relation internal - external

30 Background and Definitions
Class 2: the business mission
Class 3: IT in harmony with business strategy
Class 4: IT coexisting with the overall strategy
Class 5: IS strategy fits with business strategy
Class 6: alignment of IT strategies to achieve the grand strategies
Class 7: top management positively supports IT business strategic alignment
Class IT Business Strategic Alignment Definitions Source 1 “The strategic fit (between the internal and external business
domains) and functional integration of: business strategy, IT strategy, organizational infrastructure and processes, and IS infrastructure and processes.”
(Henderson & Venkatraman, 1993)
“The organization of the IS function within a given firm should be contingent upon the internal and external factors specific to the firm.”
(Brown & Magill, 1994)
2 “…the degree to which the information technology mission, objectives, and plans support and are supported by the business mission, objectives, and plans.”
(Reich & Benbasat, 1996)
3 “Applying IT in an appropriate and timely way and in harmony with business strategies.”
(Luftman & Brier, 1999)
4 “Using IT in a way consistent with the firm’s overall strategy.” (Palmer & Markus, 2000)
5 “The fit between IS strategy and business strategy of Organizations.” (Yayla & Hu, 2009) 6 “the extent of fit between information technology and business
strategy.”
(Tallon & Pinsonneault, 2011)
“Alignment of organization's information technology strategies is a plan for coordinating information technologies tasks to organization's grand strategies.”
(Kordnaeij, Zali, Mohabatian, & Forouzandeh, 2012)
7 “Top Management and executive support positively influences IT business alignment on the strategic level”
(Lederer & Mendelow, 1989) (Beimborn, Schlosser, & Weitzel, 2009)
Table 2-3 Various definitions of ITBSA in the literature Initial table adopted from Baker & Jones (2008, p8)
At this point we would like to refer to Chang, Hsiao, & Lue (2011) who in their research on the IT
alignment in service oriented enterprises have pointed out that the ITBSA definitions which refers to
the fact that “both business and IT executives share a common vision” actually capture the social
dimension of alignment, hence rising to the concept of social alignment. For a cross reference with
classical definition of ITBSA, we provide a definition of social alignment as put forward by Reich &
Benbasat (2000).
From IT Business Strategic Alignment to Performance 31
Definition 2-10 Social Alignment
Social dimension of alignment is defined as “the state in which business and IT executives within an organizational unit understand and are committed to the business and IT mission, objectives, and plans.” (Reich & Benbasat, 2000) In spite of the resemblance of social alignment and strategic alignment, in this research thesis we will
maintain the naming convention of ITBSA (IT Business Strategic Alignment) to maintain consistency
with literature and the main aim of this research. Below we describe (B1) the general framework of
ITBSA and (B2) the SAM model
B1: The general framework of ITBSA
Historically, multiple frameworks have been put forward in the literature to express ITBSA (see, e.g.,
Henderson & Venkatraman, 1993; Reich & Benbasat, 1996). Studies in the field of ITBSA have
utilized various configurations and schemes of components that are based on the multiple definitions
expressed in Table 2-3. A generic framework of ITBSA components is depicted in Figure 2-1.
Figure 2-1 Basic framework of the alignment between IT and business strategies Adopted from Boddy, Boonstra, & Kennedy (2005).
The basic framework shows the interaction of the common components of ITBSA which are the (a)
corporate strategy and (b) the IT strategy. It is important to note, as depicted in Figure 2-1, that the
corporate strategy (also called the organizational strategy) could take any or all of the various
components of strategic management including: production, finance, marketing, and human
resources.
B2: The SAM Model
As mentioned above there are many frameworks expressing ITBSA. Due to its importance to the
ITBSA framework, as well as, its relevance to this research, the SAM (strategic alignment model)
will be described below.

Cha
pter
2
30 Background and Definitions
Class 2: the business mission
Class 3: IT in harmony with business strategy
Class 4: IT coexisting with the overall strategy
Class 5: IS strategy fits with business strategy
Class 6: alignment of IT strategies to achieve the grand strategies
Class 7: top management positively supports IT business strategic alignment
Class IT Business Strategic Alignment Definitions Source 1 “The strategic fit (between the internal and external business
domains) and functional integration of: business strategy, IT strategy, organizational infrastructure and processes, and IS infrastructure and processes.”
(Henderson & Venkatraman, 1993)
“The organization of the IS function within a given firm should be contingent upon the internal and external factors specific to the firm.”
(Brown & Magill, 1994)
2 “…the degree to which the information technology mission, objectives, and plans support and are supported by the business mission, objectives, and plans.”
(Reich & Benbasat, 1996)
3 “Applying IT in an appropriate and timely way and in harmony with business strategies.”
(Luftman & Brier, 1999)
4 “Using IT in a way consistent with the firm’s overall strategy.” (Palmer & Markus, 2000)
5 “The fit between IS strategy and business strategy of Organizations.” (Yayla & Hu, 2009) 6 “the extent of fit between information technology and business
strategy.”
(Tallon & Pinsonneault, 2011)
“Alignment of organization's information technology strategies is a plan for coordinating information technologies tasks to organization's grand strategies.”
(Kordnaeij, Zali, Mohabatian, & Forouzandeh, 2012)
7 “Top Management and executive support positively influences IT business alignment on the strategic level”
(Lederer & Mendelow, 1989) (Beimborn, Schlosser, & Weitzel, 2009)
Table 2-3 Various definitions of ITBSA in the literature Initial table adopted from Baker & Jones (2008, p8)
At this point we would like to refer to Chang, Hsiao, & Lue (2011) who in their research on the IT
alignment in service oriented enterprises have pointed out that the ITBSA definitions which refers to
the fact that “both business and IT executives share a common vision” actually capture the social
dimension of alignment, hence rising to the concept of social alignment. For a cross reference with
classical definition of ITBSA, we provide a definition of social alignment as put forward by Reich &
Benbasat (2000).
From IT Business Strategic Alignment to Performance 31
Definition 2-10 Social Alignment
Social dimension of alignment is defined as “the state in which business and IT executives within an organizational unit understand and are committed to the business and IT mission, objectives, and plans.” (Reich & Benbasat, 2000) In spite of the resemblance of social alignment and strategic alignment, in this research thesis we will
maintain the naming convention of ITBSA (IT Business Strategic Alignment) to maintain consistency
with literature and the main aim of this research. Below we describe (B1) the general framework of
ITBSA and (B2) the SAM model
B1: The general framework of ITBSA
Historically, multiple frameworks have been put forward in the literature to express ITBSA (see, e.g.,
Henderson & Venkatraman, 1993; Reich & Benbasat, 1996). Studies in the field of ITBSA have
utilized various configurations and schemes of components that are based on the multiple definitions
expressed in Table 2-3. A generic framework of ITBSA components is depicted in Figure 2-1.
Figure 2-1 Basic framework of the alignment between IT and business strategies Adopted from Boddy, Boonstra, & Kennedy (2005).
The basic framework shows the interaction of the common components of ITBSA which are the (a)
corporate strategy and (b) the IT strategy. It is important to note, as depicted in Figure 2-1, that the
corporate strategy (also called the organizational strategy) could take any or all of the various
components of strategic management including: production, finance, marketing, and human
resources.
B2: The SAM Model
As mentioned above there are many frameworks expressing ITBSA. Due to its importance to the
ITBSA framework, as well as, its relevance to this research, the SAM (strategic alignment model)
will be described below.

32 Background and Definitions
The SAM model was developed by Henderson & Venkatraman (1993). Figure 2-2 shows two main
integrations, (1) functional integration (2) strategic alignment.
We discuss the full integration process in three stages. First, the horizontal double arrow connecting
the top two boxes stresses the (as expressed by the SAM model) functional integration between the
business strategy and the IT strategy. Meanwhile, the horizontal double arrow connecting the lower
two boxes of Figure 2-2 demonstrate the functional integration among business-side factors (such as
the administrative and organizational processes) and the IT-side factors (such as IT infrastructure and
processes). Second, the vertical double arrows connecting the upper and lower boxes (at the right side
and at the left side) demonstrate the strategic alignment among the strategic and infrastructure levels
on both the business and IT sides. Third, the crossed arrows in the middle of Figure 2-2 demonstrate
the overall necessary balance between business strategies, IT strategies, business processes, and IT
processes in order to achieve successful operations and consequently high levels of performance.
Researchers such as Maes (1999) and Sabherwal & Chan (2001) have built on this concept and
provided a more in-depth view into ITBSA. They defined ITBSA as “the degree to which the
information technology mission, objectives, and plans support and are supported by the business
mission, objectives and plans”. Nevertheless, Sabherwal & Chan (2001) provide two important
warnings, viz. (1) that the concept needs to be studied as a whole, and (2) that both strategic and
functional aspects, and any attempts for a reduced bivariate approach could lead to serious operational
problems.
Figure 2-2 Strategic alignment model SAM Adopted from Silvius, de Wall, & Smit (2009)
It is important to mention that this model has not escaped controversy. Renaud et al. (2016) have
performed an extensive analysis of the literature on the SAM model and papers citing the SAM model
between 2011 and 2014. They have concluded that the SAM model has been used and explored in
From IT Business Strategic Alignment to Performance 33
the literature from at least the following seven perspectives (for specific references on the
perspectives, please see Renaud et al. (2016)).
(1) Managing the strategic alignment. This group of researchers posit the SAM model (a wholistic
view) as being a source of competitive advantage. They propose conditions on how to enhance
the effect of the SAM model on firm’s performance.
(2) Operationalization of the SAM domains. This group is influenced by statistical analysis, and
provide tools on the operationalization of the SAM domains.
(3) Planning of the alignment. The researchers that are within this group focus on the planning
process of the SAM domains, mainly, the IT strategy and the business strategy. Some of the
authors even consider the IT strategy as a subordinate to the business strategy. They claim that
the IT strategy should be planned ex post and only according to the outcomes of the business
strategy plan (no co-planning).
(4) Strategy content perspective. This group studies the conditions that led to strategic alignment, as
well as, the impact of strategic alignment on the organizational performance.
(5) The IT strategy planning management. In this line of research, the authors claim no direct
relationship between IT investments and firm’s performance. They propose methods of
transferring those investments into a competitive advantage.
(6) The business strategy planning and implementation. These research papers are focused on the
business strategy side of the SAM. Their main concern is the methods of business strategy
implementation
(7) The inter-organizational coordination. This group’s focus is on inter-organizational IT systems’
implementation. It mainly concerns the managers of IT. They claim that strategic alignment is
less important, yet, they accept that it is a precondition for managers in order to succeed in IT
projects implementation.
Based on those perspectives, Renaud et al. (2016) have put forward the following three criticisms to
the model. (1) There is a discrepancy between the literature trends and the practical applicability of
this model. (2) The model is being designed and studied for the top-level management, and therefore,
it is not realistic for implementation. (3) The model is being treated in the literature as a prescriptive
black box (not enough consideration for its internal structures). Finally, (4) the model’s antecedents
and consequences are being analyzed, yet, no in-depth analysis is performed on its fundamental
assumptions.

Cha
pter
2
32 Background and Definitions
The SAM model was developed by Henderson & Venkatraman (1993). Figure 2-2 shows two main
integrations, (1) functional integration (2) strategic alignment.
We discuss the full integration process in three stages. First, the horizontal double arrow connecting
the top two boxes stresses the (as expressed by the SAM model) functional integration between the
business strategy and the IT strategy. Meanwhile, the horizontal double arrow connecting the lower
two boxes of Figure 2-2 demonstrate the functional integration among business-side factors (such as
the administrative and organizational processes) and the IT-side factors (such as IT infrastructure and
processes). Second, the vertical double arrows connecting the upper and lower boxes (at the right side
and at the left side) demonstrate the strategic alignment among the strategic and infrastructure levels
on both the business and IT sides. Third, the crossed arrows in the middle of Figure 2-2 demonstrate
the overall necessary balance between business strategies, IT strategies, business processes, and IT
processes in order to achieve successful operations and consequently high levels of performance.
Researchers such as Maes (1999) and Sabherwal & Chan (2001) have built on this concept and
provided a more in-depth view into ITBSA. They defined ITBSA as “the degree to which the
information technology mission, objectives, and plans support and are supported by the business
mission, objectives and plans”. Nevertheless, Sabherwal & Chan (2001) provide two important
warnings, viz. (1) that the concept needs to be studied as a whole, and (2) that both strategic and
functional aspects, and any attempts for a reduced bivariate approach could lead to serious operational
problems.
Figure 2-2 Strategic alignment model SAM Adopted from Silvius, de Wall, & Smit (2009)
It is important to mention that this model has not escaped controversy. Renaud et al. (2016) have
performed an extensive analysis of the literature on the SAM model and papers citing the SAM model
between 2011 and 2014. They have concluded that the SAM model has been used and explored in
From IT Business Strategic Alignment to Performance 33
the literature from at least the following seven perspectives (for specific references on the
perspectives, please see Renaud et al. (2016)).
(1) Managing the strategic alignment. This group of researchers posit the SAM model (a wholistic
view) as being a source of competitive advantage. They propose conditions on how to enhance
the effect of the SAM model on firm’s performance.
(2) Operationalization of the SAM domains. This group is influenced by statistical analysis, and
provide tools on the operationalization of the SAM domains.
(3) Planning of the alignment. The researchers that are within this group focus on the planning
process of the SAM domains, mainly, the IT strategy and the business strategy. Some of the
authors even consider the IT strategy as a subordinate to the business strategy. They claim that
the IT strategy should be planned ex post and only according to the outcomes of the business
strategy plan (no co-planning).
(4) Strategy content perspective. This group studies the conditions that led to strategic alignment, as
well as, the impact of strategic alignment on the organizational performance.
(5) The IT strategy planning management. In this line of research, the authors claim no direct
relationship between IT investments and firm’s performance. They propose methods of
transferring those investments into a competitive advantage.
(6) The business strategy planning and implementation. These research papers are focused on the
business strategy side of the SAM. Their main concern is the methods of business strategy
implementation
(7) The inter-organizational coordination. This group’s focus is on inter-organizational IT systems’
implementation. It mainly concerns the managers of IT. They claim that strategic alignment is
less important, yet, they accept that it is a precondition for managers in order to succeed in IT
projects implementation.
Based on those perspectives, Renaud et al. (2016) have put forward the following three criticisms to
the model. (1) There is a discrepancy between the literature trends and the practical applicability of
this model. (2) The model is being designed and studied for the top-level management, and therefore,
it is not realistic for implementation. (3) The model is being treated in the literature as a prescriptive
black box (not enough consideration for its internal structures). Finally, (4) the model’s antecedents
and consequences are being analyzed, yet, no in-depth analysis is performed on its fundamental
assumptions.
34 Background and Definitions
A detailed analysis and investigation of the SAM model is beyond the scope of this research.
Nevertheless, in subsection 6.4.4 we touch on the controversy surrounding the SAM model and the
contribution of our results to this topic.
2.2 Enterprise Governance of IT
In this section, we start exploring the background of the Enterprise Governance of IT (EGIT). In
subsection 2.2.1, we demonstrate that its roots are in the IT governance and the corporate governance.
In subsection 2.2.2 we provide a logical connection between IT governance and EGIT. In addition,
we provide a formal literature-based definition of EGIT.
2.2.1 IT Governance and Corporate Governance
At the beginning of the twentieth century industrialism was a collection of economic systems. CEOs
of the competing corporations imposed, in most cases, objectives and strategies on the board of
directors. The real owners acted at a distance in the position of being shareholders. In the rest of the
world, with the exception of the UK, industrialism was represented by a handful of quite wealthy
families owning (most of) the corporation (cf. Morck & Steier, 2007).
In the above described system of management, investors started to worry about a miss-utilization of
their investments, giving birth to the importance of the good governance concept. CEOs became
responsible for effective governance practices and investors closely monitored the quality and
performance of the listed firms. We define the term governance as follows.
Definition 2-11 Governance
Governance is defined as “the relationship among various participants in determining the direction and performance of corporations”. (Monks & Minow, 1995) In recent decades, the term “corporate governance” has topped the list of public attention in
association with the severe corporate failures which have surfaced the corporate world internationally.
Corporate governance has existed for as long as various forms of human organizations have existed.
It was intensively discussed, analyzed, and used in many reform proposals after decades of corporate
failures. A common definition for corporate governance as used in the literature is presented below.
From IT Business Strategic Alignment to Performance 35
Definition 2-12 Corporate Governance
Corporate governance is in its basic form defined as “the systems and processes put in place to direct and control an organization in order to increase performance and achieve its objectives and a sustainable shareholder value”. (ISO FDIS 26000) Shareholders, the management, and the board of directors are the primary participants in corporate
governance. The following quote by Fahy, Roche, & Winer (2004) clearly demonstrates the
importance of corporate governance for organizational survival.
"Businesses that embrace a culture of transparency, honesty and social responsibility will enhance
their business performance and maintain sustainable shareholder value. Those that fail to embrace or
accept corporate governance, corporate social responsibility, and risk management practices will
eventually fail." (Fahy et al., 2004)
Before the collapse of those corporate giants, corporate governance was not as popular in the public
arena. Calls have intensified for at least three issues, viz. (1) transparent financial regulatory
compliance, (2) balanced board structure, and (3) performance-based compensations for senior
executives. In the USA, the Sarbanes–Oxley act 2002 (SOX) was born following a comprehensive
research into America’s existing legislation which already had 4,000 pages of legislation, governing
accounting and auditing. Outside the USA, there were also efforts to enhance and enforce proper
corporate governance practices. One of the most influential acts outside the USA was the European
Union’s 8th Company Law Directive on Statutory Audit (Directive 2006/43/EC). The 8th directive
is considered the European post Sarbanes-Oxley regulatory retaliation.
Corporate Governance and IT governance cannot be considered as two distinct disciplines, IT
Governance ought to be integrated into the overall corporate governance structure (cf. Guldentops,
2003; ITGI, 2001). In terms of reporting, monitoring, and performance evaluation, effective
corporate governance requires that organizations not only have the ability to monitor and measure
historic performance on a monthly basis, but also that they are able to meet the more forward-looking
direction of setting the needs of the firm.
A critical backbone component of this forward-looking direction setting is the heavy reporting
requirement. These reporting requirements (seen as a legal requirement) clearly point to the critical
dependency on information technology. Hence, IT governance has become the focus of multinational
corporations. There are several definitions of IT governance. We will use the definition provided by
ITGI (2003) which defines IT governance as follows.

Cha
pter
2
34 Background and Definitions
A detailed analysis and investigation of the SAM model is beyond the scope of this research.
Nevertheless, in subsection 6.4.4 we touch on the controversy surrounding the SAM model and the
contribution of our results to this topic.
2.2 Enterprise Governance of IT
In this section, we start exploring the background of the Enterprise Governance of IT (EGIT). In
subsection 2.2.1, we demonstrate that its roots are in the IT governance and the corporate governance.
In subsection 2.2.2 we provide a logical connection between IT governance and EGIT. In addition,
we provide a formal literature-based definition of EGIT.
2.2.1 IT Governance and Corporate Governance
At the beginning of the twentieth century industrialism was a collection of economic systems. CEOs
of the competing corporations imposed, in most cases, objectives and strategies on the board of
directors. The real owners acted at a distance in the position of being shareholders. In the rest of the
world, with the exception of the UK, industrialism was represented by a handful of quite wealthy
families owning (most of) the corporation (cf. Morck & Steier, 2007).
In the above described system of management, investors started to worry about a miss-utilization of
their investments, giving birth to the importance of the good governance concept. CEOs became
responsible for effective governance practices and investors closely monitored the quality and
performance of the listed firms. We define the term governance as follows.
Definition 2-11 Governance
Governance is defined as “the relationship among various participants in determining the direction and performance of corporations”. (Monks & Minow, 1995) In recent decades, the term “corporate governance” has topped the list of public attention in
association with the severe corporate failures which have surfaced the corporate world internationally.
Corporate governance has existed for as long as various forms of human organizations have existed.
It was intensively discussed, analyzed, and used in many reform proposals after decades of corporate
failures. A common definition for corporate governance as used in the literature is presented below.
From IT Business Strategic Alignment to Performance 35
Definition 2-12 Corporate Governance
Corporate governance is in its basic form defined as “the systems and processes put in place to direct and control an organization in order to increase performance and achieve its objectives and a sustainable shareholder value”. (ISO FDIS 26000) Shareholders, the management, and the board of directors are the primary participants in corporate
governance. The following quote by Fahy, Roche, & Winer (2004) clearly demonstrates the
importance of corporate governance for organizational survival.
"Businesses that embrace a culture of transparency, honesty and social responsibility will enhance
their business performance and maintain sustainable shareholder value. Those that fail to embrace or
accept corporate governance, corporate social responsibility, and risk management practices will
eventually fail." (Fahy et al., 2004)
Before the collapse of those corporate giants, corporate governance was not as popular in the public
arena. Calls have intensified for at least three issues, viz. (1) transparent financial regulatory
compliance, (2) balanced board structure, and (3) performance-based compensations for senior
executives. In the USA, the Sarbanes–Oxley act 2002 (SOX) was born following a comprehensive
research into America’s existing legislation which already had 4,000 pages of legislation, governing
accounting and auditing. Outside the USA, there were also efforts to enhance and enforce proper
corporate governance practices. One of the most influential acts outside the USA was the European
Union’s 8th Company Law Directive on Statutory Audit (Directive 2006/43/EC). The 8th directive
is considered the European post Sarbanes-Oxley regulatory retaliation.
Corporate Governance and IT governance cannot be considered as two distinct disciplines, IT
Governance ought to be integrated into the overall corporate governance structure (cf. Guldentops,
2003; ITGI, 2001). In terms of reporting, monitoring, and performance evaluation, effective
corporate governance requires that organizations not only have the ability to monitor and measure
historic performance on a monthly basis, but also that they are able to meet the more forward-looking
direction of setting the needs of the firm.
A critical backbone component of this forward-looking direction setting is the heavy reporting
requirement. These reporting requirements (seen as a legal requirement) clearly point to the critical
dependency on information technology. Hence, IT governance has become the focus of multinational
corporations. There are several definitions of IT governance. We will use the definition provided by
ITGI (2003) which defines IT governance as follows.

36 Background and Definitions
Definition 2-13 IT Governance
IT governance is defined as “the responsibility of executives and the board of directors, and consists of the leadership, organizational structures and processes that ensure that the enterprise’s IT sustains and extends the organization’s strategy and objectives”. (ITGI, 2003)
Through enabling an effective monitoring, evaluation, and reporting functionality, IT governance
empowers an organization with the ability to realize three equally important and critical objectives:
(1) regulatory and legal compliance, (2) operational excellence, and (3) optimal risk management (cf.
Robinson, 2005).
2.2.2 IT Governance and EGIT
Due to the focus on ‘‘IT’’ in the naming of the IT Governance concept, the IT governance discussion
mainly stayed as a discussion within the IT area, while of course, one of the main responsibilities is
situated at the business side. This discussion raised the issue that the involvement of business should
be credited in the name, since it is crucial. As a direct result, a shift in name and definition was
proposed, focusing on business involvement. The new term was Enterprise Governance of IT. We
provide the following definition for the Enterprise Governance of IT.
Definition 2-14 Enterprise Governance of IT
EGIT is defined as “integral part of corporate governance and addresses the definition and implementation of processes, structures and relational mechanisms in the organization that enable both business and IT people to execute their responsibilities in support of business/IT alignment and the creation of business value from IT-enabled business investments” (Van Grembergen & De Haes, 2009, p3).
In recent years, the term Enterprise Governance of IT (EGIT) has been taking a center-stage in IT-
Strategy related studies (see De Haes & Grembergen, 2013). Chapter 3 provides a detailed literature
review on the EGIT concept and its relationships with both ITBSA and SIW.
2.3 Social Innovation at Work (SIW)
Innovation in general terms is anchored around the concept of turning knowledge into economic
benefit. It involves (1) the discovery followed by the (2) application of new techniques and concepts;
eventually leading to (3) growth, (4) economic prosperity, and (5) a better living standard. In this
section, we will provide a discussion about the background and importance of the concept of
innovation as a general concept in subsection 2.3.1. An overview and description of innovation, the
From IT Business Strategic Alignment to Performance 37
bridge to social innovation, the relationship with workplace innovation, and a formal definition of
both social innovation and workplace innovation are presented in subsection 2.3.2. In subsection 2.3.3
we discuss the issue of inter-departmental collaboration on innovation in more detail.
2.3.1 Importance and Background of Innovation in General
Innovation (in general terms) has been shown to be a very complex and heterogeneous subject. It is
situated far beyond and around the limitation to process innovation as explicitly assumed by the
mainstream economic theory (cf. Edquist, Hommen, & McKelvey, 2001). In terms of importance, we
focus at first on growth (cf. Goedhuys & Veugelers, 2011).
Due to the continually re-occurring financial crises in recent years, firms are faced with decreased
profits and a consequent reduction of budgets (cf. Luftman & Ben-Zvi, 2009; Zarvic et al., 2012). As
a result, in search for an alternative to the traditional financial focus, innovation as a means of the
growth-realization factor has replaced the traditional cost-cutting focus and the creative accounting
methods and practices (cf. Hamel & Schonfeld, 2003; Robeson & O'Connor, 2007). Innovation, in
general terms, was identified by several national and international organizations as the major factor
of economic growth and wealth (see, e.g., De Clercq, Menguc, & Auh, 2008; EU, 1995; OECD,
1997a; De Clercq, Menguc, & Auh, 2008; Lightfoot & Gebauer, 2011; Xue, Ray, & Sambamurthy,
2012).
Consequently, innovation plays a critical role in shaping the organizational survival through enabling
organizations (a) to deal with new and emerging technologies, (b) to improve continuously their
existing capabilities, and (c) to create a new competitive edge (cf. Banbury & Mitchell, 1995; Coad
& Rao, 2008; Armbruster, Bikfalvi, Kinkel, & Lay, 2008). Moreover, innovation (d) improves labor
productivity and (e) enables new technology to be put to work at innovative work organizations by
enhancing the effectiveness of IT investments through effective outputs and services (cf. Licht &
Moch, 1999; Pot, 2010). A detailed discussion of the relationship between innovation and
performance is presented in Chapter 3.
In spite of its critical role which innovation plays in the organizational growth and prosperity, the
European 2010 survey on working conditions has shown that only 47% of the European workforce is
involved in work process, work organization, and the performance-target setting related to their work.
Moreover, the report shows that only 40% of European workers are consulted and have an influence
on the decisions concerning their work. This surprising result (some even called it shocking)

Cha
pter
2
36 Background and Definitions
Definition 2-13 IT Governance
IT governance is defined as “the responsibility of executives and the board of directors, and consists of the leadership, organizational structures and processes that ensure that the enterprise’s IT sustains and extends the organization’s strategy and objectives”. (ITGI, 2003)
Through enabling an effective monitoring, evaluation, and reporting functionality, IT governance
empowers an organization with the ability to realize three equally important and critical objectives:
(1) regulatory and legal compliance, (2) operational excellence, and (3) optimal risk management (cf.
Robinson, 2005).
2.2.2 IT Governance and EGIT
Due to the focus on ‘‘IT’’ in the naming of the IT Governance concept, the IT governance discussion
mainly stayed as a discussion within the IT area, while of course, one of the main responsibilities is
situated at the business side. This discussion raised the issue that the involvement of business should
be credited in the name, since it is crucial. As a direct result, a shift in name and definition was
proposed, focusing on business involvement. The new term was Enterprise Governance of IT. We
provide the following definition for the Enterprise Governance of IT.
Definition 2-14 Enterprise Governance of IT
EGIT is defined as “integral part of corporate governance and addresses the definition and implementation of processes, structures and relational mechanisms in the organization that enable both business and IT people to execute their responsibilities in support of business/IT alignment and the creation of business value from IT-enabled business investments” (Van Grembergen & De Haes, 2009, p3).
In recent years, the term Enterprise Governance of IT (EGIT) has been taking a center-stage in IT-
Strategy related studies (see De Haes & Grembergen, 2013). Chapter 3 provides a detailed literature
review on the EGIT concept and its relationships with both ITBSA and SIW.
2.3 Social Innovation at Work (SIW)
Innovation in general terms is anchored around the concept of turning knowledge into economic
benefit. It involves (1) the discovery followed by the (2) application of new techniques and concepts;
eventually leading to (3) growth, (4) economic prosperity, and (5) a better living standard. In this
section, we will provide a discussion about the background and importance of the concept of
innovation as a general concept in subsection 2.3.1. An overview and description of innovation, the
From IT Business Strategic Alignment to Performance 37
bridge to social innovation, the relationship with workplace innovation, and a formal definition of
both social innovation and workplace innovation are presented in subsection 2.3.2. In subsection 2.3.3
we discuss the issue of inter-departmental collaboration on innovation in more detail.
2.3.1 Importance and Background of Innovation in General
Innovation (in general terms) has been shown to be a very complex and heterogeneous subject. It is
situated far beyond and around the limitation to process innovation as explicitly assumed by the
mainstream economic theory (cf. Edquist, Hommen, & McKelvey, 2001). In terms of importance, we
focus at first on growth (cf. Goedhuys & Veugelers, 2011).
Due to the continually re-occurring financial crises in recent years, firms are faced with decreased
profits and a consequent reduction of budgets (cf. Luftman & Ben-Zvi, 2009; Zarvic et al., 2012). As
a result, in search for an alternative to the traditional financial focus, innovation as a means of the
growth-realization factor has replaced the traditional cost-cutting focus and the creative accounting
methods and practices (cf. Hamel & Schonfeld, 2003; Robeson & O'Connor, 2007). Innovation, in
general terms, was identified by several national and international organizations as the major factor
of economic growth and wealth (see, e.g., De Clercq, Menguc, & Auh, 2008; EU, 1995; OECD,
1997a; De Clercq, Menguc, & Auh, 2008; Lightfoot & Gebauer, 2011; Xue, Ray, & Sambamurthy,
2012).
Consequently, innovation plays a critical role in shaping the organizational survival through enabling
organizations (a) to deal with new and emerging technologies, (b) to improve continuously their
existing capabilities, and (c) to create a new competitive edge (cf. Banbury & Mitchell, 1995; Coad
& Rao, 2008; Armbruster, Bikfalvi, Kinkel, & Lay, 2008). Moreover, innovation (d) improves labor
productivity and (e) enables new technology to be put to work at innovative work organizations by
enhancing the effectiveness of IT investments through effective outputs and services (cf. Licht &
Moch, 1999; Pot, 2010). A detailed discussion of the relationship between innovation and
performance is presented in Chapter 3.
In spite of its critical role which innovation plays in the organizational growth and prosperity, the
European 2010 survey on working conditions has shown that only 47% of the European workforce is
involved in work process, work organization, and the performance-target setting related to their work.
Moreover, the report shows that only 40% of European workers are consulted and have an influence
on the decisions concerning their work. This surprising result (some even called it shocking)

38 Background and Definitions
prompted an increased attention to innovation and the involvement by workers in the innovative
activities.
2.3.2 The Social Innovation Concept and Definition
In order to position the concept of innovation into its context for our research, this subsection will
provide a discussion of (a) innovation in the general form (process and product), (b) the path from
process innovation to social innovation (passing along the product and workplace innovation), and
(c) the various dimensions for social innovation in the literature. Moreover, we will provide
definitions for the concepts mentioned along the above described line of reasoning, namely, process,
product, social innovation, and workplace innovation.
Examining the history of innovation definitions, we find the roots dating back to an inspirational work
by Schumpeter (1934) who has defined innovation as “the first introduction of a product, process,
method or a system”12. At a later time, Porter (1990, p. 780) identified innovation as: “a new way of
doing things”. More recently, Freeman and Soete (2000) mention the following.
“An innovation in the economic sense is accomplished only with the first commercial transaction
involving the new product, process system or device, although the word is used also to describe the
whole process.”
The definition list is almost endless. In order to establish a standard scope and definition based on the
aim of the research, it is important to make an analytical distinction between the various general
categories of innovation. Historically, in the literature a distinction was made between technical
innovation and administrative innovation. Technical innovation involves the creation or significant
improvement of technologies, products, and services; whereas, administrative innovation involves
procedures, processes, and policies of an organization (see, Damanpour, 1987). We formally define
process innovation as follows.
Definition 2-15 Process Innovation
Process innovation is defined as “being related to the introduction of new methods and responsibilities that cause a significant change in a way service is provided”. (Davenport, 1992; Tarafdar & Gordon, 2007)
12 This work highlights the dual nature of innovation: a process and an outcome. When the “process” notion is used, it
implies introduction, application, development and application of a new idea. In contrast, when definitions are “outcome”
oriented they imply a product, process, new software or a new concept.
From IT Business Strategic Alignment to Performance 39
Product innovation is an extremely complex issue involving product development and project
management practices (efficiency and effectiveness of design and implementation processes) (cf.
Grubisic, Ferreira, Ogliari, & Gidel, 2011). Its definitions date back as far as 1911 when Schumpeter
(1911) defined product innovation as: “The introduction of a new good ... or a new quality of a good”.
At a later time, some authors have put forward definitions that point to the factor of meeting the
market needs (see, e.g., Utterback & Abernathy, 1975). They have defined product innovation as
“represented by the new products or services introduced to meet the needs of the market”; a
framework with this definition was later commonly used in product innovation research (see, e.g.,
Popa, Preda, & Boldea, 2010; Bertrand & Mol, 2013). Product innovation was also defined in terms
of the firm’s capability to generate new products; we will adopt this definition as it relates to the
concepts of our thesis.
Definition 2-16 Product Innovation
Product innovation is defined as” a focal firm’s technological abilities to develop innovative products which are new to the market or the firm, in terms of monitoring the new technology resources required by the firm, integrating these resources with its own technologies and developing marketable new products”. (Kleinschmidt & Cooper, 1991; Day, 1994) Process innovations may be technological as well as organizational13. Product innovations may be
goods or services. It is more difficult to make such distinction in the service industries because the
formal R&D is less important for the development of new service products. Hence, it is rather difficult
to make a clear distinction between product and process innovation.
As mentioned in Chapter 1, due to the inadequacy of the financial indicators alone to assess the IT’s
value for business, there was a shift of focus via a socio-technical approach to an evaluation that
involved exploring the IT-outcome. This shift, besides providing credibility to ITBSA as an
antecedent to successful innovation, has emphasized a policy shift from technological innovation to
the concept of social innovation, establishing the importance of social innovation as a factor of a
firm’s performance.
13 Significant empirical studies in the knowledge-based view of the firm have also made a distinction between product
and process innovation in terms of knowledge usage and dependency. Most of those studies claim no direct or specified
linking mechanisms between knowledge and innovation (cf. Williamson, 1999) in favor of a moderating or mediating
effect of knowledge and innovation in a larger and more generic framework of a firm’s performance. They consider
factors such as a firm’s capability to synthesize knowledge (Kogut & Zander, 1992), absorptive capacity (Cohen &
Levinthal, 1990), and core competencies (Prahalad & Hamel, 1990). Yet, they agree that process innovation integrates
more systemic and complex knowledge than product innovation (Gopalakrishnan, Bierly, & Kessler, 1999).

Cha
pter
2
38 Background and Definitions
prompted an increased attention to innovation and the involvement by workers in the innovative
activities.
2.3.2 The Social Innovation Concept and Definition
In order to position the concept of innovation into its context for our research, this subsection will
provide a discussion of (a) innovation in the general form (process and product), (b) the path from
process innovation to social innovation (passing along the product and workplace innovation), and
(c) the various dimensions for social innovation in the literature. Moreover, we will provide
definitions for the concepts mentioned along the above described line of reasoning, namely, process,
product, social innovation, and workplace innovation.
Examining the history of innovation definitions, we find the roots dating back to an inspirational work
by Schumpeter (1934) who has defined innovation as “the first introduction of a product, process,
method or a system”12. At a later time, Porter (1990, p. 780) identified innovation as: “a new way of
doing things”. More recently, Freeman and Soete (2000) mention the following.
“An innovation in the economic sense is accomplished only with the first commercial transaction
involving the new product, process system or device, although the word is used also to describe the
whole process.”
The definition list is almost endless. In order to establish a standard scope and definition based on the
aim of the research, it is important to make an analytical distinction between the various general
categories of innovation. Historically, in the literature a distinction was made between technical
innovation and administrative innovation. Technical innovation involves the creation or significant
improvement of technologies, products, and services; whereas, administrative innovation involves
procedures, processes, and policies of an organization (see, Damanpour, 1987). We formally define
process innovation as follows.
Definition 2-15 Process Innovation
Process innovation is defined as “being related to the introduction of new methods and responsibilities that cause a significant change in a way service is provided”. (Davenport, 1992; Tarafdar & Gordon, 2007)
12 This work highlights the dual nature of innovation: a process and an outcome. When the “process” notion is used, it
implies introduction, application, development and application of a new idea. In contrast, when definitions are “outcome”
oriented they imply a product, process, new software or a new concept.
From IT Business Strategic Alignment to Performance 39
Product innovation is an extremely complex issue involving product development and project
management practices (efficiency and effectiveness of design and implementation processes) (cf.
Grubisic, Ferreira, Ogliari, & Gidel, 2011). Its definitions date back as far as 1911 when Schumpeter
(1911) defined product innovation as: “The introduction of a new good ... or a new quality of a good”.
At a later time, some authors have put forward definitions that point to the factor of meeting the
market needs (see, e.g., Utterback & Abernathy, 1975). They have defined product innovation as
“represented by the new products or services introduced to meet the needs of the market”; a
framework with this definition was later commonly used in product innovation research (see, e.g.,
Popa, Preda, & Boldea, 2010; Bertrand & Mol, 2013). Product innovation was also defined in terms
of the firm’s capability to generate new products; we will adopt this definition as it relates to the
concepts of our thesis.
Definition 2-16 Product Innovation
Product innovation is defined as” a focal firm’s technological abilities to develop innovative products which are new to the market or the firm, in terms of monitoring the new technology resources required by the firm, integrating these resources with its own technologies and developing marketable new products”. (Kleinschmidt & Cooper, 1991; Day, 1994) Process innovations may be technological as well as organizational13. Product innovations may be
goods or services. It is more difficult to make such distinction in the service industries because the
formal R&D is less important for the development of new service products. Hence, it is rather difficult
to make a clear distinction between product and process innovation.
As mentioned in Chapter 1, due to the inadequacy of the financial indicators alone to assess the IT’s
value for business, there was a shift of focus via a socio-technical approach to an evaluation that
involved exploring the IT-outcome. This shift, besides providing credibility to ITBSA as an
antecedent to successful innovation, has emphasized a policy shift from technological innovation to
the concept of social innovation, establishing the importance of social innovation as a factor of a
firm’s performance.
13 Significant empirical studies in the knowledge-based view of the firm have also made a distinction between product
and process innovation in terms of knowledge usage and dependency. Most of those studies claim no direct or specified
linking mechanisms between knowledge and innovation (cf. Williamson, 1999) in favor of a moderating or mediating
effect of knowledge and innovation in a larger and more generic framework of a firm’s performance. They consider
factors such as a firm’s capability to synthesize knowledge (Kogut & Zander, 1992), absorptive capacity (Cohen &
Levinthal, 1990), and core competencies (Prahalad & Hamel, 1990). Yet, they agree that process innovation integrates
more systemic and complex knowledge than product innovation (Gopalakrishnan, Bierly, & Kessler, 1999).

40 Background and Definitions
In spite of the substantial increase in the interest surrounding social innovation, an in-depth research
providing the concept’s definition and categorization is in its early stages (cf. Pol & Ville, 2009;
Rüede & Lurtz, 2012). Several authors have provided their own categorization of social innovation
(see, e.g., Bestuzhev-Lada, 1991; Moulaert, Martinelli, Swyngedouw, & González, 2005; Pol & Ville,
2009). The derived categorizations demonstrate how diverse the understanding is about what actually
social innovation is, let alone, the criteria that should be used for its categorization. Rüede & Lurtz
(2012) argue that the derived categorizations, besides the challenge of selecting effective
categorization criteria, face two critical issues: (a) the lack of mutual exclusivity and (b) the vagueness
of the individual categories. These constraints cause a difficulty in selecting the appropriate category
for social innovation definitions.
In their extensive research on the social innovation in respect to categorization and definitions, Rüede
& Lurtz (2012) decided to sum up the various categorization schemes into seven general categories.
Table 2-4 documents the seven categories and provides a guiding question to each category for further
clarification. The authors further indicate that the most cited categories in the literature are the
categories 1-4, which also conform to the criteria of the notion concept clarity14 as defined by
Suddaby (2010).
Our focus in this research matches the characteristics of category 4. We are concerned with the work
process re-organization and innovation. Next, we provide our definition of social innovation.
Category Characterization Guiding Question 1 To do something good in/for society Which innovations are needed for a better society?
2 To change social practices and/or structure
What can we say about changes in how people interact among each other?
3 To contribute to urban and community development
How can we approach development at a community level when we put human needs and not business needs first?
4 To reorganize work processes What else can we say about innovations within organizations if we leave out technological innovations?
5 To imbue technological innovations with cultural meaning and relevance
What else is needed for a technological to become a successful innovation?
6 To make changes in the area of social work
How can we improve the professional social work provision in order to better reach the goals of social work?
7 To innovate by means of digital connectivity
What possibilities to innovate do we have in a world where people are digitally connected in social networks?
Table 2-4 Social innovation categorization Adopted from Rüede & Lurtz (2012, p.9)
14 Suddaby (2010) states that concept clarity has four main components: (1) precise definition, (2) clear scope conditions,
(3) stated semantic relationship to related concepts, and (4) logical consistency and coherence that provide a logical fit
with all other aspects.
From IT Business Strategic Alignment to Performance 41
Definition 2-17 Social Innovation
Social innovation is defined as “the development and implementation of new ideas (products, services and models) to meet social needs and create new social relationships or collaborations”. (EC, DG Regional & Urban Policy, 2013) Social innovation is quite closely associated with the concept of workplace innovation (cf. Pot et al.,
2012; Rüede & Lurtz, 2012). Workplace innovation is considered the locus of social innovation at
the organizational level. In the Netherlands and Belgium, the term social innovation is used to express
workplace innovation (cf. EC, DG Regional & Urban Policy, 2013). There are several definitions of
workplace innovation; consensus has not been reached about a single formal definition. Here we
provide a definition that will be adopted in this thesis.
Definition 2-18 Workplace Innovation
Workplace innovations are defined as “new and combined interventions in work organization, human resource management and supportive technologies”. (Pot et al., 2012; Rüede & Lurtz, 2012; Pot, 2013) The issue of defining innovation is still controversial. Improving the analysis of innovation issues is
suggested to happen through achieving consistency within a single definitional approach (cf.
Archibugi, Evangelista, & Simonetti, 1994). Due to the complexities mentioned above and given the
close association of social innovation with workplace innovation (and innovation in general), in our
context we will use the term Social Innovation at Work (SIW) to represent the combined concept of
Social Innovation at the Workplace, as expressed by Pot et al. (2012). Social innovation at the
workplace includes, by both definitions, i.e., the definitions of workplace innovation and social
innovation, the introduction of new or significantly improved ideas and processes, dynamic
management, and supportive technologies.
2.3.3 Inter-Departmental Collaboration on SIW
The definition of social innovation at work in the previous section (see also Definition 2-18) states in
its context that the development and implementation of new ideas is associated with the creation of
new collaborations. Many researchers support this notion and have identified collaborative activity
as a main ingredient of achieving successful SIW (cf., e.g., Mulgan, Tucker, Ali, & Sanders, 2007;
Bry, Valee, & France, 2011; Pot et al., 2012; Ganotakis, Hsieh, & Love, 2013; Nichols et al., 2013).
These innovation-stimulated collaborations could take one of three main dimensions: (1) intra-
organizational innovation that occurs within an organization and may involve particular departments

Cha
pter
2
40 Background and Definitions
In spite of the substantial increase in the interest surrounding social innovation, an in-depth research
providing the concept’s definition and categorization is in its early stages (cf. Pol & Ville, 2009;
Rüede & Lurtz, 2012). Several authors have provided their own categorization of social innovation
(see, e.g., Bestuzhev-Lada, 1991; Moulaert, Martinelli, Swyngedouw, & González, 2005; Pol & Ville,
2009). The derived categorizations demonstrate how diverse the understanding is about what actually
social innovation is, let alone, the criteria that should be used for its categorization. Rüede & Lurtz
(2012) argue that the derived categorizations, besides the challenge of selecting effective
categorization criteria, face two critical issues: (a) the lack of mutual exclusivity and (b) the vagueness
of the individual categories. These constraints cause a difficulty in selecting the appropriate category
for social innovation definitions.
In their extensive research on the social innovation in respect to categorization and definitions, Rüede
& Lurtz (2012) decided to sum up the various categorization schemes into seven general categories.
Table 2-4 documents the seven categories and provides a guiding question to each category for further
clarification. The authors further indicate that the most cited categories in the literature are the
categories 1-4, which also conform to the criteria of the notion concept clarity14 as defined by
Suddaby (2010).
Our focus in this research matches the characteristics of category 4. We are concerned with the work
process re-organization and innovation. Next, we provide our definition of social innovation.
Category Characterization Guiding Question 1 To do something good in/for society Which innovations are needed for a better society?
2 To change social practices and/or structure
What can we say about changes in how people interact among each other?
3 To contribute to urban and community development
How can we approach development at a community level when we put human needs and not business needs first?
4 To reorganize work processes What else can we say about innovations within organizations if we leave out technological innovations?
5 To imbue technological innovations with cultural meaning and relevance
What else is needed for a technological to become a successful innovation?
6 To make changes in the area of social work
How can we improve the professional social work provision in order to better reach the goals of social work?
7 To innovate by means of digital connectivity
What possibilities to innovate do we have in a world where people are digitally connected in social networks?
Table 2-4 Social innovation categorization Adopted from Rüede & Lurtz (2012, p.9)
14 Suddaby (2010) states that concept clarity has four main components: (1) precise definition, (2) clear scope conditions,
(3) stated semantic relationship to related concepts, and (4) logical consistency and coherence that provide a logical fit
with all other aspects.
From IT Business Strategic Alignment to Performance 41
Definition 2-17 Social Innovation
Social innovation is defined as “the development and implementation of new ideas (products, services and models) to meet social needs and create new social relationships or collaborations”. (EC, DG Regional & Urban Policy, 2013) Social innovation is quite closely associated with the concept of workplace innovation (cf. Pot et al.,
2012; Rüede & Lurtz, 2012). Workplace innovation is considered the locus of social innovation at
the organizational level. In the Netherlands and Belgium, the term social innovation is used to express
workplace innovation (cf. EC, DG Regional & Urban Policy, 2013). There are several definitions of
workplace innovation; consensus has not been reached about a single formal definition. Here we
provide a definition that will be adopted in this thesis.
Definition 2-18 Workplace Innovation
Workplace innovations are defined as “new and combined interventions in work organization, human resource management and supportive technologies”. (Pot et al., 2012; Rüede & Lurtz, 2012; Pot, 2013) The issue of defining innovation is still controversial. Improving the analysis of innovation issues is
suggested to happen through achieving consistency within a single definitional approach (cf.
Archibugi, Evangelista, & Simonetti, 1994). Due to the complexities mentioned above and given the
close association of social innovation with workplace innovation (and innovation in general), in our
context we will use the term Social Innovation at Work (SIW) to represent the combined concept of
Social Innovation at the Workplace, as expressed by Pot et al. (2012). Social innovation at the
workplace includes, by both definitions, i.e., the definitions of workplace innovation and social
innovation, the introduction of new or significantly improved ideas and processes, dynamic
management, and supportive technologies.
2.3.3 Inter-Departmental Collaboration on SIW
The definition of social innovation at work in the previous section (see also Definition 2-18) states in
its context that the development and implementation of new ideas is associated with the creation of
new collaborations. Many researchers support this notion and have identified collaborative activity
as a main ingredient of achieving successful SIW (cf., e.g., Mulgan, Tucker, Ali, & Sanders, 2007;
Bry, Valee, & France, 2011; Pot et al., 2012; Ganotakis, Hsieh, & Love, 2013; Nichols et al., 2013).
These innovation-stimulated collaborations could take one of three main dimensions: (1) intra-
organizational innovation that occurs within an organization and may involve particular departments

42 Background and Definitions
or functions (cf. Mulgan et al., 2007; Rosenbusch, Brinckmann, & Bausch, 2011; Pot et al., 2012);
(2) inter-organizational innovation that includes organizational structures beyond the organizational
boundaries, such as, just-in-time inventory systems with suppliers or an external R&D collaboration
(cf. Armbruster et al., 2008; Ganotakis et al., 2013); and (3) inter-institutional knowledge flow,
expressing the collaboration of higher education and public research institutes (cf. El Harbi,
Anderson, & Amamou, 2011).
Our research is concerned with the first type, namely, the intra-organizational collaboration; in
particular, we are concerned with the inter-departmental collaboration on SIW. In this subsection, we
explore the background and its importance. Moreover, we provide a formal definition of inter-
departmental collaboration on SIW.
The implementation of a successful innovation strategy is argued to depend on two main factors, (a)
the cooperation among various functional departments, such as R&D, marketing and IT (cf. Mulgan
et al., 2007; Ganotakis et al., 2013; Nichols et al., 2013) and (b) the extent to which they effectively
share both information (cf. Cuijpers et al., 2001; Jansen, Tempelaar, van den Bosch, Volberda, 2009)
and resources (cf. Tsai & Ghoshal, 1998) towards the actualization of such a strategy.
The importance of inter-departmental collaboration on SIW lays in at least four major advantages.
First, it enhances utilization of resources by stimulating flexibility in pooling knowledge, skills, and
capital resources from different functions (cf. Ford & Randolph, 1992). Second, inter-departmental
information integration assists in the achievement of common understanding of a new product or
service by employees, consequently, enhancing the decision-making process throughout all
development stages (cf. Sethi, 2000; Ganotakis et al., 2013). Third, it is argued that inter-departmental
collaboration leads to the willingness to accommodate diversified view points and consequently to
developing a healthy working environment through enhancing fair allocation of various resources
which creates effective leadership skills and trust (cf. De Luca & Atuahene-Gima, 2007; Bry et al.,
2011). Fourth, as a consequence of such fair allocation of resources, positive collaboration from other
functional departments is encouraged, providing the necessary ingredients of a successful innovation
strategy (cf. De Clercq et al., 2008). The inter-departmental collaborations are usually in the form of
information sharing, interaction, and cross functional coordination (cf. Troy, Hirunyawipada, &
Paswan, 2008). In general, there is agreement that innovation is about people and their collaborative
culture (cf. Naranjo-Valencia, Jiménez-Jiménez, & Sanz-Valle, 2016), and that inter-departmental
collaboration is an important factor for a successful innovation (see, Troy et al., 2008; Botzenhardt,
From IT Business Strategic Alignment to Performance 43
Meth, & Maedche, 2011). Hence, this thesis will utilize inter-departmental collaboration on SIW as
a representation of measuring the social innovation at the workplace activity (as will be explained in
Chapter 5). In Definition 2-19 we provide our formal definition of inter-departmental collaboration
on SIW.
Definition 2-19 Inter-Departmental Collaboration on SIW
Inter-departmental collaboration on SIW is defined as: “the intangible and unstructured degree of cooperation, the extent of representation, and the contribution of several functional units to the innovation process”. (Li & Calantone, 1998; De Luca & Atuahene-Gima, 2007) Inter-departmental collaboration is intangible and unstructured in the sense that it reflects (1) the
recognition by the individual or collective departments of their strategic interdependence and (2) their
need to cooperate for the common innovative goal of the organization (cf. Olson, Walker, Ruekert,
& Bonnerd, 2001; De Luca & Gima, 2007).
The notion of networks in organizations is not new, nevertheless, historically organizational
network’s lacked efficiency (the ability to manage complexity beyond a certain size of operations,
and to mobilize and focus resources on a specific task). This reduced efficiency was mainly due to
the lack of effective communication means. Castells (2000) proposed that the global society has
undergone major social and economic transformations during the last quarter of the twentieth century.
The rapid technological advance allowed for the formation of (a) new social formation which is
centered around electronic information networks, and (b) new forms of production and management
(cf. Castells, 2000). In his book, Castells (2014) names this new social formation a network society
and described it as “ The social structure that results from the interaction between social organization,
social change, and a technological paradigm constituted around digital information and
communication technologies” (cf. Castells, 2004, p. xvii).
Towards the end of the twentieth century, the emergence of modern electronic communication
networks has significantly reduced the communication limitations within and among networks.
Consequently, the new notion of “network society” has emerged. The main advantage of a networks
is its flexibility and adaptability in managing tasks. Networks grow, shrink, and re-configure
according to the needs of a specific task. Moreover, they have a higher chance of survivability because
they do not have a central node which holds all the critical knowledge. The loss of such node would
be potentially lethal to a given network. The flexibility and adaptability of networks has fostered the
emergence of a new form of business structure in the advanced societies called the Network

Cha
pter
2
42 Background and Definitions
or functions (cf. Mulgan et al., 2007; Rosenbusch, Brinckmann, & Bausch, 2011; Pot et al., 2012);
(2) inter-organizational innovation that includes organizational structures beyond the organizational
boundaries, such as, just-in-time inventory systems with suppliers or an external R&D collaboration
(cf. Armbruster et al., 2008; Ganotakis et al., 2013); and (3) inter-institutional knowledge flow,
expressing the collaboration of higher education and public research institutes (cf. El Harbi,
Anderson, & Amamou, 2011).
Our research is concerned with the first type, namely, the intra-organizational collaboration; in
particular, we are concerned with the inter-departmental collaboration on SIW. In this subsection, we
explore the background and its importance. Moreover, we provide a formal definition of inter-
departmental collaboration on SIW.
The implementation of a successful innovation strategy is argued to depend on two main factors, (a)
the cooperation among various functional departments, such as R&D, marketing and IT (cf. Mulgan
et al., 2007; Ganotakis et al., 2013; Nichols et al., 2013) and (b) the extent to which they effectively
share both information (cf. Cuijpers et al., 2001; Jansen, Tempelaar, van den Bosch, Volberda, 2009)
and resources (cf. Tsai & Ghoshal, 1998) towards the actualization of such a strategy.
The importance of inter-departmental collaboration on SIW lays in at least four major advantages.
First, it enhances utilization of resources by stimulating flexibility in pooling knowledge, skills, and
capital resources from different functions (cf. Ford & Randolph, 1992). Second, inter-departmental
information integration assists in the achievement of common understanding of a new product or
service by employees, consequently, enhancing the decision-making process throughout all
development stages (cf. Sethi, 2000; Ganotakis et al., 2013). Third, it is argued that inter-departmental
collaboration leads to the willingness to accommodate diversified view points and consequently to
developing a healthy working environment through enhancing fair allocation of various resources
which creates effective leadership skills and trust (cf. De Luca & Atuahene-Gima, 2007; Bry et al.,
2011). Fourth, as a consequence of such fair allocation of resources, positive collaboration from other
functional departments is encouraged, providing the necessary ingredients of a successful innovation
strategy (cf. De Clercq et al., 2008). The inter-departmental collaborations are usually in the form of
information sharing, interaction, and cross functional coordination (cf. Troy, Hirunyawipada, &
Paswan, 2008). In general, there is agreement that innovation is about people and their collaborative
culture (cf. Naranjo-Valencia, Jiménez-Jiménez, & Sanz-Valle, 2016), and that inter-departmental
collaboration is an important factor for a successful innovation (see, Troy et al., 2008; Botzenhardt,
From IT Business Strategic Alignment to Performance 43
Meth, & Maedche, 2011). Hence, this thesis will utilize inter-departmental collaboration on SIW as
a representation of measuring the social innovation at the workplace activity (as will be explained in
Chapter 5). In Definition 2-19 we provide our formal definition of inter-departmental collaboration
on SIW.
Definition 2-19 Inter-Departmental Collaboration on SIW
Inter-departmental collaboration on SIW is defined as: “the intangible and unstructured degree of cooperation, the extent of representation, and the contribution of several functional units to the innovation process”. (Li & Calantone, 1998; De Luca & Atuahene-Gima, 2007) Inter-departmental collaboration is intangible and unstructured in the sense that it reflects (1) the
recognition by the individual or collective departments of their strategic interdependence and (2) their
need to cooperate for the common innovative goal of the organization (cf. Olson, Walker, Ruekert,
& Bonnerd, 2001; De Luca & Gima, 2007).
The notion of networks in organizations is not new, nevertheless, historically organizational
network’s lacked efficiency (the ability to manage complexity beyond a certain size of operations,
and to mobilize and focus resources on a specific task). This reduced efficiency was mainly due to
the lack of effective communication means. Castells (2000) proposed that the global society has
undergone major social and economic transformations during the last quarter of the twentieth century.
The rapid technological advance allowed for the formation of (a) new social formation which is
centered around electronic information networks, and (b) new forms of production and management
(cf. Castells, 2000). In his book, Castells (2014) names this new social formation a network society
and described it as “ The social structure that results from the interaction between social organization,
social change, and a technological paradigm constituted around digital information and
communication technologies” (cf. Castells, 2004, p. xvii).
Towards the end of the twentieth century, the emergence of modern electronic communication
networks has significantly reduced the communication limitations within and among networks.
Consequently, the new notion of “network society” has emerged. The main advantage of a networks
is its flexibility and adaptability in managing tasks. Networks grow, shrink, and re-configure
according to the needs of a specific task. Moreover, they have a higher chance of survivability because
they do not have a central node which holds all the critical knowledge. The loss of such node would
be potentially lethal to a given network. The flexibility and adaptability of networks has fostered the
emergence of a new form of business structure in the advanced societies called the Network

44 Background and Definitions
Enterprise. This new structure requires the adaptation to new concepts and methodologies which
focus on networked operations, as opposed to the classical hierarchical structures (Castells, 2000).
The presence of such networks has the potential of significantly reduce the effect of the barriers to
SIW described above. Network Society is not directly explored in this research, yet in Chapter seven
we will link the importance of such networks to our answer of RQ3.
In our research, we will investigate the concept of SIW from the perspective of inter-departmental
collaboration on SIW. A detailed literature review on the concept of SIW as related to ITBSA and
performance is presented in Chapter 3, description of the construct is provided in Chapter 5, and an
empirical analysis of the relationship between inter-departmental collaboration on SIW and
performance is given in Chapter
CHAPTER 3 LITERATURE REVIEW
This chapter performs a literature review of the relationships among the studied concepts ITBSA,
EGIT, and SIW (see Figure 3-1) and their relationship with the departmental performance. The
ITBSA concept and its relationships to both IT investments (relationship (a) of Figure 3-1) and
organizational performance (a combination of relations (b), (c), and (d) of Figure 3-1) are discussed
and reviewed in section 3.1. In the discussion, we arrive at the finding that the linear representation
as given in Figure 3-1 is not the most adequate representation. In our opinion EGIT plays a more
supervising role (see Figure 3-4) and therefore we discuss the SIW concept in section 3.2 and
thereafter the EGIT in section 3.3. Thus, section 3.2 investigates the SIW concept and its relationships
to performance (relation (d) of Figure 3-1) and the relationship between SIW and ITBSA
(relationships (b) and (c) combined). The EGIT concept, its components, and its relationships with
both SIW and ITBSA are reviewed in section 3.3.
3.1 IT Business Strategic Alignment and a Firm’s Performance
This section reviews the main issues in the literature that relate to the investments in IT resources and
the relationship of those investments to the ITBSA concept. In subsection 3.1.1 we investigate the
issues concerning the value that IT contributes to the organizational performance. Subsection 3.1.2
will explore the proposed relationship between IT investments and ITBSA (relationship (a) of Figure
3-1) with the aim to establish the position of ITBSA along the path from IT investments to a firm’s
performance. This will be achieved by showing that the literature supports the idea that IT is a valid
antecedent to ITBSA.
In brief, we may state that in this section we review, in particular, the literature on the relationships
which are marked by question-marks followed by the subsection number that explores the given
relationship (see Figure 3-2).
ITBSA
Figure 3-1 The concepts and relationships to be explored in Chapter 3
IT Investments Performance EGIT SIW
(a) (b)
(c) (d)

Cha
pter
3
44 Background and Definitions
Enterprise. This new structure requires the adaptation to new concepts and methodologies which
focus on networked operations, as opposed to the classical hierarchical structures (Castells, 2000).
The presence of such networks has the potential of significantly reduce the effect of the barriers to
SIW described above. Network Society is not directly explored in this research, yet in Chapter seven
we will link the importance of such networks to our answer of RQ3.
In our research, we will investigate the concept of SIW from the perspective of inter-departmental
collaboration on SIW. A detailed literature review on the concept of SIW as related to ITBSA and
performance is presented in Chapter 3, description of the construct is provided in Chapter 5, and an
empirical analysis of the relationship between inter-departmental collaboration on SIW and
performance is given in Chapter
CHAPTER 3 LITERATURE REVIEW
This chapter performs a literature review of the relationships among the studied concepts ITBSA,
EGIT, and SIW (see Figure 3-1) and their relationship with the departmental performance. The
ITBSA concept and its relationships to both IT investments (relationship (a) of Figure 3-1) and
organizational performance (a combination of relations (b), (c), and (d) of Figure 3-1) are discussed
and reviewed in section 3.1. In the discussion, we arrive at the finding that the linear representation
as given in Figure 3-1 is not the most adequate representation. In our opinion EGIT plays a more
supervising role (see Figure 3-4) and therefore we discuss the SIW concept in section 3.2 and
thereafter the EGIT in section 3.3. Thus, section 3.2 investigates the SIW concept and its relationships
to performance (relation (d) of Figure 3-1) and the relationship between SIW and ITBSA
(relationships (b) and (c) combined). The EGIT concept, its components, and its relationships with
both SIW and ITBSA are reviewed in section 3.3.
3.1 IT Business Strategic Alignment and a Firm’s Performance
This section reviews the main issues in the literature that relate to the investments in IT resources and
the relationship of those investments to the ITBSA concept. In subsection 3.1.1 we investigate the
issues concerning the value that IT contributes to the organizational performance. Subsection 3.1.2
will explore the proposed relationship between IT investments and ITBSA (relationship (a) of Figure
3-1) with the aim to establish the position of ITBSA along the path from IT investments to a firm’s
performance. This will be achieved by showing that the literature supports the idea that IT is a valid
antecedent to ITBSA.
In brief, we may state that in this section we review, in particular, the literature on the relationships
which are marked by question-marks followed by the subsection number that explores the given
relationship (see Figure 3-2).
ITBSA
Figure 3-1 The concepts and relationships to be explored in Chapter 3
IT Investments Performance EGIT SIW
(a) (b)
(c) (d)

46 Literature Review
3.1.1 The IT Value for Organizational Performance and Growth
The topic of IT value for organizations has been one of the most frequently debated topics in the
literature since the emergence of IT technology (cf. Maçada et al., 2012). Given the significant
percentage of organizational spending on IT resources, and following the global financial crises and
economic recessions, there has been an increased pressure on CIOs to reduce IT spending and to
capitalize on the limited budgets in creating an explicit business value (cf. Coleman & Chatfield,
2011; Zarvic et al., 2012). The difficulty of value-creation does not only reside in the process of value
creation itself, but also in the difficulty to define and measure the IT impact on the bottom line (cf.
Dedrick, Gurbaxani, & Kraemer, 2003; Strassmann, 2004; Maçada et al., 2012). The difficulty to
measure adequately the impact is one of the factors that have prompted a controversy with regard to
the value of IT for an organization.
At the start of the discussion of the IT value creation, we provide a definition of the value of IT for
the organization. We put forward a definition originally proposed by Melville, Kraemer, & Gurbaxani
(2004). This definition is supported by Hemmatfar et al. (2010). Below we adopt their version.
Definition 3-1 IT Business Value
IT business value is defined as “the benefits that IT provides towards the performance of the organization at the intermediate process levels, such as cost reductions and increased productivity in a specific task”. (Hemmatfar et al., 2010) Supporters of the positive impact of IT on the organizational value argue that IT has a significant
value-adding role through creating innovative applications which allow for direct strategic advantage.
The innovative applications improve the project management success rate and the effective
knowledge management. Moreover, they provide for cost reduction through increasing general
efficiency of operations (cf., e.g., Ahlemann, 2009; Hemmatfar et al., 2010; Coleman & Chatfield,
2011; Mithas & Rust, 2016). Other authors have promoted the view that IT has an indirect effect on
a firm’s performance and competitive edge. Those authors have proposed an indirect effect through
mediating constructs, such as IT-enabled business processes (cf. Schwarz et al., 2010; Nazari &
(? subsection 3.1.2)
IT Investments Performance ITBSA
(? subsection 3.1.1)
(? subsection 3.1.2)
Figure 3-2 Literature review of IT, ITBSA and performance
From IT Business Strategic Alignment to Performance 47
Nazari, 2012), innovation and cost reduction (cf. Hemmatfar et al., 2010; Coleman & Chatfield, 2011;
Kleis, Chwelos, Ramirez, & Cockburn, 2012), inter-organizational collaboration (cf. Zarvic et al.,
2012), and IT governance (cf., e.g., De Haes & Grembergen, 2009; Haghjoo, 2012).
Historically, there have also been skeptics of the positive value of IT on the organizational
performance. They were the main stimulants behind the trend towards IT outsourcing and
downsizing. For example, Earl and Feeny (1994) (in their Sloan Management Review article titled
“Is Your CIO Adding Value?”) read that “General Managers are tired of being told that IT can create
a competitive advantage”. Most of the manager’s observations are focused on the IT project failures
and rising cost of information management. The absence of an objective framework to evaluate IT’s
contribution to the bottom line gave this controversial scientific article unexpected popularity. It led
to radical decisions, such as outsourcing and/or downsizing the IT investments and, in some cases,
even to firing the CIO. This skeptical view was also shared by Kettinger et al. (1994) who have
challenged a sustainable return from IT investments by showing that only 20% of the companies have
sustained competitive advantage after a period of 10 years.
In almost all firms, the business side has the advantage of decision making in its relationship with IT.
Hence, quite often do business executives threaten to outsource IT services when IT does not deliver
sufficient value. Moreover, the business side usually rejects the possibility that their own actions and
decisions may be behind the IT’s inability to function effectively. A senior manager once stated that
“IT in our organization is viewed as the technical core of the MIS function, the wide spread feeling
is that it has very little to do with our business strategy” (cf. Henderson & Venkatraman, 1993).
At a later time, this pessimistic view was supported by a famous article by Carr (2003) in the Harvard
Business Review journal named IT doesn’t matter. Carr has prompted an ongoing argument by making
an analogy between commodities such as water and gas and information technology. His main
argument was that IT resources have been transferred to a commodity through its ubiquity and
replicability causing IT to lose its strategic value as being a scarce resource15. Carr argued that
companies should stop investing heavily in IT and concentrate more on reducing operational risk
associated with IT. More recently, his views were debated in the literature and a general consensus
was reached arguing that IT has strategic importance but is not the only factor for sustaining
15 Carr justified his argument by pointing out that the core functions of IT such as mass data storage and data processing
capabilities are available to all and hence its strategic importance has diminished and that IT factors are no more than
“costs of doing business”.

Cha
pter
3
46 Literature Review
3.1.1 The IT Value for Organizational Performance and Growth
The topic of IT value for organizations has been one of the most frequently debated topics in the
literature since the emergence of IT technology (cf. Maçada et al., 2012). Given the significant
percentage of organizational spending on IT resources, and following the global financial crises and
economic recessions, there has been an increased pressure on CIOs to reduce IT spending and to
capitalize on the limited budgets in creating an explicit business value (cf. Coleman & Chatfield,
2011; Zarvic et al., 2012). The difficulty of value-creation does not only reside in the process of value
creation itself, but also in the difficulty to define and measure the IT impact on the bottom line (cf.
Dedrick, Gurbaxani, & Kraemer, 2003; Strassmann, 2004; Maçada et al., 2012). The difficulty to
measure adequately the impact is one of the factors that have prompted a controversy with regard to
the value of IT for an organization.
At the start of the discussion of the IT value creation, we provide a definition of the value of IT for
the organization. We put forward a definition originally proposed by Melville, Kraemer, & Gurbaxani
(2004). This definition is supported by Hemmatfar et al. (2010). Below we adopt their version.
Definition 3-1 IT Business Value
IT business value is defined as “the benefits that IT provides towards the performance of the organization at the intermediate process levels, such as cost reductions and increased productivity in a specific task”. (Hemmatfar et al., 2010) Supporters of the positive impact of IT on the organizational value argue that IT has a significant
value-adding role through creating innovative applications which allow for direct strategic advantage.
The innovative applications improve the project management success rate and the effective
knowledge management. Moreover, they provide for cost reduction through increasing general
efficiency of operations (cf., e.g., Ahlemann, 2009; Hemmatfar et al., 2010; Coleman & Chatfield,
2011; Mithas & Rust, 2016). Other authors have promoted the view that IT has an indirect effect on
a firm’s performance and competitive edge. Those authors have proposed an indirect effect through
mediating constructs, such as IT-enabled business processes (cf. Schwarz et al., 2010; Nazari &
(? subsection 3.1.2)
IT Investments Performance ITBSA
(? subsection 3.1.1)
(? subsection 3.1.2)
Figure 3-2 Literature review of IT, ITBSA and performance
From IT Business Strategic Alignment to Performance 47
Nazari, 2012), innovation and cost reduction (cf. Hemmatfar et al., 2010; Coleman & Chatfield, 2011;
Kleis, Chwelos, Ramirez, & Cockburn, 2012), inter-organizational collaboration (cf. Zarvic et al.,
2012), and IT governance (cf., e.g., De Haes & Grembergen, 2009; Haghjoo, 2012).
Historically, there have also been skeptics of the positive value of IT on the organizational
performance. They were the main stimulants behind the trend towards IT outsourcing and
downsizing. For example, Earl and Feeny (1994) (in their Sloan Management Review article titled
“Is Your CIO Adding Value?”) read that “General Managers are tired of being told that IT can create
a competitive advantage”. Most of the manager’s observations are focused on the IT project failures
and rising cost of information management. The absence of an objective framework to evaluate IT’s
contribution to the bottom line gave this controversial scientific article unexpected popularity. It led
to radical decisions, such as outsourcing and/or downsizing the IT investments and, in some cases,
even to firing the CIO. This skeptical view was also shared by Kettinger et al. (1994) who have
challenged a sustainable return from IT investments by showing that only 20% of the companies have
sustained competitive advantage after a period of 10 years.
In almost all firms, the business side has the advantage of decision making in its relationship with IT.
Hence, quite often do business executives threaten to outsource IT services when IT does not deliver
sufficient value. Moreover, the business side usually rejects the possibility that their own actions and
decisions may be behind the IT’s inability to function effectively. A senior manager once stated that
“IT in our organization is viewed as the technical core of the MIS function, the wide spread feeling
is that it has very little to do with our business strategy” (cf. Henderson & Venkatraman, 1993).
At a later time, this pessimistic view was supported by a famous article by Carr (2003) in the Harvard
Business Review journal named IT doesn’t matter. Carr has prompted an ongoing argument by making
an analogy between commodities such as water and gas and information technology. His main
argument was that IT resources have been transferred to a commodity through its ubiquity and
replicability causing IT to lose its strategic value as being a scarce resource15. Carr argued that
companies should stop investing heavily in IT and concentrate more on reducing operational risk
associated with IT. More recently, his views were debated in the literature and a general consensus
was reached arguing that IT has strategic importance but is not the only factor for sustaining
15 Carr justified his argument by pointing out that the core functions of IT such as mass data storage and data processing
capabilities are available to all and hence its strategic importance has diminished and that IT factors are no more than
“costs of doing business”.

48 Literature Review
competitive advantage (see, e.g., Schwarz et al., 2010; Davenport, Barth, & Bean, 2013; Kellermann
& Jones, 2013).
The controversy shows that the role and value of IT to an organization undoubtedly differs based on
the economic sector of the firm (cf. Mittal & Nault, 2009). Recent researchers argue that it is the
method of measurement of the IT value that creates this skeptic view (see, e.g., Maçada et al., 2012;
Nazari & Nazari, 2012). For example, some scholars and practitioners have traditionally used an
approach that measures the direct causal effect of an independent variable (such as IT investment) on
a traditional financial and market-oriented variable. Quan (2003) and Maçada et al. (2012) argue that
IT value cannot be measured using traditional financial and market-oriented indicators. Their
reasoning is that those indicators do not demonstrate the value of the accumulated knowledge and
organizational capabilities (cf. Strassmann, 2004).
A proposed solution was put forward initially by Melville et al. (2004) and later supported by Schwarz
et al. (2010). In their solution, they argue that a specific outcome of IT investments, “a performance-
driving resource that is reconstituted within capabilities”, need to be evaluated. In their argument,
they utilize the Dynamic Capabilities Theory (DCT) which, according to Makadok (2001), implies
that the source of competitive advantage is the result of the joint interaction between resource-picking
and capability-building (as distinguished from the static nature of resource-picking in the resource-
based theory). Schwarz et al. (2010) have focused on two main dynamic capabilities: (1) IT-enabled
processes and (2) IT strategic alignment. Their conclusion was that ITBSA, among other factors,
enables organizational value from IT investments.
In the next section, we will extensify this finding, and explore the literature on the ITBSA as well as
on its connection to organizational performance.
3.1.2 ITBSA, an Enabler of Organizational Performance from IT
In this subsection, we will start exploring the literature on the relationship between IT investments
and ITBSA by establishing IT investments as an antecedent of ITBSA (relationship (a) in Figure 3-1).
Then we review the literature on the relationship from ITBSA to a firm’s performance (this implies
a direct combined relationships (b), (c), and (d) in Figure 3-1).
Studies on organizational strategic alignment (in general terms) have a long-rooted history dating
back to 1961 when Likert was the first to shed some light on the importance of coordination in the
From IT Business Strategic Alignment to Performance 49
corporate business and functional strategies. Then in 1978, Hofer and Schendel emphasized the
importance of the linking strategies at three levels of an organization, viz. the corporate, business,
and functional level. Subsequently, Venkatraman & Camillus (1984) also called for the alignment of
organizational resources with environmental opportunities.
In the more recent decades, ITBSA has been examined according to (A) antecedents, (B)
consequences (including organizational performance), and (C) moderating and mediating variables
along the path from ITBSA to performance. Below we will explore each of these items to establish
the proposed positioning of ITBSA along the path from IT investments to organizational
performance.
Here we remark that it is almost impossible to provide a comprehensive list of all the factors that have
a tangible influence as the antecedents and consequences of ITBSA. Yet, we aim in our analysis at
getting the most contributors and will announce them in advance. This facilitates comprehensible
reading.
A: The antecedents of ITBSA
Research exploring IT-related antecedents of ITBSA has focused on several critical factors. Below
we mention seven of them.
(1) Shared knowledge and understanding (see, e.g., Croteau & Raymond, 2004; Preston & Karahanna,
2009; Pirkko, 2010; Sabegh & Motlagh, 2012).
(2) Effective internal collaboration (see, e.g., Masa'deh, Hunaiti, & Bani Yaseen, 2008; Zarvic et al.,
2012). The studies listed above have shown that shared knowledge through effective collaborative
communication has been a significant antecedent to ITBSA.
(3) Accumulated IT capabilities and mechanisms (cf. Wu, Detmar, & Liang, 2015).
(4) A successfully described history of IT projects.
The factors (3) and (4) have also shown a positive effect on the ITBSA concept (cf. Chan et al.,
2006; Yayla & Hu, 2009; Jorfi, Nor, & Najjar, 2011; Sabegh & Motlagh, 2012).
(5) Cross-involvement of IT executives and business executives.
On the line of cross-involvement, the mutual competence of IT executives and business
executives was investigated by Luftman, Papp, & Brier (1999), Bassellier, Reich, & Benbasat
(2001), and Bassellier, Benbasat, & Reich (2003). Their studies have shown that business
managers are expected to show an increased willingness to lead and participate in IT projects. On
this basis, a positive causal relationship of mutual competence on ITBSA could be expected.
(6) IT flexibility (in terms of flexible infrastructure).

Cha
pter
3
48 Literature Review
competitive advantage (see, e.g., Schwarz et al., 2010; Davenport, Barth, & Bean, 2013; Kellermann
& Jones, 2013).
The controversy shows that the role and value of IT to an organization undoubtedly differs based on
the economic sector of the firm (cf. Mittal & Nault, 2009). Recent researchers argue that it is the
method of measurement of the IT value that creates this skeptic view (see, e.g., Maçada et al., 2012;
Nazari & Nazari, 2012). For example, some scholars and practitioners have traditionally used an
approach that measures the direct causal effect of an independent variable (such as IT investment) on
a traditional financial and market-oriented variable. Quan (2003) and Maçada et al. (2012) argue that
IT value cannot be measured using traditional financial and market-oriented indicators. Their
reasoning is that those indicators do not demonstrate the value of the accumulated knowledge and
organizational capabilities (cf. Strassmann, 2004).
A proposed solution was put forward initially by Melville et al. (2004) and later supported by Schwarz
et al. (2010). In their solution, they argue that a specific outcome of IT investments, “a performance-
driving resource that is reconstituted within capabilities”, need to be evaluated. In their argument,
they utilize the Dynamic Capabilities Theory (DCT) which, according to Makadok (2001), implies
that the source of competitive advantage is the result of the joint interaction between resource-picking
and capability-building (as distinguished from the static nature of resource-picking in the resource-
based theory). Schwarz et al. (2010) have focused on two main dynamic capabilities: (1) IT-enabled
processes and (2) IT strategic alignment. Their conclusion was that ITBSA, among other factors,
enables organizational value from IT investments.
In the next section, we will extensify this finding, and explore the literature on the ITBSA as well as
on its connection to organizational performance.
3.1.2 ITBSA, an Enabler of Organizational Performance from IT
In this subsection, we will start exploring the literature on the relationship between IT investments
and ITBSA by establishing IT investments as an antecedent of ITBSA (relationship (a) in Figure 3-1).
Then we review the literature on the relationship from ITBSA to a firm’s performance (this implies
a direct combined relationships (b), (c), and (d) in Figure 3-1).
Studies on organizational strategic alignment (in general terms) have a long-rooted history dating
back to 1961 when Likert was the first to shed some light on the importance of coordination in the
From IT Business Strategic Alignment to Performance 49
corporate business and functional strategies. Then in 1978, Hofer and Schendel emphasized the
importance of the linking strategies at three levels of an organization, viz. the corporate, business,
and functional level. Subsequently, Venkatraman & Camillus (1984) also called for the alignment of
organizational resources with environmental opportunities.
In the more recent decades, ITBSA has been examined according to (A) antecedents, (B)
consequences (including organizational performance), and (C) moderating and mediating variables
along the path from ITBSA to performance. Below we will explore each of these items to establish
the proposed positioning of ITBSA along the path from IT investments to organizational
performance.
Here we remark that it is almost impossible to provide a comprehensive list of all the factors that have
a tangible influence as the antecedents and consequences of ITBSA. Yet, we aim in our analysis at
getting the most contributors and will announce them in advance. This facilitates comprehensible
reading.
A: The antecedents of ITBSA
Research exploring IT-related antecedents of ITBSA has focused on several critical factors. Below
we mention seven of them.
(1) Shared knowledge and understanding (see, e.g., Croteau & Raymond, 2004; Preston & Karahanna,
2009; Pirkko, 2010; Sabegh & Motlagh, 2012).
(2) Effective internal collaboration (see, e.g., Masa'deh, Hunaiti, & Bani Yaseen, 2008; Zarvic et al.,
2012). The studies listed above have shown that shared knowledge through effective collaborative
communication has been a significant antecedent to ITBSA.
(3) Accumulated IT capabilities and mechanisms (cf. Wu, Detmar, & Liang, 2015).
(4) A successfully described history of IT projects.
The factors (3) and (4) have also shown a positive effect on the ITBSA concept (cf. Chan et al.,
2006; Yayla & Hu, 2009; Jorfi, Nor, & Najjar, 2011; Sabegh & Motlagh, 2012).
(5) Cross-involvement of IT executives and business executives.
On the line of cross-involvement, the mutual competence of IT executives and business
executives was investigated by Luftman, Papp, & Brier (1999), Bassellier, Reich, & Benbasat
(2001), and Bassellier, Benbasat, & Reich (2003). Their studies have shown that business
managers are expected to show an increased willingness to lead and participate in IT projects. On
this basis, a positive causal relationship of mutual competence on ITBSA could be expected.
(6) IT flexibility (in terms of flexible infrastructure).

50 Literature Review
(7) The importance of an executive’s familiarity with the elements that make IT flexible.
Factors (6) and (7) were also shown to have a positive influence on ITBSA (cf. Yayla & Hu, 2009;
Almajali & Dahalin, 2011; Jorfi, Nor, & Najjar, 2011).
Each of the explored studies has separately shown a strong positive influence of basic IT-related
investments on ITBSA. In summary, the seven factors and their accompanying studies imply (1) a
positive relationship between investments in IT resources and ITBSA (relationship (a) in Figure 3-1)
and (2) establishes ITBSA as a valid consequence of IT.
B: The consequences of ITBSA (Performance Aspects)
Below we investigate the consequences of ITBSA, i.e., we look at the relationship between ITBSA
and a firm’s performance.
The effect of ITBSA on organizational performance has been studied along various dimensions. We
mention four of them, (a) positive improvements on a firm’s performance (effectiveness, efficiency,
internal coordination), combined with competitive advantage, (b) cost implications, (c) financial
indicators, and (d) SIW performance.
(a) Positive improvement on a firm’s performance combined with the achievement of competitive
advantage (through positive effect of ITBSA on increased effectiveness, efficiency, marketing
activity, internal coordination and processes) has been investigated and confirmed by a number
of researchers (see, e.g., Sabherwal & Chan 2001; Pollalis, 2003; Bergeron, Raymond & Rivard,
2004; Croteau & Raymond, 2004; Kearns & Sabherwal, 2006; Jorfi, Nor, & Najjar, 2011; Chang
et al., 2011; Luftman, 2015).
(b) Oh & Pinsonneault (2007) have explored the cost implications of the alignment concept in view
of the contingency approach. They concluded that ITBSA has a negative association in
combination with the firm’s expenses, i.e., effective ITBSA is a cause of reduced cost to the
organization.
(c) The direct effect of ITBSA on financial indicators such as return on investment (ROI) and return
on assets (ROA) was also investigated. It was shown that ITBSA has a positive implication on
financial indicators (cf. Feidler, Gorver, & Teng, 1995; Papp, 1999; Jorfi & Jorfi, 2011, Luftman,
2015; Wu, Detmar, & Liang, 2015).
From IT Business Strategic Alignment to Performance 51
(d) Along the innovation-related dimension, SIW performance enhancement due to ITBSA was also
supported by several scholars (see, e.g., Chan, Huff, Barclay & Copeland, 1997; Holthausen,
Larcker, & Sloan, 1995; Croteau & Raymond, 2004; Coltman et al., 2015; Héroux & Fortin,
2016)).
It is worth mentioning that on a different level of analysis, alignment was operationalized on the
process level (as opposed to the firm level) by Tallon (2008) and Luftman (2015). They have found
a similar positive association between alignment and business value at that level of analysis.
C: The Mediating and Moderating Variables
In spite of the fact that the majority of research shows a positive relationship between ITBSA and a
firm’s performance, some scholars argue that the relationship from ITBSA to performance is not a
direct one, but that it is mediated and/or moderated by other factors. We mention six factors together
with a reference.
(1) IT flexibility.
(2) Environmental volatility (cf. Tallon & Pinsonneault, 2011).
(3) Industry environment (cf. Xue et al., 2012).
(4) IT-enabled business processes (cf. Schwarz et al., 2010; Luftman, 2015)
(5) Service integration level (cf. Chang et al., 2011).
(6) SIW (cf. Masa'deh et al., 2008).
The controversy on the precise relationship between ITBSA and performance shows that there is a
need for further investigation of this relationship (cf. Schwarz et al., 2010; Tallon & Pinsonneault,
2011; Coltman et al., 2015). Due to our interest in the SIW concept, the next section will specifically
explore the literature on SIW from two main perspectives: (1) its relation to the organizational
performance and (2) as a factor along the relationship between ITBSA and performance (see factor
6 above).
3.2 SIW: The Facilitator between ITBSA and Performance
It is well known that the ability of an organization to achieve such a strategic advantage that it will
be distinguished from its competitors depends on the extent to which the organization invests in
innovative activities through combining valuable resources (cf. Conner, 1991; Teece, Pisano & Shuen
,1997; Spanos & Lioukas, 2001; Armbruster et al., 2008). Our aim is to investigate the position of
SIW as a valid factor on the path to organizational performance.

Cha
pter
3
50 Literature Review
(7) The importance of an executive’s familiarity with the elements that make IT flexible.
Factors (6) and (7) were also shown to have a positive influence on ITBSA (cf. Yayla & Hu, 2009;
Almajali & Dahalin, 2011; Jorfi, Nor, & Najjar, 2011).
Each of the explored studies has separately shown a strong positive influence of basic IT-related
investments on ITBSA. In summary, the seven factors and their accompanying studies imply (1) a
positive relationship between investments in IT resources and ITBSA (relationship (a) in Figure 3-1)
and (2) establishes ITBSA as a valid consequence of IT.
B: The consequences of ITBSA (Performance Aspects)
Below we investigate the consequences of ITBSA, i.e., we look at the relationship between ITBSA
and a firm’s performance.
The effect of ITBSA on organizational performance has been studied along various dimensions. We
mention four of them, (a) positive improvements on a firm’s performance (effectiveness, efficiency,
internal coordination), combined with competitive advantage, (b) cost implications, (c) financial
indicators, and (d) SIW performance.
(a) Positive improvement on a firm’s performance combined with the achievement of competitive
advantage (through positive effect of ITBSA on increased effectiveness, efficiency, marketing
activity, internal coordination and processes) has been investigated and confirmed by a number
of researchers (see, e.g., Sabherwal & Chan 2001; Pollalis, 2003; Bergeron, Raymond & Rivard,
2004; Croteau & Raymond, 2004; Kearns & Sabherwal, 2006; Jorfi, Nor, & Najjar, 2011; Chang
et al., 2011; Luftman, 2015).
(b) Oh & Pinsonneault (2007) have explored the cost implications of the alignment concept in view
of the contingency approach. They concluded that ITBSA has a negative association in
combination with the firm’s expenses, i.e., effective ITBSA is a cause of reduced cost to the
organization.
(c) The direct effect of ITBSA on financial indicators such as return on investment (ROI) and return
on assets (ROA) was also investigated. It was shown that ITBSA has a positive implication on
financial indicators (cf. Feidler, Gorver, & Teng, 1995; Papp, 1999; Jorfi & Jorfi, 2011, Luftman,
2015; Wu, Detmar, & Liang, 2015).
From IT Business Strategic Alignment to Performance 51
(d) Along the innovation-related dimension, SIW performance enhancement due to ITBSA was also
supported by several scholars (see, e.g., Chan, Huff, Barclay & Copeland, 1997; Holthausen,
Larcker, & Sloan, 1995; Croteau & Raymond, 2004; Coltman et al., 2015; Héroux & Fortin,
2016)).
It is worth mentioning that on a different level of analysis, alignment was operationalized on the
process level (as opposed to the firm level) by Tallon (2008) and Luftman (2015). They have found
a similar positive association between alignment and business value at that level of analysis.
C: The Mediating and Moderating Variables
In spite of the fact that the majority of research shows a positive relationship between ITBSA and a
firm’s performance, some scholars argue that the relationship from ITBSA to performance is not a
direct one, but that it is mediated and/or moderated by other factors. We mention six factors together
with a reference.
(1) IT flexibility.
(2) Environmental volatility (cf. Tallon & Pinsonneault, 2011).
(3) Industry environment (cf. Xue et al., 2012).
(4) IT-enabled business processes (cf. Schwarz et al., 2010; Luftman, 2015)
(5) Service integration level (cf. Chang et al., 2011).
(6) SIW (cf. Masa'deh et al., 2008).
The controversy on the precise relationship between ITBSA and performance shows that there is a
need for further investigation of this relationship (cf. Schwarz et al., 2010; Tallon & Pinsonneault,
2011; Coltman et al., 2015). Due to our interest in the SIW concept, the next section will specifically
explore the literature on SIW from two main perspectives: (1) its relation to the organizational
performance and (2) as a factor along the relationship between ITBSA and performance (see factor
6 above).
3.2 SIW: The Facilitator between ITBSA and Performance
It is well known that the ability of an organization to achieve such a strategic advantage that it will
be distinguished from its competitors depends on the extent to which the organization invests in
innovative activities through combining valuable resources (cf. Conner, 1991; Teece, Pisano & Shuen
,1997; Spanos & Lioukas, 2001; Armbruster et al., 2008). Our aim is to investigate the position of
SIW as a valid factor on the path to organizational performance.

52 Literature Review
We start our investigation by reviewing the literature on the relationship between SIW and
performance in subsection 3.2.1 (relationship (d) in Figure 3-1). In subsection 3.2.2 we use inter-
departmental collaboration on SIW as a representation of SIW. Here we provide a review on the
concept of inter-departmental collaboration on SIW. In subsection 3.2.3 we review the literature on
the relationship between ITBSA and SIW to investigate the claim made by some researchers that SIW
is a consequence of ITBSA. In Figure 3-3 question marks indicate the studied relationships of this
section.
3.2.1 SIW and Performance
In general, the literature has been supportive on the positive impact of SIW on organizational
performance. The Dortmund/Brussels Position Paper (2012) argues that SIW-induced performance
enhancements come from combining both human and organizational dimensions. The integrative
process involves knowledge and experience of all organizational levels, leading to an increased
performance on at least four levels of analysis. We discuss them below.
(1) On the public level, it is reflected in a positive impact on (a) economic value creation, (b) increased
work force capabilities in the labor market, and (c) the delivery of essential community services
(cf. Alee & Taug, 2006; Gardner, Acharya, & Yach, 2007; Oeij, Dhondt, & Kraan, 2012).
(2) On the organizational level, the integration process positively affects the behavioral outcomes
such as high performance work practices and increased organizational capacities (cf. Black &
Lynch, 2004; Pot & Fietje, 2008).
(3) On the employee level, two main effects are noted: (a) an increased employee-related outcome
such as job satisfaction and motivation (cf. Cox, Rickard, & Tamkin, 2012), and (b) increased
participation and productivity (cf. Alasoini, 2004; Pot & Fietje, 2008; Rüede & Lurtz, 2012).
(? subsection 3.2.1) (? subsection 3.2.3)
IT Investments
Performance ITBSA SIW
(subsection 3.2.2)
Figure 3-3 Literature review of SIW
From IT Business Strategic Alignment to Performance 53
(4) On the financial level, researchers have argued that SIW is an effective tool for cost reduction and
increased returns for both private and public organizations (Barraud-Didier & Guerrero, 2002;
Gunday, Ulusoy, Kilic, & Alpkan, 2011; Dhondt, ten Have, & Kraan, 2012; Pot et al., 2012).
The positive effect of SIW on performance has not refuted doubts and controversy in the literature.
The historical track of SIW project failures has led to a pessimistic view due to three major issues
with SIW projects: (A) the risky nature, (B) the efficiency vs. innovation paradox, and (C) the multi-
functional team (inter-departmental) collaboration issues. Next, we provide a brief overview of these
three issues.
A: The risky nature of SIW projects
SIW projects usually involve new methods which are based on trial and error. Mostly the SIW
projects have no historical track record for making choices and decisions, which in some cases could
lead to project failures (cf. EC, DG Regional & Urban Policy, 2013).
B: The paradox of efficiency vs. innovation
The paradox of efficiency vs. innovation is a source of another controversy16. Some researchers argue
that SIW is a distraction from efficiency (cf. Mulgan et al., 2007).
The argument has to do with the human nature to resist change. Over time, process and rules get
stabilized around the organization. In spite of the fact that SIW does not necessarily create a new
invention, it is argued that it at least brings about new combinations and permutations of existing
systems (cf. Webber, 2012). The new systems and/or processes, no matter how effective, seem to be
inefficient, risky, and in certain cases against people’s interests. Managers of SIW projects are usually
faced with difficult tradeoff decisions17. This scenario is sometimes a source of internal competition
for scarce resources causing, at least initially, a reduced performance (cf. Sarkees & Hulland, 2009;
Xue et al., 2012).
16 In some research papers, it is called “Exploitation vs. Exploration”. It refers to the act of balancing between exploiting
current resources with minimal or incremental innovation vs. exploring new frontiers in a radical innovative way (cf.
Andriopoulos & Lewis, 2009).
17 The proposed solution is an effective simultaneous balancing of innovation and efficiency in a strategy called
Ambidexterity (cf. Andriopoulos & Lewis, 2009). It is noted that very few firms are capable of effectively realizing this
balance, but those that succeed usually outperform those that do not (cf. Sarkees & Hulland, 2009). A detailed
investigation of the Ambidexterity strategy is beyond this research.

Cha
pter
3
52 Literature Review
We start our investigation by reviewing the literature on the relationship between SIW and
performance in subsection 3.2.1 (relationship (d) in Figure 3-1). In subsection 3.2.2 we use inter-
departmental collaboration on SIW as a representation of SIW. Here we provide a review on the
concept of inter-departmental collaboration on SIW. In subsection 3.2.3 we review the literature on
the relationship between ITBSA and SIW to investigate the claim made by some researchers that SIW
is a consequence of ITBSA. In Figure 3-3 question marks indicate the studied relationships of this
section.
3.2.1 SIW and Performance
In general, the literature has been supportive on the positive impact of SIW on organizational
performance. The Dortmund/Brussels Position Paper (2012) argues that SIW-induced performance
enhancements come from combining both human and organizational dimensions. The integrative
process involves knowledge and experience of all organizational levels, leading to an increased
performance on at least four levels of analysis. We discuss them below.
(1) On the public level, it is reflected in a positive impact on (a) economic value creation, (b) increased
work force capabilities in the labor market, and (c) the delivery of essential community services
(cf. Alee & Taug, 2006; Gardner, Acharya, & Yach, 2007; Oeij, Dhondt, & Kraan, 2012).
(2) On the organizational level, the integration process positively affects the behavioral outcomes
such as high performance work practices and increased organizational capacities (cf. Black &
Lynch, 2004; Pot & Fietje, 2008).
(3) On the employee level, two main effects are noted: (a) an increased employee-related outcome
such as job satisfaction and motivation (cf. Cox, Rickard, & Tamkin, 2012), and (b) increased
participation and productivity (cf. Alasoini, 2004; Pot & Fietje, 2008; Rüede & Lurtz, 2012).
(? subsection 3.2.1) (? subsection 3.2.3)
IT Investments
Performance ITBSA SIW
(subsection 3.2.2)
Figure 3-3 Literature review of SIW
From IT Business Strategic Alignment to Performance 53
(4) On the financial level, researchers have argued that SIW is an effective tool for cost reduction and
increased returns for both private and public organizations (Barraud-Didier & Guerrero, 2002;
Gunday, Ulusoy, Kilic, & Alpkan, 2011; Dhondt, ten Have, & Kraan, 2012; Pot et al., 2012).
The positive effect of SIW on performance has not refuted doubts and controversy in the literature.
The historical track of SIW project failures has led to a pessimistic view due to three major issues
with SIW projects: (A) the risky nature, (B) the efficiency vs. innovation paradox, and (C) the multi-
functional team (inter-departmental) collaboration issues. Next, we provide a brief overview of these
three issues.
A: The risky nature of SIW projects
SIW projects usually involve new methods which are based on trial and error. Mostly the SIW
projects have no historical track record for making choices and decisions, which in some cases could
lead to project failures (cf. EC, DG Regional & Urban Policy, 2013).
B: The paradox of efficiency vs. innovation
The paradox of efficiency vs. innovation is a source of another controversy16. Some researchers argue
that SIW is a distraction from efficiency (cf. Mulgan et al., 2007).
The argument has to do with the human nature to resist change. Over time, process and rules get
stabilized around the organization. In spite of the fact that SIW does not necessarily create a new
invention, it is argued that it at least brings about new combinations and permutations of existing
systems (cf. Webber, 2012). The new systems and/or processes, no matter how effective, seem to be
inefficient, risky, and in certain cases against people’s interests. Managers of SIW projects are usually
faced with difficult tradeoff decisions17. This scenario is sometimes a source of internal competition
for scarce resources causing, at least initially, a reduced performance (cf. Sarkees & Hulland, 2009;
Xue et al., 2012).
16 In some research papers, it is called “Exploitation vs. Exploration”. It refers to the act of balancing between exploiting
current resources with minimal or incremental innovation vs. exploring new frontiers in a radical innovative way (cf.
Andriopoulos & Lewis, 2009).
17 The proposed solution is an effective simultaneous balancing of innovation and efficiency in a strategy called
Ambidexterity (cf. Andriopoulos & Lewis, 2009). It is noted that very few firms are capable of effectively realizing this
balance, but those that succeed usually outperform those that do not (cf. Sarkees & Hulland, 2009). A detailed
investigation of the Ambidexterity strategy is beyond this research.

54 Literature Review
C: The multi-functional team collaboration
Most innovative activities are cross functional (cf. Mulgan et al., 2007) which includes the
involvement of multiple departments (inter-departmental collaboration). Although this collaboration
is considered critical and inevitable, it is argued that it brings about several efficiency issues. Due to
the importance of this topic for our research, we dedicate the next subsection (subsection 3.2.2) to a
detailed investigation of the issue of inter-departmental collaboration.
3.2.2 Inter-Departmental Collaboration on SIW
Owing to the fact that our level of analysis is at the departmental level, and the data instrument used
is oriented towards inter-departmental collaboration on SIW, it is to be expected that we provide
much attention to the literature review on the issue. In the current subsection, we build on the
background and importance of inter-departmental collaboration provided in Chapter 2 (subsection
2.3.3). We provide a review of the literature on the relationship between inter-departmental
collaboration on SIW and performance. We present (1) views that argue for a positive relation
between inter-departmental collaboration on SIW and performance, as well as (2) nine opposing
views to this positive relationship. We do so through the following line of reasoning. We start at the
macro level by initially providing a brief literature review on the inter-organizational collaboration
with the aim to establish the scope for the intra-organizational collaboration on SIW. Then we provide
five more barriers from nine publications with controversial views regarding the relationship between
the inter-departmental collaboration on SIW and performance with the aim to demonstrate the need
for further investigation into the issue. The five main barriers are: (1) interpretive barriers, (2)
functional diversity, (3) past experience, (4) cultural barriers, and (5) communication barriers.
In section 3.1 it was shown that aligning IT and business strategies is an important pre-requisite for
increased performance (including innovation). However, it is also argued that the sole involvement
of the IT department in the collaborative process, as important as it might be, is not a sufficient event
to achieve effective pre-requisites for successful innovation (cf. Weill & Ross, 2004). This also holds
true for the sole involvement of other departments such as the R&D (cf. Ulrich & Eppinger, 2000).
The collaboration needs to be multi-departmental (multi-functional) for a consequent innovation
success (cf. Bowen et al., 2007; Pot et al., 2012; Ganotakis et al., 2013; Nichols et al., 2013).
Subsection 2.3.3 (in Chapter 2) has provided a literature review for the background and importance
of the inter-departmental collaboration on SIW; it was argued that there are three main schemes of
collaboration, namely, intra-organizational, inter-organizational, and inter-institutional. The last type
From IT Business Strategic Alignment to Performance 55
of collaboration mentioned above, the inter-institutional, is out of the scope of this research. The
second type, inter-organizational, which is concerned with knowledge sharing and information flow
among various organizations, will be briefly explored (see A below) to provide a reference point for
the scope of this research, namely, the intra-organizational collaboration (see B below) which is
considered the most important collaboration for effective knowledge sharing among departments and
for information flow (cf. Liu & Liu, 2008).
A: Inter-organizational collaboration
We start our literature research by exploring the inter-organization collaboration on SIW (the
collaboration among organizations). Due to the increased sophistication of products and services,
generating an innovative action usually involves crossing the resource boundaries not only within an
organization, but also across a specific sector and possibly across the industry, placing an increased
importance on the inter-organizational collaboration action (cf. Kamel, 2006; Mulgan et al., 2007;
EU, DG Regional and Urban Policy, 2013). An attempt by an organization to acquire all the necessary
competencies for a complex product/service is not the most efficient (and cost effective) path to
achieve effective SIW. Hence, strategic management literature is placing an increased emphasis on
effective collaborative frameworks. For example, Pot et al. (2012) and Ganotakis et al. (2013) have
confirmed that for an effective innovative process it is important to network with external entities
such as customers, suppliers, and trade unions. Those networks allow organizations to enhance their
value-creation capability (cf. Kamel, 2006) through special tailoring of EGIT practices for more
effective external collaborations (cf. Zarvic et al., 2012).
On the negative spectrum of inter-organizational collaboration research, some researchers have gone
to the extreme of claiming no positive effect on performance from external collaborations (see, e.g.,
Rosenbusch et al., 2011); while others were more moderate and argued that external innovative
networks are often coupled with internal networks and that they jointly participate in innovative
activities (cf. Colombo, Laursen, Magnusson, & Lamastra, 2011). This claim leads us to our main
point, namely, the intra-organizational collaboration (the inter-departmental collaboration).
B: Intra-organizational collaboration
Below we examine the intra-organizational collaboration on SIW. This type of collaboration implies
that in order to create an integrated knowledge framework for effective SIW, employees of a given
department must have access to out-of-their-expertise area in terms of knowledge and experience (cf.

Cha
pter
3
54 Literature Review
C: The multi-functional team collaboration
Most innovative activities are cross functional (cf. Mulgan et al., 2007) which includes the
involvement of multiple departments (inter-departmental collaboration). Although this collaboration
is considered critical and inevitable, it is argued that it brings about several efficiency issues. Due to
the importance of this topic for our research, we dedicate the next subsection (subsection 3.2.2) to a
detailed investigation of the issue of inter-departmental collaboration.
3.2.2 Inter-Departmental Collaboration on SIW
Owing to the fact that our level of analysis is at the departmental level, and the data instrument used
is oriented towards inter-departmental collaboration on SIW, it is to be expected that we provide
much attention to the literature review on the issue. In the current subsection, we build on the
background and importance of inter-departmental collaboration provided in Chapter 2 (subsection
2.3.3). We provide a review of the literature on the relationship between inter-departmental
collaboration on SIW and performance. We present (1) views that argue for a positive relation
between inter-departmental collaboration on SIW and performance, as well as (2) nine opposing
views to this positive relationship. We do so through the following line of reasoning. We start at the
macro level by initially providing a brief literature review on the inter-organizational collaboration
with the aim to establish the scope for the intra-organizational collaboration on SIW. Then we provide
five more barriers from nine publications with controversial views regarding the relationship between
the inter-departmental collaboration on SIW and performance with the aim to demonstrate the need
for further investigation into the issue. The five main barriers are: (1) interpretive barriers, (2)
functional diversity, (3) past experience, (4) cultural barriers, and (5) communication barriers.
In section 3.1 it was shown that aligning IT and business strategies is an important pre-requisite for
increased performance (including innovation). However, it is also argued that the sole involvement
of the IT department in the collaborative process, as important as it might be, is not a sufficient event
to achieve effective pre-requisites for successful innovation (cf. Weill & Ross, 2004). This also holds
true for the sole involvement of other departments such as the R&D (cf. Ulrich & Eppinger, 2000).
The collaboration needs to be multi-departmental (multi-functional) for a consequent innovation
success (cf. Bowen et al., 2007; Pot et al., 2012; Ganotakis et al., 2013; Nichols et al., 2013).
Subsection 2.3.3 (in Chapter 2) has provided a literature review for the background and importance
of the inter-departmental collaboration on SIW; it was argued that there are three main schemes of
collaboration, namely, intra-organizational, inter-organizational, and inter-institutional. The last type
From IT Business Strategic Alignment to Performance 55
of collaboration mentioned above, the inter-institutional, is out of the scope of this research. The
second type, inter-organizational, which is concerned with knowledge sharing and information flow
among various organizations, will be briefly explored (see A below) to provide a reference point for
the scope of this research, namely, the intra-organizational collaboration (see B below) which is
considered the most important collaboration for effective knowledge sharing among departments and
for information flow (cf. Liu & Liu, 2008).
A: Inter-organizational collaboration
We start our literature research by exploring the inter-organization collaboration on SIW (the
collaboration among organizations). Due to the increased sophistication of products and services,
generating an innovative action usually involves crossing the resource boundaries not only within an
organization, but also across a specific sector and possibly across the industry, placing an increased
importance on the inter-organizational collaboration action (cf. Kamel, 2006; Mulgan et al., 2007;
EU, DG Regional and Urban Policy, 2013). An attempt by an organization to acquire all the necessary
competencies for a complex product/service is not the most efficient (and cost effective) path to
achieve effective SIW. Hence, strategic management literature is placing an increased emphasis on
effective collaborative frameworks. For example, Pot et al. (2012) and Ganotakis et al. (2013) have
confirmed that for an effective innovative process it is important to network with external entities
such as customers, suppliers, and trade unions. Those networks allow organizations to enhance their
value-creation capability (cf. Kamel, 2006) through special tailoring of EGIT practices for more
effective external collaborations (cf. Zarvic et al., 2012).
On the negative spectrum of inter-organizational collaboration research, some researchers have gone
to the extreme of claiming no positive effect on performance from external collaborations (see, e.g.,
Rosenbusch et al., 2011); while others were more moderate and argued that external innovative
networks are often coupled with internal networks and that they jointly participate in innovative
activities (cf. Colombo, Laursen, Magnusson, & Lamastra, 2011). This claim leads us to our main
point, namely, the intra-organizational collaboration (the inter-departmental collaboration).
B: Intra-organizational collaboration
Below we examine the intra-organizational collaboration on SIW. This type of collaboration implies
that in order to create an integrated knowledge framework for effective SIW, employees of a given
department must have access to out-of-their-expertise area in terms of knowledge and experience (cf.

56 Literature Review
Faniel, 2005), i.e., creating inter-departmental collaboration networks in the form of, for example,
cross-functional teams (cf. Pot et al., 2012; Ganotakis et al., 2013).
Researchers have diverse opinions on the relationship between inter-departmental collaboration on
SIW and performance. Some argue that in the presence of a number of success factors with positive
effect, the effect of the collaborative efforts is not positive. For example, Holland, Gaston, & Gomes
(2000) have identified three success factors for an inter-departmental innovation team. In their
research, they showed strategic alignment, supportive climate, and team-based accountability to be
the predominant success factors of inter-departmental collaboration leading to a successful innovation
and a positive performance. Bry et al. (2011) in their paper on social innovation as a collective
adventure argue that factors such as a common belief, proper selection of the people on the team,
trust among the involved team members, and an effective leadership are the top factors of the success
in innovation teams.
The contingent effect in inter-departmental task conflicts, seen as an enabler of successful SIW, was
examined and confirmed by De Clercq et al. (2008). Their conclusion was that the higher level of a
cross-departmental task conflict increases the positive relationship between the SIW strategy and a
firm’s performance. In general, it is agreed that external orientation, beyond the functional
boundaries, makes innovation teams more efficient and successful (cf. Ancona & Bresman, 2007;
Botzenhardt et al., 2011). Finally, Murray, Caulier-Grice, & Mulgan (2010), Ganotakis et al. (2013)
and Arvanitis & Loukis (2016), all assert that using the appropriate IT technology provides for
enhanced communication through an effective and free flow information sharing, which in turn has
a positive impact on the organizational innovative efforts.
In spite of the argued positive effect of inter-departmental collaboration on SIW on the organizational
performance, there are some scholars that argue for a negative effect due to well-known barriers. At
least five main barriers were identified that made it difficult to get employees from different
functional areas to share or transfer each other’s knowledge across departmental boundaries (see
Markus, Majchrzak, & Gasser, 2002; Carlile, 2002). We briefly discuss the following five main
barriers below: interpretive barriers, functional diversity, past experience, cultural barriers, and
communication barriers.
From IT Business Strategic Alignment to Performance 57
Interpretive barriers
A classical and significant contribution to this field was the suggestion that (a) interpretive barriers
cause difficulties between individuals from cross departmental boundaries and that (b) those barriers
lower the perceived value of cross-departmental knowledge on any innovative activity (cf.
Dougherty, 1992). This view is supported by a theory of thought worlds proposed by Dougherty
(1992) in an attempt to explain the difficulty of knowledge integration across different departments.
Basically, she argues that people from different departments develop different thought worlds18.
According to this theory, employees from different departments (thought worlds) specialize in
different domains of knowledge. This specialization acts as a barrier to taking advantage of each
other’s knowledge. Those people from different departments have distinct approaches to making
sense of situations and hence encounter barriers in: (a) judging the quality of knowledge, (b)
understanding the knowledge, and (c) re-using the knowledge.
Functional diversity
Sethi (2000) argues that functional diversity may lead to decision complexity and confusion. The
informal communication patterns combined with the participative decision-making can become a
time-consuming process (cf. Olson, Walker, & Ruekert, 1995). The classical conflict between design
and marketing departments is a real live example (cf. Beverland, 2005).
Past experience
Past experience with large scale projects is a key factor in determining the level and success of
collaboration. The lack or the weakness of such experience in some departments could be a barrier to
successful collaboration efforts (cf. Huang & Newell, 2003).
Cultural barriers
There are two forms of cultural barriers. First, we observe that inter-departmental collaboration and
knowledge sharing often fail because instead of implementing sharing and collaborating practices to
fit the culture, companies attempt to do it the other way around. They adjust their organizational
culture to fit those practices (cf. Riege, 2005). A second form of cultural barriers to inter-departmental
collaboration is as follows. In case an organizational culture apparently values certain departments
18 A thought world is “a community of persons engaged in a certain domain activity who has a shared understanding about
that activity” (Dougherty, 1992: 182).

Cha
pter
3
56 Literature Review
Faniel, 2005), i.e., creating inter-departmental collaboration networks in the form of, for example,
cross-functional teams (cf. Pot et al., 2012; Ganotakis et al., 2013).
Researchers have diverse opinions on the relationship between inter-departmental collaboration on
SIW and performance. Some argue that in the presence of a number of success factors with positive
effect, the effect of the collaborative efforts is not positive. For example, Holland, Gaston, & Gomes
(2000) have identified three success factors for an inter-departmental innovation team. In their
research, they showed strategic alignment, supportive climate, and team-based accountability to be
the predominant success factors of inter-departmental collaboration leading to a successful innovation
and a positive performance. Bry et al. (2011) in their paper on social innovation as a collective
adventure argue that factors such as a common belief, proper selection of the people on the team,
trust among the involved team members, and an effective leadership are the top factors of the success
in innovation teams.
The contingent effect in inter-departmental task conflicts, seen as an enabler of successful SIW, was
examined and confirmed by De Clercq et al. (2008). Their conclusion was that the higher level of a
cross-departmental task conflict increases the positive relationship between the SIW strategy and a
firm’s performance. In general, it is agreed that external orientation, beyond the functional
boundaries, makes innovation teams more efficient and successful (cf. Ancona & Bresman, 2007;
Botzenhardt et al., 2011). Finally, Murray, Caulier-Grice, & Mulgan (2010), Ganotakis et al. (2013)
and Arvanitis & Loukis (2016), all assert that using the appropriate IT technology provides for
enhanced communication through an effective and free flow information sharing, which in turn has
a positive impact on the organizational innovative efforts.
In spite of the argued positive effect of inter-departmental collaboration on SIW on the organizational
performance, there are some scholars that argue for a negative effect due to well-known barriers. At
least five main barriers were identified that made it difficult to get employees from different
functional areas to share or transfer each other’s knowledge across departmental boundaries (see
Markus, Majchrzak, & Gasser, 2002; Carlile, 2002). We briefly discuss the following five main
barriers below: interpretive barriers, functional diversity, past experience, cultural barriers, and
communication barriers.
From IT Business Strategic Alignment to Performance 57
Interpretive barriers
A classical and significant contribution to this field was the suggestion that (a) interpretive barriers
cause difficulties between individuals from cross departmental boundaries and that (b) those barriers
lower the perceived value of cross-departmental knowledge on any innovative activity (cf.
Dougherty, 1992). This view is supported by a theory of thought worlds proposed by Dougherty
(1992) in an attempt to explain the difficulty of knowledge integration across different departments.
Basically, she argues that people from different departments develop different thought worlds18.
According to this theory, employees from different departments (thought worlds) specialize in
different domains of knowledge. This specialization acts as a barrier to taking advantage of each
other’s knowledge. Those people from different departments have distinct approaches to making
sense of situations and hence encounter barriers in: (a) judging the quality of knowledge, (b)
understanding the knowledge, and (c) re-using the knowledge.
Functional diversity
Sethi (2000) argues that functional diversity may lead to decision complexity and confusion. The
informal communication patterns combined with the participative decision-making can become a
time-consuming process (cf. Olson, Walker, & Ruekert, 1995). The classical conflict between design
and marketing departments is a real live example (cf. Beverland, 2005).
Past experience
Past experience with large scale projects is a key factor in determining the level and success of
collaboration. The lack or the weakness of such experience in some departments could be a barrier to
successful collaboration efforts (cf. Huang & Newell, 2003).
Cultural barriers
There are two forms of cultural barriers. First, we observe that inter-departmental collaboration and
knowledge sharing often fail because instead of implementing sharing and collaborating practices to
fit the culture, companies attempt to do it the other way around. They adjust their organizational
culture to fit those practices (cf. Riege, 2005). A second form of cultural barriers to inter-departmental
collaboration is as follows. In case an organizational culture apparently values certain departments
18 A thought world is “a community of persons engaged in a certain domain activity who has a shared understanding about
that activity” (Dougherty, 1992: 182).
58 Literature Review
over others (cf. De Long & Fahey, 2000), it may happen that such a valuation acts as a barrier to
inter-departmental collaboration.
Communication barriers
Beverland (2005) already observed that communication problems and employee tension were
classically reported as a major inter-departmental collaboration barrier. A classic example is the
communication tension between the design and marketing departments. Designers see cost and
internal functionality as a major factor in a new product, while marketing departments might see
external look and ease of use as more important.
Those five barriers almost certainly hinder effective inter-departmental collaboration on SIW,
bringing about the following two major controversies regarding the usefulness of those departmental
collaborative networks.
Controversy 1 on Decision making efficiency
Researchers argue that inter-departmental collaboration is a source of decision-making delays due to
the more complex decision-making procedures (cf. Olson et al., 1995). Hackman (2009) in his
interview by Diane Coutu attributes the inefficiency to the fact that, due to this barrier, “teams don’t
even know what are they supposed to be doing”.
Controversy 2 on the Increased cost
Inter-departmental collaboration on SIW (in association with the above-mentioned barriers and
controversy 1) is considered by some employees as a source of increased cost. These employees
provide at least the following four reasons: (a) project delays (cf. Cuijpers et al., 2011), (b) less
efficiency in decision-making (cf. Olson et al., 1995), (c) conflicts over resources (cf. Troy et al.,
2008), and (d) budget over-runs (cf. Olson et al., 2001).
Conclusion
So, the topic on the relationship between (a) inter-departmental collaboration on SIW and (b)
performance is really controversial. Yet, most researchers agree that an effective and aligned IT
system is a must for collaborative activity to take place. In the next subsection, we discuss this
suggestion by investigating the relationship between the ITBSA and SIW.
From IT Business Strategic Alignment to Performance 59
3.2.3 ITBSA and SIW
IT strategic alignment with a proper business strategy has been considered the basis for sustainable
advantage and organizational success. Several studies have investigated the effect of ITBSA on
business performance as represented by constructs such as financial performance, market growth,
and company reputation; while others have specifically explored the relationship between ITBSA and
innovation activity at the organizational level. For references, see below.
As a case in point, we mention that as early as in 1993 Chan & Huff (1993) have investigated and
confirmed the positive association between ITBSA and a firm’s performance factors such as market
growth and service innovation at the organizational level. They explained that a given firm would
understand that its main (core) strategic drive to remain competitive would be the development of
new products and/or services. Furthermore, those firms would support thrust in products and services
by designing its operational development plans for a new product in harmony with its IT strategic
plans creating an aligned environment.
A positive effect of ITBSA on disruptive innovation that moves organizations from a stagnant (old)
stage to new high returns was established by Dehning, Rishardson, & Zmud (2003). ITBSA was also
shown to enhance the relationship between future innovation activities and senior management
acceptance of those activities if the innovations were associated with the idea of ITBSA (cf. Silva,
Figueroa, & Reinharta, 2007).
Tallon & Pinsonneault (2011) have asserted, in their study of IT alignment and agility, that the path
dependencies created by agility19 enable increased innovation and adaptiveness. Neubert et al. (2011)
have expanded the stand- alone view of alignment as an internal issue between the organization and
its IT systems into the inter-organizational level. They considered the effect of organizational
alignment on the IT-driven innovations and confirmed a positive relationship.
In all of the mentioned studies, ITBSA is shown to be positively associated with an innovative activity
of the organization. In this research, we propose that this relationship, on the departmental level, is
moderated by the Enterprise Governance of IT (EGIT) which is the focus of the following section.
19 Here we are referring to an environment where essential business strategy aspects are easily communicated to IT
executives, and IT capabilities essential for directing business strategy are shared with business executives.
Cha
pter
3
58 Literature Review
over others (cf. De Long & Fahey, 2000), it may happen that such a valuation acts as a barrier to
inter-departmental collaboration.
Communication barriers
Beverland (2005) already observed that communication problems and employee tension were
classically reported as a major inter-departmental collaboration barrier. A classic example is the
communication tension between the design and marketing departments. Designers see cost and
internal functionality as a major factor in a new product, while marketing departments might see
external look and ease of use as more important.
Those five barriers almost certainly hinder effective inter-departmental collaboration on SIW,
bringing about the following two major controversies regarding the usefulness of those departmental
collaborative networks.
Controversy 1 on Decision making efficiency
Researchers argue that inter-departmental collaboration is a source of decision-making delays due to
the more complex decision-making procedures (cf. Olson et al., 1995). Hackman (2009) in his
interview by Diane Coutu attributes the inefficiency to the fact that, due to this barrier, “teams don’t
even know what are they supposed to be doing”.
Controversy 2 on the Increased cost
Inter-departmental collaboration on SIW (in association with the above-mentioned barriers and
controversy 1) is considered by some employees as a source of increased cost. These employees
provide at least the following four reasons: (a) project delays (cf. Cuijpers et al., 2011), (b) less
efficiency in decision-making (cf. Olson et al., 1995), (c) conflicts over resources (cf. Troy et al.,
2008), and (d) budget over-runs (cf. Olson et al., 2001).
Conclusion
So, the topic on the relationship between (a) inter-departmental collaboration on SIW and (b)
performance is really controversial. Yet, most researchers agree that an effective and aligned IT
system is a must for collaborative activity to take place. In the next subsection, we discuss this
suggestion by investigating the relationship between the ITBSA and SIW.
From IT Business Strategic Alignment to Performance 59
3.2.3 ITBSA and SIW
IT strategic alignment with a proper business strategy has been considered the basis for sustainable
advantage and organizational success. Several studies have investigated the effect of ITBSA on
business performance as represented by constructs such as financial performance, market growth,
and company reputation; while others have specifically explored the relationship between ITBSA and
innovation activity at the organizational level. For references, see below.
As a case in point, we mention that as early as in 1993 Chan & Huff (1993) have investigated and
confirmed the positive association between ITBSA and a firm’s performance factors such as market
growth and service innovation at the organizational level. They explained that a given firm would
understand that its main (core) strategic drive to remain competitive would be the development of
new products and/or services. Furthermore, those firms would support thrust in products and services
by designing its operational development plans for a new product in harmony with its IT strategic
plans creating an aligned environment.
A positive effect of ITBSA on disruptive innovation that moves organizations from a stagnant (old)
stage to new high returns was established by Dehning, Rishardson, & Zmud (2003). ITBSA was also
shown to enhance the relationship between future innovation activities and senior management
acceptance of those activities if the innovations were associated with the idea of ITBSA (cf. Silva,
Figueroa, & Reinharta, 2007).
Tallon & Pinsonneault (2011) have asserted, in their study of IT alignment and agility, that the path
dependencies created by agility19 enable increased innovation and adaptiveness. Neubert et al. (2011)
have expanded the stand- alone view of alignment as an internal issue between the organization and
its IT systems into the inter-organizational level. They considered the effect of organizational
alignment on the IT-driven innovations and confirmed a positive relationship.
In all of the mentioned studies, ITBSA is shown to be positively associated with an innovative activity
of the organization. In this research, we propose that this relationship, on the departmental level, is
moderated by the Enterprise Governance of IT (EGIT) which is the focus of the following section.
19 Here we are referring to an environment where essential business strategy aspects are easily communicated to IT
executives, and IT capabilities essential for directing business strategy are shared with business executives.

60 Literature Review
3.3 The Enterprise Governance of IT
At the start, we would like to point to the relative lack of research on the topic of EGIT as pointed by
two authors who have executed an extensive literature research on the EGIT concept up to the year
2013 (see Valentine & Stewart, 2013). They note that “The primary limitation faced is the lack of
scholarly research relating to enterprise business technology governance in the rapidly changing
digital economy”. In a similar vein, this view is confirmed somewhat earlier by several other scholars
(cf., e.g., Coleman & Chatfield, 2011; Haghjoo, 2012) who claimed that studies investigating the role
of EGIT in value delivery are also scarce.
The aim of this section is to show that a proper EGIT is a significant player along the studied path
from IT investments to SIW and performance. We build on the background, importance and
definition of EGIT that was presented in section 2.2. Definition 2-14 has described EGIT as having
three components: processes, structures, and relational mechanisms. Below we present a more
detailed insight into those components (see subsection 3.3.1). Then, we investigate the relationships
between EGIT and SIW in subsection 3.3.2. Finally, the controversial relationship between EGIT and
ITBSA is investigated in subsection 3.3.3. Figure 3-4 depicts the relationships explored by this
section.
In Figure 3-4 EGIT is positioned, as assumed by our research, in the moderating position between
ITBSA and SIW. In this section, we have decided on this positioning because we are interested in
examining the literature for the relationships between (a) EGIT and (b) both the ITBSA and SIW with
the aim to investigate (and set the stage for) the possibility of the moderating effect of EGIT.
IT Investments
Performance ITBSA SIW
? (subsection 3.3.2)
EGIT
(subsection 3.3.3) ?
Figure 3-4 Literature review of EGIT
From IT Business Strategic Alignment to Performance 61
3.3.1 The Components of the Enterprise Governance of IT
There is no consensus on the specific factors composing the EGIT concept. A few studies have
provided a segregated exploration of EGIT’s components (as opposed to a holistic approach as will
be discussed later). Those studies have examined several factors that supposedly compose the EGIT.
For example, Sohal & Fitzpatric (2002) have worked on exploring IT governance components such
as: decision-making structures, alignment processes, and communication approaches, while Weill &
Ross (2004) have focused more on the decision-making oriented factors such as: IT steering
committee, centralization of IT decision making, and the involvement of senior management in IT.
Vaswani (2003) and Syaiful (2006) have studied the correlation between some of the above factors
and effective IT governance. For example, they argued that certain individual mechanisms, such as:
IT steering committee, involvement of senior management, corporate performance measurement
systems, culture of compliance, and corporate communications systems, have a positive effect on the
overall level of IT governance effectiveness.
A study closely related to our definition of EGIT was performed by De Haes & Van Grembergen
(2009). They have set a more standardized categorization of the factors that compose the EGIT. In
their study, they have explored two major research questions: (1) how do organizations implement
EGIT? And (2) what is the relationship between EGIT and IT business strategic alignment? The first
research question regarding the steps of implementing an EGIT is beyond the scope of this thesis.
The conceptual model of their research question #2 is discussed in Chapter 4. At this stage, we are
concerned with a part of their research question #2 in which they define the components of EGIT as
a mixture of processes, structures, and relational mechanisms. We adopt this conceptualization of
EGIT in our study. Hence, those components are further explored in the next paragraphs.
Processes
The processes of IT governance are referred to by Peterson (2004) as “formalization and
institutionalization of strategic IT decision making or IT monitoring procedures”. Those processes
include, among others, IT performance management system, formal IT governance framework,
benefit management, and reporting.
Structures
Structures are pointing to formal mechanisms, such as an IT strategy committee at the level of the
board that enables horizontal contacts between business and IT management (cf. Peterson, 2004). As
previously mentioned, IT governance should be an integral part of corporate governance,

Cha
pter
3
60 Literature Review
3.3 The Enterprise Governance of IT
At the start, we would like to point to the relative lack of research on the topic of EGIT as pointed by
two authors who have executed an extensive literature research on the EGIT concept up to the year
2013 (see Valentine & Stewart, 2013). They note that “The primary limitation faced is the lack of
scholarly research relating to enterprise business technology governance in the rapidly changing
digital economy”. In a similar vein, this view is confirmed somewhat earlier by several other scholars
(cf., e.g., Coleman & Chatfield, 2011; Haghjoo, 2012) who claimed that studies investigating the role
of EGIT in value delivery are also scarce.
The aim of this section is to show that a proper EGIT is a significant player along the studied path
from IT investments to SIW and performance. We build on the background, importance and
definition of EGIT that was presented in section 2.2. Definition 2-14 has described EGIT as having
three components: processes, structures, and relational mechanisms. Below we present a more
detailed insight into those components (see subsection 3.3.1). Then, we investigate the relationships
between EGIT and SIW in subsection 3.3.2. Finally, the controversial relationship between EGIT and
ITBSA is investigated in subsection 3.3.3. Figure 3-4 depicts the relationships explored by this
section.
In Figure 3-4 EGIT is positioned, as assumed by our research, in the moderating position between
ITBSA and SIW. In this section, we have decided on this positioning because we are interested in
examining the literature for the relationships between (a) EGIT and (b) both the ITBSA and SIW with
the aim to investigate (and set the stage for) the possibility of the moderating effect of EGIT.
IT Investments
Performance ITBSA SIW
? (subsection 3.3.2)
EGIT
(subsection 3.3.3) ?
Figure 3-4 Literature review of EGIT
From IT Business Strategic Alignment to Performance 61
3.3.1 The Components of the Enterprise Governance of IT
There is no consensus on the specific factors composing the EGIT concept. A few studies have
provided a segregated exploration of EGIT’s components (as opposed to a holistic approach as will
be discussed later). Those studies have examined several factors that supposedly compose the EGIT.
For example, Sohal & Fitzpatric (2002) have worked on exploring IT governance components such
as: decision-making structures, alignment processes, and communication approaches, while Weill &
Ross (2004) have focused more on the decision-making oriented factors such as: IT steering
committee, centralization of IT decision making, and the involvement of senior management in IT.
Vaswani (2003) and Syaiful (2006) have studied the correlation between some of the above factors
and effective IT governance. For example, they argued that certain individual mechanisms, such as:
IT steering committee, involvement of senior management, corporate performance measurement
systems, culture of compliance, and corporate communications systems, have a positive effect on the
overall level of IT governance effectiveness.
A study closely related to our definition of EGIT was performed by De Haes & Van Grembergen
(2009). They have set a more standardized categorization of the factors that compose the EGIT. In
their study, they have explored two major research questions: (1) how do organizations implement
EGIT? And (2) what is the relationship between EGIT and IT business strategic alignment? The first
research question regarding the steps of implementing an EGIT is beyond the scope of this thesis.
The conceptual model of their research question #2 is discussed in Chapter 4. At this stage, we are
concerned with a part of their research question #2 in which they define the components of EGIT as
a mixture of processes, structures, and relational mechanisms. We adopt this conceptualization of
EGIT in our study. Hence, those components are further explored in the next paragraphs.
Processes
The processes of IT governance are referred to by Peterson (2004) as “formalization and
institutionalization of strategic IT decision making or IT monitoring procedures”. Those processes
include, among others, IT performance management system, formal IT governance framework,
benefit management, and reporting.
Structures
Structures are pointing to formal mechanisms, such as an IT strategy committee at the level of the
board that enables horizontal contacts between business and IT management (cf. Peterson, 2004). As
previously mentioned, IT governance should be an integral part of corporate governance,
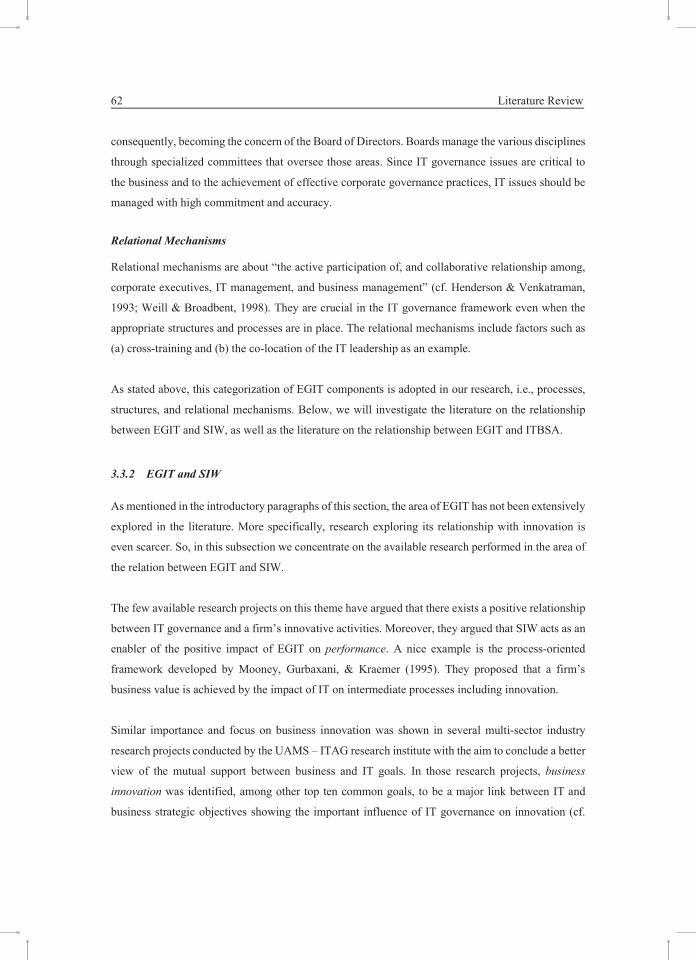
62 Literature Review
consequently, becoming the concern of the Board of Directors. Boards manage the various disciplines
through specialized committees that oversee those areas. Since IT governance issues are critical to
the business and to the achievement of effective corporate governance practices, IT issues should be
managed with high commitment and accuracy.
Relational Mechanisms
Relational mechanisms are about “the active participation of, and collaborative relationship among,
corporate executives, IT management, and business management” (cf. Henderson & Venkatraman,
1993; Weill & Broadbent, 1998). They are crucial in the IT governance framework even when the
appropriate structures and processes are in place. The relational mechanisms include factors such as
(a) cross-training and (b) the co-location of the IT leadership as an example.
As stated above, this categorization of EGIT components is adopted in our research, i.e., processes,
structures, and relational mechanisms. Below, we will investigate the literature on the relationship
between EGIT and SIW, as well as the literature on the relationship between EGIT and ITBSA.
3.3.2 EGIT and SIW
As mentioned in the introductory paragraphs of this section, the area of EGIT has not been extensively
explored in the literature. More specifically, research exploring its relationship with innovation is
even scarcer. So, in this subsection we concentrate on the available research performed in the area of
the relation between EGIT and SIW.
The few available research projects on this theme have argued that there exists a positive relationship
between IT governance and a firm’s innovative activities. Moreover, they argued that SIW acts as an
enabler of the positive impact of EGIT on performance. A nice example is the process-oriented
framework developed by Mooney, Gurbaxani, & Kraemer (1995). They proposed that a firm’s
business value is achieved by the impact of IT on intermediate processes including innovation.
Similar importance and focus on business innovation was shown in several multi-sector industry
research projects conducted by the UAMS – ITAG research institute with the aim to conclude a better
view of the mutual support between business and IT goals. In those research projects, business
innovation was identified, among other top ten common goals, to be a major link between IT and
business strategic objectives showing the important influence of IT governance on innovation (cf.
From IT Business Strategic Alignment to Performance 63
Van Grembergen & De Haes, 2009). Similarly, Peterson (2004) has proposed a positive influence
of EGIT (specifically the decentralized IT governance) on the innovation strategy in large and
complex organizations. EGIT was also shown to support innovative activities through enabling
collaboration by providing effective information sharing and smooth knowledge transfer (cf.
Coleman & Chatfield, 2011; Zarvic et al., 2012; Ganotakis et al., 2013). As already discussed in
subsection 3.2.2, this is a critical factor for successful innovation activities.
3.3.3 EGIT and ITBSA
The precise relationship between EGIT and ITBSA is controversial at least in the literature.
Researchers both agree and disagree about certain aspects of the EGIT and ITBSA relationship.
On the one hand, researchers are in general agreement along two main lines: (1) EGIT and ITBSA
are complimentary and closely related (cf. Tiwana & Konsysnski, 2010; Héroux & Fortin, 2016), and
(2) as argued by Stolze, Boehm, Zarvić, & Thomas, (2011) and confirmed by Zarvic et al. (2012),
there is a general consensus implying that the EGIT concept is about managing the strategic outcomes
and value delivery of IT investment. The latter is achieved by setting a decision-making framework
that encourages an IT-usage behavior. The essence is that the IT-usage behavior is aligned with the
general strategic goals of the organization (cf. also, Weill & Ross, 2004; Fonstad & Robsertson, 2006;
Becker, Pöppelbuß, Stolze, & Cyrus, 2009).
On the other hand, researchers disagree on two main aspects of the EGIT and ITBSA relationship:
(1) some consider EGIT to be an antecedent to ITBSA, in which case the aim is to maximize ITBSA
as an end stage of the investigated value chain (see, e.g., De Haes & Grembergen, 2009; Jorfi & Jorfi,
2011; Sabegh & Motlagh, 2012); and (2) some consider EGIT to be an enabler for ITBSA’s ability
to achieve strategic outcomes. The effect of these two disagreements could take one of two forms.
The forms (a) and (b) correspond with disagreement (1) and (2) respectively.
(a) The first form assumes that ITBSA is a consequence of EGIT. Or, as we investigate in our
research, that EGIT moderates the impact of ITBSA on other success factors. For example, Chang
et al. (2011) in their research on assessing ITBSA in service organizations have shown that service

Cha
pter
3
62 Literature Review
consequently, becoming the concern of the Board of Directors. Boards manage the various disciplines
through specialized committees that oversee those areas. Since IT governance issues are critical to
the business and to the achievement of effective corporate governance practices, IT issues should be
managed with high commitment and accuracy.
Relational Mechanisms
Relational mechanisms are about “the active participation of, and collaborative relationship among,
corporate executives, IT management, and business management” (cf. Henderson & Venkatraman,
1993; Weill & Broadbent, 1998). They are crucial in the IT governance framework even when the
appropriate structures and processes are in place. The relational mechanisms include factors such as
(a) cross-training and (b) the co-location of the IT leadership as an example.
As stated above, this categorization of EGIT components is adopted in our research, i.e., processes,
structures, and relational mechanisms. Below, we will investigate the literature on the relationship
between EGIT and SIW, as well as the literature on the relationship between EGIT and ITBSA.
3.3.2 EGIT and SIW
As mentioned in the introductory paragraphs of this section, the area of EGIT has not been extensively
explored in the literature. More specifically, research exploring its relationship with innovation is
even scarcer. So, in this subsection we concentrate on the available research performed in the area of
the relation between EGIT and SIW.
The few available research projects on this theme have argued that there exists a positive relationship
between IT governance and a firm’s innovative activities. Moreover, they argued that SIW acts as an
enabler of the positive impact of EGIT on performance. A nice example is the process-oriented
framework developed by Mooney, Gurbaxani, & Kraemer (1995). They proposed that a firm’s
business value is achieved by the impact of IT on intermediate processes including innovation.
Similar importance and focus on business innovation was shown in several multi-sector industry
research projects conducted by the UAMS – ITAG research institute with the aim to conclude a better
view of the mutual support between business and IT goals. In those research projects, business
innovation was identified, among other top ten common goals, to be a major link between IT and
business strategic objectives showing the important influence of IT governance on innovation (cf.
From IT Business Strategic Alignment to Performance 63
Van Grembergen & De Haes, 2009). Similarly, Peterson (2004) has proposed a positive influence
of EGIT (specifically the decentralized IT governance) on the innovation strategy in large and
complex organizations. EGIT was also shown to support innovative activities through enabling
collaboration by providing effective information sharing and smooth knowledge transfer (cf.
Coleman & Chatfield, 2011; Zarvic et al., 2012; Ganotakis et al., 2013). As already discussed in
subsection 3.2.2, this is a critical factor for successful innovation activities.
3.3.3 EGIT and ITBSA
The precise relationship between EGIT and ITBSA is controversial at least in the literature.
Researchers both agree and disagree about certain aspects of the EGIT and ITBSA relationship.
On the one hand, researchers are in general agreement along two main lines: (1) EGIT and ITBSA
are complimentary and closely related (cf. Tiwana & Konsysnski, 2010; Héroux & Fortin, 2016), and
(2) as argued by Stolze, Boehm, Zarvić, & Thomas, (2011) and confirmed by Zarvic et al. (2012),
there is a general consensus implying that the EGIT concept is about managing the strategic outcomes
and value delivery of IT investment. The latter is achieved by setting a decision-making framework
that encourages an IT-usage behavior. The essence is that the IT-usage behavior is aligned with the
general strategic goals of the organization (cf. also, Weill & Ross, 2004; Fonstad & Robsertson, 2006;
Becker, Pöppelbuß, Stolze, & Cyrus, 2009).
On the other hand, researchers disagree on two main aspects of the EGIT and ITBSA relationship:
(1) some consider EGIT to be an antecedent to ITBSA, in which case the aim is to maximize ITBSA
as an end stage of the investigated value chain (see, e.g., De Haes & Grembergen, 2009; Jorfi & Jorfi,
2011; Sabegh & Motlagh, 2012); and (2) some consider EGIT to be an enabler for ITBSA’s ability
to achieve strategic outcomes. The effect of these two disagreements could take one of two forms.
The forms (a) and (b) correspond with disagreement (1) and (2) respectively.
(a) The first form assumes that ITBSA is a consequence of EGIT. Or, as we investigate in our
research, that EGIT moderates the impact of ITBSA on other success factors. For example, Chang
et al. (2011) in their research on assessing ITBSA in service organizations have shown that service

64 Literature Review
automation and integration acts as a moderator of the ITBSA’s20 effect on the organizational
performance. Similarly, Tallon & Pinsonneault (2011) have examined the effect of EGIT factors
such as IT flexibility. They have concluded that there is a positive moderating effect of IT
flexibility (among other factors) on the relationship between ITBSA and performance.
(b) The second form assumes that EGIT acts as a consequence of ITBSA. Thus, EGIT mediates the
effect of ITBSA on other performance factors. Along this path of reasoning we find, for example,
Zhou, Cillier, & Wilson (2008) who argued that information management mediates the effect of
ITBSA on performance. Moreover, Beimborn et al. (2009) have shown that EGIT is a
consequence of strategic alignment and that it mediates the effect of ITBSA on structural
alignment and organizational performance.
3.3.4 Chapter Conclusion
Based on the literature findings of this chapter, we may conclude that the issue of positioning of EGIT
along the value chain from the investments in IT resources to performance is still controversial. It
needs further investigation. Consequently, in order to provide further investigation into the issue, we
have to investigate the models that relate EGIT and ITBSA. Moreover, we should build a conceptual
model for our study. We do so in the following chapter.
20 Chang et al. (2011) have examined three types of alignment: strategic, operational, and social alignments. They have
concluded that the effect of all forms of alignments (including the strategic alignment) on performance is a moderated
effect.
CHAPTER 4 THE CONCEPTUAL MODEL
Based on the background of Chapter 2 and the literature review in Chapter 3, this chapter focuses on
the development of the main conceptual model for this study. We approach the development of our
conceptual model by the following line of production. In section 4.1 we provide the theoretical
background of the mediating and moderating models. In section 4.2 we show the significance of the
departmental level analysis. In section 4.3 we develop an initial conceptual model that depicts the
assumed relationship among the three basic concepts: ITBSA, SIW, and performance. In section 4.4
we eventually design those conceptual models which are assumed to have the distinct effects of EGIT
on the relationship between ITBSA and performance.
4.1 The Theoretical Background of the Mediating and Moderating Models
In recent studies, strategic alignment mediators and moderators are playing an increasingly pivotal
role (see, e.g., Chan et al., 2006; Tallon & Pinsonneault, 2011; Wu, Detmar, & Liang, 2015). These
studies concur with our research interest. Therefore, we aim at exploring the mechanism that mediate
and moderate the relationship between ITBSA and performance at the departmental level. However,
there are not many studies of this type. So, our research focus is relatively unexplored both in the
literature and in practice. Still, our objective is to align the relation: ITBSA, EGIT, and the
departmental level of social innovation at work towards the departmental performance.
In this section, we set the stage for the development of our main conceptual model by introducing the
two theoretical models, namely, the mediating model in subsection 4.1.1., and the moderating model
in subsection 4.1.2.
4.1.1 The Mediating Model
In this subsection, the conceptual design of a generic mediating model is discussed. First, we provide
a definition for the mediating variable.
Definition 4-1 Mediating Variable
A mediating variable is “a variable with a mediating effect that is based on the extent to which it accounts for the relationship between the independent variable and the dependent variable”. (cf. Baron & Kenny, 1986)
Cha
pter
4
64 Literature Review
automation and integration acts as a moderator of the ITBSA’s20 effect on the organizational
performance. Similarly, Tallon & Pinsonneault (2011) have examined the effect of EGIT factors
such as IT flexibility. They have concluded that there is a positive moderating effect of IT
flexibility (among other factors) on the relationship between ITBSA and performance.
(b) The second form assumes that EGIT acts as a consequence of ITBSA. Thus, EGIT mediates the
effect of ITBSA on other performance factors. Along this path of reasoning we find, for example,
Zhou, Cillier, & Wilson (2008) who argued that information management mediates the effect of
ITBSA on performance. Moreover, Beimborn et al. (2009) have shown that EGIT is a
consequence of strategic alignment and that it mediates the effect of ITBSA on structural
alignment and organizational performance.
3.3.4 Chapter Conclusion
Based on the literature findings of this chapter, we may conclude that the issue of positioning of EGIT
along the value chain from the investments in IT resources to performance is still controversial. It
needs further investigation. Consequently, in order to provide further investigation into the issue, we
have to investigate the models that relate EGIT and ITBSA. Moreover, we should build a conceptual
model for our study. We do so in the following chapter.
20 Chang et al. (2011) have examined three types of alignment: strategic, operational, and social alignments. They have
concluded that the effect of all forms of alignments (including the strategic alignment) on performance is a moderated
effect.
CHAPTER 4 THE CONCEPTUAL MODEL
Based on the background of Chapter 2 and the literature review in Chapter 3, this chapter focuses on
the development of the main conceptual model for this study. We approach the development of our
conceptual model by the following line of production. In section 4.1 we provide the theoretical
background of the mediating and moderating models. In section 4.2 we show the significance of the
departmental level analysis. In section 4.3 we develop an initial conceptual model that depicts the
assumed relationship among the three basic concepts: ITBSA, SIW, and performance. In section 4.4
we eventually design those conceptual models which are assumed to have the distinct effects of EGIT
on the relationship between ITBSA and performance.
4.1 The Theoretical Background of the Mediating and Moderating Models
In recent studies, strategic alignment mediators and moderators are playing an increasingly pivotal
role (see, e.g., Chan et al., 2006; Tallon & Pinsonneault, 2011; Wu, Detmar, & Liang, 2015). These
studies concur with our research interest. Therefore, we aim at exploring the mechanism that mediate
and moderate the relationship between ITBSA and performance at the departmental level. However,
there are not many studies of this type. So, our research focus is relatively unexplored both in the
literature and in practice. Still, our objective is to align the relation: ITBSA, EGIT, and the
departmental level of social innovation at work towards the departmental performance.
In this section, we set the stage for the development of our main conceptual model by introducing the
two theoretical models, namely, the mediating model in subsection 4.1.1., and the moderating model
in subsection 4.1.2.
4.1.1 The Mediating Model
In this subsection, the conceptual design of a generic mediating model is discussed. First, we provide
a definition for the mediating variable.
Definition 4-1 Mediating Variable
A mediating variable is “a variable with a mediating effect that is based on the extent to which it accounts for the relationship between the independent variable and the dependent variable”. (cf. Baron & Kenny, 1986)

66 The Conceptual Model
So, mediation takes place in relation with A and B. The path diagram in Figure 4-1 depicts a basic
mediating relationship.
Figure 4-1 assumes a three-variable model with two causal paths feeding into the outcome variable
(Path “b” and Path “c”). The following four conditions must be satisfied.
1. Path “a” is significant. Variation in the predictor variable should significantly affect the
variations in the mediator variable.
2. Path “c” is initially significant. Variation in the predictor variable must significantly affect
the variation in the outcome.
3. When paths “a” and “b” are controlled:
i. Path “c” has (preferably) less effect than its initial effect.
ii. Path “b” must be significant.
Under a controlled scenario, a complete reduction of path “c” to zero indicates a single strong acting
mediator. Otherwise, if path “c” remains at a statistically significant level, it indicates the presence
of multiple mediating factors.
4.1.2 The Moderating Model
Below we provide a background concerning the conceptual design of a generic moderating model. It
will be explored using the descriptive path diagram method. The discussion will include the needed
conditions in order to satisfy the moderating status of a given concept (variable). We start by
providing a formal definition of a moderating variable.
Definition 4-2 Moderating Variable
A moderating variable is defined as “a qualitative or a quantitative variable that affects the direction and/or strength of the relationship between an independent variable (also called a predictor) and a dependent or variable (also called a criterion)”. (Baron & Kenny, 1986)
A: Predictor B: Outcome
Mediator
Path “a” Path “b”
Path “c”
Figure 4-1 Path diagram for the basic casual chain of a mediator model Adopted from Baron & Kenny (1986, p.1176)
From IT Business Strategic Alignment to Performance 67
In ANOVA terms a moderating effect is expressed as the interaction of two variables, the independent
variable and another variable. This interaction provides for conditions that allow the “other” variable
to enforce (or even reverse) a relationship between the independent variable and the dependent
variable(s).
A path diagram is a common method of describing both the correlational and experimental views of
a moderating variable. Figure 4-3 depicts the path diagram of a moderating relationship. There are
three causal paths that point into the outcome variable: (1) the predictor (independent variable) (path
a), (2) the moderator (path b), and (3) the product of these two (path c). Moderation assumes that a
relation between the two given variables (in this case the predictor and the outcome) changes as a
function of the moderator. So, moderation takes place on the relation between A and B (see Figure
4-2).
In order to show a moderating effect, Baron & Kenny (1996) suggest the application of a series of
regression analyses in which the outcome (dependent) variable is regressed simultaneously over (1)
the predictor, (2) the moderator, and (3) the product of the predictor and the moderator. For the
moderating test to hold, the product variable (along the path c) must be statistically significant.
Figure 4-3 Path diagram for testing a moderating effect Adopted from Glass & Singer (1972) in Baron & Kenny (1986)
a
c
b Outcome
Predictor
Moderator
Predictor X
Moderator
A
Moderator
B
Figure 4-2 The conceptual depiction of a moderating

Cha
pter
4
66 The Conceptual Model
So, mediation takes place in relation with A and B. The path diagram in Figure 4-1 depicts a basic
mediating relationship.
Figure 4-1 assumes a three-variable model with two causal paths feeding into the outcome variable
(Path “b” and Path “c”). The following four conditions must be satisfied.
1. Path “a” is significant. Variation in the predictor variable should significantly affect the
variations in the mediator variable.
2. Path “c” is initially significant. Variation in the predictor variable must significantly affect
the variation in the outcome.
3. When paths “a” and “b” are controlled:
i. Path “c” has (preferably) less effect than its initial effect.
ii. Path “b” must be significant.
Under a controlled scenario, a complete reduction of path “c” to zero indicates a single strong acting
mediator. Otherwise, if path “c” remains at a statistically significant level, it indicates the presence
of multiple mediating factors.
4.1.2 The Moderating Model
Below we provide a background concerning the conceptual design of a generic moderating model. It
will be explored using the descriptive path diagram method. The discussion will include the needed
conditions in order to satisfy the moderating status of a given concept (variable). We start by
providing a formal definition of a moderating variable.
Definition 4-2 Moderating Variable
A moderating variable is defined as “a qualitative or a quantitative variable that affects the direction and/or strength of the relationship between an independent variable (also called a predictor) and a dependent or variable (also called a criterion)”. (Baron & Kenny, 1986)
A: Predictor B: Outcome
Mediator
Path “a” Path “b”
Path “c”
Figure 4-1 Path diagram for the basic casual chain of a mediator model Adopted from Baron & Kenny (1986, p.1176)
From IT Business Strategic Alignment to Performance 67
In ANOVA terms a moderating effect is expressed as the interaction of two variables, the independent
variable and another variable. This interaction provides for conditions that allow the “other” variable
to enforce (or even reverse) a relationship between the independent variable and the dependent
variable(s).
A path diagram is a common method of describing both the correlational and experimental views of
a moderating variable. Figure 4-3 depicts the path diagram of a moderating relationship. There are
three causal paths that point into the outcome variable: (1) the predictor (independent variable) (path
a), (2) the moderator (path b), and (3) the product of these two (path c). Moderation assumes that a
relation between the two given variables (in this case the predictor and the outcome) changes as a
function of the moderator. So, moderation takes place on the relation between A and B (see Figure
4-2).
In order to show a moderating effect, Baron & Kenny (1996) suggest the application of a series of
regression analyses in which the outcome (dependent) variable is regressed simultaneously over (1)
the predictor, (2) the moderator, and (3) the product of the predictor and the moderator. For the
moderating test to hold, the product variable (along the path c) must be statistically significant.
Figure 4-3 Path diagram for testing a moderating effect Adopted from Glass & Singer (1972) in Baron & Kenny (1986)
a
c
b Outcome
Predictor
Moderator
Predictor X
Moderator
A
Moderator
B
Figure 4-2 The conceptual depiction of a moderating

68 The Conceptual Model
4.2 The Significance of the Departmental-Level Analysis
In section 1.4 we have mentioned that the firm-level data are too aggregate to make a reasonable
examination of the innovative activities of the firm. Since we believe that most of the innovative
activities appear at the departmental level, we will use two approaches to emphasize the importance
of the departmental-level contributions to a firm’s performance. The approaches are: (1) The
Balanced Score Card (BSC) strategic framework which shows the critical dependence on the
departmental level in achieving strategic goals, and (2) the IT engagement model by Fonstad (2006).
In order to avoid a possible confusion, I would like to clarify the notion of “department”. In this
thesis, “department” refers to a component of a hierarchical structure such as marketing, training, or
finance. Some international firms refer to those components as “business units”. All firms that
participated in our study had a unified naming, namely, “department”. Moreover, I would like to
emphasize that all firms in our study had a classical hierarchical structure with standard departments
such as human resources, marketing, and accounting. Naturally, some organizations had their
operation-specific departments. For example, the department of foreign exchange in the banking
industry, and the department of catering in the oil industry. Yet, the notion of department remained
unified. I stress here that none of the organizations had a working-group based structure, nor was any
of those organizations structured as a flat or networked organization.
4.2.1 The BSC and the Importance of the Departmental Level
The Balanced Score Card (BSC) as a strategic performance management framework was introduced
by Kaplan and Norton (1992). They have defined the Balanced Score Card framework as follows.
Definition 4-3 The Balanced Score Card (BSC)
The Balanced Score Card is defined as “A framework to facilitate the translation of the business strategy into controllable performance measures”. (Kaplan & Norton, 1992)
Initially, in 1992 Kaplan and Norton introduced the BSC at the enterprise level emphasizing that
firms should not restrict their performance evaluation to the financial dimension. In their view, the
performance management and the performance measurement should include aspects such as
customer satisfaction, internal processes, and innovation activities. The four main dimensions (called
perspectives) of a Balanced Score Card framework are as follows. Below we mention the perspective
and the focus question.
From IT Business Strategic Alignment to Performance 69
1. Learning & growth perspective
How can we continue to improve, to grow and to create value?
2. Internal processes perspective (later called Business perspective)
Where must we excel?
3. Customer perspective
How do our customers see us?
4. Financial perspective
How do we look to our shareholders?
Figure 4-4 depicts the three casual relations among the perspectives. IT tells the following story in
three steps.
1. If we are a learning organization and have satisfied employees, we will excel in our
internal processes (which are closely related to the business perspectives).
2. If our internal processes are effective, we will provide a good service/product to our
customers (i.e., our business runs well).
3. Satisfied customers will lead to a financial success of the organization making our
stakeholders happy, which is the ultimate goal of our efforts.
We show the importance of the departmental-level performance on the organizational growth through
the mechanics of cascading the BSC objectives top-down and bottom-up as they were proposed by
the original authors (Kaplan & Norton, 1992) (see Figure 4-5).
During the design and implementation stage, the BSC is initially designed at the senior-management
level with broad (enterprise-level) strategic objectives. In order for the BSC framework to achieve its
goals of translating strategy into action (as the authors claim) it is necessary for the BSC to be
cascaded down from the top enterprise level to all business departments (units), such as IT,
manufacturing, and marketing. By this process all business units within the organization contribute
by upward activities to the execution of the organizational top-level strategy. Figure 4-5 shows an
example of two business units A & B.

Cha
pter
4
68 The Conceptual Model
4.2 The Significance of the Departmental-Level Analysis
In section 1.4 we have mentioned that the firm-level data are too aggregate to make a reasonable
examination of the innovative activities of the firm. Since we believe that most of the innovative
activities appear at the departmental level, we will use two approaches to emphasize the importance
of the departmental-level contributions to a firm’s performance. The approaches are: (1) The
Balanced Score Card (BSC) strategic framework which shows the critical dependence on the
departmental level in achieving strategic goals, and (2) the IT engagement model by Fonstad (2006).
In order to avoid a possible confusion, I would like to clarify the notion of “department”. In this
thesis, “department” refers to a component of a hierarchical structure such as marketing, training, or
finance. Some international firms refer to those components as “business units”. All firms that
participated in our study had a unified naming, namely, “department”. Moreover, I would like to
emphasize that all firms in our study had a classical hierarchical structure with standard departments
such as human resources, marketing, and accounting. Naturally, some organizations had their
operation-specific departments. For example, the department of foreign exchange in the banking
industry, and the department of catering in the oil industry. Yet, the notion of department remained
unified. I stress here that none of the organizations had a working-group based structure, nor was any
of those organizations structured as a flat or networked organization.
4.2.1 The BSC and the Importance of the Departmental Level
The Balanced Score Card (BSC) as a strategic performance management framework was introduced
by Kaplan and Norton (1992). They have defined the Balanced Score Card framework as follows.
Definition 4-3 The Balanced Score Card (BSC)
The Balanced Score Card is defined as “A framework to facilitate the translation of the business strategy into controllable performance measures”. (Kaplan & Norton, 1992)
Initially, in 1992 Kaplan and Norton introduced the BSC at the enterprise level emphasizing that
firms should not restrict their performance evaluation to the financial dimension. In their view, the
performance management and the performance measurement should include aspects such as
customer satisfaction, internal processes, and innovation activities. The four main dimensions (called
perspectives) of a Balanced Score Card framework are as follows. Below we mention the perspective
and the focus question.
From IT Business Strategic Alignment to Performance 69
1. Learning & growth perspective
How can we continue to improve, to grow and to create value?
2. Internal processes perspective (later called Business perspective)
Where must we excel?
3. Customer perspective
How do our customers see us?
4. Financial perspective
How do we look to our shareholders?
Figure 4-4 depicts the three casual relations among the perspectives. IT tells the following story in
three steps.
1. If we are a learning organization and have satisfied employees, we will excel in our
internal processes (which are closely related to the business perspectives).
2. If our internal processes are effective, we will provide a good service/product to our
customers (i.e., our business runs well).
3. Satisfied customers will lead to a financial success of the organization making our
stakeholders happy, which is the ultimate goal of our efforts.
We show the importance of the departmental-level performance on the organizational growth through
the mechanics of cascading the BSC objectives top-down and bottom-up as they were proposed by
the original authors (Kaplan & Norton, 1992) (see Figure 4-5).
During the design and implementation stage, the BSC is initially designed at the senior-management
level with broad (enterprise-level) strategic objectives. In order for the BSC framework to achieve its
goals of translating strategy into action (as the authors claim) it is necessary for the BSC to be
cascaded down from the top enterprise level to all business departments (units), such as IT,
manufacturing, and marketing. By this process all business units within the organization contribute
by upward activities to the execution of the organizational top-level strategy. Figure 4-5 shows an
example of two business units A & B.

70 The Conceptual Model
The cascading process basically creates a link between the strategic objectives at the departmental
level (the unit level in BSC terminology) and the overall business objectives. The strategic objectives
and measures of all departmental levels must be able to roll up the hierarchical ladder in a logical
manner and eventually become aggregated into the top-level business objectives and measures.
For example, if at the corporate (senior) BSC level there is a strategic objective in the customer
perspective (the upper left part of Figure 4-5) stating: “increase customer loyalty”, it can only be
achieved if the lower level departments (business units) also adopt objectives which in their own
specialization lead to increased customer loyalty. Therefore, a lower level department, such as for
example a customer service department (depicted as business unit A in Figure 4-5), might adopt a
strategic objective in their customer perspective which states: “redesign customer service processes”,
i.e., an increase in customer loyalty for the corporation can be achieved through (among other factors)
a business process re-design by the customer service department.
It is not a pre-condition that we match Perspectives from corporate to departmental level for the
cascade of strategic objectives to be successful. The question is: how to effectively align them? As
an illustration, we assume that a strategic objective at the corporate level in the business processes
perspective states: “transform to enterprise level IT architecture”. At the level of the IT department
(e.g., the business unit A in Figure 4-5), with respect to their learning and growth perspective, there
might be a strategic objective stating: “improve the programmer’s knowledge of enterprise-level
system design”. This objective at the IT department level will have the effect of achieving the strategic
Learning & Growth Perspective
Internal Processes Perspective
Customer Perspective
Financial Perspective
THE VISION
Figure 4-4 The causal relationship in the BSC framework
From IT Business Strategic Alignment to Performance 71
objective at the corporate level (depicted by the red arrow from the learning and growth perspective
of the business unit A to the business process perspective at the corporate level).
As a result, it is the value delivered by lower-level departments that creates the overall business value
at the upper levels. Hence, there is a value rollup from the lower business levels up to the corporate
level without which, the organizational goals cannot be realized (depicted by the red arrows in Figure
4-5).
Figure 4-5 Cascading the Balanced Score Card to the departmental level Source: http://www.virtualtravelog.net/
A study conducted in Dutch business-to-business firms found that the BSC affects organizational
performance only if the performance measures and objectives are aligned, i.e., in order to create
positive value at higher levels of organizational levels, the BSC of the corporate and functional
managers must be strategically aligned (see Kaplan & Norton, 1992; Braam & Nijssen, 2004; Wu,
2012).
The authors of the Dutch study (Braam & Nijssen, 2004) explain that the organization has made three
attempts to implement a BSC system, only the third time it was successful. They justify the eventual
success to several factors, with the main factor being the use of multi-departmental project teams that
created involvement from different functional areas. This reasoning clearly shows the critical
contribution of the departmental level success to the overall organizational value. Hence, it
emphasizes the importance of the departmental level analysis.

Cha
pter
4
70 The Conceptual Model
The cascading process basically creates a link between the strategic objectives at the departmental
level (the unit level in BSC terminology) and the overall business objectives. The strategic objectives
and measures of all departmental levels must be able to roll up the hierarchical ladder in a logical
manner and eventually become aggregated into the top-level business objectives and measures.
For example, if at the corporate (senior) BSC level there is a strategic objective in the customer
perspective (the upper left part of Figure 4-5) stating: “increase customer loyalty”, it can only be
achieved if the lower level departments (business units) also adopt objectives which in their own
specialization lead to increased customer loyalty. Therefore, a lower level department, such as for
example a customer service department (depicted as business unit A in Figure 4-5), might adopt a
strategic objective in their customer perspective which states: “redesign customer service processes”,
i.e., an increase in customer loyalty for the corporation can be achieved through (among other factors)
a business process re-design by the customer service department.
It is not a pre-condition that we match Perspectives from corporate to departmental level for the
cascade of strategic objectives to be successful. The question is: how to effectively align them? As
an illustration, we assume that a strategic objective at the corporate level in the business processes
perspective states: “transform to enterprise level IT architecture”. At the level of the IT department
(e.g., the business unit A in Figure 4-5), with respect to their learning and growth perspective, there
might be a strategic objective stating: “improve the programmer’s knowledge of enterprise-level
system design”. This objective at the IT department level will have the effect of achieving the strategic
Learning & Growth Perspective
Internal Processes Perspective
Customer Perspective
Financial Perspective
THE VISION
Figure 4-4 The causal relationship in the BSC framework
From IT Business Strategic Alignment to Performance 71
objective at the corporate level (depicted by the red arrow from the learning and growth perspective
of the business unit A to the business process perspective at the corporate level).
As a result, it is the value delivered by lower-level departments that creates the overall business value
at the upper levels. Hence, there is a value rollup from the lower business levels up to the corporate
level without which, the organizational goals cannot be realized (depicted by the red arrows in Figure
4-5).
Figure 4-5 Cascading the Balanced Score Card to the departmental level Source: http://www.virtualtravelog.net/
A study conducted in Dutch business-to-business firms found that the BSC affects organizational
performance only if the performance measures and objectives are aligned, i.e., in order to create
positive value at higher levels of organizational levels, the BSC of the corporate and functional
managers must be strategically aligned (see Kaplan & Norton, 1992; Braam & Nijssen, 2004; Wu,
2012).
The authors of the Dutch study (Braam & Nijssen, 2004) explain that the organization has made three
attempts to implement a BSC system, only the third time it was successful. They justify the eventual
success to several factors, with the main factor being the use of multi-departmental project teams that
created involvement from different functional areas. This reasoning clearly shows the critical
contribution of the departmental level success to the overall organizational value. Hence, it
emphasizes the importance of the departmental level analysis.

72 The Conceptual Model
4.2.2 The IT Engagement Model
IT governance is by itself a top-down activity. However, IT governance research simultaneously is a
top-down and bottom-up approach. It is a top-down approach by focusing on the decision making by
the senior management. It is a bottom-up approach by focusing on pure project-oriented activities,
viz. how projects are managed. MIT’s Center for Information Systems Research (CISR) has
emphasized a multi directional approach. In their description two main goals are emphasized, (a) the
alignment between IT and the other business units, and (b) the alignment and coordination among
multiple organizational levels. This emphasis is depicted in the IT engagement model by Fonstad &
Roberston (2006) which is discussed below.
Fonstad & Roberston (2006) have described the linking mechanisms of the three main organizational
levels, namely, the corporate level, the business unit level, and the project team level (see Figure 4-7,
the right column). At those three levels, their model is concerned with three main components: (a)
Company-wide IT governance component (which points to the decision making process at all
organizational levels to stimulate appropriate IT-related behavior), (b) project management activities
component (which describe the achievement of corporate objectives through effective resource and
activities coordination), and (c) linking mechanisms component (which create linkages at the
business, IT, and cross business-IT levels as will be described in the following paragraphs), see the
center column of Figure 4-6.
The focus of the IT engagement model is on the linking mechanisms component which performs the
function of facilitating information flow between and within the three organizational levels
(corporate, business, and project levels). The basic concept of their model lies in the proposition that
for an organization to succeed simultaneously in all organizational strategies, as well as in the
managing of the implementation of local IT solutions, it must introduce two critical factors (1)
horizontal alignment and (2) vertical alignment. Horizontal alignment means a successful
coordination among the IT department and the other departments of the organization. Vertical
alignment means an effective coordination across the three organizational levels.
From IT Business Strategic Alignment to Performance 73
Figure 4-6 IT engagement model components Adopted from Fonsted & Roberston (2006)
In order to achieve both horizontal and vertical alignment, three main types of linkages must be
implemented.
(1) Business linkages. Are depicted as the upper left column of Figure 4-7. The business linkages
mean linking the three non-IT organizational levels and making decisions regarding: program
prioritization, post implementation reviews, company-wide objectives setting.
(2) Architecture linkages. Are depicted at the lower right column of Figure 4-7. The architectural
linkages represent the IT-based physical linkages that satisfy the IT-demanding connections
among the three organizational levels. The architectural linkages include activities such as
monthly technology reviews and architectural compliance reviews.
(3) Alignment linkages. Create a horizontal interdepartmental alignment between the IT department
and the other departments of the organization at a single level; see the central horizontal line in
Figure 4-7.
Figure 4-7 IT engagement model linkages Adopted from Fonsted & Roberston (2006)

Cha
pter
4
72 The Conceptual Model
4.2.2 The IT Engagement Model
IT governance is by itself a top-down activity. However, IT governance research simultaneously is a
top-down and bottom-up approach. It is a top-down approach by focusing on the decision making by
the senior management. It is a bottom-up approach by focusing on pure project-oriented activities,
viz. how projects are managed. MIT’s Center for Information Systems Research (CISR) has
emphasized a multi directional approach. In their description two main goals are emphasized, (a) the
alignment between IT and the other business units, and (b) the alignment and coordination among
multiple organizational levels. This emphasis is depicted in the IT engagement model by Fonstad &
Roberston (2006) which is discussed below.
Fonstad & Roberston (2006) have described the linking mechanisms of the three main organizational
levels, namely, the corporate level, the business unit level, and the project team level (see Figure 4-7,
the right column). At those three levels, their model is concerned with three main components: (a)
Company-wide IT governance component (which points to the decision making process at all
organizational levels to stimulate appropriate IT-related behavior), (b) project management activities
component (which describe the achievement of corporate objectives through effective resource and
activities coordination), and (c) linking mechanisms component (which create linkages at the
business, IT, and cross business-IT levels as will be described in the following paragraphs), see the
center column of Figure 4-6.
The focus of the IT engagement model is on the linking mechanisms component which performs the
function of facilitating information flow between and within the three organizational levels
(corporate, business, and project levels). The basic concept of their model lies in the proposition that
for an organization to succeed simultaneously in all organizational strategies, as well as in the
managing of the implementation of local IT solutions, it must introduce two critical factors (1)
horizontal alignment and (2) vertical alignment. Horizontal alignment means a successful
coordination among the IT department and the other departments of the organization. Vertical
alignment means an effective coordination across the three organizational levels.
From IT Business Strategic Alignment to Performance 73
Figure 4-6 IT engagement model components Adopted from Fonsted & Roberston (2006)
In order to achieve both horizontal and vertical alignment, three main types of linkages must be
implemented.
(1) Business linkages. Are depicted as the upper left column of Figure 4-7. The business linkages
mean linking the three non-IT organizational levels and making decisions regarding: program
prioritization, post implementation reviews, company-wide objectives setting.
(2) Architecture linkages. Are depicted at the lower right column of Figure 4-7. The architectural
linkages represent the IT-based physical linkages that satisfy the IT-demanding connections
among the three organizational levels. The architectural linkages include activities such as
monthly technology reviews and architectural compliance reviews.
(3) Alignment linkages. Create a horizontal interdepartmental alignment between the IT department
and the other departments of the organization at a single level; see the central horizontal line in
Figure 4-7.
Figure 4-7 IT engagement model linkages Adopted from Fonsted & Roberston (2006)

74 The Conceptual Model
The IT engagement model emphasized the two critical roles played by the Business-Unit level in the
alignment process. (a) It aids in aligning the IT and non-IT organizational levels, and (b) it is a critical
link between the project team level and the corporate level assuring an effective project execution.
In conclusion, the discussion of the BSC and IT-engagement models has emphasized the importance
of the departmental level (called the Business-Unit level in the IT engagement model) for an effective
organizational value creation. Hence, we have decided (as initially mentioned in Chapter 1) to base
our investigation on “single departments” as our unit of analysis, with the aim to reach specific and
realistic results.
4.3 Criteria and Selection of the Model
This section starts developing our conceptual model. We do so in three steps. First, in subsection
4.3.1, we develop an initial mediating model that depicts the following relationships: (a) the direct
relationship between ITBSA and SIW, (b) the direct relationship between SIW and departmental
performance, and (c) the mediating effect of SIW on the relationship between ITBSA and
departmental performance. The aim of this initial conceptual model is to set the stage for the main
model of this thesis. Second, in subsection 4.3.2 we describe the various positionings of EGIT on the
relationship between ITBSA and departmental performance. And third, in subsection 4.3.3 we justify
our choice of the moderating positioning of EGIT on the relationship between ITBSA and
performance.
4.3.1 The Base Model ITBSA, SIW, and Performance
In this subsection, we develop a base model that will be used to answer research questions: RQ1,
RQ2, and RQ3. It will also set the stage for the moderating model that will answer RQ4. For
readability, we repeat the RQs and the model (with the relation between the two actors mentioned in
the RQs).
RQ1: What is the effect of IT Business Strategic Alignment on Social Innovation at Work at the
departmental level?
RQ1 is concerned with the relationship between ITBSA and SIW. The first building block of our
model (see Figure 4-8) will investigate the direct relationship between ITBSA and SIW.
From IT Business Strategic Alignment to Performance 75
RQ2: What is the role of Inter-Departmental collaboration on Social Innovation at Work (SIW) on
the departmental performance?
So, RQ2 is inquiring about the relationship between SIW and departmental performance. It is the
second building block of our mediating model. It will investigate the direct relationship between SIW
and performance (see Figure 4-9). There is a group of researchers who believe in a strong positive
relation, as well as an opposing group of researchers who do not see the strong positive relation (see
subsection 3.2.3).
RQ3: How does the Social Innovation at Work at the departmental level affect the relationship
between the ITBSA and departmental performance?
RQ3 is inquiring about the nature of the effect of SIW on the relationship between ITBSA and
performance. IT is the third building block of our mediating model. It will investigate the mediating
effect of SIW on the ITBSA-performance relationship. At first glance, the relations between the actors
of our full initial mediating model would look as suggested in the model in Figure 4-10.
However, in Figure 4-10 we miss the exact form of a mediating model depicting the assumed relation
between ITBSA and performance. So, we reformulate the model as a mediating model in a formal
form as defined by Baron and Kenny (1986). The result is depicted in Figure 4-11.
RQ1, RQ2, and RQ3 lead to the following base model.
ITBSA SIW
Figure 4-8 Conceptual Model: ITBSA – SIW relationship
Performance SIW
Figure 4-9 Conceptual Model: the SIW-Performance relationship – RQ2
Performance ITBSA SIW
Figure 4-10 Conceptual Model: the mediating effect of SIW

Cha
pter
4
74 The Conceptual Model
The IT engagement model emphasized the two critical roles played by the Business-Unit level in the
alignment process. (a) It aids in aligning the IT and non-IT organizational levels, and (b) it is a critical
link between the project team level and the corporate level assuring an effective project execution.
In conclusion, the discussion of the BSC and IT-engagement models has emphasized the importance
of the departmental level (called the Business-Unit level in the IT engagement model) for an effective
organizational value creation. Hence, we have decided (as initially mentioned in Chapter 1) to base
our investigation on “single departments” as our unit of analysis, with the aim to reach specific and
realistic results.
4.3 Criteria and Selection of the Model
This section starts developing our conceptual model. We do so in three steps. First, in subsection
4.3.1, we develop an initial mediating model that depicts the following relationships: (a) the direct
relationship between ITBSA and SIW, (b) the direct relationship between SIW and departmental
performance, and (c) the mediating effect of SIW on the relationship between ITBSA and
departmental performance. The aim of this initial conceptual model is to set the stage for the main
model of this thesis. Second, in subsection 4.3.2 we describe the various positionings of EGIT on the
relationship between ITBSA and departmental performance. And third, in subsection 4.3.3 we justify
our choice of the moderating positioning of EGIT on the relationship between ITBSA and
performance.
4.3.1 The Base Model ITBSA, SIW, and Performance
In this subsection, we develop a base model that will be used to answer research questions: RQ1,
RQ2, and RQ3. It will also set the stage for the moderating model that will answer RQ4. For
readability, we repeat the RQs and the model (with the relation between the two actors mentioned in
the RQs).
RQ1: What is the effect of IT Business Strategic Alignment on Social Innovation at Work at the
departmental level?
RQ1 is concerned with the relationship between ITBSA and SIW. The first building block of our
model (see Figure 4-8) will investigate the direct relationship between ITBSA and SIW.
From IT Business Strategic Alignment to Performance 75
RQ2: What is the role of Inter-Departmental collaboration on Social Innovation at Work (SIW) on
the departmental performance?
So, RQ2 is inquiring about the relationship between SIW and departmental performance. It is the
second building block of our mediating model. It will investigate the direct relationship between SIW
and performance (see Figure 4-9). There is a group of researchers who believe in a strong positive
relation, as well as an opposing group of researchers who do not see the strong positive relation (see
subsection 3.2.3).
RQ3: How does the Social Innovation at Work at the departmental level affect the relationship
between the ITBSA and departmental performance?
RQ3 is inquiring about the nature of the effect of SIW on the relationship between ITBSA and
performance. IT is the third building block of our mediating model. It will investigate the mediating
effect of SIW on the ITBSA-performance relationship. At first glance, the relations between the actors
of our full initial mediating model would look as suggested in the model in Figure 4-10.
However, in Figure 4-10 we miss the exact form of a mediating model depicting the assumed relation
between ITBSA and performance. So, we reformulate the model as a mediating model in a formal
form as defined by Baron and Kenny (1986). The result is depicted in Figure 4-11.
RQ1, RQ2, and RQ3 lead to the following base model.
ITBSA SIW
Figure 4-8 Conceptual Model: ITBSA – SIW relationship
Performance SIW
Figure 4-9 Conceptual Model: the SIW-Performance relationship – RQ2
Performance ITBSA SIW
Figure 4-10 Conceptual Model: the mediating effect of SIW

76 The Conceptual Model
4.3.2 Incorporation of EGIT into the Base Model
In this subsection, we start incorporating the EGIT construct into the base model in order to answer
RQ4 (the final complex model will be constructed in section 4.4). We initially show positioning of
EGIT among the relationship between ITBSA and performance in the literature, then we make our
choice with a justification. For clarity, we restate RQ4.
RQ4: How does EGIT affect the relationship between ITBSA and Performance at the departmental
level?
Scholars have developed wide range of models showing IT as adding business value through ITBSA
and EGIT (see, e.g., Silva et al., 2006; Beimborn et al., 2009; Chang et al., 2011; Laudon, & Laudon,
2014; Wu et al., 2015). Before we make and justify our choice of EGIT’s position in our base model,
we narrow the models in the literature to the three following representative models.
Model 1 maps the direct relationship between ITBSA and performance with the EGIT in the
position of an antecedent to ITBSA.
Model 2 shows a mediating relationship of EGIT on the relationship between ITBSA and
performance.
Model 3 shows a moderating relationship of EGIT on the relationship between ITBSA and
performance.
Model 1: EGIT as an antecedent of ITBSA
A study by De Haes & Van Grembergen (2009) has explored the following significant research
question: “What is the specific relationship between ITBSA and EGIT on the path to performance?”
In their study, they indicate that alignment is a complex and ambiguous concept. This was earlier
mentioned by others, such as Silva et al. (2006). In their model De Haes & Van Grembergen focused
on combining both strategic and operational processes. According to their view, they have modeled
governance (processes, structures, and relational mechanisms) as antecedents to alignment (see
ITBSA
SIW At the departmental
Level
Departmental Performance
Figure 4-11 Conceptual Model: the formal mediating model of SIW
From IT Business Strategic Alignment to Performance 77
Figure 4-12). De Haes and Van Grembergen (2009) found a weak relationship between relational
mechanisms and alignment. On that basis, they concluded that there appears to be some relationship
with processes and structures; with processes being more difficult to realize than structures. A similar
conceptual model was explored by Chan et al. (2006), but instead, they have used a shared domain
of knowledge and prior IT success as a conceptualization of EGIT. In their model, EGIT is also
considered an antecedent to ITBSA. Similar conceptual models have been recently explored by Wu
et al., (2015) who have operationalized the EGIT concept as IT mechanisms, and have also found a
positive mediating relationship of ITBSA on the relationship between EGIT and perforance at the
organizational level. The conceptual model of those studies is described in Figure 4-12.
For reasons mentioned later in this subsection, we do not continue the exploration of this conceptual
model.
Model 2: EGIT as a Mediator between ITBSA and Performance
Zhou et al. (2008) have investigated a positive mediating effect of Enterprise Information
Management. In their model, the conceptualization of EGIT is placed between strategic alignment
and operational performance. They found a positive effect. Similar results were confirmed by
Beimborn et al. (2009). The conceptual model of both studies is shown in Figure 4-13.
Model 3: EGIT as a moderator between ITBSA and Performance
A moderating model has been proposed by Chang et al. (2011). They have studied the moderating
effect of the service-integration level on the relationship between ITBSA and performance. The
essence of their model lies in the fact that the authors did not look at the model as a linear model in
one dimension, but as a model in two dimensions. In their model, they propose a moderating effect
of EGIT on the relationship between ITBSA and performance (see Figure 4-13). The authors have
operationalized performance in terms of three categories: (1) customer satisfaction, (2) quick
Figure 4-13 Conceptual Model: the mediating effect of EGIT
EGIT
ITBSA Performance
Figure 4-12 Conceptual Model: EGIT as an antecedent to ITBSA
ITBSA
EGIT
Performance

Cha
pter
4
76 The Conceptual Model
4.3.2 Incorporation of EGIT into the Base Model
In this subsection, we start incorporating the EGIT construct into the base model in order to answer
RQ4 (the final complex model will be constructed in section 4.4). We initially show positioning of
EGIT among the relationship between ITBSA and performance in the literature, then we make our
choice with a justification. For clarity, we restate RQ4.
RQ4: How does EGIT affect the relationship between ITBSA and Performance at the departmental
level?
Scholars have developed wide range of models showing IT as adding business value through ITBSA
and EGIT (see, e.g., Silva et al., 2006; Beimborn et al., 2009; Chang et al., 2011; Laudon, & Laudon,
2014; Wu et al., 2015). Before we make and justify our choice of EGIT’s position in our base model,
we narrow the models in the literature to the three following representative models.
Model 1 maps the direct relationship between ITBSA and performance with the EGIT in the
position of an antecedent to ITBSA.
Model 2 shows a mediating relationship of EGIT on the relationship between ITBSA and
performance.
Model 3 shows a moderating relationship of EGIT on the relationship between ITBSA and
performance.
Model 1: EGIT as an antecedent of ITBSA
A study by De Haes & Van Grembergen (2009) has explored the following significant research
question: “What is the specific relationship between ITBSA and EGIT on the path to performance?”
In their study, they indicate that alignment is a complex and ambiguous concept. This was earlier
mentioned by others, such as Silva et al. (2006). In their model De Haes & Van Grembergen focused
on combining both strategic and operational processes. According to their view, they have modeled
governance (processes, structures, and relational mechanisms) as antecedents to alignment (see
ITBSA
SIW At the departmental
Level
Departmental Performance
Figure 4-11 Conceptual Model: the formal mediating model of SIW
From IT Business Strategic Alignment to Performance 77
Figure 4-12). De Haes and Van Grembergen (2009) found a weak relationship between relational
mechanisms and alignment. On that basis, they concluded that there appears to be some relationship
with processes and structures; with processes being more difficult to realize than structures. A similar
conceptual model was explored by Chan et al. (2006), but instead, they have used a shared domain
of knowledge and prior IT success as a conceptualization of EGIT. In their model, EGIT is also
considered an antecedent to ITBSA. Similar conceptual models have been recently explored by Wu
et al., (2015) who have operationalized the EGIT concept as IT mechanisms, and have also found a
positive mediating relationship of ITBSA on the relationship between EGIT and perforance at the
organizational level. The conceptual model of those studies is described in Figure 4-12.
For reasons mentioned later in this subsection, we do not continue the exploration of this conceptual
model.
Model 2: EGIT as a Mediator between ITBSA and Performance
Zhou et al. (2008) have investigated a positive mediating effect of Enterprise Information
Management. In their model, the conceptualization of EGIT is placed between strategic alignment
and operational performance. They found a positive effect. Similar results were confirmed by
Beimborn et al. (2009). The conceptual model of both studies is shown in Figure 4-13.
Model 3: EGIT as a moderator between ITBSA and Performance
A moderating model has been proposed by Chang et al. (2011). They have studied the moderating
effect of the service-integration level on the relationship between ITBSA and performance. The
essence of their model lies in the fact that the authors did not look at the model as a linear model in
one dimension, but as a model in two dimensions. In their model, they propose a moderating effect
of EGIT on the relationship between ITBSA and performance (see Figure 4-13). The authors have
operationalized performance in terms of three categories: (1) customer satisfaction, (2) quick
Figure 4-13 Conceptual Model: the mediating effect of EGIT
EGIT
ITBSA Performance
Figure 4-12 Conceptual Model: EGIT as an antecedent to ITBSA
ITBSA
EGIT
Performance
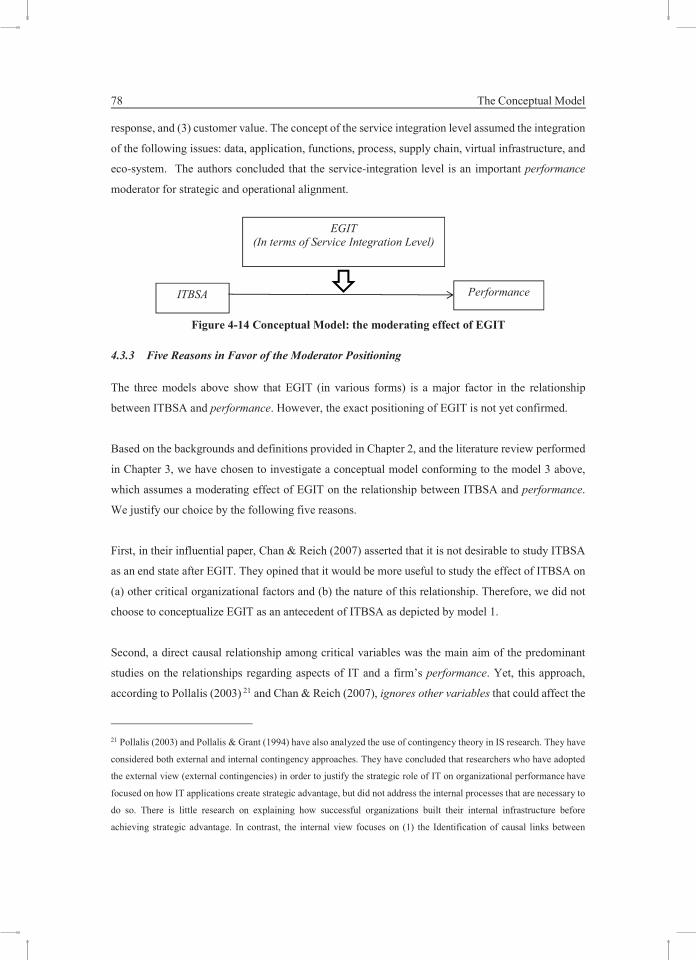
78 The Conceptual Model
response, and (3) customer value. The concept of the service integration level assumed the integration
of the following issues: data, application, functions, process, supply chain, virtual infrastructure, and
eco-system. The authors concluded that the service-integration level is an important performance
moderator for strategic and operational alignment.
4.3.3 Five Reasons in Favor of the Moderator Positioning
The three models above show that EGIT (in various forms) is a major factor in the relationship
between ITBSA and performance. However, the exact positioning of EGIT is not yet confirmed.
Based on the backgrounds and definitions provided in Chapter 2, and the literature review performed
in Chapter 3, we have chosen to investigate a conceptual model conforming to the model 3 above,
which assumes a moderating effect of EGIT on the relationship between ITBSA and performance.
We justify our choice by the following five reasons.
First, in their influential paper, Chan & Reich (2007) asserted that it is not desirable to study ITBSA
as an end state after EGIT. They opined that it would be more useful to study the effect of ITBSA on
(a) other critical organizational factors and (b) the nature of this relationship. Therefore, we did not
choose to conceptualize EGIT as an antecedent of ITBSA as depicted by model 1.
Second, a direct causal relationship among critical variables was the main aim of the predominant
studies on the relationships regarding aspects of IT and a firm’s performance. Yet, this approach,
according to Pollalis (2003) 21 and Chan & Reich (2007), ignores other variables that could affect the
21 Pollalis (2003) and Pollalis & Grant (1994) have also analyzed the use of contingency theory in IS research. They have
considered both external and internal contingency approaches. They have concluded that researchers who have adopted
the external view (external contingencies) in order to justify the strategic role of IT on organizational performance have
focused on how IT applications create strategic advantage, but did not address the internal processes that are necessary to
do so. There is little research on explaining how successful organizations built their internal infrastructure before
achieving strategic advantage. In contrast, the internal view focuses on (1) the Identification of causal links between
ITBSA
EGIT (In terms of Service Integration Level)
Performance
Figure 4-14 Conceptual Model: the moderating effect of EGIT
From IT Business Strategic Alignment to Performance 79
mode by which the studied variables interact. Researchers, such as Kraemer, Wilson, Fairburn, &
Agras (2002), insist on the fact that a moderation effect should be tested automatically with any
mediation analysis. More specifically, the idea of moderating variables affecting the relationship
between ITBSA and performance is supported by several authors (cf. Bergeron & Raymond, 1995;
Yayla & Hu, 2012; Alyahya & Suhaimi, 2013). So, for studying the effect of EGIT on the relationship
between ITBSA and performance, we prefer the moderating model 3 over the mediating model 2.
Third, the importance of a moderating effect on the organization has been mentioned by MacKinnon
(2011) who has proposed that in the cases where a moderating effect has been found, an organization
should focus its internal and/or external investments and innovations to where they are most effective.
Fourth, Tallon (2003) argued in his research that only 70% of the organizations experienced
significant performance improvement as a result of any ITBSA improvement. This implies the
presence of “other” factors affecting the relationship. For instance, the IT-engagement model by
Fonstad & Robertson (2006), as discussed in subsection 4.1.3, integrates the departmental
(horizontal) alignment with the (vertical) company-wide IT governance. The authors claim that
organizations with a higher level of governance obtain some 40% more value from IT. Similar results
were concluded by Gressgard, Amundsen, Aasen, & Hansen (2014) who have also found EGIT to
significantly enhance the effectiveness of IT tools. The presence of the dichotomy concept is
supported by Stoffers, Van der Heijden, & Notelaers (2014) who recommend the close association
between high performing organizations and higher levels of the situational (moderating) variables.
Fifth, in spite of the several encouragements in the literature, only a few studies have modeled
moderating variables that could have a significant effect on the causal relationship22 between ITBSA
and performance. Moreover, to the best knowledge of the researcher, there has not been a study at
the departmental level exploring the moderating effect of EGIT (in the form of processes, structures,
and relational mechanisms) on the relationship between ITBSA and performance.
From the models by Tallon and by Finstad & Robertson we derive two important conclusions that
influence our choice of a model. First, the inconsistence of the performance improvement (as a result
organizational variables and (2) on the challenge how IT’s effectiveness can improve the organizational performance.
This internal approach is adopted in our research.
22 For example, Masa'deh, Hunaiti, & Bani Yaseen (2008) have explored nine antecedents of IT’s fit factors and only one
performance mediating factor which was “Knowledge Management”.

Cha
pter
4
78 The Conceptual Model
response, and (3) customer value. The concept of the service integration level assumed the integration
of the following issues: data, application, functions, process, supply chain, virtual infrastructure, and
eco-system. The authors concluded that the service-integration level is an important performance
moderator for strategic and operational alignment.
4.3.3 Five Reasons in Favor of the Moderator Positioning
The three models above show that EGIT (in various forms) is a major factor in the relationship
between ITBSA and performance. However, the exact positioning of EGIT is not yet confirmed.
Based on the backgrounds and definitions provided in Chapter 2, and the literature review performed
in Chapter 3, we have chosen to investigate a conceptual model conforming to the model 3 above,
which assumes a moderating effect of EGIT on the relationship between ITBSA and performance.
We justify our choice by the following five reasons.
First, in their influential paper, Chan & Reich (2007) asserted that it is not desirable to study ITBSA
as an end state after EGIT. They opined that it would be more useful to study the effect of ITBSA on
(a) other critical organizational factors and (b) the nature of this relationship. Therefore, we did not
choose to conceptualize EGIT as an antecedent of ITBSA as depicted by model 1.
Second, a direct causal relationship among critical variables was the main aim of the predominant
studies on the relationships regarding aspects of IT and a firm’s performance. Yet, this approach,
according to Pollalis (2003) 21 and Chan & Reich (2007), ignores other variables that could affect the
21 Pollalis (2003) and Pollalis & Grant (1994) have also analyzed the use of contingency theory in IS research. They have
considered both external and internal contingency approaches. They have concluded that researchers who have adopted
the external view (external contingencies) in order to justify the strategic role of IT on organizational performance have
focused on how IT applications create strategic advantage, but did not address the internal processes that are necessary to
do so. There is little research on explaining how successful organizations built their internal infrastructure before
achieving strategic advantage. In contrast, the internal view focuses on (1) the Identification of causal links between
ITBSA
EGIT (In terms of Service Integration Level)
Performance
Figure 4-14 Conceptual Model: the moderating effect of EGIT
From IT Business Strategic Alignment to Performance 79
mode by which the studied variables interact. Researchers, such as Kraemer, Wilson, Fairburn, &
Agras (2002), insist on the fact that a moderation effect should be tested automatically with any
mediation analysis. More specifically, the idea of moderating variables affecting the relationship
between ITBSA and performance is supported by several authors (cf. Bergeron & Raymond, 1995;
Yayla & Hu, 2012; Alyahya & Suhaimi, 2013). So, for studying the effect of EGIT on the relationship
between ITBSA and performance, we prefer the moderating model 3 over the mediating model 2.
Third, the importance of a moderating effect on the organization has been mentioned by MacKinnon
(2011) who has proposed that in the cases where a moderating effect has been found, an organization
should focus its internal and/or external investments and innovations to where they are most effective.
Fourth, Tallon (2003) argued in his research that only 70% of the organizations experienced
significant performance improvement as a result of any ITBSA improvement. This implies the
presence of “other” factors affecting the relationship. For instance, the IT-engagement model by
Fonstad & Robertson (2006), as discussed in subsection 4.1.3, integrates the departmental
(horizontal) alignment with the (vertical) company-wide IT governance. The authors claim that
organizations with a higher level of governance obtain some 40% more value from IT. Similar results
were concluded by Gressgard, Amundsen, Aasen, & Hansen (2014) who have also found EGIT to
significantly enhance the effectiveness of IT tools. The presence of the dichotomy concept is
supported by Stoffers, Van der Heijden, & Notelaers (2014) who recommend the close association
between high performing organizations and higher levels of the situational (moderating) variables.
Fifth, in spite of the several encouragements in the literature, only a few studies have modeled
moderating variables that could have a significant effect on the causal relationship22 between ITBSA
and performance. Moreover, to the best knowledge of the researcher, there has not been a study at
the departmental level exploring the moderating effect of EGIT (in the form of processes, structures,
and relational mechanisms) on the relationship between ITBSA and performance.
From the models by Tallon and by Finstad & Robertson we derive two important conclusions that
influence our choice of a model. First, the inconsistence of the performance improvement (as a result
organizational variables and (2) on the challenge how IT’s effectiveness can improve the organizational performance.
This internal approach is adopted in our research.
22 For example, Masa'deh, Hunaiti, & Bani Yaseen (2008) have explored nine antecedents of IT’s fit factors and only one
performance mediating factor which was “Knowledge Management”.

80 The Conceptual Model
of ITBSA in the Tallon’s (2003) model) points to the presence of other variables in the environment
which moderate the relationship. Second, the dichotomous results by Fonstad & Robertson (2006)
model in terms of high and low levels of IT governance imply that the source of the moderating effect
could be situated in the EGIT. Therefore, we choose to study the moderating model of EGIT.
The proposed moderating influence of the EGIT on the mediating effect of SIW on the relationship
between ITBSA and performance (as mentioned in subsection 4.3.1) complicates the issue
considerably. The possible interaction between both effects (the mediating and the moderating
effects) should therefore be a subject of investigation. The next section, therefore, explores the issue
of complex models involving mediations and moderations in a single model.
4.4 How to Balance Mediation & Moderation
In section 4.3 we have identified two factors that act on the relation between ITBSA and performance,
namely, SIW and EGIT. Still, a critical question remains: is it a mediated moderation or a moderated
mediation relationship? In other words, we ask the question: which relationship precedes the other,
the mediation or the moderation?
There are two main forms by which a mediation and moderation could be jointly integrated into a
single model, (1) mediated moderation and (2) moderated mediation. There is an occasional
confusion between the two forms in literature (cf. Preacher, Rucker, & Hayes, 2007). Therefore, we
start showing some of the main differences between these two forms.
4.4.1 The Mediated Moderation
The mediated moderation model involves showing a moderating effect through an interaction effect
of variables such as “X” and “W” in (Figure 4-15) on the independent variable “Y”. Then, a mediating
variable (such as “M”) is introduced. This variable mediates the moderating effect of “W” onto the
independent variable “Y”, i.e., a moderation effect is mediated (cf. Muller, Judd, & Yzerbyt, 2005).
Paradoxically, the same diagram (Figure 4-15) is used to hypothesize both (a) a mediated moderation
and (b) a moderated mediation (cf. Preacher et al., 2007) as will be discussed in the following
paragraphs. The difference lays in what relationships are analyzed (as will be elaborated in Chapter
6).
From IT Business Strategic Alignment to Performance 81
Figure 4-15 Moderated mediation vs. mediated moderation
Adopted from Preacher et al. (2007, model 2, p.194), and Little, Card, Bovaird, Preacher, & Crandall (2007).
4.4.2 The Moderated Mediation
A plain introduction to the notion of moderated mediation is as follows. A moderated mediation
happens when the strength of an existing mediated relationship depends on the level of a third variable
(the moderator). In Figure 4-15, this means that the mediated relation between “X” and “Y” through
“M” is moderated by a variable such as “W”. In other words, the mediated relationship is always
present independently of the variable “W”. Yet, by the presence of a variable such as “W”, the
mediating relation is dependent upon the level of “W”.
4.4.3 Comparisons
Historically, there have been several calls by scholars to test the moderating effect in association with
all mediating relationships (see, e.g., James & Brett, 1984; Kraemer et al., 2002). This setup has been
gaining popularity in the examination of performance-related models involving mediation effects
(see, e.g., Tallon & Pinsonneault, 2011; Pratono, Wee, Syahchari, Nugraha, Kamariah, & Fitri, 2013;
Stoffers, I.J.M. Van der Heijden, & LA Notelaers, 2014; McCaughey, Turner, Kim, DelliFraine, &
McGhan, 2015; Shin et al., 2015).
We have initially proposed a mediating effect of SIW on the relationship between ITBSA and
performance (our base model). However, according to James & Brett (1984) and Kraemer et al.
(2002) all mediating models should be subject to a subsequent examination of a possible moderator
effect. Therefore, we will investigate a suggested moderating effect of EGIT on this mediating
relationship.
Yet, complex models attempt to explain both (a) how a given effect happens and (b) where a given
effect occurs (cf. Frone, 1999). According to the literature (cf. Preacher et al., 2007; Little et al., 2007)
the moderation effect of a given variable could act on any of the paths of the mediation model (e.g.,

Cha
pter
4
80 The Conceptual Model
of ITBSA in the Tallon’s (2003) model) points to the presence of other variables in the environment
which moderate the relationship. Second, the dichotomous results by Fonstad & Robertson (2006)
model in terms of high and low levels of IT governance imply that the source of the moderating effect
could be situated in the EGIT. Therefore, we choose to study the moderating model of EGIT.
The proposed moderating influence of the EGIT on the mediating effect of SIW on the relationship
between ITBSA and performance (as mentioned in subsection 4.3.1) complicates the issue
considerably. The possible interaction between both effects (the mediating and the moderating
effects) should therefore be a subject of investigation. The next section, therefore, explores the issue
of complex models involving mediations and moderations in a single model.
4.4 How to Balance Mediation & Moderation
In section 4.3 we have identified two factors that act on the relation between ITBSA and performance,
namely, SIW and EGIT. Still, a critical question remains: is it a mediated moderation or a moderated
mediation relationship? In other words, we ask the question: which relationship precedes the other,
the mediation or the moderation?
There are two main forms by which a mediation and moderation could be jointly integrated into a
single model, (1) mediated moderation and (2) moderated mediation. There is an occasional
confusion between the two forms in literature (cf. Preacher, Rucker, & Hayes, 2007). Therefore, we
start showing some of the main differences between these two forms.
4.4.1 The Mediated Moderation
The mediated moderation model involves showing a moderating effect through an interaction effect
of variables such as “X” and “W” in (Figure 4-15) on the independent variable “Y”. Then, a mediating
variable (such as “M”) is introduced. This variable mediates the moderating effect of “W” onto the
independent variable “Y”, i.e., a moderation effect is mediated (cf. Muller, Judd, & Yzerbyt, 2005).
Paradoxically, the same diagram (Figure 4-15) is used to hypothesize both (a) a mediated moderation
and (b) a moderated mediation (cf. Preacher et al., 2007) as will be discussed in the following
paragraphs. The difference lays in what relationships are analyzed (as will be elaborated in Chapter
6).
From IT Business Strategic Alignment to Performance 81
Figure 4-15 Moderated mediation vs. mediated moderation
Adopted from Preacher et al. (2007, model 2, p.194), and Little, Card, Bovaird, Preacher, & Crandall (2007).
4.4.2 The Moderated Mediation
A plain introduction to the notion of moderated mediation is as follows. A moderated mediation
happens when the strength of an existing mediated relationship depends on the level of a third variable
(the moderator). In Figure 4-15, this means that the mediated relation between “X” and “Y” through
“M” is moderated by a variable such as “W”. In other words, the mediated relationship is always
present independently of the variable “W”. Yet, by the presence of a variable such as “W”, the
mediating relation is dependent upon the level of “W”.
4.4.3 Comparisons
Historically, there have been several calls by scholars to test the moderating effect in association with
all mediating relationships (see, e.g., James & Brett, 1984; Kraemer et al., 2002). This setup has been
gaining popularity in the examination of performance-related models involving mediation effects
(see, e.g., Tallon & Pinsonneault, 2011; Pratono, Wee, Syahchari, Nugraha, Kamariah, & Fitri, 2013;
Stoffers, I.J.M. Van der Heijden, & LA Notelaers, 2014; McCaughey, Turner, Kim, DelliFraine, &
McGhan, 2015; Shin et al., 2015).
We have initially proposed a mediating effect of SIW on the relationship between ITBSA and
performance (our base model). However, according to James & Brett (1984) and Kraemer et al.
(2002) all mediating models should be subject to a subsequent examination of a possible moderator
effect. Therefore, we will investigate a suggested moderating effect of EGIT on this mediating
relationship.
Yet, complex models attempt to explain both (a) how a given effect happens and (b) where a given
effect occurs (cf. Frone, 1999). According to the literature (cf. Preacher et al., 2007; Little et al., 2007)
the moderation effect of a given variable could act on any of the paths of the mediation model (e.g.,

82 The Conceptual Model
paths a1 or b1 in Figure 4-15), i.e., there is a need to make an explicit assumption of which path of our
base model does the EGIT affect. In the next section, we explore the various forms of moderated
mediation models and arrive at a final conceptual model.
4.5 Our Conceptual Model
In this section, we develop our final conceptual model. In subsection 4.5.1 we present five most
commonly moderated mediation models. In subsection 4.5.2 we conclude our final conceptual model
by justifying our choice among the moderated mediation models presented in subsection 4.5.1.
4.5.1 Five combinations of Mediation and Moderation
There are at least five types of models by which the strength of a mediating relation is dependent on
a moderation variable and in terms of the nature and number of moderating variables. We mention
them below (see Table 4-1) with a brief description of each. From these, we will select in a later stage
our proposed moderated mediation model. We base the following discussion on Little et al. (2007)
and Preacher et al. (2007).
In the first type, the independent variable “X” affects (moderates) the relationship between the
mediator “M” and the dependent variable “Y” (i.e., affects the path “b”).
The second type introduces a new variable, such as “W”, which affects the path “a”, i.e., moderates
the relation between the independent variable and the mediator. This setting could also express a
“mediated moderation”, i.e., the variable “M” mediates the moderating effect of the variable “W”.
In the third type, an independent variable called “Z” affects (moderates) the relation between the
mediator and the independent variable (path “b”).
In the fourth type, two independent variables, “W” and “Z”, separately affect the paths “a” and “b”,
respectively.
In the fifth type, a single independent variable called “W” affects both paths “a” and “b”
simultaneously.
From IT Business Strategic Alignment to Performance 83
Model No.
Description Diagram
1 The independent variable “X” acts as a moderator to the path “b”.
2 A fourth variable ,e.g., “W” affects the path “a”.
3 A fourth variable ,e.g., “Z” affects the path “b”.
4 The variable “W” affects path “a”, and another variable ,e.g., “Z” affects the path “b”.
5 A variable ,e.g., “W” affects both paths “a” and “b”.
Table 4-1 Five types of complex models combining mediation and moderation Adopted from Little et al. (2007)
4.5.2 The Complete Conceptual Model
In our study, we assume the interaction of two relationships. (1) The relation between ITBSA and
performance is to be mediated by SIW (see Figure 4-11). (2) The relationship between ITBSA and
performance is to be moderated by EGIT. Hence, we have the case of one external variable acting as
a moderator to an assumed existing mediating relationship. Referring to subsections 3.3.2 and 3.3.3,
where we mentioned from the literature that (1) ITBSA and EGIT

Cha
pter
4
82 The Conceptual Model
paths a1 or b1 in Figure 4-15), i.e., there is a need to make an explicit assumption of which path of our
base model does the EGIT affect. In the next section, we explore the various forms of moderated
mediation models and arrive at a final conceptual model.
4.5 Our Conceptual Model
In this section, we develop our final conceptual model. In subsection 4.5.1 we present five most
commonly moderated mediation models. In subsection 4.5.2 we conclude our final conceptual model
by justifying our choice among the moderated mediation models presented in subsection 4.5.1.
4.5.1 Five combinations of Mediation and Moderation
There are at least five types of models by which the strength of a mediating relation is dependent on
a moderation variable and in terms of the nature and number of moderating variables. We mention
them below (see Table 4-1) with a brief description of each. From these, we will select in a later stage
our proposed moderated mediation model. We base the following discussion on Little et al. (2007)
and Preacher et al. (2007).
In the first type, the independent variable “X” affects (moderates) the relationship between the
mediator “M” and the dependent variable “Y” (i.e., affects the path “b”).
The second type introduces a new variable, such as “W”, which affects the path “a”, i.e., moderates
the relation between the independent variable and the mediator. This setting could also express a
“mediated moderation”, i.e., the variable “M” mediates the moderating effect of the variable “W”.
In the third type, an independent variable called “Z” affects (moderates) the relation between the
mediator and the independent variable (path “b”).
In the fourth type, two independent variables, “W” and “Z”, separately affect the paths “a” and “b”,
respectively.
In the fifth type, a single independent variable called “W” affects both paths “a” and “b”
simultaneously.
From IT Business Strategic Alignment to Performance 83
Model No.
Description Diagram
1 The independent variable “X” acts as a moderator to the path “b”.
2 A fourth variable ,e.g., “W” affects the path “a”.
3 A fourth variable ,e.g., “Z” affects the path “b”.
4 The variable “W” affects path “a”, and another variable ,e.g., “Z” affects the path “b”.
5 A variable ,e.g., “W” affects both paths “a” and “b”.
Table 4-1 Five types of complex models combining mediation and moderation Adopted from Little et al. (2007)
4.5.2 The Complete Conceptual Model
In our study, we assume the interaction of two relationships. (1) The relation between ITBSA and
performance is to be mediated by SIW (see Figure 4-11). (2) The relationship between ITBSA and
performance is to be moderated by EGIT. Hence, we have the case of one external variable acting as
a moderator to an assumed existing mediating relationship. Referring to subsections 3.3.2 and 3.3.3,
where we mentioned from the literature that (1) ITBSA and EGIT

84 The Conceptual Model
are both closely related and that EGIT moderates the effect of ITBSA on other success factors, and
(2) that EGIT has a positive effect on innovative activities (SIW). Weighing the pros and cons of
those subsections, we chose to investigate our PS and RQs with the assumption that EGIT acts as a
moderator on the mediating relationship between ITBSA and performance through its influence on
the relationship between ITBSA and SIW.
Therefore, we will choose model 2 from Table 4-1 as our proposed conceptual model. Figure 4-16
depicts our complete conceptual model of the mediating effect of SIW along the path from ITBSA to
performance, and the moderating effect of EGIT on this mediating relationship. In Chapter 6 (the
data analysis chapter) we will empirically investigate these relationships.
In conclusion, Chapter 2 (the literature review) has investigated the background and the significance
of the main concepts of this study, and Chapter 3 has explored the relationships among those concepts.
It was concluded that those relationships are still controversial and need further investigation,
specifically at the departmental level of analysis. In order to assist in the investigation of those
controversial relationships, two main conceptual models were developed in this chapter. (1) A
mediating model (relating ITBSA, SIW, and performance). (2) A model combining mediation and
moderation (relating ITBSA, EGIT, SIW and performance).
Figure 4-16 The complete conceptual model
ITBSA
SIW
Performance
EGIT
?
? ?
?
CHAPTER 5 FIELD WORK and DATA COLLECTION
For the investigation of the relationships among the factors of our conceptual model designed in
Chapter 4, we aim to perform an extensive multi-dimensional empirical analysis based on field data.
Therefore, we should first collect the data and then analyze them. Referring to Figure 4-16, and to the
four RQs, we should investigate the following four relationships.
(1) The effect of ITBSA on SIW.
(2) The effect of SIW on performance.
(3) The mediating effect of SIW on the relationship between ITBSA and departmental performance.
(4) The combined effect of EGIT and SIW on the relationship between ITBSA and performance at
the departmental level.
To make the investigation of those four relationships effective, we should operationalize (decide
which variables are going to reflect each construct) and collect data on those variables reflecting the
four constructs: (1) ITBSA, (2) EGIT, (3) SIW, and (4) departmental performance. In section 5.1 we
will operationalize the four constructs. In section 5.2 we describe the instruments (survey forms) that
will be used to collect the data. Section 5.3 describes the field work performed to collect the necessary
data. In section 5.4 a general description of the collected data will be provided.
For clarity, we show in Figure 5-1 our main conceptual model together with a reference to the
subsections in which each construct is operationalized and the data collection instrument is chosen.
5.1 Operationalization of the Constructs
In this section, we present the operationalization of the four main constructs of this study. Subsection
5.1.1 will discuss the operationalization of the ITBSA construct. In subsection 5.1.2 the EGIT
construct operationalization will be presented. In subsection 5.1.3 the SIW construct will be
operationalized. In subsection 5.1.4 departmental performance will be operationalized.

Cha
pter
5
84 The Conceptual Model
are both closely related and that EGIT moderates the effect of ITBSA on other success factors, and
(2) that EGIT has a positive effect on innovative activities (SIW). Weighing the pros and cons of
those subsections, we chose to investigate our PS and RQs with the assumption that EGIT acts as a
moderator on the mediating relationship between ITBSA and performance through its influence on
the relationship between ITBSA and SIW.
Therefore, we will choose model 2 from Table 4-1 as our proposed conceptual model. Figure 4-16
depicts our complete conceptual model of the mediating effect of SIW along the path from ITBSA to
performance, and the moderating effect of EGIT on this mediating relationship. In Chapter 6 (the
data analysis chapter) we will empirically investigate these relationships.
In conclusion, Chapter 2 (the literature review) has investigated the background and the significance
of the main concepts of this study, and Chapter 3 has explored the relationships among those concepts.
It was concluded that those relationships are still controversial and need further investigation,
specifically at the departmental level of analysis. In order to assist in the investigation of those
controversial relationships, two main conceptual models were developed in this chapter. (1) A
mediating model (relating ITBSA, SIW, and performance). (2) A model combining mediation and
moderation (relating ITBSA, EGIT, SIW and performance).
Figure 4-16 The complete conceptual model
ITBSA
SIW
Performance
EGIT
?
? ?
?
CHAPTER 5 FIELD WORK and DATA COLLECTION
For the investigation of the relationships among the factors of our conceptual model designed in
Chapter 4, we aim to perform an extensive multi-dimensional empirical analysis based on field data.
Therefore, we should first collect the data and then analyze them. Referring to Figure 4-16, and to the
four RQs, we should investigate the following four relationships.
(1) The effect of ITBSA on SIW.
(2) The effect of SIW on performance.
(3) The mediating effect of SIW on the relationship between ITBSA and departmental performance.
(4) The combined effect of EGIT and SIW on the relationship between ITBSA and performance at
the departmental level.
To make the investigation of those four relationships effective, we should operationalize (decide
which variables are going to reflect each construct) and collect data on those variables reflecting the
four constructs: (1) ITBSA, (2) EGIT, (3) SIW, and (4) departmental performance. In section 5.1 we
will operationalize the four constructs. In section 5.2 we describe the instruments (survey forms) that
will be used to collect the data. Section 5.3 describes the field work performed to collect the necessary
data. In section 5.4 a general description of the collected data will be provided.
For clarity, we show in Figure 5-1 our main conceptual model together with a reference to the
subsections in which each construct is operationalized and the data collection instrument is chosen.
5.1 Operationalization of the Constructs
In this section, we present the operationalization of the four main constructs of this study. Subsection
5.1.1 will discuss the operationalization of the ITBSA construct. In subsection 5.1.2 the EGIT
construct operationalization will be presented. In subsection 5.1.3 the SIW construct will be
operationalized. In subsection 5.1.4 departmental performance will be operationalized.

86 Field Work and Data Collection
t
Before we proceed, we would like to clarify our use of the term “construct”. This term refers to a
phenomenon or concept that is to be studied. Usually, such a phenomenon (or concept) is difficult to
be directly measured. Therefore, it is measured (sometimes referred to as operationalized) using a
number of variables (sometimes called indicators) represented by a group of statements on a
questionnaire. The construct (referred to as a latent variable in structural equation modeling SEM) is
then assessed from those “other” variables or indicators (cf. Ullman, 2006).
5.1.1 Operationalization of ITBSA
Researchers agree that there is no universal way to measure ITBSA. Many models were developed
that attempted to measure the strategic alignment construct. The current study has operationalized the
IT and business strategic alignment in a construct under the name ITBSA. For measuring the
construct, we utilize a scoring approach developed by Weill and Broadbent (1998) and Weill and
Ross (2004). They have developed a scoring instrument ‘‘diagnostic to assess strategic alignment’’
that requires the respondents to assess 10 statements representing 10 variables (indicators) that relate
to the degree of alignment on a scale from 1 to 5 (1=always true, 5=never true). Subsection 5.2.1
shows a detailed description of the data instrument used for this operationalization.
Figure 5-1 The conceptual model with references to subsections
Construct: ITBSA Operationalization: Subsection 5.1.1 Data Instrument: Subsection 5.2.1
Construct: Performance Operationalization: Subsection 5.1.4 Data Instrument: Subsection 5.2.4
Performance ITBSA
EGIT
Construct: EGIT Operationalization: Subsection 5.1.2 Data Instrument: Subsection 5.2.2
Construct: SIW Operationalization: Subsection 5.1.3 Data Instrument: Subsection 5.2.3
SIW
From IT Business Strategic Alignment to Performance 87
5.1.2 Operationalization of EGIT
An effective method to assess and benchmark the Enterprise Governance of IT is the use of maturity
models. A detailed maturity model was developed by the IT Governance Institute (2001). This model
identifies six levels of maturity (from 0 to 5) ranging from non-existent (level zero) to optimized
(level five) at each IT governance-related factor (see ITGI, 2001). Table 5-1 shows the six levels of
maturity. They are briefly described and used to assess each of the three EGIT factors (processes,
structures, and relational mechanisms).
In Table 5-1 we read that organizations at an overall level of zero are characterized by a complete
lack of any recognizable IT Governance process. Level one assumes that the organization, at least,
recognizes the importance of addressing IT Governance issues. The six levels all have a name, viz.
non-existent (0), initial (1), repeatable (2), defined (3), managed and measurable (4), and optimized
(5) (see Table 5-1). The highest level “five” implies an advanced understanding of IT Governance
issues and solutions, supported by an established framework and best practices of processes,
structures, and relational mechanisms.
This maturity scale is applied to a sequence of statements used to operationalize the EGIT construct.
Furthermore, EGIT operationalization has been performed through a decomposition into three
separate sub-constructs, namely, (1) the EGIT_Structures, which is operationalized as the average of
the maturity scores given to the 12 individual statements (variables) concerning the IT structures in
an organization; (2) the EGIT_Processes, which is operationalized as the average of the maturity
scores given to 11 statements (variables) describing IT governance processes in an organization; and
(3) the EGIT_Relation, which is also calculated as the average of the maturity scores given to 10
statements (Variables) regarding the IT governance relational mechanisms in an organization (see
Table 5-5). In subsection 5.2.2 we describe the data collection instrument in details.

Cha
pter
5
86 Field Work and Data Collection
t
Before we proceed, we would like to clarify our use of the term “construct”. This term refers to a
phenomenon or concept that is to be studied. Usually, such a phenomenon (or concept) is difficult to
be directly measured. Therefore, it is measured (sometimes referred to as operationalized) using a
number of variables (sometimes called indicators) represented by a group of statements on a
questionnaire. The construct (referred to as a latent variable in structural equation modeling SEM) is
then assessed from those “other” variables or indicators (cf. Ullman, 2006).
5.1.1 Operationalization of ITBSA
Researchers agree that there is no universal way to measure ITBSA. Many models were developed
that attempted to measure the strategic alignment construct. The current study has operationalized the
IT and business strategic alignment in a construct under the name ITBSA. For measuring the
construct, we utilize a scoring approach developed by Weill and Broadbent (1998) and Weill and
Ross (2004). They have developed a scoring instrument ‘‘diagnostic to assess strategic alignment’’
that requires the respondents to assess 10 statements representing 10 variables (indicators) that relate
to the degree of alignment on a scale from 1 to 5 (1=always true, 5=never true). Subsection 5.2.1
shows a detailed description of the data instrument used for this operationalization.
Figure 5-1 The conceptual model with references to subsections
Construct: ITBSA Operationalization: Subsection 5.1.1 Data Instrument: Subsection 5.2.1
Construct: Performance Operationalization: Subsection 5.1.4 Data Instrument: Subsection 5.2.4
Performance ITBSA
EGIT
Construct: EGIT Operationalization: Subsection 5.1.2 Data Instrument: Subsection 5.2.2
Construct: SIW Operationalization: Subsection 5.1.3 Data Instrument: Subsection 5.2.3
SIW
From IT Business Strategic Alignment to Performance 87
5.1.2 Operationalization of EGIT
An effective method to assess and benchmark the Enterprise Governance of IT is the use of maturity
models. A detailed maturity model was developed by the IT Governance Institute (2001). This model
identifies six levels of maturity (from 0 to 5) ranging from non-existent (level zero) to optimized
(level five) at each IT governance-related factor (see ITGI, 2001). Table 5-1 shows the six levels of
maturity. They are briefly described and used to assess each of the three EGIT factors (processes,
structures, and relational mechanisms).
In Table 5-1 we read that organizations at an overall level of zero are characterized by a complete
lack of any recognizable IT Governance process. Level one assumes that the organization, at least,
recognizes the importance of addressing IT Governance issues. The six levels all have a name, viz.
non-existent (0), initial (1), repeatable (2), defined (3), managed and measurable (4), and optimized
(5) (see Table 5-1). The highest level “five” implies an advanced understanding of IT Governance
issues and solutions, supported by an established framework and best practices of processes,
structures, and relational mechanisms.
This maturity scale is applied to a sequence of statements used to operationalize the EGIT construct.
Furthermore, EGIT operationalization has been performed through a decomposition into three
separate sub-constructs, namely, (1) the EGIT_Structures, which is operationalized as the average of
the maturity scores given to the 12 individual statements (variables) concerning the IT structures in
an organization; (2) the EGIT_Processes, which is operationalized as the average of the maturity
scores given to 11 statements (variables) describing IT governance processes in an organization; and
(3) the EGIT_Relation, which is also calculated as the average of the maturity scores given to 10
statements (Variables) regarding the IT governance relational mechanisms in an organization (see
Table 5-5). In subsection 5.2.2 we describe the data collection instrument in details.
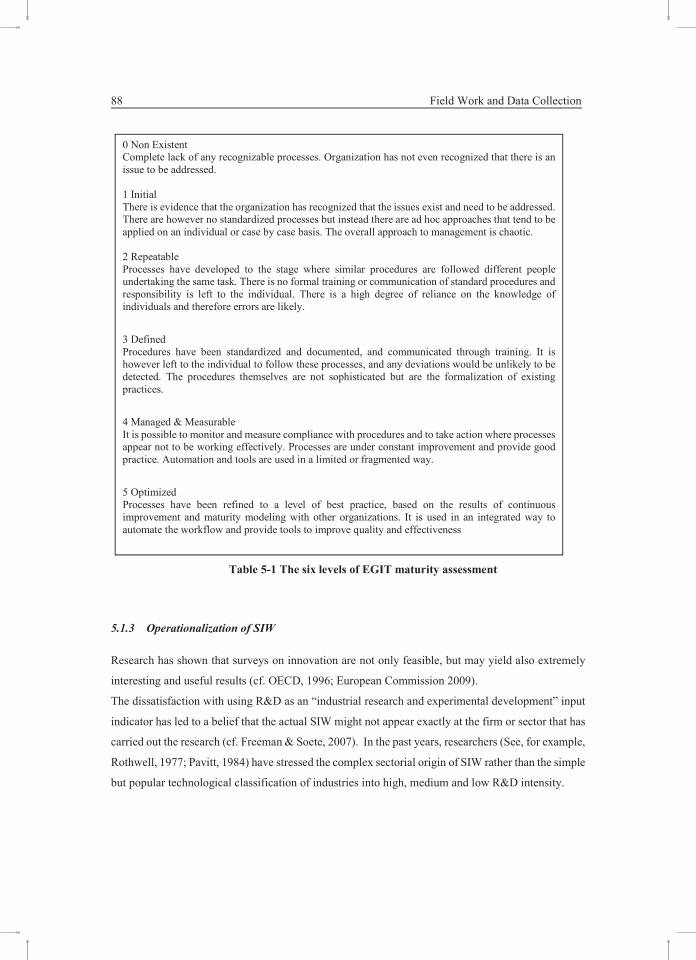
88 Field Work and Data Collection
5.1.3 Operationalization of SIW
Research has shown that surveys on innovation are not only feasible, but may yield also extremely
interesting and useful results (cf. OECD, 1996; European Commission 2009).
The dissatisfaction with using R&D as an “industrial research and experimental development” input
indicator has led to a belief that the actual SIW might not appear exactly at the firm or sector that has
carried out the research (cf. Freeman & Soete, 2007). In the past years, researchers (See, for example,
Rothwell, 1977; Pavitt, 1984) have stressed the complex sectorial origin of SIW rather than the simple
but popular technological classification of industries into high, medium and low R&D intensity.
0 Non Existent Complete lack of any recognizable processes. Organization has not even recognized that there is an issue to be addressed. 1 Initial There is evidence that the organization has recognized that the issues exist and need to be addressed. There are however no standardized processes but instead there are ad hoc approaches that tend to be applied on an individual or case by case basis. The overall approach to management is chaotic. 2 Repeatable Processes have developed to the stage where similar procedures are followed different people undertaking the same task. There is no formal training or communication of standard procedures and responsibility is left to the individual. There is a high degree of reliance on the knowledge of individuals and therefore errors are likely.
3 Defined Procedures have been standardized and documented, and communicated through training. It is however left to the individual to follow these processes, and any deviations would be unlikely to be detected. The procedures themselves are not sophisticated but are the formalization of existing practices.
4 Managed & Measurable It is possible to monitor and measure compliance with procedures and to take action where processes appear not to be working effectively. Processes are under constant improvement and provide good practice. Automation and tools are used in a limited or fragmented way.
5 Optimized Processes have been refined to a level of best practice, based on the results of continuous improvement and maturity modeling with other organizations. It is used in an integrated way to automate the workflow and provide tools to improve quality and effectiveness
Table 5-1 The six levels of EGIT maturity assessment
From IT Business Strategic Alignment to Performance 89
In subsection 2.3.3 we have elaborated on the fact that the development of new workplace ideas is
based on a successful execution of collaborative activities such as cooperation among functional
departments and effective information sharing. The importance of collaboration on innovation is
further emphasized in subsection 5.4.3. There, factors hampering innovation are identified from the
field-collected data. They rank the lack of effective information as being among the most important
factors, i.e., stressing the importance of the SIW collaboration concept.
In spite of our efforts towards achieving a high level of internationalization and diversification of the
participating organizations, there is always the possibility that the local culture will influence the
results. In my view, the most probable factor which is subject to cultural effect is the collaboration
on SIW. For example, three dimensions of the famous Hofstede (1983) cultural mix model (namely,
power distance, uncertainty avoidance, and individualism vs collectivism) could have influenced
some of the collaborative efforts on SIW. For instance, (a) power distance, could negatively affect
lower level employees’ ability to disseminate their innovative proposals, (b) uncertainty avoidance,
might deter departmental management from embracing risky innovative projects, and (c)
individualism vs collectivism, is often an incentive of collaboration avoidance.
We put forward two reasons why the local culture was not explicitly studied in the model. (1)
According to my best knowledge, there is no formal and credible analysis of the Yemeni local culture.
Such analysis would have been a necessary requirement to incorporate local culture into the model.
Performing a local culture analysis as part of this study was beyond the scope and time limitation of
this research. (2) The participating organizations were quite diverse in their cultural mix (American,
Canadian, European, Africa, East Asia, and Middle east). I have a strong believe that this cultural
mix might have reduced, to a high extent, the effect of the local culture. Nevertheless, we strongly
urge future researchers to include the culture effect into their models (if credible data is available).
Hence, we have decided, for the purpose of our study, to operationalize the social innovation at work
SIW construct in terms of eight variables (indicators) mostly relating to the inter-departmental
collaboration on SIW. Subsection 5.2.3 will describe in more details those eight variables (indicators)
and the eight statements that were used in the data collection instrument.
5.1.4 Operationalization of Performance
The operalization of the performance construct is a difficult topic. In spite of the fact that cost
reduction remains among the final desired outcome of (1) IT investments (see, for example, Lunardi

Cha
pter
5
88 Field Work and Data Collection
5.1.3 Operationalization of SIW
Research has shown that surveys on innovation are not only feasible, but may yield also extremely
interesting and useful results (cf. OECD, 1996; European Commission 2009).
The dissatisfaction with using R&D as an “industrial research and experimental development” input
indicator has led to a belief that the actual SIW might not appear exactly at the firm or sector that has
carried out the research (cf. Freeman & Soete, 2007). In the past years, researchers (See, for example,
Rothwell, 1977; Pavitt, 1984) have stressed the complex sectorial origin of SIW rather than the simple
but popular technological classification of industries into high, medium and low R&D intensity.
0 Non Existent Complete lack of any recognizable processes. Organization has not even recognized that there is an issue to be addressed. 1 Initial There is evidence that the organization has recognized that the issues exist and need to be addressed. There are however no standardized processes but instead there are ad hoc approaches that tend to be applied on an individual or case by case basis. The overall approach to management is chaotic. 2 Repeatable Processes have developed to the stage where similar procedures are followed different people undertaking the same task. There is no formal training or communication of standard procedures and responsibility is left to the individual. There is a high degree of reliance on the knowledge of individuals and therefore errors are likely.
3 Defined Procedures have been standardized and documented, and communicated through training. It is however left to the individual to follow these processes, and any deviations would be unlikely to be detected. The procedures themselves are not sophisticated but are the formalization of existing practices.
4 Managed & Measurable It is possible to monitor and measure compliance with procedures and to take action where processes appear not to be working effectively. Processes are under constant improvement and provide good practice. Automation and tools are used in a limited or fragmented way.
5 Optimized Processes have been refined to a level of best practice, based on the results of continuous improvement and maturity modeling with other organizations. It is used in an integrated way to automate the workflow and provide tools to improve quality and effectiveness
Table 5-1 The six levels of EGIT maturity assessment
From IT Business Strategic Alignment to Performance 89
In subsection 2.3.3 we have elaborated on the fact that the development of new workplace ideas is
based on a successful execution of collaborative activities such as cooperation among functional
departments and effective information sharing. The importance of collaboration on innovation is
further emphasized in subsection 5.4.3. There, factors hampering innovation are identified from the
field-collected data. They rank the lack of effective information as being among the most important
factors, i.e., stressing the importance of the SIW collaboration concept.
In spite of our efforts towards achieving a high level of internationalization and diversification of the
participating organizations, there is always the possibility that the local culture will influence the
results. In my view, the most probable factor which is subject to cultural effect is the collaboration
on SIW. For example, three dimensions of the famous Hofstede (1983) cultural mix model (namely,
power distance, uncertainty avoidance, and individualism vs collectivism) could have influenced
some of the collaborative efforts on SIW. For instance, (a) power distance, could negatively affect
lower level employees’ ability to disseminate their innovative proposals, (b) uncertainty avoidance,
might deter departmental management from embracing risky innovative projects, and (c)
individualism vs collectivism, is often an incentive of collaboration avoidance.
We put forward two reasons why the local culture was not explicitly studied in the model. (1)
According to my best knowledge, there is no formal and credible analysis of the Yemeni local culture.
Such analysis would have been a necessary requirement to incorporate local culture into the model.
Performing a local culture analysis as part of this study was beyond the scope and time limitation of
this research. (2) The participating organizations were quite diverse in their cultural mix (American,
Canadian, European, Africa, East Asia, and Middle east). I have a strong believe that this cultural
mix might have reduced, to a high extent, the effect of the local culture. Nevertheless, we strongly
urge future researchers to include the culture effect into their models (if credible data is available).
Hence, we have decided, for the purpose of our study, to operationalize the social innovation at work
SIW construct in terms of eight variables (indicators) mostly relating to the inter-departmental
collaboration on SIW. Subsection 5.2.3 will describe in more details those eight variables (indicators)
and the eight statements that were used in the data collection instrument.
5.1.4 Operationalization of Performance
The operalization of the performance construct is a difficult topic. In spite of the fact that cost
reduction remains among the final desired outcome of (1) IT investments (see, for example, Lunardi

90 Field Work and Data Collection
et al., 2014), and (2) SIW (cf. Dhondt et al., 2012; Pot et al., 2012), there has been a shift in focus
from pure cost consideration when evaluating the effect of SIW on performance towards other
efficiency factors (cf. Robeson & O'Connor, 2007). Those other factors include capacities and
capabilities (cf. Black & Lynch, 2004; Pot & Fietje, 2008; Oeij et al., 2012), productivity (cf. Pot &
Fietje, 2008; Rüede & Lurtz, 2012), flexibility (cf. Ford & Randolph, 1992), and sustainability (cf.
Eccles, Ioannis, & George, 2014; Epstein & Buhovac, 2014).
Social and Sustainable performance
An emerging dimensions of performance is gaining popularity and importance, viz. social
performance (SP) and corporate sustainability (CS) with the formal being a pre-requisite of the later.
According to Epstein & Buhovac (2014) establishing proper structures and processes that improve
the SP is a pre-requisite for improved Corporate Sustainability. In spite of the fact that we will not
directly use CS in the operationalization of the performance construct, it is important to elaborate on
this factor of performance because of its critical relation to corporate performance.
Historically, scholars such as Peterson & O'Bannon (1997) have asserted that the relationship between
coprorate social and financial performacne is not well established. In a more recent study, Eccles,
Ioannis, & George (2014) have indicated that in the long run, high sustainability companies
outperformed the low ustainability companies in terms of both economic profit (through higher
revenues due to improved reputation and reduced costs due to improved processes) and corporate
value.
Corporate Sustainability (as it is named in the literature) has initially appeared in the management
literature under the naming convention of “ecological sustainability” by Shrivastava (1995). Montiel
& Delgado-Ceballos (2014) have conducted an extensive review of the literature on the coverage of
Corporate Sustainability for the years 1995 through 2013 in popular scientific journals. Their major
findings were that (a) the term CS is still mainly used in academic literature rather than in top
management and practitioner literature, (b) a standardized definition of CS does not exist, and (c) that
it is still a major challenge to find a standard measure for CS.
There are two major threads for CS definitions in the literature. (1) In the academic publications, they
refer to CS through dimensions such as: sustaincentrism, ecological sustainability, sustainable
development, and corporate sustainability. (2) in the practitioner management publications, where
they refer to CS through dimensions such as: sustainable organization, sustainable development
From IT Business Strategic Alignment to Performance 91
innovation, and sustainable enterprise. Montiel & Delgado-Ceballos (2014) have grouped the main
dimensions of CS definitions into three main categories, economic, social, and environmental. Some
scholars refer to this approach as the Triple Bottom Line (TBL) approach.
When examinig the relation between CS and performance, the majority of CS research has used
secondary sources of data. The most common source of CS data in management literature is the Dow
Jones Sustainability Index (DJSI). For the economic dimension, the DJSI uses measures such as
corporate governance, codes of conduct/compliance, and customer relationship management. The
social dimension is commonly measured through, social reporting, corporate citizenship
philanthrophy, and stake holder engagement. And finaly, an example of environmental measures are,
environmental reporting, environmental policy/engagement, and operational eco-efficiency (cf.
Montiel & Delgado-Ceballos, 2014).
The CS dimension is not explicitly explored in this research for the following three reasons. (1) The
issue of defining and measuring CS is a complex and controversial issue. This study involves a
complex model which explores and describes factors that were grounded in previous theories as being
related to the path from ITBSA to performance. (2) Developing CS strategy and its implementation
plans is mainly a senior management role. This research was mainly concerned with the departmental
level management and performance data. (3) The data in the global indexes include data at the
corporate level, moreover, it does not include a geographically-specific information for the region of
operations of the studied organizations of research.
In this study, the departmental performance construct is operationalized as three variables (indicators)
reflecting the combination of the three main factors of performance: (1) cost reduction, (2) flexibility
of production, and (3) capacity of production (of a product or a service). Those three factors
(indicators) of departmental performance are reflected in three statements on the performance data
instrument that is detailed in subsection 5.2.4. The statements are formulated in a way such as to
reflect the performance enhancement as a result of SIW.
5.2 Data Collection Instruments
In this section, we outline the data collection instruments that were used to collect the data for our
research. In subsection 5.2.1 we discuss the data instrument used to collect data related to the ITBSA
construct variables. Subsection 5.2.2 describes the data instrument related to the EGIT construct
variables. In subsection 5.2.3 we show the data instrument related to the SIW construct variables.

Cha
pter
5
90 Field Work and Data Collection
et al., 2014), and (2) SIW (cf. Dhondt et al., 2012; Pot et al., 2012), there has been a shift in focus
from pure cost consideration when evaluating the effect of SIW on performance towards other
efficiency factors (cf. Robeson & O'Connor, 2007). Those other factors include capacities and
capabilities (cf. Black & Lynch, 2004; Pot & Fietje, 2008; Oeij et al., 2012), productivity (cf. Pot &
Fietje, 2008; Rüede & Lurtz, 2012), flexibility (cf. Ford & Randolph, 1992), and sustainability (cf.
Eccles, Ioannis, & George, 2014; Epstein & Buhovac, 2014).
Social and Sustainable performance
An emerging dimensions of performance is gaining popularity and importance, viz. social
performance (SP) and corporate sustainability (CS) with the formal being a pre-requisite of the later.
According to Epstein & Buhovac (2014) establishing proper structures and processes that improve
the SP is a pre-requisite for improved Corporate Sustainability. In spite of the fact that we will not
directly use CS in the operationalization of the performance construct, it is important to elaborate on
this factor of performance because of its critical relation to corporate performance.
Historically, scholars such as Peterson & O'Bannon (1997) have asserted that the relationship between
coprorate social and financial performacne is not well established. In a more recent study, Eccles,
Ioannis, & George (2014) have indicated that in the long run, high sustainability companies
outperformed the low ustainability companies in terms of both economic profit (through higher
revenues due to improved reputation and reduced costs due to improved processes) and corporate
value.
Corporate Sustainability (as it is named in the literature) has initially appeared in the management
literature under the naming convention of “ecological sustainability” by Shrivastava (1995). Montiel
& Delgado-Ceballos (2014) have conducted an extensive review of the literature on the coverage of
Corporate Sustainability for the years 1995 through 2013 in popular scientific journals. Their major
findings were that (a) the term CS is still mainly used in academic literature rather than in top
management and practitioner literature, (b) a standardized definition of CS does not exist, and (c) that
it is still a major challenge to find a standard measure for CS.
There are two major threads for CS definitions in the literature. (1) In the academic publications, they
refer to CS through dimensions such as: sustaincentrism, ecological sustainability, sustainable
development, and corporate sustainability. (2) in the practitioner management publications, where
they refer to CS through dimensions such as: sustainable organization, sustainable development
From IT Business Strategic Alignment to Performance 91
innovation, and sustainable enterprise. Montiel & Delgado-Ceballos (2014) have grouped the main
dimensions of CS definitions into three main categories, economic, social, and environmental. Some
scholars refer to this approach as the Triple Bottom Line (TBL) approach.
When examinig the relation between CS and performance, the majority of CS research has used
secondary sources of data. The most common source of CS data in management literature is the Dow
Jones Sustainability Index (DJSI). For the economic dimension, the DJSI uses measures such as
corporate governance, codes of conduct/compliance, and customer relationship management. The
social dimension is commonly measured through, social reporting, corporate citizenship
philanthrophy, and stake holder engagement. And finaly, an example of environmental measures are,
environmental reporting, environmental policy/engagement, and operational eco-efficiency (cf.
Montiel & Delgado-Ceballos, 2014).
The CS dimension is not explicitly explored in this research for the following three reasons. (1) The
issue of defining and measuring CS is a complex and controversial issue. This study involves a
complex model which explores and describes factors that were grounded in previous theories as being
related to the path from ITBSA to performance. (2) Developing CS strategy and its implementation
plans is mainly a senior management role. This research was mainly concerned with the departmental
level management and performance data. (3) The data in the global indexes include data at the
corporate level, moreover, it does not include a geographically-specific information for the region of
operations of the studied organizations of research.
In this study, the departmental performance construct is operationalized as three variables (indicators)
reflecting the combination of the three main factors of performance: (1) cost reduction, (2) flexibility
of production, and (3) capacity of production (of a product or a service). Those three factors
(indicators) of departmental performance are reflected in three statements on the performance data
instrument that is detailed in subsection 5.2.4. The statements are formulated in a way such as to
reflect the performance enhancement as a result of SIW.
5.2 Data Collection Instruments
In this section, we outline the data collection instruments that were used to collect the data for our
research. In subsection 5.2.1 we discuss the data instrument used to collect data related to the ITBSA
construct variables. Subsection 5.2.2 describes the data instrument related to the EGIT construct
variables. In subsection 5.2.3 we show the data instrument related to the SIW construct variables.

92 Field Work and Data Collection
And finally, in subsection 5.2.4 we show the data collection instrument related to the departmental
performance construct variables.
5.2.1 Data Instrument ITBSA
For collecting data on the variables that reflect the ITBSA construct, we have used a scoring approach
developed by Weill and Broadbent (1998) and Weill and Ross (2004). The questionnaire used in our
research relates to the most common variables (indicators) that have historically been used in
literature to identify ITBSA, such as, (a) the degree to which IT mission / vision are supported in the
Business Strategy (cf. Reich & Benbasat, 1996), (b) alignment of IT strategy with the business
strategy (cf. Henderson & Venkatraman, 1993; Beimborn et al., 2009), (c) top management and
executive support to the IT business alignment on the strategic level (cf. Lederer & Mendelow, 1989;
Beimborn et al., 2009), and (d) applying IT in an appropriate and timely way (cf. Luftman & Brier,
1999) (for details of the definitions of those concepts see Table 2-3). Table 5-2 shows the statements
that were used to collect the data related to the variables reflecting the ITBSA construct.
5.2.2 Data Instrument EGIT
Regarding to the EGIT construct, the instrument has a list of 33 statements that were used to collect
data on the variables reflecting the EGIT construct. They are numbered as follows, 1-11, 12-23, and
24-33. In particular, there were 11 statements describing the process variables (see Table 5-3), 12
statements describing the structures variables (see Table 5-4), and 10 statements for the relational
mechanism- variables (see Table 5-5). This list was based on a research in the UAMS – ITAG
Research Institute (University of Antwerp Management School – IT Alignment and Governance
Research Institute). It is based on literature, multiple in-depth case research and expert’s reviews. It
is primarily focused on strategic and management-oriented practices.
De Haes & Van Grembergen (2009) and De Haes & Van Grembergen (2013) have calculated each
of the three factors (processes, structures, and relational mechanisms) as an average of their respective
variables scores. The EGIT as a construct in its entirety was then calculated as an average of the three
factors (processes, structures, and relational mechanisms). In our research, the SEM (Structural
Equation Modeling) approach will be used. Each sub-construct of the EGIT (processes, structures,
and relational mechanisms) will be first calculated as an average of its corresponding statements in
the questionnaires reflecting its variables. Then, those averages of the three sub-constructs of the
EGIT will be used to load into the EGIT construct.
From IT Business Strategic Alignment to Performance 93
No. Statements of the ITBSA questionnaire Variable Name 1 Senior management has no vision on the role of IT ITBSA_Vision
2 Vital information necessary to make decisions is often missing ITBSA_Info
3 Management perceives little value from computing ITBSA_Value
4 A "them and us" mentality prevails (with IT people)
ITBSA_Mentality
5 The IT group drives IT projects ITBSA_Projects
6 It is hard to get financial approval for IT projects
ITBSA_Finance
7 There is no IT component in the division's strategy ITBSA_Component
8 Islands of automation exist
ITBSA_Islands
9 IT does not help for the hard tasks ITBSA_Help
10 Senior management sees outsourcing as a way to control IT ITBSA_Outsource
Table 5-2 Statements of the ITBSA questionnaire
Tables 5-3, 5-4, and 5-5 on the next pages describe the 33 statements with their definitions. This
instrument was confirmed and the individual items were validated and cross-referenced from the
literature (cf. De Haes & Van Grembergen, 2009; Van Grembergen & De Haes, 2013).

Cha
pter
5
92 Field Work and Data Collection
And finally, in subsection 5.2.4 we show the data collection instrument related to the departmental
performance construct variables.
5.2.1 Data Instrument ITBSA
For collecting data on the variables that reflect the ITBSA construct, we have used a scoring approach
developed by Weill and Broadbent (1998) and Weill and Ross (2004). The questionnaire used in our
research relates to the most common variables (indicators) that have historically been used in
literature to identify ITBSA, such as, (a) the degree to which IT mission / vision are supported in the
Business Strategy (cf. Reich & Benbasat, 1996), (b) alignment of IT strategy with the business
strategy (cf. Henderson & Venkatraman, 1993; Beimborn et al., 2009), (c) top management and
executive support to the IT business alignment on the strategic level (cf. Lederer & Mendelow, 1989;
Beimborn et al., 2009), and (d) applying IT in an appropriate and timely way (cf. Luftman & Brier,
1999) (for details of the definitions of those concepts see Table 2-3). Table 5-2 shows the statements
that were used to collect the data related to the variables reflecting the ITBSA construct.
5.2.2 Data Instrument EGIT
Regarding to the EGIT construct, the instrument has a list of 33 statements that were used to collect
data on the variables reflecting the EGIT construct. They are numbered as follows, 1-11, 12-23, and
24-33. In particular, there were 11 statements describing the process variables (see Table 5-3), 12
statements describing the structures variables (see Table 5-4), and 10 statements for the relational
mechanism- variables (see Table 5-5). This list was based on a research in the UAMS – ITAG
Research Institute (University of Antwerp Management School – IT Alignment and Governance
Research Institute). It is based on literature, multiple in-depth case research and expert’s reviews. It
is primarily focused on strategic and management-oriented practices.
De Haes & Van Grembergen (2009) and De Haes & Van Grembergen (2013) have calculated each
of the three factors (processes, structures, and relational mechanisms) as an average of their respective
variables scores. The EGIT as a construct in its entirety was then calculated as an average of the three
factors (processes, structures, and relational mechanisms). In our research, the SEM (Structural
Equation Modeling) approach will be used. Each sub-construct of the EGIT (processes, structures,
and relational mechanisms) will be first calculated as an average of its corresponding statements in
the questionnaires reflecting its variables. Then, those averages of the three sub-constructs of the
EGIT will be used to load into the EGIT construct.
From IT Business Strategic Alignment to Performance 93
No. Statements of the ITBSA questionnaire Variable Name 1 Senior management has no vision on the role of IT ITBSA_Vision
2 Vital information necessary to make decisions is often missing ITBSA_Info
3 Management perceives little value from computing ITBSA_Value
4 A "them and us" mentality prevails (with IT people)
ITBSA_Mentality
5 The IT group drives IT projects ITBSA_Projects
6 It is hard to get financial approval for IT projects
ITBSA_Finance
7 There is no IT component in the division's strategy ITBSA_Component
8 Islands of automation exist
ITBSA_Islands
9 IT does not help for the hard tasks ITBSA_Help
10 Senior management sees outsourcing as a way to control IT ITBSA_Outsource
Table 5-2 Statements of the ITBSA questionnaire
Tables 5-3, 5-4, and 5-5 on the next pages describe the 33 statements with their definitions. This
instrument was confirmed and the individual items were validated and cross-referenced from the
literature (cf. De Haes & Van Grembergen, 2009; Van Grembergen & De Haes, 2013).

94 Field Work and Data Collection
EGIT - Processes
No Index
Processes
EGIT factor to be assessed
Definition
1 P1 Strategic information systems planning
Formal process to define and update the IT strategy
2 P2 IT performance measurement (e.g. IT balanced scorecard)
IT performance measurement in domains of corporate contribution, user orientation, operational excellence and future orientation
3 P3 Portfolio management (incl. business cases, information economics, ROI, payback
Prioritization process for IT investments and projects in which business and IT is involved (incl. business cases)
4 P4 Charge back arrangements - total cost of ownership (e.g. activity based costing
Methodology to charge back IT costs to business units, to enable an understanding of the total cost of ownership
5 P5 Service level agreements Formal agreements between business and IT about IT development projects or IT operation
6 P6 IT governance framework (e.g. COBIT)
Process based IT governance and control framework
7 P7 IT governance assurance and self-assessment
Regular self-assessments or independent assurance activities on the governance and control over IT
8 P8 Project governance / management methodologies
Processes and methodologies to govern and manage IT projects
9 P9 IT budget control and reporting
Processes to control and report upon budgets of IT investments and projects
10 P10 Benefits management and reporting
Processes to monitor the planned business benefits during and after implementation of the IT investments / projects.
11 P11 COSO / ERM Framework for internal control Table 5-3 Items used to evaluate the EGIT construct for processes
Adopted from Van Grembergen & Haes (2009)
From IT Business Strategic Alignment to Performance 95
EGIT - Structures
No Index
Structures
EGIT factor to be assessed
Definition
12 S1 IT strategy committee at level of board of directors
Committee at level of board of directors to ensure IT is regular agenda item and reporting issue for the board of directors
13 S2 IT expertise at level of board of directors
Members of the board of directors have expertise and experience regarding the value and risk of IT
14 S3 (IT) audit committee at level of board of directors
Independent committee at level of board of directors overviewing (IT) assurance activities
15 S4 CIO on executive committee CIO is a full member of the executive committee
16 S5 CIO (Chief Information Officer) reporting to CEO and/or COO
CIO has a direct reporting line to the CEO and/or COO
17 S6 IT steering committee (IT investment evaluation / prioritization at executive / senior management level)
Steering committee at executive or senior management level responsible for determining business priorities in IT investments.
18 S7 IT governance function / officer
Function in the organization responsible for promoting, driving and managing IT governance processes
19 S8 Security / compliance / risk officer
Function responsible for security, compliance and/or risk, which possibly impacts IT
20 S9 IT project steering committee
Steering committee composed of business and IT people focusing on prioritizing and managing IT Projects
21 S10 IT security steering committee
Steering committee composed of business and IT people focusing on IT related risks and security Issues
22 S11 Architecture steering committee
Committee composed of business and IT people providing architecture guidelines and advise on their applications.
23 S12 Integration of governance/alignment tasks in roles and responsibilities
Documented roles and responsibilities include governance/alignment tasks for business and IT people (cf. Weill)
Table 5-4 Items used to evaluate the EGIT construct for structures Adopted from Van Grembergen & Haes (2009)
EGIT - Relational Mechanisms
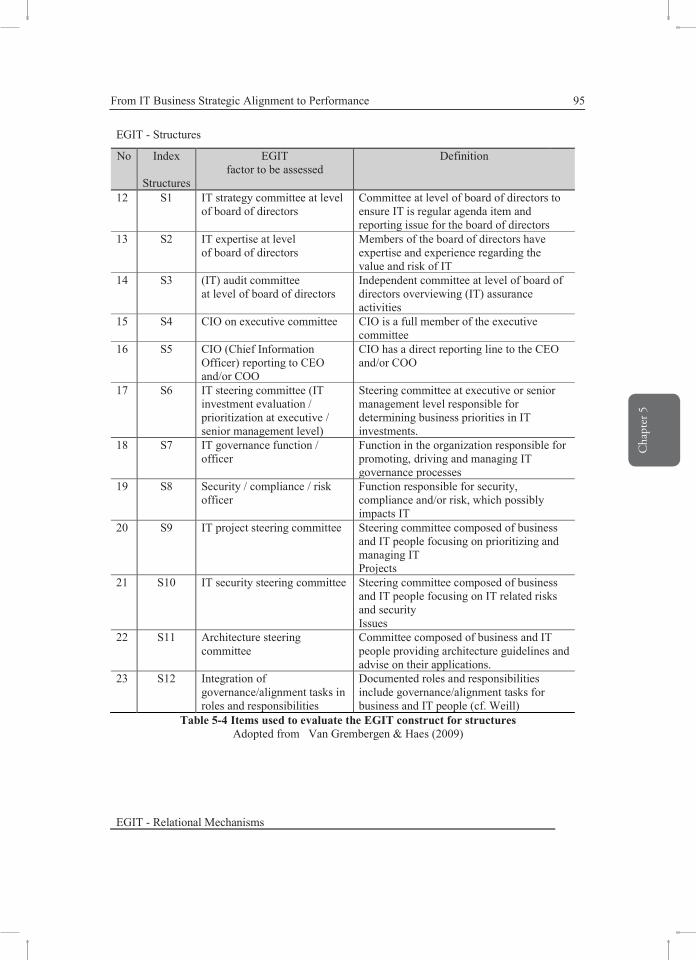
Cha
pter
5
94 Field Work and Data Collection
EGIT - Processes
No Index
Processes
EGIT factor to be assessed
Definition
1 P1 Strategic information systems planning
Formal process to define and update the IT strategy
2 P2 IT performance measurement (e.g. IT balanced scorecard)
IT performance measurement in domains of corporate contribution, user orientation, operational excellence and future orientation
3 P3 Portfolio management (incl. business cases, information economics, ROI, payback
Prioritization process for IT investments and projects in which business and IT is involved (incl. business cases)
4 P4 Charge back arrangements - total cost of ownership (e.g. activity based costing
Methodology to charge back IT costs to business units, to enable an understanding of the total cost of ownership
5 P5 Service level agreements Formal agreements between business and IT about IT development projects or IT operation
6 P6 IT governance framework (e.g. COBIT)
Process based IT governance and control framework
7 P7 IT governance assurance and self-assessment
Regular self-assessments or independent assurance activities on the governance and control over IT
8 P8 Project governance / management methodologies
Processes and methodologies to govern and manage IT projects
9 P9 IT budget control and reporting
Processes to control and report upon budgets of IT investments and projects
10 P10 Benefits management and reporting
Processes to monitor the planned business benefits during and after implementation of the IT investments / projects.
11 P11 COSO / ERM Framework for internal control Table 5-3 Items used to evaluate the EGIT construct for processes
Adopted from Van Grembergen & Haes (2009)
From IT Business Strategic Alignment to Performance 95
EGIT - Structures
No Index
Structures
EGIT factor to be assessed
Definition
12 S1 IT strategy committee at level of board of directors
Committee at level of board of directors to ensure IT is regular agenda item and reporting issue for the board of directors
13 S2 IT expertise at level of board of directors
Members of the board of directors have expertise and experience regarding the value and risk of IT
14 S3 (IT) audit committee at level of board of directors
Independent committee at level of board of directors overviewing (IT) assurance activities
15 S4 CIO on executive committee CIO is a full member of the executive committee
16 S5 CIO (Chief Information Officer) reporting to CEO and/or COO
CIO has a direct reporting line to the CEO and/or COO
17 S6 IT steering committee (IT investment evaluation / prioritization at executive / senior management level)
Steering committee at executive or senior management level responsible for determining business priorities in IT investments.
18 S7 IT governance function / officer
Function in the organization responsible for promoting, driving and managing IT governance processes
19 S8 Security / compliance / risk officer
Function responsible for security, compliance and/or risk, which possibly impacts IT
20 S9 IT project steering committee
Steering committee composed of business and IT people focusing on prioritizing and managing IT Projects
21 S10 IT security steering committee
Steering committee composed of business and IT people focusing on IT related risks and security Issues
22 S11 Architecture steering committee
Committee composed of business and IT people providing architecture guidelines and advise on their applications.
23 S12 Integration of governance/alignment tasks in roles and responsibilities
Documented roles and responsibilities include governance/alignment tasks for business and IT people (cf. Weill)
Table 5-4 Items used to evaluate the EGIT construct for structures Adopted from Van Grembergen & Haes (2009)
EGIT - Relational Mechanisms

96 Field Work and Data Collection
No Index
Relational Mechanisms
EGIT factor to be assessed
Definition
24 R1 Job-rotation IT staff working in the business units and business people working in IT
25 R2 Co-location Physically locating business and IT people close to each other
26 R3 Cross-training Training business people about IT and/or training IT people about business
27 R4 Knowledge management (on IT governance)
Systems (intranet, …) to share and distribute knowledge about IT governance framework, responsibilities, tasks, etc.
28 R5 Business/IT account management
Bridging the gap between business and IT by means of account managers who act as in-between
29 R6 Executive / senior management giving the good example
Senior business and IT management acting as "partners"
30 R7 Informal meetings between business and IT executive/senior Management
Informal meetings, with no agenda, where business and IT senior management talk about general activities, directions, etc. (e.g. during informal lunches)
31 R8 IT leadership Ability of CIO or similar role to articulate a vision for IT's role in the company and ensure that this vision is clearly understood by managers throughout the organization
32 R9 Corporate internal communication addressing IT on a regular basis
Internal corporate communication regularly addresses general IT issues.
33 R10 IT governance awareness campaigns
Campaigns to explain to business and IT people the need for IT governance
Table 5-5 Items used to evaluate the EGIT construct for Relational Mechanisms Adopted from Van Grembergen & Haes (2009)
5.2.3 Data Instrument SIW
The dissatisfaction with R&D (see subsection 5.1.3) as an input indicator (cf. Hervas, Ripoll, and
Moll, 2012) for actual SIW results has sparked the process of successfully developing a new set of
output indicators. The output indicators were developed within the framework of the original Oslo
manual (1992 - 2005). Here we refer to the Oslo manual as the joint initiative of the OECD and
Eurostat. In the early 1990s, this initiative marked the beginnings of the standardization in
measurement of SIW by a methodological approach. The OECD published the original Oslo manual
From IT Business Strategic Alignment to Performance 97
on the measurement of technological innovation in 1992, and the first revision was adopted in 1997
(see OECD, 1992; OECD-Eurostat, 1997).
The updated third edition of the OECD Oslo manual (2005) has widened its scope considerably by
publishing the measures of both the previous TPP (technological, process and product) of SIW and
the non-technological or intangible aspects of SIW. The Oslo manual serves as a basis for the CIS
(Community Innovation Survey) in the European Union and the OECD. The CIS defines a firm as
innovative if it introduces at least one innovation at the work place that is new to the firm itself (see
Arundel, 2007). The Oslo manual concentrates on aspects such as: products and processes introduced,
objectives of innovation, factors hampering innovation, and sources of information for innovation
with reference to a three-year period. The Oslo questionnaire has been widely used by the CIS23 and
its data has been utilized by a vast amount of research (see, e.g., Evangelista & Sirilli, 1998; Therrien
& Mohnen, 2003; Lau, Yam & Tang, 2010). Moreover, Eurostat encourages other countries to adopt
the CIS concept (cf. Klomp, 2001). The 2005 manual was used in the design of the questionnaire for
the latest CIS survey of 2010 (OECD, 2013).
The main international organizations in the area are the European Commission and the OECD. They
are responsible for collecting data and coordinating empirical research relevant to the purposes of this
thesis. EC and OECD have developed an instrument consistently used at the ‘firm-level’ in the
identification of innovation. Therefore, the Oslo manual is considered a main international guideline
for data compilation and assessment that is related to workplace innovation (cf. Gunday et al., 2011).
This was confirmed by the European Commission’s Guide to SIW (2013) which stated that “the SIW
approaches are notably innovations in the internationally recognized Oslo manual sense”.
More recently, the Oslo manual was used in both the design of the questionnaire for the latest CIS
survey of 2012 which was carried out in Germany and published in 2015, as well as in several recent
research as a base for innovation surveys (see, e.g., Smit & Pretorius, 2015; Hochleitner et al., 2016).
Therefore, the credibility of the Oslo manual as a general and up to date tool for innovation research
is established.
In subsection 2.3.2 we have put forward a logical link between innovation in its generic sense and
social innovation at the workplace. We used the concept of “re-organization and innovation of work
23 The Community Innovation Survey (CIS) is the main statistical instrument of the European Union for measuring
innovation activities at firm level (cf. Armbruster et al., 2008)

Cha
pter
5
96 Field Work and Data Collection
No Index
Relational Mechanisms
EGIT factor to be assessed
Definition
24 R1 Job-rotation IT staff working in the business units and business people working in IT
25 R2 Co-location Physically locating business and IT people close to each other
26 R3 Cross-training Training business people about IT and/or training IT people about business
27 R4 Knowledge management (on IT governance)
Systems (intranet, …) to share and distribute knowledge about IT governance framework, responsibilities, tasks, etc.
28 R5 Business/IT account management
Bridging the gap between business and IT by means of account managers who act as in-between
29 R6 Executive / senior management giving the good example
Senior business and IT management acting as "partners"
30 R7 Informal meetings between business and IT executive/senior Management
Informal meetings, with no agenda, where business and IT senior management talk about general activities, directions, etc. (e.g. during informal lunches)
31 R8 IT leadership Ability of CIO or similar role to articulate a vision for IT's role in the company and ensure that this vision is clearly understood by managers throughout the organization
32 R9 Corporate internal communication addressing IT on a regular basis
Internal corporate communication regularly addresses general IT issues.
33 R10 IT governance awareness campaigns
Campaigns to explain to business and IT people the need for IT governance
Table 5-5 Items used to evaluate the EGIT construct for Relational Mechanisms Adopted from Van Grembergen & Haes (2009)
5.2.3 Data Instrument SIW
The dissatisfaction with R&D (see subsection 5.1.3) as an input indicator (cf. Hervas, Ripoll, and
Moll, 2012) for actual SIW results has sparked the process of successfully developing a new set of
output indicators. The output indicators were developed within the framework of the original Oslo
manual (1992 - 2005). Here we refer to the Oslo manual as the joint initiative of the OECD and
Eurostat. In the early 1990s, this initiative marked the beginnings of the standardization in
measurement of SIW by a methodological approach. The OECD published the original Oslo manual
From IT Business Strategic Alignment to Performance 97
on the measurement of technological innovation in 1992, and the first revision was adopted in 1997
(see OECD, 1992; OECD-Eurostat, 1997).
The updated third edition of the OECD Oslo manual (2005) has widened its scope considerably by
publishing the measures of both the previous TPP (technological, process and product) of SIW and
the non-technological or intangible aspects of SIW. The Oslo manual serves as a basis for the CIS
(Community Innovation Survey) in the European Union and the OECD. The CIS defines a firm as
innovative if it introduces at least one innovation at the work place that is new to the firm itself (see
Arundel, 2007). The Oslo manual concentrates on aspects such as: products and processes introduced,
objectives of innovation, factors hampering innovation, and sources of information for innovation
with reference to a three-year period. The Oslo questionnaire has been widely used by the CIS23 and
its data has been utilized by a vast amount of research (see, e.g., Evangelista & Sirilli, 1998; Therrien
& Mohnen, 2003; Lau, Yam & Tang, 2010). Moreover, Eurostat encourages other countries to adopt
the CIS concept (cf. Klomp, 2001). The 2005 manual was used in the design of the questionnaire for
the latest CIS survey of 2010 (OECD, 2013).
The main international organizations in the area are the European Commission and the OECD. They
are responsible for collecting data and coordinating empirical research relevant to the purposes of this
thesis. EC and OECD have developed an instrument consistently used at the ‘firm-level’ in the
identification of innovation. Therefore, the Oslo manual is considered a main international guideline
for data compilation and assessment that is related to workplace innovation (cf. Gunday et al., 2011).
This was confirmed by the European Commission’s Guide to SIW (2013) which stated that “the SIW
approaches are notably innovations in the internationally recognized Oslo manual sense”.
More recently, the Oslo manual was used in both the design of the questionnaire for the latest CIS
survey of 2012 which was carried out in Germany and published in 2015, as well as in several recent
research as a base for innovation surveys (see, e.g., Smit & Pretorius, 2015; Hochleitner et al., 2016).
Therefore, the credibility of the Oslo manual as a general and up to date tool for innovation research
is established.
In subsection 2.3.2 we have put forward a logical link between innovation in its generic sense and
social innovation at the workplace. We used the concept of “re-organization and innovation of work
23 The Community Innovation Survey (CIS) is the main statistical instrument of the European Union for measuring
innovation activities at firm level (cf. Armbruster et al., 2008)

98 Field Work and Data Collection
processes” as demonstrated by option four of Table 2-4. The Oslo manual defines innovation as
representing the implementation of service, process, or organizational method that is new or
significantly improved. This definition positions the Oslo manual as the appropriate tool for our
research to investigate the SIW concept in concordance with our Definition 2-17 in Chapter 2.
Therefore, it is appropriate for the operationalization of SIW.
Hence, we have utilized the Oslo manual as a base for the design of our data collection instrument.
The wordings of the questionnaire were slightly modified to reflect SIW at the departmental level
(see Table 5-6). The respondents were asked to give their opinions to what extent do they agree with
the eight statements regarding SIW by selecting on a continuum between “Strongly agree” (rating 1)
and “Strongly dis-agree” (rating 7) (see Appendix E for the complete data collection instrument).
The detailed process of the application of this instrument for data collection is discussed in section
5.3.
No Statements of the SIW questionnaire Variable Name 1 People in our department come up with few good ideas
on their own. SIW_Own_Idea
2 Few of our projects involve team members from different departments/units.
SIW_Own_Team
3 Typically, our people DO NOT collaborate on projects internally, cross departments and subsidiaries.
SIW_Collaborate
4 At our department, ideas from outside are not considered as valuable as those invented within.
SIW_Within_Idea
5 Few good ideas for new processes/services actually come from outside the department.
SIW_Outside_Idea
6 Our departmental culture makes it hard for people to put forward novel ideas.
SIW_Culture
7 We have tough rules for investment in new projects. SIW_Rules
8 We are too slow in realizing new ideas. SIW_Slow
Table 5-6 Operationalization statements for the SIW construct
5.2.4 Data Instrument – Departmental Performance
In order to investigate the effect of SIW on the departmental performance, there was a need to collect
data on departmental performance which was operationalized as consisting of three main factors (1)
cost reduction, (2) increased productivity (capacity), and (3) increased flexibility (subsection 5.1.4.).
For this reason, three statements from the Oslo manual, each representing one of the three
operationalized factors, were used. The data instrument requires the respondents to assess the effect
of innovation on the three statements on a scale from 1 to 7 (1= very high effect, 7=very low effect).
From IT Business Strategic Alignment to Performance 99
Table 5-7 depicts those statements as well as the variables associated with each statement (Appendix
F shows the complete data collection instrument).
No Statements of the Performance questionnaire Variable Name
1 Increased Production Flexibility P_Flexibility
2 Increased Production Capacity P_Capacity
3 Reduced labor cost / unit of production P_Cost
Table 5-7 The performance data collection instrument
The details of the data collection process are described in section 5.3. The collected data are described
in section 5.4 and analyzed in Chapter 6.
5.3 Data Collection
In order to investigate the relationships that are proposed in our conceptual model, it is necessary to
obtain data on the variables reflecting (operationalizing) the following constructs: ITBSA, EGIT,
SIW, and performance. The data will be collected at the following organizational levels.
1. On the level of the organization: the data on variables related to EGIT will be collected for
the organization as a whole.
2. On the departmental level: for each participating department, there is a need to obtain the
following data.
a. Data on variables (indicators) reflecting the ITBSA construct (the specific
department’s strategic alignment with the IT department).
b. Data on variables (indicators) reflecting the SIW construct.
c. Data on variables (indicators) reflecting the departmental performance construct (the
department’s performance enhancement as a result of SIW).
We will describe the general data collection process in subsection 5.3.1. The common method bias
will be considered in subsection 5.3.2. There we also describe the precautions that are undertaken to
minimize its effect.
5.3.1 The Data Collection Process
Our aim is to improve the generalizability of the results. Therefore, we formulate the two goals:

Cha
pter
5
98 Field Work and Data Collection
processes” as demonstrated by option four of Table 2-4. The Oslo manual defines innovation as
representing the implementation of service, process, or organizational method that is new or
significantly improved. This definition positions the Oslo manual as the appropriate tool for our
research to investigate the SIW concept in concordance with our Definition 2-17 in Chapter 2.
Therefore, it is appropriate for the operationalization of SIW.
Hence, we have utilized the Oslo manual as a base for the design of our data collection instrument.
The wordings of the questionnaire were slightly modified to reflect SIW at the departmental level
(see Table 5-6). The respondents were asked to give their opinions to what extent do they agree with
the eight statements regarding SIW by selecting on a continuum between “Strongly agree” (rating 1)
and “Strongly dis-agree” (rating 7) (see Appendix E for the complete data collection instrument).
The detailed process of the application of this instrument for data collection is discussed in section
5.3.
No Statements of the SIW questionnaire Variable Name 1 People in our department come up with few good ideas
on their own. SIW_Own_Idea
2 Few of our projects involve team members from different departments/units.
SIW_Own_Team
3 Typically, our people DO NOT collaborate on projects internally, cross departments and subsidiaries.
SIW_Collaborate
4 At our department, ideas from outside are not considered as valuable as those invented within.
SIW_Within_Idea
5 Few good ideas for new processes/services actually come from outside the department.
SIW_Outside_Idea
6 Our departmental culture makes it hard for people to put forward novel ideas.
SIW_Culture
7 We have tough rules for investment in new projects. SIW_Rules
8 We are too slow in realizing new ideas. SIW_Slow
Table 5-6 Operationalization statements for the SIW construct
5.2.4 Data Instrument – Departmental Performance
In order to investigate the effect of SIW on the departmental performance, there was a need to collect
data on departmental performance which was operationalized as consisting of three main factors (1)
cost reduction, (2) increased productivity (capacity), and (3) increased flexibility (subsection 5.1.4.).
For this reason, three statements from the Oslo manual, each representing one of the three
operationalized factors, were used. The data instrument requires the respondents to assess the effect
of innovation on the three statements on a scale from 1 to 7 (1= very high effect, 7=very low effect).
From IT Business Strategic Alignment to Performance 99
Table 5-7 depicts those statements as well as the variables associated with each statement (Appendix
F shows the complete data collection instrument).
No Statements of the Performance questionnaire Variable Name
1 Increased Production Flexibility P_Flexibility
2 Increased Production Capacity P_Capacity
3 Reduced labor cost / unit of production P_Cost
Table 5-7 The performance data collection instrument
The details of the data collection process are described in section 5.3. The collected data are described
in section 5.4 and analyzed in Chapter 6.
5.3 Data Collection
In order to investigate the relationships that are proposed in our conceptual model, it is necessary to
obtain data on the variables reflecting (operationalizing) the following constructs: ITBSA, EGIT,
SIW, and performance. The data will be collected at the following organizational levels.
1. On the level of the organization: the data on variables related to EGIT will be collected for
the organization as a whole.
2. On the departmental level: for each participating department, there is a need to obtain the
following data.
a. Data on variables (indicators) reflecting the ITBSA construct (the specific
department’s strategic alignment with the IT department).
b. Data on variables (indicators) reflecting the SIW construct.
c. Data on variables (indicators) reflecting the departmental performance construct (the
department’s performance enhancement as a result of SIW).
We will describe the general data collection process in subsection 5.3.1. The common method bias
will be considered in subsection 5.3.2. There we also describe the precautions that are undertaken to
minimize its effect.
5.3.1 The Data Collection Process
Our aim is to improve the generalizability of the results. Therefore, we formulate the two goals:

100 Field Work and Data Collection
(1) the results should be derived from multinational/multicultural firms, and
(2) the results should be derived from a set of diverse industries.
The consequences are as follows. (Ad1) Only multinational firms (or organizations strongly
associated with multinational firms, such as affiliates of international banks) operating in Yemen
should be approached with the request to participate in the multi-questionnaire survey.
(Ad2) Diversification of industries was attempted as much as practically possible. The four major
sectors with prominent international presence in Yemen are (a) banking, (b) communications, (c) oil
and gas production, and (d) higher education.
The choice of the 20 international organizations was based on (1) consultation with a group of MBA
students (active managers in the field) and also (2) an advise and confirmation of the choices by the
local chamber of commerce to be a valid list of international organizations actively operating in
Yemen at that time. The participating organizations had diversified backgrounds including USA,
Canada, Europe, Africa, and the Middle East. Moreover, there was a significant cultural mix among
the employees of those organizations. Our aim was that these diversifications (corporate backgrounds
and cultural) would improve the generalizability of the results.
The 20 organizations were approached as follows: (a) nine banks (all banks in Yemen with foreign
association), (b) three communication companies (all the local communications companies), (c) six
oil production companies (all foreign oil exploration companies that were at the production level),
and (d) two international higher education universities (there were only two universities with foreign
association at the time of this study). Eight of the twenty approached organizations agreed to
participate (see Table 5-8, 3rd column). The questionnaire study received a cumulative 40% response
rate (see again Table 5-8, 4th column). This is a reasonable response rate considering similar IT
Governance and strategic alignment surveys (cf. Sabherwal & Chan, 2001; Vaswani, 2003; Héroux
& Fortin, 2016).
Industry No. of organizations approached
No. of organizations accepted to participate
Response Rate
Banking 9 4 44% Communications 3 1 33% Oil & Gas 6 2 33% Higher Education 2 1 50% Totals 20 8 40%
Table 5-8 Study response rate
From IT Business Strategic Alignment to Performance 101
Due to the fact that EGIT is the inevitable construct to be studied (without which the data will have
no value to the study) the organizations were approached through their IT senior managers. A letter
explaining the purpose and details of the study was directed to each of the targeted organizations.
Once the IT senior managers agreed in principle to participate in the study, they were requested to
forward the issue to the organizational senior management for final approval.
Once acceptance was granted, the IT managers were requested to fill the EGIT questionnaire and
consequently they were encouraged to solicit the participation of the other departments in the
organization to fill the ITBSA, SIW, and the performance questionnaires. The approached
organizations were promised insights into the results of their industry averaged over participants as a
reward for their participation in the study (please note, local industry averages are not available in
Yemen). Due to the sensitivity of some of the statements on the survey (e.g., “Senior management
has no vision for the role of IT” on the ITBSA questionnaire) the participating organizations (and
departments) have all requested anonymity of their specific names and department titles.
Consequently, the departments were only numbered and no specific department-naming was attached
to any of the questionnaires to encourage the highest possible response rate.
In order to accommodate the possibility of non-English speaking executives at the participating
organizations, the questionnaire was translated into Arabic by a professional business-oriented
translator and confirmed (through reverse translation) by two EMBA graduating students.
Initially, the questionnaires were tested in a pilot study including 12 EMBA students in their second
year of study. The EMBA program participants were middle and senior managers in various industries
including: communication, engineering companies, financial services, IT companies, and medical
services organizations. They were asked to fill all of the three questionnaires and comment on any
difficulties and/or misunderstandings. There were no major inquiries and the questions seemed
sensible and reasonable to understand in a reasonable time frame. There were minor corrections to
the Arabic version of the questionnaire.
Eventually, a total of 111 senior managers of various departments in a total of eight organizations
have participated in the survey. In terms of sample adequacy, we have taken into consideration the
following established standard arguments taken from Boomsma (1982). Boomsma has suggested that
the ratio r = p/k (where p=number of indicators, and k=number of latent variables) is used to estimate
an adequate sample size. Moreover, Boomsma has suggested a sample size of 100 for r=4, a sample

Cha
pter
5
100 Field Work and Data Collection
(1) the results should be derived from multinational/multicultural firms, and
(2) the results should be derived from a set of diverse industries.
The consequences are as follows. (Ad1) Only multinational firms (or organizations strongly
associated with multinational firms, such as affiliates of international banks) operating in Yemen
should be approached with the request to participate in the multi-questionnaire survey.
(Ad2) Diversification of industries was attempted as much as practically possible. The four major
sectors with prominent international presence in Yemen are (a) banking, (b) communications, (c) oil
and gas production, and (d) higher education.
The choice of the 20 international organizations was based on (1) consultation with a group of MBA
students (active managers in the field) and also (2) an advise and confirmation of the choices by the
local chamber of commerce to be a valid list of international organizations actively operating in
Yemen at that time. The participating organizations had diversified backgrounds including USA,
Canada, Europe, Africa, and the Middle East. Moreover, there was a significant cultural mix among
the employees of those organizations. Our aim was that these diversifications (corporate backgrounds
and cultural) would improve the generalizability of the results.
The 20 organizations were approached as follows: (a) nine banks (all banks in Yemen with foreign
association), (b) three communication companies (all the local communications companies), (c) six
oil production companies (all foreign oil exploration companies that were at the production level),
and (d) two international higher education universities (there were only two universities with foreign
association at the time of this study). Eight of the twenty approached organizations agreed to
participate (see Table 5-8, 3rd column). The questionnaire study received a cumulative 40% response
rate (see again Table 5-8, 4th column). This is a reasonable response rate considering similar IT
Governance and strategic alignment surveys (cf. Sabherwal & Chan, 2001; Vaswani, 2003; Héroux
& Fortin, 2016).
Industry No. of organizations approached
No. of organizations accepted to participate
Response Rate
Banking 9 4 44% Communications 3 1 33% Oil & Gas 6 2 33% Higher Education 2 1 50% Totals 20 8 40%
Table 5-8 Study response rate
From IT Business Strategic Alignment to Performance 101
Due to the fact that EGIT is the inevitable construct to be studied (without which the data will have
no value to the study) the organizations were approached through their IT senior managers. A letter
explaining the purpose and details of the study was directed to each of the targeted organizations.
Once the IT senior managers agreed in principle to participate in the study, they were requested to
forward the issue to the organizational senior management for final approval.
Once acceptance was granted, the IT managers were requested to fill the EGIT questionnaire and
consequently they were encouraged to solicit the participation of the other departments in the
organization to fill the ITBSA, SIW, and the performance questionnaires. The approached
organizations were promised insights into the results of their industry averaged over participants as a
reward for their participation in the study (please note, local industry averages are not available in
Yemen). Due to the sensitivity of some of the statements on the survey (e.g., “Senior management
has no vision for the role of IT” on the ITBSA questionnaire) the participating organizations (and
departments) have all requested anonymity of their specific names and department titles.
Consequently, the departments were only numbered and no specific department-naming was attached
to any of the questionnaires to encourage the highest possible response rate.
In order to accommodate the possibility of non-English speaking executives at the participating
organizations, the questionnaire was translated into Arabic by a professional business-oriented
translator and confirmed (through reverse translation) by two EMBA graduating students.
Initially, the questionnaires were tested in a pilot study including 12 EMBA students in their second
year of study. The EMBA program participants were middle and senior managers in various industries
including: communication, engineering companies, financial services, IT companies, and medical
services organizations. They were asked to fill all of the three questionnaires and comment on any
difficulties and/or misunderstandings. There were no major inquiries and the questions seemed
sensible and reasonable to understand in a reasonable time frame. There were minor corrections to
the Arabic version of the questionnaire.
Eventually, a total of 111 senior managers of various departments in a total of eight organizations
have participated in the survey. In terms of sample adequacy, we have taken into consideration the
following established standard arguments taken from Boomsma (1982). Boomsma has suggested that
the ratio r = p/k (where p=number of indicators, and k=number of latent variables) is used to estimate
an adequate sample size. Moreover, Boomsma has suggested a sample size of 100 for r=4, a sample

102 Field Work and Data Collection
size of 200 for r=3, and 400 for r=2. Basically, he is suggesting the following formula in calculating
the minimum sample size:
n >= 50(r)2 - 450r + 1100 (n= sample size)
In our study, this ratio is 18/4 = 4.5. This calculates to a minimum of 87.5 observations. Therefore,
our 103 valid observations are in the appropriate range.
For further confirmation, Hatcher (1994) recommended that the number of subjects should be the
larger one of (a) 5 times the number of variables, or (b) 100. In our case, we have 18 variables which
calculates to (18 x 5 = 90), i.e., suggesting that 103 observations (the largest of 90 and 100) is
adequate. Due to the fact that the unit of analysis for this research is the departmental level, the
number of departmental observations is considered to be our sample size. Therefore, the number of
responses is sufficient for the type of analysis needed to answer the research questions.
We are aware that thirty years ago, it was impossible to have computer questionnaires. However, we
believed that the theory cited is still valid, since the full population of such multinationals with a large
diversity is an almost “overseeable” set of firms.
For the four different industries (banking, communications, oil & gas, and higher education) we
designed the same questionnaires in order to receive consistent answers (data) over different
industries. Off course, our submission letter was different for each organization in each industry.
During the data collection process, the four questionnaires were initially handed to the IT senior
executive. A designated person at the IT department was requested to act as a coordinator with the
other participating departments. The IT executive was asked to fill in the EGIT questionnaire and the
coordinator was requested to hand a copy of the ITBSA, SIW, and performance questionnaires to
each of the senior executives at the other departments that has agreed to participate in the survey. The
ITBSA, SIW, and performance questionnaires were sequentially numbered in order to maintain
anonymity and enable the process of grouping questionnaires from a given department. The
executives of the participating departments were kindly requested to have the ITBSA, SIW, and
performance questionnaires filled by a different senior manager (as many as practically was possible).
This was to avoid the effect of common method bias as much as possible (see subsection 5.3.2 for a
discussion of this issue). A series of follow-up calls were made to the coordinators at the IT
From IT Business Strategic Alignment to Performance 103
departments to follow on the individual departments. In certain cases, the executives of the individual
departments were contacted to stimulate responses. The whole process took a little over nine months.
A difficulty was faced with some senior managers not filling any of the sequence of questionnaires
(ITBSA, SIW, and performance) due to travel, other priorities or simply not willing to spend more
time in cooperating with the research project. Eventually, there were 111 (groups) of questionnaires
received.
Out of the 111 questionnaires, 6 questionnaires had missing data (several blank fields) and were
eliminated. Two questionnaires had outliers where the respondents filled the highest value for all
questions (5 on a five scale and 7 on a seven scale questionnaires). A final set of 103 questionnaires
was used in the analysis. Table 5-9 depicts the numbering of the participating organizations as it is
used throughout this study. The grouping is in descending order of the four types of firms.
Org. Main Activities Multinational Status 1 Banking Branch of an MNC 2 Banking Branch of an MNC 3 Banking Closely affiliated with an MNC 4 Banking Closely affiliated with an MNC 5 Oil and Gas exploration services Direct subsidiary of an MNC 6 Oil and Gas exploration services Direct subsidiary of an MNC 7 Communications Direct subsidiary of an MNC 8 Higher Education Institute Direct subsidiary of an MNC
Table 5-9 Overview of the participating organizations in the survey
5.3.2 Considerations of the “Common Method Bias”
Researchers agree that common method bias is a potential problem for a measurement error in
behavioral research (cf. Podsakoff, MacKenzie, & Lee, 2003). This problem could threaten the
validity of the conclusions about the relationships between measures (cf. Bagozzi & Yi, 1991)24.
Taking into account the possible occurrence of such reasons, our study has given this problem a
serious consideration. Three precaution measures were taken to avoid the common method bias as
much as practically possible.
24 According to Bagozzi and Yi (1991), it refers to the variance of the measurement method as opposed to the concerned
construct. “At a more abstract level, method effects might be interpreted in terms of response biases such as halo effects,
social desirability, acquiescence, leniency effects, or yea- and nay-saying”

Cha
pter
5
102 Field Work and Data Collection
size of 200 for r=3, and 400 for r=2. Basically, he is suggesting the following formula in calculating
the minimum sample size:
n >= 50(r)2 - 450r + 1100 (n= sample size)
In our study, this ratio is 18/4 = 4.5. This calculates to a minimum of 87.5 observations. Therefore,
our 103 valid observations are in the appropriate range.
For further confirmation, Hatcher (1994) recommended that the number of subjects should be the
larger one of (a) 5 times the number of variables, or (b) 100. In our case, we have 18 variables which
calculates to (18 x 5 = 90), i.e., suggesting that 103 observations (the largest of 90 and 100) is
adequate. Due to the fact that the unit of analysis for this research is the departmental level, the
number of departmental observations is considered to be our sample size. Therefore, the number of
responses is sufficient for the type of analysis needed to answer the research questions.
We are aware that thirty years ago, it was impossible to have computer questionnaires. However, we
believed that the theory cited is still valid, since the full population of such multinationals with a large
diversity is an almost “overseeable” set of firms.
For the four different industries (banking, communications, oil & gas, and higher education) we
designed the same questionnaires in order to receive consistent answers (data) over different
industries. Off course, our submission letter was different for each organization in each industry.
During the data collection process, the four questionnaires were initially handed to the IT senior
executive. A designated person at the IT department was requested to act as a coordinator with the
other participating departments. The IT executive was asked to fill in the EGIT questionnaire and the
coordinator was requested to hand a copy of the ITBSA, SIW, and performance questionnaires to
each of the senior executives at the other departments that has agreed to participate in the survey. The
ITBSA, SIW, and performance questionnaires were sequentially numbered in order to maintain
anonymity and enable the process of grouping questionnaires from a given department. The
executives of the participating departments were kindly requested to have the ITBSA, SIW, and
performance questionnaires filled by a different senior manager (as many as practically was possible).
This was to avoid the effect of common method bias as much as possible (see subsection 5.3.2 for a
discussion of this issue). A series of follow-up calls were made to the coordinators at the IT
From IT Business Strategic Alignment to Performance 103
departments to follow on the individual departments. In certain cases, the executives of the individual
departments were contacted to stimulate responses. The whole process took a little over nine months.
A difficulty was faced with some senior managers not filling any of the sequence of questionnaires
(ITBSA, SIW, and performance) due to travel, other priorities or simply not willing to spend more
time in cooperating with the research project. Eventually, there were 111 (groups) of questionnaires
received.
Out of the 111 questionnaires, 6 questionnaires had missing data (several blank fields) and were
eliminated. Two questionnaires had outliers where the respondents filled the highest value for all
questions (5 on a five scale and 7 on a seven scale questionnaires). A final set of 103 questionnaires
was used in the analysis. Table 5-9 depicts the numbering of the participating organizations as it is
used throughout this study. The grouping is in descending order of the four types of firms.
Org. Main Activities Multinational Status 1 Banking Branch of an MNC 2 Banking Branch of an MNC 3 Banking Closely affiliated with an MNC 4 Banking Closely affiliated with an MNC 5 Oil and Gas exploration services Direct subsidiary of an MNC 6 Oil and Gas exploration services Direct subsidiary of an MNC 7 Communications Direct subsidiary of an MNC 8 Higher Education Institute Direct subsidiary of an MNC
Table 5-9 Overview of the participating organizations in the survey
5.3.2 Considerations of the “Common Method Bias”
Researchers agree that common method bias is a potential problem for a measurement error in
behavioral research (cf. Podsakoff, MacKenzie, & Lee, 2003). This problem could threaten the
validity of the conclusions about the relationships between measures (cf. Bagozzi & Yi, 1991)24.
Taking into account the possible occurrence of such reasons, our study has given this problem a
serious consideration. Three precaution measures were taken to avoid the common method bias as
much as practically possible.
24 According to Bagozzi and Yi (1991), it refers to the variance of the measurement method as opposed to the concerned
construct. “At a more abstract level, method effects might be interpreted in terms of response biases such as halo effects,
social desirability, acquiescence, leniency effects, or yea- and nay-saying”

104 Field Work and Data Collection
First, a great deal of effort was made to obtain the measures of the predictor and the independent
variables at different times and from different persons. The ITBSA questionnaire was given (sent) to
the senior managers of the departments first. After responses were received, the SIW questionnaire
was distributed and the departments were asked to kindly have it filled by a separate senior manager
or a senior employee (of course only if practically possible). Even in cases where the measurement
responses were provided by the same senior manager, a time lag and a proximal separation was
created. The same was applied to the performance questionnaire. This technique aims to (1) reduce
the respondent’s motivation to use previous answers to fill in gaps by what is recalled and (2) to allow
previously recalled information to leave the short-term memory.
Second, the respondent’s anonymity was protected by assuring the respondents that (a) their
department names will be anonymous and (b) will only be numbered for the purpose of creating
matching pairs of responses (ITBSA, innovation, and performance) in an effort to reduce the potential
for “socially desirable” responses. Here we remark the following. Since some of the questions
prompted the respondent to evaluate the behavior and knowledge of the senior management, the
anonymity measure has increased the probability of “honest” responses.
Third, some of the questions were on purpose originally somewhat negatively worded. The idea was
that this would aid in reducing the probability of a response pattern bias.
5.4 General Description of the Collected Data
The purpose of this section is to (a) provide the reader with a general overview of the collected data
to reflect the constructs of this study, namely, ITBSA, EGIT, SIW, and performance, and (b) to show
that our data is in alignment with the trends in the prevailing literature. A detailed and statistical
analysis will be provided in Chapter 6. Subsection 5.4.1 will provide a general description of the
ITBSA data. EGIT-related data will be described in subsection 5.4.2. Subsection 5.4.3 will describe
the SIW and the supporting SIW-related data. Finally, subsection 5.4.4 will refer to the performance
data.
5.4.1 Data of ITBSA
The aim of collecting the data related to the ITBSA construct variables is to evaluate to which extent
a strategic alignment between each individual department and the IT department exist. The collected
data is critical to all relationships that will be investigated in this study. It will assist in (a) the analysis
From IT Business Strategic Alignment to Performance 105
of the effect of ITBSA on SIW, (b) investigating the effect of EGIT on the relationship between
ITBSA and SIW, and (c) the analysis of the role of SIW on the relationship between ITBSA and
departmental performance.
Subsections 5.1.1 and 5.2.1 have depicted the statements that were used in the questionnaire to
represent variables reflecting the ITBSA construct (see Table 5-2). Each department’s senior manager
was asked to evaluate the level of strategic alignment with the IT department through the evaluation
of the ten statements in Table 5-2 on a scale was from 1 to 5 (1=always true, 5=never true). Table
5-10 depicts the descriptive statistics of the collected data reflecting the ITBSA construct.
Basic examination of the statistics in Table 5-10 reveals the following three basic facts. First, our
average score of ITBSA is 3.08. De Haes & Van Grembergen (2009) suggest that a score of 3 is
appropriate for organizatios dependent in their operations on IT. Moreover, Luftman & Kempaiah
(2008) has reported an average strategic alignment score of 3.04 among a group of 197
global organizations. And Lahdelma (2010) has reported a mean score of 3.03 for ITBSA.
Therefore, we consider our average to be in alignment with the common literature on
ITBSA.
Second, De Haes & Van Grembergen (2009) has found the score of financial sector firms (in
Belgioum) to be 2.69. They have suggested that due to the dependecy on IT and strong impact of
regulations in the financial sector, the score should be at least 3. Moreover, Luftman & Kempaiah
(2007) have found that, contrary to the expected opinion, financial organizations had a lower
alignment score compared to the manufacturing organizations. In our collected data, we found that
the financial (banks) sector had an average ITBSA score of 3.0 (see Table 5-11) , where the oil & gas
sector has a higher score of 3.8. Our results are also in contrast to the expected opinion, yet in
alignment with the above mentioned literature.

Cha
pter
5
104 Field Work and Data Collection
First, a great deal of effort was made to obtain the measures of the predictor and the independent
variables at different times and from different persons. The ITBSA questionnaire was given (sent) to
the senior managers of the departments first. After responses were received, the SIW questionnaire
was distributed and the departments were asked to kindly have it filled by a separate senior manager
or a senior employee (of course only if practically possible). Even in cases where the measurement
responses were provided by the same senior manager, a time lag and a proximal separation was
created. The same was applied to the performance questionnaire. This technique aims to (1) reduce
the respondent’s motivation to use previous answers to fill in gaps by what is recalled and (2) to allow
previously recalled information to leave the short-term memory.
Second, the respondent’s anonymity was protected by assuring the respondents that (a) their
department names will be anonymous and (b) will only be numbered for the purpose of creating
matching pairs of responses (ITBSA, innovation, and performance) in an effort to reduce the potential
for “socially desirable” responses. Here we remark the following. Since some of the questions
prompted the respondent to evaluate the behavior and knowledge of the senior management, the
anonymity measure has increased the probability of “honest” responses.
Third, some of the questions were on purpose originally somewhat negatively worded. The idea was
that this would aid in reducing the probability of a response pattern bias.
5.4 General Description of the Collected Data
The purpose of this section is to (a) provide the reader with a general overview of the collected data
to reflect the constructs of this study, namely, ITBSA, EGIT, SIW, and performance, and (b) to show
that our data is in alignment with the trends in the prevailing literature. A detailed and statistical
analysis will be provided in Chapter 6. Subsection 5.4.1 will provide a general description of the
ITBSA data. EGIT-related data will be described in subsection 5.4.2. Subsection 5.4.3 will describe
the SIW and the supporting SIW-related data. Finally, subsection 5.4.4 will refer to the performance
data.
5.4.1 Data of ITBSA
The aim of collecting the data related to the ITBSA construct variables is to evaluate to which extent
a strategic alignment between each individual department and the IT department exist. The collected
data is critical to all relationships that will be investigated in this study. It will assist in (a) the analysis
From IT Business Strategic Alignment to Performance 105
of the effect of ITBSA on SIW, (b) investigating the effect of EGIT on the relationship between
ITBSA and SIW, and (c) the analysis of the role of SIW on the relationship between ITBSA and
departmental performance.
Subsections 5.1.1 and 5.2.1 have depicted the statements that were used in the questionnaire to
represent variables reflecting the ITBSA construct (see Table 5-2). Each department’s senior manager
was asked to evaluate the level of strategic alignment with the IT department through the evaluation
of the ten statements in Table 5-2 on a scale was from 1 to 5 (1=always true, 5=never true). Table
5-10 depicts the descriptive statistics of the collected data reflecting the ITBSA construct.
Basic examination of the statistics in Table 5-10 reveals the following three basic facts. First, our
average score of ITBSA is 3.08. De Haes & Van Grembergen (2009) suggest that a score of 3 is
appropriate for organizatios dependent in their operations on IT. Moreover, Luftman & Kempaiah
(2008) has reported an average strategic alignment score of 3.04 among a group of 197
global organizations. And Lahdelma (2010) has reported a mean score of 3.03 for ITBSA.
Therefore, we consider our average to be in alignment with the common literature on
ITBSA.
Second, De Haes & Van Grembergen (2009) has found the score of financial sector firms (in
Belgioum) to be 2.69. They have suggested that due to the dependecy on IT and strong impact of
regulations in the financial sector, the score should be at least 3. Moreover, Luftman & Kempaiah
(2007) have found that, contrary to the expected opinion, financial organizations had a lower
alignment score compared to the manufacturing organizations. In our collected data, we found that
the financial (banks) sector had an average ITBSA score of 3.0 (see Table 5-11) , where the oil & gas
sector has a higher score of 3.8. Our results are also in contrast to the expected opinion, yet in
alignment with the above mentioned literature.

106 Field Work and Data Collection
No. Statements N Min Max Mean Std. Dev.
1 Senior management has no vision on the role of IT
103 1 5 3.21 1.026
2 Vital information necessary to make decisions is often missing
103 1 5 3.21 0.90
3 Management perceives little value from computing
103 1 5 3.41 0.95
4 A "them and us" mentality prevails (with IT people)
103 1 5 2.75 0.99
5 The IT group drives IT projects 103 1 5 2.74 1.00
6 It's hard to get financial approval for IT projects
103 1 5 2.87 0.94
7 There is no IT component in the division's strategy
103 1 5 3.19 1.01
8 Islands of automation exist
103 1 5 2.81 0.89
9 IT does not help with the hard tasks 103 1 5 3.46 0.84
10 Senior management sees outsourcing as a way to control IT
103 1 5 3.13 0.92
Ave
3.08
Table 5-10 ITBSA data descriptive statistics
Third, Luftman & Kempaiah (2007) have concluded that their average score of the service sector
(calculaed as being 2.3) is below that of the financial sector and the manufacturing sector. Our study
has shown that a combined average score for the service sector begins at 2.65, which is also below
the financial and manufacturing sectors.
All in all, we consider our collected data on the variables reflecting the ITBSA construct as being
reasonbly aligned with similar data in the literature.
No. Sector Strategic Alignment Score
1 Financial 3.00
2 Oil & Gas 3.60
3 Services (Communication + Education) 2.65
Table 5-11 ITBSA scores by sector
5.4.2 Data of EGIT
The EGIT components (processes, structures, and relational mechanisms) were calculated as the
averages of the respondent’s answers to the statements in the questionnaire on each of those
From IT Business Strategic Alignment to Performance 107
components. Those averaged single dimensions were then fed into the SEM model to form the
organizational EGIT construct (see Chapter 6). For demonstration purposes, EGIT was calculated
here as an average of the three sub-constructs of EGIT, namely, processes, structures, and relational
mechanisms (cf. De Haes & Van Grembergen, 2009; Van Grembergen & De Haes, 2012).
Table 5-12 summarizes the descriptive statistics for each sub-construct of the EGIT (processes,
structures, and relational mechanisms). This table is sorted in an ascending order by the composite
score of EGIT. By closer examination of the EGIT scores, we notice two issues. (1) Out of the three
organizations with the lowest scores of EGIT (organizations 5, 6, and 8), two organizations (5 & 6)
had a high relative score for relational mechanisms as compared to the scores of processes and
structures. (2) The three organizations with the highest EGIT scores (4, 2, and 7) had a relatively low
score for relational mechanisms as compared to the scores of processes and structures. This implies
that, in alignment with the argument given by De Haes & Van Grembergen (2009), organizations that
are at the start of the process of implementing the EGIT (indicated by a low average scores of EGIT),
are more focused on relational mechanisms (such as awarness campaigns, co-location (IT and
business departments). Whereas, organizations that have a more mature EGIT, are less focused on
those activities.
This finding is shown graphically by plotting average scores of processes, structures, and relational
mechanisms (vertical axis) against the overall EGIT score (horzontal axis). Each point on the graph
represents an organization at a given level of EGIT. The organizations were sorted in an increasing
order of EGIT score from left to the right of the horizontal axis.
EGIT
Organization Processes Structures Relational Mechanisms
1.3 8 1.5 1.2 1.1 2.4 5 2.2 2.1 2.9 3.0 6 2.6 3.0 3.4 3.0 1 2.7 3.1 3.3 3.1 3 2.9 2.8 3.7 3.3 4 3.3 3.8 3.0 3.6 2 3.5 3.8 3.4 4.1 7 4.9 4.02 3.4 Table 5-12 The basic distribution of the EGIT in the collected data

Cha
pter
5
106 Field Work and Data Collection
No. Statements N Min Max Mean Std. Dev.
1 Senior management has no vision on the role of IT
103 1 5 3.21 1.026
2 Vital information necessary to make decisions is often missing
103 1 5 3.21 0.90
3 Management perceives little value from computing
103 1 5 3.41 0.95
4 A "them and us" mentality prevails (with IT people)
103 1 5 2.75 0.99
5 The IT group drives IT projects 103 1 5 2.74 1.00
6 It's hard to get financial approval for IT projects
103 1 5 2.87 0.94
7 There is no IT component in the division's strategy
103 1 5 3.19 1.01
8 Islands of automation exist
103 1 5 2.81 0.89
9 IT does not help with the hard tasks 103 1 5 3.46 0.84
10 Senior management sees outsourcing as a way to control IT
103 1 5 3.13 0.92
Ave
3.08
Table 5-10 ITBSA data descriptive statistics
Third, Luftman & Kempaiah (2007) have concluded that their average score of the service sector
(calculaed as being 2.3) is below that of the financial sector and the manufacturing sector. Our study
has shown that a combined average score for the service sector begins at 2.65, which is also below
the financial and manufacturing sectors.
All in all, we consider our collected data on the variables reflecting the ITBSA construct as being
reasonbly aligned with similar data in the literature.
No. Sector Strategic Alignment Score
1 Financial 3.00
2 Oil & Gas 3.60
3 Services (Communication + Education) 2.65
Table 5-11 ITBSA scores by sector
5.4.2 Data of EGIT
The EGIT components (processes, structures, and relational mechanisms) were calculated as the
averages of the respondent’s answers to the statements in the questionnaire on each of those
From IT Business Strategic Alignment to Performance 107
components. Those averaged single dimensions were then fed into the SEM model to form the
organizational EGIT construct (see Chapter 6). For demonstration purposes, EGIT was calculated
here as an average of the three sub-constructs of EGIT, namely, processes, structures, and relational
mechanisms (cf. De Haes & Van Grembergen, 2009; Van Grembergen & De Haes, 2012).
Table 5-12 summarizes the descriptive statistics for each sub-construct of the EGIT (processes,
structures, and relational mechanisms). This table is sorted in an ascending order by the composite
score of EGIT. By closer examination of the EGIT scores, we notice two issues. (1) Out of the three
organizations with the lowest scores of EGIT (organizations 5, 6, and 8), two organizations (5 & 6)
had a high relative score for relational mechanisms as compared to the scores of processes and
structures. (2) The three organizations with the highest EGIT scores (4, 2, and 7) had a relatively low
score for relational mechanisms as compared to the scores of processes and structures. This implies
that, in alignment with the argument given by De Haes & Van Grembergen (2009), organizations that
are at the start of the process of implementing the EGIT (indicated by a low average scores of EGIT),
are more focused on relational mechanisms (such as awarness campaigns, co-location (IT and
business departments). Whereas, organizations that have a more mature EGIT, are less focused on
those activities.
This finding is shown graphically by plotting average scores of processes, structures, and relational
mechanisms (vertical axis) against the overall EGIT score (horzontal axis). Each point on the graph
represents an organization at a given level of EGIT. The organizations were sorted in an increasing
order of EGIT score from left to the right of the horizontal axis.
EGIT
Organization Processes Structures Relational Mechanisms
1.3 8 1.5 1.2 1.1 2.4 5 2.2 2.1 2.9 3.0 6 2.6 3.0 3.4 3.0 1 2.7 3.1 3.3 3.1 3 2.9 2.8 3.7 3.3 4 3.3 3.8 3.0 3.6 2 3.5 3.8 3.4 4.1 7 4.9 4.02 3.4 Table 5-12 The basic distribution of the EGIT in the collected data

108 Field Work and Data Collection
From the graphs we see that the relational mechanisms score increases up to a certain threshold
(approximately 3.5), thereafter, the level of relational mechanisms flattens out (see Figure 5-2)
as compared to the processes and structures. This graphical finding enforces the view that relational
mechanisms receive less focus after an organization has reached a certain level of EGIT maturity.
Figure 5-2 Average maturity levels of processes, structure and relational mechanisms
Finally, De Haes & Van Grembergen (2009) asserts that structures are easier to implement than
processes. In their research, their claim is based on the fact that structures are having a higher average
scores than processes. Our results are marginally in alignment with this claim. Table 5-13 shows our
statistics of the overall EGIT and its components. It can be seen that the mean of the scores for
structures (2.98) is slightly higher that the mean score for processes (2.96). The difference is marginal,
yet the result points to the expected direction. The analysis of the reasons behind the fact that
structures are easier to implement than processes is beyond the focus of this thesis. The purpse of the
description of the data as performed so far is, as mentioned in the introduction of this section, to
demonstrate that our data is in alignment with the general trend of the data in the prevailing literature.
EGIT Components N Minimum Maximum Mean Std. Deviation
EGIT_Processes 8 1.50 4.90 2.96 .94 EGIT_Structures 8 1.20 4.02 2.98 .90 EGIT_Relation 8 1.10 3.70 3.03 .76
Table 5-13 Descriptive statistics of the EGIT components
5.4.3 Data of Inter-Departmental Collaboration on SIW
Social innovation is innovation in the internationally recognized Oslo manual sense. Generally, social
innovation has to do with guiding public actions through the creation of new values that guide
collaborative working on service innovation. Social innovation approaches are (1) open rather than
-
1.00
2.00
3.00
4.00
5.00
PR
OC
ESSE
S A
VG
. SC
OR
E
1 ---------------------------------------------- > 4
EGIT SCORE
PROCESSES
-
1.00
2.00
3.00
4.00
5.00ST
RU
CTU
RES
A
VG
. SC
OR
E
1 ------------------------------------------------> 4
EGIT SCORE
STRUCTURES
-
1.00
2.00
3.00
4.00
5.00
RE
LATI
ON
AL
ME
CH
AN
ISM
S A
VG
. SC
OR
E
1 --------------------------------------------> 4
EGIT SCORE
RELATIONAL MECHANISMS
From IT Business Strategic Alignment to Performance 109
closed and (2) multi-disciplinary rather than single departmental when it comes to knowledge-sharing
and ownership.
To emphasize on the importance of our choice to operationalize SIW in terms of collaboration on
innovation, respondents were asked to assess the importance level of factors that hamper innovation
on the departmental level (see Appendix G for details of the SIW questionnaire). According to the
respondents, the most significant factors that hampered business innovation were (1) lack of qualified
personnel (64% of respondents) followed by (2) lack of information in general (60% of respondents).
The other factors hampering business innovation, are in descending order, (3) lack of information on
technology within the department (53% of departments), and (4) difficulty in finding cooperation
partners (50% of departments) (see Table 5-14). As a result, we could summarize the factors critical
to departmental innovation in descending order as follows, (1) inter-departmental collaboration in
personnel qualifications and (2) information exchange, and (3) information technology
(infrastructure) within the department.
Factors hampering innovation % of departments assessing the factor as
significant. Lack of qualified personnel 64% Lack of information 60% Lack of information on technology within the department 53% Difficulty in finding cooperation partners 50%
Table 5-14 Factors hampering innovation
This ranking of the reasons hampering innovation supports our choice of variables (indicators) for
the operationalization of SIW (see subsection 5.2.3). The majority of the eight statements from the
Oslo manual (statements 1-6) directly relate to the inter-departmental collaboration on innovation.
The remaining two statements (7,8) are indirect indicators of the need for various department’s
collaboration and support to put forward innovative ideas. Table 5-15 shows the descriptive statistics
of the 103 valid responses obtained by this study on the eight statements.

Cha
pter
5
108 Field Work and Data Collection
From the graphs we see that the relational mechanisms score increases up to a certain threshold
(approximately 3.5), thereafter, the level of relational mechanisms flattens out (see Figure 5-2)
as compared to the processes and structures. This graphical finding enforces the view that relational
mechanisms receive less focus after an organization has reached a certain level of EGIT maturity.
Figure 5-2 Average maturity levels of processes, structure and relational mechanisms
Finally, De Haes & Van Grembergen (2009) asserts that structures are easier to implement than
processes. In their research, their claim is based on the fact that structures are having a higher average
scores than processes. Our results are marginally in alignment with this claim. Table 5-13 shows our
statistics of the overall EGIT and its components. It can be seen that the mean of the scores for
structures (2.98) is slightly higher that the mean score for processes (2.96). The difference is marginal,
yet the result points to the expected direction. The analysis of the reasons behind the fact that
structures are easier to implement than processes is beyond the focus of this thesis. The purpse of the
description of the data as performed so far is, as mentioned in the introduction of this section, to
demonstrate that our data is in alignment with the general trend of the data in the prevailing literature.
EGIT Components N Minimum Maximum Mean Std. Deviation
EGIT_Processes 8 1.50 4.90 2.96 .94 EGIT_Structures 8 1.20 4.02 2.98 .90 EGIT_Relation 8 1.10 3.70 3.03 .76
Table 5-13 Descriptive statistics of the EGIT components
5.4.3 Data of Inter-Departmental Collaboration on SIW
Social innovation is innovation in the internationally recognized Oslo manual sense. Generally, social
innovation has to do with guiding public actions through the creation of new values that guide
collaborative working on service innovation. Social innovation approaches are (1) open rather than
-
1.00
2.00
3.00
4.00
5.00
PR
OC
ESSE
S A
VG
. SC
OR
E
1 ---------------------------------------------- > 4
EGIT SCORE
PROCESSES
-
1.00
2.00
3.00
4.00
5.00
STR
UC
TUR
ES
AV
G. S
CO
RE
1 ------------------------------------------------> 4
EGIT SCORE
STRUCTURES
-
1.00
2.00
3.00
4.00
5.00
RE
LATI
ON
AL
ME
CH
AN
ISM
S A
VG
. SC
OR
E
1 --------------------------------------------> 4
EGIT SCORE
RELATIONAL MECHANISMS
From IT Business Strategic Alignment to Performance 109
closed and (2) multi-disciplinary rather than single departmental when it comes to knowledge-sharing
and ownership.
To emphasize on the importance of our choice to operationalize SIW in terms of collaboration on
innovation, respondents were asked to assess the importance level of factors that hamper innovation
on the departmental level (see Appendix G for details of the SIW questionnaire). According to the
respondents, the most significant factors that hampered business innovation were (1) lack of qualified
personnel (64% of respondents) followed by (2) lack of information in general (60% of respondents).
The other factors hampering business innovation, are in descending order, (3) lack of information on
technology within the department (53% of departments), and (4) difficulty in finding cooperation
partners (50% of departments) (see Table 5-14). As a result, we could summarize the factors critical
to departmental innovation in descending order as follows, (1) inter-departmental collaboration in
personnel qualifications and (2) information exchange, and (3) information technology
(infrastructure) within the department.
Factors hampering innovation % of departments assessing the factor as
significant. Lack of qualified personnel 64% Lack of information 60% Lack of information on technology within the department 53% Difficulty in finding cooperation partners 50%
Table 5-14 Factors hampering innovation
This ranking of the reasons hampering innovation supports our choice of variables (indicators) for
the operationalization of SIW (see subsection 5.2.3). The majority of the eight statements from the
Oslo manual (statements 1-6) directly relate to the inter-departmental collaboration on innovation.
The remaining two statements (7,8) are indirect indicators of the need for various department’s
collaboration and support to put forward innovative ideas. Table 5-15 shows the descriptive statistics
of the 103 valid responses obtained by this study on the eight statements.

110 Field Work and Data Collection
No. Statements N Min Max Mean Std. Dev.
1 People in our department come up with few good ideas on their own.
103 1.00 7.00 3.28 1.41
2 Few of our projects involve team members from different departments/units 103 1.00 7.00 3.75 1.47
3 Typically, our people do not collaborate on projects internally, cross departments and subsidiaries
103 1.00 7.00 3.85 1.34
4 At our department, ideas from outside are not considered as valuable as those invented within
103 1.00 7.00 3.53 1.33
5 Few good ideas for new processes/services actually come from outside the department 103 1.00 7.00 3.42 1.41
6 Our departmental culture makes it hard for people to put forward novel ideas 103 1.00 7.01 3.61 1.45
7 We have tough rules for investment in new projects 103 1.00 7.00 3.39 1.63
8 We are too slow in realizing new ideas 103 1.00 7.00 3.30 1.45
Valid N 103
Table 5-15 Descriptive statistics for the SIW collected data
5.4.4 Data of Departmental Performance
Table 5-16 shows the basic descriptive statistics for the responses of 103 departments to the
statements reflecting the variables (indicators) operationalizing the departmental performance
construct (see subsection 5.1.4 for details of the instrument).
Statements N Min. Max. Mean Std. Deviation Increased Production Flexibility 103 3 7 5.73 0.93 Increased Production Capacity 103 3 7 5.12 1.12 Reduced labor cost / unit of production
103 2 7 4.91 1.15
Valid N 103 Table 5-16 Descriptive statistics of the effect of SIW on departmental performance
A basic examination of the descriptive statistics is given in Table 5-16. It shows that, in-spite of the
claim in the literature that cost considerations of performance are losing ground in favor of other
efficiency factors (cf. Robeson & O'Connor, 2007), our results slightly differ. The lowest mean
From IT Business Strategic Alignment to Performance 111
(which indicates the highest effect25) is still associated with product cost reduction. However, the
second highest effect is associated with increased capacity. Finally, according to our data, the least
effect of SIW on departmental performance is the improvement of production flexibility.
It is important to note that the means are very close to each other (all within less than one scale point),
indicating that all three factors are important, and the ordering is merely a numerical sequencing of
importance.
The collected data described in this chapter will be used in Chapter 6 to investigate the relationships
of our conceptual model, consequently, to provide (in Chapter 7) answers to our four research
questions and the problem statement of this study.
25 The questionnaire is setup such that 1=highest effect and 7=lowest effect. See subsection 5.2.4.

Cha
pter
5
110 Field Work and Data Collection
No. Statements N Min Max Mean Std. Dev.
1 People in our department come up with few good ideas on their own.
103 1.00 7.00 3.28 1.41
2 Few of our projects involve team members from different departments/units 103 1.00 7.00 3.75 1.47
3 Typically, our people do not collaborate on projects internally, cross departments and subsidiaries
103 1.00 7.00 3.85 1.34
4 At our department, ideas from outside are not considered as valuable as those invented within
103 1.00 7.00 3.53 1.33
5 Few good ideas for new processes/services actually come from outside the department 103 1.00 7.00 3.42 1.41
6 Our departmental culture makes it hard for people to put forward novel ideas 103 1.00 7.01 3.61 1.45
7 We have tough rules for investment in new projects 103 1.00 7.00 3.39 1.63
8 We are too slow in realizing new ideas 103 1.00 7.00 3.30 1.45
Valid N 103
Table 5-15 Descriptive statistics for the SIW collected data
5.4.4 Data of Departmental Performance
Table 5-16 shows the basic descriptive statistics for the responses of 103 departments to the
statements reflecting the variables (indicators) operationalizing the departmental performance
construct (see subsection 5.1.4 for details of the instrument).
Statements N Min. Max. Mean Std. Deviation Increased Production Flexibility 103 3 7 5.73 0.93 Increased Production Capacity 103 3 7 5.12 1.12 Reduced labor cost / unit of production
103 2 7 4.91 1.15
Valid N 103 Table 5-16 Descriptive statistics of the effect of SIW on departmental performance
A basic examination of the descriptive statistics is given in Table 5-16. It shows that, in-spite of the
claim in the literature that cost considerations of performance are losing ground in favor of other
efficiency factors (cf. Robeson & O'Connor, 2007), our results slightly differ. The lowest mean
From IT Business Strategic Alignment to Performance 111
(which indicates the highest effect25) is still associated with product cost reduction. However, the
second highest effect is associated with increased capacity. Finally, according to our data, the least
effect of SIW on departmental performance is the improvement of production flexibility.
It is important to note that the means are very close to each other (all within less than one scale point),
indicating that all three factors are important, and the ordering is merely a numerical sequencing of
importance.
The collected data described in this chapter will be used in Chapter 6 to investigate the relationships
of our conceptual model, consequently, to provide (in Chapter 7) answers to our four research
questions and the problem statement of this study.
25 The questionnaire is setup such that 1=highest effect and 7=lowest effect. See subsection 5.2.4.

112
This page is left intentionally blank
CHAPTER 6 DATA ANALYSIS and RESULTS
In this chapter, we empirically investigate the conceptual model developed in Chapter 4 by analyzing
the data described in Chapter 5. The course of the chapter is as follows. In section 6.1 we define and
justify our choice for the SEM (Structural Equation Modeling) methodology. In section 6.2, we select
our model-fit indicators. In section 6.3, the confirmatory factor analysis, validity analysis, and model
modification is performed. Finally, the SEM models, results and discussions are presented in section
6.4.
6.1 Why SEM?
In this section, we define and justify the use of the SEM methodology to investigate our proposed
conceptual model. In subsection 6.1.1 we define the SEM technique and briefly describe its advantage
over the method of OLS (Ordinary Least Square) regressions. In subsection 6.1.2 we present four
advantages of using SEM for our analysis. In subsection 6.1.3 we introduce the concept of theory
testing vs predictive application and justify our use of the theory testing approach.
6.1.1 SEM Defined
Structural Equation Modeling (SEM) is an advancement in the analysis of multiplicative effects,
mainly because of its ability to detect measurement errors within a given model (cf. Weston, Chan,
Gore, & Catalano, 2008; Yang, Yen, & Chiang, 2012). SEM definitions are hard to find, at least a
consensus definition. At this stage we provide a definition of SEM for this study.
Definition 6-1 Structural Equation Modeling
SEM is defined as “a test of a theory by specifying a model that represents predictions of that theory among plausible constructs measured with appropriate observed variables” (Hayduk, Cummings, Boadu, Pazderka-Robinson, & Boulianne, 2007).
Causal Relations in SEM
There has been a discussion in the literature relating to the actual role of SEM. Researchers are in
disagreement about the extent to which the results of SEM can be interpreted as a causal relations
among the latent variables. Nachtogall, Kroehne, Funke, & Steyer (2003) point out that SEM attempts
to asses to what extent does a given proposed model fits the empirical data. If a fit is found, we can
Cha
pter
6
112
This page is left intentionally blank
CHAPTER 6 DATA ANALYSIS and RESULTS
In this chapter, we empirically investigate the conceptual model developed in Chapter 4 by analyzing
the data described in Chapter 5. The course of the chapter is as follows. In section 6.1 we define and
justify our choice for the SEM (Structural Equation Modeling) methodology. In section 6.2, we select
our model-fit indicators. In section 6.3, the confirmatory factor analysis, validity analysis, and model
modification is performed. Finally, the SEM models, results and discussions are presented in section
6.4.
6.1 Why SEM?
In this section, we define and justify the use of the SEM methodology to investigate our proposed
conceptual model. In subsection 6.1.1 we define the SEM technique and briefly describe its advantage
over the method of OLS (Ordinary Least Square) regressions. In subsection 6.1.2 we present four
advantages of using SEM for our analysis. In subsection 6.1.3 we introduce the concept of theory
testing vs predictive application and justify our use of the theory testing approach.
6.1.1 SEM Defined
Structural Equation Modeling (SEM) is an advancement in the analysis of multiplicative effects,
mainly because of its ability to detect measurement errors within a given model (cf. Weston, Chan,
Gore, & Catalano, 2008; Yang, Yen, & Chiang, 2012). SEM definitions are hard to find, at least a
consensus definition. At this stage we provide a definition of SEM for this study.
Definition 6-1 Structural Equation Modeling
SEM is defined as “a test of a theory by specifying a model that represents predictions of that theory among plausible constructs measured with appropriate observed variables” (Hayduk, Cummings, Boadu, Pazderka-Robinson, & Boulianne, 2007).
Causal Relations in SEM
There has been a discussion in the literature relating to the actual role of SEM. Researchers are in
disagreement about the extent to which the results of SEM can be interpreted as a causal relations
among the latent variables. Nachtogall, Kroehne, Funke, & Steyer (2003) point out that SEM attempts
to asses to what extent does a given proposed model fits the empirical data. If a fit is found, we can

114 Data Analysis and Results
assume that the data supports both the measurement model (relationship between latent and observed
variables), and the structural model (the proposed relationship between the latent variables).
Nevertheless, Nachtogall et al. (2003) emphasize the point that even if we use the word “effect” to
express the relationship between the latent variables, it does not imply that the proposed structural
model (even if well fitted) is a causal model.
On the other side of the spectrum is an opinion that attempts to preserve some implication of “effect”
to the SEM model’s results. This view includes researchers such as Pearl (2012) who agrees that the
issue of causality in SEM is controversial. At the start of his paper, Pearl states that “The role of
causality in SEM research is widely perceived to be, on the one hand, of pivotal methodological
importance and, on the other hand, confusing, enigmatic, and controversial” (cf. Pearl, 2012).
Initially, he introduces the views of those researchers who oppose to the use of SEM results as being
causal relations. Perl cites Wilkinson & Task Force (1999) asserting that “The use of complicated
causal-modeling software [read SEM] rarely yields any results that have any interpretation as causal
effects”. Later, Pearl (2012) points out that the statement by Wilkinson & Task Force (1999) might
be an “overstatement”, and puts forward the following question “If SEM methods do not ‘prove’
causation, how can they yield results that have causal interpretation?”.
According to Pearl’s view, the controversy lies in the presence of a logical gap between “establishing
causation” through an elaborate experimental testing and “interpreting” parameters as causal effects
which are based on a previous scientific and theoretical knowledge. By using this proposition, Pearl
implies that if the proposed relations among the latent variables in a model are based on previously
tested and documented relationships, the results could be “interpreted” as indicating a possible causal
direction (without being proven). This view brings both sides of the controversy a bit closer.
Nachtogall et al. (2003) also proposes a compromising view by stating that (a) many users of SEM
are implicitly interested in “indicating” causality, and (b) a framework of mathematically formalized
theory has been developed for testing causality in SEM.
In our research, we have based the directional relations of our proposed complex model on previously
established models from the literature. We have explored and described our complex model involving
those relations by fitting the model to the empirical data. We interpret our results only as “effects”
and have not explicitly “established causality” by experimental testing methods.
From IT Business Strategic Alignment to Performance 115
SEM vs OLS
OLS (Ordinary Least Square) regression generally assumes that all variables are measured without
an error and that they are perfectly reliable. This assumption is rarely true and may result in an
unknown parameter estimate bias (cf. Busemeyer & Jones, 1983). The measurement error is not only
problematic for all variables in the regression, but is also challenging to the reliability of the
interaction term (used for moderation analysis) of which the reliability is a result of its principal
variables from which it is composed (cf. Little et al., 2007). In our thesis we incorporate an interaction
term to estimate the moderating effect of EGIT on the relationship between ITBSA, SIW, and
performance. Therefore, a series of regressions might not yield a reliable results and SEM will be the
approach of choice.
6.1.2 Advantages of Using SEM
There are four main advantages in using SEM over other methods in the examination of mediated
and moderated models.
First, the SEM method possesses the ability to accommodate estimates of error variance, while other
methods (such as path analysis or regression) assume that all variables are measured without error
(cf. Weston et al., 2008).
Second, the SEM method uses latent variables as opposed to observed variables. Latent variables
represent scores of several observed variables assumed to be measuring the same phenomenon. In
mediation and moderation studies, using latent variables has an advantage of providing better
reliability. This is due to the fact that variance associated with a measurement error of a given
observed variable is not likely to contribute to the score of the latent variable because this variance is
less likely to be shared among other observed variables (cf. Baron and Kenny, 1986; Hopwood, 2007).
Consequently, the use of SEM reduces the effect of unreliability and the method-effect in mediation
and moderation models.
Third, the SEM method possesses the ability to (a) estimate at first glance indirect relationships and
(b) to test the significance of any of the modeled paths. These advantages add power to testing
complex conceptual models and to providing a strong empirical evidence either with or against a
mediation and/or moderation model (cf. Iacobucci, 2012).

Cha
pter
6
114 Data Analysis and Results
assume that the data supports both the measurement model (relationship between latent and observed
variables), and the structural model (the proposed relationship between the latent variables).
Nevertheless, Nachtogall et al. (2003) emphasize the point that even if we use the word “effect” to
express the relationship between the latent variables, it does not imply that the proposed structural
model (even if well fitted) is a causal model.
On the other side of the spectrum is an opinion that attempts to preserve some implication of “effect”
to the SEM model’s results. This view includes researchers such as Pearl (2012) who agrees that the
issue of causality in SEM is controversial. At the start of his paper, Pearl states that “The role of
causality in SEM research is widely perceived to be, on the one hand, of pivotal methodological
importance and, on the other hand, confusing, enigmatic, and controversial” (cf. Pearl, 2012).
Initially, he introduces the views of those researchers who oppose to the use of SEM results as being
causal relations. Perl cites Wilkinson & Task Force (1999) asserting that “The use of complicated
causal-modeling software [read SEM] rarely yields any results that have any interpretation as causal
effects”. Later, Pearl (2012) points out that the statement by Wilkinson & Task Force (1999) might
be an “overstatement”, and puts forward the following question “If SEM methods do not ‘prove’
causation, how can they yield results that have causal interpretation?”.
According to Pearl’s view, the controversy lies in the presence of a logical gap between “establishing
causation” through an elaborate experimental testing and “interpreting” parameters as causal effects
which are based on a previous scientific and theoretical knowledge. By using this proposition, Pearl
implies that if the proposed relations among the latent variables in a model are based on previously
tested and documented relationships, the results could be “interpreted” as indicating a possible causal
direction (without being proven). This view brings both sides of the controversy a bit closer.
Nachtogall et al. (2003) also proposes a compromising view by stating that (a) many users of SEM
are implicitly interested in “indicating” causality, and (b) a framework of mathematically formalized
theory has been developed for testing causality in SEM.
In our research, we have based the directional relations of our proposed complex model on previously
established models from the literature. We have explored and described our complex model involving
those relations by fitting the model to the empirical data. We interpret our results only as “effects”
and have not explicitly “established causality” by experimental testing methods.
From IT Business Strategic Alignment to Performance 115
SEM vs OLS
OLS (Ordinary Least Square) regression generally assumes that all variables are measured without
an error and that they are perfectly reliable. This assumption is rarely true and may result in an
unknown parameter estimate bias (cf. Busemeyer & Jones, 1983). The measurement error is not only
problematic for all variables in the regression, but is also challenging to the reliability of the
interaction term (used for moderation analysis) of which the reliability is a result of its principal
variables from which it is composed (cf. Little et al., 2007). In our thesis we incorporate an interaction
term to estimate the moderating effect of EGIT on the relationship between ITBSA, SIW, and
performance. Therefore, a series of regressions might not yield a reliable results and SEM will be the
approach of choice.
6.1.2 Advantages of Using SEM
There are four main advantages in using SEM over other methods in the examination of mediated
and moderated models.
First, the SEM method possesses the ability to accommodate estimates of error variance, while other
methods (such as path analysis or regression) assume that all variables are measured without error
(cf. Weston et al., 2008).
Second, the SEM method uses latent variables as opposed to observed variables. Latent variables
represent scores of several observed variables assumed to be measuring the same phenomenon. In
mediation and moderation studies, using latent variables has an advantage of providing better
reliability. This is due to the fact that variance associated with a measurement error of a given
observed variable is not likely to contribute to the score of the latent variable because this variance is
less likely to be shared among other observed variables (cf. Baron and Kenny, 1986; Hopwood, 2007).
Consequently, the use of SEM reduces the effect of unreliability and the method-effect in mediation
and moderation models.
Third, the SEM method possesses the ability to (a) estimate at first glance indirect relationships and
(b) to test the significance of any of the modeled paths. These advantages add power to testing
complex conceptual models and to providing a strong empirical evidence either with or against a
mediation and/or moderation model (cf. Iacobucci, 2012).

116 Data Analysis and Results
Fourth, the SEM method allows for the distinction between a poor measurement and a miss-specified
model. The two components of SEM (factor analysis and the structural model) take care of those
issues, respectively (cf. Kenny & McCoach, 2003).
6.1.3 Predictive Application vs. Theory Testing
Historically, there have been two main uses for SEM. (1) Predictive application and (2) theory testing
(cf. Joreskog & Wold, 1982; Fornell & Bookstein, 1982; Barroso, Carrión, & Roldán, 2010). First,
the predictive application is based on an econometric perspective that focuses on parameter prediction
(predicting the dependent variable). Parameters are estimated with the aim to maximize the variance
explained. The fit of such predictive models does not use the classical goodness-of-fit measures, it is
rather evaluated on the model’s ability to account for the sample covariance and hence, it is based on
the amount of a variance-explained basis. The PLS (Partial Least Square) approach is advantageous
in this kind of applications because it considers all the variance of the observed measures as a useful
variance. Yet, according to both publications, Joreskog & Wold (1982) and McDonald (1996), the
PLS estimates are correct under the assumptions of a large sample and a large number of observed
variables per latent construct. The approach of predictive application and the PLS method are
frequently used in consulting applications (cf. McDonald, 1996).
Second, the theory testing methodology is used whenever there is a strong theoretical background for
the components of a model and further theoretical testing is the main objective (cf. Barroso et al.,
2010). For these kind of applications, the ML (maximum likelihood) methodology (also sometimes
refered to as full-information estimation approach) is commonly used. In the ML approach, each
proposed relationship among the latent constructs should be justified by previous theory. Using ML
for theory testing has at least four advantages.
The first advantage is that the uniqueness (a combination of random error variance and measure
specific variance associated with the common factor model of ML) is of no theoretical interest and is
excluded from the definition of the latent constructs. Consequently, the covariance among the latent
variables is adjusted to reflect this reduction on variances. Because of this assumption, the amount of
variance explained in a group of observed variables is not of a main concern (cf. Anderson & Gerbing,
1988).
A second advantage of the ML method is that it allows for an estimate of a model fit using classical
fit-indices (due to the fact that the fit function is asymptotically distributed as Chi-square).
From IT Business Strategic Alignment to Performance 117
Third, the ML approach provides for a very efficient parameter estimates (cf. Joreskog & Wold,
1982).
The fourth advantage of ML, in comparison to its family of methods (covariance based analyses) such
as GLS (generalized least square) and WLS (weighted least square), is concerned with the relaxed
strictness of the multivariate normality requirement. In general terms, the literature shows that ML
performs better than both GLS and WLS (cf. Olsson, Foss, Troye, & Howell, 2000; Iacobucci, 2010).
In more specific terms regarding the effect of non-normality on the standard errors, Olsson et al.
(2000) and Lei & Lomax (2005) assert that ML is relatively robust and there is no effect on the
standard errors of parameter estimates. They claim that there is an effect on the parameter estimates
themselves for samples less than 100, which does not concern us as our sample is above 100. For
further re-assurance, there are scholars asserting that even the parameter estimates themselves are
also generaly robust to multivariate non-normality (cf. Finch, West, & MacKinnon, 1997; Fan &
Wang, 1998).
Our research is characterized by these issue: (a) the components of our model are well rooted in
theory, (b) our purpose is to test a theory and the general trend among known constructs (ITBSA,
EGIT, SIW, and departmental performance), and (c) we are not concerned with predicting a
dependent construct. Therefore, we will utilize the ML methodology to test the extent to which our
proposed model fits the collected data.
Moreover, we will not need to be particularly concerned with the amuont of variance explained by
our model and our chosen methodology should be well robust to multivariate non-normality.
6.2 The Fit Indicators of the Model
Our choice of ML methodology avails the test of model fit. Yet, it is important to mention that the
SEM models are an attempt to approximate a proposed model of construct relationships to an actual
model in the collected data. It is only an approximation, a perfect fit is too high a dream (cf. Wolfle,
2003). In order to assess the level of estimation, it is neither recommended, nor realistic, to include
every index known and generated by a computer in its program’s output.
Thus, it is difficult to answer the question “what is the appropriate choice of indices?”. Below we list
three views on index categorization as published in the literature. Then we give our choice for the
categorization of the fit indices.

Cha
pter
6
116 Data Analysis and Results
Fourth, the SEM method allows for the distinction between a poor measurement and a miss-specified
model. The two components of SEM (factor analysis and the structural model) take care of those
issues, respectively (cf. Kenny & McCoach, 2003).
6.1.3 Predictive Application vs. Theory Testing
Historically, there have been two main uses for SEM. (1) Predictive application and (2) theory testing
(cf. Joreskog & Wold, 1982; Fornell & Bookstein, 1982; Barroso, Carrión, & Roldán, 2010). First,
the predictive application is based on an econometric perspective that focuses on parameter prediction
(predicting the dependent variable). Parameters are estimated with the aim to maximize the variance
explained. The fit of such predictive models does not use the classical goodness-of-fit measures, it is
rather evaluated on the model’s ability to account for the sample covariance and hence, it is based on
the amount of a variance-explained basis. The PLS (Partial Least Square) approach is advantageous
in this kind of applications because it considers all the variance of the observed measures as a useful
variance. Yet, according to both publications, Joreskog & Wold (1982) and McDonald (1996), the
PLS estimates are correct under the assumptions of a large sample and a large number of observed
variables per latent construct. The approach of predictive application and the PLS method are
frequently used in consulting applications (cf. McDonald, 1996).
Second, the theory testing methodology is used whenever there is a strong theoretical background for
the components of a model and further theoretical testing is the main objective (cf. Barroso et al.,
2010). For these kind of applications, the ML (maximum likelihood) methodology (also sometimes
refered to as full-information estimation approach) is commonly used. In the ML approach, each
proposed relationship among the latent constructs should be justified by previous theory. Using ML
for theory testing has at least four advantages.
The first advantage is that the uniqueness (a combination of random error variance and measure
specific variance associated with the common factor model of ML) is of no theoretical interest and is
excluded from the definition of the latent constructs. Consequently, the covariance among the latent
variables is adjusted to reflect this reduction on variances. Because of this assumption, the amount of
variance explained in a group of observed variables is not of a main concern (cf. Anderson & Gerbing,
1988).
A second advantage of the ML method is that it allows for an estimate of a model fit using classical
fit-indices (due to the fact that the fit function is asymptotically distributed as Chi-square).
From IT Business Strategic Alignment to Performance 117
Third, the ML approach provides for a very efficient parameter estimates (cf. Joreskog & Wold,
1982).
The fourth advantage of ML, in comparison to its family of methods (covariance based analyses) such
as GLS (generalized least square) and WLS (weighted least square), is concerned with the relaxed
strictness of the multivariate normality requirement. In general terms, the literature shows that ML
performs better than both GLS and WLS (cf. Olsson, Foss, Troye, & Howell, 2000; Iacobucci, 2010).
In more specific terms regarding the effect of non-normality on the standard errors, Olsson et al.
(2000) and Lei & Lomax (2005) assert that ML is relatively robust and there is no effect on the
standard errors of parameter estimates. They claim that there is an effect on the parameter estimates
themselves for samples less than 100, which does not concern us as our sample is above 100. For
further re-assurance, there are scholars asserting that even the parameter estimates themselves are
also generaly robust to multivariate non-normality (cf. Finch, West, & MacKinnon, 1997; Fan &
Wang, 1998).
Our research is characterized by these issue: (a) the components of our model are well rooted in
theory, (b) our purpose is to test a theory and the general trend among known constructs (ITBSA,
EGIT, SIW, and departmental performance), and (c) we are not concerned with predicting a
dependent construct. Therefore, we will utilize the ML methodology to test the extent to which our
proposed model fits the collected data.
Moreover, we will not need to be particularly concerned with the amuont of variance explained by
our model and our chosen methodology should be well robust to multivariate non-normality.
6.2 The Fit Indicators of the Model
Our choice of ML methodology avails the test of model fit. Yet, it is important to mention that the
SEM models are an attempt to approximate a proposed model of construct relationships to an actual
model in the collected data. It is only an approximation, a perfect fit is too high a dream (cf. Wolfle,
2003). In order to assess the level of estimation, it is neither recommended, nor realistic, to include
every index known and generated by a computer in its program’s output.
Thus, it is difficult to answer the question “what is the appropriate choice of indices?”. Below we list
three views on index categorization as published in the literature. Then we give our choice for the
categorization of the fit indices.

118 Data Analysis and Results
Three Views in the Literature
There are several views in the literature about the issue of index categorization. Below we mention
three of them.
First, Hu and Bentler (1999) suggested the use of a two-index combination of the standardized root
mean square residual (SRMR)26 with either one of Non-Normed Fit Index (NNFI) (sometimes called
the Tucker–Lewis index TLI), the standardized root mean square residual (RMSEA), or the
comparative fit index (CFI).
Second, Iacobucci (2010) points out that there is an agreement among researchers on the following
combination of indices: (a) the Chi-square with the degrees of freedom and the associated p-value,
(b) the SRMR, and (c) CFI.
Third, Newsom (2012) prefers to use the combination of incremental fit index (IFI) (also known as
DELTA2) and the SRMR. It is important to note that the IFI is sensitive to sample size and not
recommended for routine use. Consequently, we will not refer to IFI. It was mentioned for reference
only.
Fit Indices Categories
There are various categorizations of the fit indices. One of the common categorizations is by Hooper,
Coughlan, & Mullen (2008). They name three specific main categories:27 (a) the absolute fit indices,
such as the Chi-square, RMR/SRMR, GFI, and RMSEA, (b) the Incremental fit indices, such as the
NFI and CFI), and (c) the Parsimonious fit indices, such as the PNFI. For our choice of fit indices,
we will adopt the Hooper et al. (2008) categorization of the indices.
In the following three subsections (6.2.1, 6.2.2, and 6.2.3) we provide a description of each of the
categories (Absolute, Incremental, and Parsimonious) respectively. In subsection 6.2.4 we make our
final choice of indices for our model fit analysis.
26 The indices that are eventually used in this thesis will be explained in details in the following subsections.
27 The number of categories and the naming varies with scholars, for example Newsom (2012) names four categories:
Absolute, relative, Parsimony, and non-centrality.
From IT Business Strategic Alignment to Performance 119
6.2.1 The Choice for Absolute Fit Indices
These indices basically describe how well does the proposed model (theory) fit the sample data. The
result is directly derived from the fit between obtained and implied covariance matrices (and the ML
minimization function) (cf. McDonald & Ho, 2002; Newsom, 2012). In other words, the indices do
not use an alternative model for comparison (as used by the relative indices discussed in the following
subsection). This group of indices include (among others) (1) the Chi-square, (2) the RMR, SRMR,
RMSEA, and (3) GFI. Below we briefly describe those indices (the GFI will be described for its
historical importance, but it will not be referenced in our models).
(1) The Chi-square index () is the only inferential statistic while all the others are descriptive28 (cf.
Iacobucci, 2010). This index basically assesses the goodness of fit (the discrepancy between the
sample and the fitted covariance matrix). For a good fit, the should be non-significant at the
0.05 threshold, therefore, in some literature it is referred to as the badness of fit measure (cf.
Barrett, 2007). The index is sensitive to both (a) multivariate normality (for slightest deviation
from multivariate normality it tends to reject even well specified models), and (b) to sample size.
For large samples, it tends to reject fitted models, and for small samples it lacks the power of
discriminating between good and bad fitted models. Therefore, in order to minimize the impact
of sample size, a normed is usually reported. It is calculated as (/Degrees of freedom). Even
though there is no consensus on a fixed cutoff value for this ratio, a widely acceptable value is as
high as 2 (cf. Ullman, 2006; Tabachnick & Fidell, 2007). We will report the index, the
significance (p-value), the associated degrees of freedom, and the normed (/df).
(2) Root mean square error of approximation (RMSEA) is practical approach to model fitting. It
accepts the reality that a perfect fit is an exaggerated goal to aim at. Therefore, an acceptance of
the fact that models are only an approximation of the true model is more realistic (cf. Wolfle,
2003). This view led to the invention of the RMSEA indicator. It indicates the extent to which a
model with optimal parameter estimates fits the population covariance (cf. Byrne, 1998;
Iacobucci, 2010). Because of its sensitivity to the number of parameters (it favors models with
less parameters), it has become a very popular index to report. Higher values indicate worst fit.
Hu & Bentler (1998) and Hu & Bentler (1999) have suggested a cut off point of 0.06, and Steiger
28 This statement means that it is the only statistic that makes a clear statement about the significance of a hypothesis, the
other statistics only use rule of thumb for goodness of fit assessment.

Cha
pter
6
118 Data Analysis and Results
Three Views in the Literature
There are several views in the literature about the issue of index categorization. Below we mention
three of them.
First, Hu and Bentler (1999) suggested the use of a two-index combination of the standardized root
mean square residual (SRMR)26 with either one of Non-Normed Fit Index (NNFI) (sometimes called
the Tucker–Lewis index TLI), the standardized root mean square residual (RMSEA), or the
comparative fit index (CFI).
Second, Iacobucci (2010) points out that there is an agreement among researchers on the following
combination of indices: (a) the Chi-square with the degrees of freedom and the associated p-value,
(b) the SRMR, and (c) CFI.
Third, Newsom (2012) prefers to use the combination of incremental fit index (IFI) (also known as
DELTA2) and the SRMR. It is important to note that the IFI is sensitive to sample size and not
recommended for routine use. Consequently, we will not refer to IFI. It was mentioned for reference
only.
Fit Indices Categories
There are various categorizations of the fit indices. One of the common categorizations is by Hooper,
Coughlan, & Mullen (2008). They name three specific main categories:27 (a) the absolute fit indices,
such as the Chi-square, RMR/SRMR, GFI, and RMSEA, (b) the Incremental fit indices, such as the
NFI and CFI), and (c) the Parsimonious fit indices, such as the PNFI. For our choice of fit indices,
we will adopt the Hooper et al. (2008) categorization of the indices.
In the following three subsections (6.2.1, 6.2.2, and 6.2.3) we provide a description of each of the
categories (Absolute, Incremental, and Parsimonious) respectively. In subsection 6.2.4 we make our
final choice of indices for our model fit analysis.
26 The indices that are eventually used in this thesis will be explained in details in the following subsections.
27 The number of categories and the naming varies with scholars, for example Newsom (2012) names four categories:
Absolute, relative, Parsimony, and non-centrality.
From IT Business Strategic Alignment to Performance 119
6.2.1 The Choice for Absolute Fit Indices
These indices basically describe how well does the proposed model (theory) fit the sample data. The
result is directly derived from the fit between obtained and implied covariance matrices (and the ML
minimization function) (cf. McDonald & Ho, 2002; Newsom, 2012). In other words, the indices do
not use an alternative model for comparison (as used by the relative indices discussed in the following
subsection). This group of indices include (among others) (1) the Chi-square, (2) the RMR, SRMR,
RMSEA, and (3) GFI. Below we briefly describe those indices (the GFI will be described for its
historical importance, but it will not be referenced in our models).
(1) The Chi-square index () is the only inferential statistic while all the others are descriptive28 (cf.
Iacobucci, 2010). This index basically assesses the goodness of fit (the discrepancy between the
sample and the fitted covariance matrix). For a good fit, the should be non-significant at the
0.05 threshold, therefore, in some literature it is referred to as the badness of fit measure (cf.
Barrett, 2007). The index is sensitive to both (a) multivariate normality (for slightest deviation
from multivariate normality it tends to reject even well specified models), and (b) to sample size.
For large samples, it tends to reject fitted models, and for small samples it lacks the power of
discriminating between good and bad fitted models. Therefore, in order to minimize the impact
of sample size, a normed is usually reported. It is calculated as (/Degrees of freedom). Even
though there is no consensus on a fixed cutoff value for this ratio, a widely acceptable value is as
high as 2 (cf. Ullman, 2006; Tabachnick & Fidell, 2007). We will report the index, the
significance (p-value), the associated degrees of freedom, and the normed (/df).
(2) Root mean square error of approximation (RMSEA) is practical approach to model fitting. It
accepts the reality that a perfect fit is an exaggerated goal to aim at. Therefore, an acceptance of
the fact that models are only an approximation of the true model is more realistic (cf. Wolfle,
2003). This view led to the invention of the RMSEA indicator. It indicates the extent to which a
model with optimal parameter estimates fits the population covariance (cf. Byrne, 1998;
Iacobucci, 2010). Because of its sensitivity to the number of parameters (it favors models with
less parameters), it has become a very popular index to report. Higher values indicate worst fit.
Hu & Bentler (1998) and Hu & Bentler (1999) have suggested a cut off point of 0.06, and Steiger
28 This statement means that it is the only statistic that makes a clear statement about the significance of a hypothesis, the
other statistics only use rule of thumb for goodness of fit assessment.

120 Data Analysis and Results
(2007) has suggested that values as high as 0.07 are acceptable for a fair fit29. We will report
RMSEA and consider values close to 0.06 as a good fit value.
(3) Goodness-of-fit index (GFI) has been created by Jöreskog & Sörbom (1996). The index is an
alternative to the index. It basically calculates the proportion of the variance that the estimated
population accounts for (cf. Tabachnick & Fidell, 2007). It ranges from 0 to 1. It is sample
sensitive, as large samples increase its value. Moreover, it is sensitive to the proportion of the
degrees of freedom (df) to the sample size, i.e., as the number of degrees of freedom increases in
proportion to the sample size, this indicator tends to decrease in value. Due to these sensitivities,
it has been recommended that this index should not be used (cf. Sharma et al., 2005).
6.2.2 The Choice for Incremental Fit Indices
Incremental fit indices describe the fit of a model in relative to another reference model, therefore, in
some literature those indices are described as comparative (or relative) indices (cf. Miles & Shevlin,
2007; Iacobucci, 2012). This group includes indices such as the CFI (cf. McDonald & Ho, 2002).
Below we describe some characteristics of the index.
The Comparative Fit Index (CFI) was first introduced by Bentler (1990). It is a revised form of the
normed-fit index NFI30 in that it performs well even with small samples (cf. Tabachnick & Fidell,
2007). This index compares the sample covariance to a null model which assumes no correlation
among latent variables. The CFI’s values range from 0 to 1 with values closer to 1 indicating a good
fit. Initially a value > 0.9 was considered a good fit, later Hu & Bentler (1998) has proposed a cut off
of > 0.95 which became acceptable among the research community. Due to its tolerance to small
samples and as a representation of the comparative fit indeces, we will report the CFI index with our
analysis.
29 Some earlier literature has suggested values between .05 and 0.1 to be acceptable for fair fit. Other scholars have
suggested values between 0.8-0.1 to be an indication of mediocre fit and values bellow 0.8 to be fair fit. See for example
(MacCallum et al.,1996).
30 The NFI index was criticized for three main reasons (1) it was influenced by sample size, (2) it underestimated a fit in
small samples, and (3) it was difficult to compare across data sets (cf. Iacobucci, 2012).
From IT Business Strategic Alignment to Performance 121
6.2.3 The Choice for Parsimonious Fit Indices.
The parsimonious fit indices are in principle incremental (or relative) indices. They are adjusted (for
the degrees of freedom) to penalize complex (less parsimonious) models. The aim is to encourage a
straightforward theoretical process (cf. Newsom, 2012). The more complex models would obtain
lower values for the indices. Mulaik, James, Van Alstine, Bennett, Lind, & Stilwell (1989) is credited
for developing several of those indices. The category of parsimonious fit indices includes indices
such as the parsimonious CFI and parsimonious NFI. Those indices are very difficult to interpret and
have no agreed threshold values (cf. Newsom, 2012). A model could obtain a value close to 0.5 for a
parsimonious index while having a value of 0.95 for other indices (cf. Mulaik et al., 1989). There is
a fundamental debate in the literature wheteher the parsimonial indices are appropriate to use and
report (cf. Hooper et al., 2008). We will report PCFI as a reference only (in comparison to the CFI
index that was chosen in the previous subsection).
6.2.4 Final Choice of Model Indices
The issue of choosing a set of indices is not a trivial task. Iacobucci (2010) has pointed out to an
agreement in the literature that, fundamentaly, the following three indicators should be reported:
(with its p-value and df), the RMSEA, and the CFI. Based on the discussion and descriptions in the
previous subsections, we put together a balanced set of indices that would provide a reasonable
indicator of fit for our analysis. First, for the absolute indices we will utilize the (with degrees of
freedom and the p-value, as well as the ratio of /df) and the RMSEA. Second, as a representative
of the incremental indices group we will choose the CFI index. Third, we will report the PCFI index
to provide a reference point for the model complexity. We will use the estimation thresholds as
depicted in Table 6-1. Our choice of indices is supported by a study performed by Jackson, Gillaspy,
& Purc-Stephenson (2009) in which they have reviewed the frequency by which various indices were
used in the literature. They have shown that was reported in 89% of the studies. CFI was reported
in 78.4% of studies. And RMSEA was reported in 64.9% of studies. Moreover, 92.8% of the studies
have reported more than one type of indicators (such as an absolute and an incremental).
Indicator Approximation threshold Reference
/df < 2 (Ullman, 2006; Tabachnick & Fidell, 2007)
p-value > 0.05 (non-significant) (Barrett, 2007) RMSEA Close to 0.06 (Hu & Bentler 1998 & 1999) CFI > 0.95 (Hu & Bentler 1998 & 1999) PCFI >0.5 (Mulaik et al., 1989; Hooper et al., 2008)
Table 6-1 Model fit indicators and threshold values

Cha
pter
6
120 Data Analysis and Results
(2007) has suggested that values as high as 0.07 are acceptable for a fair fit29. We will report
RMSEA and consider values close to 0.06 as a good fit value.
(3) Goodness-of-fit index (GFI) has been created by Jöreskog & Sörbom (1996). The index is an
alternative to the index. It basically calculates the proportion of the variance that the estimated
population accounts for (cf. Tabachnick & Fidell, 2007). It ranges from 0 to 1. It is sample
sensitive, as large samples increase its value. Moreover, it is sensitive to the proportion of the
degrees of freedom (df) to the sample size, i.e., as the number of degrees of freedom increases in
proportion to the sample size, this indicator tends to decrease in value. Due to these sensitivities,
it has been recommended that this index should not be used (cf. Sharma et al., 2005).
6.2.2 The Choice for Incremental Fit Indices
Incremental fit indices describe the fit of a model in relative to another reference model, therefore, in
some literature those indices are described as comparative (or relative) indices (cf. Miles & Shevlin,
2007; Iacobucci, 2012). This group includes indices such as the CFI (cf. McDonald & Ho, 2002).
Below we describe some characteristics of the index.
The Comparative Fit Index (CFI) was first introduced by Bentler (1990). It is a revised form of the
normed-fit index NFI30 in that it performs well even with small samples (cf. Tabachnick & Fidell,
2007). This index compares the sample covariance to a null model which assumes no correlation
among latent variables. The CFI’s values range from 0 to 1 with values closer to 1 indicating a good
fit. Initially a value > 0.9 was considered a good fit, later Hu & Bentler (1998) has proposed a cut off
of > 0.95 which became acceptable among the research community. Due to its tolerance to small
samples and as a representation of the comparative fit indeces, we will report the CFI index with our
analysis.
29 Some earlier literature has suggested values between .05 and 0.1 to be acceptable for fair fit. Other scholars have
suggested values between 0.8-0.1 to be an indication of mediocre fit and values bellow 0.8 to be fair fit. See for example
(MacCallum et al.,1996).
30 The NFI index was criticized for three main reasons (1) it was influenced by sample size, (2) it underestimated a fit in
small samples, and (3) it was difficult to compare across data sets (cf. Iacobucci, 2012).
From IT Business Strategic Alignment to Performance 121
6.2.3 The Choice for Parsimonious Fit Indices.
The parsimonious fit indices are in principle incremental (or relative) indices. They are adjusted (for
the degrees of freedom) to penalize complex (less parsimonious) models. The aim is to encourage a
straightforward theoretical process (cf. Newsom, 2012). The more complex models would obtain
lower values for the indices. Mulaik, James, Van Alstine, Bennett, Lind, & Stilwell (1989) is credited
for developing several of those indices. The category of parsimonious fit indices includes indices
such as the parsimonious CFI and parsimonious NFI. Those indices are very difficult to interpret and
have no agreed threshold values (cf. Newsom, 2012). A model could obtain a value close to 0.5 for a
parsimonious index while having a value of 0.95 for other indices (cf. Mulaik et al., 1989). There is
a fundamental debate in the literature wheteher the parsimonial indices are appropriate to use and
report (cf. Hooper et al., 2008). We will report PCFI as a reference only (in comparison to the CFI
index that was chosen in the previous subsection).
6.2.4 Final Choice of Model Indices
The issue of choosing a set of indices is not a trivial task. Iacobucci (2010) has pointed out to an
agreement in the literature that, fundamentaly, the following three indicators should be reported:
(with its p-value and df), the RMSEA, and the CFI. Based on the discussion and descriptions in the
previous subsections, we put together a balanced set of indices that would provide a reasonable
indicator of fit for our analysis. First, for the absolute indices we will utilize the (with degrees of
freedom and the p-value, as well as the ratio of /df) and the RMSEA. Second, as a representative
of the incremental indices group we will choose the CFI index. Third, we will report the PCFI index
to provide a reference point for the model complexity. We will use the estimation thresholds as
depicted in Table 6-1. Our choice of indices is supported by a study performed by Jackson, Gillaspy,
& Purc-Stephenson (2009) in which they have reviewed the frequency by which various indices were
used in the literature. They have shown that was reported in 89% of the studies. CFI was reported
in 78.4% of studies. And RMSEA was reported in 64.9% of studies. Moreover, 92.8% of the studies
have reported more than one type of indicators (such as an absolute and an incremental).
Indicator Approximation threshold Reference
/df < 2 (Ullman, 2006; Tabachnick & Fidell, 2007)
p-value > 0.05 (non-significant) (Barrett, 2007) RMSEA Close to 0.06 (Hu & Bentler 1998 & 1999) CFI > 0.95 (Hu & Bentler 1998 & 1999) PCFI >0.5 (Mulaik et al., 1989; Hooper et al., 2008)
Table 6-1 Model fit indicators and threshold values
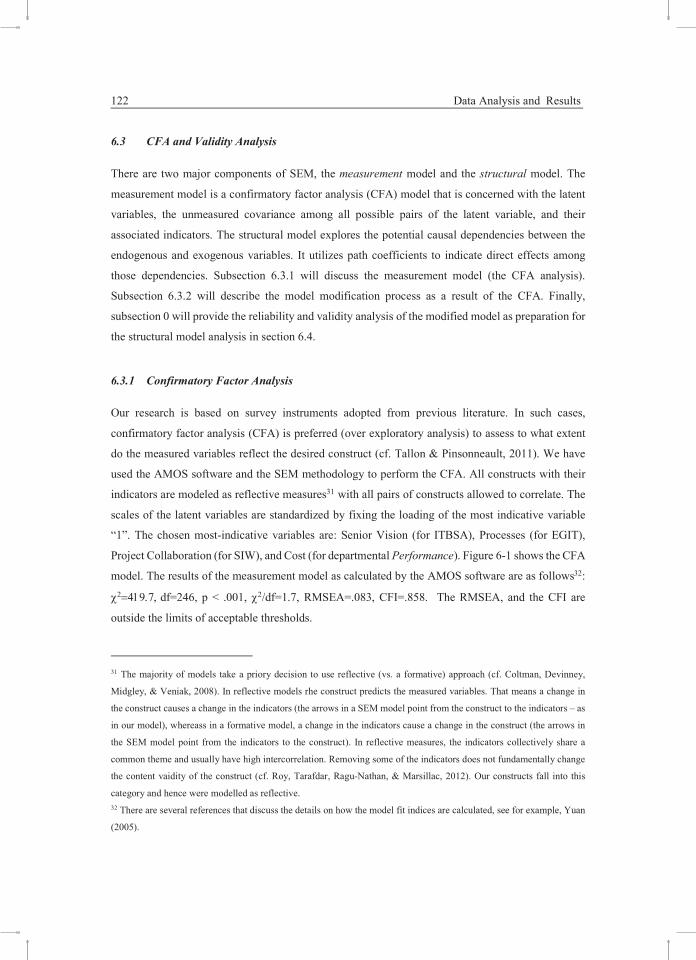
122 Data Analysis and Results
6.3 CFA and Validity Analysis
There are two major components of SEM, the measurement model and the structural model. The
measurement model is a confirmatory factor analysis (CFA) model that is concerned with the latent
variables, the unmeasured covariance among all possible pairs of the latent variable, and their
associated indicators. The structural model explores the potential causal dependencies between the
endogenous and exogenous variables. It utilizes path coefficients to indicate direct effects among
those dependencies. Subsection 6.3.1 will discuss the measurement model (the CFA analysis).
Subsection 6.3.2 will describe the model modification process as a result of the CFA. Finally,
subsection 0 will provide the reliability and validity analysis of the modified model as preparation for
the structural model analysis in section 6.4.
6.3.1 Confirmatory Factor Analysis
Our research is based on survey instruments adopted from previous literature. In such cases,
confirmatory factor analysis (CFA) is preferred (over exploratory analysis) to assess to what extent
do the measured variables reflect the desired construct (cf. Tallon & Pinsonneault, 2011). We have
used the AMOS software and the SEM methodology to perform the CFA. All constructs with their
indicators are modeled as reflective measures31 with all pairs of constructs allowed to correlate. The
scales of the latent variables are standardized by fixing the loading of the most indicative variable
“1”. The chosen most-indicative variables are: Senior Vision (for ITBSA), Processes (for EGIT),
Project Collaboration (for SIW), and Cost (for departmental Performance). Figure 6-1 shows the CFA
model. The results of the measurement model as calculated by the AMOS software are as follows32:
df=246, p < .001, df=1.7, RMSEA=.083, CFI=.858. The RMSEA, and the CFI are
outside the limits of acceptable thresholds.
31 The majority of models take a priory decision to use reflective (vs. a formative) approach (cf. Coltman, Devinney,
Midgley, & Veniak, 2008). In reflective models rhe construct predicts the measured variables. That means a change in
the construct causes a change in the indicators (the arrows in a SEM model point from the construct to the indicators – as
in our model), whereass in a formative model, a change in the indicators cause a change in the construct (the arrows in
the SEM model point from the indicators to the construct). In reflective measures, the indicators collectively share a
common theme and usually have high intercorrelation. Removing some of the indicators does not fundamentally change
the content vaidity of the construct (cf. Roy, Tarafdar, Ragu-Nathan, & Marsillac, 2012). Our constructs fall into this
category and hence were modelled as reflective.
32 There are several references that discuss the details on how the model fit indices are calculated, see for example, Yuan
(2005).
From IT Business Strategic Alignment to Performance 123
In the case where fit indices of a model are not meeting the desired level, it is a common practice in
literature to perform several trials of model refinement. There are at least two major approaches
(among others) to modify a model.
First, parameters with non-significant loadings or parameters with loadings below a chosen cut-off
point (such as 0.7) could be deleted (cf. Fornell & Larcker, 1981).
Second, theoretically and logically justifiable co-variances among error terms are added. Those
proposed co-variances are sometimes referred to as “Lagrange multiplier statistics” (cf. Mueller &
Hancock, 2008) and are usually generated by SEM software packages in the form of modification
indices33 (cf. Hox & Bechger, 1998). Researchers use those modification indices to execute a
sequence of iterative model modifications till a reasonable fit is reached (cf. Hox & Bechger, 1998).
It is important to stress that those covariance relationships should be added within a given latent
variable (not across latent variables), should be theoretically justifiable, and should be added among
error terms of variables that are likely to be answered in the same way but are not likely to have a
causation relationship. In the following subsection, we will perform the model modification.
6.3.2 The Model Modification
This subsection addresses model modification. We investigate the loadings of the parameters and the
error covariance of the model constructs, viz. ITBSA, EGIT, SIW, and the performance construct.
In order to have suggestions for a model modification, we start analyzing the loadings of the
parameters on the latent variables. As indicated in subsection 6.1.3, our purpose is to test a theory and
the general relationships among known variables. We are not much concerned with predicting a
dependent construct, and hence, the amount of variance explained is not our main concern. Table 6-2
depicts the results of the initial CFA run. It shows the parameters, the latent variables, the parameter’s
33 Those modification indices are generated by most SEM software packages and appear within the standard output of a
SEM model. A given value of a modification index is basically the minimum amount that the Chi-square statistic will
decrease as a result of freeing the given parameter (cf. Hox & Bechger, 1998). It is important to note that the re-specified
model should be viewed as an exploratory model that does not resemble reality any more than the initially conceptualized
model (cf. Mueller & Hancock, 2008).

Cha
pter
6
122 Data Analysis and Results
6.3 CFA and Validity Analysis
There are two major components of SEM, the measurement model and the structural model. The
measurement model is a confirmatory factor analysis (CFA) model that is concerned with the latent
variables, the unmeasured covariance among all possible pairs of the latent variable, and their
associated indicators. The structural model explores the potential causal dependencies between the
endogenous and exogenous variables. It utilizes path coefficients to indicate direct effects among
those dependencies. Subsection 6.3.1 will discuss the measurement model (the CFA analysis).
Subsection 6.3.2 will describe the model modification process as a result of the CFA. Finally,
subsection 0 will provide the reliability and validity analysis of the modified model as preparation for
the structural model analysis in section 6.4.
6.3.1 Confirmatory Factor Analysis
Our research is based on survey instruments adopted from previous literature. In such cases,
confirmatory factor analysis (CFA) is preferred (over exploratory analysis) to assess to what extent
do the measured variables reflect the desired construct (cf. Tallon & Pinsonneault, 2011). We have
used the AMOS software and the SEM methodology to perform the CFA. All constructs with their
indicators are modeled as reflective measures31 with all pairs of constructs allowed to correlate. The
scales of the latent variables are standardized by fixing the loading of the most indicative variable
“1”. The chosen most-indicative variables are: Senior Vision (for ITBSA), Processes (for EGIT),
Project Collaboration (for SIW), and Cost (for departmental Performance). Figure 6-1 shows the CFA
model. The results of the measurement model as calculated by the AMOS software are as follows32:
df=246, p < .001, df=1.7, RMSEA=.083, CFI=.858. The RMSEA, and the CFI are
outside the limits of acceptable thresholds.
31 The majority of models take a priory decision to use reflective (vs. a formative) approach (cf. Coltman, Devinney,
Midgley, & Veniak, 2008). In reflective models rhe construct predicts the measured variables. That means a change in
the construct causes a change in the indicators (the arrows in a SEM model point from the construct to the indicators – as
in our model), whereass in a formative model, a change in the indicators cause a change in the construct (the arrows in
the SEM model point from the indicators to the construct). In reflective measures, the indicators collectively share a
common theme and usually have high intercorrelation. Removing some of the indicators does not fundamentally change
the content vaidity of the construct (cf. Roy, Tarafdar, Ragu-Nathan, & Marsillac, 2012). Our constructs fall into this
category and hence were modelled as reflective.
32 There are several references that discuss the details on how the model fit indices are calculated, see for example, Yuan
(2005).
From IT Business Strategic Alignment to Performance 123
In the case where fit indices of a model are not meeting the desired level, it is a common practice in
literature to perform several trials of model refinement. There are at least two major approaches
(among others) to modify a model.
First, parameters with non-significant loadings or parameters with loadings below a chosen cut-off
point (such as 0.7) could be deleted (cf. Fornell & Larcker, 1981).
Second, theoretically and logically justifiable co-variances among error terms are added. Those
proposed co-variances are sometimes referred to as “Lagrange multiplier statistics” (cf. Mueller &
Hancock, 2008) and are usually generated by SEM software packages in the form of modification
indices33 (cf. Hox & Bechger, 1998). Researchers use those modification indices to execute a
sequence of iterative model modifications till a reasonable fit is reached (cf. Hox & Bechger, 1998).
It is important to stress that those covariance relationships should be added within a given latent
variable (not across latent variables), should be theoretically justifiable, and should be added among
error terms of variables that are likely to be answered in the same way but are not likely to have a
causation relationship. In the following subsection, we will perform the model modification.
6.3.2 The Model Modification
This subsection addresses model modification. We investigate the loadings of the parameters and the
error covariance of the model constructs, viz. ITBSA, EGIT, SIW, and the performance construct.
In order to have suggestions for a model modification, we start analyzing the loadings of the
parameters on the latent variables. As indicated in subsection 6.1.3, our purpose is to test a theory and
the general relationships among known variables. We are not much concerned with predicting a
dependent construct, and hence, the amount of variance explained is not our main concern. Table 6-2
depicts the results of the initial CFA run. It shows the parameters, the latent variables, the parameter’s
33 Those modification indices are generated by most SEM software packages and appear within the standard output of a
SEM model. A given value of a modification index is basically the minimum amount that the Chi-square statistic will
decrease as a result of freeing the given parameter (cf. Hox & Bechger, 1998). It is important to note that the re-specified
model should be viewed as an exploratory model that does not resemble reality any more than the initially conceptualized
model (cf. Mueller & Hancock, 2008).

124 Data Analysis and Results
estimate, the standard error (SE), the critical ratio (CR), and the probability level (significance) of
the estimate.
Figure 6-1 CFA Before model modification
We will utilize the unstandardized estimates and initially attempt to remove the parameters with
estimates below the level of 0.7. The model is then re-run and the fit indices will be re-examined.
Following this process, the four eliminated parameters were as follows (see Table 6-2 for details and
positioning of those variables – eliminated variables are in bold):
(1) EGIT_Relations34
(2) ITBSA_Islands
(3) ITBSA_Help
(4) ITBSA_Outsource
34 This is consistent with some of the literature that suggested that for mature firms the EGIT relationships component is
not a focus anymore as much as the processes and structures (see, for example, De Haes & Van Grembergen, 2009).
SIW
SIW
Collaborate
1
ITBSA
ITBSA
VIsion
ITBSAInfo
ITBSA
Mentality
EGIT
ITBSA
Finance
ITBSA
Component
ITBSA
Projects
ITBSA
Value
SIWOwn Team
SIW
WIthin Idea
SIW
Outside Idea
EGITProcesses
EGITStructures
SIWOwn Idea
SIWSlow
SIW
Rules
SIW
Culture
1
EGIT
Relation
ITBSA
Islands
ITBSAHelp
ITBSA
Outsource
Performance
Cost
Capacity
Flexibility
1
1
From IT Business Strategic Alignment to Performance 125
The model was re-run and the following fit indices were found. The df=183, p < .001,
df=1.63, RMSEA=.079, CFI=.89. There has been some improvement in the model fit, yet the
RMSEA, and the CFI indices are still outside the limits of acceptable thresholds and the model might
be further improved.
Consequently, the modification indices were examined for possible co-variances among error terms.
The following three co-variances were theoretically and logically justified and, hence, implemented.
Parameter Latent Variable Estimate S.E. C.R. P
SIW_Collaborate <--- SIW 1.000
SIW_Own_Team <--- SIW 1.051 .168 6.258 ***
SIW_Within_Idea <--- SIW .841 .151 5.570 ***
SIW_Outside_Idea <--- SIW .996 .161 6.169 ***
SIW_Culture <--- SIW 1.399 .170 8.214 ***
SIW_Rules <--- SIW 1.280 .188 6.805 ***
SIW_Slow <--- SIW 1.345 .169 7.956 ***
SIW_Own_Idea <--- SIW 1.174 .163 7.199 ***
ITBSA_Senior_Vision <--- ITBSA 1.000
ITBSA_Mentality <--- ITBSA 1.252 .180 6.954 ***
ITBSA_Finance <--- ITBSA .855 .159 5.364 ***
ITBSA _Component <--- ITBSA .760 .167 4.550 ***
ITBSA_Info <--- ITBSA .828 .153 5.431 ***
ITBSA_Value <--- ITBSA .720 .157 4.571 ***
ITBSA_Islands <--- ITBSA .482 .143 3.376 ***
ITBSA_Help <--- ITBSA .625 .140 4.470 ***
ITBSA_Outsource <--- ITBSA .599 .150 3.990 ***
ITBSA_Projects <--- ITBSA .815 .167 4.893 ***
EGIT_Processes <--- EGIT 1.000 EGIT_Structures <--- EGIT 1.111 .072 15.532 ***
EGIT_Relation <--- EGIT .663 .076 8.758 ***
P_Flexibility <--- Performance 1.279 .267 4.787 ***
P_Capacity <--- Performance 1.399 .288 4.867 ***
P _Cost <--- Performance 1.000
Table 6-2 Results of initial CFA run Note: Eliminated variables by CFA are in bold

Cha
pter
6
124 Data Analysis and Results
estimate, the standard error (SE), the critical ratio (CR), and the probability level (significance) of
the estimate.
Figure 6-1 CFA Before model modification
We will utilize the unstandardized estimates and initially attempt to remove the parameters with
estimates below the level of 0.7. The model is then re-run and the fit indices will be re-examined.
Following this process, the four eliminated parameters were as follows (see Table 6-2 for details and
positioning of those variables – eliminated variables are in bold):
(1) EGIT_Relations34
(2) ITBSA_Islands
(3) ITBSA_Help
(4) ITBSA_Outsource
34 This is consistent with some of the literature that suggested that for mature firms the EGIT relationships component is
not a focus anymore as much as the processes and structures (see, for example, De Haes & Van Grembergen, 2009).
SIW
SIW
Collaborate
1
ITBSA
ITBSA
VIsion
ITBSAInfo
ITBSA
Mentality
EGIT
ITBSA
Finance
ITBSA
Component
ITBSA
Projects
ITBSA
Value
SIWOwn Team
SIW
WIthin Idea
SIW
Outside Idea
EGITProcesses
EGITStructures
SIWOwn Idea
SIWSlow
SIW
Rules
SIW
Culture
1
EGIT
Relation
ITBSA
Islands
ITBSAHelp
ITBSA
Outsource
Performance
Cost
Capacity
Flexibility
1
1
From IT Business Strategic Alignment to Performance 125
The model was re-run and the following fit indices were found. The df=183, p < .001,
df=1.63, RMSEA=.079, CFI=.89. There has been some improvement in the model fit, yet the
RMSEA, and the CFI indices are still outside the limits of acceptable thresholds and the model might
be further improved.
Consequently, the modification indices were examined for possible co-variances among error terms.
The following three co-variances were theoretically and logically justified and, hence, implemented.
Parameter Latent Variable Estimate S.E. C.R. P
SIW_Collaborate <--- SIW 1.000
SIW_Own_Team <--- SIW 1.051 .168 6.258 ***
SIW_Within_Idea <--- SIW .841 .151 5.570 ***
SIW_Outside_Idea <--- SIW .996 .161 6.169 ***
SIW_Culture <--- SIW 1.399 .170 8.214 ***
SIW_Rules <--- SIW 1.280 .188 6.805 ***
SIW_Slow <--- SIW 1.345 .169 7.956 ***
SIW_Own_Idea <--- SIW 1.174 .163 7.199 ***
ITBSA_Senior_Vision <--- ITBSA 1.000
ITBSA_Mentality <--- ITBSA 1.252 .180 6.954 ***
ITBSA_Finance <--- ITBSA .855 .159 5.364 ***
ITBSA _Component <--- ITBSA .760 .167 4.550 ***
ITBSA_Info <--- ITBSA .828 .153 5.431 ***
ITBSA_Value <--- ITBSA .720 .157 4.571 ***
ITBSA_Islands <--- ITBSA .482 .143 3.376 ***
ITBSA_Help <--- ITBSA .625 .140 4.470 ***
ITBSA_Outsource <--- ITBSA .599 .150 3.990 ***
ITBSA_Projects <--- ITBSA .815 .167 4.893 ***
EGIT_Processes <--- EGIT 1.000 EGIT_Structures <--- EGIT 1.111 .072 15.532 ***
EGIT_Relation <--- EGIT .663 .076 8.758 ***
P_Flexibility <--- Performance 1.279 .267 4.787 ***
P_Capacity <--- Performance 1.399 .288 4.867 ***
P _Cost <--- Performance 1.000
Table 6-2 Results of initial CFA run Note: Eliminated variables by CFA are in bold

126 Data Analysis and Results
The ITBSA Construct
First, within the ITBSA construct, the following modification indices were added and accepted.
(a) The senior management’s vision for the IT department is related to the availability of information
for decision making (ITBSA_Vision <-> ITBSA_Info). It is logical to assume that if the senior
management has no vision for IT, there will be a deficiency of the availability of information.
Hence, it is feasible to believe that those factors have something in common and are strongly
related.
(b) It is suggested that the senior management’s vision for IT and the senior management’s perceived
value from IT are related (ITBSA_Vision <-> ITBSA_Value). Indeed, those parameters are
logically related. Actually, they are a redundant confirmation parameter in the data instrument.
We can safely assume that if the senior management has no vision for the IT department, it implies
that the senior management perceives no value from the IT department. Therefore, we will retain
this path.
(c) It was suggested that the parameter of “them and us” mentality is related to the fact the IT
department drives IT projects (ITBSA_Mentality <-> ITBSA_Projects). From a logical point of
view, it is expected that if the prevailing mentality is “them and us” between the IT department
and the rest of the firm, the IT will not be guiding most of the IT projects. After adding this co-
variance and re-analyzing the model, the value of the path between the error terms was negative,
hence, confirming the logical view that IT does not guide the IT projects if the “them and us”
mentality prevails. Therefore, we have decided to retain the path.
The SIW Construct
Second, for the SIW construct, two paths among error terms were tested and retained.
(a) It is proposed that the collaboration on innovation projects with other departments is related to the
involvement of external members in our innovation teams. It is expected that those two parameters
(collaboration and external member’s involvement) are positively related. The positive value of
the path connecting their error terms has confirmed the concept.
(b) The modification indices have suggested relating the parameters for valuing external ideas on
innovation and accepting external suggestions for innovation. We can logically assume that
From IT Business Strategic Alignment to Performance 127
perceiving an idea as valuable is very much related to accepting that specific idea. And therefore,
we will retain the path.
The Performance Construct
Third, the following co-variance among error terms were suggested for the performance construct.
The performance construct contains two major dimensions (a) cost related dimension (the cost of
production and the cost of energy), and (b) the capacity related dimension (flexibility and capacity of
production).
The suggested modifications to the model have indicated a covariance among error terms of the non-
cost-related parameters, namely, production capacity and production flexibility (P_Capacity and
P_Flexibility). Actually, those parameters are both production-related and have something in
common that is not directly related to cost. This covariance was retained.
The model was re-run with the above described co-variances implemented. At this point of analysis,
the values of the fit indices are demonstrating an acceptable level of fit. The following parameters
were achieved. df=158, p =.018, df=1.25, RMSEA=.05, CFI=.962. These values
indicate an adequate fit and we consider the measurement model acceptable for structural analysis.
Figure 6-2 demonstrates the measurement model after modification.
6.3.3 Reliability and Validity Analysis
Due to the modifications of some constructs because of the CFA, Cronbach’s Alpha was recalculated
to assure construct validity. The Cronbach’s Alpha for the modified constructs was ITBSA= .81 and
EGIT=.94. Both are acceptable.
In order to explore the convergent and discriminant reliabilities, the following four values were
calculated: CR (composite reliability), AVE (average variance extracted), MSV35 (maximum shared
variance), and ASV36 (average shared variance). Table 6-3 shows those values for our constructs.
35 MSV is calculated as the squared maximum correlation with any variable.
36 ASV is calculated as the average squared correlations with the other constructs in the model.

Cha
pter
6
126 Data Analysis and Results
The ITBSA Construct
First, within the ITBSA construct, the following modification indices were added and accepted.
(a) The senior management’s vision for the IT department is related to the availability of information
for decision making (ITBSA_Vision <-> ITBSA_Info). It is logical to assume that if the senior
management has no vision for IT, there will be a deficiency of the availability of information.
Hence, it is feasible to believe that those factors have something in common and are strongly
related.
(b) It is suggested that the senior management’s vision for IT and the senior management’s perceived
value from IT are related (ITBSA_Vision <-> ITBSA_Value). Indeed, those parameters are
logically related. Actually, they are a redundant confirmation parameter in the data instrument.
We can safely assume that if the senior management has no vision for the IT department, it implies
that the senior management perceives no value from the IT department. Therefore, we will retain
this path.
(c) It was suggested that the parameter of “them and us” mentality is related to the fact the IT
department drives IT projects (ITBSA_Mentality <-> ITBSA_Projects). From a logical point of
view, it is expected that if the prevailing mentality is “them and us” between the IT department
and the rest of the firm, the IT will not be guiding most of the IT projects. After adding this co-
variance and re-analyzing the model, the value of the path between the error terms was negative,
hence, confirming the logical view that IT does not guide the IT projects if the “them and us”
mentality prevails. Therefore, we have decided to retain the path.
The SIW Construct
Second, for the SIW construct, two paths among error terms were tested and retained.
(a) It is proposed that the collaboration on innovation projects with other departments is related to the
involvement of external members in our innovation teams. It is expected that those two parameters
(collaboration and external member’s involvement) are positively related. The positive value of
the path connecting their error terms has confirmed the concept.
(b) The modification indices have suggested relating the parameters for valuing external ideas on
innovation and accepting external suggestions for innovation. We can logically assume that
From IT Business Strategic Alignment to Performance 127
perceiving an idea as valuable is very much related to accepting that specific idea. And therefore,
we will retain the path.
The Performance Construct
Third, the following co-variance among error terms were suggested for the performance construct.
The performance construct contains two major dimensions (a) cost related dimension (the cost of
production and the cost of energy), and (b) the capacity related dimension (flexibility and capacity of
production).
The suggested modifications to the model have indicated a covariance among error terms of the non-
cost-related parameters, namely, production capacity and production flexibility (P_Capacity and
P_Flexibility). Actually, those parameters are both production-related and have something in
common that is not directly related to cost. This covariance was retained.
The model was re-run with the above described co-variances implemented. At this point of analysis,
the values of the fit indices are demonstrating an acceptable level of fit. The following parameters
were achieved. df=158, p =.018, df=1.25, RMSEA=.05, CFI=.962. These values
indicate an adequate fit and we consider the measurement model acceptable for structural analysis.
Figure 6-2 demonstrates the measurement model after modification.
6.3.3 Reliability and Validity Analysis
Due to the modifications of some constructs because of the CFA, Cronbach’s Alpha was recalculated
to assure construct validity. The Cronbach’s Alpha for the modified constructs was ITBSA= .81 and
EGIT=.94. Both are acceptable.
In order to explore the convergent and discriminant reliabilities, the following four values were
calculated: CR (composite reliability), AVE (average variance extracted), MSV35 (maximum shared
variance), and ASV36 (average shared variance). Table 6-3 shows those values for our constructs.
35 MSV is calculated as the squared maximum correlation with any variable.
36 ASV is calculated as the average squared correlations with the other constructs in the model.

128 Data Analysis and Results
Figure 6-2 CFA After model modification
For internal consistency reliability, CR should exceed 0.7. This condition is satisfied in all our
constructs providing for a satisfactory internal consistency (see Table 6-3).
Construct AVE CR MSV ASV ITBSA .38 .80 .52 .33 EGIT .89 .94 .45 .26 SIW .53 .90 .52 .32
Performance .53 .77 .09 .04
Table 6-3 Reliability statistics
In order to assess the convergent validity, CR should exceed the AVE, and AVE should be above .5.
The first condition (CR>AVE) is satisfied for all our constructs. As for the second condition
(AVE>.5) it is satisfied for all constructs except the ITBSA. Our closer inspection reads as follows.
To start with, we have used literature-approved data collection instruments in order to build our
constructs. Moreover, as mentioned in subsection 6.1.3, we aim at performing a procedure for general
theory testing (as opposed to predictive analysis). Hence, we are not much concentrating on and thus
SIW
SIW
Collaboratee3
1
ITBSA
ITBSA
VIsion
ITBSA
Infoe5
ITBSAMentality
e6
EGIT
ITBSA
Financee14
ITBSA
Componente15
ITBSA
Projectse18
ITBSAValue
e20
1
SIW
Own Teame25
1
SIW
WIthin Ideae26
1
SIW
Outside Ideae27
EGIT
Processes
EGIT
Structures
e33
1
e341
e35
SIW
Own Ideae56
1
SIW
Slowe59
SIW
Rulese60
SIWCulture
e66
1
1
1
1
Performance
P_Coste721
P_Capacitye73
1
P_Flexibilitye74
1
1
1
1
1
1
1
1
1
1
1
From IT Business Strategic Alignment to Performance 129
not so much concerned with the average variance extracted. Therefore, we will consider the ITBSA
construct valid for the purpose of our study.
The discriminant validity is assessed by comparing the MSV and ASV to the AVE. Both MSV and
ASV should be less than AVE. This condition is satisfied for all our constructs except for the ITBSA.
The ASV is less than AVE as desired, nevertheless, the MSV (maximum shared variance) exceeds
the AVE. Table 6-4 shows an alternative method of assessing the discriminant validity. This method
compared the square root of the AVE to all the other correlations of the given construct. It is
recommended that the square root of the AVE should exceed all the correlations of a given construct
with the other constructs in the model. Again, this condition is satisfied for all the constructs except
the ITBSA. Here it is due to the low AVE of the ITBSA construct, which as mentioned above, is not
our main focus owing to the nature of our research. Yet, it is important to mention that this situation
is indicative. The possible reason for the low value is that some of the variables of the ITBSA
construct cross load into other constructs.
Moreover, we would like to remark that in this research, we have not developed our own data
instruments. We have used literature-approved instruments. Therefore, we believe still to be in the
region of what is acceptable and reliable (and do not consider further modification of our model). So,
we will continue with the constructs composition as shown in Figure 6-2 as a result of the CFA
analysis.
SIW ITBSA EGIT Performance
SIW .73 ITBSA .72 .62 EGIT .59 .67 .94
Performance .30 .15 .01 .73
Table 6-4 Convergent/discriminant validity and correlations The diagonal elements in bold & underlined are the square root of AVE
As for the multivariate normality, in subsection 6.1.3 we have discussed the fact the ML analysis is
robust to marginal levels of departures from multivariate normality. We have performed a visual
inspection of the histogram graphs and a Q-Q graphs of the variables composing the two dependent
constructs (SIW and performance). No major deviation from normality was detected (see Appendix
A). Furthermore, skew and kurtosis statistics were inspected for departures from acceptable values (-
.8 and +.8). The only variable that was close to the +1 value was the SIW_Own_Idea with a value of
.90 (see the skew and kurtosis tables in Appendix A). Therefore, we have decided to perform a log

Cha
pter
6
128 Data Analysis and Results
Figure 6-2 CFA After model modification
For internal consistency reliability, CR should exceed 0.7. This condition is satisfied in all our
constructs providing for a satisfactory internal consistency (see Table 6-3).
Construct AVE CR MSV ASV ITBSA .38 .80 .52 .33 EGIT .89 .94 .45 .26 SIW .53 .90 .52 .32
Performance .53 .77 .09 .04
Table 6-3 Reliability statistics
In order to assess the convergent validity, CR should exceed the AVE, and AVE should be above .5.
The first condition (CR>AVE) is satisfied for all our constructs. As for the second condition
(AVE>.5) it is satisfied for all constructs except the ITBSA. Our closer inspection reads as follows.
To start with, we have used literature-approved data collection instruments in order to build our
constructs. Moreover, as mentioned in subsection 6.1.3, we aim at performing a procedure for general
theory testing (as opposed to predictive analysis). Hence, we are not much concentrating on and thus
SIW
SIW
Collaboratee3
1
ITBSA
ITBSA
VIsion
ITBSA
Infoe5
ITBSAMentality
e6
EGIT
ITBSA
Financee14
ITBSA
Componente15
ITBSA
Projectse18
ITBSAValue
e20
1
SIW
Own Teame25
1
SIW
WIthin Ideae26
1
SIW
Outside Ideae27
EGIT
Processes
EGIT
Structures
e33
1
e341
e35
SIW
Own Ideae56
1
SIW
Slowe59
SIW
Rulese60
SIWCulture
e66
1
1
1
1
Performance
P_Coste721
P_Capacitye73
1
P_Flexibilitye74
1
1
1
1
1
1
1
1
1
1
1
From IT Business Strategic Alignment to Performance 129
not so much concerned with the average variance extracted. Therefore, we will consider the ITBSA
construct valid for the purpose of our study.
The discriminant validity is assessed by comparing the MSV and ASV to the AVE. Both MSV and
ASV should be less than AVE. This condition is satisfied for all our constructs except for the ITBSA.
The ASV is less than AVE as desired, nevertheless, the MSV (maximum shared variance) exceeds
the AVE. Table 6-4 shows an alternative method of assessing the discriminant validity. This method
compared the square root of the AVE to all the other correlations of the given construct. It is
recommended that the square root of the AVE should exceed all the correlations of a given construct
with the other constructs in the model. Again, this condition is satisfied for all the constructs except
the ITBSA. Here it is due to the low AVE of the ITBSA construct, which as mentioned above, is not
our main focus owing to the nature of our research. Yet, it is important to mention that this situation
is indicative. The possible reason for the low value is that some of the variables of the ITBSA
construct cross load into other constructs.
Moreover, we would like to remark that in this research, we have not developed our own data
instruments. We have used literature-approved instruments. Therefore, we believe still to be in the
region of what is acceptable and reliable (and do not consider further modification of our model). So,
we will continue with the constructs composition as shown in Figure 6-2 as a result of the CFA
analysis.
SIW ITBSA EGIT Performance
SIW .73 ITBSA .72 .62 EGIT .59 .67 .94
Performance .30 .15 .01 .73
Table 6-4 Convergent/discriminant validity and correlations The diagonal elements in bold & underlined are the square root of AVE
As for the multivariate normality, in subsection 6.1.3 we have discussed the fact the ML analysis is
robust to marginal levels of departures from multivariate normality. We have performed a visual
inspection of the histogram graphs and a Q-Q graphs of the variables composing the two dependent
constructs (SIW and performance). No major deviation from normality was detected (see Appendix
A). Furthermore, skew and kurtosis statistics were inspected for departures from acceptable values (-
.8 and +.8). The only variable that was close to the +1 value was the SIW_Own_Idea with a value of
.90 (see the skew and kurtosis tables in Appendix A). Therefore, we have decided to perform a log
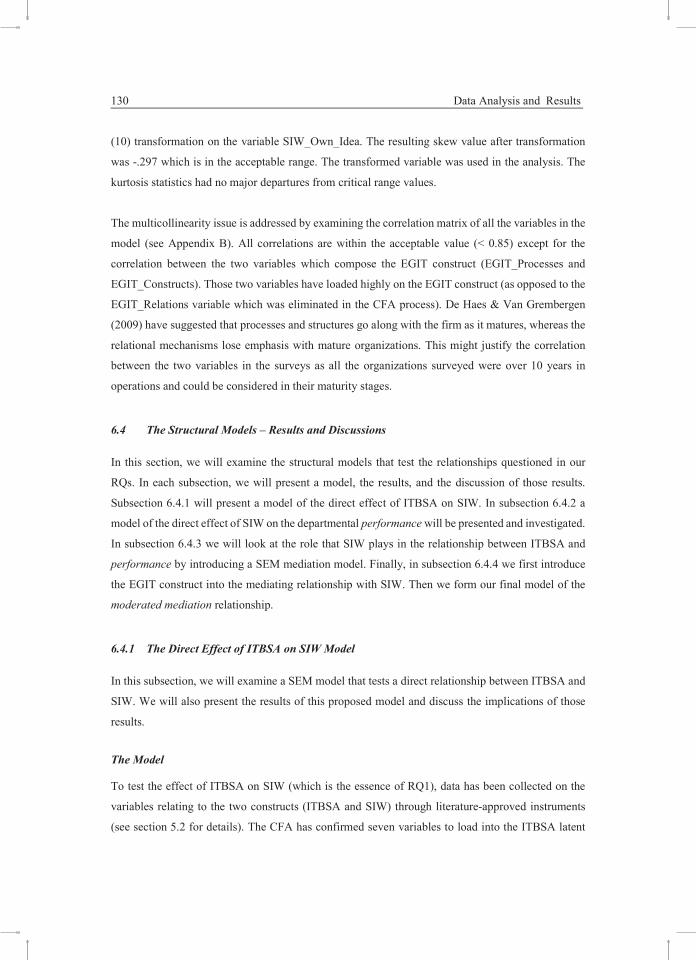
130 Data Analysis and Results
(10) transformation on the variable SIW_Own_Idea. The resulting skew value after transformation
was -.297 which is in the acceptable range. The transformed variable was used in the analysis. The
kurtosis statistics had no major departures from critical range values.
The multicollinearity issue is addressed by examining the correlation matrix of all the variables in the
model (see Appendix B). All correlations are within the acceptable value (< 0.85) except for the
correlation between the two variables which compose the EGIT construct (EGIT_Processes and
EGIT_Constructs). Those two variables have loaded highly on the EGIT construct (as opposed to the
EGIT_Relations variable which was eliminated in the CFA process). De Haes & Van Grembergen
(2009) have suggested that processes and structures go along with the firm as it matures, whereas the
relational mechanisms lose emphasis with mature organizations. This might justify the correlation
between the two variables in the surveys as all the organizations surveyed were over 10 years in
operations and could be considered in their maturity stages.
6.4 The Structural Models – Results and Discussions
In this section, we will examine the structural models that test the relationships questioned in our
RQs. In each subsection, we will present a model, the results, and the discussion of those results.
Subsection 6.4.1 will present a model of the direct effect of ITBSA on SIW. In subsection 6.4.2 a
model of the direct effect of SIW on the departmental performance will be presented and investigated.
In subsection 6.4.3 we will look at the role that SIW plays in the relationship between ITBSA and
performance by introducing a SEM mediation model. Finally, in subsection 6.4.4 we first introduce
the EGIT construct into the mediating relationship with SIW. Then we form our final model of the
moderated mediation relationship.
6.4.1 The Direct Effect of ITBSA on SIW Model
In this subsection, we will examine a SEM model that tests a direct relationship between ITBSA and
SIW. We will also present the results of this proposed model and discuss the implications of those
results.
The Model
To test the effect of ITBSA on SIW (which is the essence of RQ1), data has been collected on the
variables relating to the two constructs (ITBSA and SIW) through literature-approved instruments
(see section 5.2 for details). The CFA has confirmed seven variables to load into the ITBSA latent
From IT Business Strategic Alignment to Performance 131
variable and eight variables to load into the SIW latent variable. We have setup a SEM model to test
the direct effect of ITBSA on SIW as in, for example, Hopwood (2007), or in Wu, Detmar, & Liang
(2015). The directional arrow connecting the ITBSA and SIW latent variables tests our proposed
effect between those two latent variables. The model will also setup the stage for the examination of
the effect of SIW on the relationship between ITBSA and performance (RQ3). Figure 6-3 depicts the
SEM model.
Figure 6-3 SEM model - direct effect of ITBSA on SIW
***p < 0.001; **p <0.05; *p < 0.1; ns: not significant
SIW
SIW
Collaborate
1
ITBSA
ITBSA
VIsion
ITBSA
Info
ITBSAMentality
ITBSA
Finance
ITBSA
Component
ITBSA
Projects
ITBSAValue
SIW
Own Team
SIW
WIthin Idea
SIW
Outside Idea
SIW
Own Ideas
SIW
Slow
SIW
Rules
SIWCulture
1
β = .73***

Cha
pter
6
130 Data Analysis and Results
(10) transformation on the variable SIW_Own_Idea. The resulting skew value after transformation
was -.297 which is in the acceptable range. The transformed variable was used in the analysis. The
kurtosis statistics had no major departures from critical range values.
The multicollinearity issue is addressed by examining the correlation matrix of all the variables in the
model (see Appendix B). All correlations are within the acceptable value (< 0.85) except for the
correlation between the two variables which compose the EGIT construct (EGIT_Processes and
EGIT_Constructs). Those two variables have loaded highly on the EGIT construct (as opposed to the
EGIT_Relations variable which was eliminated in the CFA process). De Haes & Van Grembergen
(2009) have suggested that processes and structures go along with the firm as it matures, whereas the
relational mechanisms lose emphasis with mature organizations. This might justify the correlation
between the two variables in the surveys as all the organizations surveyed were over 10 years in
operations and could be considered in their maturity stages.
6.4 The Structural Models – Results and Discussions
In this section, we will examine the structural models that test the relationships questioned in our
RQs. In each subsection, we will present a model, the results, and the discussion of those results.
Subsection 6.4.1 will present a model of the direct effect of ITBSA on SIW. In subsection 6.4.2 a
model of the direct effect of SIW on the departmental performance will be presented and investigated.
In subsection 6.4.3 we will look at the role that SIW plays in the relationship between ITBSA and
performance by introducing a SEM mediation model. Finally, in subsection 6.4.4 we first introduce
the EGIT construct into the mediating relationship with SIW. Then we form our final model of the
moderated mediation relationship.
6.4.1 The Direct Effect of ITBSA on SIW Model
In this subsection, we will examine a SEM model that tests a direct relationship between ITBSA and
SIW. We will also present the results of this proposed model and discuss the implications of those
results.
The Model
To test the effect of ITBSA on SIW (which is the essence of RQ1), data has been collected on the
variables relating to the two constructs (ITBSA and SIW) through literature-approved instruments
(see section 5.2 for details). The CFA has confirmed seven variables to load into the ITBSA latent
From IT Business Strategic Alignment to Performance 131
variable and eight variables to load into the SIW latent variable. We have setup a SEM model to test
the direct effect of ITBSA on SIW as in, for example, Hopwood (2007), or in Wu, Detmar, & Liang
(2015). The directional arrow connecting the ITBSA and SIW latent variables tests our proposed
effect between those two latent variables. The model will also setup the stage for the examination of
the effect of SIW on the relationship between ITBSA and performance (RQ3). Figure 6-3 depicts the
SEM model.
Figure 6-3 SEM model - direct effect of ITBSA on SIW
***p < 0.001; **p <0.05; *p < 0.1; ns: not significant
SIW
SIW
Collaborate
1
ITBSA
ITBSA
VIsion
ITBSA
Info
ITBSAMentality
ITBSA
Finance
ITBSA
Component
ITBSA
Projects
ITBSAValue
SIW
Own Team
SIW
WIthin Idea
SIW
Outside Idea
SIW
Own Ideas
SIW
Slow
SIW
Rules
SIWCulture
1
β = .73***

132 Data Analysis and Results
The Results
The model has =97 and 84 degrees of freedom. The p value was equal to .157, which is acceptable.
The ratio /df=1.16 which is also within the acceptable range. The values of CFI=0.98,
RMSEA=0.039, and PCFI=0.78 are all within the acceptable ranges. Therefore, we consider the
model having a good fit (see Table 6-1 for a list of acceptable ranges for the fit variables). The
standardized coefficient of the ITBSA construct was β =.73 (p<0.001) showing a positive effect of
ITBSA on SIW.
The Discussion
Studies in the strategic alignment between IT and the business side have attempted to study the path
from ITBSA to the firm’s performance. The controversy about the exact components of this path
have prompted several studies attempting to suggest factors along this path. It was suggested that
SIW is one of those factors. As part of our investigation of the path from ITBSA to performance, we
are proposing that the strategic alignment between the IT and business strategies has a positive effect
on SIW. The statistically significant association between the ITBSA and SIW constructs in our model
of Figure 6-3 have provided an empirical evidence supporting our proposition.
Our findings support previous findings that confirmed the general view of the positive effect of
strategic alignment on SIW (see, for example, Silva, Figueroa, & Reinharta, 2007; Tallon &
Pinsonneault, 2011) or the more recent ones reporting a positive impact of IT and alignment on
innovation (such as, Cui, Ye, Teo, & Li, 2015; Ferreira, Fernandes, Alves, & Raposo, 2015).
Moreover, our results expand the concept of ITBSA’s positive influence to include the collaboration
on SIW at the departmental level which has not been studied intensively. The importance of our
findings lies in the fact that we stress the critical role of formulating aligned strategies between the
IT and other business departments in enhancing the interdepartmental collaboration on SIW.
In order to affirm that SIW is a representation (and an important antecedent) of performance, we aim
to empirically associate SIW with departmental performance in subsection 6.4.2.
From IT Business Strategic Alignment to Performance 133
6.4.2 The Direct Effect of SIW on Performance Model
In this subsection, we will propose a SEM model to investigate the relationship between the SIW and
performance constructs (RQ2 of this thesis). We will present the model, the results, and then discuss
the results.
***p < 0.001; **p <0.05; *p < 0.1; ns: not significant
The Model
In RQ2, we investigate the relationship between the social innovation at the workplace and the
departmental performance. In order to investigate this relationship, we have designed a SEM model
that includes those two constructs (SIW and performance). The two constructs are represented in the
β =.38**
SIW
SIW
Collaborate
1
SIW
Own Team
SIW
WIthin Idea
SIW
Outside Idea
SIW
Own Idea
SIW
Slow
SIW
Rules
SIWCulture
Performance
P_Cost
P_Capacity
P_Flexibility
1
Figure 6-4 Direct Effect of SIW on Performance

Cha
pter
6
132 Data Analysis and Results
The Results
The model has =97 and 84 degrees of freedom. The p value was equal to .157, which is acceptable.
The ratio /df=1.16 which is also within the acceptable range. The values of CFI=0.98,
RMSEA=0.039, and PCFI=0.78 are all within the acceptable ranges. Therefore, we consider the
model having a good fit (see Table 6-1 for a list of acceptable ranges for the fit variables). The
standardized coefficient of the ITBSA construct was β =.73 (p<0.001) showing a positive effect of
ITBSA on SIW.
The Discussion
Studies in the strategic alignment between IT and the business side have attempted to study the path
from ITBSA to the firm’s performance. The controversy about the exact components of this path
have prompted several studies attempting to suggest factors along this path. It was suggested that
SIW is one of those factors. As part of our investigation of the path from ITBSA to performance, we
are proposing that the strategic alignment between the IT and business strategies has a positive effect
on SIW. The statistically significant association between the ITBSA and SIW constructs in our model
of Figure 6-3 have provided an empirical evidence supporting our proposition.
Our findings support previous findings that confirmed the general view of the positive effect of
strategic alignment on SIW (see, for example, Silva, Figueroa, & Reinharta, 2007; Tallon &
Pinsonneault, 2011) or the more recent ones reporting a positive impact of IT and alignment on
innovation (such as, Cui, Ye, Teo, & Li, 2015; Ferreira, Fernandes, Alves, & Raposo, 2015).
Moreover, our results expand the concept of ITBSA’s positive influence to include the collaboration
on SIW at the departmental level which has not been studied intensively. The importance of our
findings lies in the fact that we stress the critical role of formulating aligned strategies between the
IT and other business departments in enhancing the interdepartmental collaboration on SIW.
In order to affirm that SIW is a representation (and an important antecedent) of performance, we aim
to empirically associate SIW with departmental performance in subsection 6.4.2.
From IT Business Strategic Alignment to Performance 133
6.4.2 The Direct Effect of SIW on Performance Model
In this subsection, we will propose a SEM model to investigate the relationship between the SIW and
performance constructs (RQ2 of this thesis). We will present the model, the results, and then discuss
the results.
***p < 0.001; **p <0.05; *p < 0.1; ns: not significant
The Model
In RQ2, we investigate the relationship between the social innovation at the workplace and the
departmental performance. In order to investigate this relationship, we have designed a SEM model
that includes those two constructs (SIW and performance). The two constructs are represented in the
β =.38**
SIW
SIW
Collaborate
1
SIW
Own Team
SIW
WIthin Idea
SIW
Outside Idea
SIW
Own Idea
SIW
Slow
SIW
Rules
SIWCulture
Performance
P_Cost
P_Capacity
P_Flexibility
1
Figure 6-4 Direct Effect of SIW on Performance

134 Data Analysis and Results
form of two latent variables each composed of its observed variables (see Figure 6-4). The CFA in
section 6.3 has confirmed six observed variables to load into the SIW latent variable and three
observed variables to load into the performance latent variable. The arrow pointing from SIW to
performance is proposing a test of directional effect from SIW to performance.
The Results
The model results have shown value of 54.5 with 40 degrees of freedom (p 0.062). The /df ratio
was 1.36 which is considered within the acceptable range and the p value exceeding .05 confirms an
acceptable model. The CFI=0.97, RMSEA=0.06 (borderline), and the PCFI=0.71 were all also within
acceptable ranges. Below, we consider and discuss the structural model having an acceptable fit.
The Discussion
The standardized coefficient of the SIW latent variable was β=.38 (p=.008). This loading indicates a
positive and significant relationship between the SIW and departmental performance.
In literature, the effect of SIW on performance has been a controversial topic. This controversy was
the main stimulant behind our investigation of this relationship. Our findings have shown a positive
influence of SIW on departmental performance. These findings are in concordance with recent studies
confirming the positive effect of SIW on a firm’s performance (see, for example, Leal-Rodríguez,
Eldridge, Roldán, Leal-Millán, & Ortega-Gutiérrez, 2015; Piening & Salge, 2015; Yamin &
Mavondo, 2015; Sok & O'Cass, 2015). Those studies have supported a positive effect of SIW on
performance on several dimensions including, organizational, learning, financial, and individual.
Furthermore, our level of investigation is on the departmental level and specifically focusing on the
effect of collaboration on SIW. We show that on the departmental level, it is critical to collaborate
among various functional departments to achieve the desired SIW-induced performance.
On this level of analysis our findings are in alignment with scholars such as Ganotakis et al. (2013)
and Nichols et al. (2013) who have called for general collaboration needs for successful innovative
efforts. Our results are also in alignment with researchers that have more specifically argued for an
intra-departmental (cross functional) collaborative efforts towards innovation (see, for example, Pot
et al., 2012; Ganotakis et al., 2013), and with scholars such as Naranjo-Valencia et al. (2016) who
have stressed the importance of the creation of a collaborative culture at the people-level.
From IT Business Strategic Alignment to Performance 135
Our findings are not in agreement with the results by Mulgan et al. (2007) who have claimed that
SIW is a distraction from efficiency. Moreover, our results show that the final impact on performance
is positive despite claims by scholars such as Xue et al. (2012). They claim that SIW creates internal
competition for resources (and hence is reducing performance). This disagreement between our
findings and their conclusions might be due to the difference in the level of analysis. While their
research was on the firms aggregate level, we have focused on the intra-departmental collaboration
level, which might be the key success factor for an effective resource management and the eventual
positive impact on performance.
6.4.3 The Mediating Effect of SIW Model
The findings of the last two subsections (6.4.1 and 6.4.2) have shown a positive and significant effect
of both ITBSA on SIW, and SIW on performance. A quite frequently voiced and popular view in the
literature claims that the effect from ITBSA to performance is mediated by other critical factors (see,
for example, Masa'deh et al., 2008; Tallon & Pinsonneault, 2011; Luftman, 2015).
This trend has prompted our investigation into a possible mediating effect. Our literature review has
revealed that SIW is (a) a critical factor for firm’s performance (see, for example, Pot et al., 2012;
Rüede & Lurtz, 2012; Nichols et al., 2013; Naranjo-Valencia et al, 2016), and (b) possibly positioned
as a mediator on the path from IT investments to firm’s performance (cf. Masa'deh et al., 2008; Cui,
Ye, Teo, & Li, 2015; Arvanitis & Loukis, 2016).
The claims mentioned above have stimulated further inquiry into the actual role that SIW plays in the
relationship between ITBSA and performance by others and by us (RQ3 in our research). This
inquiry and the controversy in the literature about this issue were the continuous drivers behind our
RQ3. We are now proposing a mediating role of SIW on this relationship. In this subsection, we
design a SEM models and discuss their results that explore the role of SIW on the relationship
between ITBSA and performance.

Cha
pter
6
134 Data Analysis and Results
form of two latent variables each composed of its observed variables (see Figure 6-4). The CFA in
section 6.3 has confirmed six observed variables to load into the SIW latent variable and three
observed variables to load into the performance latent variable. The arrow pointing from SIW to
performance is proposing a test of directional effect from SIW to performance.
The Results
The model results have shown value of 54.5 with 40 degrees of freedom (p 0.062). The /df ratio
was 1.36 which is considered within the acceptable range and the p value exceeding .05 confirms an
acceptable model. The CFI=0.97, RMSEA=0.06 (borderline), and the PCFI=0.71 were all also within
acceptable ranges. Below, we consider and discuss the structural model having an acceptable fit.
The Discussion
The standardized coefficient of the SIW latent variable was β=.38 (p=.008). This loading indicates a
positive and significant relationship between the SIW and departmental performance.
In literature, the effect of SIW on performance has been a controversial topic. This controversy was
the main stimulant behind our investigation of this relationship. Our findings have shown a positive
influence of SIW on departmental performance. These findings are in concordance with recent studies
confirming the positive effect of SIW on a firm’s performance (see, for example, Leal-Rodríguez,
Eldridge, Roldán, Leal-Millán, & Ortega-Gutiérrez, 2015; Piening & Salge, 2015; Yamin &
Mavondo, 2015; Sok & O'Cass, 2015). Those studies have supported a positive effect of SIW on
performance on several dimensions including, organizational, learning, financial, and individual.
Furthermore, our level of investigation is on the departmental level and specifically focusing on the
effect of collaboration on SIW. We show that on the departmental level, it is critical to collaborate
among various functional departments to achieve the desired SIW-induced performance.
On this level of analysis our findings are in alignment with scholars such as Ganotakis et al. (2013)
and Nichols et al. (2013) who have called for general collaboration needs for successful innovative
efforts. Our results are also in alignment with researchers that have more specifically argued for an
intra-departmental (cross functional) collaborative efforts towards innovation (see, for example, Pot
et al., 2012; Ganotakis et al., 2013), and with scholars such as Naranjo-Valencia et al. (2016) who
have stressed the importance of the creation of a collaborative culture at the people-level.
From IT Business Strategic Alignment to Performance 135
Our findings are not in agreement with the results by Mulgan et al. (2007) who have claimed that
SIW is a distraction from efficiency. Moreover, our results show that the final impact on performance
is positive despite claims by scholars such as Xue et al. (2012). They claim that SIW creates internal
competition for resources (and hence is reducing performance). This disagreement between our
findings and their conclusions might be due to the difference in the level of analysis. While their
research was on the firms aggregate level, we have focused on the intra-departmental collaboration
level, which might be the key success factor for an effective resource management and the eventual
positive impact on performance.
6.4.3 The Mediating Effect of SIW Model
The findings of the last two subsections (6.4.1 and 6.4.2) have shown a positive and significant effect
of both ITBSA on SIW, and SIW on performance. A quite frequently voiced and popular view in the
literature claims that the effect from ITBSA to performance is mediated by other critical factors (see,
for example, Masa'deh et al., 2008; Tallon & Pinsonneault, 2011; Luftman, 2015).
This trend has prompted our investigation into a possible mediating effect. Our literature review has
revealed that SIW is (a) a critical factor for firm’s performance (see, for example, Pot et al., 2012;
Rüede & Lurtz, 2012; Nichols et al., 2013; Naranjo-Valencia et al, 2016), and (b) possibly positioned
as a mediator on the path from IT investments to firm’s performance (cf. Masa'deh et al., 2008; Cui,
Ye, Teo, & Li, 2015; Arvanitis & Loukis, 2016).
The claims mentioned above have stimulated further inquiry into the actual role that SIW plays in the
relationship between ITBSA and performance by others and by us (RQ3 in our research). This
inquiry and the controversy in the literature about this issue were the continuous drivers behind our
RQ3. We are now proposing a mediating role of SIW on this relationship. In this subsection, we
design a SEM models and discuss their results that explore the role of SIW on the relationship
between ITBSA and performance.

136 Data Analysis and Results
Two Models
To design the SEM model, we utilize the mediation methodology by Baron and Kenny (1986) (see
Chapter 4 for details) and apply the conceptual model designed in subsection 4.1.1 in a SEM
framework (see, for example, Hopwood , 2007; Leal-Rodríguez et al., 2015; Wu et al., 2015). By
following this methodology to explore the proposed mediating role, we need to show that (a) ITBSA
is initially related to performance, and (b) that this relationship is reduced or diminished by the
introduction of SIW into the relationship. To achieve this goal we need to design two SEM models,
Model 1 that explores the direct relationship between ITBSA and peformance, and Model 2 that will
simultaneously examine the relationships among ITBSA, SIW, and performance.
Figure 6-5 Model 1, direct effect of ITBSA on Performance ***p < 0.001; **p <0.05; *p < 0.1; ns: not significant
ITBSA
ITBSA
VIsion
ITBSA
Info
ITBSAMentality
ITBSA
Finance
ITBSA
Component
ITBSA
Projects
ITBSAValue
Performance
P_Cost
P_Capacity
P_Flexibility
1
1
β =.231**
From IT Business Strategic Alignment to Performance 137
Model 1
First, we design Model 1 which investigates the relationship between ITBSA and performance. We
do so by designing a model composed of the two constructs (ITBSA & performance) represented by
two latent variables connected with a directional arrow from ITBSA to performance (cf. Hopwood,
2007; Wu et al., 2015). The directional arrow depicts our claim that ITBSA has a direct effect on
departmental performance. The aim is to satisfy the first requirement by Baron and Kenny (1986) for
a mediation relationship as proposed by our conceptual model in subsection 4.1.1. Figure 6-5 depicts
the SEM model for this proposed relationship.
Discussion of Model 1 Validity Results
The results of the analysis were as follows. The p=.5) with 31 degrees of freedom. The
insignificant p-value (0.05) points to a valid model. The /df ratio was 1.45 which is also considered
within the acceptable range (< 2).
The CFI=0.95, and the PCFI=0.65 were all within acceptable ranges. RMSEA=0.066 is slightly above
the proposed value of .06. Given the good fit of the remaining indicators, the fact that fit indicator
values are only an estimation, and that according to Hu & Bentler (1998 & 1999) values close to 0.06
are acceptable, we consider the structural model having an acceptable fit. We return to Model 1 when
we discuss the results of the combined results of Model 1 and Model 2.
Model 2
For model 2, we implement the mediation conceptual model of subsection 4.1.1 in SEM methodology
as depicted in Figure 6-6. The three constructs ITBSA, SIW and performance are connected via
directional arrows to test for the significance of the paths (ITBSA->SIW) and (SIW->performance)
to satisfy the second condition of mediation by Baron & Kenny (1986). The mediation will be
considered a full mediation if the path (ITBSA->performance) becomes non-significant.
Discussion of Model2 Validity Results
The mediation model had a p=.5), df=126. The /df ratio was 1.22 which is within the
acceptable range. Hence, our model passed the inferential statistics test.
The values of CFI=0.97, RMSEA=0.046, and the PCFI=0.80 were all within acceptable ranges.
Consequently, we consider the model in Figure 6-6 a valid model. We return to Model 2 when we
discuss the combined results of Model 1 and Model 2.

Cha
pter
6
136 Data Analysis and Results
Two Models
To design the SEM model, we utilize the mediation methodology by Baron and Kenny (1986) (see
Chapter 4 for details) and apply the conceptual model designed in subsection 4.1.1 in a SEM
framework (see, for example, Hopwood , 2007; Leal-Rodríguez et al., 2015; Wu et al., 2015). By
following this methodology to explore the proposed mediating role, we need to show that (a) ITBSA
is initially related to performance, and (b) that this relationship is reduced or diminished by the
introduction of SIW into the relationship. To achieve this goal we need to design two SEM models,
Model 1 that explores the direct relationship between ITBSA and peformance, and Model 2 that will
simultaneously examine the relationships among ITBSA, SIW, and performance.
Figure 6-5 Model 1, direct effect of ITBSA on Performance ***p < 0.001; **p <0.05; *p < 0.1; ns: not significant
ITBSA
ITBSA
VIsion
ITBSA
Info
ITBSAMentality
ITBSA
Finance
ITBSA
Component
ITBSA
Projects
ITBSAValue
Performance
P_Cost
P_Capacity
P_Flexibility
1
1
β =.231**
From IT Business Strategic Alignment to Performance 137
Model 1
First, we design Model 1 which investigates the relationship between ITBSA and performance. We
do so by designing a model composed of the two constructs (ITBSA & performance) represented by
two latent variables connected with a directional arrow from ITBSA to performance (cf. Hopwood,
2007; Wu et al., 2015). The directional arrow depicts our claim that ITBSA has a direct effect on
departmental performance. The aim is to satisfy the first requirement by Baron and Kenny (1986) for
a mediation relationship as proposed by our conceptual model in subsection 4.1.1. Figure 6-5 depicts
the SEM model for this proposed relationship.
Discussion of Model 1 Validity Results
The results of the analysis were as follows. The p=.5) with 31 degrees of freedom. The
insignificant p-value (0.05) points to a valid model. The /df ratio was 1.45 which is also considered
within the acceptable range (< 2).
The CFI=0.95, and the PCFI=0.65 were all within acceptable ranges. RMSEA=0.066 is slightly above
the proposed value of .06. Given the good fit of the remaining indicators, the fact that fit indicator
values are only an estimation, and that according to Hu & Bentler (1998 & 1999) values close to 0.06
are acceptable, we consider the structural model having an acceptable fit. We return to Model 1 when
we discuss the results of the combined results of Model 1 and Model 2.
Model 2
For model 2, we implement the mediation conceptual model of subsection 4.1.1 in SEM methodology
as depicted in Figure 6-6. The three constructs ITBSA, SIW and performance are connected via
directional arrows to test for the significance of the paths (ITBSA->SIW) and (SIW->performance)
to satisfy the second condition of mediation by Baron & Kenny (1986). The mediation will be
considered a full mediation if the path (ITBSA->performance) becomes non-significant.
Discussion of Model2 Validity Results
The mediation model had a p=.5), df=126. The /df ratio was 1.22 which is within the
acceptable range. Hence, our model passed the inferential statistics test.
The values of CFI=0.97, RMSEA=0.046, and the PCFI=0.80 were all within acceptable ranges.
Consequently, we consider the model in Figure 6-6 a valid model. We return to Model 2 when we
discuss the combined results of Model 1 and Model 2.

138 Data Analysis and Results
The Combined Results of the Mediation test in Model 1 & Model 2
To assess whether SIW mediates the relationship between ITBSA and performance, we need to show
(1) a direct relationship between ITBSA and performance, (2) a valid relationship from ITBSA to
SIW, and (3) a valid relationship from SIW to performance.
First, in Model 1 (see Figure 6-5) the standardized loading of the ITBSA coefficient was significant
with β=.231 and (p=.045). This finding shows a significant initial direct effect of ITBSA on
performance, which satisfied the first condition above for a mediation test (cf. Baron and Kenny,
1986).
Second, in Model 2 (see Figure 6-6) (a) the ITBSA coefficient was β=0.731 (p<.001) satisfying the
second condition above. And (b), the coefficient for SIW was β=.415 (p=0.48) which satisfies the
third mediation condition above. Hence, all three required relationships for a mediation relationship
are valid. By this results we confirm the mediating role of SIW on the path from ITBSA to
performance.
Furthermore, the significant direct relationship from ITBSA to performance (in Model 1) has changed
to insignificant in Model 2 (β =-.05, p=0.848) indicating a full mediation situation.
The Discussion of the Combined Results by Model 1 and Model 2
Our initial findings of this subsection have confirmed a relatively37 positive effect of aligning the IT
and business strategies on the departmental performance. These findings are in concordance with
scholars that have established ITBSA as an enabler of organizational performance through improving
several organizational success factors including efficiency and effectiveness (cf. Jorfi et al., 2011;
Chang et al., 2011), cost effective operations (cf. Oh & Pinsonneault, 2007), and eventually improved
financial performance (cf. Jorfi & Jorfi, 2011; Wu et al., 2015).
37 We use the expression “relatively positive” to be on the conservative side due to the “borderline” indicators of the
ITBSA->performance SEM model. In the following mediating model, we show that this relationship between ITBSA and
performance is mediated by SIW at the departmental level.
From IT Business Strategic Alignment to Performance 139
Figure 6-6 Model 2, the mediation model of SIW ***p < 0.001; **p <0.05; *p < 0.1; ns: not significant
Moreover, our findings of subsection 6.4.2 have confirmed the assertions in points (a) and (b) above,
namely, that ITBSA has a positive influence on SIW, and that SIW (as claimed by many researchers)
is a critical factor for achieving higher performance levels. In summary, we have shown that the
relationship between the IT/business strategic alignment and the organizational performance at the
β =.731***
β =.415**
β = -.05ns
SIW
SIW
Collaborate
1
ITBSA
ITBSA
VIsion
ITBSA
Info
ITBSAMentality
ITBSA
Finance
ITBSA
Component
ITBSA
Projects
ITBSAValue
SIW
Own Team
SIW
WIthin Idea
SIW
Outside Idea
SIW
Own Idea
SIW
Slow
SIW
Rules
SIWCulture
Performance
P_Cost
P_Capacity
P_Flexibility
1
1

Cha
pter
6
138 Data Analysis and Results
The Combined Results of the Mediation test in Model 1 & Model 2
To assess whether SIW mediates the relationship between ITBSA and performance, we need to show
(1) a direct relationship between ITBSA and performance, (2) a valid relationship from ITBSA to
SIW, and (3) a valid relationship from SIW to performance.
First, in Model 1 (see Figure 6-5) the standardized loading of the ITBSA coefficient was significant
with β=.231 and (p=.045). This finding shows a significant initial direct effect of ITBSA on
performance, which satisfied the first condition above for a mediation test (cf. Baron and Kenny,
1986).
Second, in Model 2 (see Figure 6-6) (a) the ITBSA coefficient was β=0.731 (p<.001) satisfying the
second condition above. And (b), the coefficient for SIW was β=.415 (p=0.48) which satisfies the
third mediation condition above. Hence, all three required relationships for a mediation relationship
are valid. By this results we confirm the mediating role of SIW on the path from ITBSA to
performance.
Furthermore, the significant direct relationship from ITBSA to performance (in Model 1) has changed
to insignificant in Model 2 (β =-.05, p=0.848) indicating a full mediation situation.
The Discussion of the Combined Results by Model 1 and Model 2
Our initial findings of this subsection have confirmed a relatively37 positive effect of aligning the IT
and business strategies on the departmental performance. These findings are in concordance with
scholars that have established ITBSA as an enabler of organizational performance through improving
several organizational success factors including efficiency and effectiveness (cf. Jorfi et al., 2011;
Chang et al., 2011), cost effective operations (cf. Oh & Pinsonneault, 2007), and eventually improved
financial performance (cf. Jorfi & Jorfi, 2011; Wu et al., 2015).
37 We use the expression “relatively positive” to be on the conservative side due to the “borderline” indicators of the
ITBSA->performance SEM model. In the following mediating model, we show that this relationship between ITBSA and
performance is mediated by SIW at the departmental level.
From IT Business Strategic Alignment to Performance 139
Figure 6-6 Model 2, the mediation model of SIW ***p < 0.001; **p <0.05; *p < 0.1; ns: not significant
Moreover, our findings of subsection 6.4.2 have confirmed the assertions in points (a) and (b) above,
namely, that ITBSA has a positive influence on SIW, and that SIW (as claimed by many researchers)
is a critical factor for achieving higher performance levels. In summary, we have shown that the
relationship between the IT/business strategic alignment and the organizational performance at the
β =.731***
β =.415**
β = -.05ns
SIW
SIW
Collaborate
1
ITBSA
ITBSA
VIsion
ITBSA
Info
ITBSAMentality
ITBSA
Finance
ITBSA
Component
ITBSA
Projects
ITBSAValue
SIW
Own Team
SIW
WIthin Idea
SIW
Outside Idea
SIW
Own Idea
SIW
Slow
SIW
Rules
SIWCulture
Performance
P_Cost
P_Capacity
P_Flexibility
1
1

140 Data Analysis and Results
departmental level is mediated by other factors, and among them the social innovation at work (SIW)
plays an important role. We are pleased to report this as a contribution to the ideas published so far.
6.4.4 The Moderated Mediation Model
There are a few views in the literature (including our own) that have claimed a mediating role of SIW
on the relationship between ITBSA and performance. Nevertheless, this issue is still controversial.
There have been strong calls to include the study of “other” variables in any linear relationships (cf.
Chan & Reich, 2007). Some researchers have called specifically for the investigation of moderating
effect on any mediating relationship with the hope to clarify the controversy (see, e.g., Kraemer et
al., 2002). These calls inspired us to formulate RQ4. The aim is to explain the controversial results of
the relationship between ITBSA, SIW, and departmental performance considering the EGIT
involvement as a potential moderator. In this subsection, we design a moderated mediation model,
test the model, present the results, and discuss their implications.
The Model
To investigate the effect of EGIT on the ITBSA-SIW-performance relationship, we follow the
conceptual model designed in subsection 4.5.2 which positions EGIT as a proposed moderator to this
relationship. The SEM model incorporates the four constructs (ITBSA, EGIT, SIW, and
performance). The constructs are represented by four latent variables composed of their respective
observed variables as per the CFA in section 6.3.
To test a moderation effect in a regression setting, an interaction term is used (see subsection 4.1.2
for details). The simplest form of an interaction term is the result of the multiplication of the
independent and the moderator variables (cf. Baron & Kenny, 1986). The apparent problem with such
interaction term is that it usually is highly correlated with its first order predictor variables from which
it was calculated, causing a major fluctuation in the estimated regression weights by even a small
fluctuation in the sample (cf. Little, Bovaird, & Widaman, 2006). As a solution to this collinearity
problem, researchers have used the mean centering technique. Nevertheless, in certain instances of
using this technique, some collinearity might remain. In those cases, a residual centering could be
applied38. This technique involves a two-step regression procedure in order to orthogonalize
38 For detailed description of those techniques and their advantages/disadvantages, please refer to Kenny & Judd (1984),
Little et al., (2006), and Steinmetz, Davidov, & Schmidt, 2011).
From IT Business Strategic Alignment to Performance 141
(eliminates non-essential multi-collinearity) in regression analyses. This process ensures that the
product term is independent from its first order components. In our case, SEM is used for the
moderation analysis and the product term is composed of two latent variables (ITBSA and EGIT).
We have followed the procedure described in Little et al. (2006) and Steinmetz et al. (2011) to create
the (residual-centering-based) orthogonalized indicators for the interaction product term. The
interaction term is named ITBSAxEGIT and consists of fourteen (2 EGIT x 7 ITBSA) residual terms
as input variables (see Appendix C for details of the calculations).
The SEM model expressing the conceptual moderated mediation model of subsection 4.5.2 is based
on the SEM model in Preacher et al. (2007) and Fairchild & MacKinnon (2009, model “b”) (see
Figure 6-7). To match the model of Figure 6-7 into our constructs, the letter “X” would represent
ITBSA, “M” would correspond to SIW, and “W” would be the EGIT. The letter “Y” is the
departmenal performance. Our moderated mediation model is depicted in Figure 6-8.
Figure 6-7 SEM model of moderated mediation
Adopted form Preacher et al. (2007), p194
The Results
The moderated mediation model in Figure 6-8 had p=.399) and df=465. The /df ratio was
1.02 which is within the acceptable range. Hence, our model passed the inferential statistics test. The
model had CFI=0.99, RMSEA=0.012, and PCFI=0.826. The CFI, RMSEA and PCFI were all within
acceptable values (see Table 6-3). As a result, we consider the model valid and will continue the
investigation. The coefficient of the product term (ITBSA x EGIT) was positive and significant, β
=0.21 (p=.049). The coefficients of the ITBSA and SIW variables were all valid with values of β
=0.59 (p<.001), and β =0.53 (p<.027) respectively.

Cha
pter
6
140 Data Analysis and Results
departmental level is mediated by other factors, and among them the social innovation at work (SIW)
plays an important role. We are pleased to report this as a contribution to the ideas published so far.
6.4.4 The Moderated Mediation Model
There are a few views in the literature (including our own) that have claimed a mediating role of SIW
on the relationship between ITBSA and performance. Nevertheless, this issue is still controversial.
There have been strong calls to include the study of “other” variables in any linear relationships (cf.
Chan & Reich, 2007). Some researchers have called specifically for the investigation of moderating
effect on any mediating relationship with the hope to clarify the controversy (see, e.g., Kraemer et
al., 2002). These calls inspired us to formulate RQ4. The aim is to explain the controversial results of
the relationship between ITBSA, SIW, and departmental performance considering the EGIT
involvement as a potential moderator. In this subsection, we design a moderated mediation model,
test the model, present the results, and discuss their implications.
The Model
To investigate the effect of EGIT on the ITBSA-SIW-performance relationship, we follow the
conceptual model designed in subsection 4.5.2 which positions EGIT as a proposed moderator to this
relationship. The SEM model incorporates the four constructs (ITBSA, EGIT, SIW, and
performance). The constructs are represented by four latent variables composed of their respective
observed variables as per the CFA in section 6.3.
To test a moderation effect in a regression setting, an interaction term is used (see subsection 4.1.2
for details). The simplest form of an interaction term is the result of the multiplication of the
independent and the moderator variables (cf. Baron & Kenny, 1986). The apparent problem with such
interaction term is that it usually is highly correlated with its first order predictor variables from which
it was calculated, causing a major fluctuation in the estimated regression weights by even a small
fluctuation in the sample (cf. Little, Bovaird, & Widaman, 2006). As a solution to this collinearity
problem, researchers have used the mean centering technique. Nevertheless, in certain instances of
using this technique, some collinearity might remain. In those cases, a residual centering could be
applied38. This technique involves a two-step regression procedure in order to orthogonalize
38 For detailed description of those techniques and their advantages/disadvantages, please refer to Kenny & Judd (1984),
Little et al., (2006), and Steinmetz, Davidov, & Schmidt, 2011).
From IT Business Strategic Alignment to Performance 141
(eliminates non-essential multi-collinearity) in regression analyses. This process ensures that the
product term is independent from its first order components. In our case, SEM is used for the
moderation analysis and the product term is composed of two latent variables (ITBSA and EGIT).
We have followed the procedure described in Little et al. (2006) and Steinmetz et al. (2011) to create
the (residual-centering-based) orthogonalized indicators for the interaction product term. The
interaction term is named ITBSAxEGIT and consists of fourteen (2 EGIT x 7 ITBSA) residual terms
as input variables (see Appendix C for details of the calculations).
The SEM model expressing the conceptual moderated mediation model of subsection 4.5.2 is based
on the SEM model in Preacher et al. (2007) and Fairchild & MacKinnon (2009, model “b”) (see
Figure 6-7). To match the model of Figure 6-7 into our constructs, the letter “X” would represent
ITBSA, “M” would correspond to SIW, and “W” would be the EGIT. The letter “Y” is the
departmenal performance. Our moderated mediation model is depicted in Figure 6-8.
Figure 6-7 SEM model of moderated mediation
Adopted form Preacher et al. (2007), p194
The Results
The moderated mediation model in Figure 6-8 had p=.399) and df=465. The /df ratio was
1.02 which is within the acceptable range. Hence, our model passed the inferential statistics test. The
model had CFI=0.99, RMSEA=0.012, and PCFI=0.826. The CFI, RMSEA and PCFI were all within
acceptable values (see Table 6-3). As a result, we consider the model valid and will continue the
investigation. The coefficient of the product term (ITBSA x EGIT) was positive and significant, β
=0.21 (p=.049). The coefficients of the ITBSA and SIW variables were all valid with values of β
=0.59 (p<.001), and β =0.53 (p<.027) respectively.

142 Data Analysis and Results
β = 0.21*
β =0.59***
β = 0.53*
***p < 0.001; **p <0.01; *p < 0.05; ns: not significant
The Discussion
A consensus on the relationship between ITBSA and EGIT has not been well established in the
literature (see subsection 3.3.3). The literature agrees that both (ITBSA and EGIT) are closely related
(cf. Tiwana & Konsysnski, 2010), and have an eventual positive effect on performance (see, e.g.,
Faryabi, Fazlzadeh, Zahedi, & Darabi, 2012; Tallon et al., 2013; Luftman, 2015; Héroux & Fortin,
2016). Nevertheless, some scholars have categorized EGIT as an antecedent of ITBSA as in the SAM
model where EGIT is one of ITBSA’s maturity factors (see, Sabegh & Motlagh, 2012; Luftman,
β = -.09ns
Figure 6-8 The complete moderated mediation SEM model
SIW
SIW
Collaborate
1
ITBSA
ITBSA
VIsion
ITBSAInfo
ITBSA
Mentality
ITBSA
Finance
ITBSA
Component
ITBSAProjects
ITBSA
Value
SIWOwn Team
SIWWIthin Idea
SIW
Outside Idea
SIWOwn Idea
SIW
Slow
SIW
Rules
SIW
Culture
Performance
P_Cost
P_Capacity
P_Flexibility
1
1
EGIT
EGIT
PROCESSES1
EGIT
STRUCTURES
ITBSAxEGIT
e1i1
1
e1i2
e1i3
e1i4
e1i5
e1i6
e1i7
e2i1
e2i2
e2i3
e2i4
e2i5
e2i6
e2i7
From IT Business Strategic Alignment to Performance 143
2015), while others have concluded that ITBSA is a predecessor of a successful IT governance
(EGIT) (cf. Beimborn, Schlosser, & Weitzel, 2009; Chang et al., 2011; Tallon, Ramirez, & Short,
2013).
As a response to this controversy, we have decided to investigate EGIT as a moderator for the effect
of ITBSA on performance (mediated by SIW). Initially, in subsection 6.4.3 we have constructed a
mediation model of ITBSA, SIW, and performance. In the current subsection, we have built a
complex model of moderated mediation that builds on the mediation model of subsection 6.4.3. This
complex model investigates two critical concepts. First, it investigates a popular suggestion in the
literature that mediating relationships need to be investigated for possible moderators. Second, it
specifically investigates EGIT as being one of those possible moderators in the specific case of the
mediating relationship among ITBSA, SIW, and performance. The positive and significant
coefficient of the product term (ITBSAxEGIT) points to a significant moderating effect of EGIT on
the relationship between ITBSA and SIW (cf. James & Brett, 1984; Wgener & Fabrigar, 2000).
Moreover, the change in the coefficients of the ITBSA and SIW, as a result of the introduction of the
EGIT into the mediating model of subsection 6.4.3, also confirm the moderating effect of EGIT (cf.
Preacher, Rucker, & Hayes, 2007).
Consequently, our findings are in alignment with both main trends in the literature. First, we confirm
the validity of the calls by scholars for testing moderating effects with mediating relationships (e.g.,
James & Brett, 1984; Kraemer et al., 2002). Second, by introducing EGIT as a moderator into the
mediating relationship of SIW, and by confirming a significant moderating effect, we are confirming
our choice of EGIT as a moderator to the effect of ITBSA on performance (through the mediation of
SIW). This finding is in alignment with scholars such as Chang et al. (2011) who have modeled EGIT
in a moderating position.
Our results also contribute to the SAM literature. The controversy, criticism, and researcher’s
classification in regard to the SAM model was explored in subsection 2.1.2. In spite of the fact that
there are no rigid borderlines between some of the 7 groups of researchers as put forward by Renaud
et al. (2016) (see subsection 2.1.2), we claim that our research could be classified within the two
groups of (1) & (2). This is because we have both used statistical methods, and studied the effect of
strategic alignment on performance.

Cha
pter
6
142 Data Analysis and Results
β = 0.21*
β =0.59***
β = 0.53*
***p < 0.001; **p <0.01; *p < 0.05; ns: not significant
The Discussion
A consensus on the relationship between ITBSA and EGIT has not been well established in the
literature (see subsection 3.3.3). The literature agrees that both (ITBSA and EGIT) are closely related
(cf. Tiwana & Konsysnski, 2010), and have an eventual positive effect on performance (see, e.g.,
Faryabi, Fazlzadeh, Zahedi, & Darabi, 2012; Tallon et al., 2013; Luftman, 2015; Héroux & Fortin,
2016). Nevertheless, some scholars have categorized EGIT as an antecedent of ITBSA as in the SAM
model where EGIT is one of ITBSA’s maturity factors (see, Sabegh & Motlagh, 2012; Luftman,
β = -.09ns
Figure 6-8 The complete moderated mediation SEM model
SIW
SIW
Collaborate
1
ITBSA
ITBSA
VIsion
ITBSAInfo
ITBSA
Mentality
ITBSA
Finance
ITBSA
Component
ITBSAProjects
ITBSA
Value
SIWOwn Team
SIWWIthin Idea
SIW
Outside Idea
SIWOwn Idea
SIW
Slow
SIW
Rules
SIW
Culture
Performance
P_Cost
P_Capacity
P_Flexibility
1
1
EGIT
EGIT
PROCESSES1
EGIT
STRUCTURES
ITBSAxEGIT
e1i1
1
e1i2
e1i3
e1i4
e1i5
e1i6
e1i7
e2i1
e2i2
e2i3
e2i4
e2i5
e2i6
e2i7
From IT Business Strategic Alignment to Performance 143
2015), while others have concluded that ITBSA is a predecessor of a successful IT governance
(EGIT) (cf. Beimborn, Schlosser, & Weitzel, 2009; Chang et al., 2011; Tallon, Ramirez, & Short,
2013).
As a response to this controversy, we have decided to investigate EGIT as a moderator for the effect
of ITBSA on performance (mediated by SIW). Initially, in subsection 6.4.3 we have constructed a
mediation model of ITBSA, SIW, and performance. In the current subsection, we have built a
complex model of moderated mediation that builds on the mediation model of subsection 6.4.3. This
complex model investigates two critical concepts. First, it investigates a popular suggestion in the
literature that mediating relationships need to be investigated for possible moderators. Second, it
specifically investigates EGIT as being one of those possible moderators in the specific case of the
mediating relationship among ITBSA, SIW, and performance. The positive and significant
coefficient of the product term (ITBSAxEGIT) points to a significant moderating effect of EGIT on
the relationship between ITBSA and SIW (cf. James & Brett, 1984; Wgener & Fabrigar, 2000).
Moreover, the change in the coefficients of the ITBSA and SIW, as a result of the introduction of the
EGIT into the mediating model of subsection 6.4.3, also confirm the moderating effect of EGIT (cf.
Preacher, Rucker, & Hayes, 2007).
Consequently, our findings are in alignment with both main trends in the literature. First, we confirm
the validity of the calls by scholars for testing moderating effects with mediating relationships (e.g.,
James & Brett, 1984; Kraemer et al., 2002). Second, by introducing EGIT as a moderator into the
mediating relationship of SIW, and by confirming a significant moderating effect, we are confirming
our choice of EGIT as a moderator to the effect of ITBSA on performance (through the mediation of
SIW). This finding is in alignment with scholars such as Chang et al. (2011) who have modeled EGIT
in a moderating position.
Our results also contribute to the SAM literature. The controversy, criticism, and researcher’s
classification in regard to the SAM model was explored in subsection 2.1.2. In spite of the fact that
there are no rigid borderlines between some of the 7 groups of researchers as put forward by Renaud
et al. (2016) (see subsection 2.1.2), we claim that our research could be classified within the two
groups of (1) & (2). This is because we have both used statistical methods, and studied the effect of
strategic alignment on performance.

144 Data Analysis and Results
Our contribution to the literature is in two unique directions. (1) We explored the internal structures
of the SAM model. We have shown that the IT strategies and the business strategies (a) need to have
a strategic alignment (rather than functional integration). And (b) in order for this alignment to have
a positive effect on performance, it needs to have, first, a focus on innovation and second, there need
to be effective IT processes and structures in place. These findings provide a distinct insight into the
internal structure of the SAM model in terms of the relationships among three of its domains (IT
strategy, business strategy, and IT structures). (2) We have performed the analysis at the departmental
level. Hence, giving guidance to the middle-management of an organization. This fact aids with the
criticism of the SAM model as being designed and analyzed for the top-management level of the
organization. Finally, based on the results discussed above, we may conclude that EGIT improves
the effectiveness of IT Luftman (2015), and Héroux & Fortin (2016)39. Table 6-5 summarizes the
results and investments on performance as earlier proposed by Haghjoo (2012), Table 6-5 presentes
conclusions of all the SEM models.
39 Inspite of the fact that Héroux & Fortin (2016) have not modelled EGIT specifically in the moderating position, our
results agrees with their research in the principle that EGIT enhances the effectiveness of IT investments on the innovation
process.
From IT Business Strategic Alignment to Performance 145
Table 6-5 Summary of the SEM models results ***p < 0.001; **p <0.01; *p < 0.05; ns: not significant

Cha
pter
6
144 Data Analysis and Results
Our contribution to the literature is in two unique directions. (1) We explored the internal structures
of the SAM model. We have shown that the IT strategies and the business strategies (a) need to have
a strategic alignment (rather than functional integration). And (b) in order for this alignment to have
a positive effect on performance, it needs to have, first, a focus on innovation and second, there need
to be effective IT processes and structures in place. These findings provide a distinct insight into the
internal structure of the SAM model in terms of the relationships among three of its domains (IT
strategy, business strategy, and IT structures). (2) We have performed the analysis at the departmental
level. Hence, giving guidance to the middle-management of an organization. This fact aids with the
criticism of the SAM model as being designed and analyzed for the top-management level of the
organization. Finally, based on the results discussed above, we may conclude that EGIT improves
the effectiveness of IT Luftman (2015), and Héroux & Fortin (2016)39. Table 6-5 summarizes the
results and investments on performance as earlier proposed by Haghjoo (2012), Table 6-5 presentes
conclusions of all the SEM models.
39 Inspite of the fact that Héroux & Fortin (2016) have not modelled EGIT specifically in the moderating position, our
results agrees with their research in the principle that EGIT enhances the effectiveness of IT investments on the innovation
process.
From IT Business Strategic Alignment to Performance 145
Table 6-5 Summary of the SEM models results ***p < 0.001; **p <0.01; *p < 0.05; ns: not significant

146
This page is left intentionally blank
CHAPTER 7 CONCLUSION
In this chapter, we provide a conclusion to our research. We will do so by providing answers to the
research questions in section 7.1 and the problem statement in section 7.2. We will provide
observations and personal opinions in section 7.3. In section 7.4 we give four limitations of the study.
Finally, in section 7.5 we give five suggestions for future research.
7.1 Answers to the Research Questions
In Chapter 1 we presented our problem statement. This problem statement was investigated by four
research questions presented in section 1.5. The answers of those research questions will be
summarized in subsections (7.1.1 - 7.1.4).
7.1.1 Answer to RQ1
The research question RQ1 reads as follows: “What is the effect of IT Business Strategic Alignment
on Social Innovation at Work (SIW) at the departmental level?”
We have investigated this relationship by initially conducting an extensive literature review. Despite
the controversies in the literature regarding the direct effect of the strategic alignment (ITBSA) on
the organizational social innovation at work (SIW), we have claimed in this research that, at the
departmental level, there exists a positive relationship between the ITBSA and the SIW.
Our empirical testing of this proposition included collecting data at the departmental level through a
questionnaire on ITBSA and SIW. The survey has produced 103 valid data points. The data was
analyzed using the SEM methodology. The analysis has led to a valid model showing a positive and
significant effect of ITBSA on SIW (see subsection 6.4.1 for the analysis and the discussion of the
results).
As a conclusion to our literature review and empirical data analysis, we provide an answer to RQ1 as
follows.
Cha
pter
7
146
This page is left intentionally blank
CHAPTER 7 CONCLUSION
In this chapter, we provide a conclusion to our research. We will do so by providing answers to the
research questions in section 7.1 and the problem statement in section 7.2. We will provide
observations and personal opinions in section 7.3. In section 7.4 we give four limitations of the study.
Finally, in section 7.5 we give five suggestions for future research.
7.1 Answers to the Research Questions
In Chapter 1 we presented our problem statement. This problem statement was investigated by four
research questions presented in section 1.5. The answers of those research questions will be
summarized in subsections (7.1.1 - 7.1.4).
7.1.1 Answer to RQ1
The research question RQ1 reads as follows: “What is the effect of IT Business Strategic Alignment
on Social Innovation at Work (SIW) at the departmental level?”
We have investigated this relationship by initially conducting an extensive literature review. Despite
the controversies in the literature regarding the direct effect of the strategic alignment (ITBSA) on
the organizational social innovation at work (SIW), we have claimed in this research that, at the
departmental level, there exists a positive relationship between the ITBSA and the SIW.
Our empirical testing of this proposition included collecting data at the departmental level through a
questionnaire on ITBSA and SIW. The survey has produced 103 valid data points. The data was
analyzed using the SEM methodology. The analysis has led to a valid model showing a positive and
significant effect of ITBSA on SIW (see subsection 6.4.1 for the analysis and the discussion of the
results).
As a conclusion to our literature review and empirical data analysis, we provide an answer to RQ1 as
follows.

148 Conclusion
“The empirical results support our claim that there is a positive impact of ITBSA on Social Innovation
at Work SIW.”
This result is in alignment with studies such as Silva et al. (2007), Neubert et al. (2011), Cui et al.
(2015), and Ferreira et al. (2015)/ They also have concluded a positive impact of strategic alignment
on promoting innovative activities and collaboration.
7.1.2 Answer to RQ2
Research question RQ2 is concerned with an important yet controversial topic. That is, the
collaboration on social innovation at work (SIW) and its effect on performance at the departmental
level.
The research question RQ2 reads as follows: “What is the role of Social Innovation at Work (SIW)
on the departmental performance?
Our literature review in Chapter 3 has revealed that SIW, as a concept, is critical not only to the
organizational success but also to the survival of an organization. However, we have pointed to the
fact that scholars have different opinions on the issue of the effect of SIW on performance. SIW,
while considered a vehicle for effective resource and knowledge sharing, was shown by some scholars
to be a source of conflicts and unnecessary project delays causing significant cost overruns40.
In order to investigate this controversial relationship, we have used a matched data collection
instruments for SIW and departmental performance (see subsections 5.2.3 and 5.2.4, respectively).
Overall 103 valid data points were collected. Our SEM model and the results of the empirical analysis
in subsection 6.4.2 have established a positive and statistically significant effect of SIW on the
departmental performance.
Therefore, we state our answer to the research question RQ2 as follows.
“The departmental social innovation at work SIW has a positive effect on the departmental
performance in terms of service flexibility, production capacity and cost reduction “.
40 See (section 4.1) for detailed discussion and references.
From IT Business Strategic Alignment to Performance 149
Despite some studies which have shed some doubt on the positive effect of SIW on performance (see,
for example, Cuijpers et al., 2011; Bry et al., 2011), our answer to RQ2 concurs with studies such as
Quintane, Casselman, Reiche, & Nylund (2011), Yamin & Mavondo (2015), and Piening & Salge
(2015) in establishing a positive effect of SIW on performance. We believe that by this study we have
contributed to the body of knowledge on this topic. Our re-focusing on this research topic has
strengthened the confirmation to a departmental level of analysis.
7.1.3 Answer to RQ3
The research question RQ3 reads as follows: “How does the Social Innovation at Work at the
departmental level affect the relationship between the ITBSA and departmental performance?
Our research has demonstrated empirically (by answering RQ1 & RQ2 above) that (a) ITBSA has a
positive effect on SIW, and (b) SIW has a positive effect on the departmental performance.
Furthermore, there were studies on the organizational level which argued in favor of a mediating role
of SIW between organizational factors and performance (see, e.g., Han, Kim and Srivastava, 1998;
Hurley and Hult, 1998; Kirca, Jayachandran and Bearden, 2005). To investigate our claim that at the
departmental level, SIW acts as a mediator between ITBSA and performance, we have (a) performed
an extensive literature review, and (b) collected data reflecting the three constructs of our proposed
model, namely, ITBSA, SIW, and departmental performance. Our proposed model was analyzed
using the SEM methodology. The examination of the model has shown that it is a valid structural
model. Moreover, not only all conditions of a mediating model were satisfied (see subsection 6.4.3),
but also, the direct path from ITBSA to performance has turned to be a non-significant (as a result of
introducing the mediator). All in all, our research indicated a full mediation effect of SIW.
Based on those results, we provide the following answer to the RQ3.
“SIW has a full mediating role between ITBSA and departmental performance “.
Our answer to RQ3 contributes to the clarification of the ongoing controversy regarding the direct
link of ITBSA to performance vs. an indirect link through mediating factors. Our results are in
accordance with both (a) studies indicating the general presence of mediating factors between ITBSA
and performance (cf. Hurley & Hult, 1998; Kirca et al., 2005; Schwarz et al., 2010; Maçada et al.,
2012), and (b) a more specific studies pointing to SIW as a mediator along the path from IT

Cha
pter
7
148 Conclusion
“The empirical results support our claim that there is a positive impact of ITBSA on Social Innovation
at Work SIW.”
This result is in alignment with studies such as Silva et al. (2007), Neubert et al. (2011), Cui et al.
(2015), and Ferreira et al. (2015)/ They also have concluded a positive impact of strategic alignment
on promoting innovative activities and collaboration.
7.1.2 Answer to RQ2
Research question RQ2 is concerned with an important yet controversial topic. That is, the
collaboration on social innovation at work (SIW) and its effect on performance at the departmental
level.
The research question RQ2 reads as follows: “What is the role of Social Innovation at Work (SIW)
on the departmental performance?
Our literature review in Chapter 3 has revealed that SIW, as a concept, is critical not only to the
organizational success but also to the survival of an organization. However, we have pointed to the
fact that scholars have different opinions on the issue of the effect of SIW on performance. SIW,
while considered a vehicle for effective resource and knowledge sharing, was shown by some scholars
to be a source of conflicts and unnecessary project delays causing significant cost overruns40.
In order to investigate this controversial relationship, we have used a matched data collection
instruments for SIW and departmental performance (see subsections 5.2.3 and 5.2.4, respectively).
Overall 103 valid data points were collected. Our SEM model and the results of the empirical analysis
in subsection 6.4.2 have established a positive and statistically significant effect of SIW on the
departmental performance.
Therefore, we state our answer to the research question RQ2 as follows.
“The departmental social innovation at work SIW has a positive effect on the departmental
performance in terms of service flexibility, production capacity and cost reduction “.
40 See (section 4.1) for detailed discussion and references.
From IT Business Strategic Alignment to Performance 149
Despite some studies which have shed some doubt on the positive effect of SIW on performance (see,
for example, Cuijpers et al., 2011; Bry et al., 2011), our answer to RQ2 concurs with studies such as
Quintane, Casselman, Reiche, & Nylund (2011), Yamin & Mavondo (2015), and Piening & Salge
(2015) in establishing a positive effect of SIW on performance. We believe that by this study we have
contributed to the body of knowledge on this topic. Our re-focusing on this research topic has
strengthened the confirmation to a departmental level of analysis.
7.1.3 Answer to RQ3
The research question RQ3 reads as follows: “How does the Social Innovation at Work at the
departmental level affect the relationship between the ITBSA and departmental performance?
Our research has demonstrated empirically (by answering RQ1 & RQ2 above) that (a) ITBSA has a
positive effect on SIW, and (b) SIW has a positive effect on the departmental performance.
Furthermore, there were studies on the organizational level which argued in favor of a mediating role
of SIW between organizational factors and performance (see, e.g., Han, Kim and Srivastava, 1998;
Hurley and Hult, 1998; Kirca, Jayachandran and Bearden, 2005). To investigate our claim that at the
departmental level, SIW acts as a mediator between ITBSA and performance, we have (a) performed
an extensive literature review, and (b) collected data reflecting the three constructs of our proposed
model, namely, ITBSA, SIW, and departmental performance. Our proposed model was analyzed
using the SEM methodology. The examination of the model has shown that it is a valid structural
model. Moreover, not only all conditions of a mediating model were satisfied (see subsection 6.4.3),
but also, the direct path from ITBSA to performance has turned to be a non-significant (as a result of
introducing the mediator). All in all, our research indicated a full mediation effect of SIW.
Based on those results, we provide the following answer to the RQ3.
“SIW has a full mediating role between ITBSA and departmental performance “.
Our answer to RQ3 contributes to the clarification of the ongoing controversy regarding the direct
link of ITBSA to performance vs. an indirect link through mediating factors. Our results are in
accordance with both (a) studies indicating the general presence of mediating factors between ITBSA
and performance (cf. Hurley & Hult, 1998; Kirca et al., 2005; Schwarz et al., 2010; Maçada et al.,
2012), and (b) a more specific studies pointing to SIW as a mediator along the path from IT

150 Conclusion
investments to performance (e.g., Hemmatfar et al., 2010; Coleman & Chatfield, 2011; Kleis et al.,
2012).
In our answer to RQ3, we have stressed the critical role of the collaboration on SIW. Moreover, in
subsection 5.4.3 we have shown that our respondents have ranked the two factors (1) lack of
information, and (2) the difficulty of finding cooperation partners for innovation projects among the
highest factors hampering innovation efforts. In spite of the fact that none of the studied organizations
in this research was organized as a formal network structure, we fully recognize the importance of
the concept of network society (please see subsection 3.2.2 for discussion of the concept) in
supporting effective collaboration towards successful SIW. For example, social communications
networks have led to an increased cross-department communications (both formal and informal mode
of communications). Such communications may reduce the barriers to collaborative innovation
efforts, such as, communications barriers, and cultural barriers (see subsection 3.2.2). Therefore, we
believe that facilitating the creation of an effective (flexible and adaptable) network society within
an organization is inevitable for improved performance.
7.1.4 Answer to RQ4
Research question RQ4 reads as follows: “How does EGIT affect the relationship between ITBSA
and performance at the departmental level?”
The importance of moderating variables in research is large. Moreover, the suggestion in the literature
is that moderating variables should be tested with mediating relationships. Thus, we have investigated
in this research to what extent does the EGIT have a moderating effect on the relationship between
the ITBSA and performance by acting on the path between ITBSA and SIW (subsection 4.4.3). To
test our claim, we have performed an extensive literature review and designed a complex conceptual
model incorporating both the mediating effect of SIW as shown in RQ3, and the proposed moderating
effect of EGIT (see subsection 4.5.2). This conceptual model has utilized and combined the collected
data on the following four constructs: ITBSA, SIW, EGIT, and performance. The model was designed
and tested using SEM (see subsection 6.4.4). The analysis and discussion has revealed that the model
is significant and indicated that EGIT has a moderating effect along the path from ITBSA to
performance.
Consequently, our answer to the research question RQ4 is as follows.
From IT Business Strategic Alignment to Performance 151
“EGIT has a moderating effect along the path from ITBSA to performance at the departmental level.”
These results are in agreement with researchers who have claimed that a relationship between ITBSA
and Performance is moderated by other factors (cf. Lindman et al., 2001). Our results are also in
concordance with more specific studies that point directly to IT governance as a factor along this path
(see, e.g., De Haes & Van Grembergen, 2009; Haghjoo, 2012; De Haes & Van Grembergen, 2013).
7.2 Answer to the Problem Statement
The problem statement of this research thesis reads as follows:
“To what extent can we make transparent the effects of SIW and Enterprise Governance of IT on the
relationship between IT Business Strategic Alignment and the Organizational Performance at the
departmental level?”
The complex model that we have designed in subsection 4.5.2 and analyzed using the SEM
methodology in subsection 6.4.4, has revealed a moderating effect of EGIT as resulted from RQ4.
But, the complex nature of the model has also revealed that there is an interaction between the
mediating effect of SIW (RQ3) and the moderating effect of EGIT (RQ4). The analysis and discussion
in subsection 6.4.4 has shown that the nature of this interaction is “moderated mediation”, i.e., the
mediating effect of SIW (on the relationship between ITBSA and performance) is moderated by
EGIT. Therefore, our formal answer to the main problem statement is as follows.
“EGIT and SIW both significantly act on the path from ITBSA to performance in the form that SIW
mediates the relationship between ITBSA and performance, and this mediating relationship is
moderated by EGIT.”
Our answer to the problem statement emphasizes the that Social Innovation at the workplace (SIW)
is a critical and inevitable factor in realizing value from IT investments. Yet, to achieve the best
potential of those investments, an effective Enterprise Governance of IT processes and structures
must be in place. These findings constitute our main contribution of this study.

Cha
pter
7
150 Conclusion
investments to performance (e.g., Hemmatfar et al., 2010; Coleman & Chatfield, 2011; Kleis et al.,
2012).
In our answer to RQ3, we have stressed the critical role of the collaboration on SIW. Moreover, in
subsection 5.4.3 we have shown that our respondents have ranked the two factors (1) lack of
information, and (2) the difficulty of finding cooperation partners for innovation projects among the
highest factors hampering innovation efforts. In spite of the fact that none of the studied organizations
in this research was organized as a formal network structure, we fully recognize the importance of
the concept of network society (please see subsection 3.2.2 for discussion of the concept) in
supporting effective collaboration towards successful SIW. For example, social communications
networks have led to an increased cross-department communications (both formal and informal mode
of communications). Such communications may reduce the barriers to collaborative innovation
efforts, such as, communications barriers, and cultural barriers (see subsection 3.2.2). Therefore, we
believe that facilitating the creation of an effective (flexible and adaptable) network society within
an organization is inevitable for improved performance.
7.1.4 Answer to RQ4
Research question RQ4 reads as follows: “How does EGIT affect the relationship between ITBSA
and performance at the departmental level?”
The importance of moderating variables in research is large. Moreover, the suggestion in the literature
is that moderating variables should be tested with mediating relationships. Thus, we have investigated
in this research to what extent does the EGIT have a moderating effect on the relationship between
the ITBSA and performance by acting on the path between ITBSA and SIW (subsection 4.4.3). To
test our claim, we have performed an extensive literature review and designed a complex conceptual
model incorporating both the mediating effect of SIW as shown in RQ3, and the proposed moderating
effect of EGIT (see subsection 4.5.2). This conceptual model has utilized and combined the collected
data on the following four constructs: ITBSA, SIW, EGIT, and performance. The model was designed
and tested using SEM (see subsection 6.4.4). The analysis and discussion has revealed that the model
is significant and indicated that EGIT has a moderating effect along the path from ITBSA to
performance.
Consequently, our answer to the research question RQ4 is as follows.
From IT Business Strategic Alignment to Performance 151
“EGIT has a moderating effect along the path from ITBSA to performance at the departmental level.”
These results are in agreement with researchers who have claimed that a relationship between ITBSA
and Performance is moderated by other factors (cf. Lindman et al., 2001). Our results are also in
concordance with more specific studies that point directly to IT governance as a factor along this path
(see, e.g., De Haes & Van Grembergen, 2009; Haghjoo, 2012; De Haes & Van Grembergen, 2013).
7.2 Answer to the Problem Statement
The problem statement of this research thesis reads as follows:
“To what extent can we make transparent the effects of SIW and Enterprise Governance of IT on the
relationship between IT Business Strategic Alignment and the Organizational Performance at the
departmental level?”
The complex model that we have designed in subsection 4.5.2 and analyzed using the SEM
methodology in subsection 6.4.4, has revealed a moderating effect of EGIT as resulted from RQ4.
But, the complex nature of the model has also revealed that there is an interaction between the
mediating effect of SIW (RQ3) and the moderating effect of EGIT (RQ4). The analysis and discussion
in subsection 6.4.4 has shown that the nature of this interaction is “moderated mediation”, i.e., the
mediating effect of SIW (on the relationship between ITBSA and performance) is moderated by
EGIT. Therefore, our formal answer to the main problem statement is as follows.
“EGIT and SIW both significantly act on the path from ITBSA to performance in the form that SIW
mediates the relationship between ITBSA and performance, and this mediating relationship is
moderated by EGIT.”
Our answer to the problem statement emphasizes the that Social Innovation at the workplace (SIW)
is a critical and inevitable factor in realizing value from IT investments. Yet, to achieve the best
potential of those investments, an effective Enterprise Governance of IT processes and structures
must be in place. These findings constitute our main contribution of this study.
152 Conclusion
7.3 Observations and Personal Opinions
Based on our models which were developed, validated and investigated in this study, and the
statistically significant relationships among the studied factors, we formulate the following four
observations and personal opinions.
(1) Literature has proposed that SIW has positive improvement effects on several levels (public,
organizational, employee, and financial). Our answer to RQ1 states that ITBSA has a positive
effect on SIW. This observation emphasizes that managers need to make this activity (strategic
alignment) a survival duty as opposed to a luxury option. Moreover, we opine that for our
departmental level of analysis it is important to practice strategic alignment at all organizational
levels including the departmental level.
(2) Given the valid mediating effect of SIW on the relationship between ITBSA and performance,
managers should refrain from the harmful competition on innovative resources. Rather, in our
opinion, they should (a) establish an incentive program that ranks rewards of innovative activities
on collective performance across departments, and (b) emphasize the importance of focusing on
the organizational strategic alignment efforts to include (on the business side) strategic objectives
stimulating departmental collaborative actions on social innovation at work (c) spend efforts to
establish an effective and formal network society within the organization. Such organizational and
social structures will enhance innovation-related collaborative activities across functional
departments, leading to an enhanced and sustainable performance levels. On the IT side of the
equation, those strategies may include, for example, an objective stating “enhancing
interdepartmental innovation-related collaborative IT networks” (such as the establishment of
innovative ideas-hunting portals and innovation collaboration platforms).
(3) The ability of this research to identify the EGIT as a moderator for the relationship between the
ITBSA and the departmental innovation, allows IT managers and business managers to focus on
efforts and activities which may lead to efficient use of IT resources. For example, up to now
managers needed to monitor and benchmark the level of IT investment and become satisfied if a
joint committee of a business unit and IT has formed a joint strategy for the next period. This
research has shown that to capitalize on IT investments through effective interdepartmental
collaboration on SIW, managers need to develop and establish effective IT governance structures
and processes. From these observations, we see that the highly-recommended structures include
the establishment of IT strategy committee at the level of Board of Directors, IT projects and
governance function steering committees, and the integration of IT governance tasks into the
From IT Business Strategic Alignment to Performance 153
general roles and responsibilities. While an example of effective IT processes might include the
establishment of a formal IT governance framework, a formal process to define and measure IT
strategic plans, and
prioritizing IT investments in which both IT and business strategies are involved.
(4) Social performance and the consequent Corporate Sustainability performance is a vital factor for
organizational survival. Our research has emphasized the importance of strategic alignment and
the implementation of proper EGIT structures and process. A consequence of such
implementation will implicitly support higher levels of corporate sustainability. For example,
incorporating social responsibility measures (such as pollution monitoring and control) into the
corporate business strategy, aligning the strategy with IT, and implementing an effective IT
portfolio management process by which those pollution reduction projects get priority, will
improve both social performance and sustainability.
7.4 Limitations of the Study
This study has four limitations that could be overcome in future research. Those limitations are
summarized below: (1) restricted generalizability, (2) the assumptions of model modification, and (3)
geographical limitations (4) employee layers limitations
(1) Restricted generalizability.
The current research has a prevailing exploratory/descriptive nature. The proposed causal
relationships have not been “confirmed” through experimental theory methods. Therefore, the
outputs of the model cannot formally be considered predictive. Moreover, this research has used
one type of questionnaires and one method of data collection for ITBSA, SIW and performance.
There are several other instruments for the identification of the ITBSA, SIW, and performance
constructs. So, the limitation is in the restricted generalizability. For further research, we suggest
confirming the relationships utilizing different data instruments to conclude more generalizable
results.
(2) The assumptions of model modification
Our proposed models and the methodology used (cf. Baron & Kenny, 1986) to test the mediating
and moderating relationships have shown a specific trend in the relations between ITBSA, EGIT,
SIW, and performance that is valid under the assumptions described in subsection 6.3.2 (the
model modification). This design has put a stamp on the analysis and the way to draw conclusions.

Cha
pter
7
152 Conclusion
7.3 Observations and Personal Opinions
Based on our models which were developed, validated and investigated in this study, and the
statistically significant relationships among the studied factors, we formulate the following four
observations and personal opinions.
(1) Literature has proposed that SIW has positive improvement effects on several levels (public,
organizational, employee, and financial). Our answer to RQ1 states that ITBSA has a positive
effect on SIW. This observation emphasizes that managers need to make this activity (strategic
alignment) a survival duty as opposed to a luxury option. Moreover, we opine that for our
departmental level of analysis it is important to practice strategic alignment at all organizational
levels including the departmental level.
(2) Given the valid mediating effect of SIW on the relationship between ITBSA and performance,
managers should refrain from the harmful competition on innovative resources. Rather, in our
opinion, they should (a) establish an incentive program that ranks rewards of innovative activities
on collective performance across departments, and (b) emphasize the importance of focusing on
the organizational strategic alignment efforts to include (on the business side) strategic objectives
stimulating departmental collaborative actions on social innovation at work (c) spend efforts to
establish an effective and formal network society within the organization. Such organizational and
social structures will enhance innovation-related collaborative activities across functional
departments, leading to an enhanced and sustainable performance levels. On the IT side of the
equation, those strategies may include, for example, an objective stating “enhancing
interdepartmental innovation-related collaborative IT networks” (such as the establishment of
innovative ideas-hunting portals and innovation collaboration platforms).
(3) The ability of this research to identify the EGIT as a moderator for the relationship between the
ITBSA and the departmental innovation, allows IT managers and business managers to focus on
efforts and activities which may lead to efficient use of IT resources. For example, up to now
managers needed to monitor and benchmark the level of IT investment and become satisfied if a
joint committee of a business unit and IT has formed a joint strategy for the next period. This
research has shown that to capitalize on IT investments through effective interdepartmental
collaboration on SIW, managers need to develop and establish effective IT governance structures
and processes. From these observations, we see that the highly-recommended structures include
the establishment of IT strategy committee at the level of Board of Directors, IT projects and
governance function steering committees, and the integration of IT governance tasks into the
From IT Business Strategic Alignment to Performance 153
general roles and responsibilities. While an example of effective IT processes might include the
establishment of a formal IT governance framework, a formal process to define and measure IT
strategic plans, and
prioritizing IT investments in which both IT and business strategies are involved.
(4) Social performance and the consequent Corporate Sustainability performance is a vital factor for
organizational survival. Our research has emphasized the importance of strategic alignment and
the implementation of proper EGIT structures and process. A consequence of such
implementation will implicitly support higher levels of corporate sustainability. For example,
incorporating social responsibility measures (such as pollution monitoring and control) into the
corporate business strategy, aligning the strategy with IT, and implementing an effective IT
portfolio management process by which those pollution reduction projects get priority, will
improve both social performance and sustainability.
7.4 Limitations of the Study
This study has four limitations that could be overcome in future research. Those limitations are
summarized below: (1) restricted generalizability, (2) the assumptions of model modification, and (3)
geographical limitations (4) employee layers limitations
(1) Restricted generalizability.
The current research has a prevailing exploratory/descriptive nature. The proposed causal
relationships have not been “confirmed” through experimental theory methods. Therefore, the
outputs of the model cannot formally be considered predictive. Moreover, this research has used
one type of questionnaires and one method of data collection for ITBSA, SIW and performance.
There are several other instruments for the identification of the ITBSA, SIW, and performance
constructs. So, the limitation is in the restricted generalizability. For further research, we suggest
confirming the relationships utilizing different data instruments to conclude more generalizable
results.
(2) The assumptions of model modification
Our proposed models and the methodology used (cf. Baron & Kenny, 1986) to test the mediating
and moderating relationships have shown a specific trend in the relations between ITBSA, EGIT,
SIW, and performance that is valid under the assumptions described in subsection 6.3.2 (the
model modification). This design has put a stamp on the analysis and the way to draw conclusions.

154 Conclusion
For further research, we propose a re-confirmation of the results by using alternative techniques
to test the mediation and moderation relationships.
(3) Geographical limitations
Although our aim was to allow for the most generalizable results through (a) involving
multinational organizations in the data collection process, and (b) designing the conceptual model
from components well-grounded in previous theories in the literature, it is a reality that all the
collected data was from Yemen branches of those multinationals. This might have imposed
certain level of a culture and/or country bias in the responses.
(4) Employee-level limitations
The type of the requested information for this study requires respondents with a senior level
management experience (at the minimum, on the level of heads of departments) from both IT and
business sides. Therefore, we have only targeted high-level executives and their direct assistants.
We did not involve ordinary or medium-level employees in the studied organizations. This fact
might impose a restriction on our understanding of the, sometimes contradictory, views of
different layers of employees on issues such as willingness of collaboration on innovation or
effects of various factors (structures and processes) on production flexibility. Nevertheless, we
feel this compromise was inevitable due to the nature of the required information.
7.5 Future Research
For future research, we suggest the following five lines of investigation: (l) larger variety of
thematics, (2) deepen the study of the interaction level, (3) using different techniques, and (4)
inclusion of more variables in the model, and (5) involve multiple layers of employees.
(1) Larger variety of thematics
Exploring different aspects (thematic) of Social Innovation at work such as, education,
administrative capacity building, and social policies. Moreover, variety of thematics could be
explored in combination with a specific EGIT component. For example, emphasizing capacity
building by implementing EGIT processes. They should ensure and monitor objectives and results
of the capacity building activities and projects.
From IT Business Strategic Alignment to Performance 155
(2) Deepen the study of the interaction level
A more in-depth study could be performed by studying the interaction of the components of the
EGIT when acting as moderators.
(3) Using different techniques of analysis
As mentioned in the thesis, ITBSA is an ambiguous topic. Therefore, we suggest (a) to use a
different variant of the data collection tool (for example, to explore a different variant of IT
Business alignment such as the Social Alignment concept), and (b) to validate our results by
examining different techniques of testing the moderator and mediator relationships. (c) Involve a
causality “confirmation” technique which will allow the model to become more suitable for
predictive and normative applications.
(4) Inclusion of more variables in the model
Some of our empirical results of the final moderated mediation model were at “borderline” values.
This might suggest that including other variables (not in the model) as moderators and/or
mediators along the path from IT investments to performance might improve the validity and
predictability of the model. Such variables may include (a) the investigation of the recent and
under-researched concept of digital business strategies (DBS) as proposed by Kahre et al. (2017).
They propose going beyond “alignment” and considering the IT and business strategies as one
entity. (b) Involving a factor of the “local culture”in the study might benefit the model fit, as well
as, improving the explanatory power of the model. (c) Operationalization of the performance
construct is a complicated issue. Inevitably, the model explanatory power will benefit from the
inclusion of other factors of performance such as Corporate Sustainibility. Those factors will
broaden the scope of performance from the cost/production aspects into the more sustainable form
of performance.
(5) Involve multiple layers of employees
We have mentioned that one of the limitations of this study that it only involved senior level
managers in the data collection process. We recommend to design future research in a form which
invovles multiple layers of employees. The possible contradicting views of employees of various
levels (mainly on the issue of collaboration on social innovation) might add to the explanatory
power of the results.

Cha
pter
7
154 Conclusion
For further research, we propose a re-confirmation of the results by using alternative techniques
to test the mediation and moderation relationships.
(3) Geographical limitations
Although our aim was to allow for the most generalizable results through (a) involving
multinational organizations in the data collection process, and (b) designing the conceptual model
from components well-grounded in previous theories in the literature, it is a reality that all the
collected data was from Yemen branches of those multinationals. This might have imposed
certain level of a culture and/or country bias in the responses.
(4) Employee-level limitations
The type of the requested information for this study requires respondents with a senior level
management experience (at the minimum, on the level of heads of departments) from both IT and
business sides. Therefore, we have only targeted high-level executives and their direct assistants.
We did not involve ordinary or medium-level employees in the studied organizations. This fact
might impose a restriction on our understanding of the, sometimes contradictory, views of
different layers of employees on issues such as willingness of collaboration on innovation or
effects of various factors (structures and processes) on production flexibility. Nevertheless, we
feel this compromise was inevitable due to the nature of the required information.
7.5 Future Research
For future research, we suggest the following five lines of investigation: (l) larger variety of
thematics, (2) deepen the study of the interaction level, (3) using different techniques, and (4)
inclusion of more variables in the model, and (5) involve multiple layers of employees.
(1) Larger variety of thematics
Exploring different aspects (thematic) of Social Innovation at work such as, education,
administrative capacity building, and social policies. Moreover, variety of thematics could be
explored in combination with a specific EGIT component. For example, emphasizing capacity
building by implementing EGIT processes. They should ensure and monitor objectives and results
of the capacity building activities and projects.
From IT Business Strategic Alignment to Performance 155
(2) Deepen the study of the interaction level
A more in-depth study could be performed by studying the interaction of the components of the
EGIT when acting as moderators.
(3) Using different techniques of analysis
As mentioned in the thesis, ITBSA is an ambiguous topic. Therefore, we suggest (a) to use a
different variant of the data collection tool (for example, to explore a different variant of IT
Business alignment such as the Social Alignment concept), and (b) to validate our results by
examining different techniques of testing the moderator and mediator relationships. (c) Involve a
causality “confirmation” technique which will allow the model to become more suitable for
predictive and normative applications.
(4) Inclusion of more variables in the model
Some of our empirical results of the final moderated mediation model were at “borderline” values.
This might suggest that including other variables (not in the model) as moderators and/or
mediators along the path from IT investments to performance might improve the validity and
predictability of the model. Such variables may include (a) the investigation of the recent and
under-researched concept of digital business strategies (DBS) as proposed by Kahre et al. (2017).
They propose going beyond “alignment” and considering the IT and business strategies as one
entity. (b) Involving a factor of the “local culture”in the study might benefit the model fit, as well
as, improving the explanatory power of the model. (c) Operationalization of the performance
construct is a complicated issue. Inevitably, the model explanatory power will benefit from the
inclusion of other factors of performance such as Corporate Sustainibility. Those factors will
broaden the scope of performance from the cost/production aspects into the more sustainable form
of performance.
(5) Involve multiple layers of employees
We have mentioned that one of the limitations of this study that it only involved senior level
managers in the data collection process. We recommend to design future research in a form which
invovles multiple layers of employees. The possible contradicting views of employees of various
levels (mainly on the issue of collaboration on social innovation) might add to the explanatory
power of the results.

156
This page is left intentionally blank
157
REFERENCES
Acur, N., Kandemir, D., & Boer, H. (2012). Strategic Alignment and New Product Development:
Drivers and Performance Effects. J PROD INNOV MANAG, 29(2), 304–318.
Ahlemann, F. (2009). Towards a conceptual reference model for project management information
systems. International Journal of Project Management, 27(1), 19-30.
Alasoini, T. (2004). The new Finnish workplace development programme (TYKES-FWDP) as an
approach to innovation. Concepts & Transformation, 9(3), 279–295.
Alee, V., & Taug, J. (2006). Collaboration, innovation, and value creation in a global telecom.
Learning Organization, 13(6), 569–578.
Almajali, D. A., & Dahalin, Z. M. (2011). Applying the Triangulation Approach in IT – Business
Strategic Alignment and Sustainable Competitive Advantage. IBIMA Business Review, 2011,
1-12.
Alyahya, M., & Suhaimi, M. (2013). A Conceptual Model for Business and Information Technology
Strategic Alignment from the Perspective of Small and Medium Enterprises. International
Journal of Business, Humanities and Technology, 3(7), 83-90.
Ancona, D. G., & Bresman, H. (2007). X-Teams. Massachusetts: Harvard Business School Publishing
Corporation.
Anderson, J., & Gerbing, D. (1988). Structural Equation Modeling in Practice: A Review and
Recommended Two-Step Approach. Psychological Bulletin, 103(3), 411-423.
Andrews, K. R. (1971). The Concept of Corporate Strategy. Homewood: Irwin.
Andrews, K. R. (1980). The Concept of Corporate Strategy. (3rd ed.). Homewod.
Andriopoulos, C., & Lewis, M. (2009). Exploitation-Exploration Tensions and Organizational
Ambidexterity: Managing Paradoxes of Innovation. Organization Science, 20(4), 696-717.
Applegate, L., Austin, R., & McFarlan, F. (2007). Corporate information strategy and management:
text and cases. Boston: McGraw-Hill/Irwin.
Archibugi, D., Evangelista, R., & Simonetti, R. (1994). On the definition and measurement of product
and process innovations. Innovation and Employment: Process versus Product innovation.
(L. H. Charles Edquist, Ed.) Edward Elgar.
Armbruster, H., Bikfalvi, A., Kinkel, S., & Lay, G. (2008). Organizational innovation: The challenge
of measuring non-technical innovation in large-scale surveys. Technovation, 28, 644–657.
Arundel, A. (2007). Innovation Survey indocators: What impact on innovation policy? Paris: OECD.
Arvanitis, S., & Loukis, E. (2016). Investigating the effects of ICT on innovation and performance of
European hospitals: an exploratory study. The European Journal of Health Economics, 17(4),
403-418.

158 References
Bagozzi, R. P., & Yi, Y. (1991). Multitrait–multimethod matrices in consumer research. Journal of
Consumer Research, 17, 426-439.
Baker, J., & Jones, D. (2008). A Theoretical Framework for Sustained Strategic. Proceedings of JAIS
Theory. 8(16). Sprouts: Working Papers on Information Systems.
Baker, J., Jones, D., Qing, C., & Jaeki, S. (2011). Conceptualizing the Dynamic Strategic Alignment
Competency. Journal of the Association for Information Systems, 12(4), 299-322.
Bakos, J. (1987). Dependent variables for the study of firm and industry-level impacts of information
technology. ICIS.
Banbury, C. M., & Mitchell, W. (1995). The effects of introducing important incremental innovation
on market share and business survival. Strategic Management Journal, 16, 161-182.
Baron, R. M., & Kenny, A. D. (1986). The Moderator-Mediator Variable Distinction in Social
Psychological Research: Conceptual, Strategic, and Statistical Considerations. Journal of
personality and Social Psychology, 51(6), 1173-1182.
Barraud-Didier, V., & Guerrero, S. (2002). Impact of social innovations on French companies'
performance: A study of high-involvement practices. Measuring Business Excellence, 6(2),
42-48.
Barrett, P. (2007). Structural Equation Modelling: Adjudging Model Fit. Personality and Individual
Differences, 42(5), 815-24.
Barroso, C., Carrión, G., & Roldán, J. (2010). pplying maximum likelihood and PLS on different
sample sizes: studies on SERVQUAL model and employee behavior model. In Handbook of
partial least squares (pp. 427-447). Springer Berlin Heidelberg.
Bassellier, G., Benbasat, I., & Reich, B. (2003). The Influence of Business Managers' IT Competence
on Championing IT. Information Systems Research, 14(4), 317-336.
Bassellier, G., Reich, B., & Benbasat, I. (2001). Information Technology Competence of Business
Managers: A Definition and Research Model. Journal of Management information Systems,
17(4), 159-182.
Bechor, T., Neumann, S., Zviran, M., & Glezer, C. (2010). A contingency model for estimating
success of strategic information systems planning. Information & Management, 47(1), 17–29.
Becker, J., Pöppelbuß, J., Stolze, C., & Cyrus, A. (2009). Developing a framework for IT governance
in the post-merger integration phase. In Proceedings of the 17th European conference on
information systems (ECIS 2009), (pp. 3137–3149). Verona, Italy.
Becker, M. C., & Lillemark, M. (2006). Marketing/R&D integration in the pharmaceutical industry.
Research Policy, 35, 105-120.
From IT Business Strategic Alignment to Performance 159
Beimborn, D., Schlosser, F., & Weitzel, T. (2009). Proposing a theoretical model for IT governance
and IT business alignment. Proceedings of the 42nd Hawaii International Conference on
System Sciences, (pp. 1-11). Hawaii.
Bentler, P. (1990). Comparative Fit Indexes in Structural Models. Psychological Bulletin, 107(2),
238-46.
Bergeron, F., & Raymond, L. (1995). The Contribution of IT to the Bottom Line : A Contingency
Perspective of Strategic Dimensions. Proceedings of the 16th International Conference on
Information Systems, (pp. 167-181). Amsterdam.
Bergeron, F., Raymond, L., & Rivard, S. (2004). Ideal Patterns of Strategic Alignment and Business
Performance. Information & Management, 41(8), 1003-1020.
Berghout, E., & Tan, C. (2013). Understanding the impact of business cases on IT investment
decisions: An analysis of municipal e-government projects. Information & Management, 50,
489–506.
Bertrand, O., & Mol, M. (2013). The Antecedents And Innovation Effects Of Domestic And Offshore
R&D Outsourcing: The Contingent Impact Of Cognitive Distance And Absorptive Capacity .
Strategic Management Journal, 34, 751-760.
Bestuzhev-Lada, I. (1991). Social Forecasting and Social Innovations. Societ Sociology, 30(4), 85-
96.
Beverland, M. B. (2005). Managing the Design Innovation–Brand Marketing Interface: Resolving
the Tension between Artistic Creation and Commercial Imperatives. Journal of Product
Innovation Management, 22(2), 193-207.
Black, S., & Lynch, L. M. (2004). What's driving the new economy?: the benefits of workplace
innovation. The Economic Journal, 114(493), F97-F116.
Boddy, D., Boonstra, A., & Kennedy, G. (2005). Managing information systems: An organisational
Perspective 2nd Ed. Harlow: Pearson.
Boomsma, A. (1982). Robustness of LISREL against small sample sizes in factor analysis models.
In K. Joreskog, & H. Wold, Systems under indirect observations, Causality, structure,
prediction (pp. 149-173). Amsterdam: North Holland.
Botzenhardt, A., Meth, H., & Maedche, A. (2011). Cross-functional integration of product
management and product design in application software development: exploration of success
factors. Thirty Second International Conference on Information Systems, (pp. 1-18).
Shanghai.

160 References
Bowen, P. L., Cheung, M. D., & Rohde, F. H. (2007). Enhancing IT governance practices: A model
and case study of an organization's efforts. International Journal of Accounting Information
Systems, 8, 191-221.
Boynton, A. C., & Zmud, R. W. (1987). Information Technology Planning in the 1990s: Directions
for Practice and Research. MIS Quarterly, 11(1), 59-71.
Braam, G. M., & Nijssen, E. J. (2004). Performance effects of using the balanced scorecard: a note
on the Dutch experience. Long Range Planning, 37(4), 335-349.
Brown, V. C., & Magill, L. S. (1994). Alignment of the IS functions with the enterprise: towards of
model of antecedents. MIS Quarterly, 18(4), 371-403.
Bry, N., Valee, O., & France, C. (2011). Social Innovation? Let's Start Living Innovation As a
Collective Adventure. International Journal of Organizational Innovation, 4(2), 5-14.
Brynjolfsson, E. (1993). The productivity paradox of information technology: review and.
Communications of the ACM, 36(12), 67-77.
Busemeyer, J., & Jones, L. (1983). Analysis of multiplicative combination rules when the causal
variables are measured with error. Psychological Bulletin, 93(3), 549-562.
Byrd, A. T., Lewis, R. B., & Bryan, W. R. (2006). The leveraging influence of strategic alignment on
IT investment: An empirical examination. Information & Management, 43(3), 308-321.
Byrne, B. (1998). Structural Equation Modeling with LISREL, PRELIS and SIMPLIS: Basic
Concepts, Applications and Programming. Mahwah, New Jersey:: Lawrence Erlbaum
Associates.
Cameron, B. H. (2009). IT Portfolio Management: Implementing and Maintaining IT Strategic
Alignment. In A. W. Tan, & P. Theodorou, Strategic Information Technology and Portfolio
Management (pp. 352-377). Harshey, NY: Information Science Reference.
Carlile, P. R. (2002). A Pragmatic View of Knowledge and Boundaries: Boundary Objects in New
Product Development. Organization Science, 13(4), 442-455.
Carr, N. G. (2003). IT Doesn't Matter. Harvard Business Review, 81(5), 41–49.
Castells, M. (2000). Toward a Sociology of the Network Society. Contemporary Sociology, 29(5),
693-699.
Castells, M. (2004). The Network Society, A Cross-cultural Perspective. Cheltenham, UK •
Northampton, MA, USA: Edward Elgar.
Chan, E. Y., & Reich, H. B. (2007). IT Alignment: What Have We Learned? Journal of Information
Technology, 22(6), 297-315.
Chan, Y. E. (2002). Why Haven't We Mastered Alignment? The Importance of the Informal
Organizaional structure. MIS Quarterly Executive, 1(2), 97-112.
From IT Business Strategic Alignment to Performance 161
Chan, Y. E., Huff, S. L., Barclay, D. W., & Copeland, D. G. (1997). Business Strategy Orientation,
Information Systems Orientation and Strategic Alignment. Information Systems Research,
8(2), 125-150.
Chan, Y. E., Sabherwal, R., & Tatcher, J. B. (2006). Antecedents and outcomes of strategic IS
alignment: an empirical investigation. IEEE Transactions on Engineering Management,
53(1), 27-47.
Chan, Y., & Huff, S. (1993). Strategic Information Systems Alignment. Business Quarterly, 58(1),
51-56.
Chang, H. L., Hsiao, H. E., & Lue, C. P. (2011). Assessing IT-business alignment in service-oriented
Enterprises. Pacific Asia Journal of the Association for Information Systems, 3(1), 29-48.
Chen, D., Preston, D., Mocker, M., & Teubner, A. (2010). Informatio Systems Strategy;
Reconceptualization, Meazurment, and Implications. MIS Quarterly, 34(2), 233-259.
Coad, A., & Rao, R. (2008). Innovation and firm growth in high-tech sectors: A quantile regression
approach. Research Policy, 37, 633-48.
Cohen, W. M., & Levinthal, D. A. (1990). Absorptive capacity: a new perspective on learning and
innovation. Administrative Science Quarterly, 35, 128-152.
Coleman, T., & Chatfield, A. (2011). Promises And Successful Practice In IT Governance: A Survey
Of Australian Senior IT Managers. 15th PACIS Proceedings, paper 49. Queensland.
Colombo, M. G., Laursen, K., Magnusson, M., & Lamastra, C. R. (2011). Organizing Inter- and Intra-
Firm Networks: What is the Impact on Innovation Performance? Industry and Innovation,
18(6), 531-538.
Coltman, T., Devinney, T., Midgley, D., & Veniak, S. (2008). Formative versus reflective
measurement models: Two applications of formative measurement. Journal of Business
Research, 61(12), 250-1262.
Coltman, T., Tallon, P., Sharma, R., & Queiroz, M. (2015). Strategic IT alignment: twenty-five years
on. Journal of Information Technology, 30, 91-100.
Conner, K. R. (1991). A historical comparison of resource-based theory and five schools of thought
within industrial organization economics: do we have a new theory of the firm? Journal of
Management, 17(1), 121-154.
Cox, A., Rickard, C., & Tamkin, P. (2012). Work organisation and innovation. Dublin: European
Foundation for the Improvement of Living and Working Conditions.
Creswell, J. W. (2003). Research Design, Qualitative Quantitative and Mixed Methods Approaches.
Thousand Oaks: Sage Publications.

162 References
Croteau, A. M., & Raymond, L. (2004). Performance outcomes of strategic and IT competencies
alignment. Journal of Information Technology, 19, 178-190.
Cui, T., Ye, H., Teo, H., & Li, J. (2015). Information technology and open innovation: A strategic
alignment perspective. Information and Management, 52(3), 348-358.
Cuijpers, M., Guenter, H., & Hussinger, K. (2011). Costs and Benefits of Inter-departmental
Innovation Collaboration. Research Policy, 40(4), 565-575.
Daft, R. L., & Lengel, R. H. (1986). Organizational information requirements, media richness and
structural design. Management Science, 32, 554-571.
Damanpour, F. (1987). The adoption of technological, administrative and ancillary innovations –
impact of organizational factors. Journal of Management, 13(4), 675-688.
Davenport, T. H. (1992). Process Innovation: Reengineering Work through Information Technology.
Cambridge: Harvard Business School Press.
Davenport, T., Barth, P., & Bean, R. (2013). How 'Big Data' Is Different. MIT Sloan Management
Review, 54(1).
Day, G. (1994). The capabilities of market-driven organizations. Journal of Marketing, 58(4), 37 -
52.
De Clercq, C., Menguc, B., & Auh, S. (2008). Unpacking the relationship between an innovation
strategy and firm performance: The role of task conflict and political activity. Journal of
Business Research, 62, 1046-1053.
De Haes, S., & Van Grembergen, W. (2009). An Exploratory Study into IT Governance
Implementations and its Impact on Business/IT Alignment. Information Systems
Management, 26, 123-137.
De Haes, S., & Van Grembergen, W. (2013). Improving enterprise governance of IT in a major
airline: A teaching case. Journal of Information Technology Teaching Cases, 3, 60-69.
De Long, D. W., & Fahey, L. (2000). Diagnosing cultural bariers to knowledge management.
Academy of management Executive, 14(4), 113-127.
De Luca, L. M., & Gima, K. A. (2007). Market Knowledge Dimensions and Cross-Functional
Collaboration: Examining the Different Routes to Product Innovation Performance. Journal
of Marketing, 71, 95–112.
Debreceny, R., & Gray, G. (2011). IT Governance Drivers of Process Maturity. Hawaii Conference
on Systems Science. Hawaii.
Dedrick, J., Gurbaxani, V., & Kraemer, K. (2003). Information technology and economic
performance: a critical review of the empirical evidence. ACM Computing Surveys, 35(1), 1-
28.
From IT Business Strategic Alignment to Performance 163
Dehning, B., Rishardson, V. J., & Zmud, R. W. (2003). The value relevance of announcements of
transformational information technology investments. MIS Quarterly, 27(4), 637-656.
DeJager, P. (1995, March 27). Are computers boosting productivity, No! Computerworld, 128-130.
Dhondt, S., ten Have, K., & Kraan, K. (2012). Twenty-five years of government spending cuts:
consequences for the quality of work and productivity. In I. Houtman, Work Life in the
Netherlands. TNO.
Dong, X., Liu, Q., & Yin, D. (2008). Business Performance, Business Strategy, and Information
System Strategic Alignment: an Empirical Study on Chinese Firms. Tsinghua Science and
Technology, 13(3), 348-354.
Dortmund/Brussels Paper. (2012). Workplace Innovation as Social Innovation. Dortmund: SFS
Dortmund/TU Dortmund, CESO/University of Leuven and TNO.
Dougherty, D. (1992). Interpretive barriers to successful product innovation in large firms. Org. Sci.,
3(2), 179-202.
Drazin, R., & Van De Ven, A. H. (1985). Alternative Forms of Fit in Contingency Theory.
Administrative Science Quarterly, 30(4), 514-539.
Earl, M. J. (1993). Experiences in strategic information systems planning. MIS Quarterly, 17(1), 1-
24.
Earl, M. J., & Feeny, D. F. (1994). Is Your CIO Adding Value? Sloan Management Review, Spring,
11-20.
EC. (2013). Guide to social innovation. Policy, Regional and Urban. European Commission.
Eccles, R., Ioannis, I., & George, S. (2014). "The Impact of Corporate Sustainability on
Organizational Processes and Performance. Management Science, 60(11), 2835-2857.
Edquist, C., Hommen, L., & McKelvey, M. (2001). Innovation and Employment:Process Versus
Product Innovation. Northampton: Edward Elgar Publishing Limited.
El Harbi, S., Anderson, A. R., & Amamou, M. (2011). Knowledge sharing processes in Tunisian
small ICT firms. Library Review, 60(1), 24-36.
Epstein, M., & Buhovac, A. (2014). Making Sustaiablity Work: Best Practices in Managing and
Measuring Corporate, Social, Environmental, and Economic impacts. Berrett-Koehler.
Evangelista, R., & Sirilli, G. (1998). Innovation in the Service Sector:Results from the Italian
Statistical Survey. Technological Forecasting and Social Change, 58, 251-269.
Fahy, M., Roche, J., & Winer, A. (2004). Beyond Governance - Creating Corporate Value through
Performance, Conformance and Responsibility. West Sussex, England: John Wiley & Sons
Ltd.
164 References
Fairchild, A., & MacKinnon, D. (2009). A General Model for Testing Mediation and Moderation
Effects. Preventive Science, 10, 87-99.
Fan, X., & Wang, L. (1998). Effects of potential confounding factors on fit indices and parameter
estimates for true and misspecified SEM models. Educational and Psychological
Measurement, 58, 701–735.
Faniel, I. M. (2005). Enhancing perceived value of cross-departmental knowledge on innovation via
KM technology features. Academy of Management (pp. 1-6). Honolulu: ICIS.
Faryabi, M., Fazlzadeh, A., Zahedi, B., & Darabi, H. (2012). Alignment of Business and IT and Its
Association with Business Performance: The Case of Iranian Firms. Journal of Business &
Management, 1(1), 15-28.
Favaro, K., Rangan, K., & Hirsh, E. (2012). Strategy: An Executive’s Definition. Strategy+ Business,
67.
Feidler, K., Gorver, V., & Teng, J. (1995). An empirical study of information technology enabled
business process redesign and corporate competitive strategy. European Journal of
Information Systems, 4(1), 17-30.
Ferreira, J., Fernandes, C., Alves, A., & Raposo, M. (2015). Drivers of innovation strategies: Testing
the Tidd and Bessant (2009) model. Journal of Business Research, 68(7), 1395-1403.
Finch, J., West, S., & MacKinnon, D. (1997). Effect of sample size and nonnormality on the
estimation of mediated effects in latent variable models. Structural Equation Modeling, 4(2),
87−107.
Fonstad, N., & Robsertson, D. (2006). Transforming a Company, Projectby Project: The IT
Engagement Model. MIS quarterly, 5(1), 1-14.
Ford, R. C., & Randolph, W. A. (1992). Cross-Functional Structures: A Review and Integration of
Matrix Organization and Project Management. Journal of Management, 8, 267-294.
Fornell, C., & Bookstein, F. (1982). Two structural equation models: JJSREL and PLS applied to
consumer exit-voice theory. Journal of Marketing Research, 19, 440-485.
Fornell, C., & Larcker, D. (1981). Evaluating Structural Model with un-observable variables and
measurement error. Journal of Marketing Research, 18(1), 39-50.
Frazier, P., Barron, K., & Tix, A. (2004). Testing Moderator and Mediator Effects in Counseling
Psychology Research. Journal of Counseling Psychology, 51(1), 115–134.
Freeman , C., & Soete, L. (2007). Developing science, technology and innovation indicators: what
we can learn from the past. Maastricht Economic and social Research and training centre on
Innovation and Technology. Maastricht: united nations University.
From IT Business Strategic Alignment to Performance 165
Freeman, C., & Soete, L. (2000). The Economics of industrial Innovation 3rd Ed. Great Brittain: MIT
Press.
Frone, M. (1999). Work stress and alcohol use. Alcohol research and health, 23(4), 284-291.
Ganotakis, P., Hsieh, W., & Love, J. (2013). Information systems, inter-functional collaboration and
innovation in Taiwanese high-tech manufacturing firms. Production Planning & Control,
24(8-9), 837-850.
Gardner, C., Acharya, T., & yach, D. (2007). Technological and social innovation: a unifying new
paradigm for global health. Health Affairs, 26(4), 1052–1061.
Glass, D., & Singer, J. (1972). Urban Steress: Experiments on noise and social stressors. New York:
Academic Press.
Goedhuys, M., & Veugelers, R. (2011). Innovation
strategies,processandproductinnovationsandgrowth: Firm-level evidencefromBrazil.
Econ.Dyn., 1-14.
Gopalakrishnan, S., Bierly, P., & Kessler, E. (1999). A reexamination of product and process
innovations using a knowledge-based view. Journal of High Technology Management
Research, 10, 147-166.
Gressgard, L., Amundsen, O., Aasen, T., & Hansen, K. (2014). Use of information and
communication technology to support employee driven innovation in organizations: A
knowledge management perspective. Journal of Knowledge Management, 18(4), 633-650.
Group, B. C. (2006). Innovation. Senior Management Survey. Retrieved 2 2012, from
http://www.bcg.com/documents/file14826.pdf
Grubisic, V., Ferreira, V., Ogliari, A., & Gidel, T. (2011). Recommendations for risk identification
method selection according to product design and project management maturity, product
innovation degree and project team. 18th International Conference on Engineering Design
(pp. 15-18). (ICED 11).
Guldentops, E. (2003). Governing Information Technology through CobiT. In W. Van Grembergen,
Strategies for Information Technology Governance. Hershey: Idea Group Publishing.
Gunday, G., Ulusoy, G., Kilic, K., & Alpkan, L. (2011). Effects of innovation types on firm
performance. International Journal of Production Economics, 133(2), 662-676.
Hackman, J. (2009, May). Why Teams Don’t Work. (D. Coutu, Interviewer) HBR Magazine.
Haghjoo, G. (2012). Towards a Better Understanding of How Effective IT Governance Leads to
Business Value: A Literature Review and Future Research Directions. 23rd Australasian
Conference on Information Systems Effective IT Governance Business Value Model.
Hamel, G., & Schonfeld, E. (2003). Why It’s Time to Take a Risk. Business, 4(3), 62-68.

166 References
Han, J. K., Kim, N., & Srivastava, R. K. (1998). Market Orientation and Organizational Performance:
Is InnoInnovation a Missing Link? Journal of Marketing, 62(10), 30-45.
Hatcher, L. (1994). A step-by-step approach to Using the SAS System for Factor Analysis and
Structural Equation Modeling. Cary, ND:SAS Institute, Inc.
Hayduk, L., Cummings , G., Boadu, K., Pazderka-Robinson, H., & Boulianne, S. (2007). Testing!
testing! one, two, three–Testing the theory in structural equation models! Personality and
Individual Differences, 42(5), 841-850.
Hayes, A. (2012). PROCESS: A Versatile Computational Tool for Observed Variable Mediation,
Moderation, and Conditional Process Modeling. White Paper.
Hemmatfar, M., Salehi, M., & Bayat, M. (2010). Competitive Advantages and Strategic Information
Systems. International Journal of Business and Management, 5(7), 158-169.
Henderson, J. C., & Venkatraman, N. (1993). Strategic Alignment: Leveraging Information
Technology for Transforming Organizations. IBM Systems Journa;, 32(1), 472-484.
Héroux, S., & Fortin, A. (2016). The Influence of IT Governance, IT Competence and IT-Business
Alignment on Innovation. Cahier de recherche, 04.
Hervas, J. L., Ripoll, F. S., & Moll, C. B. (2012). The returns from process innovation: patterns,
antecedents and results. DRUID. Copenhagen.
Hochleitner, F., Arbussa, A., & Coenders, G. (2016). Innovations in an Open Innovation Context.
Journal of technology management & innovation, 11(3), 50-58.
Hofstede, G. (1983). National Cultures in four Dimansions. A research-based Theory of Cultural
Differences among Nations. Int. Studies of Man. & Org., XIII(1-2), 46-74.
Holland, S., Gaston, K., & Gomes., J. (2000). Critical success factors for cross-functional teamwork
in new product development. IJMR, 2(3), 231-259.
Holthausen, R. W., Larcker, D. F., & Sloan, R. G. (1995). Business Unit Innovation and the structure
of executive compensation. Journal of Accounting and Economics, 19, 279-313.
Homburg, C., Krohmer, H., & Workman, J. P. (1999). Strategic consensus and performance the role
of strategy type and market-related dynamism. 20(4), 339-357.
Hooper, D., Coughlan, J., & Mullen, M. (2008). Structural equation modelling: Guidelines for
determining model fit. Articles, 2.
Hopwood, C. J. (2007). Moderation and Mediation in Structural Equation Modeling: Applications
for Early Intervention Research. Journal of Early Intervension, 29(3), 262-272.
Hox, J., & Bechger, T. (1998). An introduction to structural equation modelling. Family Science
Review, 11, 354-373.
From IT Business Strategic Alignment to Performance 167
Hu, L., & Bentler, P. (1998). Fit Indices in Covariance Structure Modeling: Sensitivity to
Underparameterized Model Misspecification. Psychological Methods, 3(4), 424-453.
Hu, L., & Bentler, P. (1999). Cutoff Criteria for Fit Indexes in Covariance Structure Analysis:
Conventional Criteria. Structural Equation Modeling, 6(1), 1-55.
Huang, J. C., & Newell, S. (2003). Knowledge integration processes and dynamics within the context
of cross-functional projects. International Journal of Project Management, 21, 167–176.
Hurley, R. F., & Hult, G. T. (1998). Innovation, Market Orientation, and Organizational Learning:
An Integration and Empirical Examination. Journal of Marketing, 62(7), 42-54.
Iacobucci, D. (2010). Structural equations modeling: Fit indices, sample size, and advanced topics.
Journal of Consumer Psychology, 20(1), 90-98.
Iacobucci, D. (2012). Mediation analysis and categorical variables: The final frontier. Journal of
Consumer Psychology, 22, 582-594.
Im, S. K., Dow, E. K., & Grover, V. (2001). Research report: a reexamination of IT. Information,
12(1), 103-117.
Issa-Salwe, A., Ahmed, M., Aloufi, K., & Kabir, M. (2010). Strategic Information Systems
Alignment: Alignment of IS/IT with Business Strategy. Journal of Information Processing
Systems, 6(1), 121-128.
ITGI. (2008). Enterprise Value: Governance of IT investments, The Val IT Framework.
Jackson, D., Gillaspy, J., & Purc-Stephenson, R. (2009). Reporting Practices in Confirmatory Factor
Analysis: An Overview and Some Recommendations. Psychological Methods, 14(1), 6-23.
James, L., & Brett, J. (1984). Mediators, moderators, and tests for mediation. Journal of Applied
Psychology, 69, 307-321.
Jansen, J. P., Tempelaar, M. P., van den Bosch, F. J., & Volberda, H. W. (2009). Structural
Differentiation and Ambidexterity: The Mediating Role of Integration Mechanisms.
Organization Science, 20(4), 797-811.
Johnson, M. A., & Lederer, L. A. (2010). CEO/CIO Mutual Understanding, Strategic Alignment, and
the Contribution of IS to the Organization. Information & Management, 47(3), 138-149.
Jöreskog, K., & Sörbom, D. (1996). LISREL 8: User’s reference guide. Scientific Software. Chicago.
Joreskog, K., & Wold, H. (1982). Systems under indirect observation - causality structure prediction.
Amsterdam.
Jorfi, S., & Jorfi, H. (2011). Strategic Operations Management: Investigating the Factors Impacting
IT-Business Strategic Alignment. Procedia Social and Behavioral Sciences, 24, 1606–1614.

168 References
Jorfi, S., Nor, M., & Najjar, L. (2011). Assessing the Impact of IT Connectivity and IT Capability on
IT-Business Strategic Alignment: An Empirical Study. Computer Information Science, 4(3),
76-87.
Joshi, M. P., Kathuria, R., & Porth, S. J. (2003). Alignment of strategic priorities and performance:
an operations perspective. Journal of Operations Management, 21(3), 353-369.
Kahre, C., Hoffmann, D., & Ahlemann, F. (2017). Beyond Business-IT Alignment-Digital Business
Strategies as a Paradigmatic Shift: A Review and Research Agenda. Proceedings of the 50th
Hawaii International Conference on System Sciences. Hawaii.
Kamel, M. (2006). Collaboration for Innovation in Closed System Industries: The Case of the
Aviation Industry. Engineering Management Journal, 18(4), 16-22.
Kaplan, R., & Norton, D. (1992, January-February). The Balanced Score Card - measures that drive
performance. Harvard Business Review, 71-79.
Kathuria, R., Joshi, M. P., & Porth, S. J. (2007). Organizational alignment and performance: past,
present and future. Management Decision, 45(3), 503-517.
Kearns, G. S., & Lederer, A. L. (2000). The effect of strategic alignment on the use of IS-based
resources for competitive advantage. Journal of Strategic Infrmation Systems, 9(4), 265-293.
Kearns, G. S., & Lederer, A. L. (2004). The impact of industry contextual factors on IT focus and the
use of IT for competitive advantage. Information & Management, 41(7), 899-919.
Kearns, S. G., & Lederer, A. L. (2001). Strategic IT-Alignment: A Model for Competitive Advantage.
22nd ICIS, (pp. 1-12). Barcelona.
Kearns, S. G., & Sabherwal, R. (2006). Strategic Alignment Between Business and Information
Technology: A Knowledge-Based View of Behaviors, Outcome, and Consequences. Journal
of Management Information Systems, 23(3), 129-162.
Kellermann , A., & Jones, S. (2013). What It Will Take To Achieve The As-Yet-Unfulfilled Promises
Of Health Information Technology. Health Affairs, 32(1), 63-68.
Kenny, D., & Judd, C. (1984). Estimating the Nonlinear and Interactive Effects of Latent Variables.
Psychological Bulletin, 96(1), 201-210.
Kenny, D., & McCoach, D. (2003). Effect of the Number of Variables on Measures of Fit in Structural
Equation Modeling. Structural Equation Modeling, 10(3), 333-351.
Kettinger, W., Grover, V., Guha, S., & Segars, A. H. (1994). Strategic information systems
revisited:A study in sustainability and performance. MIS Quarterly, 18, 31-55.
Kingdon, J. (2003). Agendas, Alternatives and Public Policies. New York: LONGMAN.
From IT Business Strategic Alignment to Performance 169
Kirca, A. H., Jayachandran, S., & Bearden, W. O. (2005). Market Orientation: A Meta-Analytic
Review and Assessment of Its Antecedents and Impact on Performance. Journal of Marketing,
69(4), 24–41.
Kleinknecht, A., & Mohnen, P. (2001). Innovation and Firm Performance - Econometric Exploration
of Survey Data. Hampshire, U.K.: Palgrave.
Kleinschmidt, E., & Cooper, R. (1991). The impact of product innovativeness on performance.
Journal of Product Innovation Management, 8(4), 240-251.
Kleis, L., Chwelos, P., Ramirez, R., & Cockburn, I. (2012). Information Technology and Intangible
Output: The Impact of IT Investments on Innovation Productivity. Information Systems
Research, 23(1), 39-42.
Klomp, L. (2001). Measuring Output from R&D Activities in Innovation Surveys. ISI 53. Seoul.
Kogut, B., & Zander, U. (1992). Knowledge of the firm, combinative capabilities, and the replication
of Technology. Organization Science, 3, 383-397.
Koh, S., Gunasekaran, A., & Goodman, T. (2011). Drivers, barriers and critical success factors for
ERPII implementation in supply chains: A critical analysis. The Journal of Strategic
Information Systems, 20(4), 385–402.
Kordnaeij, A., Zali, M. R., Mohabatian, A., & Forouzandeh, S. (2012). Alignment of IT Strategies
with Grand Strategies: BSC Approach. European Journal of Economics, Finance and
Administrative Sciences, 47, 147-157.
Kraemer, H., Wilson, G., Fairburn, C., & Agras, W. (2002). Mediators and moderators of treatment
effects in randomized clinical trials. Archives of General Psychiatry, 59, 877-883.
Lahdelma, P. (2010). The effect of formal and informal intraorganizational structures on the
perceived strategic IT-Business alignment. . 18th European Conference on Information
Systems.
Lau, A. W., Yam, R. M., & Tang, E. Y. (2010). The impact of technological innovation capabilities
on innovation performance: An empirical study in Hong Kong. Journal of Science and
Technology Policy in China, 1(2), 163-186.
Laudon, K. C., & Laudon, J. P. (2014). Management Informatino Systems: Managing the Digital
Firm, 13th ed. Prentice Hall.
Leal-Rodríguez, A., Eldridge, S., Roldán, J., Leal-Millán, A., & Ortega-Gutiérrez, J. (2015).
Organizational unlearning, innovation outcomes, and performance: The moderating effect of
firm size. Journal of Business Research, 68, 803–809.
Lederer, A., & Mendelow, A. (1989). Co-ordination of information systems plans with business
plans. Journal of Management Information Systems, 6(2), 5-19.

170 References
Lei, M., & Lomax, R. (2005). The effect of varying degrees of nonnormality in structural equation
modeling. Structural Equation Modeling, 12(1), 1-27.
Leidner, D. E., & Elam, J. (1995). The Impact of Executive Informaion Systems on Organizational
Design, Intelligence and decision Making. Organization science, 6(6).
Li, T., & Calantone, R. J. (1998). The Impact of Market Knowledge Competence on New Product
Advantage: Conceptualization and Empirical Examination. Journal of Marketing, 62, 13-29.
Licht, G., & Moch, D. (1999). Innovation and information technology in serviec. Canadian Journal
of Economics, 32(2), 363-382.
Lightfoot, H. W., & Gebauer, H. (2011). Exploring the alignment between service strategy and
service innovation. Journal of Service Management, 22(5), 664-683.
Lindman, F. T., Callarman, T. E., Fowler, K. L., & McClathey, C. A. (2001). Strategic consensus and
manufacturing performance. Journal of Managerial Issues, 13(1), 45-64.
Little, T., Bovaird, J., & Widaman, K. (2006). On the Merits of Orthogonalizing Powered and Product
Terms: Implications for Modeling Interactions Among Latent Variables. STRUCTURAL
EQUATION MODELING, 13(4), 497–519.
Little, T., Card, N., Bovaird, J., Preacher, K., & Crandall, C. (2007). Structural equation modeling of
mediation and moderation with contextual factors. Modeling contextual effects in longitudinal
studies, 1, 207-230.
Liu, M. S., & Liu, N. C. (2008). Sources of knowledge acquisition and patterns of knowledge-sharing
behaviors – an empirical study of Taiwanese high-tech firms. International Journal of
Information Management, 28(5), 423-432.
Luftman, J. (2000). Assessing Business-IT Alignment Maturity. Communication of AIS, 4(14).
Luftman, J. (2015). Strategic Alignment Maturity. In J. Brocke, & M. Rosemann, Handbook on
Business Process Management 2, 2nd Ed. (pp. 5-43). Berlin Heidelberg: Springer.
Luftman, J. N., Papp, R., & Brier, T. (1999). Enablers And Inhibitors Of Business-IT Alignment.
Coomunications of the AIS, 1(1), 1-33.
Luftman, J., & Ben-Zvi, T. (2009). Key Issues for IT Executives 2009: Difficult Economy’s Impact
on IT. MIS Quarterly Executive, 9(1), 49-59.
Luftman, J., & Brier, T. (1999). Achieving and Sustaining Business-IT Alignment. California
Management review, 42(1), 109-122.
Luftman, J., & Kempaiah, R. (2008). Key Issues for IT Executives. MIS Quarterly Executive, 7(2),
99-112.
Luftman, J., & Rajkumark, K. (2007). An update on business/alignment: a line has been drawn. MIS
Quarterly Executive, 6(3), 166-177.
From IT Business Strategic Alignment to Performance 171
Luftman, J., Kempaiah, R., & Nash, E. (2005). Key Issues for IT Executives. MIS Quarterly
Executive, 5(2), 81-101.
Lunardi, G., Becker, J., Macada, A., & Dolci, P. (2014). The impact of adopting IT governance on
financial performance: An empirical analysis among Brazilian firms. International Journal of
Accounting Information Systems, 15, 66-81.
Maçada, A. C., Beltrame, M. M., Dolci, P. C., & Becker, J. L. (2012). IT Business Value Model for
Information Intensive Organizations. Brazilian Administration Review, 9(1), 44-65.
MacCallum, R., Browne, M., & Sugawara, H. (1996). Power Analysis and Determination of Sample
Size for Covariance Structure Modeling. Psychological Methods, 1(2), 130-49.
MacKinnon, D. (2011). Integrating Mediators and Moderators in Research Design. Res Soc Work
Pract., 21(6), 675-681.
Maes, R. (1999). Reconsidering Information Management through a Generic Framework. PrimaVera
Working Paper, 99(15). Amsterdam: UNiversity of Amsterdam.
Magalhães, R. (2004). Organizational Knowledge and Technology. Northampton, MA,: Edward
Elgar.
Makadok, R. (2001). Toward a Synthesis of the Resource-Based and Dynamic-Capability Views of
Rent Creation. Strategic Management Journal, 22(5), 387-401.
Markus, M. L., Majchrzak, A., & Gasser, L. (2002). A Design Theory for Systems That Support
Emergent Knowledge Processes. MIS Quarterly, 26(3), 179 212.
Masa'deh, R., Hunaiti, Z., & Bani Yaseen, A. (2008). An Integrative Model Linking IT-Business
Strategic Alignment and Firm Performance: The Mediating Role of Pursuing Innovation and
Knowledge Management Strategies. Communications of the International Business
Information Management Association (IBIMA), 2(24), 180-187.
McCaughey, D., Turner, N., Kim, J., DelliFraine, J., & McGhan, G. (2015). Examining workplace
hazard perceptions & employee outcomes in the long-term care industry. Safety Science, 78,
190-197.
McDonald, R. (1996). Path analysis with composite variables. Multivariate Behavioral Research,
31(2), 239–270.
McDonald, R., & Ho, M. (2002). Principles and Practice in Reporting Statistical Equation Analyses.
Psychological Methods, 7(1), 64-82.
Melville, N., Kraemer, K., & Gurbaxani, V. (2004). Review: information technology and
organizational performance: an integrative model of IT business value. MIS Quarterly, 28(2),
283-322.

172 References
Miles, J., & Shevlin, M. (2007). A time and a place for incremental fit indices. Personality and
Individual Differences, 42(5), 869-74.
Mintzberg, H. (1987). The strategy Concept I: Five Ps FOR Strategy. California Management
Review, Fall, 11-24.
Mintzberg, H. (1994). The Rise and Fall of Strategic Planning. New York: Free Press.
Mithas, S., & Rust, R. (2016). HOW INFORMATION TECHNOLOGY STRATEGY AND
INVESTMENTS INFLUENCE FIRM PERFORMANCE: CONJECTURE AND
EMPIRICAL EVIDENCE. MIS Quarterly, 40(1), 223-246.
Mittal, N., & Nault, B. R. (2009). Investments in information technology: indirect effects and
information technology intensity. Information Systems Research, 20(1), 140-154.
Monks, R. A., & Minow, N. (1995). Corporate Governance. Oxford: Blackwell.
Montiel, L., & Delgado-Ceballos, J. (2014). Defining and measuring corporate sustainability: Are we
there yet? Organization & Environment, 27(2), 113-139.
Mooney, J. G., Gurbaxani, V., & Kraemer, K. L. (1995). A process-oriented framework for assessing
the business value of information technology. 16th International Conference on Information
System, (pp. 17-27). Amsterdam.
Morck, R. K., & Steier, L. (2007). The Global History of Corporate Governance: An Introduction. In
R. Morck, A History of Corporate Governance around theWorld: Family Business Groups to
Professional Managers (pp. 1-65). Chicago: University of Chicago Press.
Moulaert, F., Martinelli, F., Swyngedouw, E., & González, S. (2005). Towards alternative model(s)
of local innovation. Urban Studies, 42(11), 1969-1990.
Mueller, R., & Hancock, G. (2008). Best practices in structural equation modeling. In Best advanced
practices in quantitative methods (pp. 488-508).
Mulaik, S., James, L., Van Alstine, J., Bennett, N., Lind, S., & Stilwell, C. (1989). Evaluation of
goodness-of-fit indices for structural equation models. Psychological bulletin, 105(3), 430.
Mulgan, G., Tucker, S., Ali, R., & Sanders, B. (2007). Social innovation, what is it? Skoll centre for
social entrepreneurship - Oxford University.
Muller, D., Judd, C., & Yzerbyt, V. (2005). When moderation is mediated and mediation is
moderated. Journal of Personality and Social Psychology, 89, 852-863.
Murray, R., Caulier-Grice, J., & Mulgan, G. (2010). THE OPEN BOOK OF SOCIAL INNOVATION.
The young foundation.
Nachtogall, C., Kroehne, U., Funke, F., & Steyer, R. (2003). Pros and cons of structural equation
modeling. Methods Psychological Research Online, 8(2), 1-22.
From IT Business Strategic Alignment to Performance 173
Naranjo-Valencia, J., Jiménez-Jiménez, D., & Sanz-Valle, R. (2016). Studying the links between
organizational culture, innovation, and performance in Spanish companies. Revista
Latinoamericana, 48, 30-41.
Narayanan, V. K. (2001). Managing Technology an Innovation for Competitive Edge. Upper Saddle
River, , New Jersey: Prentice-Hall.
Nazari, M., & Nazari, H. (2012). A Framework for IT Investment. 2nd International Conference on
Management and Artificial Intelligence (pp. 70-74). Singapore: IACSIT Press.
Neirotti, P., & Paolucci, E. (2007). Assessing the strategic value of information technology: an
analysis on the insurance sector. Information & Management, 44(6), 568-582.
Neubert, G., Dominguez, C., & Ageron, B. (2011). Inter-organisational alignment to enhance
information technology (IT) driven services innovation in a supply chain: the case of radio
frequency identification (RFID). International Journal of Computer Integrated
Manufacturing, 24(11), 1058-1073.
Newsom, J. (2012). Some clarifications and recommendations on fit indices. USP, 123-133.
Nichols, N., Phipps, D., Provençal, J., & Hewitt, A. (2013). Knowledge Mobilization, Collaboration,
and Social Innovation: Leveraging Investments in Higher Education. Canadian Journal of
Nonprofit and Social Economy Research, 4(1), 25-42.
Nolan, R., & W. McFarlan, F. (2005, October). Information Technology and the Board of Directors.
Harvard Business Review, 96-106.
O'Brien, J. (2012). Introduction to information systems 16th Ed. . Boston: McGraw-Hill/Irvin.
Oeij, P., Dhondt, S., & Kraan, K. (2012). Workplace innovation and social innovation: monitoring
and policy in the Netherlands. 2nd International Wellbeing at Work Conference. Manchester.
Oh, W., & Pinsonneault, A. (2007). On the Assessment of the Strategic Value of Information
Technologies: Conceptual and Analytical Approaches. MIS, 31(2), 239-265.
Olson, E. M., Walker, O. C., & Ruekert, R. W. (1995). Organizing for effective new product
development: the moderating role of product innovativeness. The Journal of Marketing, 59(1),
48-62.
Olson, E. M., Walker, O. C., Ruekert, R. W., & Bonnerd, J. M. (2001). Patterns of cooperation during
new product development among marketing, operations and R&D: implications for project
performance. Journal of Product Innovation Management, 18, 258-271.
Olsson, U., Foss, T., Troye, S., & Howell, R. (2000). The performance of ML, GLS, and WLS
estimation in structural equation modeling under conditions of misspecification and
nonnormality. Structural Equation Modeling, 7(4), 557−595.

174 References
Palmer, J. W., & Markus, M. L. (2000). The Performance Impacts of Quick Response and Strategic
Alignment in Specialty Retailing. Information Systems Research, 11(3), 241-259.
Papp, R. (1999). Business-IT alignment: productivity paradox payoff? Industrial Management &
Data Systems, 99/8, 367±373.
Pavitt, K. (1984). Sectoral patterns of technical change: towards a taxonomy and a theory. Reasearch
Policy, 13(6), 343-373.
Pearl, J. (2012). The causal foundations of structural equation modeling . In R. Hoyle, Handbook of
structural equation modeling (pp. 68-91). New York: Guilford Press.
Peppard, J. (2001). Bridging the gap between IS organization and the rest of the business: plotting a
route. 11(3), 249-270.
Peterson, L., & O'Bannon, D. (1997). The Corporate Social-Financial Perforamnce Relationship:
Typology and Analysis. . Bunsiness and Society, 36(4), 419.
Peterson, R. R. (2004). Integration Strategies and Tactics for Information Technology Governance.
In W. Van Grembergen, Strategies for Information Technology Governance (pp. 37-80).
Hershey PA: Idea Group Publishing.
Petrovic, D., Mihic, M., & Stosic, B. (2009). Strategic IT Portfolio Management for Development of
Innovative Competence. Strategic Information Technology and Portfolio Management, 150-
169. Information science reference, Hershey-New York.
Piening, E., & Salge, T. (2015). Understanding the antacedents, contingencies, and performance
inmplications of process innovation. A dynamic capabilities perspective. Journal of Product
Innovation, 32(1), 80-97.
Pirkko, L. (2010). The effect of formal and informal intra-organizationalstructures on the perceived
strategic IT-Business alignment. 18th European Conference on Information Systems (pp. 1-
12). Pretoria: 18th European Conference on Information Systems.
Podsakoff, P. M., MacKenzie, S. B., & Lee, J. Y. (2003). Common Method Biases in Behavioral
Research: A Critical Review of the Literature and Recommended Remedies. Journal of
Applied Psychology, 88(5), 879-903.
Pol, E., & Ville, S. (2009). Social Innovation: Buzz Word Or Enduring Term. The Journal of Socio-
Economics, 38(6), 878-885.
Pollalis, Y. A. (2003). Patterns of co-alignment in information-intensive organizations: business
performance through integration strategies. International Journal of Information
Management, 23, 469-492.
Pollalis, Y. A., & Grant, J. H. (1994). Information resources & corporate strategy development.
Informatin Strategy, 11(1), 12-28.
From IT Business Strategic Alignment to Performance 175
Popa, I., Preda, G., & Boldea, M. (2010). A Theoretical Approach Of The Concept of Innovation.
Society(1), 151-156.
Porter, M. (1980). Competitive Strategy. new York: The Free Press.
Porter, M. (1996, Nov-Dec). What Is Strategy? HBR.
Porter, M. E. (1990). The Competitive Advantage of Nations. New york: Macmillan.
Pot, F. (2010). Social Innovation: win – win at the workplace. Working longer through better working
conditions, new modes of work and career organisation . Nov 16/17 Brussels.
Pot, F. (2013). Workplace Innovation: history, definitions, programmes, theories. HELIX Conference.
Linköping.
Pot, F., & Fietje , V. (2008). Social innovation, the new challenge for Europe. International Journal
of Productivity & Performance Management, 57(6), 468–473.
Pot, F., Dhondt, S., de Korte, E., Oeij, O., & Vaas, F. (2012). Workplace innovation in the
Netherlands. In I. Houtman, Work Life in the Netherlands (pp. 173-190). TNO.
Prahalad, C. K., & Hamel, G. (1990). The core competence of the corporation. Harvard Business
Review, 68, 79-91.
Pratono, A., Wee, T., Syahchari, D., Nugraha, A., Kamariah, N., & Fitri, H. (2013). The Direct Effect
of Entrepreneurial Orientation and Innovation Success on Firm Performance. American
Journal of Economics, 3(1), 1-6.
Preacher, K., Rucker, D., & Hayes, A. (2007). Addressing Moderated Mediation Hypotheses: Theory,
Methods, and Prescriptions. Multivariate Behavioral Research, 42(1), 185-227.
Preston , D. S., & Karahanna, E. (2004). Mechanisms for the Development of Shared Mental Models
between the CIO and the Top Management Team. International Conference on Information
Systems (ICIS). Washington DC: International Conference on Information Systems (ICIS).
Preston, D. S., & Karahanna, E. (2009). How to Develop a Shared Vision: The Key to IS Strategic
Alignment. MIS Quarterly Executive, 8(1), 1-8.
Prowse, S. (1998). Corporate Governance: Emerging Issues and Lessons from East Asia. World
Bank.
Quan, J. (2003). Information Technology Investments and Firms' Performance—A Duopoly
Perspective. Journal of Management Information Systems, 20(3), 121-158.
Quintane, E., Casselman, M. R., Reiche, B. S., & Nylund, P. A. (2011). Innovation as a knowledge-
based outcome. Journal of knowledge management, 15(6), 928-947.
Rai, A., Patnayakuni, R., & Patnayakuni, N. (1997). Technology Investment and Business.
Communications of the ACM, 40(7), 89-97.
Rayner, B. (1995, October 9). Management matters. Computerworld Premier 100, 7-10.

176 References
Reich, B. H., & Benbasat, I. (1996). Measuring the Linkage between Business and Information
Technology Objectives. MIS Quarterly, 20(1), 55-81.
Reich, B. H., & Benbasat, I. (2000). Factors That Influence the Social Dimension of Alignment
Between Business and Information Technology Objectives. MIS Quarterly, 24(1), 81-113.
Renaud, A., Walsh, I., & Kalika, M. (2016). Is SAM still alive? A bibliometric and interpretive
mapping of the strategic alignment research field. The Journal of Strategic Information
Systems, 25(2), 75-103.
Riege, A. (2005). Three-dozen knowledge-sharing barriers managers must consider. Journal of
knowledge management, 9(3), 18-35.
Robert, M. (1997). Strategy Pure & Simple II: How Winning Companies Dominate Their
Competitors. McGraw-Hill.
Roberts, A., & Gardiner, P. D. (1998). Project management and strategy implementation.
Proceedings of the 3r d International Research Network on Organizing by Projects (pp. 317-
323). Alberta: University of Calgary.
Robeson, D., & O'Connor, G. (2007). The governance of innovation centers in large established
companies. J. Eng. Technol. Manage, 24, 121-147.
Robinson, N. (2005). IT excellence starts with governance. Journal of Investment Compliance, 6(3),
45-49.
Rockart, J., & Short, J. (1989). IT in the 1990s: Managing organizational interdependence. Sloan
Management Review, 30(2), 7-17.
Rosenbusch, N., Brinckmann, J., & Bausch, A. (2011). Is innovation always beneficial? A meta-
analysis of the relationship between innovation and performance in SMEs. Journal of
Business Venturing, 26, 441–457.
RothWell, R. (1977). The UK textile machinery industry: a case study in technical change.
Roy, S., Tarafdar, M., Ragu-Nathan, T., & Marsillac, E. (2012). The Effect of Misspecification of
Reflective and Formative Constructs in Operations and Manufacturing Management
Research. The Electronic Journal of Business Research Methods, 10(1), 34-52.
Rüede, D., & Lurtz, K. (2012). Mapping the various meanings of social innovation: Towards a
differentiated understanding of an emerging concept. EBS Business School.
Sabegh, M., & Motlagh, S. (2012). The role and relevance of IT governance and IT capability in
Business - IT alignment in medium and large companies. Business and Management Review,
2(6), 16-23.
Sabherwal, R., & Chan, Y. E. (2001). Alignment Between Business and IS Strategies: A Study of
Prospectors, Analyzers, and Defenders. Information Systems Research, 12(1), 11-33.
From IT Business Strategic Alignment to Performance 177
Sabherwal, R., Hirschheim, R., & Goles, T. (2001). The Dynamics of Alignment: Insights from a
Punctuated Equilibrium Model. Organization Science, 12(2), 179-197.
Sarkees, M., & Hulland, J. (2009). Innovation and efficiency: It is possible to have it all. Business
Horizons, 52(1), 45-55.
Schumpeter, J. (1911). The Theory of Economic Development. Cambridge: Harvard University Press.
Schumpeter, J. A. (1934). Theory of Economic Development. Cambridge, MA.: Harvard University
Press.
Schwarz, A., Kalika, M., Kefi, H., & Schwarz, C. (2010). A Dynamic Capabilities Approach to
Understanding the Impact of IT-Enabled Businesses Processes and IT-Business Alignment on
the Strategic and Operational Performance of the Firm. CAIS, 26(4), 57-84.
Scot, A. (1997). Strategic planning. Edinburgh: Edinburgh: Pitman Publishing.
Senge, P. (1990). The fifth discipline. New york: Doubleday.
Sethi, R. (2000). New Product Quality and Product Development. Journal of Marketing, 64, 1-14.
Sharma, S., Mukherjee, S., Kumar, A., & Dillon, W. (2005). A simulation study to investigate the
use of cutoff values for assessing model fit in covariance structure models. Journal of Business
Research, 58(1), 935-43.
Shin, H., Lee, J., Kim, D., & Rhim, H. (2015). Strategic agility of Korean small and medium
enterprises and itsinfluence on operationaland firm performance. Int. J. Production
Economics, 168, 181-196.
Shrivastava, P. (1995). The role of corporations in achieving ecological sustainability. Academy of
Management Review, 20, 936-960.
Silva, E., Plazaola, L., & Ekstedt, M. (2006). Strategic Business and IT Alignment: A Prioritized
Theory Diagram. PICMET 2006 Proceedings. Istanbul: PICMET.
Silva, L., Figueroa, E. B., & Reinharta, J. G. (2007). Interpreting IS alignment: A multiple case study
in professional organizations. Information and Organization, 17(4), 232-265.
Silvius, A., de Wall, B., & Smit, J. (2009). Bsiness and IT alignment; Answers and temaining
questions. Pacific Asia Conference on Information Systems (PACIS). Association for
Information Systems.
Smit, D., & Pretorius, T. (2015). Measuring The Level Of Technological Innovation. International
Association for Management of Technology (pp. 1102-1124). Cape Town: IAMOT.
Sohal, A. S., & Fitzpatric, P. (2002). IT governance and management in large Australian
organizations. Production Economics, 75, 97-112.

178 References
Sok, P., & O'Cass, A. (2015). Examining the new product innovation – performance relationship:
Optimizing the role of individual-level creativity and attention-to-detail. Industrial Marketing
Management, 47(May), 156–165.
Solow, R. S. (1987, July). We'd better watch out. New York Times Book Review, 12.
Spanos, Y., & Lioukas, S. (2001). An examination into the causal logic of rent generation: contrasting
Porter's competitive strategy framework and the resource based perspective. Strategic
Management Journal, 22, 907-934.
Steiger, J. (2007). Understanding the limitations of global fit assessment in structural equation
modeling,. Personality and Individual Differences, 42(5), 893-98.
Steiner, G. (1979). Strategic Planning. Free Press.
Steinmetz, H., Davidov, E., & Schmidt, P. (2011). Three Approaches to Estimate Latent Interaction
Effects: Intention and Perceived Behavioral Control in the Theory of Planned Behavior.
Methodological Innovations Online, 6(1), 95-110.
Stoffers, J., I.J.M. Van der Heijden, B., & LA Notelaers, G. (2014). Towards a moderated mediation
model of innovative work behaviour enhancement. Journal of organizational change
management, 27(4), 642-659.
Stolze, C., Boehm, M., Zarvić, N., & Thomas, O. (2011). Towards Sustainable IT by Teaching
Governance Practices for Inter-Organizational Dependencies. (pp. 70-88). Hamburg:
Springer.
Strassmann, P. (1990). The Business Value of Computers: An Executive’s Guide. New Canaan,
Connecticut: Economic Press.
Strassmann, P. (2004). Six rules for finding IT value. Cutter IT Journal, 17(8), 5-9.
Suddaby, R. (2010). Editor's comments: Construct clarity in theories of management and
organization. Academy of Management Review, 35, 346-357.
Syaiful, A. (2006). Effective Information Technology Governance Mechanism: An Australian Study.
MadaInternational Journal of Business, Vol. 8(No. q), 69-202.
Syaiful, A., & Peter, G. (2005). Determinants of Effective Information Technology Governance: A
Study of IT intensity. Proceedings of International IT Governance Conference. Auckland.
Tabachnick, B., & Fidell, L. (2007). Using Multivariate Statistics (5th ed.). New York: Allyn and
Bacon.
Tallon, P. (2003). The Alignment Paradox. CIO Insight, 1(47).
Tallon, P. P. (2008). A Process-Oriented Perspective on the Alignment of Information Technology
and Business Strategy. Journal of Management Information Systems, 24(3), 231-272.
From IT Business Strategic Alignment to Performance 179
Tallon, P. P. (2011). Value Chain Linkages and the Spillover Effects of Strategic Information
Technology Alignment: A Process-Level View. Journal of Management Information Systems,
28(3), 9-44.
Tallon, P. P., & Pinsonneault, A. (2011). Competing Perspectives on the link between strategic
information technology alignment and organizational agility:insights from a mediation
moedel. MIS Quarterly, 35(2), 463-486.
Tallon, P., Ramirez, R., & Short, J. (2013). The information artifact in IT governance: toward a theory
of information governance. Journal of Management Information Systems, 30(3), 141-178.
Tam, P. (2007). CIO Jobs Morph From Tech Support Into Strategy. Wall Street Journal, CCXLIX, p.
B1.
Tang, Z., & Walters, B. (2009). The Interplay of Strategic Management and Information Technology.
In A. W. Tan, & P. Theodorou, Strategic Information Technology and Portfolio manaement
(pp. 314 -326). Hershey - New York: Information science reference.
Tarafdar, M., & Gordon, S. R. (2007). Understanding the influence of information systems
competencies on process innovation: A resource-based view. Strategic Information Systtems,
16, 353-392.
Teece, D. J., Pisano, G., & Shuen, A. (1997). Dynamic capabilities and strategic management.
Strategic Management Journal, 18(7), 509-533.
Therrien, P., & Mohnen, P. (2003). How innovative are Canadian firms compared to some European
firms? A comparative look at innovation surveys. Technovation, 23, 359–369.
Tiwana, A., & Konsysnski, B. (2010). Complementarities between organizational IT architecture and
governance structure. Information Systems Research, 21(2), 288-304.
Troy, L. C., Hirunyawipada, T., & Paswan, A. K. (2008). Cross-functional integration and new
product success: an empirical investigation of the findings. Journal of Marketing, 72, 132-
146.
Tsai, W., & Ghoshal, S. (1998). Social capital and value creation: the role of intrafirm networks. Acad
Manag, 41, 464-76.
Ullman, J. (2006). Structural Equation Modeling: Reviewing the Basics and Moving Forward.
JOURNAL OF PERSONALITY ASSESSMEN, 87(1), 35-50.
Ulrich, K., & Eppinger, S. (2000). Product design and development. New York: McGraw-Hill.
Utterback, J., & Abernathy, W. (1975). A dynamic model of process and product innovation. Omega,
3(6), 639-656.

180 References
Valentine, E., & Stewart, G. (2013). The emerging role of the Board of Directors in enterprise
business technology governance. International Journal of Disclosure and Governance,
10(November), 346-362.
Van Grembergen, W., & De Haes, S. (2009). Enterprise Governance of Information Technology:
Achieving Strategic Alignment and Value. New York: Springer.
Van Grembergen, W., & De Haes, S. (2012). A Research Journey into Enterprise Governance of IT,
Business/IT Alignment and Value Creation. In W. Van Grembergen, & S. De Haes, Business
Strategy and Applications in Enterprise IT Governance (pp. 1-13). Antwerp: Antwerp
Management School, Belgium.
Van Grembergen, W., S., D. H., & E., G. (2004). Structures, processes and relational mechanisms for
IT governance. In Grembergen (ed.), Strategies for Information Technology Governance,
Idea Group Publishing, 1-36.
Vaswani, R. (2003). Determinants of effective information technology (IT) governance. Unpublished
Thesis. Australia: School of Business, University of Queensland.
Venkatraman, N., & Camillus, J. C, J. (1984). Exploring the concept of “Fit” in strategic management.
Academy of Management Review, 9(3), 513-525.
Ward, J. (2012). Information systems strategy: Quo vadis? Journal of Strategic Information Systems,
21, 165-171.
Ward, J., Griffiths, P., & Whitmore, P. (1990). Strategic Planning for Information Systems. Wiley.
Webber, J. (2012). Social Innovation and Social Enterprise in the Classroom: Frances Westley on
Bringing Clarity and Rigor to Program Design. Academy of Management Learning &
Education, 11(3), 409-418.
Weill, P., & Broadbent, M. (1998). Leveraging the New Infrastructure: How Market Leaders
Capitalize on Information Technology. Boston: Harvard Business School Press.
Weill, P., & Ross, J. (2004). IT Governance: How Top Performers Manage IT Decision Rights for
Superior Results. Boston: Harvard Business School Press.
West, C. T., & Schwenk, C. R. (1996). Top management team strategic consensus, demographic
homogeneity and firm performance: a report of resounding nonfindings. Strategic
Management Journal, 17(7), 571-576.
Weston, R., Chan, F., Gore, P., & Catalano, D. (2008). An Introduction to Using Structural Equation
Models in Rehabilitation Psychology. Rehabilitation Psychology, 53(3), 340-356.
Wgener, D., & Fabrigar, L. (2000). Analysis and design for nonexperimental data: Addressing causal
and noncausal hypotheses. In H. Reis, & C. Judd, Handbook of research methods in social
and personality psychology (pp. 412-450). New York: Cambridge University Press.
From IT Business Strategic Alignment to Performance 181
Whitley, R. (2002). Developing innovative competences: The role of institutional frameworks.
Industrial and Corporate Change, 11(3), 497-528.
Wilkinson, L., & The Task Force, o. o. (1999). Statistical methods in psychology journals: Guidelines
and explanations. American Psychologist, 54, 594-604.
Williamson, O. E. (1999). Strategy research: governance and competence perspectives. Strategic
Management Journal, 20, 1087-1108.
Wolfle, L. (2003). The introduction of path analysis to the social sciences, and some emergent themes:
An annotated bibliography. Structural Equation Modeling, 10(1), 1-34.
Wong, T., Ngan, S., Chan, F., & Chong, A. (2012). A two-stage analysis of the influences of
employee alignment on effecting business–IT alignment. Decision Support Systems, 53, 490–
498.
Wu, H. Y. (2012). Constructing a strategy map for banking institutions with key performance
indicators of the balanced scorecard. Evaluation and Program Planning, 35, 303-320.
Wu, S., Detmar, W., & Liang, T. (2015). How Information Technology Governance Mechanisms and
Strategic Alignment Influence Organizational Performance: Insights from a Matched Survey
of Business and IT Managers. MIS Quarterly, 39(2), 497-518.
Xue, L., Ray, G., & Sambamurthy, V. (2012). Efficiency or innovation: How do industry
environments moderate the effects of firm's IT assets portfolios? MIS Quarterly, 36(2), 509-
528.
Yamin, S., & Mavondo, F. (2015). Organizational innovation: Relationship with functional strategies
and organizational performance. 2000 Academy of Marketing Science (AMS) Annual
Conference (pp. 296-301). Springer International Publishing.
Yang, L., Yen, H., & Chiang, Y. (2012). A framework for assessing impacts of leadership
competency on police project performance. Policing: An International Journal of Police
Strategies & Management, 35(3), 528-550.
Yayla, A., & Hu, Q. (2009). Antecedents and drivers of IT-Business strategic alignment: Empirical
validation of a theoretical model. 17th European Conference on Information Systems, (pp. 3-
13).
Yayla, A., & Hu, Q. (2012). The Impact of IT Business Strategic Alignment on Firm Performance in
a Developing Country Setting: Exploring moderating roles of environmental uncertainty and
strategic orientation. European Journal of Information Systems, 21(4), 373-387.
Yuan, K. (2005). Fit Indices Versus Test Statistics. Multivariate Behavioral Research, 40(1), 115-
148.

182 References
Zarvic, N., Stolze, C., Boehm, M., & Thomas, O. (2012). Dependency-based IT Governance practices
in inter-organisational collaborations: A graph-driven elaboration. International Journal of
Information Management, 32(6), 541-549.
Zhou, H., Cillier, D. A., & Wilson, D. D. (2008). The relationship of srategic business alignment and
enterprise information managementin achieving better busines performance. Enterprise
Information Systems, 2(2), 75-91.
Other Organization-Specific References
European Commission (2009), Challenges for EU Support to Innovation in Services – Fostering New
Markets and Jobs through Innovation, EC(2009)1195 Final, European Commission, Brussels.
European Commission, (2004). Innovation Management Studies
European Union, 1995. Green Paper on Innovation. European Commission, Brussels.
Interpreting Innovation Data, Joint Publication, 3rd Edition.
Interpreting Technological Innovation Data. OECD, Paris.
ITGI, 2003, Board Briefing on IT Governance, Second Edition, from www.itgi.org
ITGI, 2007, COBIT 4.1, from www.itgi.org
ITGI, 2008, Enterprise Value: Governance of IT investments, The Val IT Framework, from
www.itgi.org
OECD, Eurostat (2005). Oslo Manual – Guidelines for Collecting and interpreting innovation data
3rd edition.
OECD, 1997a. National Innovation Systems. OECD, Paris.
OECD, 1997b. Oslo Manual. Proposed Guidelines for Collecting and interpreting innovation data 2nd
edition.
OECD, 1999. Managing National Innovation Systems. OECD, Paris.
OECD, 2013. Publications of Eurostat and OECD.
http://epp.eurostat.ec.europa.eu/portal/page/portal/microdata/cis last updated 23.7.2013, accessed on August,
2013.
Publications of Eurostat and OECD http://epp.eurostat.ec.europa.eu/portal/page/portal/statistics,
accessed on 10.10.2013.
Dortmund-Brussels Declaration (2012). Available at www.ukwon.net/resource.php?resource_id=297
European Commission , DG Regional and Urban Policy, 2013. Available at:
http://ec.europa.eu/bepa/pdf/publications_pdf/social_innovation.pdf, retrieved on 30.1.2014
From IT Business Strategic Alignment to Performance 183
Web Sites:
Information Technology Alignment and Governance Research Institute: www.uams.be/ITAG
ISACA: www.isaca.org
ISO: www.iso.org
IT Governance Institute: www.itgi.org

184
This page is left intentionally blank
185
APPENDICES
The list of Appendices consists of the following seven appendices.
Appendix A: Data Validation Figures & Tables.
Appendix B: Bivariate Correlations Matrix.
Appendix C: Interaction Variable Calculation.
Appendix D: ITBSA Data Collection Instrument
Appendix E: EGIT Data Collection Instrument
Appendix F: SIW Data Collection Instrument
Appendix G: Performance Data Collection Instrument

186 Appendices
Data Validation – Tables & Figures
Variable Histogram with normal curve Q-Q plot
SIW
_Cul
ture
Siw
_Ow
n_Id
eas
SIW
_Ow
n_T
eam
Siw
_Col
labo
rate
From IT Business Strategic Alignment to Performance 187
SIW
_Wit
hin_
Idea
SIW
_Out
side
_Ide
a
SIW
_Rul
es
SIW
_Slo
w
P_F
lexi
bili
ty
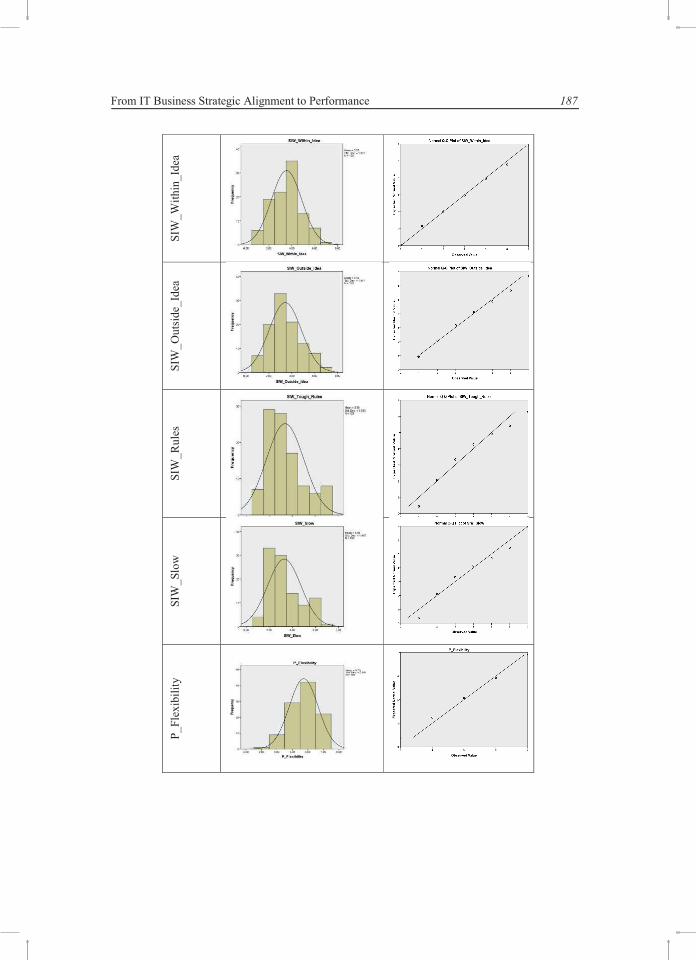
186 Appendices
Data Validation – Tables & Figures
Variable Histogram with normal curve Q-Q plot
SIW
_Cul
ture
Siw
_Ow
n_Id
eas
SIW
_Ow
n_T
eam
Siw
_Col
labo
rate
From IT Business Strategic Alignment to Performance 187
SIW
_Wit
hin_
Idea
SIW
_Out
side
_Ide
a
SIW
_Rul
es
SIW
_Slo
w
P_F
lexi
bili
ty

188 Appendices
P_C
ost
P_C
apac
ity
Figure A-1 Histograms and Q-Q plots of dependent constructs
SIW construct Variables skew kurtosis
SIW_Own_Idea .904 .435 SIW_Own_Team .068 -.648
SIW_Collaborate .194 -.605
SIW_Within_Idea .091 -.385
SIW_Outside_Idea .432 -.292
SIW_Culture .678 -.394
SIW_Rules .782 -.180
SIW_Slow .693 -.497
Table A-1 Skew & Kurtosis of SIW
Performance Variables skew kurtosis
P_Flexibility -.389 -.342 P_Capacity -.188 -.700
P_Cost -.299 -.159
Table A-2 Skew and Kurtosis of Performance
From IT Business Strategic Alignment to Performance 189
Bivariate Correlations Matrix
12
34
56
78
910
11
12
13
14
15
16
17
18
19
20
1ITBSA_VIsion
1
2ITBSA_Info
0.49***
1
3ITBSA_Value
0.53***
0.21**
1
4ITBSA_Mentality
0.52***
0.50***
0.46***
1
5ITBSA_Projects
0.29**
0.40***
0.29**
0.39***
1
6ITBSA_Finance
0.43***
0.32**
0.30**
0.51***
0.44***
1
7ITBSA_Com
ponent
0.24**
0.35***
0.19ns
0.42***
0.35***
0.33**
1
8EGIT_Processes
0.36***
0.23**
0.34***
0.62***
0.41***
0.35***
0.34***
1
9EGIT_Structures
0.33**
0.23**
0.34***
0.56***
0.41***
0.36***
0.39***
0.89***
1
10
SIW
_Own_Idea
0.20**
0.33ns
0.22**
0.48***
0.41***
0.30**
0.39***
0.41***
0.43***
1
11
SIW
_Own_Team
0.25**
0.34**
0.23**
0.39***
0.31**
0.18*
0.26**
0.41***
0.43***
.485
1
12
SIW
_Collaborate
0.10ns
0.27**
0.19ns
0.27**
0.37***
0.09ns
0.25**
0.37***
0.43***
.469
0.68***
1
13
SIW
_W
Ithin_Idea
0.12ns
0.31**
0.04ns
0.34***
0.37***
0.20**
0.37***
0.28**
0.35***
.490
0.42***
0.46***
1
14
SIW
_Outside_Idea
0.30**
0.38***
0.10ns
0.35***
0.28**
0.10ns
0.21**
0.29**
0.25**
.487
0.52***
0.50***
0.58***
1
15
SIW
_Culture
0.39***
0.39***
0.21**
0.58***
0.43***
0.29**
0.37***
0.47***
0.45***
.701
0.56***
0.61***
0.47***
0.56***
1
16
SIW
_Rules
0.23**
0.32**
0.21**
0.49***
0.52***
0.27**
0.38***
0.42***
0.47***
.603
0.41***
0.43***
0.41***
0.40***
0.62***
1
17
SIW
_Slow
0.41***
0.43***
0.24**
0.57***
0.51***
0.29**
0.38***
0.53***
0.52***
.635
0.49***
0.57***
0.44***
0.52***
0.80***
0.67***
1
18
P_Flexibility
0.11ns
0.08ns
-0.02ns
0.05ns
0.10ns
0.01ns
0.15ns
-0.01ns
-0.06ns
.193
0.25**
0.25**
0.14ns
0.2**
0.24**
0.13ns
0.09ns
1
19
Pe_Capacity
0.072ns
0.08ns
-0.03ns
0.09ns
0.13ns
0.04ns
0.06ns
0.03ns
-0.01ns
.222
0.3**
0.24**
0.25**
0.31**
0.15ns
0.19*
0.09ns
0.66***
1
20
P_Cost
-0.01ns
0.22**
0.04ns
0.13ns
0.26**
0.13ns
0.24**
0.16*
0.11ns
.270
0.38***
0.31**
0.31**
0.31**
0.23**
0.18*
0.14ns
0.45***
0.41***
1
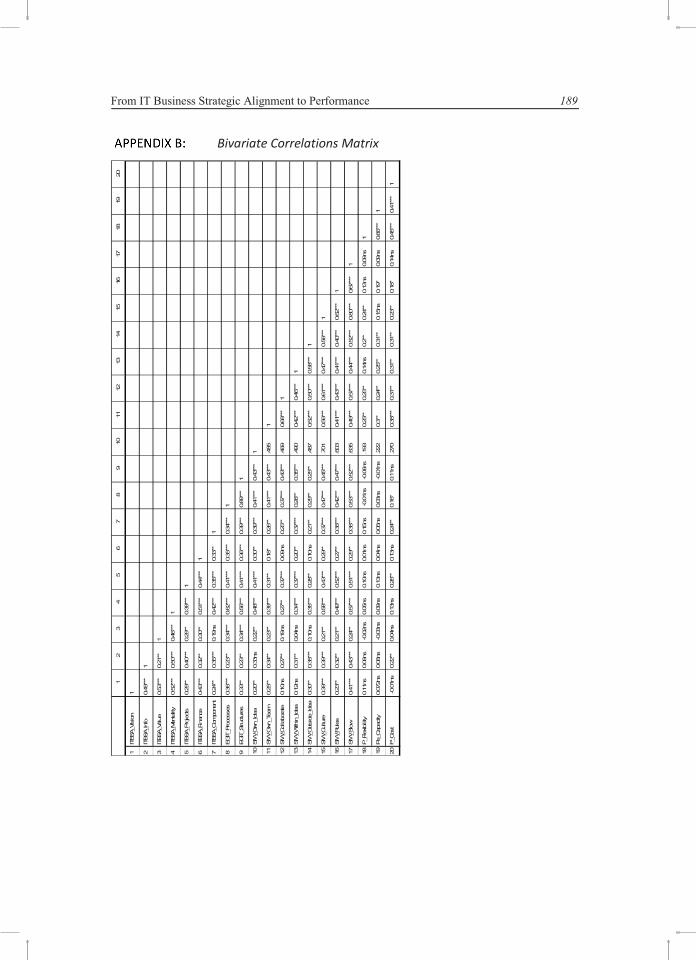

190 Appendices
Interaction Variable Calculations
The interaction variable ITBSAxEGIT was calculated as follows.
1) Fourteen product variables were calculated as a result of multiplying the two variables of EGIT
(EGIT_Processes and EGIT_Structures) by the seven variables of ITBSA (ITBSA_Vision,
ITBSA_Info, ITBSA_Value, ITBSA_Mentality, ITBSA_Projects, ITBSA_Finance,
ITBSA_Component). This multiplication formed the following 14 intermediate variables as
follows.
1)EGIT_Processes_x_ITBSA_Vision
.
7)EGIT_Processes_x_ITBSA_Component
8)EGIT_Structures_x_ITBSA_Vision
.
14)EGIT_Structures_x_ITBSA_Component
2) Each of the above intermediary 14 variables was then regressed over all the first-order 9 variables
(2 EGIT Variables and 7 ITBSA variables). The residuals of these regressions were saved as a
new 14 variables. For example, the error residual of the first regression (resulting from regressing
EGIT_Processes_x_ITBSA_Vision over the 9 first order variables of EGIT and ITBSA) we called
“e1i1” (“e1” pointing to the first variable of EGIT, namely EGIT_Processes, and “i1” pointing
to the first variable of ITBSA, Namely ITBSA_Vision). Finally, calculating all the 14 error
residuals (e1i1, e1i2, ……e2i6, e2i7).
3) Those 14 error residuals were then used as the indicators of the interaction term used in the
moderated mediation SEM model (see Figure 6-8).
From IT Business Strategic Alignment to Performance 191
THE ITBSA Questionnaire
Business / IT alignment Questionnaire
Organization: Matching Code:
The purpose of this questionnaire is to assess the level of strategic alignment
between your department and the IT department at your organization.
** Please be kind to answer the questions as objectively as possible
** The anonimity of your evaluation will be preserved
Please assess the following IT department alignment-related statements in relation to your department:
ALWAYS NEVER
TRUE TRUE
1 2 3 4 5
The IT group drives IT projects
It is hard to get financial approval for IT projects
Islands of automation exist
IT does not help for the hard tasks
Senior management sees outsourcing as a way to
control IT
Senior management has no vision for the role of IT
There is no IT component in the division's strategy
Management perceives little value from
computing A "them and us" mentality prevails (with IT
people)
Vital information necessary to make decisions is
often missing

192 Appendices
The EGIT Questionnaire
EGIT – Processes Questionnaire
Appendix E: cont’d. EGIT-Structures Questionnaire
Enterprise Governance of IT Maturity Level
Organization: Matching Code
The purpose of this questionnaire is to assess the level of the Maturity Level of the"Enterprise Government of IT" at your organization.
Plese note the following:
*** The anonimity of your evaluation will be preserved*** Please use the description sheet to clarify the meaning of each item*** Please use the assessment sheet to assess the following statements to the best of your knowledge
1 2 3 4 5
STRUCTURES:
S1 IT strategy committee at level of board of directors
S2 IT expertise at level of board of directors
S3 (IT) audit committee at level of board of directors
S4 CIO on executive committee
S5
S7 IT governance function / officer
S8 Security / compliance / risk officer
S9 IT project steering committee
S10 IT security steering committee
S11 Architecture steering committee
S12
CIO (Chief Information Officer) reporting to CEO (Chief
Executive) and/or COO (Chief Operational Officer)
S6
IT steering committee (IT investment evaluation /
prioritisation at executive / senior management
level)
Integration of governance/alignment tasks in
roles&responsibilities
From IT Business Strategic Alignment to Performance 193
Enterprise Governance of IT Maturity Level
Organization: Matching Code
The purpose of this questionnaire is to assess the level of the Maturity Level of the"Enterprise Government of IT" at your organization.
Plese note the following:
*** The anonimity of your evaluation will be preserved*** Please use the description sheet to clarify the meaning of each item*** Please use the assessment sheet to assess the following statements to the best of your knowledge
1 2 3 4 5
PROCESSES :
P1 Strategic information systems planning
P2
P3
P5 Service level agreements
P6 IT governance framework COBIT
P7 IT governance assurance and self-assessment
P8 Project governance / management methodologies
P9 IT budget control and reporting
P10 Benefits management and reporting
P11 COSO / ERM
IT performance measurement (e.g., IT balanced
scorecard)
Portfolio management (incl. business cases,
information economics, ROI, payback)
P4Charge back arrangements -total cost of
ownership (e.g. activity based costing

194 Appendices
Appendix E: Cont’d. EGIT-Relational Mechanisms Questionnaire
Enterprise Governance of IT Maturity Level
Organization: Matching Code
The purpose of this questionnaire is to assess the level of the Maturity Level of the"Enterprise Government of IT" at your organization.
Plese note the following:
*** The anonimity of your evaluation will be preserved*** Please use the description sheet to clarify the meaning of each item*** Please use the assessment sheet to assess the following statements to the best of your knowledge
1 2 3 4 5
Relational Mechanism
R1 Job-rotation
R2 Co-location
R3 Cross-training
R4 Knowledge management (on IT governance)
R5 Business/IT account management
R6
R7
R9 IT leadership
R10
R11 IT governance awareness campaigns
Informal meetings between business and IT
executive/senior Management
Corporate internal communication addressing IT
on a regular basis
Executive / senior management giving the good
example
From IT Business Strategic Alignment to Performance 195
The SIW Questionnaire
Departmental Innovation Questionnaire
Organization: Matching Code
The purpose of this questionnaire is to assess the level of departmental innovation & the collaboration on innovation projects
among the departments of your organization
*** The anonimity of your evaluation will be preserved
*** Please be kind to answer the questions as objectivelly as possible
Product/Service Innovation
During the past three years, did your Department/Business Unit introduce:
No Yes
New or significantly improved Services ?
Process Innovation
During the past three years, did your Department/Business Unit introduce:
Yes No
New or significantly improved methods of manufacturing or producing goods or services
New or significantly improved logistics, delivery or distribution methods for your inputs, goods or services
New or significantly improved supporting activities for your processes, such as maintenance systems or
For Each of the following statements , please state the extent to which you agree or disagree
Strongly Neither Strongly
Agree Agree NOR Disagree
Disagree
1 2 3 4 5 6 7
We have tough rules for investment in new projects
We are too slow in realizing new ideas
Factors hampering Innovation at your department:
During the specified period, how important were the following factors for hampering your innovation
activities or projects or influencing a decision NOT to innovateVery HIGH Very LOW
in Importance in Importance
1 2 3 4 5 6 7
Lack of qualified personnel
Lack of information on technology
Lack of information within company and marketsDifficulty in finding cooperation partners/assistance for
innovation
At our department, ideas from outside are not considered as valuable
as those invented withinFew good ideas for new processes/services actually come from outside
the department
Our departmental culture makes it hard for people to put forward novel
ideas
People in our department come up with few good ideas on their own
Few of our projects involve team members from different
departments/units Typically, our people DO NOT collaborate on projects internaly, cross
departments and subsidiaries

196 Appendices
The Departmental Performance Questionnaire
Departmental Performance Questionnaire
Organization: Matching Code
The purpose of this questionnaire is to assess the effect of departmental innovation on the performance
of your department
*** The anonimity of your evaluation will be preserved
*** Please be kind to answer the questions as objectivelly as possible
Performance Effect of Innovation:
Very HIGH Very LOW
Effect Effect
1 2 3 4 5 6 7
Improved flexibility of production/service provision
Increased capacity of product/service provision
Reduced labour costs per unit of output
How significant were each of the following effects on departmental performance,
as a result of your departmental innovation introduced during the past three years
197
Summary
The relation between Information Technology (IT) investments and business performance is a
challenging topic of research. Managers are more than ever pressed towards the realization of high
returns on IT investments. Among the critical factors in the realization of such returns are IT Business
Strategic Alignment (ITBSA), Enterprise Governance of IT (EGIT), and Social Innovation at Work
(SIW). Several studies have explored the relations among those factors along the path towards
organizational performance. Controversial results have prompted the need for further research into
the nature of those relations.
In our research, we focus on the relationship between ITBSA and performance. Specifically, we
investigate the effects of EGIT and SIW on this relationship.
In Chapter 1, we provide an overview and the background of the relationship between IT investments
and the organizational performance. We also provide a brief background of the concepts of ITBSA,
EGIT, and the social innovation.
Subsequently, the problem statement (PS) reads as follows.
PS: To what extent can we make transparent the effects of EGIT and SIW on the relationship between
ITBSA and the Organizational Performance at the departmental level?
In order to answer the PS, we have formulated the following four research questions (RQs).
RQ1: What is the effect of IT Business Strategic Alignment on Social Innovation at Work at the
departmental level?
RQ2: What is the role of Social Innovation at Work on the departmental performance?
RQ3: How does the Social Innovation at Work (SIW) at the departmental level affect the relationship
between the ITBSA and departmental performance?
RQ4: How does EGIT affect the relationship between ITBSA, SIW and performance at the
departmental level?
198 Summary
Chapter 2 provides the background and definitions for the main concepts of this study. It presents the
history of the evolution of IT strategy and its integration into the business strategy. We relate EGIT
to both the corporate governance and the IT governance. Finally, we link the innovation as a general
concept to the more specific concept of social innovation.
In Chapter 3, we perform an extensive literature review. Literature is examined on the relationship
between ITBSA and the firms’ performance. We show that the relationship is controversial and needs
further investigation. We also explore the positioning of SIW as a facilitator between ITBSA and
performance. Finally, EGIT is investigated in terms of its relationship with both ITBSA and SIW.
The literature review has revealed contradicting views on those relationships. Hence, the stage is set
for the construction of our conceptual model in the next Chapter.
Chapter 4 presents the conceptual model. We do so by first providing a theoretical background on the
mediation and moderation models. We then stress the importance of the departmental-level analysis
by showing that successful innovation and performance originate at the departmental level.
Consequently, we may conclude that our analysis will be at the departmental level of the organization.
Next, in order to formulate our conceptual model, we present the model selection criteria and justify
our preference for the moderation model for EGIT. Finally, we present our combined conceptual
model which includes the ITBSA, EGIT, SIW, and performance constructs.
Chapter 5 presents the details of the data collection process. We first present and justify the
operationalization of the main constructs (ITBSA, EGIT, SIW, and performance). We then choose
and justify the data collection instruments that are used to collect the field data. Next, the process of
the data collection is explained in details. The data collection was performed in eight multinational
organizations operating in the country of Yemen. Those eight organizations represent four main
business sectors (banking, communication, oil & gas, and higher education). Finally, the trends in the
collected data are compared with similar data in the literature. The observation is that they are in
alignment.
In Chapter 6, we perform an extensive statistical data analysis using the Structural Equation Modeling
(SEM) technique. First, we justify the use of SEM as an appropriate technique to start exploring
mediation and moderation relationships. We then choose and justify our choice of the indices, namely
Chi Square, RMSEA, CFI, and the PCFI indices. A confirmatory factor analysis (CFA) on the model
reliability is then performed. In order to reach a valid model for SEM analysis, there was a need for
From IT Business Strategic Alignment to Performance 199
slight modifications to the model. The modified model was then analyzed in the form of four sub-
models. Each of those sub-models is related to one of the four research questions. The results have
shown that (a) the four models are valid, and (b) each model points to one of the following four
positive relationships: (1) ITBSA has a positive effect on SIW, (2) SIW has a positive effect on the
departmental performance, (3) SIW mediates the relationship between ITBSA and departmental
performance, and (4) EGIT moderates the mediating effect of SIW.
Chapter 7 summarizes the answers to the four research questions and the problem statement. We then
provide three observations on how to realize performance enhancement from IT investments. We
may state that (1) managers need to align their departmental strategies with the IT strategies, (2)
managers need to direct the focus of this alignment on the collaborative effort to achieve
organizational innovation, and (3) to maximize the effect of the strategic alignment of point 1,
managers should direct their efforts to the development of the EGIT. The main focus should be on
(a) IT processes and (b) IT structures. The chapter also discusses the limitations of the study and
offers the following areas for further research: (1) exploring different aspects (thematic) of SIW, (2)
a more in-depth study of the interaction among the components of EGIT when acting as moderators,
(3) test the results with a different variant of the data collection tools (specific for ITBSA and SIW),
and (4) test the models by including other variables that are not yet in the current model) as (a)
mediators and/or (b) moderators along the path from ITBSA to performance.

200
This page is intentionally left blank
201
Samenvatting
De relatie tussen investeringen in informatie technologie (IT) en prestaties van bedrijven
(organizational performance) is een uitdagend onderzoeksonderwerp. Managers staan meer
dan ooit onder druk om maximaal rendement te realiseren op investeringen in IT. Enkele van
de essentiële factoren in de realisatie van dit rendement zijn IT Business Alignment (ITBSA),
Enterprise Governance of IT (EGIT) en Social Innovation at Work (SIW). Diverse studies
hebben zich gericht op het onderzoeken van de relaties tussen deze factoren met het oog op
organizational performance. Controversiële resultaten hebben verder onderzoek van deze
relaties noodzakelijk gemaakt.
Om deze reden richten wij onze aandacht op de relatie tussen ITBSA en performance. Hierin
onderzoeken wij de effecten van EGIT en SIW op deze relatie.
In hoofdstuk 1 geven we een overzicht van de achtergrond van de relatie tussen investeringen
in IT en organizational performance. Tevens geven we een beknopt overzicht van de
achtergrond van de concepten ITBSA, EGIT en SIW.
Vervolgens worden de probleemstelling (PS) en de vier onderzoeksvragen (OVs)
geformuleerd. De probleemstelling luidt als volgt.
PS: In hoeverre kunnen we de effecten van EGIT en SIW op de relatie tussen ITBSA en de
Organizational Performance op afdelingsniveau transparant maken?
Om deze PS te beantwoorden zijn vier onderzoeksvragen geformuleerd.
OV 1: Wat is het effect van ITBSA op SIW op afdelingsniveau?
OV 2: Welke rol speelt SIW op afdelingsniveau in de prestaties?
OV 3: Wat is het effect van SIW op afdelingsniveau op de relatie tussen ITBSA en prestaties
van afdelingen?

202 Samenvatting
OV 4: Wat voor effect heeft SIW op afdelingsniveau op de relatie tussen ITSBA en prestaties
van afdelingen?
Hoofdstuk 2 beschrijft de achtergronden en definities van de belangrijkste concepten in deze
thesis. Het geeft daarmee tevens een historisch overzicht van de ontwikkeling van de IT
strategie en de integratie ervan in de bedrijfsstrategie. We relateren EGIT aan zowel
bedrijfsbeheer als IT beheer. Tot slot linken we innovatie als breed concept aan het meer
specifieke concept van sociale innovatie.
Hoofdstuk 3 geeft een uitvoerige literatuurstudie. De onderzochte literatuur bestaat uit
onderzoek naar de relatie tussen ITSBA en de prestaties van bedrijven. Hier zullen we laten
zien dat deze relatie controversieel is en beter onderzocht dient te worden. Tevens onderzoeken
we de positionering van SIW als facilitator tussen ITBSA en de prestaties. Tenslotte wordt
onderzocht hoe EGIT zich verhoudt in relatie tot ITSBA en SIW. De literatuurstudie toont aan
dat er conflicterende meningen zijn over deze relaties. Hiermee zal de basis worden gelegd
voor de constructie van ons conceptuele model in het volgende hoofdstuk.
In hoofdstuk 4 presenteren wij bovengenoemd conceptuele model. Dit doen wij door eerst een
theoretische achtergrond te geven van de mediation en moderation modellen. Vervolgens
benadrukken we het belang van analyse op afdelingsniveau door aan te tonen dat succesvolle
innovatie en performance hun oorsprong vinden op afdelingsniveau. Vanuit deze resultaten
mogen we concluderen dat onze analyse ook op afdelingsniveau geldig is.
Om ons conceptuele model te kunnen formuleren, presenteren we de selectie-criteria voor het
model en verantwoorden we onze voorkeur voor een mediation model voor EGIT. Tenslotte
presenteren wij ons gecombineerde conceptuele model bestaande uit de constructen van
ITBSA, EGIT, SIW en performance.
Hoofdstuk 5 behelst een uiteenzetting van de details van het data-collectie proces. Eerst
presenteren we de uitvoering van de belangrijkste constructen (ITBSA, EGIT, SIW en
performance) en verantwoorden deze daarna. Vervolgens kiezen we de instrumenten die
gebruikt worden in het proces van de data-collectie. Natuurlijk verantwoorden we wat we
gekozen hebben. Daaropvolgend wordt het proces van data-collectie uitvoerig beschreven. De
data is verzameld in acht internationale bedrijven gevestigd in Yemen. Deze acht bedrijven
representeren vier voorname bedrijfssectoren (financieel/bankensector, communicatie, olie en
From IT Business Strategic Alignment to Performance 203
gas, en hoger onderwijs). Tenslotte wordt de verzamelde data beschreven door te laten zien dat
de trends in onze data in overeenstemming zijn met gelijksoortige data uit de literatuur.
In hoofdstuk 6 voeren we een uitgebreide statistische data-analyse uit waarbij we gebruik
maken van de Structural Equation Modeling (SEM) techniek. Eerst beargumenteren we de
geschiktheid van SEM als techniek om de relaties tussen mediation en moderation te
analyseren. Dan verantwoorden we onze keuze van de indices, zijnde Chi Square, RMSEA,
CFI en PCFI, die gebruikt zullen worden voor de validatie van het model. Een bevestigende
factor analyse (confirmatory factor analysis (CFA)) en een model betrouwbaarheidstest
worden uitgevoerd. Om tot een valide model voor de SEM analyse te komen, was het nodig
het bestaande model iets aan te passen. Het aangepaste model is vervolgens geanalyseerd door
vier sub-modellen te bestuderen. Elk van deze modellen is gerelateerd aan een van de vier
onderzoeksvragen.
Uit de resultaten bleek dat (a) de vier modellen valide zijn (b) ieder sub-model wijst op een van
de volgende vier relaties:
(1) ITSBA heeft een positief effect op SIW. (2) SIW heeft een positief effect op het
functioneren van afdelingen. (3) SIW werkt bemiddelend op de relatie tussen ITBSA en het
functioneren van afdelingen. (4) EGIT modereert het bemiddelende effect van SIW.
Hoofdstuk 7 recapituleert de antwoorden op de vier onderzoeksvragen en de probleemstelling.
Op basis van deze uitkomsten worden er drie mogelijkheden voorgesteld waarmee een positief
effect op functioneren bereikt kan worden middels investeringen in IT. We stellen dat (1)
managers hun bedrijfsvoering strategie op afdelingsniveau af moeten stemmen met de IT
strategie, (2) managers zich moeten richten om punt 1 te implementeren op de collectieve
inspanning om bedrijfsinnovatie te realiseren en (3) om het effect van de strategische
afstemming genoemd bij 1 te maximaliseren, zouden managers zich moeten richten op het
ontwikkelen van (EGIT). De focus zou moeten liggen op IT processen en IT structuren.
Vervolgens worden er vier mogelijkheden voor verder onderzoek uitgelicht: (1) het verkennen
van thematische aspecten van SIW, (2) een uitgebreidere analyse van de interactie tussen de
componenten van EGIT wanneer deze als moderators functioneren, (3) het testen van de
resultaten uit deze thesis met andere data collectie instrumenten (met name voor ITBSA en

204 Samenvatting
SIW) en (4) het testen van modellen door andere variabelen toe te voegen (niet in huidige
model zijn toegepast) als middelaars of moderators in het traject van ITBSA naar performance.
205
Curriculum Vitae
Adel Alhuraibi was born in Nitra, Slovakia on January 30, 1967. He received his high school
education partly in Prague (the Czech Republic) and Sana’a (Yemen). Thereafter, he
graduated with a double major in business and computer science from Colorado State
University in 1990. Moreover, he obtained his MSc. in financial management from the
University of London in 1998. Subsequently, he joined Maastricht School of Management in
2006 and defended his M. Phil degree in 2008. With these credentials Adel joined the Tilburg
University in 2012 for a PhD degree which he obtained in 2017.
Adel’s working activities are as follows. He joined Sana’a University as an assistant instructor
in the College of Business in 1997. Since then, he has been instructing a number of
undergraduate courses at both Sana'a University and the College of Business at the Lebanese
International University (since January 2010). The courses included Entrepreneurship,
International Business, International Finance, Financial Modeling and Strategic Management.
Moreover, Adel has been delivering an MBA course (Performance Management and
Information Technology) for MsM (Maastricht School of Management) MBA program in
Yemen since 2007.
Finally, Adel Alhuraibi has acted as a consultant and a trainer in the field of strategic
performance management systems. He has executed several projects for both private
enterprises (Banks, oil & gas, and commercial Trade Organizations in Europe & Yemen) and
public/developmental agencies (including several Ministries and governmental agencies in
Yemen). Some of the delivered public consultancy projects and training were funded by
international agencies, such as the World Bank, UNDP, KfW, USAID and GOPA.

206
This page is intentionally left blank
207
Special Acknowledgment
Writing a Ph.D. thesis is a very challenging process. First of all, I faced the academic
challenges as all normal Ph.D. students do. Then I experienced difficult logistic obstacles
related to the political and military unrest that happened in Yemen (the country of my research)
during the course of this long journey. It made the research an expedition with many
adventures. Surely, reaching the completion would not have been possible on my own.
Therefore, I am very grateful to many people who supported me in this endeavor.
I would like to start by expressing a great deal of appreciation to my supervising team headed
by Professor Jaap van den Herik. Professor van den Herik has put his trust in me and continued
to do so in a very rough period of my life. This included two civil unrests in Yemen, as well as
a complete family relocation during the course of this research. His trust, valuable time
dedication, and very detailed remarks were all main factors of inspiration which kept me on
track towards the completion of this educational project. Professor van den Herik believed in
my abilities and provided dedicated and professional support with remarkable patience. I will
never forget his dedication, and honestly, I wish to adopt his level of personal commitment
and attention to details for the future students in my own academic life (it will be tough, but
at least I promise to try).
In other words with the same intentions, I would like to convey my appreciation and great
respect to the efforts of Professor Suresh Ankolekar from the Maastricht School of
Management. His technical guidance and constructive remarks throughout the journey were
invaluable. Initially, he has assisted me at the very beginning with the formulation of my
research idea. During the course of my research, he did not withhold any effort in providing
critical suggestions and pointing to valuable literature that helped in overcoming pivotal
hurdles in my research. Moreover, due to logistical and travel difficulties during the grim
phases of this research, the skype sessions with Professor Ankolekar helped me to keep the
research project on track. Similarly, I owe thanks and appreciation to Professor Bartel A. Van
de Walle who has supported me during this project. His contribution were critical in
establishing the foundation and the structure of my thesis. I appreciate the fact that in spite of
his very busy (international) schedule, he has managed to dedicate a portion of his precious
time to my support. Of course, my sincere thanks and gratitude are directed to Joke Hellemons
for her continuous support, advise on logistical issues, and her nurturing of my communications
with the supervising professors. Without her, it would have been a much more difficult journey.

208 Special Acknowledgment
After Joke’s retirement Monique Arntz has served me with a similar involvement that showed
much accuracy and diligence. Thank you, Monique!
Special thanks are dedicated to the five members of the assessment committee, namely the
Professors W.J.A.M. van den Heuvel, E. O. Postma, M. E. M. van Reisen, and J. N. Kok, as
well as Dr. V. Feltkamp who spent a considerable amount of their time and effort in reading
my draft version of the thesis. I am sure that their constructive comments are a valuable
contribution to my learning experience and will assist me in attaining the ability to write and
defend the research idea in a more multi-view and holistic manner.
Moreover, I would like to extend my appreciation to the Center for Business Administration
(CBA), which is a joint project between Sana’a University (College of Business & Economics)
and the Maastricht School of Management (MsM), for coordinating my doctorate study. Next
is my great appreciation to the CBA MBA students which have positively contributed at the
data collection stage. My special thanks goes to the NUFFIC organization which has sponsored
the establishment of the CBA and has partially financed my doctorate study as part of the CBA
project. Special thanks is reserved for Dr. Saib Sallam, the manager of CBA at that time, for
his efforts in coordinating and realizing my doctorate program. Moreover, I express my thanks
and appreciation to the academic professors and administrative staff of the College of Business
at Sana’a University (department of Business Administration) for their support.
Then, my profound acknowledgments are dedicated to Maastricht School of Management
where the journey has started with my MPhil degree. First of all, I would like to thank the
dean, Professor W.A. Naudé, and the academic staff for spending all effort in their limitless
and timeless academic contributions. Moreover, I greatly acknowledge the administration
teams in all institutions involved in this research. Their flexibility, dedication, and patience
during the tough times have made the journey possible. Moreover, I would like to extend my
special appreciation to Mr. Meinhard Gans who was one of the first supporters of my doctorate
track during his several visits to Yemen as part of the CBA establishment project. I also thank
him for being fully supportive and inspiring during my study and stay at MsM. I would also
like to thank Mr. Patrick Mans and Ms. Sandra Kolkman, and all other employees of the
administrative staff for their exceptional support during my initial academic work at MsM.
From IT Business Strategic Alignment to Performance 209
Last but not least, I am greatly thankful to all members of my family. Without their love,
encouragement, and above all patience, the completion of this thesis would not have been
possible. This includes my father who has never stopped inspiring me to continue my study
towards completion. He was always the provider of my peace of mind, and the sense of
tranquility about my immediate family during my frequent absence. His encouraging words
will always remain with me. I am also confident that my mother would have been proud of my
achievement if she was given the opportunity to stay among us. However, she passed away too
early and had only my promise that I would do my utmost to reach this goal. I also thank my
immediate family, my beloved wife, and my four children for putting up with my mental
absence during my physical presence, and my physical absence during hard and unsecure times.
You all were a great source of inspiration.
Finally, I dedicate my sincere thanks and acknowledgment to all professors, friends, and family
members whose names I did not mention and who also played an important role in this success.

210
This page is intentionally left blank
211
SIKS Ph.D. Series
2011 1. Botond Cseke (RUN), Variational Algorithms for
Bayesian Inference in Latent Gaussian Models 2. Nick Tinnemeier (UU), Organizing Agent
Organizations. Syntax and Operational Semantics of an Organization-Oriented Programming Language
3. Jan Martijn van der Werf (TUE), Compositional Design and Verification of Component-Based Information Systems
4. Hado van Hasselt (UU), Insights in Reinforcement Learning; Formal analysis and empirical evaluation of temporal difference
5. Bas van der Raid (VU), Enterprise Architecture Coming of Age - Increasing the Performance of an Emerging Discipline
6. Yiwen Wang (TUE), Semantically-Enhanced Recommendations in Cultural Heritage
7. Yujia Cao (UT), Multimodal Information Presentation for High Load Human Computer Interaction
8. Nieske Vergunst (UU), BDI-based Generation of Robust Task Oriented Dialogues
9. Tim de Jong (OU), Contextualised Mobile Media for Learning
10. Bart Bogaert (UvT), Cloud Content Contention 11. Dhaval Vyas (UT), Designing for Awareness: An
Experience focused HCI Perspective 12. Carmen Bratosin (TUE), Grid Architecture for
Distributed Process Mining 13. Xiaoyu Mao (UvT), Airport under Control.
Multiagent Scheduling for Airport Ground Handling
14. Milan Lovric (EUR), Behavioral Finance and Agent-Based Artificial Markets
15. Marijn Koolen (UvA), The Meaning of Structure: the Value of Link Evidence for Information Retrieval
16. Maarten Schadd (UM), Selective Search in Games of Different Complexity
17. Jiyin He (UVA), Exploring Topic Structure: Coherence, Diversity and Relatedness
18. Mark Ponsen (UM), Strategic Decision-Making in complex games
19. 19. Ellen Rusman (OU), The Mind’s Eye on Personal Profiles
20. 20. Qing Gu (VU), Guiding service-oriented software engineering - A view-based approach
21. Linda Terlouw (TUD), Modularization and Specification of Service-Oriented Systems
22. Junte Zhang (UVA), System Evaluation of Archival Description and Access
1. Wouter Weerkamp (UVA), Finding People and their Utterances in Social Media
2. Syed Waqar us Qounain Jaffry (VU), Analysis and Validation of Models for Trust Dynamics
3. Matthijs Aart Pontier (VU), Virtual Agents for Human Communication - Emotion Regulation and Involvement-Distance Trade-Offs in Embodied Conversational Agents and Robots
4. Matthijs Aart Pontier (VU), Virtual Agents for Human Communication - Emotion Regulation and Involvement-Distance Trade-Offs in Embodied Conversational Agents and Robots
5. Aniel Bhulai (VU), Dynamic website optimization through autonomous management of design patterns
6. Rianne Kaptein (UVA), Effective Focused Retrieval by Exploiting Query Context and Document Structure
7. Faisal Kamiran (TUE), Discrimination-aware Classification
8. Egon van den Broek (UT), Affective Signal Processing (ASP): Unraveling the mystery of emotions
9. Ludo Waltman (EUR), Computational and Game-Theoretic Approaches for Modeling Bounded Rationality
10. Nees-Jan van Eck (EUR), Methodological Advances in Bibliometric Mapping of Science
11. Tom van der Weide (UU), Arguing to Motivate Decisions
12. Paolo Turrini (UU), Strategic Reasoning in Interdependence: Logical and Game-theoretical Investigations
13. Maaike Harbers (UU), Explaining Agent Behavior in Virtual Training
14. Erik van der Spek (UU), Experiments in serious game design: a cognitive approach
15. Adriana Burlutiu (RUN), Machine Learning for Pairwise Data, Applications for Preference Learning and Supervised Network Inference
16. Nyree Lemmens (UM), Bee-inspired Distributed Optimization
17. Joost Westra (UU), Organizing Adaptation using Agents in Serious Games
18. Viktor Clerc (VU), Architectural Knowledge Management in Global Software Development
19. Luan Ibraimi (UT), Cryptographically Enforced Distributed Data Access Control
20. Michal Sindlar (UU), Explaining Behavior through Mental State Attribution
21. Henk van der Schuur (UU), Process Improvement through Software Operation Knowledge
22. Boris Reuderink (UT), Robust Brain-Computer Interfaces
23. Herman Stehouwer (UvT), Statistical Language Models for Alternative Sequence Selection

212 SIKS Dissertation Series
24. Beibei Hu (TUD), Towards Contextualized Information Delivery: A Rule-based Architecture for the Domain of Mobile Police Work
25. Azizi Bin Ab Aziz (VU), Exploring Computational Models for Intelligent Support of Persons with Depression
26. Mark Ter Maat (UT), Response Selection and Turn-taking for a Sensitive Artificial Listening Agent
27. Andreea Niculescu (UT), Conversational interfaces for task oriented spoken dialogues: design aspects influencing interaction quality
2012 1. Terry Kakeeto (UvT), Relationship Marketing for
SMEs in Uganda 2. Muhammad Umair (VU), Adaptivity, emotion, and
Rationality in Human and Ambient Agent Models 3. Adam Vanya (VU), Supporting Architecture Evolution
by Mining Software Repositories 4. Jurriaan Souer (UU), Development of Content
Management System-based Web Applications 5. Marijn Plomp (UU), Maturing Interorganisational
Information Systems 6. Wolfgang Reinhardt (OU), Awareness Support for
Knowledge Workers in Research Networks 7. Rianne van Lambalgen (VU), When the Going Gets
Tough: Exploring Agent-based Models of Human Performance under Demanding Conditions
8. Gerben de Vries (UVA), Kernel Methods for Vessel Trajectories Ricardo Neisse (UT), Trust and Privacy Management Support for Context-Aware Service Platforms
9. Ricardo Neisse (UT), Trust and Privacy Management Support for Context-Aware Service Platforms
10. David Smits (TUE), Towards a Generic Distributed Adaptive Hypermedia Environment
11. J.C.B. Rantham Prabhakara (TUE), Process Mining in the Large: Preprocessing, Discovery, and Diagnostics
12. Kees van der Sluijs (TUE), Model Driven Design and Data Integration in Semantic Web Information Systems
13. Suleman Shahid (UvT), Fun and Face: Exploring non-verbal expressions of emotion during playful interactions
14. Evgeny Knutov (TUE), Generic Adaptation Framework for Unifying Adaptive Web-based Systems
15. Natalie van der Wal (VU), Social Agents. Agent-Based Modelling of Integrated Internal and Social Dynamics of Cognitive and Affective Processes.
16. Fiemke Both (VU), Helping people by understanding them - Ambient Agents supporting task execution and depression treatment
17. Amal Elgammal (UvT), Towards a Comprehensive Framework for Business Process Compliance
18. Eltjo Poort (VU), Improving Solution Architecting Practices
19. Helen Schonenberg (TUE), What’s Next? Operational Support for Business Process Execution
20. Ali Bahramisharif (RUN), Covert Visual Spatial Attention, a Robust Paradigm for Brain-Computer Interfacing
21. Roberto Cornacchia (TUD), Querying Sparse Matrices for Information Retrieval
22. Thijs Vis (UvT), Intelligence, politie en veiligheidsdienst: verenigbare grootheden?
23. Christian Muehl (UT), Toward Affective Brain-Computer Interfaces: Exploring the Neurophysiology of Affect during Human Media Interaction
24. Laurens van der Werff (UT), Evaluation of Noisy Transcripts for Spoken Document Retrieval
25. Silja Eckartz (UT), Managing the Business Case Development in Inter-Organizational IT Projects: A Methodology and its Application
26. Emile de Maat (UVA), Making Sense of Legal Text
27. Hayrettin Gurkok (UT), Mind the Sheep! User Experience Evaluation & Brain-Computer Interface Games
28. Nancy Pascall (UvT), Engendering Technology Empowering Women
29. Almer Tigelaar (UT), Peer-to-Peer Information Retrieval
30. Alina Pommeranz (TUD), Designing Human-Centered Systems for Reflective Decision Making
31. Emily Bagarukayo (RUN), A Learning by Construction Approach for Higher Order Cognitive Skills Improvement, Building Capacity and Infrastructure
32. Wietske Visser (TUD), Qualitative multi-criteria preference representation and reasoning
33. Rory Sie (OUN), Coalitions in Cooperation Networks (COCOON)
34. Pavol Jancura (RUN), Evolutionary analysis in PPI networks and applications
35. Evert Haasdijk (VU), Never Too Old To Learn – On-line Evolution of Controllers in Swarm- and Modular Robotics
36. Denis Ssebugwawo (RUN), Analysis and Evaluation of Collaborative Modeling Processes
37. Agnes Nakakawa (RUN), A Collaboration Process for Enterprise Architecture Creation
38. Selmar Smit (VU), Parameter Tuning and Scientific Testing in Evolutionary Algorithms
39. Hassan Fatemi (UT), Risk-aware design of value and coordination networks
40. Agus Gunawan (UvT), Information Access for SMEs in Indonesia
41. Sebastian Kelle (OU), Game Design Patterns for Learning
42. Dominique Verpoorten (OU), Reflection Amplifiers in selfregulated Learning
43. Withdrawn 44. Anna Tordai (VU), On Combining Alignment
Techniques
From IT Business Strategic Alignment to Performance 213
45. Benedikt Kratz (UvT), A Model and Language for Business aware Transactions
46. Simon Carter (UVA), Exploration and Exploitation of Multilingual Data for Statistical Machine Translation
47. Manos Tsagkias (UVA), Mining Social Media: Tracking Content and Predicting Behavior
48. Jorn Bakker (TUE), Handling Abrupt Changes in Evolving Time-series Data
49. Michael Kaisers (UM), Learning against Learning - Evolutionary dynamics of reinforcement learning algorithms in strategic interactions
50. Steven van Kervel (TUD), Ontologogy driven Enterprise Information Systems Engineering
51. Jeroen de Jong (TUD), Heuristics in Dynamic Sceduling; a practical framework with a case study in elevator dispatching
2013 1. Viorel Milea (EUR), News Analytics for Financial
Decision Support 2. Erietta Liarou (CWI), MonetDB/DataCell:
Leveraging the Column-store Database Technology for Efficient and Scalable Stream Processing
3. Szymon Klarman (VU), Reasoning with Contexts in Description Logics
4. Chetan Yadati (TUD), Coordinating autonomous planning and scheduling
5. Dulce Pumareja (UT), Groupware Requirements Evolutions Patterns
6. Romulo Goncalves (CWI), The Data Cyclotron: Juggling Data and Queries for a Data Warehouse Audience
7. Giel van Lankveld (UvT), Quantifying Individual Player Differences
8. Robbert-Jan Merk (VU), Making enemies: cognitive modeling for opponent agents in fighter pilot simulators
9. Fabio Gori (RUN), Metagenomic Data Analysis: Computational Methods and Applications
10. Jeewanie Jayasinghe Arachchige (UvT), A Unified Modeling Framework for Service Design.
11. Evangelos Pournaras (TUD), Multi-level Reconfigurable Selforganization in Overlay Services
12. Marian Razavian (VU), Knowledge-driven Migration to Services
13. Mohammad Safiri (UT), Service Tailoring: User-centric creation of integrated IT-based homecare services to support independent living of elderly
14. Jafar Tanha (UVA), Ensemble Approaches to Semi-Supervised Learning
15. Daniel Hennes (UM), Multiagent Learning - Dynamic Games and Applications
16. Eric Kok (UU), Exploring the practical benefits of argumentation in multi-agent deliberation
17. Koen Kok (VU), The PowerMatcher: Smart Coordination for the Smart Electricity Grid
18. Jeroen Janssens (UvT), Outlier Selection and One-Class Classification
19. Renze Steenhuizen (TUD), Coordinated Multi-Agent Planning and Scheduling
20. Katja Hofmann (UvA), Fast and Reliable Online Learning to Rank for Information Retrieval
21. Sander Wubben (UvT), Text-to-text generation by monolingual machine translation
22. Tom Claassen (RUN), Causal Discovery and Logic
23. Patricio de Alencar Silva (UvT), Value Activity Monitoring
24. Haitham Bou Ammar (UM), Automated Transfer in
25. Agnieszka Anna Latoszek-Berendsen (UM), Intention-based Decision Support. A new way of representing and implementing clinical guidelines in a Decision Support System
26. Alireza Zarghami (UT), Architectural Support for Dynamic Homecare Service Provisioning
27. Mohammad Huq (UT), Inference-based Framework Managing Data Provenance
28. Frans van der Sluis (UT), When Complexity becomes Interesting: An Inquiry into the Information eXperience
29. Iwan de Kok (UT), Listening Heads 30. Joyce Nakatumba (TUE), Resource-Aware
Business Process Management: Analysis and Support
31. Dinh Khoa Nguyen (UvT), Blueprint Model and Language for Engineering Cloud Applications
32. Kamakshi Rajagopal (OUN), Networking For Learning; The role of Networking in a Lifelong Learner’s Professional Development
33. Qi Gao (TUD), User Modeling and Personalization in the Microblogging Sphere
34. Kien Tjin-Kam-Jet (UT), Distributed Deep Web Search
35. Abdallah El Ali (UvA), Minimal Mobile Human Computer Interaction
36. Than Lam Hoang (TUe), Pattern Mining in Data Streams
37. Dirk Börner (OUN), Ambient Learning Displays
38. Eelco den Heijer (VU), Autonomous Evolutionary Art
39. Joop de Jong (TUD), A Method for Enterprise Ontology based Design of Enterprise Information Systems
40. Pim Nijssen (UM), Monte-Carlo Tree Search for Multi-Player Games
41. Jochem Liem (UVA), Supporting the Conceptual Modelling of Dynamic Systems: A Knowledge Engineering Perspective on Qualitative Reasoning
42. Léon Planken (TUD), Algorithms for Simple Temporal Reasoning
22. Marieke Peeters (UU), Personalized Educational Games - Developing agent-supported scenario-based training

214 SIKS Dissertation Series
43. Marc Bron (UVA), Exploration and Contextualization through Interaction and Concepts
2014 1. Nicola Barile (UU), Studies in Learning Monotone
Models from Data 2. Fiona Tuliyano (RUN), Combining System
Dynamics with a Domain Modeling Method 3. Sergio Raul Duarte Torres (UT), Information
Retrieval for Children: Search Behavior and Solutions
4. Hanna Jochmann-Mannak (UT), Websites for children: search strategies and interface design - Three studies on children’s search performance and evaluation
5. Jurriaan van Reijsen (UU), Knowledge Perspectives on Advancing Dynamic Capability
6. Damian Tamburri (VU), Supporting Networked Software Development
7. Arya Adriansyah (TUE), Aligning Observed and Modeled Behavior
8. Samur Araujo (TUD), Data Integration over Distributed and Heterogeneous Data Endpoints
9. Philip Jackson (UvT), Toward Human-Level Artificial Intelligence: Representation and Computation of Meaning in Natural Language
10. Ivan Salvador Razo Zapata (VU), Service Value Networks
11. Janneke van der Zwaan (TUD), An Empathic Virtual Buddy for Social Support
12. Willem van Willigen (VU), Look Ma, No Hands: Aspects of Autonomous Vehicle Control
13. Arlette van Wissen (VU), Agent-Based Support for Behavior Change: Models and Applications in Health and Safety Domains
14. Yangyang Shi (TUD), Language Models With Metainformation
15. Natalya Mogles (VU), Agent-Based Analysis and Support of Human Functioning in Complex Socio-Technical Systems: Applications in Safety and Healthcare
16. Krystyna Milian (VU), Supporting trial recruitment and design by automatically interpreting eligibility criteria
17. Kathrin Dentler (VU), Computing healthcare quality indicators automatically: Secondary Use of Patient Data and Semantic Interoperability
18. Mattijs Ghijsen (UVA), Methods and Models for the Design and Study of Dynamic Agent Organizations
19. Vinicius Ramos (TUE), Adaptive Hypermedia Courses: Qualitative and Quantitative Evaluation and Tool Support
20. Mena Habib (UT), Named Entity Extraction and Disambiguation for Informal Text: The Missing Link
21. Kassidy Clark (TUD), Negotiation and Monitoring in Open Environments
23. Eleftherios Sidirourgos (UvA/CWI), Space Efficient Indexes for the Big Data Era
24. Davide Ceolin (VU), Trusting Semi-structured Web Data
25. Martijn Lappenschaar (RUN), New network models for the analysis of disease interaction
26. Tim Baarslag (TUD), What to Bid and When to Stop
27. Rui Jorge Almeida (EUR), Conditional Density Models Integrating Fuzzy and Probabilistic Representations of Uncertainty
28. Anna Chmielowiec (VU), Decentralized k-Clique Matching
29. Jaap Kabbedijk (UU), Variability in Multi-Tenant Enterprise Software
30. Peter de Cock (UvT), Anticipating Criminal Behaviour
31. Leo van Moergestel (UU), Agent Technology in Agile Multiparallel Manufacturing and Product Support
32. Naser Ayat (UvA), On Entity Resolution in Probabilistic Data
33. Tesfa Tegegne (RUN), Service Discovery in eHealth
34. Christina Manteli (VU), The Effect of Governance in Global Software Development: Analyzing Transactive Memory Systems.
35. Joost van Ooijen (UU), Cognitive Agents in Virtual Worlds: A Middleware Design Approach
36. Joos Buijs (TUE), Flexible Evolutionary Algorithms for Mining Structured Process Models
37. Maral Dadvar (UT), Experts and Machines United Against Cyberbullying
38. Danny Plass-Oude Bos (UT), Making brain-computer interfaces better: improving usability through post-processing.
39. Jasmina Maric (UvT), Web Communities, Immigration, and Social Capital
40. Walter Omona (RUN), A Framework for Knowledge Management Using ICT in Higher Education
41. Frederic Hogenboom (EUR), Automated Detection of Financial Events in News Text
42. Carsten Eijckhof (CWI/TUD), Contextual Multidimensional Relevance Models
43. Kevin Vlaanderen (UU), Supporting Process Improvement using Method Increments
44. Paulien Meesters (UvT), Intelligent Blauw. Met als ondertitel: Intelligence-gestuurde politiezorg in gebiedsgebonden eenheden.
45. Birgit Schmitz (OUN), Mobile Games for Learning: A Pattern Based Approach
46. Ke Tao (TUD), Social Web Data Analytics: Relevance, Redundancy, Diversity
From IT Business Strategic Alignment to Performance 215
47. Shangsong Liang (UVA), Fusion and Diversification in Information Retrieval
2015 1. Niels Netten (UvA), Machine Learning for
Relevance of Information in Crisis Response 48. Faiza Bukhsh (UvT), Smart auditing: Innovative
Compliance Checking in Customs Controls 49. Twan van Laarhoven (RUN), Machine learning for
network data 50. Howard Spoelstra (OUN), Collaborations in Open
Learning Environments 51. Christoph Bösch (UT), Cryptographically Enforced
Search Pattern Hiding 52. Farideh Heidari (TUD), Business Process Quality
Computation - Computing Non-Functional Requirements to Improve Business Processes
53. Maria-Hendrike Peetz (UvA), Time-Aware Online Reputation Analysis
54. Jie Jiang (TUD), Organizational Compliance: An agent-based model for designing and evaluating organizational interactions
55. Randy Klaassen (UT), HCI Perspectives on Behavior Change Support Systems
56. Henry Hermans (OUN), OpenU: design of an integrated system to support lifelong learning
57. Yongming Luo (TUE), Designing algorithms for big graph datasets: A study of computing bisimulation and joins
58. Julie M. Birkholz (VU), Modi Operandi of Social Network Dynamics: The Effect of Context on Scientific Collaboration Networks
59. Giuseppe Procaccianti (VU), Energy-Efficient Software
60. Bart van Straalen (UT), A cognitive approach to modeling bad news conversations
61. Klaas Andries de Graaf (VU), Ontology-based 62. Changyun Wei (UT), Cognitive Coordination for
Cooperative Multi-Robot Teamwork 63. André van Cleeff (UT), Physical and Digital Security
Mechanisms: Properties, Combinations and 64. olger Pirk (CWI), Waste Not, Want Not! - Managing
Relational Data in Asymmetric Memories 65. Bernardo Tabuenca (OUN), Ubiquitous Technology
for Lifelong Learners 66. Lois Vanhée (UU), Using Culture and Values to
Support Flexible Coordination 67. Sibren Fetter (OUN), Using Peer-Support to Expand
and Stabilize Online Learning 68. Zhemin Zhu (UT), Co-occurrence Rate Networks 69. Luit Gazendam (VU), Cataloguer Support in
Cultural Heritage 70. Richard Berendsen (UVA), Finding People, Papers,
and Posts: Vertical Search Algorithms and Evaluation
71. Steven Woudenberg (UU), Bayesian Tools for Early Disease Detection
72. Alexander Hogenboom (EUR), Sentiment Analysis of Text Guided by Semantics and Structure
73. Sándor Héman (CWI), Updating compressed colomn stores
74. Janet Bagorogoza (TiU), Knowledge Management and High Performance; The Uganda Financial Institutions Model for HPO
75. Hendrik Baier (UM), Monte-Carlo Tree Search Enhancements for One-Player and Two-Player Domains
76. Kiavash Bahreini (OU), Real-time Multimodal Emotion Recognition in E-Learning
77. Yakup Koç (TUD), On the robustness of Power Grids
78. Jerome Gard (UL), Corporate Venture Management in SMEs
79. Frederik Schadd (TUD), Ontology Mapping with Auxiliary Resources
80. Victor de Graaf (UT), Gesocial Recommender Systems
81. Jungxao Xu (TUD), Affective Body Language of Humanoid Robots: Perception and Effects in Human Robot Interaction
2016 1. Syed Saiden Abbas (RUN), Recognition of
Shapes by Humans and Machines 2. Michiel Christiaan Meulendijk (UU),
Optimizing medication reviews through decision support: prescribing a better pill to swallow
3. Maya Sappelli (RUN), Knowledge Work in Context: User Centered Knowledge Worker Support
4. Laurens Rietveld (VU), Publishing and Consuming Linked Data
5. Evgeny Sherkhonov (UVA), Expanded Acyclic Queries: Containment and an Application in Explaining Missing Answers
6. Michel Wilson (TUD), Robust scheduling in an uncertain environment
7. Jeroen de Man (VU), Measuring and modeling negative emotions for virtual training
8. Matje van de Camp (TiU), A Link to the Past: Constructing Historical Social Networks from Unstructured Data
9. Archana Nottamkandath (VU), Trusting Crowdsourced Information on Cultural Artefacts
10. George Karafotias (VUA), Parameter Control for Evolutionary Algorithms
11. Anne Schuth (UVA), Search Engines that Learn from Their Users
12. Max Knobbout (UU), Logics for Modelling and Verifying Normative Multi-Agent Systems
13. Nana Baah Gyan (VU), The Web, Speech Technologies and Rural Development in West Africa - An ICT4D Approach
14. Ravi Khadka (UU), Revisiting Legacy Software System Modernization
15. Steffen Michels (RUN), Hybrid Probabilistic Logics - Theoretical Aspects, Algorithms and Experiments

216 SIKS Dissertation Series
16. Guangliang Li (UVA), Socially Intelligent Autonomous Agents that Learn from Human Reward
17. Berend Weel (VU), Towards Embodied Evolution of Robot Organisms
18. Albert Meroño Peñuela (VU), Refining Statistical Data on the Web
19. Julia Efremova (Tu/e), Mining Social Structures from Genealogical Data
20. Daan Odijk (UVA), Context & Semantics in News & Web Search
21. Alejandro Moreno Célleri (UT), From Traditional to Interactive Playspaces: Automatic Analysis of Player Behavior in the Interactive Tag Playground
22. Grace Lewis (VU), Software Architecture Strategies for Cyber Foraging Systems
23. Fei Cai (UVA), Query Auto Completion in Information Retrieval
24. Brend Wanders (UT), Repurposing and Probabilistic Integration of Data; An Iterative and data model independent approach
25. Julia Kiseleva (TU/e), Using Contextual Information to Understand Searching and Browsing Behavior
26. Dilhan Thilakarathne (VU), In or Out of Control: Exploring Computational Models to Study the Role of Human Awareness and Control in Behavioural Choices, with Applications in Aviation and Energy Management Domains
27. Wen Li (TUD), Understanding Geo-spatial Information on Social Media
28. Mingxin Zhang (TUD), Large-scale Agent-based Social Simulation - A study on epidemic prediction and control
29. Nicolas Höning (TUD), Peak reduction in decentralised electricity systems - Markets and prices for flexible planning
30. Ruud Mattheij (UvT), The Eyes Have It 31. Mohammad Khelghati (UT), Deep web content
monitoring 32. Eelco Vriezekolk (UT), Assessing
Telecommunication Service Availability Risks for Crisis Organisations
33. Peter Bloem (UVA), Single Sample Statistics, exercises in learning from just one example
34. Dennis Schunselaar (TUE), Configurable Process Trees: Elicitation, Analysis, and Enactment
35. Zhaochun Ren (UVA), Monitoring Social Media: Summarization, Classification and Recommendation
36. Daphne Karreman (UT), Beyond R2D2: The design of nonverbal interaction behavior optimized for robot-specific morphologies
37. Giovanni Sileno (UvA), Aligning Law and Action - a conceptual and computational inquiry
38. Andrea Minuto (UT), Materials that Matter - Smart Materials meet Art & Interaction Design
39. Merijn Bruijnes (UT), Believable Suspect Agents; Response and Interpersonal Style Selection for an Artificial Suspect
40. Christian Detweiler (TUD), Accounting for Values in Design
41. Thomas King (TUD), Governing Governance: A Formal Framework for Analysing Institutional Design and Enactment Governance
42. Spyros Martzoukos (UVA), Combinatorial and Compositional Aspects of Bilingual Aligned Corpora
43. Saskia Koldijk (RUN), Context-Aware Support for Stress SelfManagement: From Theory to Practice
44. Thibault Sellam (UVA), Automatic Assistants for Database Exploration
45. Bram van de Laar (UT), Experiencing Brain-Computer Interface Control
46. Jorge Gallego Perez (UT), Robots to Make you Happy
47. Christina Weber (UL), Real-time foresight - Preparedness for dynamic innovation networks
48. Tanja Buttler (TUD), Collecting Lessons Learned
49. Gleb Polevoy (TUD), Participation and Interaction in Projects. A Game-Theoretic Analysis
50. Yan Wang (UVT), The Bridge of Dreams: Towards a Method for Operational Performance Alignment in IT-enabled Service Supply Chains
2017 1. Jan-Jaap Oerlemans (UL), Investigating
Cybercrime 2. Sjoerd Timmer (UU), Designing and
Understanding Forensic Bayesian Networks using Argumentation
3. Daniël Harold Telgen (UU), Grid Manufacturing; A Cyber Physical Approach with Autonomous Products and Reconfigurable Manufacturing Machines
4. Mrunal Gawade (CWI), Multi-core Parallelism in a Columnstore
5. Mahdieh Shadi (UVA), Collaboration Behavior 6. Damir Vandic (EUR), Intelligent Information
Systems for Web Product Search 7. Roel Bertens (UU), Insight in Information: from
Abstract to Anomaly 8. Rob Konijn (VU), Detecting Interesting
Differences: Data Mining in Health Insurance Data using Outlier Detection and Subgroup Discovery
9. Dong Nguyen (UT), Text as Social and Cultural Data: A Computational Perspective on Variation in Text
10. Robby van Delden (UT), (Steering) Interactive 11. Florian Kunneman (RUN), Modelling patterns
of time and emotion in Twitter #anticipointment 12. Sander Leemans (TUE), Robust Process Mining
with Guarantees
From IT Business Strategic Alignment to Performance 217
13. Gijs Huisman (UT), Social Touch Technology - Extending the reach of social touch through haptic technology
14. Shoshannah Tekofsky, You Are Who You Play You Are: Modelling Player Traits from Video Game Behavior
15. Peter Berck, Memory-Based Text Correction 16. Aleksandr Chuklin, Understanding and Modeling
Users of Modern Search Engines 17. Daniel Dimov, Crowdsourced Online Dispute
Resolution 18. Wilma Latuny, The Power of Facial Expressions 19. Jeroen Vuurens (TUD) Proximity of Terms, Texts
and Semantic Vectors in Information Retrieval 20. Mohammad bashir Sedighi (TUD) Fostering
Engagement in Knowledge Sharing: The Role of Perceived Benefits, Costs and Visibility
21. Jeroen Linssen (UT) Meta Matters in Interactive Storytelling and Serious Gaming (A Play on Worlds)
22. Sara Magliacane (VU) Logics for causal inference under uncertainty
23. David Graus (UVA) Entities of Interest--- Discovery in Digital Traces
24. Chang Wang (TUD) Use of Affordances for Efficient Robot Learning
25. Veruska Zamborlini (VU) Knowledge Representation for Clinical Guidelines, with applications to Multimorbidity Analysis and Literature Search
26. Merel Jung (UT) Socially intelligent robots that understand and respond to human touch
27. Michiel Joosse (UT) Investigating Positioning and Gaze Behaviors of Social Robots: People's Preferences, Perceptions and Behavior
28. John Klein (VU) Architecture Practices for Complex Contexts
29. Adel Alhuraibi (UVT), From IT Business Strategic Alignment to Performance: A Moderated Mediation Model of Social Innovation and Enterprise Governance of IT

218
This page is intentionally left blank
219
TICC Ph.D. Series
1. Pashiera Barkhuysen, Audiovisual prosody in interaction (2008)
2. Ben Torben-Nielsen, Dendritic morphology: Function shapes structure (2008)
3. Hans Stol, A framework for evidence-based policy making using IT (2009)
4. Jeroen Geertzen, Dialogue act recognition and prediction (2009)
5. Sander Canisius, Structured prediction for natural language processing (2009)
6. Fritz Reul, New architectures in computer chess (2009)
7. Laurens van der Maaten, Feature extraction from visual data (2009)
8. Stephan Raaijmakers, Multinomial language learning (2009)
9. Igor Berezhnoy, Digital analysis of paintings (2009)
10. Toine Bogers, Recommender systems for social bookmarking (2009)
11. Sander Bakkes, Rapid adaption of video games (2010)
12. Maria Mos, Complex lexical items (2010) 13. Marieke van Erp, Accessing natural history:
Discoveries in data cleaning, structuring, and retrieval (2010)
14. Edwin Commandeur, Implicit causality and implicit consequentiality in language comprehension (2010)
15. Bart Bogaert, Cloud content contention (2011)
16. Xiaoyu Mao, Airport under control (2011) 17. Olga Petukhova, Multidimensional dialogue
modelling (2011) 18. Lisette Mol, Language in the hands (2011) 19. Herman Stehouwer, Statistical language
models for alternative sequence selection (2011)
20. Terry Kakeeto-Aelen, Relationship marketing for SMEs in Uganda (2012)
21. Suleman Shahid, Fun & face: Exploring non-verbal expressions of emotion during playful interactions (2012)
22. Thijs Vis, Intelligence, politie en veiligheidsdienst: Verenigbare grootheden? (2012)
23. Nancy Pascall, Engendering technology empowering women Uganda (2012)
24. Agus Gunawan, Information access for SMEs in Indonesia (2012)
25. Giel van Lankveld, Quantifying individual player differences (2013)
26. Sander Wubben, Text-to-text generation using monolingual machine translation (2013)
27. Jeroen Janssens, Outlier selection and one-class classification (2013)
28. Martijn Balsters, Expression and perception of emotions: The case of depression, sadness, and fear (2013)
29. Lisanne van Weelden, Metaphor in good shape (2013)
30. Ruud Koolen, Need I say more? On overspecification in definite reference (2013)
31. Douglas Mastin, Exploring infant engagement, language socialization and vocabulary development: A study of rural and urban communities in Mozambique (2013)
32. Philip Jackson, Toward human-level artificial intelligence: Representation and computation of meaning in natural language (2014)
33. Jorrig Vogels, Referential choices in language production: The role of accessibility (2014)
34. Peter de Kock, Anticipating criminal behaviour (2014)
35. Constantijn Kaland, Prosodic marking of semantic contrasts: Do speaker adapt to addresses? (2014)
36. Pauline Meesters, Intelligent Blauw (2014) 37. Jasmina Maric, Web communities,
immigration and social capital (2014)
38. Mandy Visser, Better use your head: How people learn to signal emotions in social contexts (2015)
39. Sterling Hutchinson, How symbolic and embodied representations work in concert (2015)
40. Marieke Hoetjes, Talking hands: Reference in speech, gesture and sign (2015)
41. Elisabeth Lubinga, Stop HIV/AIDS: Start talking? The effects of rhetorical figures in health messages on conversations among South African adolescents (2015)
42. Janet Bagorogoza, Knowledge management and high performance: The Uganda financial institutional models for HPO (2015)
43. Hans Westerbeek, Visual realism: Exploring effects on memory, language production, comprehension, and preference (2016)
44. Matje van de Camp, A link to the past: Constructing historical social networks from unstructured data (2016)
45. Annemarie Quispel, Data for all: How designers and laymen use and evaluate information visualizations (2016)
46. Rick Tillman, Language matters: the influence of language and language use on cognition (2016)
47. Ruud Mattheij, The eyes have it (2016) 48. Marten Pijl, Tracking of human motion
over time (2016)

220 TICC Ph.D. Series
49. Yevgen Matusevych, Learning constructions from bilingual exposure: Computational studies of argument structure acquisition(2016)
50. Karin van Nispen, What can people with aphasia communicate with their hands? A study of representation techniques in pantomime and co-speech gesture (2016)
51. Adriana Baltaretu, Speaking of landmarks. How visual information influences reference in spatial domains (2016)
52. Mohamed Abbadi Casanova 2, a domain specific language for general game development (2017)
53. Shoshannah Tekofsky, You are who you play you are: modelling player traits from video game behavior
54. Adel Alhuaribi, From IT Business Strategic Alignment to Performance: A moderated Mediation Model of Social Innovation and Enterprise Governance of IT (2017)