Tijuana River Valley Trash, Waste Tire and Sediment ... Tire and Sediment Characterization Study A...
21
Tijuana River Valley Trash, Tijuana River Valley Trash, Waste Tire and Sediment Waste Tire and Sediment Characterization Study Characterization Study A Status Update A Status Update Conducted by: URS Corporation Grants Sponsored by: California Integrated Waste Management Board (CIWMB) State Water Resources Control Board USIBWC Citizens Forum October 22, 2009, 6 - 8 p.m. International Boundary and Water Commission United States Section
Transcript of Tijuana River Valley Trash, Waste Tire and Sediment ... Tire and Sediment Characterization Study A...

Tijuana River Valley Trash, Tijuana River Valley Trash, Waste Tire and Sediment Waste Tire and Sediment Characterization StudyCharacterization Study
A Status UpdateA Status Update
Conducted by:URS Corporation
Grants Sponsored by:California Integrated Waste Management Board (CIWMB)State Water Resources Control Board
USIBWC Citizens ForumOctober 22, 2009, 6 - 8 p.m.
International Boundary and Water Commission United States Section
Scope of WorkScope of Work
•• Data ReviewData Review•• Aerial Photograph ReviewAerial Photograph Review•• Trash and Waste Tire SurveyTrash and Waste Tire Survey•• Test PitsTest Pits•• Soil BoringsSoil Borings•• Report of FindingsReport of Findings
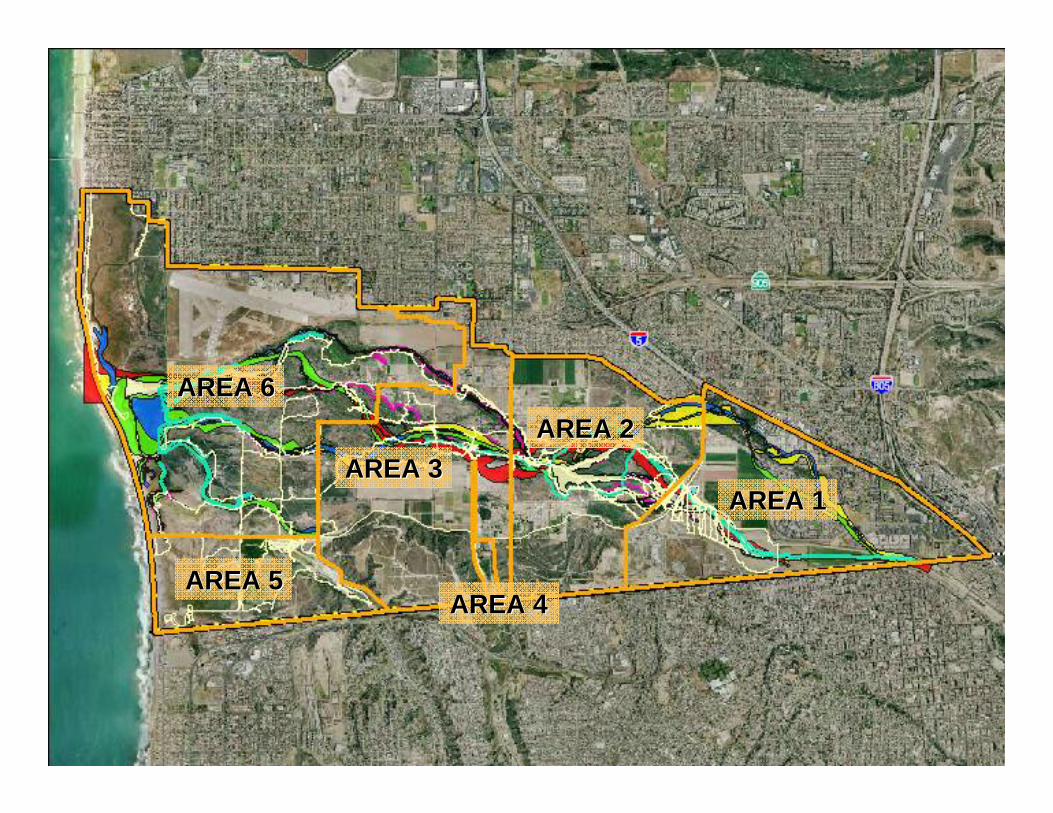
AREA 1AREA 1
AREA 4AREA 4
AREA 2AREA 2AREA 3AREA 3
AREA 6AREA 6
AREA 5AREA 5

Trash Survey MethodsTrash Survey Methods•• Divided valley into 6 areas, including state parks and Divided valley into 6 areas, including state parks and
federal landfederal land•• Conducted linear transects across open areasConducted linear transects across open areas•• Paralleled water courses/channels in heavily vegetated Paralleled water courses/channels in heavily vegetated
areasareas•• Based observations on City descriptorsBased observations on City descriptors•• Quantified by visually estimating % trash coverage of Quantified by visually estimating % trash coverage of
approximate areasapproximate areas•• Weighed trash in representative areasWeighed trash in representative areas•• Used CIWMB solid waste categoriesUsed CIWMB solid waste categories•• Integrated representative areas to estimate total trash Integrated representative areas to estimate total trash
volumes by typevolumes by type

Field Data CollectionField Data Collection
•• Data Collection Using GPSData Collection Using GPS
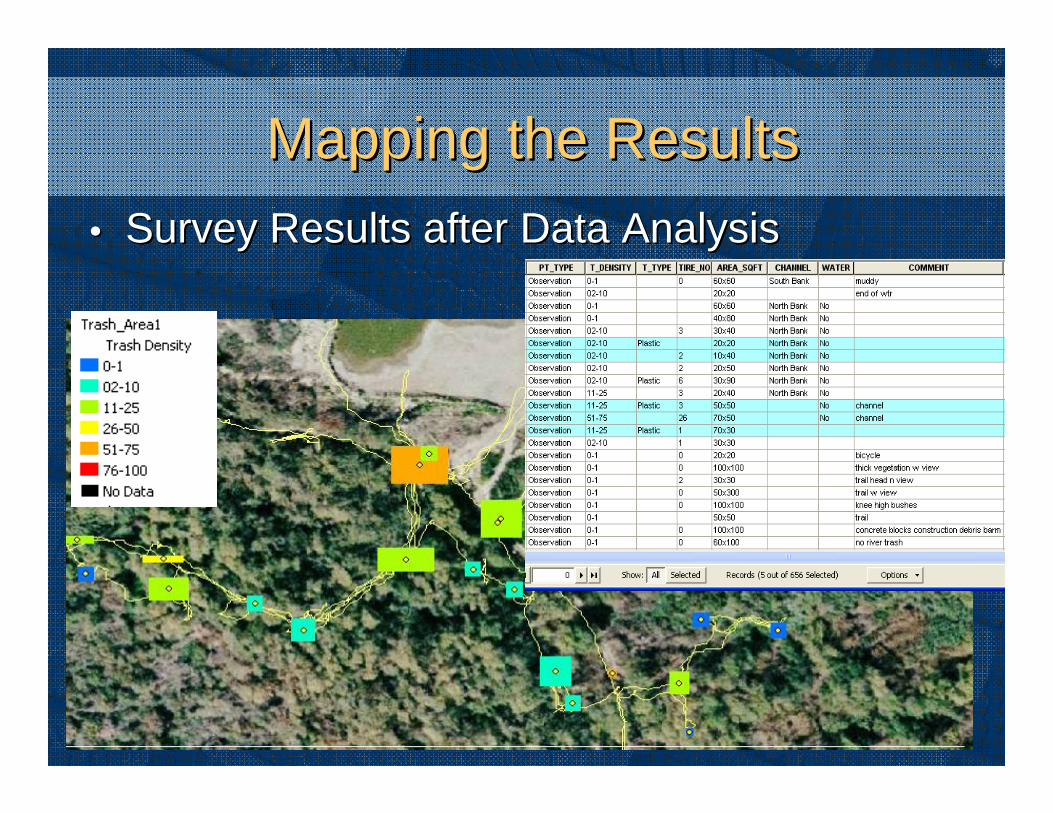
•• Survey Results after Data AnalysisSurvey Results after Data Analysis
Mapping the ResultsMapping the Results
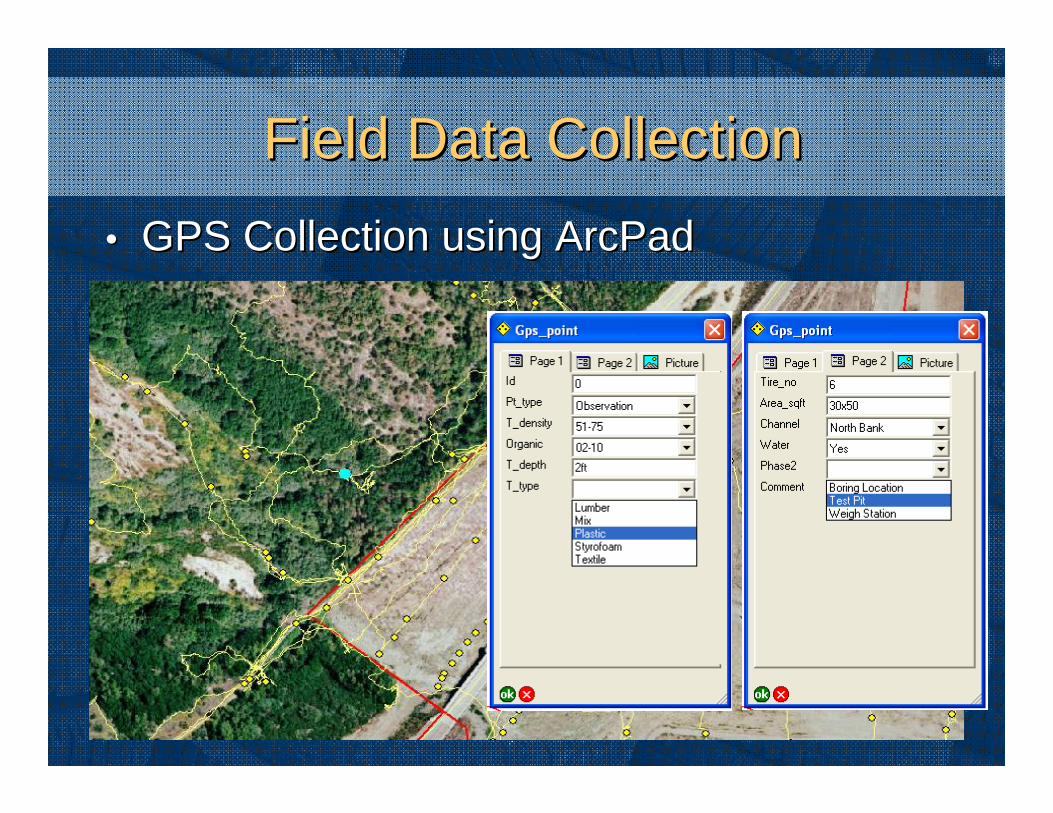
Field Data CollectionField Data Collection•• GPS Collection using ArcPadGPS Collection using ArcPad

Data Sharing ToolsData Sharing Tools•• ArcReader DemoArcReader Demo
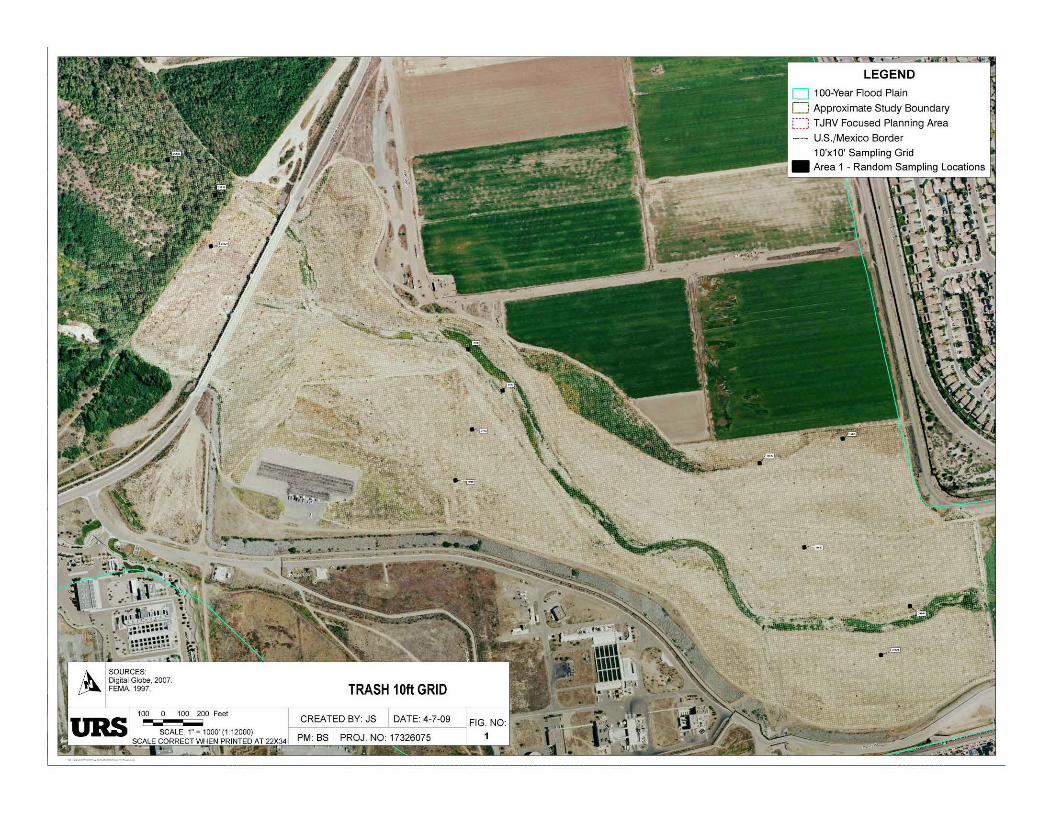
LEGEND 0 1 00-Year Flood Plain
D Approximate Study Boundary
CJ T JRV Focused Planning Area
---- U.S./Mexico Border
1 O'x1 0' Sampling Grid
• Area 1 - Random Sampling Locations

Trash Survey Methods: Trash Survey Methods: Weighing TrashWeighing Trash
Measure and flag test plot Collect trash
Sort trash by type Weigh trash by type

Cei/ID !Total Area Weight% of Total I I 7368 Accumulation Area Cell Area (sf) I 28196 Total lw/oTires lw/o Tires I I 150 Trash Coverage % I lw/o brenches stumps sediment
Weight (lbs) Waste Category Sub-Totals Weight% of Totals Totallbs Ave lbs/sf Paper Cardboard 1.2 0.044% 0.063% 0.081% 0 0.000 Paper 0 .6 0.022% 0.031% 0 .041% 0.6 0.004
I I
Glass Bottles 8.6 0.315% 0.449% 0.583% 0.7 0.005
Metal cans A I and Steel 8.3 0.304% 0.433% 0.563% 1 0.007 other 5 .6 0.205% 0.292",{, 0.380% 0 0.000
Electronics Brown Goods 0 0.000% 0.000% 0 .000% 0 0 .000 Computer related 0 0.000% 0.000% 0.000% 0 0.000
~ I
Plastic PETE 72.8 2.666% 3.799% 4.936% 13.3 0.089 HOPE 60.4 2.212% 3.152",{, 4.095% 8.6 0.057 Durable Plastic 117.3 4.295% 6.121% 7.953% 10.4 0.069 Remainder/ Composite 169 6.188% 8.820% 11.458% 12.1 0.081 -Total Plastic 419.5 15.361% 21.892% 28.441% 44.4 0.296
I Other Organic Leaves/Grass/Sed 270.1 9.890% 14.096% 16.5 0.110 Branches Stumps 171 .1 6.265% 8.929% 25.4 0.169 Textiles 79.8 2.922% 4.164% 5 .41 0% 3.1 0.021 Carpet 2.3 0.084% 0.120% 0.156% 0 0.000 food
Construction I Demo! Concrete Asphalt Lumber 477.4 17.481% 24.914% 32.366% 31 0 .207
Ho usehold Haz Wast 1.3 0.048% 0.068% 0.088% 1.2 0.008
Special Waste Tires (lbs) 814.8 29.835% 0 0.000 Bulky Items 50.8 1.860% 2.651% 3.444% 0 0.000 Other 0.1 0.004% 0.005% 0 .007% 0.1 0.001
Total Weight 124 wlo Tires 124 0.827
w/o Tires, LG& sed
Total Trash Weight: 2731 100.000% 100.000% 100.000% ash Weight w /o Tires: 1916.2 es, Stumps Sediment: 1475
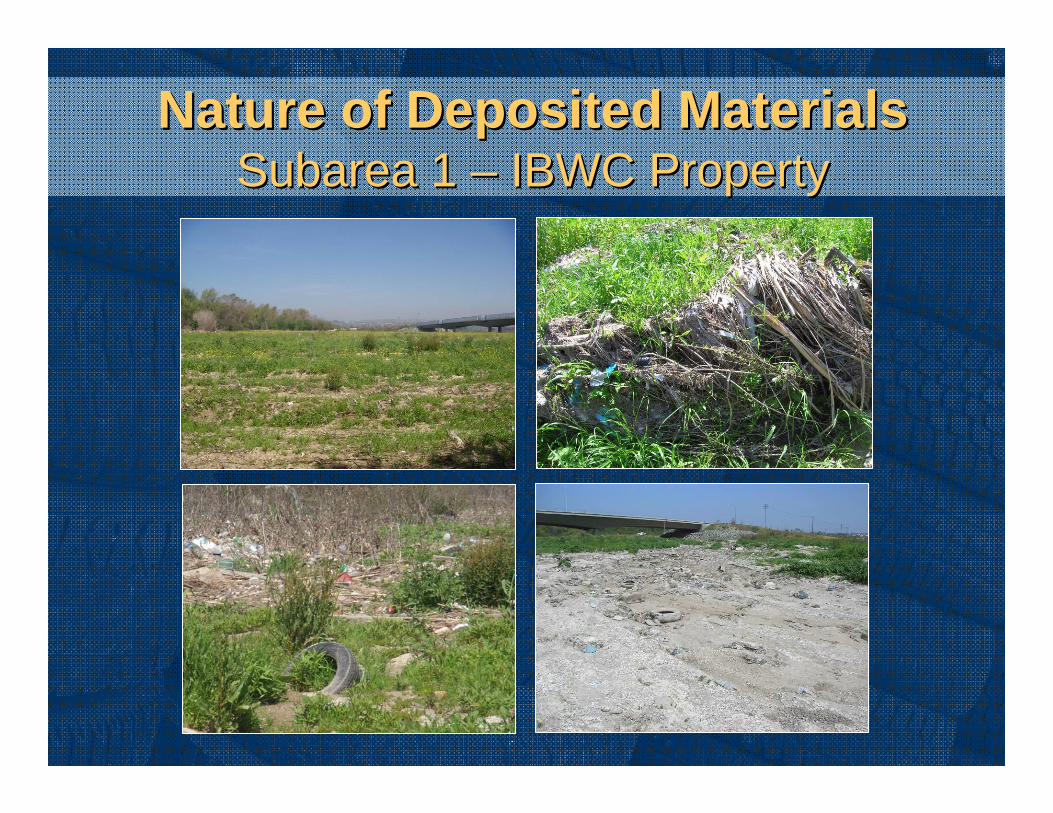
Nature of Deposited MaterialsNature of Deposited MaterialsSubarea 1 Subarea 1 –– IBWC PropertyIBWC Property

Nature of Deposited MaterialsNature of Deposited MaterialsSubarea 2 Subarea 2 –– DairymartDairymart to Hollisterto Hollister
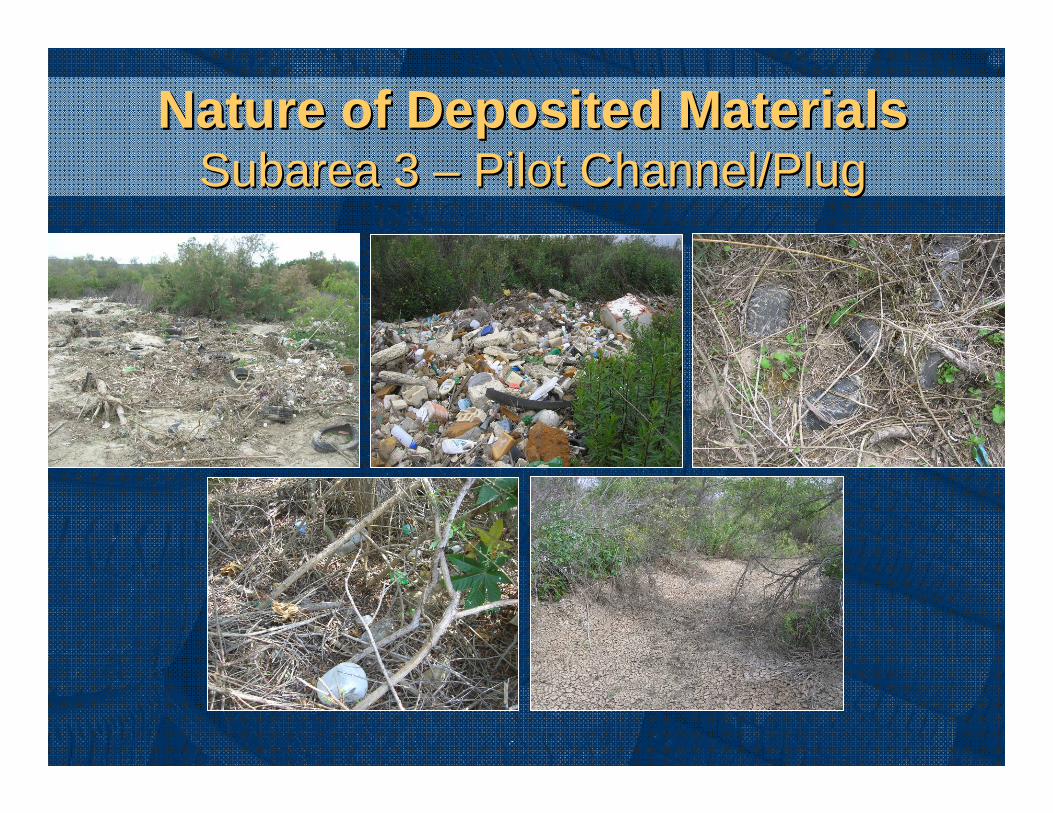
Nature of Deposited MaterialsNature of Deposited MaterialsSubarea 3 Subarea 3 –– Pilot Channel/PlugPilot Channel/Plug
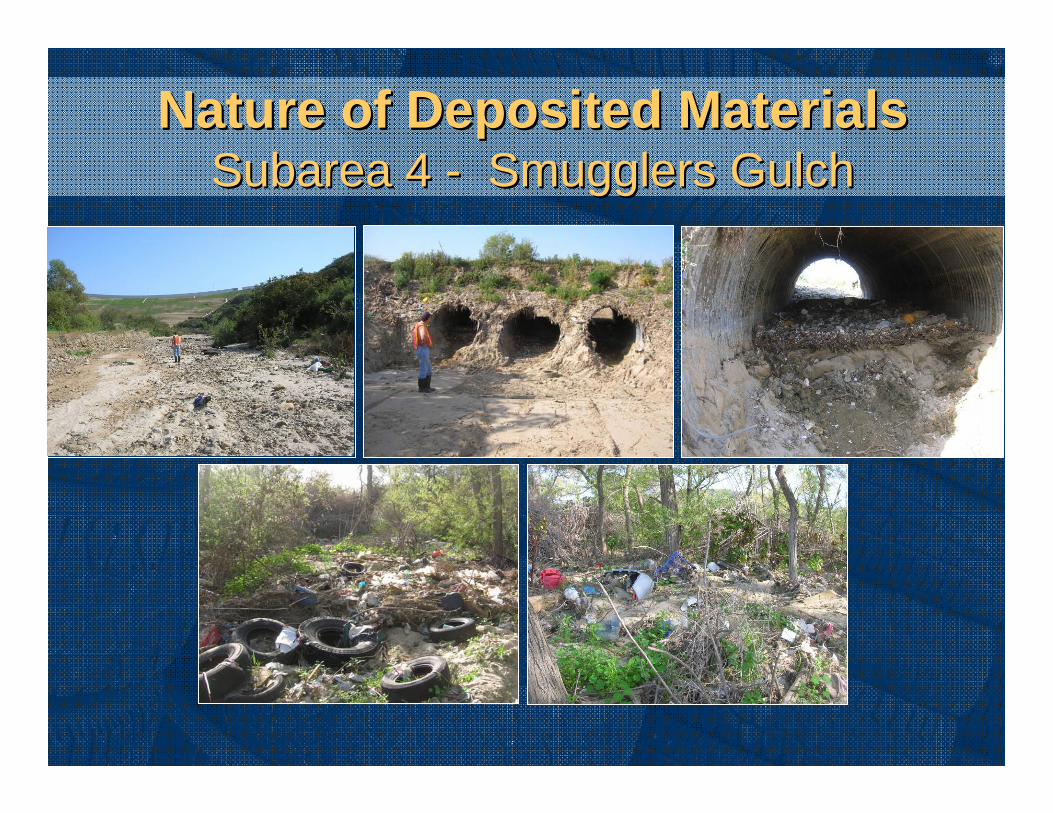
Nature of Deposited MaterialsNature of Deposited MaterialsSubarea 4 Subarea 4 -- Smugglers GulchSmugglers Gulch

Nature of Deposited MaterialsNature of Deposited MaterialsSubarea 5 Subarea 5 –– Goat CanyonGoat Canyon
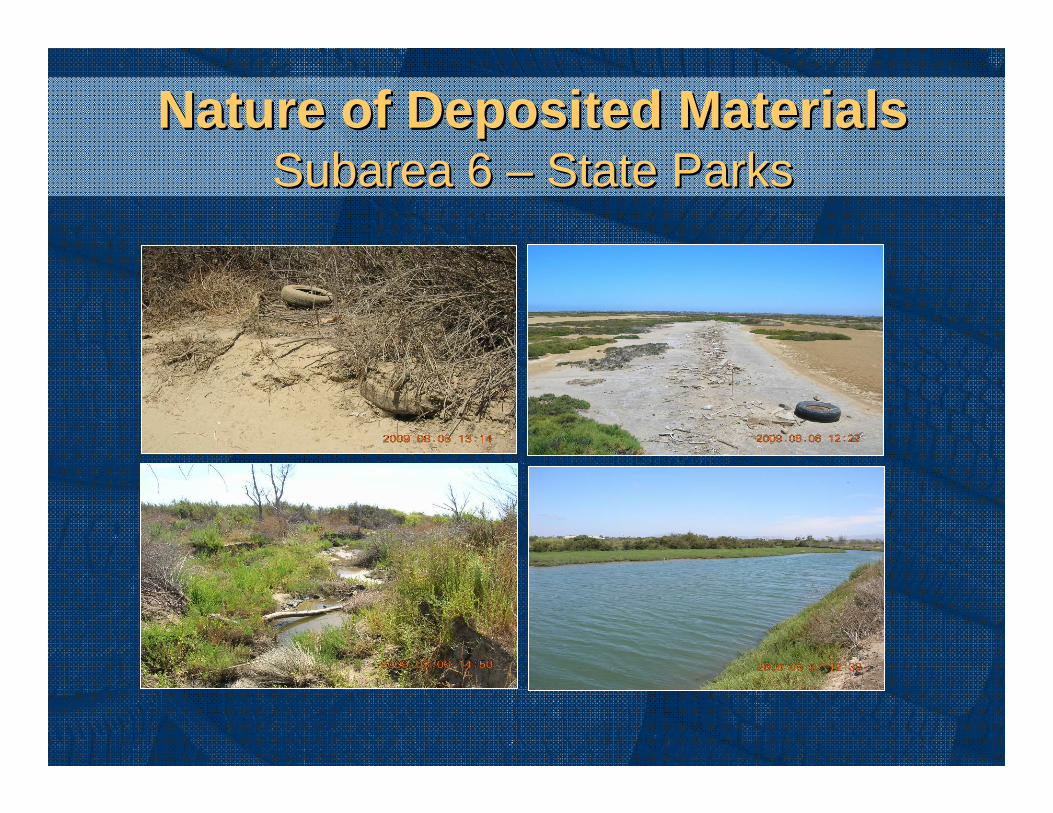
Nature of Deposited MaterialsNature of Deposited MaterialsSubarea 6 Subarea 6 –– State ParksState Parks

Test Pits and BoringsTest Pits and Borings
•• Excavated over 40 test pitsExcavated over 40 test pits•• Observed presence of trashObserved presence of trash•• Collected soil samples for chemical analysisCollected soil samples for chemical analysis•• Analyzed for constituents of potential concern:Analyzed for constituents of potential concern:
–– MetalsMetals–– Hydrocarbons Hydrocarbons –– pesticides, dioxinspesticides, dioxins
•• Advanced 10 boringsAdvanced 10 borings•• Collected samples for grainCollected samples for grain--size and plasticitysize and plasticity
Some Preliminary FindingsSome Preliminary Findings
•• Up to 12 feet of accumulated sediment found Up to 12 feet of accumulated sediment found in the plug areain the plug area
•• About 5 feet sediment east of About 5 feet sediment east of DairymartDairymartBridgeBridge
•• Sediment is primarily sand with clay lensesSediment is primarily sand with clay lenses•• Few samples with trace levels of chemicalsFew samples with trace levels of chemicals•• Little trash observed in the sedimentLittle trash observed in the sediment

WhatWhat’’s Next?s Next?
•• Evaluate analytical and grainEvaluate analytical and grain--size datasize data•• Issue Report of Findings (December)Issue Report of Findings (December)•• Use findings as basis for:Use findings as basis for:
–– Trash cleanupsTrash cleanups–– Sediment removals/cleanupsSediment removals/cleanups–– Sand reuse options Sand reuse options –– Preliminary engineering design for trash Preliminary engineering design for trash
collection devices in the valleycollection devices in the valley

WhatWhat’’s Next?s Next?Current Trash Capture BMP Status• Review of existing trash and sediment loading information
(completed)• Preliminary conceptual design options of trash capture BMPs
(completed)• Capital and operation and maintenance costs for several design
options have been estimated
Next steps• Perform detailed hydrological/hydraulic analysis for main river and
major tributaries to TJ River Valley• Refine trash and sediment loading data to develop BMP sizing
criteria• Develop design plans for trash capture BMPs and/or sediment
basins and identify potential locations for BMPs and O&M infrastructure