Tide-modulated ice flow variations drive seismicity near ...
10
Instructions for use Title Tide-modulated ice flow variations drive seismicity near the calving front of Bowdoin Glacier, Greenland Author(s) Podolskiy, Evgeny A.; Sugiyama, Shin; Funk, Martin; Walter, Fabian; Genco, Riccardo; Tsutaki, Shun; Minowa, Masahiro; Ripepe, Maurizio Citation Geophysical research letters, 43(5), 2036-2044 https://doi.org/10.1002/2016GL067743 Issue Date 2016-03-16 Doc URL http://hdl.handle.net/2115/61471 Rights ©2016. The Authors. Tide-modulated ice flow variations drive seismicity near the calving front of Bowdoin Glacier, Greenland, Geophys. Res. Lett.,43, 2036-2044, doi:10.1002/2016GL067743. Rights(URL) http://creativecommons.org/licenses/by-nc-nd/4.0/ Type article File Information Podolskiy_et_al-2016-Geophysical_Research_Letters.pdf Hokkaido University Collection of Scholarly and Academic Papers : HUSCAP
Transcript of Tide-modulated ice flow variations drive seismicity near ...

Instructions for use
Title Tide-modulated ice flow variations drive seismicity near the calving front of Bowdoin Glacier, Greenland
Author(s) Podolskiy, Evgeny A.; Sugiyama, Shin; Funk, Martin; Walter, Fabian; Genco, Riccardo; Tsutaki, Shun; Minowa,Masahiro; Ripepe, Maurizio
Citation Geophysical research letters, 43(5), 2036-2044https://doi.org/10.1002/2016GL067743
Issue Date 2016-03-16
Doc URL http://hdl.handle.net/2115/61471
Rights ©2016. The Authors. Tide-modulated ice flow variations drive seismicity near the calving front of Bowdoin Glacier,Greenland, Geophys. Res. Lett.,43, 2036-2044, doi:10.1002/2016GL067743.
Rights(URL) http://creativecommons.org/licenses/by-nc-nd/4.0/
Type article
File Information Podolskiy_et_al-2016-Geophysical_Research_Letters.pdf
Hokkaido University Collection of Scholarly and Academic Papers : HUSCAP
Geophysical Research Letters
Tide-modulated ice flow variations drive seismicity nearthe calving front of Bowdoin Glacier, GreenlandEvgeny A. Podolskiy1,2, Shin Sugiyama1, Martin Funk3, Fabian Walter3, Riccardo Genco4,Shun Tsutaki1,5, Masahiro Minowa1, and Maurizio Ripepe4
1Institute of Low Temperature Science, Hokkaido University, Sapporo, Japan, 2Now at Arctic Research Center, HokkaidoUniversity, Sapporo, Japan, 3Laboratory of Hydraulics, Hydrology and Glaciology, ETH Zürich, Zürich, Switzerland,4Dipartimento di Scienze della Terra, Università di Firenze, Florence, Italy, 5Arctic Environment Research Center, NationalInstitute of Polar Research, Tokyo, Japan
Abstract Glacier microseismicity is a promising tool to study glacier dynamics. However, physicalprocesses connecting seismic signals and ice dynamics are not clearly understood at present. Particularly,the relationship between tide-modulated seismicity and dynamics of calving glaciers remains elusive.Here we analyze records from an on-ice seismometer placed 250 m from the calving front of BowdoinGlacier, Greenland. Using high-frequency glacier flow speed measurements, we show that the microseismicactivity is related to strain rate variations. The seismic activity correlates with longitudinal stretchingmeasured at the glacier surface. Both higher melt rates and falling tides accelerate glacier motion andincrease longitudinal stretching. Long-term microseismic monitoring could therefore provide insights onhow a calving glacier’s force balance and flow regime react to changes at the ice-ocean interface.
1. Introduction
Recent studies have shown that tides play an important role in modulation of earthquake and icequake phe-nomena. Timing of large-magnitude shear-slip processes related to slow earthquakes [Ide and Tanaka, 2014]and ice stream stick-slip [Winberry et al., 2009; Pratt et al., 2014] have been reported to depend on the sealevel variation phase, and this has important implications for forecasting earthquake reoccurrence and glacierdynamics. On a smaller scale, tide-induced patterns of microseismic cryogenic activity have been found to berelated to sea ice cracking along coastal zones of Antarctica [Kaminuma, 1994] or to ice shelf bending neargrounding areas [Anandakrishnan and Alley, 1997a; Barruol et al., 2013; Hammer et al., 2015].
Tides may indirectly control more than just glacial basal microseismicity [Anandakrishnan and Alley, 1997a;Zoet et al., 2012]; e.g., seismic emissions from glacier calving in Svalbard and Alaska were recently shown tocorrelate with low tides [Koubova, 2015; Bartholomaus et al., 2015a]. However, tidal effects appear to have noinfluence on calving statistics at Columbia Glacier [O’Neel et al., 2007], on rift propagation seismicity on theAmery Ice Shelf [Bassis et al., 2008], or on the microseismicity of asperities under Rutford Ice Stream [Smithet al., 2015].
Tide-induced cryoseismicity has been discovered in only a few cryospheric environments, and there has beenlittle observational support for proposed mechanisms [von der Osten-Woldenburg, 1990; Adalgeirsdòttir et al.,2008; Barruol et al., 2013]. Moreover, to our knowledge, tide-induced cryoseismicity has not been observed inGreenland, the second largest ice-covered area worldwide, where recent dramatic recession of outlet glaciersis a key driver for accelerated ice sheet mass loss [Khan et al., 2015; Pritchard et al., 2009]. All previous investi-gations of tide-induced cryoseismicity have been based on seismic observations of increased activity (mainlyduring falling or rising tides) near grounding lines in Antarctica. The corresponding interpretations includedthe vertical motion of an ice shelf (or bending), resettlement of a glacier on a nunatak’s lateral margin, glacierlateral flexure, hydraulic fracturing at a bottom of a glacier, and force balance of ice stream basal condi-tions (see the summary in Table S1 in the supporting information). These examples demonstrate that thereis no universal explanation and that tides may drive icequakes of different origin through a variety of mech-anisms (Table S1). However, without clarification of the source mechanisms, it would be unreliable to useseismic records as proxies for climate- or ocean-induced changes to glaciers. For example, there is ongoingdiscussion concerning what other types of icequakes, such as those from calving seismicity, really represent
RESEARCH LETTER10.1002/2016GL067743
Key Points:• Near-source records of seismicity at a
calving front• First evidence of clear tidal
modulation of cryoseismic activityin Greenland
• Variation in longitudinal extensionalstrain rates drives microseismicity
Supporting Information:• Figure S1 and Table S1
Correspondence to:E. A. Podolskiy,[email protected]
Citation:Podolskiy, E. A., S. Sugiyama, M. Funk,F. Walter, R. Genco, S. Tsutaki,M. Minowa, and M. Ripepe (2016),Tide-modulated ice flow variationsdrive seismicity near the calvingfront of Bowdoin Glacier, Greenland,Geophys. Res. Lett., 43, 2036–2044,doi:10.1002/2016GL067743.
Received 17 JAN 2016
Accepted 13 FEB 2016
Accepted article online 18 FEB 2016
Published online 8 MAR 2016
©2016. The Authors.This is an open access article under theterms of the Creative CommonsAttribution-NonCommercial-NoDerivsLicense, which permits use anddistribution in any medium, providedthe original work is properly cited, theuse is non-commercial and nomodifications or adaptations are made.
PODOLSKIY ET AL. MICROSEISMICITY OF CALVING FRONT 2036

Geophysical Research Letters 10.1002/2016GL067743
Figure 1. (a) Study site location in Greenland. (b) Bowdoin Glacier monitoring network, with locations of key stationsand other instruments. (c) Orthophoto taken by a unmanned aerial vehicle on 11 July 2015 (courtesy ofY. S. V. Weidmann and G. Jouvet, ETH Zürich shows a magnified view of the near-front seismic array, at the location ofseismic station “ic2” (77.6788∘N, 68.6032∘W).
[Bartholomaus et al., 2012]. Similarly, continuous microseismic signals have only recently been linked tosubglacial discharge [Bartholomaus et al., 2015b].
In this paper, we report a distinct pattern of tide-induced microseismicity in the Bowdoin Glacier front, north-western Greenland (Figure 1a). This glacier is known to exhibit a tide-modulated flow velocity, with daily peaksin horizontal speed that occur in conjunction with low tides [Sugiyama et al., 2015]. Such behavior is similar,for example, to Bindschadler Ice Stream [Anandakrishnan et al., 2003] or David Glacier in Antarctica, which wasfound to move partly via tidally modulated stick-slip events [Zoet et al., 2012]. Here we present evidence show-ing that Bowdoin’s seismic events are strongly correlated with the rate of longitudinal ice stretching, which inturn is controlled by air temperature variations and oscillating tide height.
2. Study Site and Methods
The 3 km wide Bowdoin Glacier flows from the Greenland ice sheet into the Bowdoin Fjord (77∘41’N,68∘35’W). The ice thickness is 280 m, and horizontal ice velocity reaches 1.4–2.6 m/d near the glacier front[Sugiyama et al., 2015]. The glacier front position was relatively stable since the end of the nineteenth century[Chamberlin, 1897] until the end of the twentieth century, but its speed has doubled since 2000, and it hasbeen rapidly retreating since 2008, when the terminus retreated from an ocean bed bump [Sugiyama et al.,2015]. Recent observations also show that the dynamics of Bowdoin Glacier are very sensitive to small pertur-bations in air temperature, precipitation, and tides [Sugiyama et al., 2015]. This may be an important differencewith other calving glaciers; for instance, Podrasky et al. [2014] found a step increase in ice speed near theterminus of the Jakobshavn Isbræ ice stream, Western Greenland, after a large calving event. Also, before wecompare our findings with other glaciers, we note that Bowdoin is rather small, thin, and narrow and doesnot have a large floating tongue, like at some previously studied Antarctic glaciers, which may be 30 km wide,1.2 km thick, and extend 150 km into an ocean [Barruol et al., 2013].
A seismic array consisting of four on-ice stations was installed during 7–19 July 2015 at the central part of theBowdoin Glacier near the calving front. These stations were installed as part of a larger network established for
PODOLSKIY ET AL. MICROSEISMICITY OF CALVING FRONT 2037

Geophysical Research Letters 10.1002/2016GL067743
monitoring of the glacier front dynamics (Figure 1b). Lennartz LE-3-D short- and long-period seismometers,powered by batteries and solar panels and connected to Taurus and Güralp digitizers, were placed in 30 cmdeep pits, protected with fabric and arranged in a triangle-shaped array (with a distance between stations ofabout 150 m). These instruments were located approximately 250 m from the glacier front, where icebergsare discharged into the fjord. The marginal ice cliff at the calving front was 20–30 m high above the water.Stations were visited daily for level/orientation checks and data backup. Installation of sensors so close to thecalving front allows for a unique data set.
Two dual-frequency Global Positioning System stations (GPS; GEM-1, Global Navigation Satellite Systems Inc.)installed on ice (B1501 and B1502 in Figure 1b), with a base station anchored on rock, continuously measuredice displacement every 15 min with a horizontal precision of several millimeters. An automatic weather station(AWS; Vaisala WXT520 and Campbell CR1000) was operated near the base station with output rates of 5 min(Figure 1b). More details of the GPS and AWS measurements are described in Sugiyama et al. [2015].
Here we focus on records from the seismic station “ic2” (acquisition frequency 500 Hz; eigenfrequency 1 Hz;flat response between 1 and 100 Hz) since it had the longest noninterrupted operation (between ∼ 18:00, 7July and 13:00, 19 July 2015 UTC; with several maintenance downtimes rarely exceeding 4 min). Data fromother short-period seismometers were similar to each other due to the proximity of the stations. Tide mea-surements from Pituffik station in Thule were retrieved from the Global Sea Level Observing System network.Tide levels were also directly measured near the calving front and were found to be very similar to the Thulerecord. Given that tide levels near the glacier are complicated by calving-generated tsunamis, these data arenot shown and will be published elsewhere.
Using the classic seismological approach (“short-term averaging/long-term averaging,” threshold triggeralgorithm) [e.g., Barruol et al., 2013], we analyzed the temporal variability of microseismic events, which werecontinuously recorded over a period of 2 weeks.
3. Results3.1. Icequake Duration and MagnitudeMost icequakes were detected at all stations. They tend to correspond to impulsive signals filling a widefrequency band up to Nyquist frequency of 250 Hz (e.g., Figure 2b). Clear P and S phases could not be dis-tinguished, and thus, source distances could not be derived from the time delay between these two seismicphases. For stations in the middle of a heavily crevassed glacier front, it is reasonable to assume that the mostcommon and strong signals are produced by surface cracks [Mikesell et al., 2012].
Using similar trigger properties to Barruol et al. [2013], the number of detected events is more than an order ofmagnitude larger than in previous studies of Antarctic ice shelves, exceeding 100,000 in 2 weeks. For example,previous studies found only up to 20–100 events per hour [Adalgeirsdòttir et al., 2008; Barruol et al., 2013;Hammer et al., 2015] compared with the 600 events per hour in this study. Similarly high numbers of eventswere reported in the ablation zone of a lake-terminating Bering Glacier by West et al. [2010].
Of the icequakes detected at “ic2”, 85% had durations, d, of less than 1.0 s. These correspond to negative val-ues of duration-magnitudes Md (where Md ≈ −0.9 + 2log(d)) [Barruol et al., 2013] and are therefore expectedto have originated within a few kilometers of the station (Figures 2c and 2d). Similar to Barruol et al. [2013], wefind that the most frequently observed duration was 0.4 s. A drop in occurrence frequency below this dura-tion is likely to be nonphysical [e.g., Smith et al., 2015] and originates from fewer detections of weaker events(the equivalent completeness magnitude Mdc ≈ −1.5). Signals of comparable durations (0.1–1 s) were alsoobserved by Barruol et al. [2013] and previously interpreted as crevasse openings [Métaxian, 2003; Pomeroyet al., 2013], basal and surface cracks [Dalban Canassy et al., 2013], or intermediate [Helmstetter et al., 2015] andbasal icequakes [Walter et al., 2008].
Magnitude distribution b values (0.87–2.2) are similar or higher than the value of 0.86 found by Barruol et al.[2013], meaning that a larger number of weaker events were detected in the present study (b value rangeis due to the sensitivity of fits to the lowest cutoff magnitude; Figure 2d). This result is likely due to (1) thenear-source locations of short-period seismometers, (2) the shorter recording periods, or (3) differences inglacier dynamics (with some repeaters causing a deviation from the classical logarithmic Gutenberg-Richterrelationship).
PODOLSKIY ET AL. MICROSEISMICITY OF CALVING FRONT 2038

Geophysical Research Letters 10.1002/2016GL067743
Figure 2. (a) Example of a raw seismogram from ic2 station (vertical component), showing corresponding frequencydata on (b) 13 July 2015, 15:10:00–15:35:00 UTC. (c and d) Distribution of icequake duration (0.1 s bins) and durationmagnitude, Md (0.04 magnitude bins), for about 100,000 events identified at ic2 for a 2 week recording period. Dashedand solid lines show logarithmic fits with two different high-pass magnitude thresholds (>−1.42) and (>−0.22), yieldingR2 = 0.97 and 0.89, respectively. Corresponding b values are 0.87 and 2.19, respectively.
The b values show a wide range, from 1 to 3.5 for surface and deep events, respectively [Dalban Canassy et al.,2013; Helmstetter et al., 2015]. Along with the high sensitivity of fits to the lowest cutoff magnitude of eventsat the low-magnitude end of the spectrum (not discussed by Barruol et al. [2013]), this does not allow us tobetter identify dominant processes solely by comparing b values with previous studies (Figure 2d).
3.2. Temporal Icequake Activity Patterns and TidesThe results show a clear double-peak diurnal oscillation in the number of events per hour (Figure 3a). A com-parison with the time series of tide height, which reached an amplitude of around 1 m, shows that maximumseismic activity occurred during falling tides or close to low tides (Figure 3b).
PODOLSKIY ET AL. MICROSEISMICITY OF CALVING FRONT 2039

Geophysical Research Letters 10.1002/2016GL067743
Figure 3. (a) Number of detected events per hour at station ic2 during the period 7–19 July 2015. Solid curve showsfitted Fourier series with eight terms and R2= 0.54. (b) Corresponding tide height observed at Pituffik station, Thule(latitude 76.5434∘, longitude −68.8626∘; 126.5 km from the calving front). Neap/spring tides took place around 9/17 July2015, respectively.
There are some major differences between the present data and previously reported tide-modulated ice-quakes in the Mertz Glacier, East Antarctica [Barruol et al., 2013]. The unique near-front location of instrumentson ice in this study allows us to observe that seismic activity does not cease at low tidal velocities (i.e.,<0.1 m/h). Contrary to the results reported for the Mertz Glacier, hundreds of events were recorded per hourduring such periods. This feature may be related to the location of the considered station at the most dynamicpart of the glacier, and, as it will be shown in the next section, to an extensional flow regime of the glacier.
The relatively short duration of our campaign makes it difficult to estimate the periodic effects of long-termtidal cycles, such as neap or spring tides [e.g., Barruol et al., 2013]. Therefore, after recognizing the double-peakdiurnal pattern (Figure 3), we proceed by directly comparing all available time series instead of performingharmonic analysis. We also note that remarkably quiet wind conditions (median wind speed was 0.9 m/s)reduce extra sources of noise, which could interfere with detections [Hammer et al., 2015].
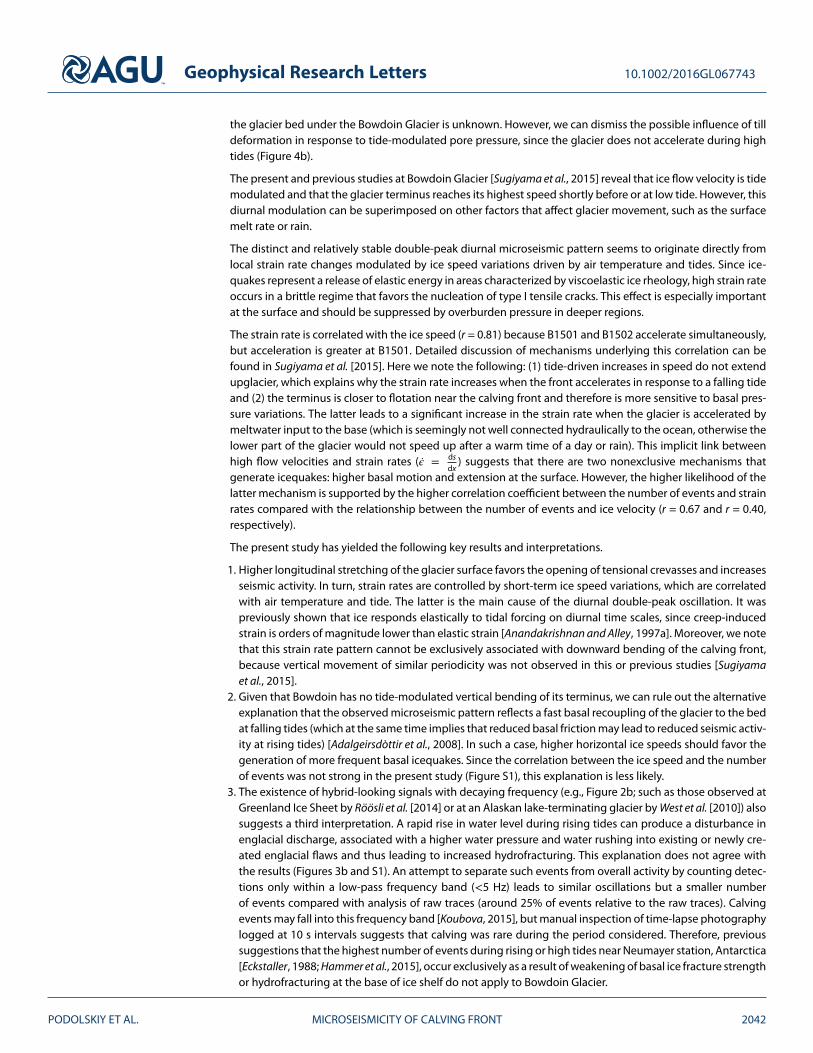
3.3. Glacier Dynamics and Other FactorsNo rain occurred during the 2015 field campaign, thus reducing a number of factors affecting ice speed.Horizontal ice velocity is strongly correlated with air temperature and hence surface melt rate (r = 0.67) andseems to lag air temperature by about 5 h. This is presumably due to the time necessary for meltwater toreach the subglacial environment and influence basal motion through reduced effective pressure (Figure 4a).Superimposed on this trend are diurnal variations in ice speed, which are also related to tides (ice acceleratesduring falling tides) (Figure 4b). These two factors both modulate ice speed as was observed in this andprevious campaigns [Sugiyama et al., 2015].
Microseismic patterns are only weakly correlated with ice velocity, but share seemingly concurrent timing ofpeaks (r = 0.40; Figure S1), and are not correlated with air temperature from AWS measurements (r = 0.17;Figure S1). In addition, microseismic patterns exhibit negative relationships with tide height and tide velocity(r = −0.49 and r = −0.35, respectively; Figure S1). This relationship is particularly persistent during the periodof maximum number of seismic emissions during falling tides (Figure S1).
Given that the ice front is moving faster than upstream sections of Bowdoin Glacier [Sugiyama et al., 2015],a longitudinal stretching flow regime is expected near the terminus area. For evaluating strain rate varia-tions of the terminus area, we extract hourly distance increments between two GPS stations (B1501 andB1502; Figure 1b). During the study period, the distance increased by 5 m (from an initial value of 1883 m)with absolute average extension rates of about 2 cm h−1, which is equivalent to strain rates of 1 × 10⁻⁵ h−1
(∼ 0.09 a−1). The highest correlation is found for the number of hourly seismic events and longitudinal strainrates (Figure 4c) (r = 0.67), which suggests that continuous microseismic activity is produced by a stretchingmechanism that was active throughout the study period.
PODOLSKIY ET AL. MICROSEISMICITY OF CALVING FRONT 2040
Geophysical Research Letters 10.1002/2016GL067743
Figure 4. Horizontal ice speed (measured near the seismic station ic2) and extension rates (between GPS stations B1501and B1502) are shown after locally weighted smoothing over a 1 h window. Air temperature from the AWS is shown as1 h averages. Associated correlation coefficients are indicated as “r”; all were statistically significant (p <0.05). Allparameters are shown as an anomaly, i.e., as deviation from the mean, a = x(t)−x̄
|x̄|.
Longitudinal and transverse stretching can be due to a number of factors. The magnitude and the signof longitudinal and transverse stretching upstream the calving front strongly depend on the shape of thebedrock topography. Given that the calving front remained relatively stationary during the course of theexperiment, this factor can be omitted. Since the strain rate is controlled by ice speed, the following approxi-mation can be applied. A multivariate regression model, using shifted air temperature anomalies, Ta(t−5), andtide height anomalies, h(t), as the main predictors of longitudinal strain rate anomalies, �̇�, and expressed as�̇� ≈ 0.16Ta(t−5) − 2.85×10⁻²h(t) (where air temperature is shifted by 5 h), explains only 38% of the variancein the observed hourly stretching record. This suggests that ice speed is controlled not only by temperatureand tide but other factors, such as lateral coupling with fjord walls, add extra variance.
4. Discussion on the Mechanisms of Icequakes
Previous work by Adalgeirsdòttir et al. [2008] reported a correlation between diurnal variations in ice velocityand microseismicity based on surface motion and seismic data sets separated by 7 years. This separation doesnot allow for any clear formulation of the relationship between glacier flow and microseismicity. Over a periodof weeks to months, Anandakrishnan and Alley [1997b] observed an anticorrelation between basal seismicityunder the stagnating Ice Stream C in Antarctica and its flow velocity, suggesting that water diversion at thebed may reduce the lubrication of sticky spots.
Several studies have reported correlations between a daily double-peak in microseismicity and diurnal tidalcycle for Antarctic marginal glaciers and ice shelves [Adalgeirsdòttir et al., 2008; Barruol et al., 2013]. In addi-tion, Anandakrishnan and Alley [1997a] demonstrated that basal microseismicity correlates with low tides asfar as 10 km inland from the grounding line. Surprisingly, Smith et al. [2015] did not observe this pattern in thesame area of Rutford Ice Stream, as earlier reported by Adalgeirsdòttir et al. [2008], suggesting that a differentmethod of analysis or changes in the dynamics of the area can produce variable results. The authors also didnot exclude a possibility that tidally modulated changes in till pore pressure did not affect mechanical proper-ties of stiffly consolidated till under sticky spots (which can cause ice stream velocity changes). The nature of
PODOLSKIY ET AL. MICROSEISMICITY OF CALVING FRONT 2041
Geophysical Research Letters 10.1002/2016GL067743
the glacier bed under the Bowdoin Glacier is unknown. However, we can dismiss the possible influence of tilldeformation in response to tide-modulated pore pressure, since the glacier does not accelerate during hightides (Figure 4b).
The present and previous studies at Bowdoin Glacier [Sugiyama et al., 2015] reveal that ice flow velocity is tidemodulated and that the glacier terminus reaches its highest speed shortly before or at low tide. However, thisdiurnal modulation can be superimposed on other factors that affect glacier movement, such as the surfacemelt rate or rain.
The distinct and relatively stable double-peak diurnal microseismic pattern seems to originate directly fromlocal strain rate changes modulated by ice speed variations driven by air temperature and tides. Since ice-quakes represent a release of elastic energy in areas characterized by viscoelastic ice rheology, high strain rateoccurs in a brittle regime that favors the nucleation of type I tensile cracks. This effect is especially importantat the surface and should be suppressed by overburden pressure in deeper regions.
The strain rate is correlated with the ice speed (r = 0.81) because B1501 and B1502 accelerate simultaneously,but acceleration is greater at B1501. Detailed discussion of mechanisms underlying this correlation can befound in Sugiyama et al. [2015]. Here we note the following: (1) tide-driven increases in speed do not extendupglacier, which explains why the strain rate increases when the front accelerates in response to a falling tideand (2) the terminus is closer to flotation near the calving front and therefore is more sensitive to basal pres-sure variations. The latter leads to a significant increase in the strain rate when the glacier is accelerated bymeltwater input to the base (which is seemingly not well connected hydraulically to the ocean, otherwise thelower part of the glacier would not speed up after a warm time of a day or rain). This implicit link betweenhigh flow velocities and strain rates (�̇� = ds
dx) suggests that there are two nonexclusive mechanisms that
generate icequakes: higher basal motion and extension at the surface. However, the higher likelihood of thelatter mechanism is supported by the higher correlation coefficient between the number of events and strainrates compared with the relationship between the number of events and ice velocity (r = 0.67 and r = 0.40,respectively).
The present study has yielded the following key results and interpretations.
1. Higher longitudinal stretching of the glacier surface favors the opening of tensional crevasses and increasesseismic activity. In turn, strain rates are controlled by short-term ice speed variations, which are correlatedwith air temperature and tide. The latter is the main cause of the diurnal double-peak oscillation. It waspreviously shown that ice responds elastically to tidal forcing on diurnal time scales, since creep-inducedstrain is orders of magnitude lower than elastic strain [Anandakrishnan and Alley, 1997a]. Moreover, we notethat this strain rate pattern cannot be exclusively associated with downward bending of the calving front,because vertical movement of similar periodicity was not observed in this or previous studies [Sugiyamaet al., 2015].
2. Given that Bowdoin has no tide-modulated vertical bending of its terminus, we can rule out the alternativeexplanation that the observed microseismic pattern reflects a fast basal recoupling of the glacier to the bedat falling tides (which at the same time implies that reduced basal friction may lead to reduced seismic activ-ity at rising tides) [Adalgeirsdòttir et al., 2008]. In such a case, higher horizontal ice speeds should favor thegeneration of more frequent basal icequakes. Since the correlation between the ice speed and the numberof events was not strong in the present study (Figure S1), this explanation is less likely.
3. The existence of hybrid-looking signals with decaying frequency (e.g., Figure 2b; such as those observed atGreenland Ice Sheet by Röösli et al. [2014] or at an Alaskan lake-terminating glacier by West et al. [2010]) alsosuggests a third interpretation. A rapid rise in water level during rising tides can produce a disturbance inenglacial discharge, associated with a higher water pressure and water rushing into existing or newly cre-ated englacial flaws and thus leading to increased hydrofracturing. This explanation does not agree withthe results (Figures 3b and S1). An attempt to separate such events from overall activity by counting detec-tions only within a low-pass frequency band (<5 Hz) leads to similar oscillations but a smaller numberof events compared with analysis of raw traces (around 25% of events relative to the raw traces). Calvingevents may fall into this frequency band [Koubova, 2015], but manual inspection of time-lapse photographylogged at 10 s intervals suggests that calving was rare during the period considered. Therefore, previoussuggestions that the highest number of events during rising or high tides near Neumayer station, Antarctica[Eckstaller, 1988; Hammer et al., 2015], occur exclusively as a result of weakening of basal ice fracture strengthor hydrofracturing at the base of ice shelf do not apply to Bowdoin Glacier.
PODOLSKIY ET AL. MICROSEISMICITY OF CALVING FRONT 2042

Geophysical Research Letters 10.1002/2016GL067743
5. Conclusion
In situ observations of the Bowdoin Glacier shed light onto the seemingly chaotic fracture mechanics of adifficult-to-access glacier calving front. Multiple mechanisms have been proposed to explain tide-modulatedicequakes (Table S1). However, detailed measurements of variations in glacier surface velocity have enabledus to narrow down the most likely controls on tide-modulated icequakes.
Here on example of the Bowdoin Glacier, we show for the first time that tide-modulated microseismicity canbe driven by strain rate variation. The strain rate corresponds to longitudinal stretching of the glacial surface inresponse to higher melt rates and falling tides; both of which accelerate the glacier and enhance the stretchingflow regime. The latter favors near-surface tensile crevasse openings. It still remains to be understood howuniversal this mechanism is at other sections of the glacier or at other glaciers, in particular, in Antarctica.Our observations do not rule out the possibility of tide-related vertical bending of ice shelves or glaciers withlarge floating tongues, which also may lead to icequakes [Barruol et al., 2013]. However, earlier and futureinterpretations need to be considered from a perspective of presented here mechanisms, because BowdoinGlacier is grounded, with no tide-induced vertical bending of the near-floating tongue yet always exhibitsmicroseismic activity due to continuous longitudinal stretching. This highlights the need for further studiesto clarify the locations and source mechanisms of icequakes and their relationship with ice dynamics.
Further analyses of the collected data set and event types through advanced array and discrimination algo-rithms [e.g., Hammer et al., 2015], as well as the integration of this data set with other records (e.g., from aninfrasound array and high-frequency time-lapse photography), would provide greater insights into calvingfront dynamics. Understanding of the latter is crucial for our ability to predict the future response of glaciersto oceanic and atmospheric forcings.
ReferencesAdalgeirsdòttir, G., A. M. Smith, T. Murray, M. A. King, K. Makinson, K. W. Nicholls, and A. E. Behar (2008), Tidal influence on Rutford Ice
Stream, West Antarctica: Observations of surface flow and basal processes from closely spaced GPS and passive seismic stations,J. Glaciol., 54, 715–724, doi:10.3189/002214308786570872.
Anandakrishnan, S., and R. B. Alley (1997a), Tidal forcing of basal seismicity of Ice Stream C, West Antarctica, observed far inland, J. Geophys.Res., 102(B7), 15,183–15,196.
Anandakrishnan, S., and R. B. Alley (1997b), Stagnation of Ice Stream C, West Antarctica by water piracy, Geophys. Res. Lett., 24(3), 265–268,doi:10.1029/96GL04016.
Anandakrishnan, S., D. Voigt, R. Alley, and M. King (2003), Ice Stream D flow speed is strongly modulated by the tide beneath the Ross IceShelf, Geophys. Res. Lett., 30(7), 1361, doi:10.1029/2002GLO16329.
Barruol, G., E. Cordier, J. Bascou, F. R. Fontaine, B. Legrésy, and L. Lescarmontier (2013), Tide-induced microseismicity in the Mertz glaciergrounding area, East Antarctica, Geophys. Res. Lett., 40, 5412–5416, doi:10.1002/2013GL057814.
Bartholomaus, T. C., C. F. Larsen, S. O’Neel, and M. E. West (2012), Calving seismicity from iceberg-sea surface interactions, J. Geophys. Res.,117, F04029, doi:10.1029/2012JF002513.
Bartholomaus, T. C., C. F. Larsen, M. E. West, S. O’Neel, E. C. Pettit, and M. Truffer (2015a), Tidal and seasonal variations in calving fluxobserved with passive seismology, J. Geophys. Res. Earth Surf., 120, 2318–2337, doi:10.1002/2015JF003641.
Bartholomaus, T. C., J. M. Amundson, J. I. Walter, S. O’Neel, M. E. West, and C. F. Larsen (2015b), Subglacial discharge at tidewater glaciersrevealed by seismic tremor, Geophys. Res. Lett., 42, 6391–6398, doi:10.1002/2015GL064590.
Bassis, J. N., H. A. Fricker, R. Coleman, and J.-B. Minster (2008), An investigation into the forces that drive ice-shelf rift propagation on theAmery Ice Shelf, East Antarctica, J. Glaciol., 54(184), 17–27, doi:10.3189/002214308784409116.
Chamberlin, T. C. (1897), Glacial studies in Greenland. X, J. Geol., 5(3), 229–240.Dalban Canassy, P., F. Walter, S. Husen, H. Maurer, J. Faillettaz, and D. Farinotti (2013), Investigating the dynamics of an alpine glacier using
probabilistic icequake locations: Triftgletscher, Switzerland, J. Geophys. Res. Earth Surf., 118, 2003–2018, doi:10.1002/jgrf.20097.Eckstaller, A. (1988), Seismologische Untersuchungen mit Daten der Georg-von-Neumayer Station, Antarktis, 1982–1984, PhD thesis,
Ludwig-Maximilians-Universität, München, Germany.Hammer, C., M. Ohrnberger, and V. Schlindwein (2015), Pattern of cryospheric seismic events observed at Ekström ice shelf, Antarctica,
Geophys. Res. Lett., 42, 3936–3943, doi:10.1002/2015GL064029.Helmstetter, A., L. Moreau, B. Nicolas, P. Comon, and M. Gay (2015), Intermediate-depth icequakes and harmonic tremor in an alpine glacier
(Glacier d’Argentiére, France): Evidence for hydraulic fracturing?, J. Geophys. Res. Earth Surf., 120, 402–416, doi:10.1002/2014JF003289.Ide, S., and Y. Tanaka (2014), Controls on plate motion by oscillating tidal stress: Evidence from deep tremors in western Japan, Geophys. Res.
Lett., 41, 3842–3850, doi:10.1002/2014GL060035.Kaminuma, K. (1994), Seismic activity in and around the Antarctic continent, Terra Antarctica, 1(2), 423–426.Khan, S. A., A. Aschwanden, A. A. Bjørk, J. Wahr, K. K. Kjeldsen, and K. H. Kjaer (2015), Greenland ice sheet mass balance: A review, Reports on
Progress in Physics, 046801, 1–26, doi:10.1088/0034-4885/78/4/046801.Koubova, H. (2015), Localization and analysis of calving-related seismicity at Kronebreen, Svalbard, MSc thesis, Univ. of Oslo, Oslo.Métaxian, J.-P. (2003), Seismicity related to the glacier of Cotopaxi Volcano, Ecuador, Geophys. Res. Lett., 30(9), 1483,
doi:10.1029/2002GL016773.Mikesell, T. D., K. van Wijk, M. M. Haney, J. H. Bradford, H. P. Marshall, and J. T. Harper (2012), Monitoring glacier surface seismicity in time
and space using Rayleigh waves, J. Geophys. Res., 117, F02020, doi:10.1029/2011JF002259.O’Neel, S., H. P. Marshall, D. E. McNamara, and W. T. Pfeffer (2007), Seismic detection and analysis of icequakes at Columbia Glacier, Alaska,
J. Geophys. Res., 112, F03S23, doi:10.1029/2006JF000595.
AcknowledgmentsThis work was a part of the GRENEArctic Climate Change ResearchProject and partially carried out inthe Arctic Challenge for Sustainability(ArCS) Project. The authors alsoacknowledge funding from a JSPSGrant-in-Aid (PU15901), SNF grant200021_153179/1, helicopter supportfrom Air Greenland, and fieldassistance by G. Lombardi and othermembers of the campaign. TheSwiss National Science Foundationfinanced the salary of F.W. and partof the instrument deployment costs(GlaHMSeis ProjectPP00P2_157551).We also thank D. Sakakibara for helpwith satellite imagery and D. MacAyealfor directing us to early studies ofBowdoin Glacier. Geodesic, and AWSdata can be obtained from NIPR datadepository (https://ads.nipr.ac.jp/).Seismic data will be archived at theSwiss Seismological Service; access canbe granted by the authors. Seismicprocessing and preparation of figuresemployed ObsPy, QGIS, and MATLABsoftware. Finally, the authors thank M.Truffer and G. Barruol for constructivereviews of the paper.
PODOLSKIY ET AL. MICROSEISMICITY OF CALVING FRONT 2043

Geophysical Research Letters 10.1002/2016GL067743
Podrasky, D., M. Truffer, M. Lüthi, and M. Fahnestock (2014), Quantifying velocity response to ocean tides and calving near the terminus ofJakobshavn Isbræ, Greenland, J. Glaciol., 60(222), 609–621, doi:10.3189/2014JoG13J130.
Pomeroy, J., A. Brisbourne, J. Evans, and D. Graham (2013), The search for seismic signatures of movement at the glacier bed in apolythermal valley glacier, Ann. Glaciol., 54(64), 149–156, doi:10.3189/2013AoG64A203.
Pratt, M. J., J. P. Winberry, D. A. Wiens, S. Anandakrishnan, and R. B. Alley (2014), Seismic and geodetic evidence for grounding-line control ofWhillans Ice Stream stick-slip events, J. Geophys. Res. Earth Surf., 119, 333–348, doi:10.1002/2013JF002842.
Pritchard, H. D., R. J. Arthern, D. G. Vaughan, and L. A. Edwards (2009), Extensive dynamic thinning on the margins of the Greenland andAntarctic ice sheets, Nature, 461(7266), 971–975, doi:10.1038/nature08471.
Röösli, C., F. Walter, S. Husen, L. C. Andrews, M. P. Lüthi, G. A. Catania, and E. Kissling (2014), Sustained seismic tremors and icequakesdetected in the ablation zone of the Greenland ice sheet, J. Glaciol., 60(221), 563–575, doi:10.3189/2014JoG13J210.
Smith, E. C., A. M. Smith, R. S. White, A. M. Brisbourne, and H. D. Pritchard (2015), Mapping the ice-bed interface characteristics of Rutford IceStream, West Antarctica, using microseismicity, J. Geophys. Res. Earth Surf., 120, 1881–1894, doi:10.1002/2015JF003587.
Sugiyama, S., D. Sakakibara, S. Tsutaki, M. Maruyama, and T. Sawagaki (2015), Glacier dynamics near the calving front of Bowdoin Glacier,northwestern Greenland, J. Glaciol., 61(226), 223–232, doi:10.3189/2015JoG14J127.
von der Osten-Woldenburg, H. (1990), Icequakes on Ekström ice shelf near Atka bay, Antarctica, J. Glaciol., 36(122), 31–36.Walter, F., N. Deichmann, and M. Funk (2008), Basal icequakes during changing subglacial water pressures beneath Gornergletscher,
Switzerland, J. Glaciol., 54(186), 511–521, doi:10.3189/002214308785837110.West, M. E., C. F. Larsen, M. Truffer, S. O’Neel, and L. LeBlanc (2010), Glacier microseismicity, Geology, 38(4), 319–322, doi:10.1130/G30606.1.Winberry, J. P., S. Anandakrishnan, R. B. Alley, R. A. Bindschadler, and M. A. King (2009), Basal mechanics of ice streams: Insights from the
stick-slip motion of Whillans Ice Stream, West Antarctica, J. Geophys. Res., 114, F01016, doi:10.1029/2008JF001035.Zoet, L. K., S. Anandakrishnan, R. B. Alley, A. A. Nyblade, and D. A. Wiens (2012), Motion of an Antarctic glacier by repeated tidally modulated
earthquakes, Nat. Geosci., 5(9), 623–626.
PODOLSKIY ET AL. MICROSEISMICITY OF CALVING FRONT 2044