Tide and Sea Level Characteristics at Juaymah, West Coast...
17
JKAU: Mar. Sci., Vol. 21, No. 1, pp: 133-149 (2010 A. D. / 1431 A. H.) DOI: 10. 4197/Mar. 21-1.8 133 Tide and Sea Level Characteristics at Juaymah, West Coast of the Arabian Gulf Abdullah M. Al-Subhi Faculty of Marine Science King Abdul-Aziz University, Jeddah, Saudi Arabia [email protected] Abstract. Based on hourly values of the sea level record for the year 2000 and 2005 at Juaymah, Arabian Gulf, the harmonic tidal analysis was performed. It showed a mixed type of tide (F ≈ 0.44) with semidiurnal dominance. On an annual basis, the astronomical tide comprised about 90% of the water level variations. Most of the residual variation (observed minus astronomical component) depends on the variation in atmospheric pressure, water density, and the wind stress. The atmospheric pressure seems to be important compared to density variation and the wind stress in both years. The atmospheric pressure is higher in winter and lower in summer with a consequence of lower residual sea level in winter and higher in summer. Keywords: Arabian Gulf, harmonic tidal analysis, observed tide astronomical tide, meteorological tide, mean sea level. Introduction The Arabian Gulf extends about 1000 km in length and maximum width is approximately 370 km. The average depth is about 36 m and surface area is approximately 239×10 3 km 2 (Emery, 1956). It is located in an arid region and mostly dominated by the Shamal; a northwesterly wind which occurs almost year round (Perrone, 1979). The evaporation rate is nearly 2 m/yr (Privett, 1959; Hastenrath and Lamb, 1979; Meshal and Hassan, 1986; and Ahmad and Sultan, 1991). The net freshwater input by precipitation and river discharge is 0.15 m/yr (Johns et al., 2003). The major fresh water source in the Arabian Gulf is through the Shatt-Al- Arab, at the head of the Gulf and fed by the Euphrates, Tigris and Karun
-
Upload
truongnhan -
Category
Documents
-
view
215 -
download
1
Transcript of Tide and Sea Level Characteristics at Juaymah, West Coast...

JKAU: Mar. Sci., Vol. 21, No. 1, pp: 133-149 (2010 A. D. / 1431 A. H.)
DOI: 10. 4197/Mar. 21-1.8
133
Tide and Sea Level Characteristics at Juaymah, West
Coast of the Arabian Gulf
Abdullah M. Al-Subhi
Faculty of Marine Science
King Abdul-Aziz University, Jeddah, Saudi Arabia
Abstract. Based on hourly values of the sea level record for the year
2000 and 2005 at Juaymah, Arabian Gulf, the harmonic tidal analysis
was performed. It showed a mixed type of tide (F ≈ 0.44) with
semidiurnal dominance. On an annual basis, the astronomical tide
comprised about 90% of the water level variations. Most of the
residual variation (observed minus astronomical component) depends
on the variation in atmospheric pressure, water density, and the wind
stress. The atmospheric pressure seems to be important compared to
density variation and the wind stress in both years. The atmospheric
pressure is higher in winter and lower in summer with a consequence
of lower residual sea level in winter and higher in summer.
Keywords: Arabian Gulf, harmonic tidal analysis, observed tide
astronomical tide, meteorological tide, mean sea level.
Introduction
The Arabian Gulf extends about 1000 km in length and maximum width is approximately 370 km. The average depth is about 36 m and surface
area is approximately 239×103 km2 (Emery, 1956). It is located in an arid region and mostly dominated by the Shamal; a northwesterly wind which occurs almost year round (Perrone, 1979). The evaporation rate is nearly
2 m/yr (Privett, 1959; Hastenrath and Lamb, 1979; Meshal and Hassan, 1986; and Ahmad and Sultan, 1991). The net freshwater input by precipitation and river discharge is 0.15 m/yr (Johns et al., 2003). The
major fresh water source in the Arabian Gulf is through the Shatt-Al-Arab, at the head of the Gulf and fed by the Euphrates, Tigris and Karun

Abdullah M. Al-Subhi 134
rivers. The flow from the Tigris and Euphrates through Shatt-Al-Arab varies considerably through the year and has recently been reduced significantly due to the ongoing river basin modification in upstream countries (Al-Yamani, 2008). Tides in the Arabian Gulf are complex exhibiting; semi-diurnal, diurnal, and mixed nature (Reynolds, 1993). According to Najafi (1997) the major semi-diurnal and diurnal tidal constituents in the Arabian Gulf are M2, S2, K1, and O1. The semi-diurnal tide has two amphidromic points that are located in the north-western and southern ends of the Gulf, while the diurnal tide has a single amphidromic point in the centre of the Gulf near Bahrain (Najafi, 1997 and Hunter, 1982). Najafi (1997) predicted tidal flows of 0.9 m/s near the Strait of Hormuz and at the head of the Gulf, and 0.3 – 0.6 m/s elsewhere in the Gulf.
The scope of this study is to apply the least square harmonic method to investigate tidal characteristics and sea level fluctuation at Juaymah
(26o 51.6′ N, 49o
54.5′ E) west coast of the Arabian Gulf (Fig. 1).
Fig. 1. Map of the Arabian Gulf showing the locations of Juaymah and Dhahran in the west
coast; where the tide and meteorological data were obtained respectively for the year
2000 and 2005.

Tide and Sea Level Characteristics at Juaymah, …
135
Data and Methods of Analysis
The purpose of the analysis is to find out the amplitude and phase for the five important tidal constituent; namely M2, S2, N2, K1, and O1. Finding the tidal harmonic constants at a place allows one to predict astronomical tide at that place. Furthermore, the meteorological tide; a change in water level caused by local meteorological conditions can be found by subtracting the astronomical tide from the observed tide data. Once the meteorological tide determined, a straight forward correlation with meteorological and oceanographic data gives the main factors affecting the sea level fluctuation at that site.
Three types of data were obtained to carry out this study. The tide data are an hourly observed tide for the periods of Jan 1 – Dec 31, 2000 and Jan 1 – Dec 31, 2005. The data were obtained from Saudi Aramco Company. However, these two records are the only data available at the time of the study.
The meteorology data are obtained from PME (Presidency of Meteorology and Environment) Jeddah, Saudi Arabia. The meteorological data (for the year 2000 and 2005) are on a daily basis for Dhahran city; ~ 40 km south of Juaymah. Both meridional and zonal components of wind stress were computed using the wind speed and direction. The components of wind stress were adjusted for the North–West orientation of the coastline. The monthly means of the evaporation rates at the Arabian Gulf were calculated using the latent heat flux (Qe)
values presented in (Ahmad and Sultan, 1991).
Due to the importance of sea water density effect on the variations of sea level (Abdallah and Eid, 1989); the oceanographic data; monthly
averages of salinity and temperature at standard depth were obtained
from NODC–WOA05 (National Oceanographic Data Center – World Ocean Atlas 2005). The oceanographic data were obtained for the purpose of calculating water density. These data are a 1-degree gridded data and have been chosen for the closest grid to the station; e.g. 50.5oE and 26.5oN. The data are for the standard depth intervals up to 50 m deep.
This study employs the World Tides ver. 2009 by John Boon; a GUI-based program for tidal analysis and prediction using up to 35 tidal harmonic constituents under Matlab© package which can be downloaded

Abdullah M. Al-Subhi 136
from the following URL: http://www.mathworks.com/matlabcentral/ fileexchange/24217-world-tides. The program is made for the analysis and prediction of tides using the least squares harmonic analysis. It allows the user to decompose a water level record into its tidal and non-tidal components by fitting between 5 and 35 tidal harmonic constituents. The constituents can then be saved to allow future prediction of tides. A brief mathematical background (abstracted from (Boon, 2004)) is presented below:
To predict tide at a place, we simply apply the following harmonic equation:
( )*01
( ) cosm
j j j j jj
h t h f H t u kω
=
= + + −∑ (1)
where;
t is the time in serial hours, h(t) is the predicted water level at t, h0 is the mean water level, fj is the lunar node factor for jth constituent, Hj is the
mean amplitude for jth constituent over 18.6-year lunar node cycle, ωj is the frequency of jth constituent, uj is the nodal phase for jth constituent, kj
*
is the phase of jth
constituent for the time origin in use (midnight beginning December 31, 1899), m is the number of consitutents. For purely solar constitunets, fj=1 and uj=0. Others are obtained by formula of (Doodson and Warburg, 1980 and Schureman, 1958). To compute the tidal constituent amplitude (Hj) and phase (Kj) the least squares harmonic analysis should be applied. However, the least squares criterion requires
a solution for the harmonic constants that will produce the minimum
possible sum of squared differences for a series of observations ht of length n:
2
1
[ ( )]n
t
t
h h t minimum=
− =∑ (2)
Therefore, equation (1) will be re-written as:
01 1
( ) cos sinm m
j j j jj j
h t A A t B tω ω
= =
= + +∑ ∑ (3)
where;
Tide and Sea Level Characteristics at Juaymah, …
137
2 2
0 0, ,
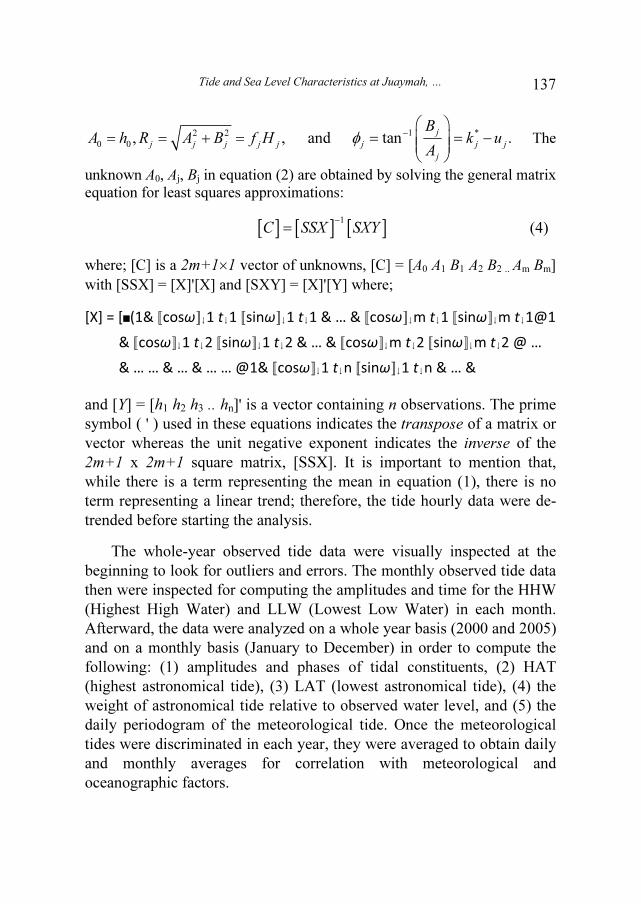
j j j j jA h R A B f H= = + = and 1 *
tan .j
j j j
j
Bk u
Aφ −
⎛ ⎞= = −⎜ ⎟⎜ ⎟
⎝ ⎠ The
unknown A0, Aj, Bj in equation (2) are obtained by solving the general matrix
equation for least squares approximations:
[ ] [ ] [ ]1
C SSX SXY−
= (4)
where; [C] is a 2m+1×1 vector of unknowns, [C] = [A0 A1 B1 A2 B2 .. Am Bm]
with [SSX] = [X]'[X] and [SXY] = [X]'[Y] where;
[X] = [■(1& ƒcosω„91 t91 ƒsinω„91 t91 & … & ƒcosω„9m t91 ƒsinω„9m t91@1
& ƒcosω„91 t92 ƒsinω„91 t92 & … & ƒcosω„9m t92 ƒsinω„9m t92 @ …
& … … & … & … … @1& ƒcosω„91 t9n ƒsinω„91 t9n & … &
and [Y] = [h1 h2 h3 .. hn]' is a vector containing n observations. The prime
symbol ( ' ) used in these equations indicates the transpose of a matrix or
vector whereas the unit negative exponent indicates the inverse of the
2m+1 x 2m+1 square matrix, [SSX]. It is important to mention that,
while there is a term representing the mean in equation (1), there is no
term representing a linear trend; therefore, the tide hourly data were de-
trended before starting the analysis.
The whole-year observed tide data were visually inspected at the
beginning to look for outliers and errors. The monthly observed tide data
then were inspected for computing the amplitudes and time for the HHW
(Highest High Water) and LLW (Lowest Low Water) in each month.
Afterward, the data were analyzed on a whole year basis (2000 and 2005)
and on a monthly basis (January to December) in order to compute the
following: (1) amplitudes and phases of tidal constituents, (2) HAT
(highest astronomical tide), (3) LAT (lowest astronomical tide), (4) the
weight of astronomical tide relative to observed water level, and (5) the
daily periodogram of the meteorological tide. Once the meteorological
tides were discriminated in each year, they were averaged to obtain daily
and monthly averages for correlation with meteorological and
oceanographic factors.

Abdullah M. Al-Subhi 138
Results and Discussion
The observed tide for the year 2000 and 2005 are given in Fig. 2 & 3 respectively. The data for year 2000 have discontinuity in the last week of May which does not alter the computation anyway.
0 30 60 90 120 150 180 210 240 270 300 330 360-1.5
-1
-0.5
0
0.5
1
1.5
Julian Day 2000
Wa
ter L
eve
l (m
ete
rs)
Observed Astronomical Meteorological
Fig. 2. Observed, astronomical, and meteorological tide hourly values for Juaymah station
during the year 2000.
0 30 60 90 120 150 180 210 240 270 300 330 360-1.5
-1
-0.5
0
0.5
1
1.5
Julian Day 2005
Wa
ter L
eve
l (m
ete
rs)
Observed Astronomical Meteorological
Fig. 3. Observed, astronomical, and meteorological tide hourly values for Juaymah station
during the year 2005.
The Highest High Water (HHW) and Lowest Low Water (LLW) in each month for both years as well as the Highest Astronomical Tide (HAT) Lowest Astronomical Tide (LAT) are given in Table 1.

Tide and Sea Level Characteristics at Juaymah, …
139
Table 1. The monthly HHW and LLW for the year 2000 and 2005 as well as the HAT and
LAT values.
2000 2005
HHW LLW HHW LLW
Month W. L.
(cm)
Time
(Day.hour)
W. L.
(cm)
Time
(Day.hour)
W. L.
(cm)
Time
(Day.hour)
W. L.
(cm)
Time
(Day.hour)
Jan 498 21.17 301 24.13 496 10.17 280 12.12
Feb 493 23.19 269 08.13 502 13.20 279 11.12
Mar 496 09.06 285 04.01 499 10.17 291 26.11
Apr 492 22.07 320 12.04 500 26.06 298 06.09
May 490 08.08 298 08.01 506 26.07 292 07.22
Jun 515 05.07 313 17.23 513 24.07 315 25.00
Jul 516 03.06 308 31.23 519 23.06 321 21.23
Aug 510 03.07 307 31.01 517 21.06 323 20.23
Sep 512 17.19 304 02.13 502 20.18 306 17.22
Oct 507 15.18 311 19.14 505 19.18 324 08.13
Nov 523 18.22 311 27.11 505 17.18 310 19.12
Dec 499 11.17 293 27.12 508 17.18 313 04.12
HAT Value: 1.011 LAT Value: -1.010 HAT Value: 1.019 LAT Value: -1.041
Tidal harmonic constituents are shown in Table 2. The amplitudes and phases seem to be identical for both years. According to the ratio; F = (M2+S2 / K1+O1), both years showed a mixed type of tide with semidiurnal imposed. F= 0.43 for 2000, and = 0.44 for 2005. These values as well as the HAT and LAT values are in agreement with those of annual Saudi Aramco tide tables (current version for the year 2009).
Table 2. Tidal harmonic constituents at Juaymah station for the year 2000 and 2005.
2000 2005 Tide
Constituent Amplitude Phase Amplitude Phase
O1 0.129 227.36 0.133 225.18
K1 0.165 315.78 0.172 316.59
N2 0.106 315.44 0.107 316.14
M2 0.512 071.05 0.508 069.35
S2 0.182 185.43 0.184 182.22
In both years, the astronomical tides comprise almost 90% of the total water level variations; (89.70% and 89.93% for year 2000 and 2005
respectively). However, these values change when we consider the month-by-month tides (Table 3).

Abdullah M. Al-Subhi 140
Table 3. Monthly astronomical and meteorological tides weight (%) of total water level
variance
2000 2005
Month Astromical tide
(%)
Meteorological tide
(%)
Astromical tide
(%)
Meteorological tide
(%)
Jan 81.87 18.13 87.90 12.10
Feb 88.35 11.65 92.08 07.92
Mar 81.54 18.46 91.23 08.77
Apr 95.91 04.09 92.71 07.29
May 96.28 03.72 94.41 05.59
Jun 96.51 03.49 97.16 02.84
Jul 98.25 01.75 96.91 03.09
Aug 97.60 02.40 98.26 01.74
Sep 95.47 04.53 96.63 03.37
Oct 96.02 03.98 97.06 02.94
Nov 91.02 08.98 94.82 05.18
Dec 92.62 07.38 92.26 07.74
From the above table, it is obvious that the month-to-month percentage weights of both the astronomical and meteorological tides are
different annually and seasonally. Year 2000 shows slightly lower percentage of astronomical tides as compared with year 2005. Moreover, during winter season the meteorological tides have larger amplitudes in
comparison with summer months. This is in concurrence with higher
astronomical tides during summer (late May to Aug.) and in autumn transition period (Sept. and Oct.).
The periodogram of the meteorological tide for both years are shown
in Fig. 4 & 5 respectively. In both figures diurnal and semi-diurnal cycles noticeably appear. However, the strength of these cycles differs due to the nature of altering daily weather from year to year. For instance, the meteorological tide shows stronger semi-diurnal cycle than the daily cycle in 2005.

Tide and Sea Level Characteristics at Juaymah, …
141
Fig. 4. The periodogram of the meteorological tide for the year 2000.
0 1 2 3 4 5 6 7 80
1
2
3
4
5x 10
-5
Frequency(cycles per day)
Energy
Fig. 5. The periodogram of the meteorological tide for the year 2005.
The monthly mean sea level in both years shows a high correlation with atmospheric pressure. The correlation values range between -0.738 to -0.831 with significant P value 0.001. Figures 6 & 7 represent the
correlation between monthly mean sea level and atmospheric pressure in 2000 and 2005 respectively.
0 1 2 3 4 5 6 7 80
1
2
3
4
5x 10
-5
Frequency(cycles per day)
Energy

Abdullah M. Al-Subhi 142
Fig. 6. Correlation of monthly meteorological tide with the atmospheric pressure in the year
2000.
Fig. 7. Correlation of monthly meteorological tide with the atmospheric pressure in the year
2005.
Figures 6 and 7 show higher residual mean sea level in summer and
lower mean sea level in winter for both years. This agrees with the findings of (Sharaf El-Din, 1988, El-Gindy, 1991, and Sultan et al. (1995)). The latter remarked that “the sea level responds to atmospheric
Tide and Sea Level Characteristics at Juaymah, …
143
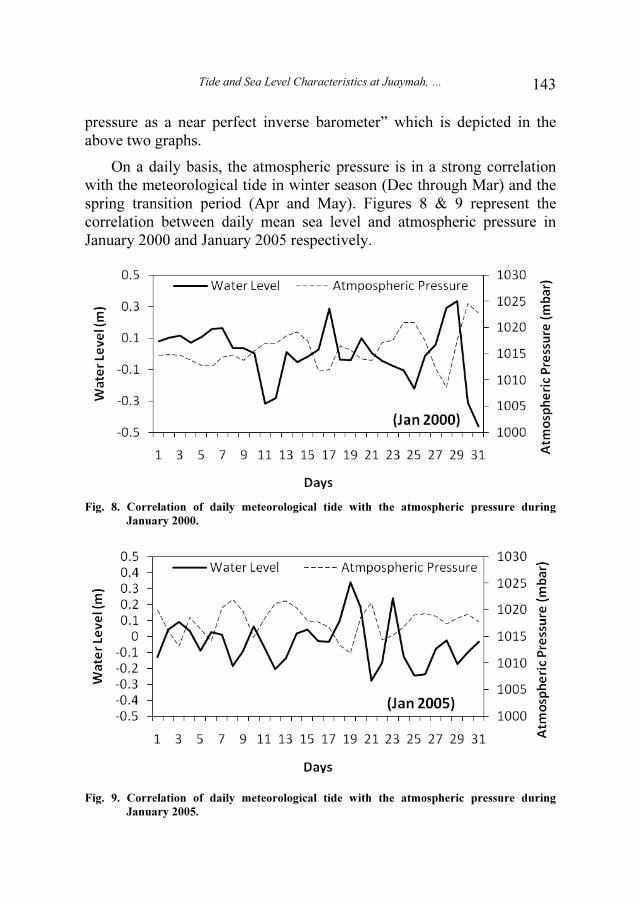
pressure as a near perfect inverse barometer” which is depicted in the above two graphs.
On a daily basis, the atmospheric pressure is in a strong correlation with the meteorological tide in winter season (Dec through Mar) and the spring transition period (Apr and May). Figures 8 & 9 represent the correlation between daily mean sea level and atmospheric pressure in January 2000 and January 2005 respectively.
Fig. 8. Correlation of daily meteorological tide with the atmospheric pressure during
January 2000.
Fig. 9. Correlation of daily meteorological tide with the atmospheric pressure during
January 2005.

Abdullah M. Al-Subhi 144
The analysis of the monthly mean sea level shows that in summer season (June through Aug) the monthly mean sea level has a fair correlation with water density of the water column. Figures 10 and 11 illustrate this correlation for the year 2000 and the 2005 respectively. Correlation values are -0.570 with P value 0.005 and -0.562 with P value 0.005 for the year 2000 and 2005 respectively. This is almost in agreement with the results of Sultan et al. (1995). Due to non-availability of the daily values of salinity and temperature, the daily correlation of water density and meteorological tide could not be computed.
Fig. 10. Correlation of monthly meteorological tide with the water density in the year 2000.
Fig. 11. Correlation of monthly meteorological tide with the water density in the year 2005.

Tide and Sea Level Characteristics at Juaymah, …
145
The autumn transition period (mid Sep through mid Nov) however demonstrate another controlling factor. In both years a clear negative correlation with wind component appears. In the year 2000, the correlation between the zonal component of wind stress and the meteorological tide represent a value of -0.679 with P value of 0.001 during the month September (Fig. 12). On the other hand, the meridional component of wind stress shows also a correlation of about -0.574 with P value 0.001 for the month of October 2005 (Fig. 13). This may be due to the variation in daily wind pattern. The periodogram of the meteorological tide for the year 2000 and 2005 (Fig. 4 and 5) also show difference in energy concentration.
The evaporation rate during the year 2000 and 2005 did not show any significant correlation with the changes in mean sea level.
Fig. 12. Correlation of daily meteorological tide with the along-shore wind stress during
September 2000.
Fig. 13. Correlation of daily meteorological tide with the cross-shore wind stress during
October 2005.
Abdullah M. Al-Subhi 146
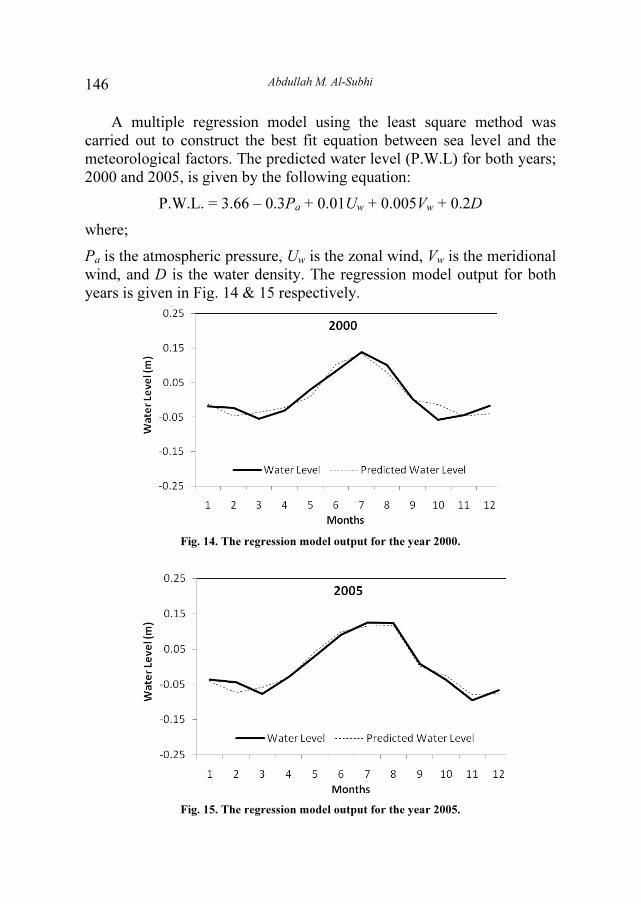
A multiple regression model using the least square method was carried out to construct the best fit equation between sea level and the meteorological factors. The predicted water level (P.W.L) for both years; 2000 and 2005, is given by the following equation:
P.W.L. = 3.66 – 0.3Pa + 0.01Uw + 0.005Vw + 0.2D
where;
Pa is the atmospheric pressure, Uw is the zonal wind, Vw is the meridional wind, and D is the water density. The regression model output for both years is given in Fig. 14 & 15 respectively.
Fig. 14. The regression model output for the year 2000.
Fig. 15. The regression model output for the year 2005.

Tide and Sea Level Characteristics at Juaymah, …
147
Conclusion
At Juaymah station, the observed tide data for the year 2000 and 2005 show a mixed type of tide with semidiurnal dominance. On an annual basis, the astronomical tide comprises of about 90% of the total water variation. On monthly basis, the astronomical tide proportion ranges from 81.54% during March to 98.25 in July for the year 2000 and from 87.90 in January to 98.26 during August in the year 2005. The meteorological tide shows a correlation with atmospheric pressure and the water column density for both years. On a daily basis, the winter data show a strong correlation with atmospheric pressure. Due to the non-availability of the daily values of temperature and salinity with depth the correlation between the density variation and the residual water level could not be obtained. During the autumn transition period, the correlation with wind components appears clearly.
Acknowledgment
I would like to thank Mr. Abdullah Al-buainain for helping in getting tide and meteorological data and Mr. Ibrahim Mehrezi for preparing the data for analysis. The acknowledgment is also extended to Prof. Fazal Chaudhry for reviewing the manuscript and for the great scientific suggestions. Mr. Sami El-Nadi is thanked for providing re-prints of some published papers.
References
Abdullah, A. M. and Eid, F. M. (1989) On the steric sea level in the Red Sea, Int. Hydrograph.
Review, Monaco, LXVI(1): 115-1124.
Ahmad, F. and Sultan, S.A.R. (1991) Annual mean surface heat fluxes in the Arabian Gulf and
the net heat transport through the Strait of Hormuz, Atmos. Ocean., 29: 54–61.
Al-Yamani, F. (2008) Importance of the fresh water influx from the Shatt-Al-Arab river on the
Gulf marine environment, In: Protecting the Gulf’s Marine Ecosystems from Pollution. A.H.
Abuzinada, H.J. Barth, F. Krupp, B. Boer, and T.Z. Al Abdessalaam (ed.) 2008, Birkhauser
Verlag, Switzerland.
Boon, J.D. (2004) Secrets of the Tide: Tide aAnd Tidal Current Analysis and Predictions, Storm
Surges and Sea Level Trends, Horwood Publishing, Chichester, U.K, 212 p.
Doodson, A. T. and Warburg, H.D. (1980) Admiralty manual of tide, Admiralty Charts and
Publications, London, England, 270 p.
El-Gindy, A.A.H. (1991) Sea level variations and their relations to the meteorological factors in
the Arab Gulf Area with stress on monthly means, Int. Hydrograph. Review, Monaco,
LXVIII(1): 109-125.
Emery, K.O. (1956) Sediments and water of the Persian Gulf, Bull. Amer. Assoc. Petrol. Geol.,
40: 2354-2383.

Abdullah M. Al-Subhi 148
Hastenrath, S. and Lamb, P.J. (1979) Climatic Atlas of the Indian Ocean, Part 2, The Ocean
Heat Budget, Univ. of Wisc. Press, Madison, Wisconsin.
Hunter, J.R. (1982) Aspects of the dynamics of the residual circulation of the Arabian Gulf, in:
Coastal Oceanography, H.G. Gade, A. Edwards, and H. Svendsen, (ed.) Plenum Press, 31-
42.
Johns, W.E., Yao, F., Olson, D.B., Josey, S.A., Grist, J.P. and Smeed, D.A. (2003)
Observations of seasonal exchange through the Straits of Hormuz and the inferred
freshwater budgets of the Persian Gulf, J. Geophys. Res., 108(C12): 3391.
Meshal, A.H. and Hassan, H.M. (1986) Evaporation from the coastal waters of the central part
of the Gulf, Arabian Gulf Sci. Res., 4: 649–655.
Najafi, H.S. (1997) Modelling tides in the Persian Gulf using dynamic nesting, PhD Thesis,
University of Adelaide, Adelaide, South Australia.
Perrone, T.J. (1979) Winter shamal in the Persian Gulf, Tech. Rep., Naval Environ. Predict. Res.
Facil., Monterey, Calif., 79-06.
Privett, D.W. (1959) Monthly charts of evaporation from the North Indian Ocean, including the
Red Sea and the Persian Gulf, Quart. J. Roy. Meteorol. Soc., 85: 424-428.
Reynolds, R.M. (1993) Physical oceanography of the Gulf, Strait of Hormuz, and the Gulf of
Oman – Results from the Mt Mitchell expedition, Mar. Pollution Bull., 27: 35-59.
Saudi Aramco, Saudi Aramco Tide Tables (current version for the year 2009).
Schureman, P. (1958) Manual of harmonic analysis and prediction of tide, U.S. Dept of
commerce, Coast and Geodetic Survey. Special Publication No. 98, Washington, D.C.,
317 p.
Sharaf El-Din, S.H. (1988) Sea Level Variation along the Saudi Coast of the Arabian Gulf and
their Relation to Meteorological Parameters, Special Report 1409 H, King Fahad Naval
Academy Jubail, Saudi Arabia, pp101.
Sultan, S.A.R., Ahmad, F., Elghribi, N.M. and Al-Subhi, A.M. (1995) An analysis of Arabian
Gulf monthly mean sea level, Continental Shelf Res., 15: 1471-1482.

Tide and Sea Level Characteristics at Juaymah, …
149
����� �� �� � ������ ��� ��� �� ��� ��
���� ���� ����� ����
������ �� ����
������ �� � �� ������� ���� ����� � ���� – ����� � ����� ������ �
������� . ��� ����� ��� ��� ��� ����� ����� ����� ��
��� ����� �� � �����!!! � �!!" ������ ��� �� ���
����� #�$ ����� �� ��. �%���� &�� '( ) * ��� )�+,(
��$�� -�*� '� ' /)F ≈ 0.44 ( 23�* ���/��� ���+, 4�
�5�( 6��3� ������. �� &*� 7�*�� ������ 8� ) * ��� �� 9
����: �/�� �%��� &�� �/;<!= �*� ) �>�>� '� ���� ?�
����. ������� ) �>�>��) �� &��� �� ��� ) * ��� '�� @����/ (
7��� ��5� ��AB� ?��� )* / � A/� 9� C ��� & +�� ) �/��� 9
����� 8�. D��AB� �A/( 7��� ��5� ' /� & �+��� ��� A/� '�
'�� �� E/ �� ���� ��� ?��*� ���� �� C ���. ' �/ ��/
- ���F �3�� ��� G�5 �$*�� � �;� �3� �� 7��� ��5�
�� ���� ��� ?��*� H �$*� �� �; ��� ��/�� �AI� 2�3�
2�3� �3� �� G� ����� � �;� �3�.
���� �������: �%��� &� ����� ����� 9����� #�$� &��� 9
&J ;�� �%��� �/�� �%��� &�� �� 9 �%��� &
7�������� 9���� ��� ?��*� .