Thyristor-based “phase hopping” frequency conversion technique
13
Turk J Elec Eng & Comp Sci (2019) 27: 230 – 242 © TÜBİTAK doi:10.3906/elk-1711-162 Turkish Journal of Electrical Engineering & Computer Sciences http://journals.tubitak.gov.tr/elektrik/ Research Article Thyristor-based “phase hopping” frequency conversion technique Zhengwang XU 1,2,3 ,, Jiarui ZHANG 1,2,3, ∗ ,, Yuchun YI 1,2,3 ,, Cheng CHEN 1,2,3 ,, Jiaqi YU 1,2,3 ,, Wei MEI 1,2,3 ,, Daiwei FENG 1,2,3 , 1 Hubei Collaborative Innovation Center for High-efficiency Utilization of Solar Energy, Hubei University of Technology, Wuhan, China 2 Hubei Key Laboratory for High-efficiency Utilization of Solar Energy and Operation Control of Energy Storage System, Hubei University of Technology, Wuhan, China 3 Hubei Power Grid Intelligent Control and Equipment Engineering Technology Research Center, Hubei University of Technology, Wuhan, China Received: 30.01.2018 • Accepted/Published Online: 12.06.2018 • Final Version: 22.01.2019 Abstract: This study proposes a new AC/AC “phase hopping” frequency conversion method based on the analyses of the disadvantages of the conventional cosine wave-crossing method. The advantages of this new method include no circulating current, no dead time, and an output frequency close to the power frequency. This study also introduces the basic principles of the “phase hopping” method and analyzes these principles combined with the voltage phase-changing comparison to that of the cosine wave-crossing method. The “phase hopping” principles are used to analyze the generation of thyristor trigger pulses, including the generation time and duration. A simulation is conducted in MATLAB, and the simulation output waveform and harmonic analysis results are then obtained. The proposed approach is verified on an experimental platform. Consequently, the results are in good agreement with those of the theoretical and simulation analyses. Key words: AC/AC frequency conversion, cosine wave-crossing method, “phase hopping”, MATLAB 1. Introduction Electric energy is widely considered a type of clean energy in various fields. However, a large amount of electric energy is wasted because of inefficiencies in motor loads. For example, statistics published in China showed that the amount of electric energy consumed by motors accounts for 60%–70% of the national total. Moreover, AC motors account for approximately 90% of the total electric energy consumption, while motors with pump or fan loads account for 30% of the total Chinese power consumption. The motors supplying these loads typically operate at a constant speed. Even so, the liquid or gas flows supplied by these motors change in volume from time to time. Factories adjust the flows using baffles or valves, which decreases the overall system efficiency, to ensure that the volumes match. The efficiency of fan loads is approximately 40%, whereas that of pump loads is approximately 28%, thereby showing the potential to save a significant amount of energy if the efficiency of these loads can be increased. The preferred solution for achieving industrial energy savings is the frequency conversion technology because this approach allows the working characteristics of motors to be fully utilized. An insulated-gate bipolar transistor (IGBT) is the representative of full-control devices in the frequency conversion field. IGBT ∗ Correspondence: [email protected] This work is licensed under a Creative Commons Attribution 4.0 International License. 230
Transcript of Thyristor-based “phase hopping” frequency conversion technique

Turk J Elec Eng & Comp Sci(2019) 27: 230 – 242© TÜBİTAKdoi:10.3906/elk-1711-162
Turkish Journal of Electrical Engineering & Computer Sciences
http :// journa l s . tub i tak .gov . t r/e lektr ik/
Research Article
Thyristor-based “phase hopping” frequency conversion technique
Zhengwang XU1,2,3 , Jiarui ZHANG1,2,3,∗ , Yuchun YI1,2,3 , Cheng CHEN1,2,3 ,Jiaqi YU1,2,3 , Wei MEI1,2,3 , Daiwei FENG1,2,3
1Hubei Collaborative Innovation Center for High-efficiency Utilization of Solar Energy,Hubei University of Technology, Wuhan, China
2Hubei Key Laboratory for High-efficiency Utilization of Solar Energy and Operation Controlof Energy Storage System, Hubei University of Technology, Wuhan, China
3Hubei Power Grid Intelligent Control and Equipment Engineering Technology Research Center,Hubei University of Technology, Wuhan, China
Received: 30.01.2018 • Accepted/Published Online: 12.06.2018 • Final Version: 22.01.2019
Abstract: This study proposes a new AC/AC “phase hopping” frequency conversion method based on the analysesof the disadvantages of the conventional cosine wave-crossing method. The advantages of this new method include nocirculating current, no dead time, and an output frequency close to the power frequency. This study also introduces thebasic principles of the “phase hopping” method and analyzes these principles combined with the voltage phase-changingcomparison to that of the cosine wave-crossing method. The “phase hopping” principles are used to analyze the generationof thyristor trigger pulses, including the generation time and duration. A simulation is conducted in MATLAB, and thesimulation output waveform and harmonic analysis results are then obtained. The proposed approach is verified on anexperimental platform. Consequently, the results are in good agreement with those of the theoretical and simulationanalyses.
Key words: AC/AC frequency conversion, cosine wave-crossing method, “phase hopping”, MATLAB
1. IntroductionElectric energy is widely considered a type of clean energy in various fields. However, a large amount of electricenergy is wasted because of inefficiencies in motor loads. For example, statistics published in China showedthat the amount of electric energy consumed by motors accounts for 60%–70% of the national total. Moreover,AC motors account for approximately 90% of the total electric energy consumption, while motors with pump orfan loads account for 30% of the total Chinese power consumption. The motors supplying these loads typicallyoperate at a constant speed. Even so, the liquid or gas flows supplied by these motors change in volume fromtime to time. Factories adjust the flows using baffles or valves, which decreases the overall system efficiency, toensure that the volumes match. The efficiency of fan loads is approximately 40%, whereas that of pump loadsis approximately 28%, thereby showing the potential to save a significant amount of energy if the efficiency ofthese loads can be increased.
The preferred solution for achieving industrial energy savings is the frequency conversion technologybecause this approach allows the working characteristics of motors to be fully utilized. An insulated-gatebipolar transistor (IGBT) is the representative of full-control devices in the frequency conversion field. IGBT
∗Correspondence: [email protected]
This work is licensed under a Creative Commons Attribution 4.0 International License.230
XU et al./Turk J Elec Eng & Comp Sci
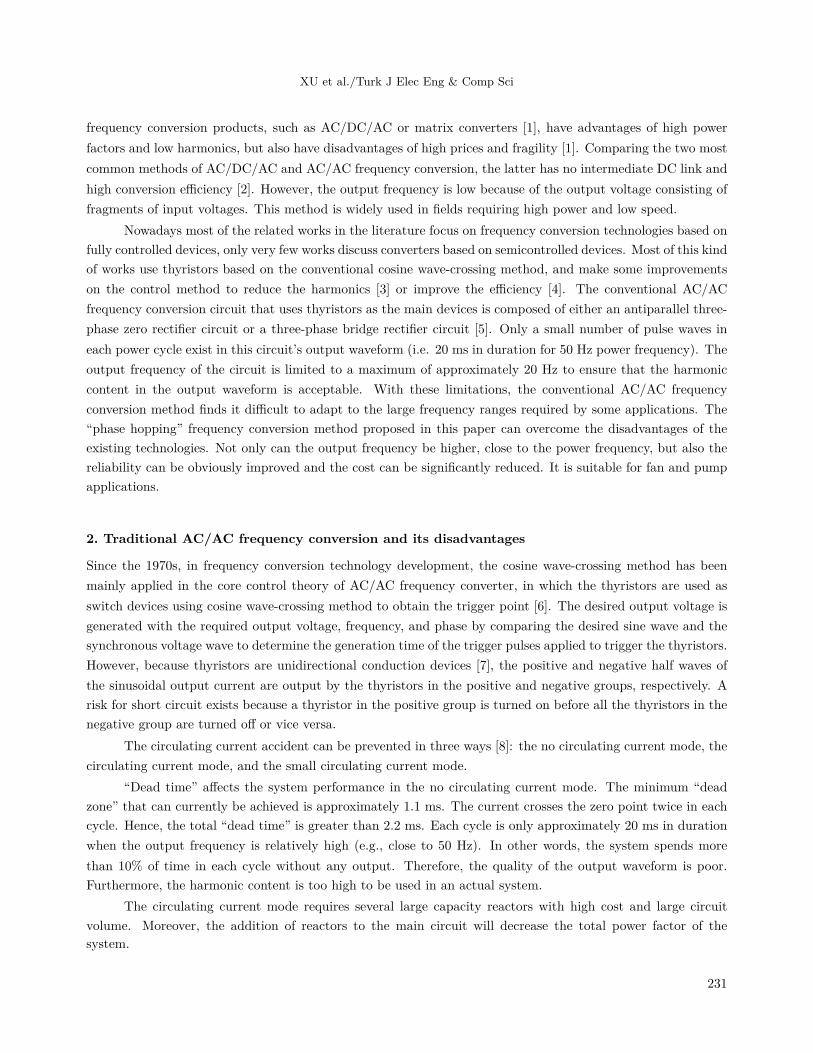
frequency conversion products, such as AC/DC/AC or matrix converters [1], have advantages of high powerfactors and low harmonics, but also have disadvantages of high prices and fragility [1]. Comparing the two mostcommon methods of AC/DC/AC and AC/AC frequency conversion, the latter has no intermediate DC link andhigh conversion efficiency [2]. However, the output frequency is low because of the output voltage consisting offragments of input voltages. This method is widely used in fields requiring high power and low speed.
Nowadays most of the related works in the literature focus on frequency conversion technologies based onfully controlled devices, only very few works discuss converters based on semicontrolled devices. Most of this kindof works use thyristors based on the conventional cosine wave-crossing method, and make some improvementson the control method to reduce the harmonics [3] or improve the efficiency [4]. The conventional AC/ACfrequency conversion circuit that uses thyristors as the main devices is composed of either an antiparallel three-phase zero rectifier circuit or a three-phase bridge rectifier circuit [5]. Only a small number of pulse waves ineach power cycle exist in this circuit’s output waveform (i.e. 20 ms in duration for 50 Hz power frequency). Theoutput frequency of the circuit is limited to a maximum of approximately 20 Hz to ensure that the harmoniccontent in the output waveform is acceptable. With these limitations, the conventional AC/AC frequencyconversion method finds it difficult to adapt to the large frequency ranges required by some applications. The“phase hopping” frequency conversion method proposed in this paper can overcome the disadvantages of theexisting technologies. Not only can the output frequency be higher, close to the power frequency, but also thereliability can be obviously improved and the cost can be significantly reduced. It is suitable for fan and pumpapplications.
2. Traditional AC/AC frequency conversion and its disadvantages
Since the 1970s, in frequency conversion technology development, the cosine wave-crossing method has beenmainly applied in the core control theory of AC/AC frequency converter, in which the thyristors are used asswitch devices using cosine wave-crossing method to obtain the trigger point [6]. The desired output voltage isgenerated with the required output voltage, frequency, and phase by comparing the desired sine wave and thesynchronous voltage wave to determine the generation time of the trigger pulses applied to trigger the thyristors.However, because thyristors are unidirectional conduction devices [7], the positive and negative half waves ofthe sinusoidal output current are output by the thyristors in the positive and negative groups, respectively. Arisk for short circuit exists because a thyristor in the positive group is turned on before all the thyristors in thenegative group are turned off or vice versa.
The circulating current accident can be prevented in three ways [8]: the no circulating current mode, thecirculating current mode, and the small circulating current mode.
“Dead time” affects the system performance in the no circulating current mode. The minimum “deadzone” that can currently be achieved is approximately 1.1 ms. The current crosses the zero point twice in eachcycle. Hence, the total “dead time” is greater than 2.2 ms. Each cycle is only approximately 20 ms in durationwhen the output frequency is relatively high (e.g., close to 50 Hz). In other words, the system spends morethan 10% of time in each cycle without any output. Therefore, the quality of the output waveform is poor.Furthermore, the harmonic content is too high to be used in an actual system.
The circulating current mode requires several large capacity reactors with high cost and large circuitvolume. Moreover, the addition of reactors to the main circuit will decrease the total power factor of thesystem.
231

XU et al./Turk J Elec Eng & Comp Sci
The small circulating current mode uses small capacity reactors and has advantages in terms of cost,volume, and power factor impact. Furthermore, no “dead time” exists in the system. However, the circulatingcurrent will be large if the reactor capacity is too small. In contrast, this mode will suffer from disadvantagessimilar to those of the circulating current mode if the reactor capacity is too large. The system will work intwo different statuses: circulating current mode and no circulating current mode. Consequently, the workingconditions will be inconsistent, thereby causing a certain amount of waveform distortion. The design andcontrol of the entire system will also become more complex. Therefore, the three types of control methods usedin the traditional AC/AC frequency conversion method all have insurmountable defects. In addition, the outputfrequency of each of the three methods must be lower than 20 Hz, so the application scope is limited.
3. “Phase hopping” frequency conversion theory
This study proposes a new AC/AC frequency conversion method referred to herein as the “phase hopping”method to address the disadvantages of the existing technologies. This is a new type of frequency conversionidea, which is further innovated on the basis of the cosine wave-crossing method and has not been described inany previous literature of AC/AC frequency conversion. The method allows the maximum output frequency tobe close to the power frequency under the condition that the harmonic content is limited to a low level in theoutput waveform.
3.1. Basic principle of the “phase hopping” frequency conversion
The three-phase bridge rectifier circuit shown in Figure 1 illustrates the “phase hopping” frequency conversionmethod [9]. The circuit structure is identical to that used in the conventional no circulating current AC/ACfrequency conversion circuit [10]. The bridge rectifier circuit comprises six thyristors (i.e. P1, P2, P3, P4, P5,and P6) in the positive group and six thyristors (i.e. N1, N2, N3, N4, N5, and N6) in the negative group. Thetwo groups of bridge rectifier circuits are connected in an antiparallel mode. A three-phase power is applied topoints C, B, and A. The single-phase sine wave is output from points E and O.
C B A
EO
P4
P6
P2
P1
P3
P5
N1
N3
N5
N4
N6
N2
Figure 1. “Phase hopping” frequency conversion circuit.
The current in the positive group flows out from point E to the load and returns from point O. Assumingthat P1 and P2 are turned on at a certain instant in time, point E is connected to point A; point O is connected
232

XU et al./Turk J Elec Eng & Comp Sci
to point C; and the cycloconverter voltage is output from points A and C. The output voltage is UAC , whichis simplified as AC here and below for simplicity.
As an example, we let P3 turn on and P1 cut off after 33.33 ms from the instant mentioned before. Then,the cycloconverter output voltage is BC. P4 turns on after another 33.33 ms, P2 cuts off at the same time, andthe cycloconverter output voltage is changed to BA. The conduction of the thyristors changes once every 33.33ms, which causes the output voltage circulation to change sequentially through CA, CB, AB, AC, BC, and BA.The negative group operates similarly.
Because a large cycle contains six changes, each change introduces a π/3 phase delay to the outputvoltage, and six times can introduce a total phase delay of 2π (one cycle). Therefore, after the completion ofa large cycle, the actual cycle number reduces one relative to the 50 Hz power cycle number. Assuming that alarge cycle is completed within 10 power frequency cycles, which is 200 ms. That is, the total number of outputvoltage cycles is 10 − 1 = 9. Thus, the final output voltage frequency is 9/(200/1000 ) = 45 Hz. In otherwords, the use of these three-phase bridge rectifier circuits can convert a 50 Hz power to a 45 Hz one. In theprocess, each pair of thyristors’ continuous conduction time is 200/6 = 33.33 ms. Output frequencies otherthan 45 Hz can be obtained by using similar control strategies.
The AC/AC frequency conversion method proposed herein connects the cycloconverter output terminalto the different phases of the input power using a “hopping” method. Therefore, this method is referred to asthe “phase hopping” frequency conversion method.
3.2. Phase-changing and frequency analysis of the cosine wave-crossing methodThe output frequency variation of the cycloconverter controlled by the cosine wave-crossing method was firstanalyzed to explain the output frequency variation of the “phase hopping” frequency conversion method. Figure2 shows the relationship among the input line voltage, output voltage, and the desired sine wave of the cosinewave-crossing method.
Line voltageU Synchronous input voltage Expected sine voltage
Figure 2. Cosine wave-crossing method output voltage.
As shown in Figure 2, the cycloconverter output voltage waveform under the control of the cosine wave-crossing method consists of many segments of the sine waves. If we take the input power frequency of 50 Hz asan example, its phase grows with the speed of the 50 Hz frequency when the output voltage follows a certainline voltage. The phase is reduced by π/3 when the output voltage jumps from a line voltage to the next linevoltage. Clearly, the more times of the voltage jumps during an output voltage cycle, the longer the period andthe lower the corresponding output frequency will be.
The phase reduced by the jumps in each cycle is expressed as follows, assuming that the number of jumpsin a cycle of the output voltage is M:
∆φ = M × π
3. (1)
233
XU et al./Turk J Elec Eng & Comp Sci
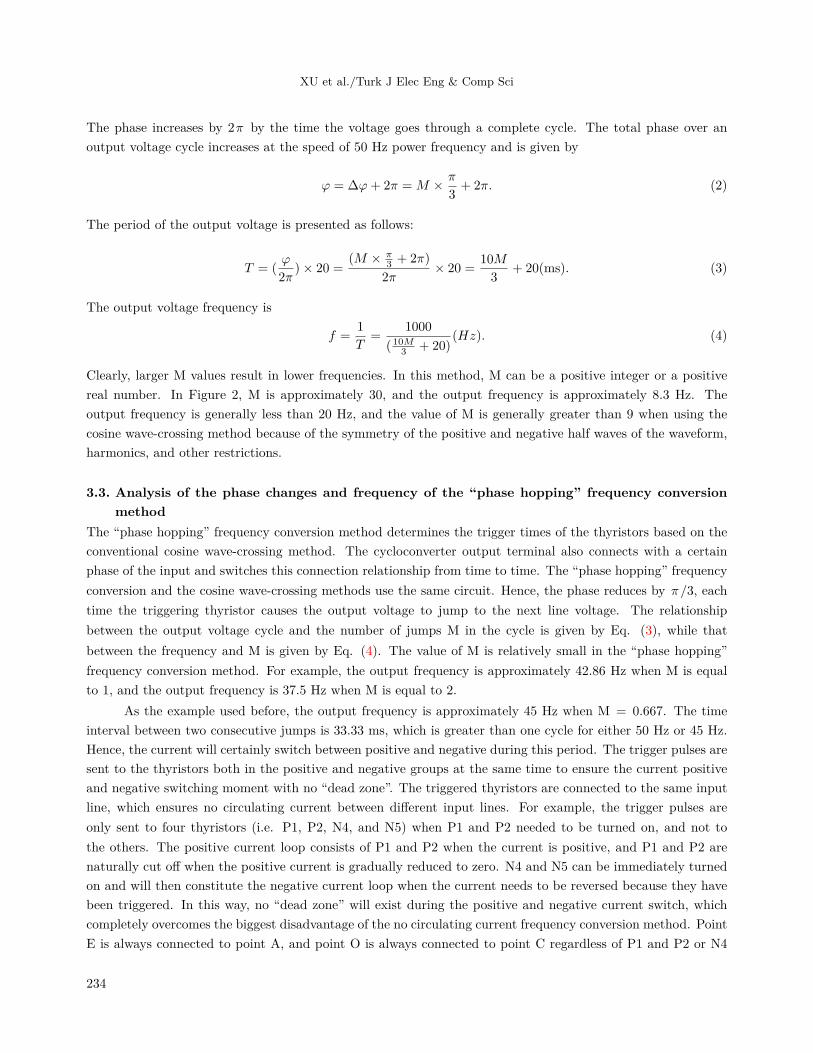
The phase increases by 2π by the time the voltage goes through a complete cycle. The total phase over anoutput voltage cycle increases at the speed of 50 Hz power frequency and is given by
φ = ∆φ+ 2π = M × π
3+ 2π. (2)
The period of the output voltage is presented as follows:
T = (φ
2π )× 20 =(M × π
3 + 2π)
2π× 20 =
10M
3+ 20(ms). (3)
The output voltage frequency is
f =1
T=
1000
( 10M3 + 20)(Hz). (4)
Clearly, larger M values result in lower frequencies. In this method, M can be a positive integer or a positivereal number. In Figure 2, M is approximately 30, and the output frequency is approximately 8.3 Hz. Theoutput frequency is generally less than 20 Hz, and the value of M is generally greater than 9 when using thecosine wave-crossing method because of the symmetry of the positive and negative half waves of the waveform,harmonics, and other restrictions.
3.3. Analysis of the phase changes and frequency of the “phase hopping” frequency conversionmethod
The “phase hopping” frequency conversion method determines the trigger times of the thyristors based on theconventional cosine wave-crossing method. The cycloconverter output terminal also connects with a certainphase of the input and switches this connection relationship from time to time. The “phase hopping” frequencyconversion and the cosine wave-crossing methods use the same circuit. Hence, the phase reduces by π/3, eachtime the triggering thyristor causes the output voltage to jump to the next line voltage. The relationshipbetween the output voltage cycle and the number of jumps M in the cycle is given by Eq. (3), while thatbetween the frequency and M is given by Eq. (4). The value of M is relatively small in the “phase hopping”frequency conversion method. For example, the output frequency is approximately 42.86 Hz when M is equalto 1, and the output frequency is 37.5 Hz when M is equal to 2.
As the example used before, the output frequency is approximately 45 Hz when M = 0.667. The timeinterval between two consecutive jumps is 33.33 ms, which is greater than one cycle for either 50 Hz or 45 Hz.Hence, the current will certainly switch between positive and negative during this period. The trigger pulses aresent to the thyristors both in the positive and negative groups at the same time to ensure the current positiveand negative switching moment with no “dead zone”. The triggered thyristors are connected to the same inputline, which ensures no circulating current between different input lines. For example, the trigger pulses areonly sent to four thyristors (i.e. P1, P2, N4, and N5) when P1 and P2 needed to be turned on, and not tothe others. The positive current loop consists of P1 and P2 when the current is positive, and P1 and P2 arenaturally cut off when the positive current is gradually reduced to zero. N4 and N5 can be immediately turnedon and will then constitute the negative current loop when the current needs to be reversed because they havebeen triggered. In this way, no “dead zone” will exist during the positive and negative current switch, whichcompletely overcomes the biggest disadvantage of the no circulating current frequency conversion method. PointE is always connected to point A, and point O is always connected to point C regardless of P1 and P2 or N4
234

XU et al./Turk J Elec Eng & Comp Sci
and N5 being turned on in this method. The current will automatically decide to flow through either P or Ngroup of thyristors depending on the circuit requirements. The current must pass through the load to form aloop, such that the current will not directly flow between two phases. In this way, the biggest disadvantage ofthe circulating current frequency conversion method can be overcome. Figure 3a illustrates the control methodof the 45 Hz output voltage, and a similar method can be used when a different output frequency is needed.The figure also depicts that the time interval between two jumps in the “phase hopping” frequency conversionmethod is greater than that between two jumps in the cosine wave-crossing method.
AB AC BC BA CA CB AB AC BC BA CA CB AB AC BC BA CA CB AB AC BC
AB AC BC BA CA CB AB AC BC BA CA CB AB AC BC BA CA CB AB AC BC
(a) 45 Hz (top) (b) 42.86 Hz (bottom)
Figure 3. Illustration of the “phase hopping” frequency conversion output voltage.
3.4. Analysis of different frequency output waveformsFigure 3 shows the line voltage cycles through AB, AC, BC, BA, CA, and CB. The output voltage at each“phase hopping” jumps from a line voltage to the next line voltage and causes a π/3 phase delay. The totalphase delay after six times of “phase hopping” is 2π . In other words, a cycle is reduced. Every six times of“phase hopping” completes a big circulation. The output frequency changes if the interval between two “phasehopping” changes. As shown in Figure 3a, the interval between each of the two phase hops is 10 line voltagepulse waves or 33.33 ms, and the output frequency is 45 Hz. Meanwhile, Figure 3b illustrates that the intervalbetween each of the two phase hops is 7 line voltage pulse waves or 23.3 ms, and the output frequency is 42.86Hz.
4. Control methodAn output voltage frequency of 42.86 Hz is used as an example to analyze the turn-on rule of thyristors. Theline voltage sequence is AB, AC, BC, BA, CA, CB with a delay time of 3.3 ms between two adjacent linevoltages. The output voltage changes from one line voltage to another (i.e. “phase hopping” happens) for every7 line voltage pulse waves or 23.3 ms. Table presents the thyristor turn-on rule in the case of 42.86 Hz.
The second line in Table represents the input line voltages. Each occupies a duty of 3.3 ms. The thirdline shows the line voltage to which the output voltage is equal.
The fourth line shows which thyristor should be triggered to realize the output voltage changing from aninput line voltage to another.
235

XU et al./Turk J Elec Eng & Comp Sci
Tab
le.
Trig
ger
rule
ofth
eth
yrist
ors
for
42.8
6H
z.
Para
met
ers
1st
frag
men
t2n
dfr
agm
ent
3rd
frag
men
tLi
nevo
ltage
AB
AC
BC
BA
CA
CB
AB
AC
BC
BA
CA
CB
AB
AC
BC
BA
CA
CB
AB
AC
BC
Out
put
volta
geB
CB
AC
AN
ewtr
igge
rth
yrist
orN
6N
1N
2
Trig
gert
hyris
tors
N6+
P3N
1+
P4N
2+
P5C
ompl
emen
tth
yrist
ors
N5+
P2N
6+
P3N
1+
P4
Trig
ger
mom
ent
1.67
ms
25m
s48
.33
ms
Pulse
dura
tion
23.3
ms
23.3
ms
23.3
ms
Tab
le.
Con
tinue
d.
Para
met
ers
4th
fragm
ent
5th
fragm
ent
6th
fragm
ent
Line
volta
geC
BA
BA
CC
BA
BA
CC
BA
BA
CC
BA
BA
CC
BA
BA
CC
BA
BA
CC
BA
CBC
Out
put
volta
geC
BA
BA
CN
ewtr
igge
rth
yrist
orN
3N
4N
5
Trig
ger
thyr
is-to
rsN
3+
P6N
4+
P1N
5+
P2
Com
plem
ent
thyr
istor
sN
2+
P5N
3+
P6N
4+
P1
Trig
ger
mom
ent
71.6
7m
s95
ms
118.
33m
sPu
lsedu
ratio
n23
.3m
s23
.3m
s23
.3m
sN
ote:
“+”
mea
ns“a
nd”.
236

XU et al./Turk J Elec Eng & Comp Sci
First, assume that UAB is at the peak (Figure 3b). However, letter U is omitted, and UAB is simplifiedas AB here and below for simplicity. The voltages mentioned below are simplified similarly. At this moment, thefundamental wave content of the output voltage passes the zero point in the upward direction, and the outputvoltage switches from AC to BC. The latter letter C remains the same as the output voltage switches from ACto BC, which means that the conducting thyristor N5 is unchanged according to Figure 1. The former letterchanges from A to B when the output voltage switches from AC to BC, which indicates that the conductingthyristor switched from N4 to N6. AB is the highest voltage, and A is higher than B. Hence, N6 is positivelybiased when N4 is conducting state. N6 will turn on and complete the switching from A to B when N6 receivesa pulse. The output voltage will then remain as BC until the next jump. The time duration between two jumpscovers 7 line voltage pulse waves or 23.33 ms.
Second, the output voltage fundamental wave passes the zero point in the upward direction, and theoutput voltage switches from BC to BA when AC is the highest. The former letter B remains unchanged.Hence, the conducting thyristor N6 remains unchanged. The latter letter changes from C to A. Therefore, theconducting thyristor switches from N5 to N1. Accordingly, N1 is positively biased when N5 is conducting statebecause AC is the highest, and A is higher than C. N1 is then turned on and completes the switching from Cto A when a pulse is received. The output remains as BC until the next jump.
Thereafter, the subsequent steps proceed in a similar fashion and successively trigger N2, N3, N4, andN5.
The fifth line of Table is explained as follows: when a thyristor is triggered, a pulse will be simultaneouslysent to the thyristor connected in antiparallel with the new triggered thyristor. Thus, the current can freelyswitch between positive and negative because the thyristors in both the positive and negative groups are triggeredat the same time. Therefore, no dead zone exists around the zero current. In addition, no circulating currentis present even though the two triggered thyristors are simultaneously conducting because they are connectedto the same line.
The sixth line of Table shows that the thyristors (e.g., N5 and P2) are triggered at the same time whenthe new triggered thyristors (e.g., N6 and P3) are triggered to ensure that the current loop is complete.
The seventh line of Table is explained as follows: the delay time of the trigger pulse can be calculated fromthe synchronization point of the moment when AC is moving upwards and crossing the zero point is consideredto be a synchronization point. For example, the moment of the first jump when AB is at the peak is 1.67 msafter the AC upwards crosses the zero point.
The eighth line of Table is explained as follows: the duration of the four trigger pulses, which start fromthe moment determined by the seventh line.
5. Simulation and experimental analysis
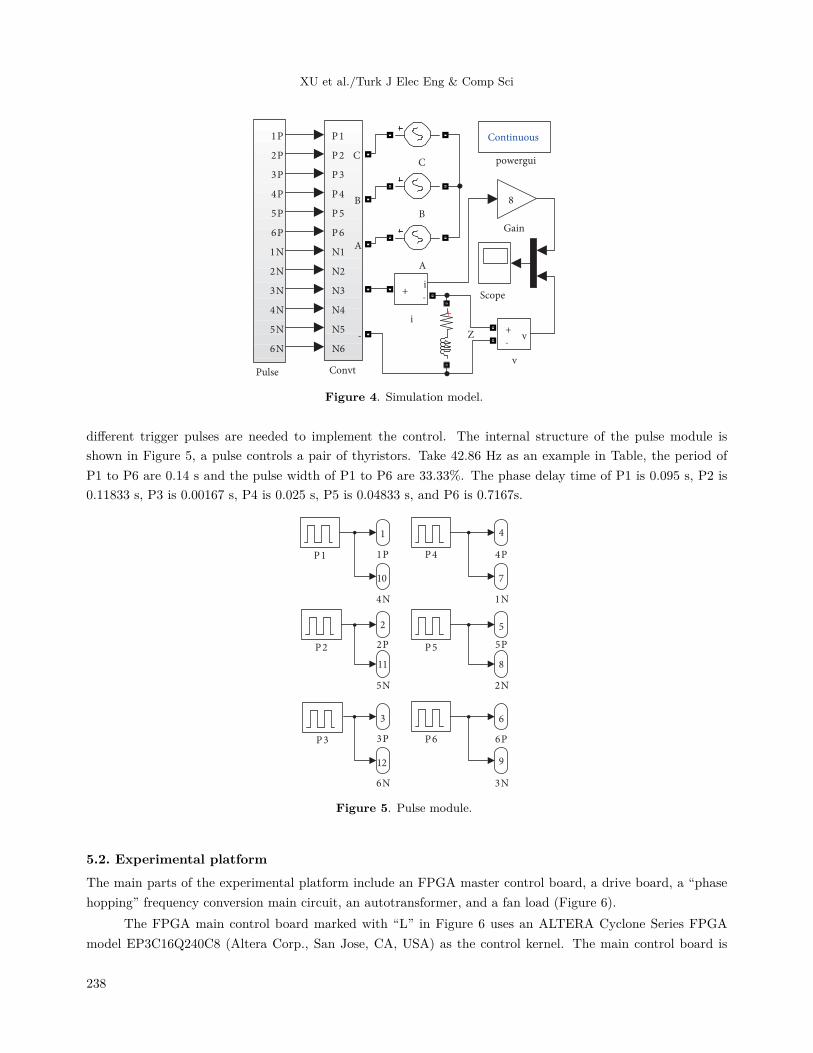
5.1. Simulation modelFigure 4 shows the simulation model. The thyristor module is denoted as “Convt” and comprises two groups ofthyristors connected in an antiparallel bridge formation. The “Pulse” block generates the thyristor pulses thattrigger thyristors in block “Convt” and is shown as a single block because of the large number of devices andthe complexity of the connections. “A, B, C” represent the three-phase power. Its peak voltage is equal to 180V. The element “Z” represents a resistance–inductance load (simulate a fan load), its inductance is 0.03 H, andits resistance is 5 Ω .
The main circuit consists of six pairs of thyristors in reverse parallel connection. Therefore, only six
237
XU et al./Turk J Elec Eng & Comp Sci
C
B
A
Continuous
powergui
P1
P2
P3
P4
P5
P6
N1
N2
N3
N4
N5
N6
C
B
A
-
Convt
1P
2P
3P
4P
5P
6P
1N
2N
3N
4N
5N
6N
Pulse
v+-
v
+
Z
Scopei
+-
i
8
Gain
Figure 4. Simulation model.
different trigger pulses are needed to implement the control. The internal structure of the pulse module isshown in Figure 5, a pulse controls a pair of thyristors. Take 42.86 Hz as an example in Table, the period ofP1 to P6 are 0.14 s and the pulse width of P1 to P6 are 33.33%. The phase delay time of P1 is 0.095 s, P2 is0.11833 s, P3 is 0.00167 s, P4 is 0.025 s, P5 is 0.04833 s, and P6 is 0.7167s.
4
4P
1
1P
6
6P
3
3P
2
2P
5
5P
7
1N
9
3N
11
5N
P3
P4
P5
P6
P1
P2
10
4N
12
6N
8
2N
Figure 5. Pulse module.
5.2. Experimental platformThe main parts of the experimental platform include an FPGA master control board, a drive board, a “phasehopping” frequency conversion main circuit, an autotransformer, and a fan load (Figure 6).
The FPGA main control board marked with “L” in Figure 6 uses an ALTERA Cyclone Series FPGAmodel EP3C16Q240C8 (Altera Corp., San Jose, CA, USA) as the control kernel. The main control board is
238

XU et al./Turk J Elec Eng & Comp Sci
Figure 6. Experimental platform.
used to output the pulse signals required by the thyristors. A drive circuit is required because the trigger signalgenerated by the main control board is weak and cannot trigger the thyristors in the main circuit. The driverboard marked with “G”, “H”, and “I” performs the required power amplification of the pulses to trigger thethyristors. The driver board also performs any required auxiliary functions, such as synchronous detection,current detection, resistance capacitance absorption, etc. The autotransformer connected to the wires markedwith “M” and is not in the figure, is used to adjust the grid voltage to the appropriate experimental voltage.The fan marked with “K” is the load for the frequency conversion circuit. Furthermore, the output frequencyof the cycloconverter can be directly observed by monitoring the changes in the fan speed. The regulated powersupply marked with “N” is used to power the control circuits.
The “phase hopping” frequency conversion main circuit comprises two three-phase bridge rectifier modulesmarked with “A” and “B” and mounted on an aluminum radiator. The trigger pulses of the inside thyristorsare driven by the part of the driver board marked with “G” and “H” and mounted on the side of the aluminumradiator. The part of the driver board marked with “I”; the other four three-phase bridge rectifier modulesmarked with “C”, “D”, “E”, and “F”; and another driver board mounted on the other side of the radiator pointedby the arrow marked with “J” are used for the experiments with multiple technology and can be omitted here.
5.3. Simulation waveforms and experimental results analysis
The trigger moment and the duration of each trigger signal when the output frequency is 45 Hz depend on similartrigger relationship as that outlined in Table. Figure 7a shows the simulation voltage and current waveformsof load. The trigger moment and the duration of each trigger signal when the output frequency is 42.86 Hz aredetermined based on the trigger relationship also outlined in Table. Figure 7b presents the simulation outputvoltage and current waveforms. In order to analyze the influence of harmonic on the system and the ability offrequency conversion in the intermediate frequency area, the third harmonic with 10% of the fundamental waveis injected into the input of three-phase power, and a 20°phase offset is set relative to the fundamental wave.Based on that condition, a simulation of 37.5 Hz is made, and the voltage and current waveforms are shown inFigure 7c. To make it clear, the current waveforms are expanded eight times.
239

XU et al./Turk J Elec Eng & Comp Sci
0.08 0.09 0.1 0.11 0.12 0.13 0.14 0.15 0.16 0.17 0.18-400
-300
-200
-100
0
100
200
300
400
0.05 0.06 0.07 0.08 0.09 0.1 0.11 0.12 0.13 0.14-400
-300
-200
-100
0
100
200
300
400
0.08 0.09 0.1 0.11 0.12 0.13 0.14 0.15 0.16 0.17-400
-300
-200
-100
0
100
200
300
400
Gainv
Gainv
Gainv
(a) 45 Hz (b) 42 .86 Hz (c) 37 .5Hz
Figure 7. Simulation output voltage (red) and current (black) waveforms.
In the experiments, the cycloconverter uses the “phase hopping” method. The output terminal isconnected with a single-phase fan. Figure 8a shows the experimental output voltage and current waveforms ofthe 45 Hz frequency. Figure 8b presents the experimental output voltage and current waveforms of 42.86 Hz.The output frequency can be read out by 1/∆T shown in the figure. The pictures show that the theoreticalanalysis is consistent with the simulation results described in the previous section.
(a) 45 Hz (b) 42.86 Hz
Figure 8. Experimental output voltage (blue) and current (yellow) waveforms.
A comparison of Figure 8a with Figure 7a shows a “phase hopping” happening for approximately every1.5 cycles of the power voltage. The analysis in Section 3.4 implies that the interval between each of the two“phase hops” is 10 line voltage pulse waves. The time of 1.5 cycles of the power voltage is 1.5 ×20 = 30 ms, whilethat of the 10 line voltage pulse waves is 10 ×3.3 = 33 ms. Therefore, the results of the theoretical analysis,simulation, and experiments are in good agreement with each other. We can obtain the same conclusion bycomparing Figure 8b with Figure 7b. An interval of approximately 1 cycle of the power voltage or 20 ms or 7line voltage pulse waves can be observed between two “phase hops”.
Figure 9 presents the harmonic simulation analysis results with a 45 Hz output current and voltage basedon the “phase hopping” frequency conversion circuit. Figure 9 shows that the total output harmonic distortionrate of the “phase hopping” frequency conversion circuit is 16.94% for current and 31.64% for voltage under thecondition that the output is a higher frequency (i.e., 45 Hz) close to the power frequency (i.e., 50 Hz). The valueallows it to be used in less demanding situations. The multiple techniques used in the conventional frequencyconversion can be combined with the “phase hopping” frequency conversion technique proposed herein if theactual application needs to further reduce the total harmonic distortion of the output. In this way, the totalharmonic distortion can be reduced significantly. For example, according to the similar simulation analysis,
240

XU et al./Turk J Elec Eng & Comp Sci
the total voltage harmonic distortion can be reduced to 9.87% if the triple technology, where three groups of“phase hopping” frequency conversion circuits are connected in series or in parallel, is used. These specificcircumstances will be detailed in another paper.
Signal
Time (s)0.06 0.07 0.08 0.09 0.1 0.11 0.12 0.13 0.14
Sig
nal m
ag.
-200
0
200
FFT window: 4 of 13.5 cycles of selected signal
FFT analysis
Frequency (Hz)0 200 400 600 800 1000
Ma
g (%
of
Fu
nd
ame
ntal
)
0
2
4
6
8
10
12
14Fundamental (45Hz) = 231.2 , THD= 16.94%
Signal
Time (s)0.06 0.07 0.08 0.09 0.1 0.11 0.12 0.13 0.14
Sig
nal m
a g.
-200
0
200
FFT window: 4 of 13.5 cycles of selected signal
FFT analysis
Frequency (Hz)0 200 400 600 800 1000
Ma
g (%
of
Fu
nd
ame
n ta l
)
0
5
10
15
20
Fundamental (45Hz) = 283.1 , THD= 31.64%
(a)current (b) voltage
Figure 9. 45 Hz output current and voltage harmonic simulation results.
6. ConclusionThe “phase hopping” frequency conversion method is realized based on the traditional cosine wave-crossingmethod by properly arranging the trigger pulses of the thyristors, connecting the cycloconverter output terminalwith a certain phase of the input, and changing the connection between the input lines from time to time. Thecycloconverter uses a “phase hopping” frequency conversion method to overcome the disadvantages of traditionalcycloconverters. Moreover, the output frequency can be a higher frequency close to the power frequency. Hence,the technique can be applied in a wider field. We verified the feasibility of the proposed “phase hopping”frequency conversion method by a simulation and an experimental analysis. The output of the cycloconverterbased on the “phase hopping” frequency conversion method will have a relatively low harmonic content andcan be directly used in applications where the harmonic content requirement is not very high. The addition ofmultiple technologies can further reduce the harmonic content, thereby expanding the range of applications.
We point out that the present study is based on the simplest design, it has the ability of changingfrequency but cannot change the output voltage; thus, it temporarily cannot be put into application in practicalproduction. However, if the “phase hopping” method is used together with the multiple technology, accordingto the method of voltage vector superposition, the overall output voltage is the vector combination of all outputvoltages of all circuit stages, so the output voltage can be changed as desired when the frequency is changed.The pertinent theory, specific experimental procedures, and phenomena will be detailed in another article.
241

XU et al./Turk J Elec Eng & Comp Sci
Acknowledgments
This work was supported by Nansha District Science and Technology Plan Project of Guangzhou, China (GrantNO. 2016CX011).
References
[1] Idris Z, Hamzah MK, Saidon MF. Implementation of single-phase matrix converter as a direct AC-AC converterwith commutation strategies. In: IEEE 2006 Power Electronics Specialists Conference; 18–22 June 2006; Jeju, SouthKorea. New York, NY, USA: IEEE. pp. 1-7.
[2] Nair HS, Ramchand DR. A new switching algorithm for an AC-AC converter with high frequency link. In: IEEE2015 Conference of the IEEE Industrial Electronics Society; 9–12 November 2015; Yokohama, Japan. New York,NY, USA: IEEE. pp. 4615-4620 .
[3] Cho Y, Cokkinides GJ, Meliopoulos AP. Advanced time domain method for remote wind farms with LFACtransmission systems: power transfer and harmonics. In: IEEE 2012 International Conference on Harmonics andQuality of Power; 17–20 June 2012; Hong Kong, China. Washington, DC, USA: IEEE. pp. 1-6.
[4] Chen X, Du QN. Research on modified pulse triggering control strategy of AC-AC converter. Colliery Mech Elect2014; 3: 34-37.
[5] Azam, MA. Three to single phase buck-boost regulated high power quality cycloconverter. In: IEEE 2012 InnovativeSmart Grid Technologies-Asia; 21–24 May 2012; Tianjin, China. Washington, DC, USA: IEEE. pp. 1-6.
[6] Symonds A, Laylabadi M. Large cycloconverter drives in mining applications. In: IEEE 2013 Industry ApplicationsSociety Annual Meeting; 6–11 October 2013; Lake Buena Vista, FL, USA. New York, NY, USA: IEEE. pp. 1-12.
[7] Bhowmik PK , Yellapragada S, Manjrekar M. Dynamic analysis and controller design for a center-point-clamped AC-AC converter. In: IEEE 2015 Applied Power Electronics Conference and Exposition; 15–19 March 2015; Charlotte,NC, USA. New York, NY, USA: IEEE. pp. 535-542.
[8] Basirifar M, Shoulaie A. A comparative study of circulating current free and circulating current cycloconverters.In: IEEE 2010 Power Quality Conference; 14–15 September 2010; Tehran, Iran. Washington, DC, USA: IEEE. pp.1-4.
[9] Imam MHT, Azam A, Azad AN, Kabir MA. Three to single phase buck and boost cycloconverters with goodinput power quality. In: IEEE 2012 Innovative Smart Grid Technologies-Asia; 21–24 May 2012; Tianjin, China.Washington, DC, USA: IEEE. pp. 1-6.
[10] Khodabandeh M, Zolghadri MR, Shahbazi M, Noroozi N. T-type direct AC/AC converter structure. IET PowerElectron 2016; 9: 1426-1436.
242