Thurston County Farmland Inventory - Home - WSU Extension Counties
23
Thurston County Farmland Inventory Summary Report to the Bullitt Foundation by Jeff Fisher and Lea Mitchell For South of the Sound Community Farm Land Trust March 30, 2009
Transcript of Thurston County Farmland Inventory - Home - WSU Extension Counties
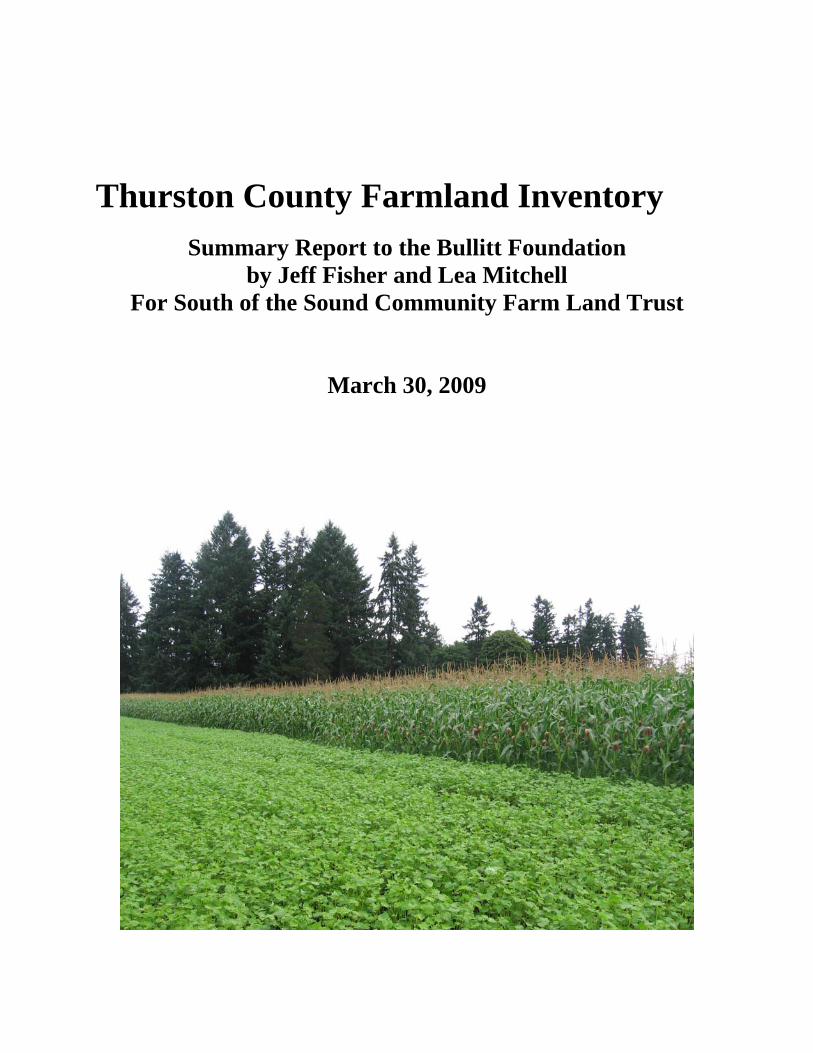
Thurston County Farmland Inventory
Summary Report to the Bullitt Foundation by Jeff Fisher and Lea Mitchell
For South of the Sound Community Farm Land Trust
March 30, 2009

South of the Sound
Community Farm Land Trust P.O. Box 12118
Olympia, WA 98508 www.communityfarmlandtrust.org
Mission
South of the Sound Community Farm Land Trust (SSCFLT) promotes a local food and farming system through the application of community supported
farmland preservation strategies, through partnerships with other organizations that increase opportunities for farms and farmers to flourish, and through public
educational outreach.
Using the model developed by community land trusts, SSCFLT acquires and holds agricultural lands for the benefit of the larger community. It provides
opportunities for farmers to lease agricultural lands at affordable rates on a long term basis, and provides opportunities for low income households to secure
housing on a long term basis that is decent and affordable.
SSCFLT promotes sustainable land use for conservation of natural resources and the long term health, safety and well being of the community (August 2008).
Board and Members
The Board and membership is composed of: 1) local farmers concerned about the economic viability of local agriculture; 2) advocates concerned about the loss of local farms and farm land
economies; 3) affordable housing advocates promoting the use of the community land trust model in rural communities; and 4) active citizens concerned about sustainable land use and
resource conservation.
Acknowledgements Many people and organizations helped create the inventory and we heartily thank them all. The project was conceived by Eric Delvin and launched with support from the Bullitt Foundation. Staff from the Evergreen State College provided computer support, the use of the Computer Applications Lab, and the ability for several students to work with South of the Sound Community Farm Land Trust on student internships during Summer 2008. The inventory is based on over thirty data sets and input from many people who provided public records, helped us evaluate and apply the data, and strategized with us. Thanks to staff from Thurston County Geodata, the Thurston County Assessor’s Office, Thurston Regional Planning Council, the Washington State Field Office of the Nature Conservancy, the Washington State Departments of Agriculture, Ecology, Fish and Wildlife, Natural Resources, and Health, the Thurston County Conservation District, the U.S. Department of Agriculture National Agricultural Statistics Service, the Natural Resources Conservation Service, the Rural Technology Institute, the Washington State Office of Farmland Preservation, and the Washington State Field Office of American Farmland Trust. In addition, we thank staff from other local farmland trusts, members of the Thurston County Agriculture Committee, and the Board and members of South of the Sound Community Farm Land Trust Above all, thanks to the farmers who farm and to the community members who buy local food and other local goods. Because of them, there are working lands to protect and local economies to support and expand.
Jeff Fisher Lea Mitchell Geographic Information System Project Manager Project Lead

Table of Contents
Project Summary …………………………………………………………1 Results ……………………………………………………………………..2 Table 1. Summary of Thurston County Farmland Inventory…………....…..…….4 Appendices ………………………………………………………………..5 Appendix I. Data Fields …………………………………………………………….…5 Appendix II. Methodology………………………………………………………….…..6 Appendix III. Supplemental Data Tables………………………………………………12 Table A. Farm Operator and Farm Sales Characteristics -12 Table B. Summary of Selected Federal Agricultural Data for Thurston County -13 Table C. Thurston County Agriculture Highlights and Statewide Rank-14 Table D. Thurston County Irrigated Crops -15 Table E. Organic Certified Businesses, Crops, and Acres in Thurston County -16 Table F. Certified Organic Farmgate Sales from Thurston County -17 Table G. Urbanization in Thurston County 1985-2000 -18 Table H. Farmland Acquisition or Easement Purchases in Five Local Counties -19 Farmland Inventory Maps Map 1. Farmland of Thurston County M-1 Map 2. Thurston County Land Cover Assessment M-2 Map 3. Thurston County Farmland and Associated Soil Types M-3 Map 4. Current Land Uses of Thurston County Farmland M-4 Map 5. Thurston County Farmland and Associated Watershed M-5 Map 6. Thurston County Farmland and Associated Conservation Areas M-6 Map 7. Thurston County Farmland, Priority Conservation, and Priority
Habitat Areas M-7 Map 8. Thurston County Farmland Local Habitat Assessment M-8 Map 9. Thurston County Farmland and Public Lands M-9 Map 10. Thurston County Farmland Proximity to Urban Growth Areas M-10 Map 11. Assessed Land Value Per Acre Thurston County Farmland M-11 Map 12. Thurston County Farmland and Long Term Agriculture Zoning M-12 Map 13. Conservation Easements and Thurston County Farmland M-13
1
Project Summary The Thurston County Farmland Inventory was completed for South of the Sound Community Farm Land Trust with financial support from the Bullitt Foundation and data contributions from government agencies, nonprofit organizations, and trade associations that work with farmers. The goal of the Thurston County Farmland Inventory was to create a countywide agriculture census and Geographic Information System (GIS) analysis that could be used to define priority conservation areas and strategies for protecting farmland and the associated natural resource values. The following questions framed the inventory focus and methodology:1
What is farmland?; Where is Thurston County’s farmland located?; What are the primary characteristics of the farmland as defined by ownership,
size, soils, current use, proximity to urban areas, conservation, and cultural values?, and
What additional characteristics should be collected in order to be able to assess how various land parcels relate to criteria that are commonly associated with farmland acquisition or purchase of development rights programs?
The core products of the inventory are: A GIS database; A set of GIS maps that summarize the core findings; An excel database that can be queried, updated, and used to assess the
characteristics of the 3,338 farmland parcels in the inventory; The ability to do analysis and data extracts for public outreach materials, and A methodology that can be adapted and used for other farmland inventories.
The inventory is a snapshot in time based on public records from over thirty data sets (Appendix I). It is supplemented by data tables from the most recent Federal Census of Agriculture and other data regarding farming and farmlands in Thurston County (Tables A-H). Although Thurston County does not yet have a purchase of development rights program, the inventory was designed to include sufficient data to apply criteria that may be developed in the future.2 South of the Sound Community Farm Land Trust will manage the inventory in accordance with all data sharing agreements and associated restrictions. Due to these restrictions, the database and GIS maps that contain sensitive information will be used for planning and academic purposes only and the maps will not be reproduced at a scale greater than 1:24,0000 or distributed to the general public.
1 See Appendices I and II for a list of the core data sources and description of the methodology. 2 The Thurston County Agricultural Committee drafted Site Selection Evaluation Criteria in 2006 as part of an effort to assess potential farmland preservation projects that may have been eligible to receive funding from Thurston County’s Conservation Futures program. This criteria is an attachment to a letter from the Agriculture Advisory Committee, to the Conservation Futures Group c/0 Michael Welter, Director, Thurston County Development Services. May 2006.
2
Results Farmlands at Risk The results of the farmland inventory suggest that a majority of Thurston County’s farmland is at risk of being converted to other uses. The analysis indicates that:
75% of the farmland is within three miles of an urban growth boundary (Map 10); Only about 51% of the farmland is in the open space tax program (Table 1); The majority of farmland is not within a Long Term Agricultural zone (Map 12); The average age of principal farm operators is 57 years old (Table A), and Of the total land in farms, the majority is rented land. 3
Thurston County Farmland and Local Farm Economy Despite the risks facing farmland and local farmers, Thurston County has a significant farmland base and local farm economy. The inventory defined 68,247 acres of farmland represented by 3,338 parcels and 1,518 ownerships (Table 1 and Map 1). Although the higher quality soils and larger tracts of farmland tend to be in the southern and eastern part of the county, farmland is dispersed throughout Thurston County on a variety of soil types (Maps 3 and 5). Through the growth of community supported agriculture, demand for local organic foods, and significant increases in organic pastures, there are over 2,900 acres of certified organic acres. Amongst western Washington’s seventeen counties, Thurston County ranks third (after Skagit and King) in terms of both the amount of certified organic acres and the estimated value of organic goods sold directly from the farm.4 Finally, in 2007 Thurston County’s farms generated an estimated $117 million in market value sales (Table C). Conservation Values Along with defining significant amounts of farmland and associated local farm economies, the inventory analysis found that an estimated 50% of the farmland in Thurston County contains, or is adjacent to, areas that provide important fish and wildlife habitat (Maps 6,7,8). This presents both an opportunity and a challenge to local farmers. It suggests that their lands may qualify for various conservation benefit programs. It also indicates that there is likely increasing pressure on them to maintain wildlife habitats. Together, these conditions call for preservation strategies that will mutually benefit farming and fish and wildlife habitats.
3 The 2007 census of agriculture defines land in farms as: primarily agricultural land used for crops, pasture, or grazing; associated woodland and wasteland that is part of the farm operation; and lands enrolled in four federal conservation programs ( Appendix B, page B-14). Data regarding rented land is from Volume 1 Chapter 2: County Level Data, Table 46. Census of Agriculture, USDA National Agricultural Statistics Service. 2009. See http://www.agcensus.usda.gov/publications/2007. 4 See Appendix III Tables E and F for a listing of the certified organic acres and organic sales data.

3
Farmland Preservation Programs The inventory found that although there are farms that have conservation easements on them to protect fish and wildlife habitats, there are no farms enrolled in the federal Farmland Protection Program 5 and there are currently no local funds dedicated to farmland preservation (Table H). According to the most recent Federal Agricultural Census, there are 17 farms and 404 acres enrolled in the federal Conservation Reserve, Wetlands Reserve, Farmable Wetlands, or Conservation Reserve Enhancement Programs. At the local level, Thurston County has created an Open Space Tax program that provides landowners the option of applying to have their property assessed at “current use” instead of “highest and best use.” As a result, their property taxes are lowered if their application is accepted. These programs provide important incentives for conservation. However, with the exception of the federal Farmland Protection Program, they are not designed to protect farmland in perpetuity or to build local farm economies. Relation to the Federal Agriculture Census The farmland inventory results vary from the most recent Federal Census of Agriculture, which defines 80,617 farmland acres and indicates an increase in farmland acres (Table B). This in contrast to the 68,247 farmland acres, and ongoing farmland loss, indicated by the inventory. These discrepancies are likely because the federal data is based on self reported information from surveys and mathematical estimates design to account for farms that are not surveyed or do not complete a survey. The farmland inventory is based on actual data about features of specific parcels. Through future collaborations, the inventory can contribute to federal survey efforts and help reduce reliance on mathematical estimates that may not be fully representative of actual farmland acres and farming activity.
Next Steps Completion of the farmland inventory has laid the foundation for future farmland preservation work. South of the Sound Community Farm Land Trust will use the inventory to:
Define priority conservation areas, partners, and viable preservation strategies;
Help develop local programs, policies, and financing to advance farmland preservation and expand local farm economies;
Improve, and advocate for, the collection of data regarding farmland conversions and other information that is currently not available or difficult to access, and
Create public outreach materials.
5 The federal Farmland Protection Program requires a 50% local match. To date, Thurston County does not have a dedicated funding program to help farmers make the match.
4
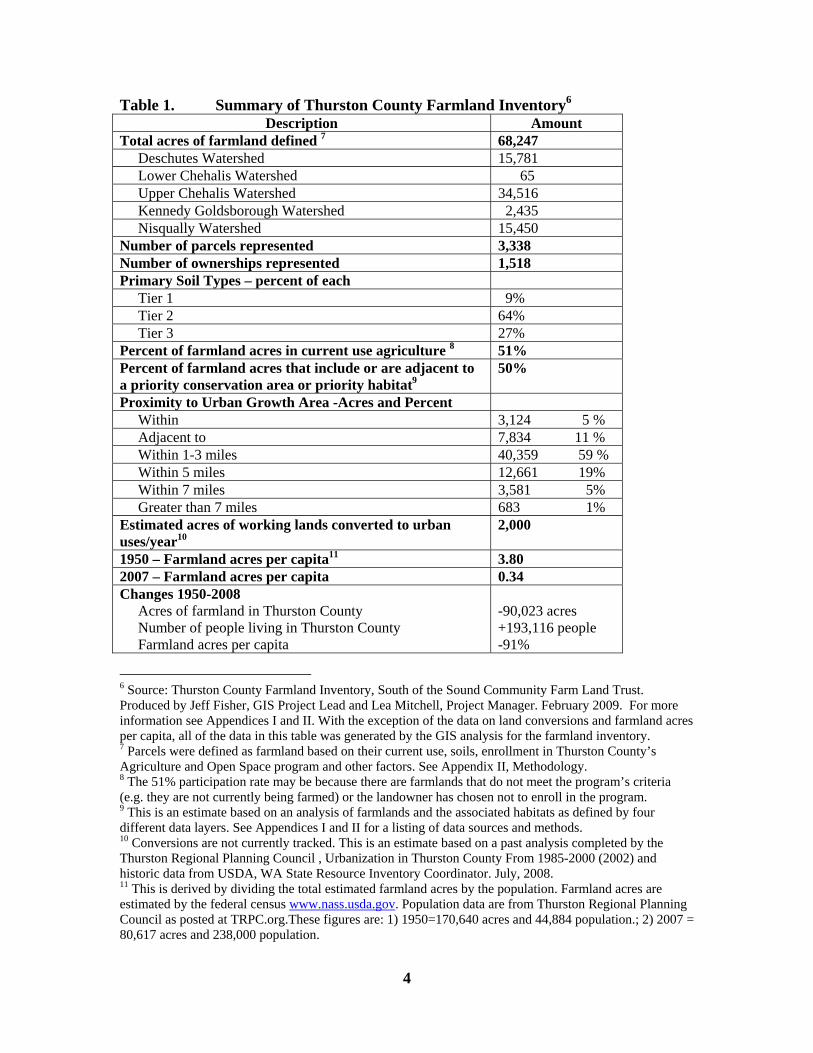
Table 1. Summary of Thurston County Farmland Inventory6 Description Amount
Total acres of farmland defined 7 68,247 Deschutes Watershed 15,781 Lower Chehalis Watershed 65 Upper Chehalis Watershed 34,516 Kennedy Goldsborough Watershed 2,435 Nisqually Watershed 15,450 Number of parcels represented 3,338 Number of ownerships represented 1,518 Primary Soil Types – percent of each Tier 1 9% Tier 2 64% Tier 3 27% Percent of farmland acres in current use agriculture 8 51% Percent of farmland acres that include or are adjacent to a priority conservation area or priority habitat9
50%
Proximity to Urban Growth Area -Acres and Percent Within 3,124 5 % Adjacent to 7,834 11 % Within 1-3 miles 40,359 59 % Within 5 miles 12,661 19% Within 7 miles 3,581 5% Greater than 7 miles 683 1% Estimated acres of working lands converted to urban uses/year10
2,000
1950 – Farmland acres per capita11 3.80 2007 – Farmland acres per capita 0.34 Changes 1950-2008 Acres of farmland in Thurston County Number of people living in Thurston County Farmland acres per capita
-90,023 acres +193,116 people -91%
6 Source: Thurston County Farmland Inventory, South of the Sound Community Farm Land Trust. Produced by Jeff Fisher, GIS Project Lead and Lea Mitchell, Project Manager. February 2009. For more information see Appendices I and II. With the exception of the data on land conversions and farmland acres per capita, all of the data in this table was generated by the GIS analysis for the farmland inventory. 7 Parcels were defined as farmland based on their current use, soils, enrollment in Thurston County’s Agriculture and Open Space program and other factors. See Appendix II, Methodology. 8 The 51% participation rate may be because there are farmlands that do not meet the program’s criteria (e.g. they are not currently being farmed) or the landowner has chosen not to enroll in the program. 9 This is an estimate based on an analysis of farmlands and the associated habitats as defined by four different data layers. See Appendices I and II for a listing of data sources and methods. 10 Conversions are not currently tracked. This is an estimate based on a past analysis completed by the Thurston Regional Planning Council , Urbanization in Thurston County From 1985-2000 (2002) and historic data from USDA, WA State Resource Inventory Coordinator. July, 2008. 11 This is derived by dividing the total estimated farmland acres by the population. Farmland acres are estimated by the federal census www.nass.usda.gov. Population data are from Thurston Regional Planning Council as posted at TRPC.org.These figures are: 1) 1950=170,640 acres and 44,884 population.; 2) 2007 = 80,617 acres and 238,000 population.
5
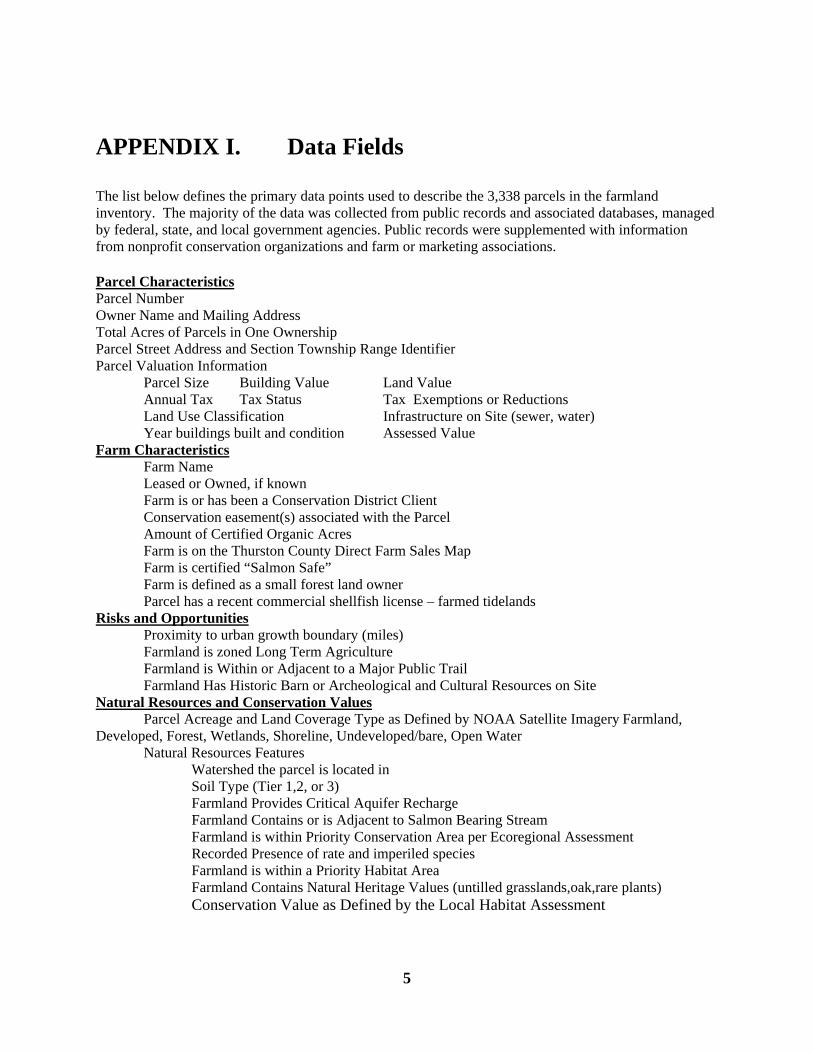
APPENDIX I. Data Fields The list below defines the primary data points used to describe the 3,338 parcels in the farmland inventory. The majority of the data was collected from public records and associated databases, managed by federal, state, and local government agencies. Public records were supplemented with information from nonprofit conservation organizations and farm or marketing associations. Parcel Characteristics Parcel Number Owner Name and Mailing Address Total Acres of Parcels in One Ownership Parcel Street Address and Section Township Range Identifier Parcel Valuation Information Parcel Size Building Value Land Value Annual Tax Tax Status Tax Exemptions or Reductions Land Use Classification Infrastructure on Site (sewer, water) Year buildings built and condition Assessed Value Farm Characteristics
Farm Name Leased or Owned, if known
Farm is or has been a Conservation District Client Conservation easement(s) associated with the Parcel Amount of Certified Organic Acres Farm is on the Thurston County Direct Farm Sales Map Farm is certified “Salmon Safe” Farm is defined as a small forest land owner Parcel has a recent commercial shellfish license – farmed tidelands Risks and Opportunities Proximity to urban growth boundary (miles) Farmland is zoned Long Term Agriculture Farmland is Within or Adjacent to a Major Public Trail Farmland Has Historic Barn or Archeological and Cultural Resources on Site Natural Resources and Conservation Values
Parcel Acreage and Land Coverage Type as Defined by NOAA Satellite Imagery Farmland, Developed, Forest, Wetlands, Shoreline, Undeveloped/bare, Open Water
Natural Resources Features Watershed the parcel is located in Soil Type (Tier 1,2, or 3)
Farmland Provides Critical Aquifer Recharge Farmland Contains or is Adjacent to Salmon Bearing Stream Farmland is within Priority Conservation Area per Ecoregional Assessment Recorded Presence of rate and imperiled species Farmland is within a Priority Habitat Area Farmland Contains Natural Heritage Values (untilled grasslands,oak,rare plants) Conservation Value as Defined by the Local Habitat Assessment

6
APPENDIX II. GIS Methodology The Thurston County farmland inventory uses a geographic information system (GIS) analysis to identify lands suitable for farming. With Thurston County parcel data as the base, a systematic approach was used to define parcels that are either currently farmed or could be in the future. Parcels identified using GIS were input into the Farmland Inventory and attributed with additional information as described below. The inventory was initiated in June 2008 and completed in February, 2009. Listed below are the key steps that were completed in order to develop the inventory. The GIS methodology and the following summary were developed by Jeff Fisher for South of the Sound Community Farmland Trust.
1. Obtain Thurston County parcel data from Thurston GeoData –June, 2008.
2. Remove parcels within incorporated cities (Olympia, Tumwater, Lacey, Tenino, Bucoda, Yelm, & Rainier).
3. Remove all publicly owned parcels 4. Search remaining parcels for those associated with large-scale commercial forestry or
mining (Weyerhauser, Green Diamond, etc.).
5. Use Excel to determine the total acreage by ownership and total assessed value by ownership and join with parcel data. Remove those property owners with less than 5 acres.
a. Export parcels table from ArcMap b. Using Excel perform a count of OWNER_NAME c. Join ownership count table with parcel data d. Remove single parcel owners with less than five acres e. Export parcels table from ArcMap f. Using Excel perform a count of PARCEL_NO g. Join parcel count table with parcel data h. Merge all split parcels i. Export parcels table from ArcMap j. Using Excel perform a sum of acreage by ownership k. Using Excel perform a sum of land value by ownership l. Join sum tables with parcel data m. Remove all property owners with less than five total acres
6. Intersect parcel data with NRCS soil data to determine parcels in the tier 1 and tier 2 soil types. Remove those parcels that fall outside of tier one and two. Tier value was determined from a mix of the Land Capability Classification and Prime Farmland Classification. See the table below for the soil tier classifications. Data Source: Natural Resources Conservation Service http://www.or.nrcs.usda.gov/pnw_soil/wa_reports.html
7
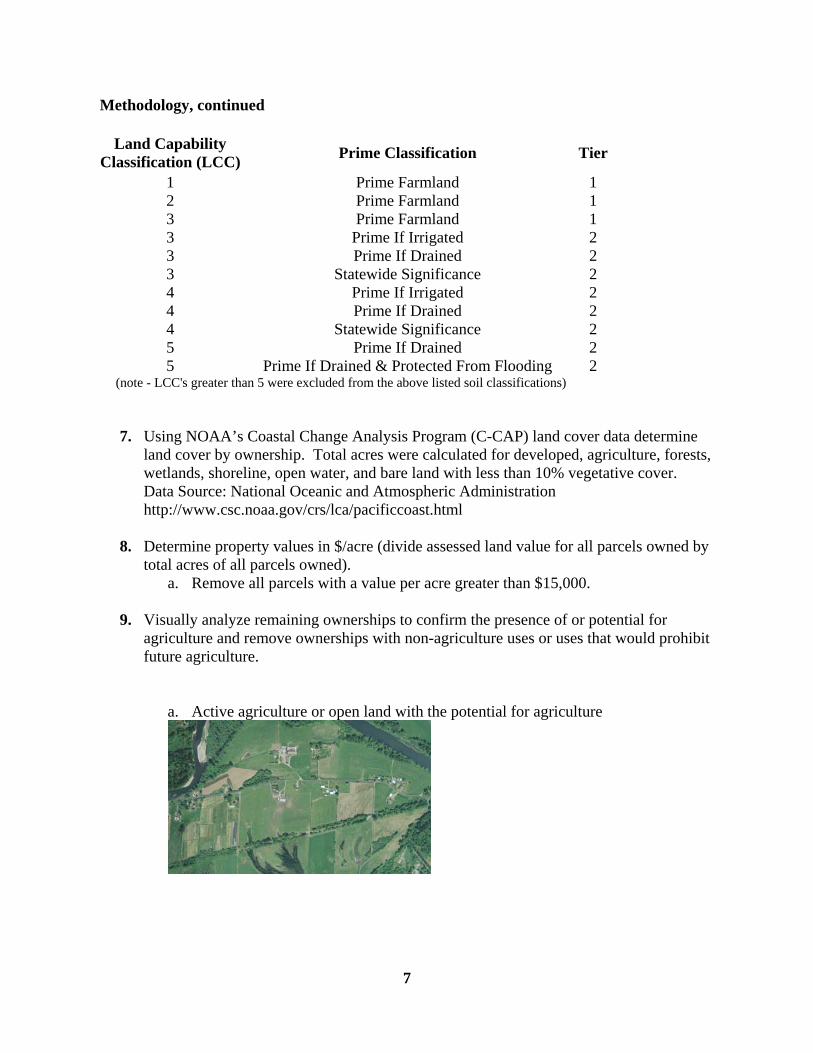
Methodology, continued
Land Capability Classification (LCC)
Prime Classification Tier
1 Prime Farmland 1 2 Prime Farmland 1 3 Prime Farmland 1 3 Prime If Irrigated 2 3 Prime If Drained 2 3 Statewide Significance 2 4 Prime If Irrigated 2 4 Prime If Drained 2 4 Statewide Significance 2 5 Prime If Drained 2 5 Prime If Drained & Protected From Flooding 2
(note - LCC's greater than 5 were excluded from the above listed soil classifications)
7. Using NOAA’s Coastal Change Analysis Program (C-CAP) land cover data determine land cover by ownership. Total acres were calculated for developed, agriculture, forests, wetlands, shoreline, open water, and bare land with less than 10% vegetative cover. Data Source: National Oceanic and Atmospheric Administration http://www.csc.noaa.gov/crs/lca/pacificcoast.html
8. Determine property values in $/acre (divide assessed land value for all parcels owned by
total acres of all parcels owned). a. Remove all parcels with a value per acre greater than $15,000.
9. Visually analyze remaining ownerships to confirm the presence of or potential for
agriculture and remove ownerships with non-agriculture uses or uses that would prohibit future agriculture.
a. Active agriculture or open land with the potential for agriculture
8
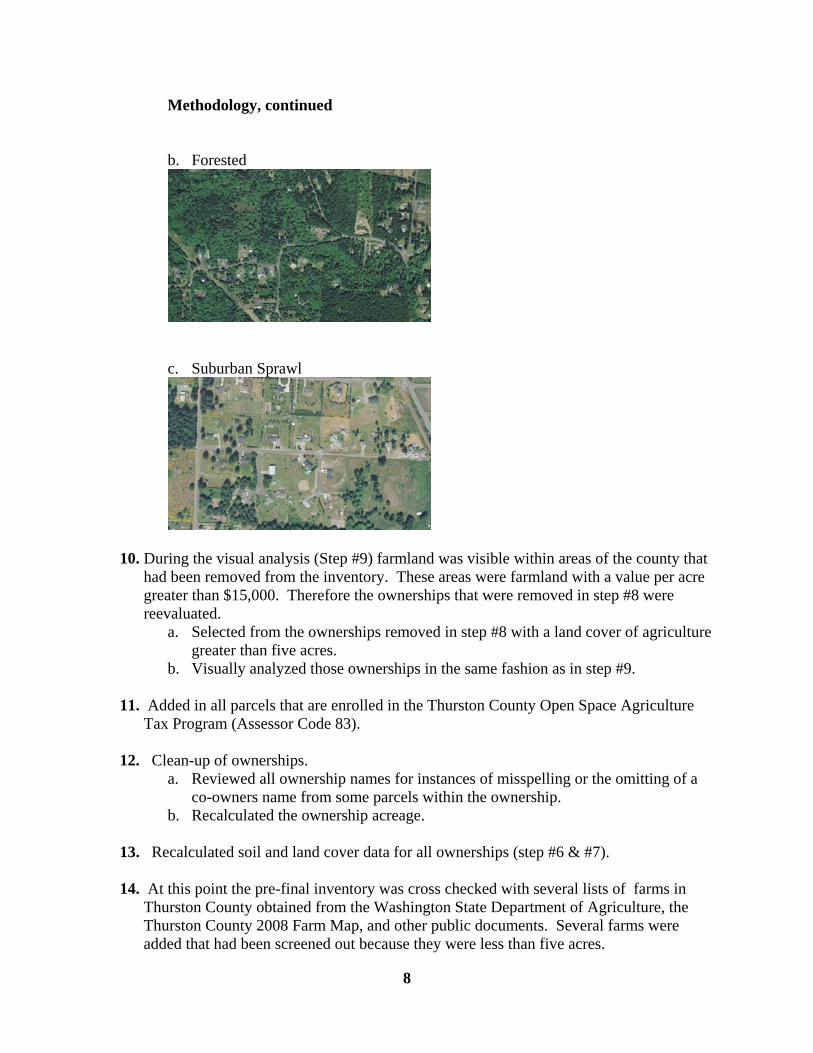
Methodology, continued b. Forested
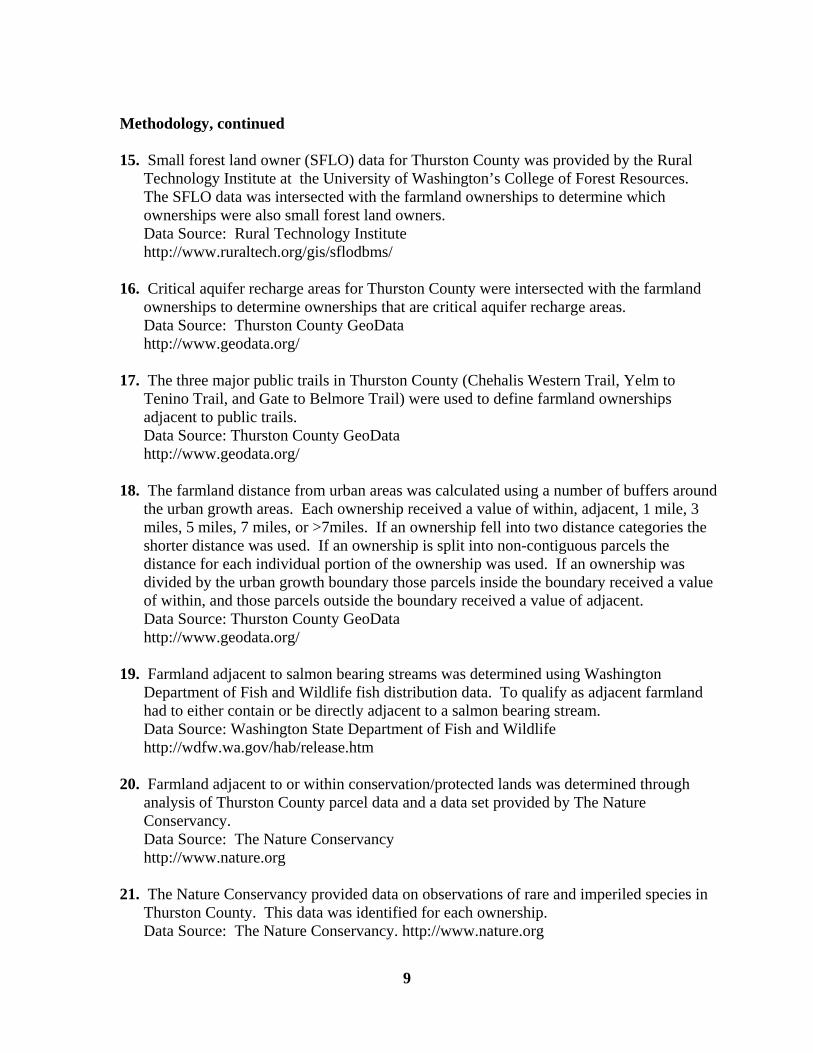
c. Suburban Sprawl
10. During the visual analysis (Step #9) farmland was visible within areas of the county that had been removed from the inventory. These areas were farmland with a value per acre greater than $15,000. Therefore the ownerships that were removed in step #8 were reevaluated.
a. Selected from the ownerships removed in step #8 with a land cover of agriculture greater than five acres.
b. Visually analyzed those ownerships in the same fashion as in step #9.
11. Added in all parcels that are enrolled in the Thurston County Open Space Agriculture Tax Program (Assessor Code 83).
12. Clean-up of ownerships.
a. Reviewed all ownership names for instances of misspelling or the omitting of a co-owners name from some parcels within the ownership.
b. Recalculated the ownership acreage.
13. Recalculated soil and land cover data for all ownerships (step #6 & #7). 14. At this point the pre-final inventory was cross checked with several lists of farms in
Thurston County obtained from the Washington State Department of Agriculture, the Thurston County 2008 Farm Map, and other public documents. Several farms were added that had been screened out because they were less than five acres.
9
Methodology, continued
15. Small forest land owner (SFLO) data for Thurston County was provided by the Rural
Technology Institute at the University of Washington’s College of Forest Resources. The SFLO data was intersected with the farmland ownerships to determine which ownerships were also small forest land owners. Data Source: Rural Technology Institute http://www.ruraltech.org/gis/sflodbms/
16. Critical aquifer recharge areas for Thurston County were intersected with the farmland
ownerships to determine ownerships that are critical aquifer recharge areas. Data Source: Thurston County GeoData http://www.geodata.org/
17. The three major public trails in Thurston County (Chehalis Western Trail, Yelm to
Tenino Trail, and Gate to Belmore Trail) were used to define farmland ownerships adjacent to public trails. Data Source: Thurston County GeoData http://www.geodata.org/
18. The farmland distance from urban areas was calculated using a number of buffers around
the urban growth areas. Each ownership received a value of within, adjacent, 1 mile, 3 miles, 5 miles, 7 miles, or >7miles. If an ownership fell into two distance categories the shorter distance was used. If an ownership is split into non-contiguous parcels the distance for each individual portion of the ownership was used. If an ownership was divided by the urban growth boundary those parcels inside the boundary received a value of within, and those parcels outside the boundary received a value of adjacent. Data Source: Thurston County GeoData http://www.geodata.org/
19. Farmland adjacent to salmon bearing streams was determined using Washington Department of Fish and Wildlife fish distribution data. To qualify as adjacent farmland had to either contain or be directly adjacent to a salmon bearing stream. Data Source: Washington State Department of Fish and Wildlife http://wdfw.wa.gov/hab/release.htm
20. Farmland adjacent to or within conservation/protected lands was determined through
analysis of Thurston County parcel data and a data set provided by The Nature Conservancy. Data Source: The Nature Conservancy http://www.nature.org
21. The Nature Conservancy provided data on observations of rare and imperiled species in
Thurston County. This data was identified for each ownership. Data Source: The Nature Conservancy. http://www.nature.org

10
Methodology, continued
22. The Washington Department of Fish and Wildlife has defined areas of Thurston County that contain unique or significant habitat and species that require special efforts to ensure their survival. Habitat type and species were identified for intersecting farmland ownerships. Data Source: Washington State Department of Fish and Wildlife http://wdfw.wa.gov/hab/release.htm
23. Priority conservation areas were identified for Thurston County as part of a larger
interagency Ecoregional Assessment. Priority conservation areas were identified for intersecting farmland ownerships. Data Source: Ecoregional Assessments, The Nature Conservancy, the Washington Department of Fish and Wildlife, the Nature Conservancy of Canada, and the Washington Department of Natural Resources. http://www.waconservation.org/ecoWillamette.shtml
24. The Washington Natural Heritage Program has identified areas with untilled grasslands
and oak dominated or co-dominated canopies. Grassland or oak types were identified for intersecting farmland ownerships. Data Source: Washington Natural Heritage Program http://www1.dnr.wa.gov/nhp/refdesk/gis/oakgrsld.html
25. The Washington Natural Heritage Program has identified areas with rare or imperiled
species and plant communities. The species name, species status, and conservation rank were identified for intersecting farmland ownerships. Data Source: Washington Natural Heritage Program http://www.dnr.wa.gov/ResearchScience/Topics/NaturalHeritage/Pages/amp_nh.aspx
26. The Thurston Conservation District provided a list of ownerships that have received
assistance from the Conservation District. These ownerships were identified in the farmland inventory data. Data Source: Thurston Conservation District http://www.thurstoncd.org
27. Watershed data was received from the Washington Department of Ecology and the
watershed was identified for all parcels. Data Source: Washington State Department of Ecology http://www.ecy.wa.gov/services/gis/maps/wria/wria.htm
28. Farmland ownerships zoned long term agriculture was identified using Thurston County
zoning data and the zoning revisions that were adopted in January, 2009. Data Source: Thurston County GeoData http://www.geodata.org
11
Methodology, continued
29. Data on tidelands certified for commercial shellfish growing or harvesting was provided by the Washington Department of Health. This data set is subject to change changes as certifications expire or are renewed on an ongoing basis. Data Source: Washington State Department of Health http://ww4.doh.wa.gov/gis/gisdata.htm
30. A Local Habitat Assessment (LHA) for Thurston County was provided by Washington
Department of Fish and Wildlife. This data set assesses habitat values on a local level, as opposed to the Ecoregional Assessments provided by data source 23., listed above. Data Source: Washington State Department of Fish and Wildlife http://wdfw.wa.gov/hab/release.htm
Data regarding existing conservation easements in Thurston County was provided by Thurston County Geodata (M-31, Thurston County Important Greenspaces completed for Thurston Regional Planning Council May, 2003) and the Natural Resources Conservation Service. Because there is no central coding system whereby parcels with easements can be readily identified through the electronic data maintained by the Thurston County Assessors Office, the inventory data on easements should be considered a preliminary draft at this time.
12
Appendix III. Supplemental Data Tables The following eight tables supplement the data that was gathers by the GIS analysis for the Thurston County farmland inventory. Because the Federal Census of Agricultural is currently the most comprehensive agricultural survey available, highlights from the survey are presented here. However, due to surveying methods and definitions used, the census data may under represent certain types of agricultural activity over represent others. As additional local information becomes available, it can be used to help ground truth future surveys.
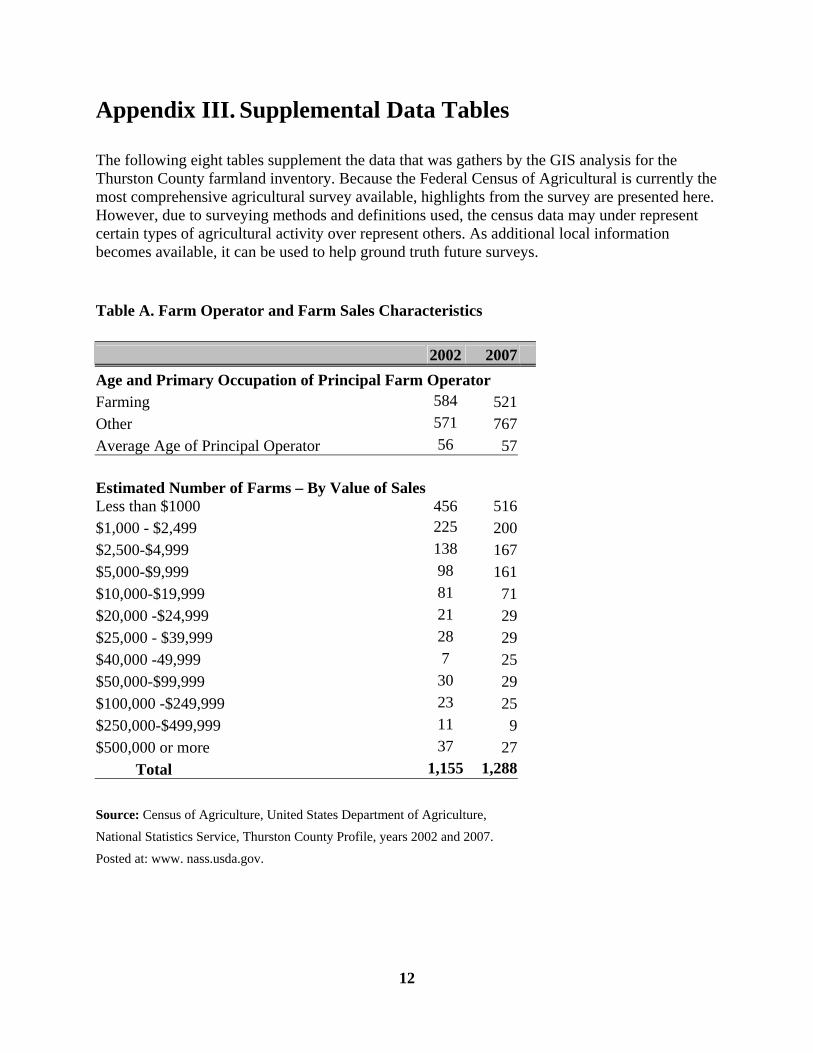
Table A. Farm Operator and Farm Sales Characteristics
2002 2007
Age and Primary Occupation of Principal Farm Operator Farming 584 521 Other 571 767 Average Age of Principal Operator 56 57
Estimated Number of Farms – By Value of SalesLess than $1000
456 516
$1,000 - $2,499 225 200 $2,500-$4,999 138 167 $5,000-$9,999 98 161 $10,000-$19,999 81 71 $20,000 -$24,999 21 29 $25,000 - $39,999 28 29 $40,000 -49,999 7 25 $50,000-$99,999 30 29 $100,000 -$249,999 23 25 $250,000-$499,999 11 9 $500,000 or more 37 27
Total 1,155 1,288
Source: Census of Agriculture, United States Department of Agriculture,
National Statistics Service, Thurston County Profile, years 2002 and 2007.
Posted at: www. nass.usda.gov.

13
Table B. Summary of Selected Federal Agricultural Data for Thurston County (1)
Item 2002 2007
Estimated Number of Farms and Farmland Acres (2) Farms (number) 1,155 1,288 Land in farms (acres) 74,442 80,616
Estimated Value of Goods Sold and Income Market value of agricultural products sold $114,675,000 $117,855,000 Crops $49,331,000 $42,427,800 Livestock, poultry, and their products $65,344,000 $75,427,200
Number of Farms - By Size 1 to 9 acres 334 425 10 to 49 acres 544 565 50 to 179 acres 190 197 180 to 499 acres 63 75 500 to 999 acres 17 14 1,000 acres or more 7 12
Cropland and Irrigated Lands Number of Farms and Acres (3)Total cropland (farms-acres) 726 -30,029 659 - 26,283 Cropland used only for pasture or grazing (farms-acres) 410 - 9,986 202 - 6,081 Harvested cropland (farms-acres) 482 - 17,720 494 - 18,066
Livestock, Poultry, and other animals Number of Farms Cattle and calves 485 535 Beef cows 412 462 Milk cows (4) 39 28 Other 34 45 Milk goats 23 50 Hogs and pigs 50 84 Sheep and lambs 60 86 Poultry - (layers,pullets,broilers,turkeys,ducks, geese) 166 247
Vegetables and Grains Number of Farms Land used for all hay and all haylage, grass silage,greenchop 290 316 Vegetables harvested for sale 45 64 Land in orchards 42 43 Corn for silage or greenchop 1 5 Oats for grain 3 0 Barley for grain 2 1 1) Federal census are based on survey results and associated estimates to account for the the percentage of surveys that are not completed. Thus the results may vary from state or local data. 2) Since 1975, the federal Census Bureau and USDA have defined a farm as a place that has or normally would have $1,000 or more in gross sales of farm products (e.g. crops,livestock,trees). They also include operations with five or more horses or ponies and no other agricultural sales. 3) Farms may have more than one main crop, thus totals below may exceed total number of farms in county. 4) Milk cows as defined by the federal census does not mean licensed dairies. It refers to milks cows that are part of a farm operation. Source: Census of Agriculture, United States Department of Agriculture, National Statistics Service, Thurston County Profile. See years 2002 and 2007.

14
Table C. Thurston County Agriculture Highlights and Statewide Rank (1) State Rank Value
Rank - Market Value of Products Sold ‘02 ‘07 2002 2007 Change
Total value of agricultural products sold 15 16 $114,675,000 $117,885,000 $3,210,000
Livestock, poultry, and their products 7 10 $65,344,000 $74,901,000 $9,557,000
Crops, including nursery, greenhouse 17 18 $49,331,000 $42,984,000 -$6,347,000
Rank - Market Value by Commodity Group Revenue
Grain,oilseed,dry beans, and sweet potatoes (D) 33 (D) $7,000 NA
Horses, ponies,mules,burros, and donkeys 1 7 $5,734,000 $1,314,000 -$4,420,000
Poultry and eggs 3 3 $18,388,000 $33,283,000 $14,895,000
Nursery,greenhouse,floriculture, and sod 4 3 (D) $37,225,000 NA
Aquaculture 5 4 $13,382,000 $13,244,000 -$138,000
Milk and other dairy products from cows 7 10 $23,918,000 $19,696,000 -$4,222,000
Hogs and pigs 8 10 $112,000 $132,000 $20,000
Other animals and animal products 14 7 $307,000 $1,294,000 $987,000
Other crops and hay 20 23 $1,106,000 $751,000 -$355,000
Vegetables,melons,potatoes,and sweet potatoes 21 15 $647,000 $2,527,000 $1,880,000
Fruits, tree nuts, and berries 22 18 $1,083,000 $2,113,000 $1,030,000
Cattle and calves (includes beef cows) 22 20 $3,437,000 $5,659,000 $2,222,000
Sheep, goats, and their products 22 7 $65,000 $279,000 $214,000
Christmas Trees,short rotation woody crops (D) 10 (D) $361,000 NA
Rank - Livestock Inventory # of Livestock
Layers 20 weeks and older 1 1 1,150,573 1,509,090 358,517
Broilers and other meat-type chickens 3 6 477,463 (D) NA
Horses and ponies 8 12 3,639 3,229 -410
Bee colonies 8 2,406 NA NA
Cattle and calves 15 17 23,928 17,225 -6,703
Rank - Acres of Top Crops Acres
Sod 1 (D) 1,282 (D) NA
Cut Christmas Trees 5 5 759 720 -39
Nursery Stock 8 8 (D) 413 NA
All Berries 10 NA 232 NA NA
Forage-hay,haylage, grass silage,greenchop 17 18 14,072 14,265 193
Notes: 1) (D) indicates that the federal government withheld data to avoid disclosing information on individual farms. NA indicates that the data are not available or possible to calculate.
Source: US Dept. of Agriculture Census of Agriculture, County Profile, Thurston, Washington. 2002 and 2007.

15
Table D. Thurston County Irrigated Crops (1)
Type of Irrigated Crop Acres
Percent of Total Irrigated Acres
Christmas Trees and Doug Fir 844 12.73%
Christmas Trees 776 11.70%
Doug Fir 68 1.03%
Fruit 295 4.45%
Apple 1 0.02%
Blueberry 98 1.48%
Caneberry 77 1.16%
Pear 2 0.03%
Rhubarb 16 0.24%
Strawberry 101 1.52%
Grains 8 0.12%
Barley 8 0.12%
Hay, Pasture, Silage 3,143 47.39%
Alfalfa,hay 32 0.48%
Grass, hay 2,902 43.76%
Green manure 67 1.01%
Pasture, irrigated 142 2.14%
Nursery 807 12.17%
Research 97 1.46%
Sod 753 11.35%
Vegetables 685 10.33%
Market crops 165 2.49%
Corn 425 6.41%
Onion 1 0.02%
Pea 45 0.68%
Pumpkin 26 0.39%
Radish 23 0.35%
Total acres in irrigated crop survey 6,632 100.00%
Notes: 1) The Washington State Department of Agriculture (WSDA) survey defines irrigated crops by
Field surveys. Due to varying survey techniques this data varies from the federal agricultural census.
The acres listed here are irrigated acres only and do not represent the full acreage for the listed crop type.
Source: 2007 irrigated crop survey data from the Washington State Department of Agriculture (WSDA).

16
Table E. Organic Certified Businesses, Crops, and Acres in Thurston County (1)
Business Name Certified Organic Crops Organic Acres
Common Ground CSA Broccoli, Broccoli seed, Spinach, Spinach Seed 0.10
Evergreen State College Organic Farm
Apples, Assorted Cut Flowers, Blueberries, Chickens (Eggs), Chickens (Meat Birds), Culinary Herbs, Ducks (Eggs), Figs, Flowers, Grapes, Kiwis, Medicinal Herbs, Mixed Vegetables, Mulberries, Mushrooms, Pears, Plant Starts, Plums, Raspberries, Strawberries. 3.00
Carr's Organic Blueberry Farms Blueberries 4.00
Yelm Earthworm & Castings Farm Apples, Garlic, Grapes, Mixed Vegetables, Onions, Plant Starts - Vegetables, Tomatoes 5.00
Nisqually River Farm Apples, Cherries, Flowers, Garlic, Herbs, Mixed Vegetables, Plums, Potatoes, Tomatoes 5.00
Left Foot Organics Blueberries, Flowers, Mixed Herbs, Mixed Vegetables, Plant Starts 5.00
Stokesberry Farm Chickens (Meat), Hay/Pasture, Pasture, Turkeys 5.50
Pigman's Organic Produce Patch
Asparagus, Beans - Green, Blackberries, Blueberries, Broccoli, Carrots, Lettuce, Melons, Mixed Vegetables, Onions, peas- Green, Plant Starts, Potatoes, Pumpkins, Raspberries, Squash, Strawberries, Sweet Corn.
6.00
Four Seasons Organic LLC Mixed Herbs, Mixed Vegetables 9.75
Rising River Farm Asparagus, Culinary Herbs, Mixed Vegetables, Pasture, Rhubarb, Rosemary 14.50
Kirsop Farms Cover crop, Mixed Berries, Mixed Vegetables, Potatoes, Squash 25.00
Johnn Schols Chard, Kale, Lettuce, Squash 26.50
Johnson Berry Farm
Apples, Blackberries, Blueberries, Cherries - Bing, Currants, Herbs, Pears, Peppers, Pie Cherries, Plums -Italian, Raspberries, Rhubarb, Strawberries.
31.00
Stoney Plains Organic Farm
Apricots, Beans, Blackberries, Chickens (Eggs), Culinary Herbs, Dry Beans, Duck (Eggs), Fallow, Herbs, Mixed Vegetables, Plant Starts, Plums, Prunes, Raspberries, Strawberries. 49.00
Lopez's Farm Blackberries, Fallow, Pasture, Raspberries, Rhubarb 60.00

17
Table E. Continued
Business Name Certified Organic Crops Organic Acres
Wil Ridge Farms Hay 60.00
Helsing Junction Farm
Asian, Bosc, Comice, Fallow, Liberty, Mixed Berries, Mixed Herbs, Mixed Vegetables, Raspberries, Strawberries. 80.50
Schorno Agri-Business Alfalfa & Orchard Grass Hay / Silage, Orchard Grass Hay / Silage 100.00
River Valley Farms Dairy Cows (Milk), Hay, Pasture 195.00
Ratcliff Tractor and Equipment Grass Hay/Haylage 195.00
Mahan Ranch LLC Cattle (Beef), Dairy Cows (Milk), Pasture 473.00
Stiebrs Farms Cattle (Beef), Chickens (Eggs), Pasture, Triticale 670.00
Johnson Farms Cattle (Beef (born after January 1, 2007), Hay, Haylage, Pasture, Silage 932.00
Total Certified Organic Acreage 2954.85
Notes
1) These figures are current as of August, 2008 and are subject to change depending on certifications.
2) In addition to the organic certified farms, there are many local farms that are operated as sustainable
farms and use organic practices but have chosen not to be certified organic.
Source: South of the Sound Community Farm Land Trust (SSCFLT).Based on
data provided by Jones, Kristy, Washington State Department of Agriculture, 8.07.08
pursuant to Public Records requested from SSCFLT.
Table F. Certified Organic Farmgate Sales From Thurston County (1)
Item 2004 2005 2006 Western WA. Rank Percent Change
2004-2006
Certified Organic Farms 18 17 19 6%
Certified Organic Acres 965 1004 2130 3rd (06) 121%
Estimated Farmgate Sales $3,212,108 $4,038,718 $4,947,077 3rd (06) 54%
Notes:
Sales figures likely represent only a portion of total farmgate sales. For example, some
producers have sales in more than one county but sales may only be linked to one county local.
The data does not include sales data from other certifiers or exempt producers with sales less than $5,000.
Finally, it includes only certified organic farms and not farms that are operated as organic or sustainable but
have chosen not to pursue organic certification.
Source: Kirby, Elizabeth and David Granatstein. Profile of Organic Crops in Washington
State - 2007. WSU Center for Sustaining Agriculture and Natural Resources. May 2008.

18
Table G. Urbanization in Thurston County 1985-2000 (1)
Local Watershed Total Acres Forested
Lands Agriculture
Lands Shrub Lands
Total Acres Urbanized
Percent of Urbanized Acres that were Agriculture Lands
Black River 78,971 4,248 2110 1551 7,909 26.68%
Budd/Deschutes 104,019 4,422 1427 1299 7,148 19.96%
Chehalis River 47,034 699 3264 505 4,468 73.05%
Eld Inlet 23,534 1,193 73 199 1,465 4.98%
Henderson Inlet 31,832 2,547 1470 445 4,462 32.94%
Nisqually River 88,640 4,890 1275 73 6,238 20.44%
Skookumchuck River 55,163 35 236 20 291 81.10%
Totten Inlet 21,401 519 39 66 624 6.25%
West Capitol Forest 19,272 0 0 0 0 0.00%
Total 469,866 18,553 9,894 4,158 32,605 30.35%
Note: 1) This is the most recent data available regarding conversions of working lands in Thurston County.
There is currently no system in place to track the urbanization or conversion of working lands.
Source: The Rate of Urbanization and Forest Harvest in Thurston County, 1985-2000.
Thurston Regional Planning Council, 2002.

19
Table H. Summary of Farmland Acquisition or Easement Purchases in Five Local Counties
County
Designated Funds
Available
Year of Inception/
First Easement Acquisition
Easements/ Restrictions
Acquired Acres
Protected
Program Funds
Spent to Date
Additional Funds
Spent to Date
Primary Funding Sources
Thurston $0 1996/1998 18-Nisqually 942 $2,241,122 N/A Property tax
King $1,600,000 1979/1984 220 13,265 $60,500,000 N/A
Appropriations, bonds, private & foundation contributions, property tax
San Juan $2,500,000 1990/1994 13 1,156 $2,219,752 0
Bonds, property tax,
real estate transfer tax,
timber excise tax
Skagit $1,875,275 1996/1998 104 6,078 $4,376,029 9,029,520
Local government
contributions, private &
foundation contributions, property tax, state grants,
timber excise tax
Whatcom $307,653 2001/2002 8 571 $1,327,600 3,751,841
Property tax, real estate excise tax
Notes: 1) NA indicates data was not readily available or reported. 2) The data listed here is subject to change as additional acquisitions occur. 3) The counties listed here are those for which data was available from the Farmland Information Center. This list is not representatives of all Washington state counties.
Source: Farmland Information Center. Status of Local Pace Programs.2008.