
THRUST VECTOR LOAD CELL · balance for measuring rocket engine thrust. ... and can be corrected for...
28
AEDC-TR-70-246 NQV EXPERIMENTAL EVALUATION OF A THRUST VECTOR LOAD CELL R. W. Postma Rocketdyne November 1970 This document has been approved for public release and sale; its distribution is unlimited. ARNOLD ENGINEERING DEVELOPMENT CENTER AIR FORCE SYSTEMS COMMAND ARNOLD AIR FORCE STATION, TENNESSEE ****** CF p
-
Upload
dangkhuong -
Category
Documents
-
view
220 -
download
2
Transcript of THRUST VECTOR LOAD CELL · balance for measuring rocket engine thrust. ... and can be corrected for...
AEDC-TR-70-246 NQV
EXPERIMENTAL EVALUATION
OF A
THRUST VECTOR LOAD CELL
R. W. Postma
Rocketdyne
November 1970
This document has been approved for public release and sale; its distribution is unlimited.
ARNOLD ENGINEERING DEVELOPMENT CENTER
AIR FORCE SYSTEMS COMMAND
ARNOLD AIR FORCE STATION, TENNESSEE
****** CF p

imm When U. S. Government drawings specifications, or other data are used for any purpose other than a definitely related Government procurement operation, the Government thereby incurs no responsibility nor any obligation whatsoever, and the fact that the Government may have formulated, furnished, or in any way supplied the said drawings, specifications, or other data, is not to be regarded by implication or otherwise, or in any manner licensing the holder or any other person or corporation, or conveying any rights or permission to manufacture, use, or sell any patented invention that may in any way be related thereto.
Qualified users may obtain copies of this report from the Defense Documentation Center.
References to named commercial products in this report are not to be considered in any sense as an endorsement of the product by the United States Air Force or the Government.

AEDC-TR-70-246
EXPERIMENTAL EVALUATION OF A
THRUST VECTOR LOAD CELL
R. W. Postma Rocketdyne
This document has been approved for public release and sale; its distribution is unlimited.

AEDC-TR-70-246
FOREWORD
The work presented herein was sponsored by Arnold Engineering Development Center (AEDC), Air Force Systems Command (AFSC), Arnold Air Force Station, Tennessee, under Program Element 6S701F, Project 4344, Task 37.
This report was prepared i by the Research Division of Rocketdyne, a Division of North American Rockwell Corporation, Canoga Park, California, under Air Force Contract F40600-70-C-0007, "Research Contract for the Evaluation of a Thrust Vector Load Cell." The contract consisted of the instrumentation and calibration of a half-scale model previously fabricated and partially strain gaged under Contract F40600-68-C-0004, "Research of a Vector Thrust Load Cell," Report No. AEDC-TR-64-233. Inclusive dates of the present evaluation were November 1969 to February 1970. This report has been designated R-8254 by Rocketdyne. The manuscript was submitted for publication IS June 1970.
The author is particularly indebted to J. LeFevere and others associated with the NAR Tri-Sonic Wind Tunnel Facility who provided invaluable advice and assistance in the calibration of the model.
The reproducibles used in the reproduction of this report were supplied by the authors.
This technical report has been reviewed and is approved.
David G. Francis Harry L. Maynard First Lieutenant, USAF Colonel, USAF Research and Development Division Director of Technology Directorate of Technology
AEDC-TR-70-246
ABSTRACT
This report describes the results of an experimental evaluation of a half-scale (physical size) model of a previously analyzed six-component force balance for testing rocket engines. The force range of the model was scaled down from 5000 Ibf to 200 lbf, and structural parameters were scaled to represent those of the full-scale version which was analyzed under Contract F40600-68-C-0004. The evaluation includes the determination of (1) first- and second-order interactions of single and combination loads and (2) the effect of combination loads at expected gimbal points for typical rocket engines. The data which are presented in tabulated form, validate the prior analysis, and demonstrate that short force measuring links, assembled into a compact integral structure, do not result in excessive interactions.
m
AEDC-TR-70-246
CONTENTS
FOREWORD Ü ABSTRACT ill
I. SUMMARY 1 II. INTRODUCTION 3
III. DESCRIPTION OF APPARATUS 4 3.1 Model Cell 4 3.2 Calibration Rig 6
IV. CALIBRATION AND DATA REDUCTION PROCEDURES 7 V. RESULTS 10
5.1 Calibration Constants 10 5.2 Tabulated Results 11
VI. DISCUSSION OF RESULTS 12 6.1 Angular Precision 12 6.2 Precision of Thrust Magnitude 14 6.3 Precision of Vector Location 16
VII. CONCLUSIONS 17
ILLUSTRATIONS
Figure
1. Scale Model Vector Thrust Load Cell 18 2. Force Link Arrangement of Model Cell 19 3. Installation on Calibration Rig 20
TABLES
I. Calibration Constants 10 II. Results (Corrected for First Order Interactions) 13
A E DC-TR-70-246
SECTION I
SUMMARY
fills evaluation of a scale model vector thrust load cell has served to
validate the analytical study of the concept of using an integral force
balance for measuring rocket engine thrust. The precision of the model
demonstrated capability to exceed the 1/3 vector angle final accuracy goal
by an order of magnitude and readily achieve the 0.020-inch vector location
and l/2 percent thrust amplitude accuracy goals of the preceding contract.
The basic structure of the design tested shoved that it is feasible to
build a balance comprised of short, rigid force-measuring links assembled
into a compact structure located at the front of the rocket motor. The
balance tested in this program was purposely designed to demonstrate the
capability to achieve low interactions between the axial force links and
the side force links. The design was intentionally kept elementary so as
to make its understanding and analysis as simple as possible.
Having demonstrated these objectives, it fs worthwhile to reflect on the
Importance of low interactions. Although such qualities as low interaction
and linearity are the usual criteria for a successful six-component force
balance, accurate results can be achieved if relatively large first-order
interactions and non-linearities are repeatable, can be accurately evaluated
by proper calibration, and can be corrected for in the reduction of test data.
From a practical point of view, second-order interactions caused by balance
distortion under load should be small because many combinations of calibration

AEDC-TR-70-246
loads are needed to evaluate them. The second-order interactions in this
testing vere demonstrated to be insignificant as predicted by the previous
analysis.
In contrast to other balance geometries analyzed in the previous study (Ref.
1), it is a characteristic of the balance design tested that the precision
of vector location depends primarily on force link precision rather than
on the structural geometry. The precision achieved during this testing
did not reach the ultimate precision capabilities of high precision load
cells or wind tunnel balances although the vector location and magnitude
precision vere veil vithln the objectives of this program. As discussed
in the preceding study, Important factors in this concept are (l) the
convenience of being able to evaluate interactions on the special cali-
bration rig prior to aligning the balance to the engine, (2) the ability
to assemble the balance and engine on the test stand, and (3) the ability
to perform final calibrations before and after test firing. As discussed
in the section on results, the Improvement of force cell precision is
partly a matter of reducing strain-gage creep and further refinement of
calibration technique.
A E DC-TR-70-246
SECTION II
IHTRODUCTION
In rocket engine development and production acceptance static testing it
is frequently essential that the magnitude, direction, and location of the
net thrust vector he determined. This is currently accomplished through
use of multi-component thrust stands comprised of externally arranged
load-measuring assemblies. Because of the obvious operational short-
comings of such arrangements, the idea of a single transducer which could
be used to obtain thrust vector data has long been attractive. But there
was little progress toward achieving such a device until the Arnold Engi-
neering Development Center sponsored the analytical evaluation of the
concept in 1968 under Contract F^o6oo-68-C-0004.
The conclusions from this study (Ref. l) indicated that a vector thrust
load cell with an integral propellent compensator is capable of providing
the general advantages of:
1. Reduced on-site calibration effort
2. Simplified alignment of the rocket engines
3. Improved thrust measurement accuracy for liquid propellent rockets.
Because of the unorthodox force link geometries, the short force link lengths,
and the stiff flexures and force links that were incorporated in the basic
concept analyzed; an experimental evaluation of a model transducer was recom-
mended* This report describes the experimental program which was carried
out to confirm the analytical conclusions.
AEDC-TR-70-246
SECTIOK III
BESCRIPTIOH OF APPARATUS
3.1 MODEL CELL
A thrust cell for use over a range of 1000 to 20,000 pounds of axial
o force at vector angles up to 12 vas considered for the analytical study.
A model cell (Fig. 1) based on the following design and scaling considera-
tions, vas completed and used for the experimental evaluation.
1. The -dimensions vhich establish kinematic relationships are
half of those specified for the full-scale basic design.
These dimensions are lengths of force links, positions of
force links, and plate diameter. The overall size of the
model is 7-1/8 inches diameter by 3-3 A inches.
2. Load capacity vas scaled dovn 25:1. nominal axial thrust capacity
i of the model is 200 lbf compared to 5000ilbf and side thrust
capacity of UO lbf compared to 1000 lbf.
3. The reduced load capacity allowed use of jflexures machined as two
short small diameter rods near the end of each force link. Because
each of these rod flexures provides three degrees of freedom, the i
total number of flexures Is reduced in the ratio of 5:2 compared
to the full-scale design (where four circular flexures and one
cruciform torsion flexure are needed per force link).
i
AEDC-TR-70-246
k. Restoring moments caused by bending and torsion of the rod
flexures are approximately the same percentage of applied
forces as the circular arc flexures used In the full-scale
design. Because rod flexures are much stlffer in bending than
circular arc flexures, the reduced loads were necessary to allow
the cross-sectional areas of the rods to be scaled dovn. The
result is that the relative bending stiffness (also referred to
as percentage redundancy) of the half-scale model is the same as
the full-scale design*
5. Hon-linear, second-order Interactions are also designed to be the
same as in the full-scale version. Consequently, angular dis-
tortion of the balance under nominal load is the same. To accom-
plish this, compression and tension deflections of flexures and
force cells, machined as part of each force link, are scaled to
one-half at nominal load (approximately 0.001 inch vs. 0.002 inch).
The thickness of the two circular plates and the size of brackets
supporting side force links were also scaled so that calculated
plate and bracket deflections are reduced to one-half at nominal
loads.
6. Force cells, as veil as flexures, were machined as integral parts
of the force links. The force cells are short columns with "i"
cross sections that are strained in compression or tension. Strain
gages can be bonded to either the webs or the outsides of the
flanges of the axial force cells (L^, Lg, and L.,). The side force
cells have sufficient space for strain gages on the flanges only.
AEDC-TR-70-246
7. The force links, plates, and. brackets were machined from 17-4 PH
corrosion-resistant steel, the same material which would be used
for a full-scale working model. Force links were age-hardened,
after partial machining to achieve the high yield strength needed
for repeatable stress-strain characteristics in force cells and
flexures.
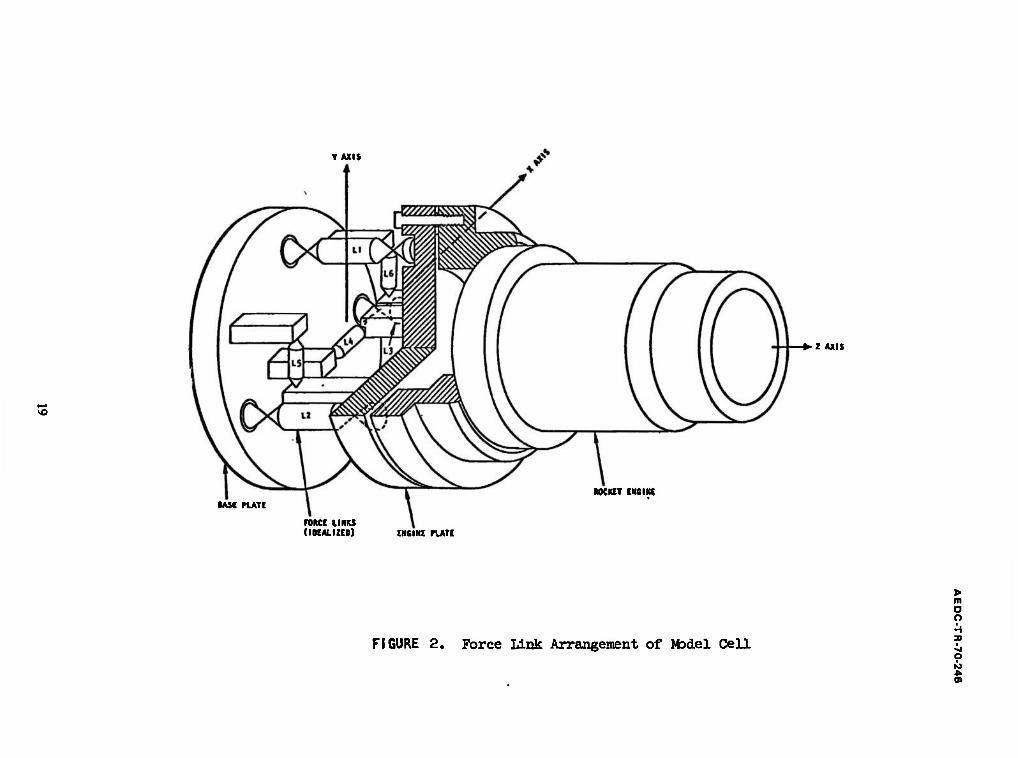
8. Semi-conductor strain gages were bonded to the three axial force
links, L^, Lp, and L? (Fig. 2) and the side force link, LL. These
strain gages were wired into Wheatstone bridge circuits and temp-
erature compensated as usual.
9. The alignment of the axial load and side load to the reference plane
was controlled by the use of precision levels. The precision of the
level used to align the space of the cell has a resolution of .00002
radians. The level used to align the axial force rod has a resolution
of .00008 radians. During the application of loads to the balance,
the base of the balance was realigned by observing these two levels
to compensate for balance and support deflections.
3.2 CALIBRATION RIG
The calibration rig used for this work is the wind tunnel balance certifi-
cation equipment at the North American Rockwell Corporation, Los Angeles
Division, Tri-Sonic Wind Tunnel. In addition to the high precision align-
ment, fixtures, this system has digital readout instruments for use with
strain gages.
'The model cell is shown mounted on the movable sling of the calibration
rig in Fig. 3»
AEDC-TR-70-246
SECTION IV
CALIBRATION AND DATA REDUCTION PROCEDURES
Calibration constants including correction terms for first-order interactions
were obtained by applying loads directly in line with the four strain-gaged
force links (L-,, 1^, La, and L. of Fig. l).
The data reduction was accomplished using existing computer programs at the
Tri-Sonic Wind Tunnel. Least squares second-degree best-fit curves were
obtained for the primary constants and first-degree curves for the inter-
action terms. For loadings at other points than the four force links, pseudo -
reaction forces at the four calibration load stations were obtained from the
following equations.
2 CD Rl " (B11E1 + C11E1 ) + ^2*2 + *L5R3 + \k*k
R2 = J^Rl 4 (*22E2 + C22E22) + M23R3 + *W*1*
R3 = M3lHi+ *3&> + (B33E3 + C33R32) + "3UR4
Rk = Mj^ -f M42R2 -f M43R3 4- (B^ 4 C^2)
In these equations the B.^ terms are forces at the four load stations in
line with the force links, and the 3i terms are the electrical outputs in
millivolts. The B^ and Ci;, terms are constants describing the calibration
curves obtained from calibration loads over the respective force link Lj_
(lb-volts/mv and lb-volts /nnr respectively). The M terms are considered
The reaction forces may be considered to exist at these points although the input forces are reacted at the actual force link locations.

AEDC-TR-70-246
to be interaction terms with reference to these four load stations (lb/lb)*
These terms represent the partial derivatives of applied calibration force
to the apparent force indicated at another load station and are computed
from the calibration data by:
Bll
*U B (2)
ij
Here the B.. terms are the interaction slopes from the calibrations in
lb-volts/mv.
Since the objective of the data reduction is to compute the magnitude,
direction, and location of the external force vector, another set of equations
is written to translate the pseudo-reaction forces obtained by solution of the
preceding equations for cases where an axial load at the center is combined
with a side load at some known distance from the center of the balance. The
first set of equations was solved by iteration, using the standard computer
program and the resulting reaction forces were entered into the following set
of equations:
Fz = Rl+ R2 +R3
My. ■ R^ -f RgXg -f" R^x^
F » v? 2
6 = arc tan
ÜL F. z
Xx « .009 inch
X2 - 2.167 inch
X3 ■ -2.I6I inch
(3)
AEDC-TR-70-246
By this method the strain gage voltages E. produced by known input forces
Fz and F have been used to compute reaction forces RJ at the calibration
load stations which are then translated to the calculated external thrust
vector for comparison vith the known thrust vector.
AEDC-TR-70-246
SECTION V
RESULTS
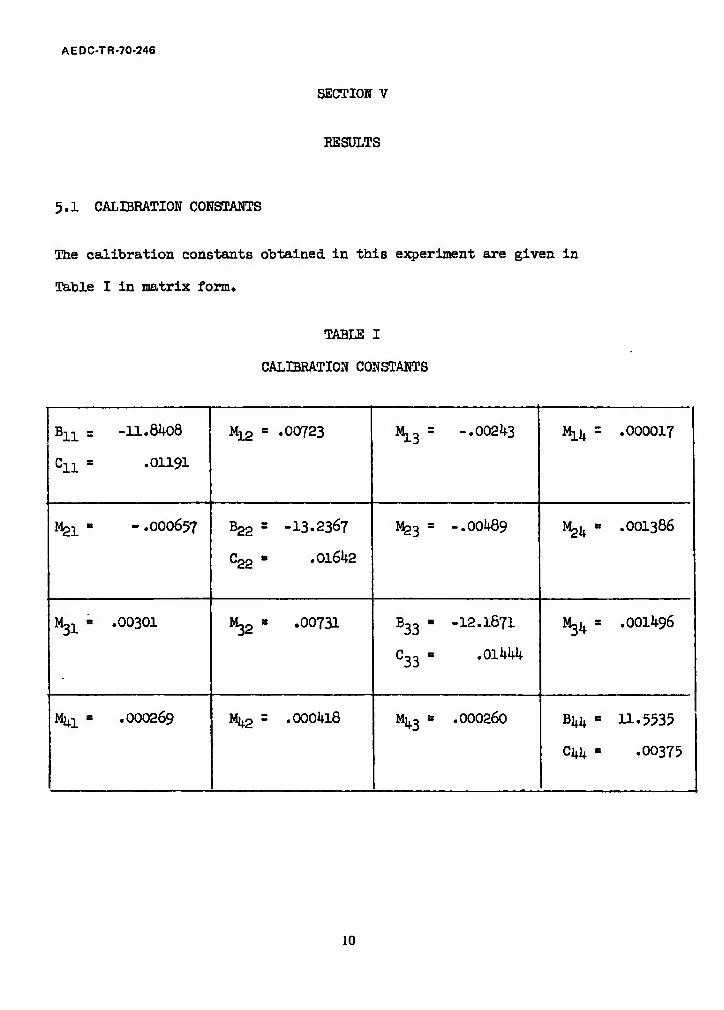
5.1 CALIBRATION CONSTANTS
The calibration constants obtained in this experiment are given in
Table I in matrix form.
TABLE I
CALIBRATION CONSTANTS
B11 = -11.8J+08 M12 * .00723 ^3 = -.002^3 Ml4 = .000017
Cll * .01191
%L = -.000657 B22 =
c22 =
-13.2367
.01642
^3 = -.00489 %*" .001386
M31i .00301 M32S .00731 B33 "
C33-
-12.1871
.01444
V = .OOI496
Min B .000269 Mlt2 = . 000418 M^3 = .000260
Ckk ■
11.5535
.00375
10

AEDC-TR-70-246
5.2 TABULATED RESULTS
Table II compares the measured values of thrust vector magnitude angle
and location (corrected for first-order interactions from Table I) with
the calibration inputs of the same parameters.
11
AEDC-TR-70-246
SECTION VI
DISCUSSION OF RESULTS
6.1 ANGULAR PRECISION
The experimental results satisfactorily accomplished the main objective of
this program: that of evaluating the basic design described as the ortho-
gonal tripod geometry in Ref. 1. Mast noteworthy, the first-order inter-
actions resulting from force link misalignment were very small and were
readily corrected for as a routine procedure in data reduction. Also,
the second-order interactions caused by angular distortion of force links
under load were sufficiently small that very high angular precision was
achieved by accounting for only the first-order interactions. The angular
measurements would still have been very precise if the first-order inter-
actions were also ignored.
The interaction caused by misalignment of the axial force links (see
Section 7.2.1, Ref. l) is given by the sum of Hin * «YQ + HV. in the cali-
bration matrix (Table I) which is equal to .0003 radians for a purely axial
load. The results corrected for this interaction (shown in Table II) gave 2
a 2 G~ error of .00016 radian for all purely axial loads (© - 0) and
.00036 radian for all load combinations including angles up to 22° of arc.
The maximum error as shown in the tabulated results in Table II was .OOOVf
radian at 11.$ .
During the combination load tests the side loads were applied at a station
representing a typical gimbal location. This location of z - 6.255 inches
from the center of the balance would be equivalent to 12*510 inches in a
full-scale model. 2Twice the standard deviation represents a probability of .95 that an individual error will be less than the 20" error (for large sample uses). This is sometimes stated as the 95$ confidence level.
12

AEDC-TR-70-246
RUHT»
Ban SB ions nag *■ *x lbf Ibf
50 0 100 0 200 0 300 0 »00 0
am FARUmSES
(Come tod For hrat Ordar Interactions)
■nSDKsD mK3 «ASBBD UCATIOI (II xy PL/Uffl)
♦ Boaraa«
0 0 3 3 3
UCASKH ■OSEOLTAIT
ran lauaram urns
MRU • USOR
naiLiAR FORSI
OMBUJI
L0CAT3W x
Inoboa
-.0102 -.0107 -.0106 -.0105 -.0101
AS DlbVJHTIOI
X
BIAS
Km ■
H.A. I.A. I.A. I.A. I.A.
X lnohfti
0 0 0 0 0
T 7 <6r SBAEDD
.076 -.002 -.090
.301 ■ 336
X i
IS 50 100 200 300 LOO
.00002
.00008
.00005
.00001 -.00002
Dagraos Indiana
.00002
.00008
.00005
.00001 -.00002
50.038 99.998
199.B19 300.COL 400.1*2
Inebaa
-.0102 -.0107 -.0106 -.0105 -.0101
Inobti
-.0022 -.0027 -.0026 -.0025 -.0021
Inchon
.0002 -.0003 -.3002 -.0001 .0003
Ararat* ■ - .OUh. -.002* Tbft raaalalng data vor« taten on tae following day. Calibrations avvr forao llnoa L^, I«, and L» vor* porforaoA la Hun» 13, 1*, and 13 of tba praoodlnn dar.
17 SO 50 50
0 5
10
0 5-72
11.32
I.A. 6.255 6.253
0 .6255
1.2510
50 50.249 50.990
io99»7 .19691
5-70 11.28
-.OOOO8 -.00019 -.000*7
50.032 50.188 50.9*9
.00* -.121 -.082
-.0107 .6162
1.2*1*
-.0107 -.0093 -.0095
-.0027 -.0013 -.0015
-.0003 .0011 .0009
IB 100 100 100 100 100
0 5
10 15 20
0 2.87
B.53 11.32
I.A. 6.255 6.255 6.255 6.255
0 .3127 .6255 .9382
1.2510
10c 100.125 100.199 101.11s 101.980
-.0300B .W ■09932 .1*852 .19693
2.85 5.69 8.51
11.26
-.30008 -.00025 -.0003* -.OOO36 -.000*6
99.928 100.062 100.»36 101.010 101.6*0
-.072 -.063 -.062 -.107 -.137
-.0102 .3022 .6162 .9295
1.2*33
-.0102 -.0105 -.0093 -.0087 -.0077
-.0022 -.0025 -.0013 -.0007
.0003
.0002 -.0001
.0011
.0017 .0027
*A but flaxura on taa «xLal for» oallbratlon rgd wu ronlacod after Run 16.
19 130 150 150 150
0 10 20 30
0 3-82 7.63
11.32
S.A. 6.255 6.255 6.255
0 .«169 .8399
1.2510
15c.000 150.333 151.327 152.971
.00018
.06663
.132*5
.19708
.01 3-82 7-59
11.29
.00018
.00011 -.03010 -.00030
150.061 150.179 151.21* 152.800
.0*3 -.102 -.075 ..112
-.0017 .«171 .8*0*
1.2517
-.0017 .0032 .0005 .0007
.0007
.0026
.0029
.0031
so 200 200 200 200 200
0 10 20
s 0
2.87 5.72 6.53
11.32
I.A. 6.255 6.255 6.255 6.255
0 .3127 .6255 ■9382
1.2510
200.000 200.2*9 20C.998 202.237 203.961
.00008
.0*985
.09996
.1*872
.19722
2.86 5.70 8.5s
11.30
.00008 -.00009 -.0001D -.00016 -.00016
199.918 200.196 200.928 202.066 203.6*3
-.0*1 .123
-.03* -.06* -.155
-.003* .3127 .6233 .9371
1.2506
-.003* -.0060 ..0022 -.0011 -.0002
-.0010 .002* .0002 .0013 .0022
ao.i
300 300 300
0 10 20 0 0
0 1« 3.82
C 0
I.A. 6.255 6.255 I.A. I.A.
0 .2065 .11T0
3 3
300.000 300.167 300.666 300.000 loc.ooo
-.00002
.00003
.00002
1.91 3.82
-.00002 .00009
-.03013 .00003 .00002
300.126 300.IS6 300.662 300.1*5 »00.194
■0*3 .007
-.001 .0*8 .0*9
-.0063 .2033 .»128
-.0060 -.0073
-.OO63 -.005* -.00*8 -.0060 -.OC73
-.0039 -.0030 -.002* -.0036 -.00*9
21 50 100 150 200
0 0 0 0
0 0 0 0
I.A. I.A. I.A. I.A.
0 0 0 0
50 100 150 200
.00008
.00000 -.00002
.0001*
: .00006 .00000 .00002 .0001*
49.930 100.030 1*9.960 200.080
-.0*0 .030
-.026 .0*0
-.0031 .0011
-.0016 •.0038
.0031
.0311 -.0016 -.OO38
.00»
.0000 -.001*
S3 100 1O0 100 100 100
0 10 20 30 «0
0 5.72
11.32 16.70 21.80
C 0 0 c 0
0 0 0 0 0
100 100.500 101.980 10A.W3 107.703
.00003
.19736
.29137
.38050
** 11.31 16.69 21.80
1.0001* ft» -.00002 -.00008
.00000
100.155 «* 101.993 10».37»
-1D7.583
.155
-.112
,0017 .0013 .0001 .0006 .0006
.0017
.0013
.0001
.0006
.0006
.00*1
.0037 .0025 .3030 .0030
24 200 200 200 200' 200
0 10 20 30 1«
0 2.87 5.72 8.53
11.32
0 0 0 0 0
0 0 0 0 0
200.000 200.230 200.998 202.237 2OJ.9S1
.00005
.05017
.09980
.1*90*
.19758
2~.B7 5.72 8.51.
11.35
.0000; -.00021
.00013
.00015
.00018
200.128 200.333 201.3*3 202.2*3 203.936
.06*
.0*1
.022 ■003
-.01«
-.0032 -.0028 -.0032 -.303! -.0030
-.0032 -.0028 -.0032 -.0032 -.0030
-.0008 -.000* -.3008 -.0008 -.0006
2S 100 100
20 llO
11.32 21.80
3.130 3.130
.6260 1.2520
101.960 107.703
.19730
.38026 11.30 21.79
-.00008 -.00023
IO2.OI8 107.6*2
.037 -.056
.6279 1.25*2
.0019
.0022 .00b3 .00*6
*f 100 130
20 10
11-32 21.80
9.382 9.382
I.876 3.752
101.980 107.733
.19688
.37952 11.28 21.7*
-.00050 -.00098
102.320 107.571 f
.039 -.122 1
I.878» 3.76IO /
.0020
.0090/ .00** .011*
«•nop la data «Suction. / Ibroa link Lg w loaded In tanaloe en tbla laidlng. which m bajond tfaa rangt of tba oaLIbration eoutanta mad la tbla data raduatlan.
t nuaa loadi at V = 9-3Ö2 art bayoad tba DOZDBI ranga of tba balanoa. 15/L6
13

A EDC-TR-70-246
One of the primary questions to be answered in this evaluation vas whether
or not the side load could be accurately measured when applied at the
distance z from the side force link. The results verify the analysis
in Ref. 1 and show conclusively that the effect of this overhung loading
structure is very minimal. In Runs 18, 19» and 20(Table II) the additional
error due to the increase in vector angle from 0 to 11.5 is small enough
that the second-order interactions caused by balance distortion (see
Section 7.3, Reference l) can be easily ignored except by the most
exacting requirements. The second-order interaction in Run 20 for a
vector angle of 11.5° at the nominal axial load of 200 pounds was .00021*
radian which agreed closely with the value of .00021 radian predicted for
the basic design on Page 56 of Reference 1.
6.2 PRECISION OF THRUST MAGNITUDE
The precision of the strain gaged force links was adequate for the primary
purpose of this experiment, which was to evaluate the structural geometry
of the basic design. As shown in Table II, the 2 ö~ precision of the
resultant thrust for all combinations of axial and side loads was 0.1^ percent
The semiconductor strain gages evidenced a slight amount of creep under
load (.03 percent for the first minute of loading for the axial force links).
For this reason and because of the limited time available for the completion
of the required number of tests, data was taken between one and two minutes
after application of load, which did not always allow sufficient time for
the weight pans to stop swinging. Generally, a calibration of this nature
takes about two weeks including set-up time and -re-runs, and undoubtedly
the precision of the data shown in Table II, which was taken in the final
two days of a five-day period, could have been improved had more time been
available to improve calibration technique.
14
AEDC-TR -70-246
Under stress, creep of the epoxy bond between the strain gage and the
substrate is always a potential problem in the manufacture of strain
gage transducers. Metal foil strain gages are less subject to this effect
than semiconductor gages because of the relative thickness of the
constantan foil (.0001 inch compared to the silicon sliver, .0005 inch).
However, semiconductor load cells are sufficiently free from creep if long
gages are used and if proper attention is paid to the stress distribution
along the strain gage. Given proper attention to these details, creep from
semiconductor strain gages would be about .05 percent in five minutes'.
Creep from constantan foil strain gages would be typically about .01 percent in
the same period of time.
The strain gages used on the axial force links were somewhat non-linear as
evidenced by the second-degree constants in the matrix in Table I (G...,
Cg2, and C..). This presented no problem since the method of data reduction
provided for a second degree nonlinearity. The semiconductor gages used on
the side force link were more linear as shown by the relative size of C^
to B^L. The nonlinearity may be calculated by l/2 (EC/B) which is 0.11
percent of full scale for the side force link.
The first-order interaction of the side force link on axial force was
reasonably small. This interaction is primarily caused by misalignment of
the side force link as explained in Section 7*2.2., Ref. 1. This inter-
action is equal to Kji ♦ &^ 4- M_. (Table I) and is also equal to .0028 Fx/Fz.
The maximum value of this would be O.056 percent at a 11.5° vector angle.
Again, this interaction was readily extracted from the data.
■a ^Conversation by the author with John Pugnaire, Bytrex Division of Tyco Corp., Waltham, Mass.
15
AEDC-TR-70-246
6.3 PRECISION OF VECTOR LOCATION
Since the forces resolved by the three axial force links determine the
location of the thrust vector in the xy plane of the balance, force link
precision directly affects the precision of the measured vector location
(see Section 7.1, Ref. l). Consequently, the comments in the preceding
paragraphs regarding precision also apply here. The precision obtained
for the location of the thrust vector given in terms of the measured
bias, and the 20" variation of the vector location data in the last
column of Table II was -.002^ inch t .0003 inch.
Certain adjustments vere made in the presentation of this data. After
Run 18 it .was noticed that the flexure connecting the axial force rod
to the balance was bent. At this point a new flexure was installed and
as a consequence the location bias was reduced by .008 inch. The second
column for location error in Runs 12, 17, and 18, Table II, show this
correction. After this adjustment the average of all runs (excluding 25
and 26) was -.002^ inch which can be partially attributed to errors in the
measurement of the location of the three load stations (x., x„ and x_) for
the axial calibrations. The last column in Table II shows the location
errors corrected for this bias.
The location precision obtained was sufficient for the purposes of this
experiment, which was primarily to evaluate the balance structural geometry.
As with the precision of the thrust resultant^ a five-to-one improvement in
this location precision would be readily achieved by reduction of strain
gage creep and by the improvement in calibration technique that would
normally result from more experience with the calibration of this type of
balance.
16
AEDC-TR-70-246
SECTION VII
CONCLUSIONS
An instrument designed in an orthogonal tripod geometry with short,
rigid force-measuring links in a compact structure, can be used satis-
factorily to measure the thrust vector (magnitude, direction, and
location) produced by a rocket engine»
This type of vector thrust cell can also be conveniently calibrated
with known axial and lateral loads in order to qualify the data obtained.
17

AEDC-TR-70-246
Figure 1. Scale Model Vector Thrust Load Cell
18
V AXIS
vo
■ASE PLATE
FORCE LINKS (IDEALIZED)
¥-Z AXIS
ROCKET (NCIKt
ENGINE PLATE
FIGURE 2. Force Link Arrangement of MDdel Cell
> m o o
JO ■ -J O K>
01
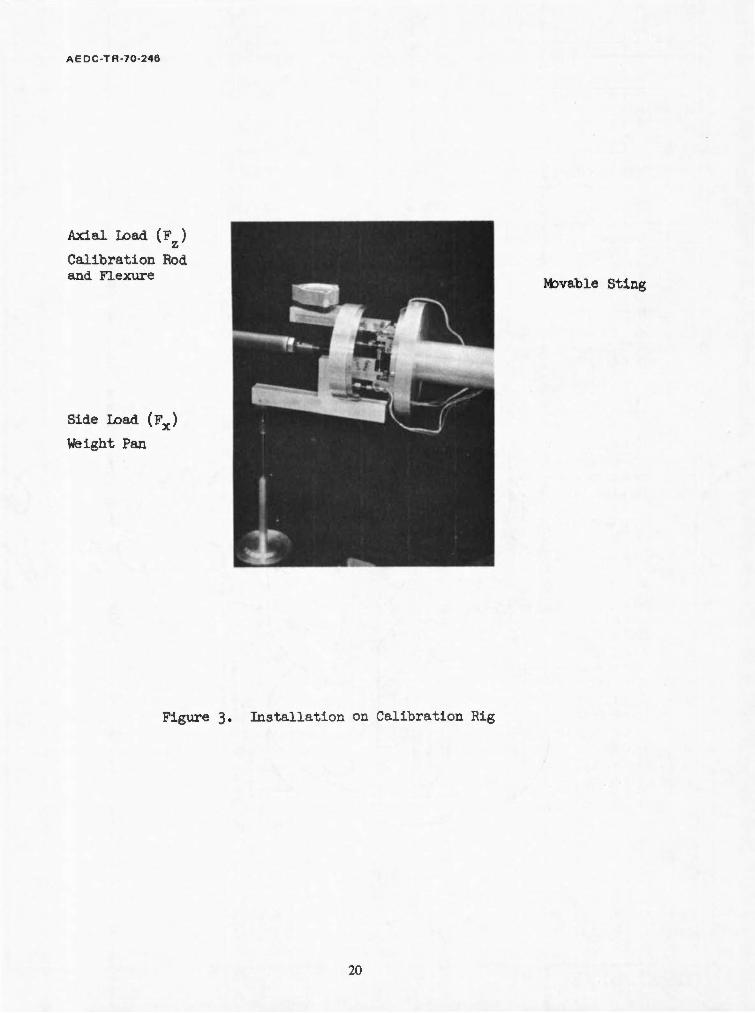
AEDC-TR-70-246
Axial Load (F )
Calibration Rod and Flexure
Side Load (Fx)
Weight Pan
Movable Sting
Figure 3. Installation on Calibration Rig
20

UNCLASSIFIED SecurityClassUication
DOCUMENT CONTROL DATA -R&D (Security classification ol title, body ol abstract and Indexing annotation must be entered when the overall report is classified)
I. ORIGINATING ACTIVITY (Corporate author)
North American Rockwell Corporation Rocketdyne Division, 6633 Canoga Avenue Canoga Park, California 91304
2a. REPORT SECURITY CLASSIFICATION
UNCLASSIFIED 26. GROUP
N/A 3. REPORT TITLE
EXPERIMENTAL EVALUATION OF A THRUST VECTOR LOAD CELL
4. DESCRIPTIVE NOTES (Type ol report end inclusive datea)
Final Report - November 1969 to February 1970 s- AUTHOR(S) (Flrat name, middle Initial, laat name)
R. W. Postma, Rocketdyne
«■ REPORT DATE
November 1970 7a. TOTAL NO. OF PACES
25 7b. NO. OF REFS
None 8a. CONTRACT OR GRANT NO.
F40600-70-C-O007 b. PROJECT NO. 4344
c- Program Element 6 570IF
* Task Nos. 37 and 08
Sa. ORIGINATOR'S REPORT NUMBERS)
AEDC-TR-70-246
9b. OTHER REPORT NOI9I (Any other numbers that may be assigned this report)
R-8254 10. DISTRIBUTION STATEMENT
This document has been approved for public release and sale; its distribution is unlimited.
II- SUPPLEMENTARY NOTES
Available in DDC
12. SPONSORING MILITARY ACTIVITY
Arnold Engineering Development Center, Air Force Systems Command, Arnold Air Force Station, Tenn.37389
13. ABSTRACT
This report describes the results of an experimental evaluation of a half-scale (physical size) model of a previously analyzed six-component force balance for testing rocket engines. The force range of the model was scaled down from 5000 lbf to 200 lbf, and structural parameters were scaled to represent those of the full-scale version which was analyzed under Contract F40600-68-C-0004. The evaluation includes the determina- tion of (1) first- and second-order interactions of single and combina- tion loads and (2) the effect of combination loads at expected gimbal points for typical rocket engines. The data which are presented in tabulated form, validate the prior analysis, and demonstrate that short force measuring links, assembled into a compact integral structure, do not result in excessive interactions.
DD .FN°0RV*..1473 UNCLASSIFIED
Security Classification
UNCLASSIFIED Security Clwlflcatloii
14, KIV WORD*
LINK A
MOLK NT
LINK • LINK C
ROUI WT ROLB WT
Model
weight indicator
load cells
rocket engines gimbal force
Mac AnoUArtT«
UNCLASSIFIED Security Classification


![DOCUMENTATION SHEET General TT1 - RubberdesignTT1 TYPE APPROVALS Initial load limit [N] Max. Vertical load [N] Max. Thrust load [N] at 4mm vertical compression (- ) ( static load )](https://static.fdocuments.us/doc/165x107/5f6e0df28e84ba3b6d61782c/documentation-sheet-general-tt1-rubberdesign-tt1-type-approvals-initial-load-limit.jpg)