Thrust performance of a variable-geometry, … · of a Variable-Geometry, Nonaxisymmetric, Two-...
40
NASA Technical Paper 21 71 June 1983 Thrust Performance of a Variable-Geometry, Nonaxisymmetric, Two- Dimensional, Convergent= Divergent Exhaust Nozzle on a Turbojet Engine at Altitude David M. Straight and Richard R. Cullom 25th Anniversary 1958-1983 t ! NASA TP 21 71 c.1 I LOAN COW: RETURN TO AFWL TECHNICAL LIBRARY KlFlTLAND AFB, N.M. https://ntrs.nasa.gov/search.jsp?R=19830018568 2018-06-30T09:58:15+00:00Z
Transcript of Thrust performance of a variable-geometry, … · of a Variable-Geometry, Nonaxisymmetric, Two-...

NASA Technical Paper 21 71
June 1983
Thrust Performance of a Variable-Geometry, Nonaxisymmetric, Two- Dimensional, Convergent= Divergent Exhaust Nozzle on a Turbojet Engine at Altitude
David M. Straight and Richard R. Cullom
25th Anniversary 1958-1983
- I t !
NASA TP 2 1 71 c.1
I
LOAN COW: RETURN TO AFWL TECHNICAL LIBRARY KlFlTLAND AFB, N.M.
https://ntrs.nasa.gov/search.jsp?R=19830018568 2018-06-30T09:58:15+00:00Z

TECH LIBRARY KAFB, NM
NASA Technical Paper 21 71
1983
National Aeronautics and Space Administration
Scientlfic and Technical Information Branch
I llllll lllllllll1 lllll111 lllll Hlllllll Ill 00b7954
Thrust Performance of a Variable-Geometry, Nonaxisymmetric, Two- Dimensional, Convergent= Divergent Exhaust Nozzle on a Turbojet Engine at Altitude
David M. Straight and Richard R. Cullom Lewis Research Center Cleveland, Ohio

Summary The potential thrust performance of full-scale, nonaxi-
symmetric, two-dimensional, convergent-divergent exhaust nozzles was determined by testing a versatile air- cooled research configuration on a 585-13 turbojet engine in an altitude test facility. Nonafterburning data were obtained for three nozzle throat areas where a range of internal expansion area ratios from 1.2 to 2.3 was investigated. Significant performance corrections were made to account for coolant flows that bypassed the nozzle throat and for seal leakages.
The results of the investigation indicated that gross thrust coefficients of 0.985 or higher were achievable over most of the operating range (nozzle pressure ratios greater than 4) if seal leakage and bypass coolant losses were eliminated. The corrected thrust performance values were in good agreement with one-dimensional theory and scale-model data for most configurations. Three- dimensional flow effects occurred near the nozzle throat plane and in the presence of the wall surface discontinuities, which were more pronounced than in the scale models.
Introduction Nonaxisymmetric exhaust nozzles have potential bene-
fits for advanced fighter-aircraft such as improved integration with the airframe to reduce drag and increase lif t , improved maneuverability in combat situations through vectoring and reversing, and increased flexibility for short-takeoff-and-landing (STOL) operations. Reference 1 includes a bibliography and summary of 82 publications on nonaxisymmetric nozzles up to 1979. Additional experimental data include scale-model tests with several nonaxisymmetric nozzle concepts and design variables. Both internal performance results obtained in static rig tests (refs. 2 to 4) and installed performance results obtained with wind tunnel models have been published (refs. 5 to 9). Theoretical studies have been made on integrating nonaxisymmetric nozzles with several different aircraft (ref. 1) in which benefits were determined analytically from model test results. There is, however, a paucity of full-scale engine data to confirm the high performance potential indicated by the model tests. Favorable results have been obtained in the full- scale ADEN program (ref. 10) at sea-level static test conditions.
A low-aspect-ratio versatile research exhaust nozzle was designed and built by a contractor for testing on a 585-13 full-scale turbojet engine at the NASA Lewis Research Center. Although the design incorporated many variable features so that parametric performance and heat transfer data on the.effect of the variables could be
obtained for different nozzle configurations, only the baseline performance results without afterburning are presented in this report. The design features, however, included variable throat area for afterburning, variable area ratio for a wide range of nozzle pressure ratios, vectoring by two methods (flap vectoring or pivoting the nozzle throat), thrust reversing, and replaceable panels to study various cooling schemes on the convergent and divergent flaps. The design philosophy, to keep costs low, was to use boilerplate support structure but internal parts having thin walls approaching flight-weight hardware and realistic flow paths. Simple low-cost leaf seals were used throughout to prevent leakage. The nozzle was extensively instrumented to obtain internal thrust performance and heat transfer data.
Thrust performance was obtained with the nozzle in the normal (nonvectored) cruise position. The nonafterburning data were obtained for three throat areas (710,903, and 1129 cm2; 110, 140, and 175 in2) over a wide range of internal expansion area ratios (1.2 to 2.3) and operating nozzle pressure ratios (1.6 to 14.0) in the PSL-3 altitude test facility at NASA Lewis. The maximum performance potential of the nozzle was determined by correcting the measured thrust coefficients for seal leakage and coolant flows that bypassed the nozzle throat. The calibrations required and the calculation methods used are included in this report.
The corrected thrust data are compared with simple one-dimensionai theory and scale-model data for similar geometries (ref. 2). To complete the documentation of parameters that affect internal thrust performance, several plots of typical internal wall static-pressure profiles are presented and compared with one- dimensional theory.
Apparatus Engine and Installation
The engine used for this investigation was a 585-13, afterburner-equipped turbojet, figure ](a). At sea-level static conditions the rated dry thrust is 12 900 N (2900 lb). The rated airflow is 20 kglsec (44 lb/sec). The engine has an eight-stage axial-flow compressor with variable inlet guide vanes. The annular combustor discharges into a two-stage turbine. For these tests the standard axisymmetric, variable-area exhaust nozzle was replaced with a two-dimensional, convergent-divergent nozzle. The standard 585 variable-area nozzle control, which is integrated into the engine main fuel control, was replaced by the manual two-dimensional, convergent-divergent (2D-CD) nozzle area control, which was independent of the main fuel control.
The engine installation in the altitude test chamber, a conventional direct-connect type, is shown in figures 1

\ \
Station: P i
(a)
r Labyrinth 1 exhaust nozzle // I
/ I /// seal Compressor /I Afterburner 7 1' ,
3 z
2 3 5 7 8 9 0 (nozzle inlet) (throat1 (exit1 (altitude
chamber) o Total pressure o Static pressure x Total temperature
i \\
(plenum)
<
@ X X X
Station 1 (airflow -measu ri ng station)
Station 3 (compressor exit)
(b)
Station 5 (turbine exit)
Station 2 (compressor inlet)
o o o o o o o o o o i_l/ Station 7
(nozzle inlet)
(a1 Engine installation; station locations. (b) Stations, viewed looking upstream.
Figure 1. - 585-13 engine installation and instrumentation layout.
and 2. At the left is the forward bulkhead, which separates the 5.5-m-diameter (18-ft-diam) inlet plenum from the 7.3-rn-diameter (24-ft-diam) test chamber. The required pressure and temperature air flows from the plenum at the left, through the bellmouth, and into the engine inlet duct. A conical screen is attached to the bellmouth to prevent foreign object ingestion. A labyrinth seal is used to isolate the inlet ducting and thus allow free movement of the engine for thrust measurement.
The engine and test nozzle were mounted to the thrust bed through separate support structures as shown in figure 2. In this test installation the 2D-CD nozzle has been rotated 90" around the engine centerline from a typical airframe installation. The interface between the engine and the nozzle is a piston ring seal designed to compensate for component thermal growth. This seal also minimizes transfer of loads or moment forces between the engine and the nozzle. The thrust bed is suspended by four multiflexured vertical rods attached at

Figure 2 -Engine installation in altitude test chamber.
their upper ends to the chamber. The bed alignment with the airflow direction is maintained by two multiflexured horizontal rods located fore and aft on the far side of the bed. The thrust bed is restrained from free movement by a dual load-cell system that allows the bed to be preioaded and therefore calibrated.
Engine exhaust gases and test cell cooling air are captured by a water-cooled collector extending through the rear bulkhead at the right. To accommodate the rectangular-cross-sectioned exhaust plume from the two- dimensional nozzle, a rectangular, variable-area exhaust collector aperture was formed by two horizontally movable doors. The van-able area allows sizing of the collector aperture so that the facility exhaust air equipment can be used efficiently for the wide range of nozzle configurations available for testing.
Nozzle
The two-dimensional, convergent-divergent exhaust nozzle is capable of variable internal exhaust jet or external area expansion, as well as jet deflection by pivoting or flap vectoring and thrust reversal. This nozzle was designed and fabricated under contract by General Electric. Design features of this hardware include a fiied transition section, two pivotable reverser-blocker doors, 50-percent-cutback side walls, interchangeable flap cooling panels, and a pivotable nozzle body with movable convergent and divergent flaps (fig. 3.) AU movable components of the nozzIe were sealed against hot-gas leakage with simple elastic leaf sheet-metal seals. Location of these seals is indicated in figure 3. The gas
seals at the left and right sides of the throat can be seen in figure 4. The movable convergent and divergent flaps provided throat area and nozzle expansion area ratio variation. With the movable flaps the nozzle throat area could be varied from 568 cm2 (88 in2) to 1290 cm2 (200 in2). For the dry-cruise condition at a flight Mach number of 0-9 and an altitude of 4570 m (15 000 ft) the nozzle throat had an aspect ratio of 4.0. The height of the exhaust gas flow path through the rectangular nozzle was constant a t 53.67 cm (21.13 in.). The test nozzle had an overall maximum length of 244 cm (96.2 in.) including the afterburner. When the divergent flaps were vectored differentially with respect to the nozzle centerline, up to ltI5" of supersonic turning of the exhaust jet could be accomplished. The nozzle body could be pivoted inde- pendently *15" to provide subsonic turning of the jet. When nozzle body pivoting and flap vectoring were combined, the exhaust jet could be deflected a maximum of ~k30". An electrohydraulic servocontrol system positioned the variable-geometry sections of the exhaust nozzle. The hydraulic actuators in this system operated at a pressure of 620 N/cm2 (900 psig).
The convergent and divergent nozzle flaps were provided with instrumented interchangeable cooling paneIs so that impingement, f i i , or combined impingement-fiIm cooling schemes could be tested. AD of the nozzles tested had impingement-cooled panels installed on the right side and impingement-filmcooied panels on the left side as viewed Erom downstream. The inner walls of the nozzle hot-gas flow path were approximately of flight-weight design in order to simdate actual heat transfer conditions. Most of the hot-
3

V Location of gas seal
Reverser chute -,
r Piston ring seal
Transition section
t- 2.:) + E -I t- ;to: + 2.04) -I Figure 3. - Cross-sectional schematic of two-dimensional, convergentdivergent exhaust nozzle. (Dimensions are in centimeters (inches). )
Figure 4. - Exit view of two-dimensional. convergentdivergent exhaust nozzle.
side wall area was fabricated from Hastelloy X. Nozzle component wall thicknesses varied from 0.10 cm to 0.33 cm (0.040 in. to 0.130 in.). A system of 14 individually controlled and metered zones supplied cooling air to the various nozzle components and cooling panels. The zone valves were of the air-operated plug type and were controlled through set-point potentiometers.
The test nozzle as viewed from the exit (fig. 4) shows impingement-cooled panels installed on the right flaps and impingement-film-cooled panels installed on the left flaps. One cooled panel was installed on each convergent flap. Each divergent flap had three cooled panels as shown. The round-to-rectangular transition section can be seen upstream through the nozzle throat. This figure
4

shows the position in which the nozzle was tested, that is, rotated 90" about the engine centerline from a typical aircraft installation.
Instrumentation
For these tests instrumentation was provided to determine engine inlet and altitude chamber conditions, nozzle performance, and engine operating status. On-line data readout was provided, through alphanumeric video
Transition section I x x I
X
X X
X
Y
x x X
Station 7
(a) (nozzle inlet)
displays and a line printer, by a facility computer system with 1-second data update time capability. Engine and nozzle instrument stations and locations are identified in figures 1 and 5 .
Engine thrust and thrust-bed preload forces were measured separately with 22 250-N (5000-lb) strain-gage load cells. The load cells were independently calibrated and mounted beneath the thrust bed. The thrust- measuring system accuracy was f 18 N (h4 lb).
Reverser- blocker
8 8
8 8
I
0 Static pressure x Wall temoerature
:onve r - ent flap
@$
8
'88
x 8 -
a (nozzle throat) (nozzle exit)
(a) Transition section and flaps (right side as viewed from centerline). (b) Top and bottom side walls.
Figure 5. - Nozzle wall instrumentations.
5
Most pressures were recorded on 19 Scanivalves (24 ports each) that were operated by the facility computer. The differential Scanivalve transducers were calibrated while in use and had an estimated system accuracy of k0.26 percent full scale. Pressures recorded with individual differential transducers had system accuracies of &0.60 percent full scale.
All thermocouples were Chromel-Alumel and were referenced to a 339 K (610" R) oven. The estimated system accuracy was f 1.1 deg K (k2 .0 deg R). Position of the movable convergent and divergent flaps was determined with calibrated linear potentiometers attached to the respective hydraulic actuators.
The nozzle inlet total pressure was determined from a 10-probe rake located 19.8 cm (7.8 in.) upstream of the inlet to the nozzle transition section. The test chamber or altitude pressure was measured by six pressure taps located near the outer end of the nozzle thrust reverser chutes. These chutes were open to the test chamber at the outer end but closed to the nozzle flow stream by the reverser-blocker doors at the inner end. The nozzle inlet total temperature was equated to the turbine outlet temperature, as is reasonable for nonafterburning engine operation. This temperature was determined from three rakes of five probes each located at the turbine exit.
The array of wall static-pressure taps and thermocouples installed on the right, or impingement- cooled, side of the nozzle is shown in figure 5(a). The instrumentation array on the left convergent and divergent flaps is identical to that shown, except that it is inverted. Not shown are pressure and temperature sensors installed in the coolant flow passages of the nozzle components. Each flat wall, top and bottom (side walls as installed on an aircraft), was instrumented with 13 wall static-pressure taps and 13 wall thermocouples as shown in figure 5(b). In total there were approximately 150 pressure and 200 temperature sensors installed on or in the nozzle.
Procedure Testing
For the baseline performance tests the variable- geometry nozzle was maintained in the cruise mode. The nozzle was not pivoted nor were the divergent flaps vectored differentially with respect to the nozzle centerline. Also the thrust reverser was not used. The movable flaps were positioned to set a specific throat area and to vary the nozzle expansion area ratio. Nozzle dry- thrust performance was recorded for three nozzle throat areas at various expansion area ratios over a range of nozzle pressure ratios. The three nominal throat areas were 710, 903, and 1129 cm2 (110, 140, and 175 in2). Nozzle expansion area ratio was varied from 1.2 to 2.3. The various configurations of the nozzle, as it was tested, are shown in figure 6 and summarized in table I. Figure 6(a) shows the position of the trailing edge of the cutback side wall. Figure 6(b) shows isometric sketches of the nine configurations in table I.
For these tests the nozzle throat area and expansion area ratio were adjusted to the desired values. The engine inlet conditions were set to 10.3 N/cm2 (15.0 psia) pressure and 289 K (520" R) temperature and held con- stant for all nozzle configurations. Although the tests were run without afterburning, the nozzle coolant flows were set equal to calculated afterburning design values for all configurations so that the effect of coolant flow on thrust could be determined. The total nozzle coolant flow was approximately 13 percent of the nozzlegas flow. The nozzle inlet total temperature, which is grossly a function of the nozzle throat area, was set to the desired test value by small adjustments in engine speed. All data were recorded with the corrected speed above 95.5 percent to ensure that the interstage compressor bleeds were closed. With the nozzle inlet total pressure fixed, the altitude chamber pressure was varied to produce the desired nozzle pressure ratio. Nozzle performance was obtained
TABLE I - NOZZLE CONFIGURATION
area,
A1 A2 A3 A4 81 c1
710
1 903 140
1129 175
1.20 1.50 1.79 2.29 1.20 1.20 1.50 1.80 2.30
Nozz 1 e throat aspect r a t i o
4.10
3.19 2.55
Convergent f l a p
angle, aC' deg
28.75
1 21.25 13.15
Divergent f l a p
angle,
2.19 I 5.66
14.60 2.86 3.58 8.91
14.31 23.72
8.87
6
over a range of nozzle pressure ratios from 1.6 to 14.0. Postrun Leakage Calibration -
Test points did not intentionally correspond to specific flight Mach numberlaltitude conditions.
the thrust bed was calibrated before and after each test period. For these baseline nozzle performance tests the engine was operated using ASTM-A-1 jet fuel.
As the nozzle tests were conducted, it became apparent from the on-line data that the level of thrust performance was substandard. It was suspected that the hot-gas seals on the various movable components of the nozzle were leaking and perhaps contributing to the performance decrease. The elastic leaf sheet-metal seals installed on
To enhance performance data
Configu- ration
Configur tion A l : At = 710 cm2 .iiio i n4 ; Ae/At = 1.2
Configuration A3: At = 710 cm2
Ibl 1110 id; A,/A~ = 1.8.
b- Sidewal l trai l ing edge
r c e n t e r l i n e _- __- _ _ _ _ _
I''- Sidewal l trai l ing edge centerl line
~- '-- _ _ _ _ ___- (a)
Configuration A2: A t = 710 cm2 (110 i n $ A,/A~ = 1.5.
.
Configuration A4: At = 710 cm2 1110 in?); AeIAt = 23.
Configuration 61: At = 903 cm2 Configuration C1: At = 1129 cm2 (140 in2); Ae/At L 1. 2. 1175 in2); Ae/At = 1. 2
Configuration c3: A~ - 113 cm2 (175 in2); AeIAt = 1.8.
@ ,/ ''0
Configuration cz = 1129 cm2 1175 in2); Ae/At = 1.5.
0*\
/' @ 0
Conf igurat i in ~q A - 1129 cm2 1175 in2); AeIAt = $3.
la) Flap positions. Ib) Isometric views.
Figure 6. - Nozzle configurations.
the movable components and at the pivot points are located in figure 3. Figure 4 shows the gas seals on the left and right pivot points at the throat. Seals were installed on the top and bottom edges of the convergent and divergent flaps. Also seals were used between the reverser-blocker door pivot arms and the flat side walls at the top and bottom. Individual lengths of the leaf seals and their percentage distribution overall and upstream of the throat are summarized in table 11.
When nozzle testing was completed, a leak calibration test was performed with the nozzle and engine afterburner. The afterburner was included so as to consider possible leakage of the piston ring seal between the afterburner outlet and the nozzle inlet. Leaktight closures were installed at the afterburner inlet and at the nozzle divergent section just upstream of the side-wall trailing edges to form a pressure vessel. For this calibration the nozzle throat area was 710 cm2 (110 in2) and the expansion area ratio was 1.2. This configuration was chosen because it appeared to display the largest decrease in performance. And therefore if seal leakage contributed to the performance decline, it should be more apparent with this configuration.
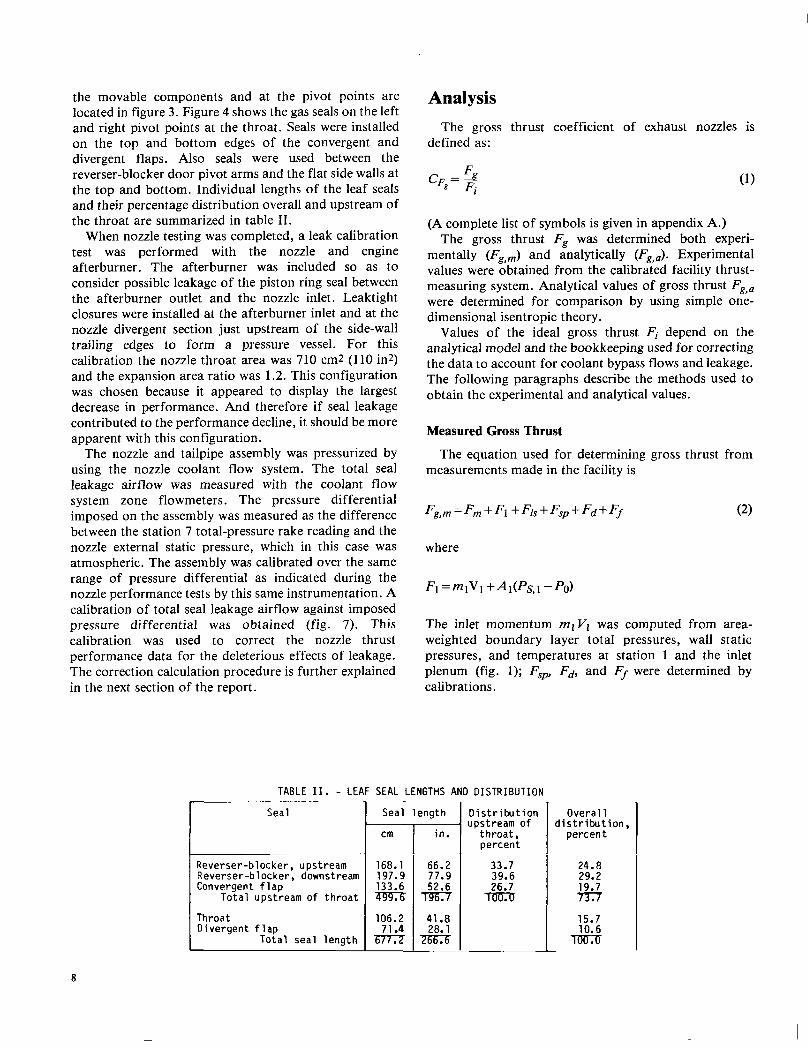
The nozzle and tailpipe assembly was pressurized by using the nozzle coolant flow system. The total seal leakage airflow was measured with the coolant flow system zone flowmeters. The pressure differential imposed on the assembly was measured as the difference between the station 7 total-pressure rake reading and the nozzle external static pressure, which in this case was atmospheric. The assembly was calibrated over the same range of pressure differential as indicated during the nozzle performance tests by this same instrumentation. A calibration of total seal leakage airflow against imposed pressure differential was obtained (fig. 7). This calibration was used to correct the nozzle thrust performance data for the deleterious effects of leakage. The correction calculation procedure is further explained in the next section of the report.
Seal l e n g t h D i s t r i b u t i o n upstream o f
t h r o a t , r--- ~ ~. i = l percent
Reverser-blocker, upstream 168.1 66.2 33.7 Reverser-blocker, downstream 197.9 77.9 39.6 Convergent f l a p 133.6 52.6 26.7
T o t a l upstream o f t h r o a t 7-557 TCEU
Analysis The gross thrust coefficient of exhaust nozzles is
defined as:
O v e r a l l
percent
24.8 29.2 19.7 7-37
d i s t r i b u t i o n ,
(A complete list of symbols is given in appendix A.) The gross thrust Fg was determined both experi-
mentally (Fg,,J and analytically (Fg,J. Experimental values were obtained from the calibrated facility thrust- measuring system. Analytical values of gross thrust Fg,a were determined for comparison by using simple one- dimensional isentropic theory.
Values of the ideal gross thrust Fi depend on the analytical model and the bookkeeping used for correcting the data to account for coolant bypass flows and leakage. The following paragraphs describe the methods used to obtain the experimental and analytical values.
Measured Gross Thrust
The equation used for determining gross thrust from measurements made in the facility is
where
The inlet momentum mlVl was computed from area- weighted boundary layer total pressures, wall static pressures, and temperatures at station 1 and the inlet plenum (fig. 1); Fsp, Fd, and Ff were determined by calibrations.
Throat 106.2 41.8 Divergent f l a p
Tota l seal l e n g t h XFX I 71.4 I 28.1 I 15.7 I *
8
0 4 8 12 16 20 Nozzle differential pressure, APl. N k m 2
I 4 8 12 16 20 24
I 0
Nozzle differential pressure, APl, psid
Figure 7. - Nozzle seal leakage calibration. Amibent test cell pressure, Po, 9.85 N/cm2 (14.29 psia); throat area, At, 710 cm2 (110 in2): internal expansion area ratio, Ae/Av 1.2
Ideal Gross Thrust
The general equation for ideal gross thrust is
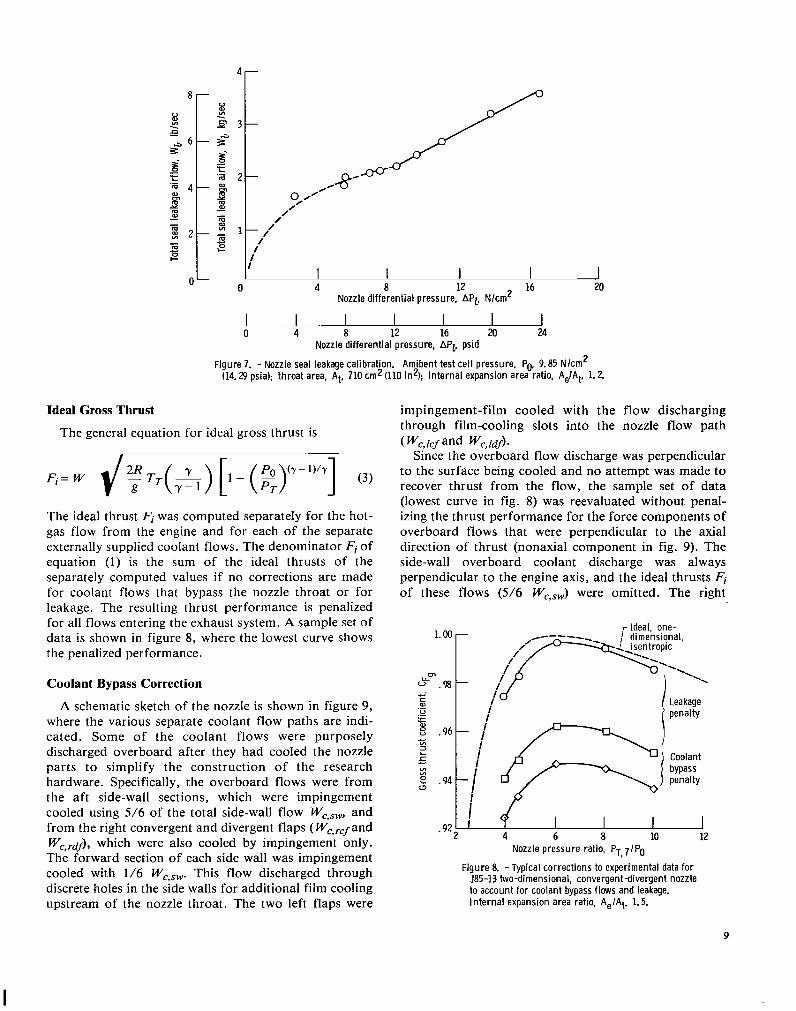
The ideal thrust Fi was computed separately for the hot- gas flow from the engine and for each of the separate externally supplied coolant flows. The denominator Fi of equation (1) is the sum of the ideal thrusts of the separately computed values if no corrections are made for coolant flows that bypass the nozzle throat or for leakage. The resulting thrust performance is penalized for all flows entering the exhaust system. A sample set of data is shown in figure 8, where the lowest curve shows the penalized performance.
Coolant Bypass Correction
A schematic sketch of the nozzle is shown in figure 9, where the various separate coolant flow paths are indi- cated. Some of the coolant flows were purposely discharged overboard after they had cooled the nozzle parts to simplify the construction of the research hardware. Specifically, the overboard flows were from the aft side-wall sections, which were impingement cooled using 5/6 of the total side-wall flow WC,,, and from the right convergent and divergent flaps ( WC,,,fand Wc,rdf)), which were also cooled by impingement only. The forward section of each side wall was impingement cooled with 1/6 We,,,. This flow discharged through discrete holes in the side walls for additional film cooling upstream of the nozzle throat. The two left flaps were
impingement-film cooled with the flow discharging through film-cooling slots into the nozzle flow path
Since the overboard flow discharge was perpendicular to the surface being cooled and no attempt was made to recover thrust from the flow, the sample set of data (lowest curve in fig. 8) was reevaluated without penal- izing the thrust performance for the force components of overboard flows that were perpendicular to the axial direction of thrust (nonaxial component in fig. 9). The side-wall overboard coolant discharge was always perpendicular to the engine axis, and the ideal thrusts Fi of these flows (5/6 WC,,,,,) were omitted. The right
( wc,lcf and wc,ldf)-
1.00
m
u” .9a L
c P)
U .- .- c
? .96
VI VI
E .94 a
,- Ideal. one-
1 1
6 a 10 12 . 9Z2 I / 4 4
Nozzle pressure ratio, PT, 7IPg
Figure 8. -Typical corrections to experimental data for J85-13 two-dimensional. convergentdivergent nozzle to account for coolant bypass flows and leakage. Internal expansion area ratio, AeIAt. 1.5.
9

KAxial Nonaxial omponenr~ ,! ‘xomponents
\\4 f ,‘ ‘1 rNonaxial w_ -1 7: component
Coolant flows
Wc, transition liner Wc, right convergent flap reverser section Wc, rdf r ight divergent flap
$1 r pivot section Wc, Icf left convergent flap Wc, sw side walls Wc, Idf left divergent flap c, P
Figure 9. - Schematic of coolant flow paths.
convergent and divergent flaps, however, were not parallel to the engine axis: the angles varied with the throat area setting and the nozzle area ratio A,/At. Thus an axial force component resulted from the discharge of coolant from the two right flaps (fig. 9) and would affect the thrust measured by the load cells. For this reason the axial components of the Fi of these flows are included in the total Fi. The nonaxial force components of these coolant flows, however, were omitted in the total Fi used in equation (1). All of the ideal thrusts of the left-flap coolant flows were included in the total Fi since these flows were discharged internally.
The thrust performance for the sample data set in figure 8, after these corrections have been made in the values of Fi, are shown by the square symbols, which are about 1.5 percentage points above the fully penalized performance curve. This 1.5 percent is the penalty for incomplete recovery of thrust from the externally discharged coolant, which bypassed the nozzle throat.
Leakage Correction
For determining the maximum performance potential of full-scale nonaxisymmetric nozzles and to compare the performance with scale-model data, it was desirable to correct the data for leakage. This was particularly important for the data in this report because the leakage was higher than would occur in a developed flight-weight nozzle.
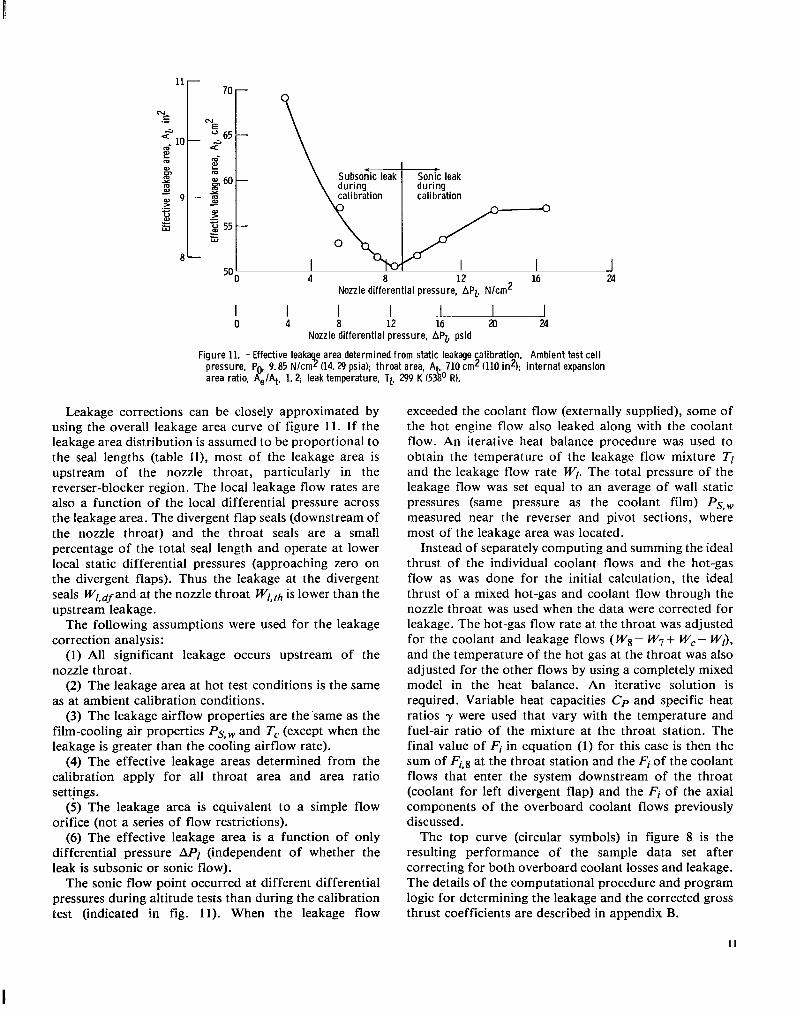
A schematic of the 2D-CD nozzle with the leakage flow paths indicated is presented in figure 10. The total effective leakage area was computed from the leakage calibration data (fig. 7) and is presented in figure 11. As the differential pressure was increased from zero to about 8.5 N/cm2 (12 psid), the effective leakage area decreased
probably because the seals were deflecting in a direction to seal off the leakage.
The high leakage levels and the reversal of the trend at 8 .5 N/cm2 (12 psid), however, were not expected and indicated a leakage problem. It is not known whether the trend reversal can be attributed to the flow becoming sonic, as indicated in figure 11, or to increasing actual area due to higher pressure loads. The local distribution of leaks among the various leakage flow paths indicated in figure 10 was not determinable from the available data. A qualitative estimate was made, however, at very !ow APl by walk-around test personnel. The major leakage flow was in the region of the reverser ports ( FV/,r).
WL, P Wl, r wZ. fh Wl, cf wZ, th wZ, df
Leakage flows
Piston r ing seal Reverser section seals Forward hinge seals Convergent flap sidewall seals Throat hinge seals Divergent flap side-wall seals
t - -
Figure 10. - Schematic of leakage flow paths,
10
I I
Leakage corrections can be closely approximated by using the overall leakage area curve of figure 11. If the leakage area distribution is assumed to be proportional to the seal lengths (table XI), most of the leakage area is upstream of the nozzle throat, particularly in the reverser-blocker region. The local leakage flow rates are also a function of the local differential pressure across the leakage area. The divergent flap seals (downstream of the nozzle throat) and the throat seals are a small percentage of the total seal length and operate at lower local static differential pressures (approaching zero on the divergent flaps). Thus the leakage at the divergent seals W/,dfand at the nozzle throat W/, th is lower than the upstream leakage.
The following assumptions were used for the leakage correction analysis:
(1) All significant leakage occurs upstream of the nozzle throat.
(2) The leakage area at hot test conditions is the same as at ambient calibration conditions.
(3) The leakage airflow properties are the'same as the film-cooling air properties Ps,,, and T, (except when the leakage is greater than the cooling airflow rate).
(4) The effective leakage areas determined from the calibration apply for all throat area and area ratio settings.
( 5 ) The leakage area is equivalent to a simple flow orifice (not a series of flow restrictions).
(6) The effective leakage area is a function of only differential pressure APl (independent of whether the leak is subsonic or sonic flow).
The sonic flow point occurred at different differential pressures during altitude tests than during the calibration test (indicated in fig. 11). When the leakage flow
exceeded the coolant flow (externally supplied), some of the hot engine flow also leaked along with the coolant flow. An iterative heat balance procedure was used to obtain the temperature of the leakage flow mixture T/ and the leakage flow rate W,. The total pressure of the leakage flow was set equal to an average of wall static pressures (same pressure as the coolant film) Ps,,, measured near the reverser and pivot sections, where most of the leakage area was located.
Instead of separately computing and summing the ideal thrust of the individual coolant flows and the hot-gas flow as was done for the initial calculation, the ideal thrust of a mixed hot-gas and coolant flow through the nozzle throat was used when the data were corrected for leakage. The hot-gas flow rate at the throat was adjusted for the coolant and leakage flows (w8 = W, + W,- Wl), and the temperature of the hot gas at the throat was also adjusted for the other flows by using a completely mixed model in the heat balance. An iterative solution is required. Variable heat capacities Cp and specific heat ratios y were used that vary with the temperature and fuel-air ratio of the mixture at the throat station. The final value of Fi in equation (1) for this case is then the sum of Fi,8 at the throat station and the Fi of the coolant flows that enter the system downstream of the throat (coolant for left divergent flap) and the Fi of the axial components of the overboard coolant flows previously discussed.
The top curve (circular symbols) in figure 8 is the resulting performance of the sample data set after correcting for both overboard coolant losses and leakage. The details of the computational procedure and program logic for determining the leakage and the corrected gross thrust coefficients are described in appendix B.
11
I

l . O r
0 0
m isentropic I
26 I 22
1 .6 1.0 1.4 1. a
Ratio of area at axial station within nozzle to throat area, Ax/At
Figure 12 - Nomenclature and analytical model for ideal one- dimensional, isentropic expansion calculations.
Ideal Isentropic Thrust
The corrected experimental data can be compared with an ideal one-dimensional, isentropic gross thrust coeffi- cient such as shown by the dashed line in figure 8. In this case the gross thrust Fg in equation (1) is predicted for design and off-design pressure ratios.
The theoretical ideal gross thrust was computed for each fixed-area-ratio configuration tested over a range of operating pressure ratio. A sketch of the analytical model is shown in figure 12. For the analysis it was assumed that the nozzle side walls extend to the end of the divergent flaps such that the nozzle is a simple two-dimensional, convergent-divergent supersonic nozzle of given fixed area ratio. With no corrections for coolant flow, leakage, friction, flow angularity, shocks, or flow separations and assuming a simple one-dimensional isentropic expansion, the thrust produced by the nozzle is
The model assumes that the nozzle is flowing full to the exit plane at A , and that, Ps,, is not equal to PO, there is a step change in pressure to PO at the exit plane. Thus the second term in equation (4) (Ps,, - PO) has a finite value,
either plus or minus. When Ps,~=Po, the nozzle is ideally expanded and the second term is zero. A maximum ideal thrust coefficient exists at that pressure ratio (Fg=Fi, and C, = 1 .O per equation (1)).
f h e value of Ps,, at the exit plane is computed from the ideal isentropic area ratio equation:
A,= At
I
where A , is set equal to the desired A , to find P S , ~ at station 9 (Ps,, in eq. (4)). Nozzle inlet total pressure PT and nozzle throat area At are given.
The variation of local-static-to-total-pressure ratio P~,,/PT with local area ratio Ax/At in figure 12 is a plot of equation ( 5 ) . This plot is relatively insensitive to the value of y, and values from published compressible flow charts (ref. 11) for y = 1.4 were used.
The calculated isentropic thrust at nozzle pressure ratios other than ideally expanded results in lower thrust coefficients. If the operating pressure ratio is higher than the optimum (Po<Ps,,), the A AP term is negative, but the momentum is greater than that of the optimum pressure ratio and the sum is again below the optimum thrust. The net result is a curve such as shown by the dashed line in figure 8, where the maximum occurs at the optimum pressure ratio (PT/Po = 6 ) for that particular area ratio &/AI= 1.5).
The analytical model described above is idealized. When a nozzle is overexpanded (Po> Ps,,), the flow often separates or shocks form that cause nonuniformities in exit flow velocity and pressure profiles. Two such hypothetical cases are shown in figure 12. Some actual data are presented in the section Results and Discussion. When such phenomena occur, the actual thrust produced by the nozzle can exceed the values predicted by the simple analytical model presented here. This can be confirmed by integrating pressure-area data if enough measurements are made.
Results and Discussion Thrust Performance
Each of the nine configurations (table I) was tested over a range of nozzle pressure ratios from below to

0 2D-CD corrected data ----_ Ideal, onedimensional, isentropic - Model (see fig. for details)
Model C-11 (ref. 2): r- Model C-5 (ref. 2): \\ Ae/At = 1.8; ',* (b = 10.70
0 2D-CD corrected data Q Zero nozzle coolant __--- Ideal, onedimensional, isentropic
Model (see fig. for details)
r Model C-5 (ref. 2): / A e I A t = 1.8;
c,j = 10.7O
Model C-11 (ref. 2): AeIA = 1.25; Q = 1.40 ,
c
2 1 Model C-9 (ref. 2): - VI
2 VI 1.00 e " .98
c
VI
AeIAt 1.4; (b = 5.407
Nozzle pressure ratio, PT,7/Po
(b) Ae IAt = 1.5; c,j = 5.7'., (c) AeIAt = 1.8; Q = 8.8'. (d) AeIAt = 2 3; c,j = 14.6'.
(a) Ae/At = 1.2; Q = 2 3O.
Figure 13. - Dry gross thrust performance for various internal expansion area ratios A /At and divergent flap angles q. Throat area, At, 710 cm$(llO in2); gas temperature, TG, 944 K (1700O R).
Ideal. onedimensional, isentropic Model C-11 (ref. 2): Ae/At = 1. 25;
c,j = 5.40
I 0 2 4 6 8 10
Nozzle pressure ratio, PT, 7IPo
Figure 14. - Dry gross thrust performance for internal expansion area ratio Ae/At of 1.2 and divergent flap angle q, of 2 9". Throat area, At, 903 cm2 (140 in2); gas temperature, TG, 716 K (1288' R).
.94
above the value that theoretically provides the maximum thrust for that particular configuration. The ideal gross thrust used to compute the gross thrust coefficient CF for each data point was corrected for seal leakage and nonaxial components of coolant flow discharged outside the nozzle structure, as discussed in the section Analysis.
The corrected thrust coefficient data are presented in figures 13 to 15. The dashed lines in the figures are the
Model C-9 (ref. 2):
E 2 4 6 8 1 0
Nozzle pressure
' 0 0
4 6 8 10 12 14 ratio, PT, 7 I Po
(a) AeIAt = 1.2; Q = 3.6O. (b) Ae/At = 1.5; (c) A e I A t = 1.8; Q = 14.3'. (d) Ae/At 5 2 3; Q = 23.7'.
= 8.9'.
Figure 15. - Dry gross thrust performance for various internal expansion area ratios Ae/At and divergent flap angles Q. Throat area, A 1129 cm2 (175 in2); gas temperature. TG. 600 K (lo$bo R).
calculated ideal-expansion, one-dimensional isentropic performance for each configuration assuming no coolant penalties, leakage, friction, flow angle, or nonisentropic flow effects. Only area ratio A,/A1 was accounted for in the ideal calculation (see Analysis). The solid lines in the figures are scale-model data published in reference 2 . The model identification numbers are from that reference. The model configurations are not exactly the same (note differences in A,/AI and the divergent flap angles ad) but closely represent the full-scale configurations. The configuration differences account for most of the shift in pressure ratio values where the peak performance occurs. The shifts are more pronounced at low area ratios (figs. 13(a), 14, and 15(a)).
The corrected J85 full-scale data are generally within 2 percent of the ideal isentropic predictions and are in good agreement with the scale-model data although some scatter exists in the experimental data and the corrections for coolant bypass and leakage are not precise (see assumptions in Analysis). Friction and flow angle effects can account for most of the difference between the ideal and experimental data. The lowest experimental peak performance occurred at a high divergent flap angle (23.7' in fig. 15(d)). This low performance is due to flow angularity since a significant portion of the flow at the nozzle exit is not flowing parallel to the engine centerline.
13

The peak performance is also lower at low area ratios (&At= 1.2 in figs. 13(a) and 15(a)) than at the midrange area ratios. This performance loss may be attributed to three-dimensional nonisentropic flow effects in the nozzle throat region, which are more pronounced at the low area ratios. Wall static-pressure data to support this hypothesis are presented in Results and Discussion.
Some of the corrected data at low nozzle pressure ratios show gross thrust coefficients that are higher than the ideal isentropic value (figs. 13(b), 14, and 15(a)). Again, the actual flow is not ideal, and the forces resulting from pressure recovery downstream of internal shocks can increase the total force at some nozzle pressure ratios.
The area ratio of an operational exhaust nozzle would be either (1) scheduled with throat area by using linkages or (2) allowed to free float by pressure forces so that nearly ideal area ratios would occur at all flight conditions. The overall performance of a variable-area- ratio nozzle would then be near the peaks of the individual fixed-area-ratio curves presented in figures 13 and 15. Composite summaries of the peak performance for the two throat areas of figures 13 and 15 are presented in figures 16 and 17, respectively. Figure 16 shows that the performance potential of a variable-area-ratio 2D-CD nozzle at a dry-cruise throat area setting (data from fig. 13) is between 0.985 and 0.990 for all nozzle pressure ratios above 4.0. The highest performance occurred at an area ratio of 1.5. Below a nozzle pressure ratio of 4.0 the performance decreased to 0.958 at a pressure ratio of 2.5. The ideal isentropic thrust coefficient of a variable-area-ratio nozzle would have a
Configuration Internal expansion area ra!io,
Ae /At 0 A1 1.2
A A4 2.3
A2 1.5 0 A3 1.8
-_--- Ideal, onedimensional isentropic - Experimental
0 2 4 6 8 10 12 14 16 Nozzle pressure ratio, PT, 7/Po
Figure 16. - Dry gross thrust performance summary for throat area At of 710 cm2 (110 in2) and gas tempera- ture TG of 944 K (1700O R).
1.00 3 u
- VI
2 5 .94
e VI VI
a .92
Configuration Internal expansion area ratio,
A J A t
,
0 c1 1.2 0 c2 1.5 0 c3 1.8 A c 4 2.3
----- Ideal, onedimensional, isentropic Experimental
~
2 4 6 8 10 12 14 16 Nozzle pressure ratio, P T , ~ / P o
Figure 17. - Dry gross thrust performance summary for throat area At of 1129 cm2 (175 in2) and gas tempera- ture TG of 600 K (1080° R).
value of 1 .Q over the full range (a line through the peaks of the dashed lines in fig. 16). A similar plot for the maximum-afterburning area setting (the data were obtained without afterburning) is shown in figure 17. In this case the performance is higher than for the dry-cruise configuration. The performance increased from 0.967 at a pressure ratio of 2.0 to a maximum of 0.996 at a pressure ratio of 6.5, where the area ratio was 1.5. Above this pressure ratio the maximum performance decreased slowly to 0.987 at a pressure ratio of 14.0.
These high performance levels are achievable with nonaxisymmetric 2D-CD nozzles if the leakage and coolant penalties are eliminated.
Flow Discharge Coefficient
After the data had been corrected for leakage and coolant flows that bypassed the nozzle throat, the flow coefficient of the nozzle was determined by ratioing the effective area of the throat to the actual measured area. The effective area was computed from the corrected values of throat flow rate and mixed hot-gas temperature and the measured values of total pressure.
The flow discharge coefficients determined from the data are presented in figure 18. Above a nozzle pressure ratio of 5.0 the flow coefficient was nearly constant for both the dry-cruise throat area setting (fig. 18(a)) and the maximum-afterburning throat area setting (fig. 18(b)) as established by a line through the data scatter. The maximum-afterburning average throat area setting value of 0.957 was lower than the average value of 0.965 for the dry-cruise throat area setting. A possible explanation for
14

1. 00
Config- Internal uration expansion
area ratio, Ae'At
0 A2 1.5 0 A3 1.8
- A A4 2.3 1 u d M o d e l (ref. 2)
.98
0 c1 1.2 0 c2 1.5
- 0 c3 1.8 A C4
-
0 0 I (b) I 1 .94 0 5 10 15
Nozzle pressure ratio, PT, 7IPo
(a) At = 710 crn2 (110 in2). (b) At = 1129 cm2 (175 in2).
Figure 18. -Variation of nozzle discharge coefficient with pressure ratio for two throat areas At.
F i g u r e
19 b-1
20 (a-1)
21 (a-1) 21 a-2) 21 IbJ E l c ) 21 i d - 1 21 (d-21
the difference is that the leakage area for the maximum- afterburning throat area setting may be somewhat different than that for the dry-cruise throat area setting at which the leakage test was run (see Analysis). Any difference would affect the corrected flow rate through the nozzle throat as well as the corrected gross thrust performance discussed in the previous section.
The full-scale nozzle discharge coefficients are generally about 2 percent lower than the values reported in reference 2. The range of the reference values is indicated by the crosshatched areas in figure 18. Another difference exists at nozzle pressure ratios below 5.0. The trend of the full-scale nozzle values decreased at lower pressure ratios, whereas the model data showed a trend toward increasing values at lower pressure ratios. The presence of seals at the nozzle throat (fig. 4) could have an effect on the flow coefficients as well as on thrust performance because of a small step change in area at the throat station. The reference data were obtained by using a model with continuous, smooth walls and no irregular surface features or sharp corners.
Wail Static Pressure Profiles
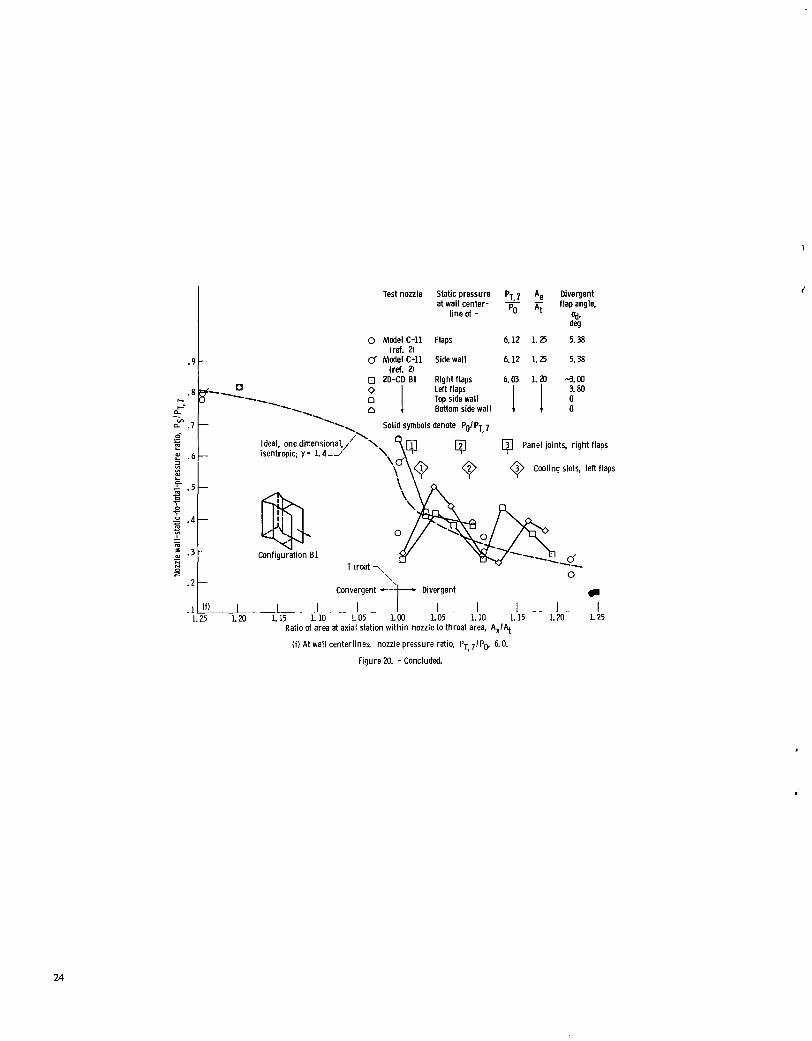
Wall static pressure (ratioed to nozzle inlet total pressure) profiles for convergent and divergent flaps and top and bottom side walls are presented in figures 19 to 21 for nozzle throat area settings of 710, 903, and 1129 cm2 (110, 140, and 175 inz), respectively. In each figure, typical pressure profile plots are presented for various combinations of area ratio and operating nozzle pressure ratio. The types of plot, configuration, and test pressure ratio are summarized in table 111.
Each figure includes an isometric sketch of the configuration for the data shown and oriented as the
TABLE 111. - WALL STATIC-PRESSURE PROFILE PLOTS
Conf i g- u r a t i o n
A1 A1
4 A3 A4
81
c1 1 c1 c2 c3 c4 c4
Throat area, 3 c d
7i 1129 gl I
__ i n2
110 I 1
140
175 I
Nozzle pressurr r a t i o ,
pT.7/p0 4.5 4.5 2.5 2.5 6.0
14.0 9.0
14.0
1.6 1.6 2.0 2.6 3.5 4.5 4.5 6.0
4.4 4.4 6.1 9.0
13.9 13.9
~
Type o f p l o t
A t w a l l c e n t e r l i n e s Across stream A t w a l l c e n t e r l i n e s Across stream A t w a l l c e n t e r l i n e s
Across stream A t w a l l c e n t e r l i n e s
Across stream A t w a l l c e n t e r l i n e s
A t w a l l c e n t e r l i n e s Across stream A t w a l l c e n t e r l i n e s A t w a l l c e n t e r l i n e s A t w a l l c e n t e r l i n e s Across stream

r-
Ratio of area at axial station wi th in nozzle to throat area, A,IA1
Top side wall
AxIAt
Solid symbols denote upstream + 1.004 of nozzle throat +-
at wall center- - flap angle, l ine of - %
deg
0 Model C-11 Flaps 4 3 1 1. Z 5.38
d .gi,21ii Sidewall 4 3 1 1.25 5.38
O P D - C D A 1 Rightflaps 4.49 1.a 2.26 .9 - iref. 21
Left flaps 2 22
Left flaps
P
0-
g
a Z P
L at
- m I ... u
at
- ._ - - r I - -
g ,
1.0 .5 0
.. .\ Ideal. onedimensional. I' \
Solid symbols denote Po/PT, 7 .7-
4 a Panel joints, r ight flaps
.6- isentropic; y - 1.4 -J' Q Q Cooling slots, left flaps
.5 -
@JJ . , .4-
d .3- Configuration A1 -- la-1) I I I 0 @ I
'S"T, 7
la-21
:5 0 .5 Z'zmax
Representation of nozzle rear view
side wall
h
1. 104
t 1.001 1.575 2. 1731
-.5 0 .5 1.0
Right flaps
1.354
0 .5 1.0 'SiPT. 7
ZIZmax
la-11 At wall centerlines. la-21 Across stream at various axial stations x.
la) Internal expansion area ratio, AeIAt, 1.2; nozzle pressure ratio, Pr.71 Pg. 45.
Figure 19. - Nozzle wall-static-to-total-pressure-ratio profiles at throat area At of 710 cm21110 in2).
16
. . . . ... . .

Left flaps
4P
<I
1.0
.8
x .6 E
>- > -
. 4
. 2
0 1.0 .5 0
Test nozzle Static pressure PT 7 A, at wall center- A
l ineof - '0
o Model C-9 Flaps 2 5 2 L a (ref. 2)
(ref. 2) d Model C-9 Side wall 2.52 1.m
0 ZD-CD A2 Right flaps 2% L 4 9 I I Left flaps Top side wall 2 1 Bottom side wal l
Solid symbols denote P o I P T , ~
O
n
Divergent flap angle,
@d* deg
5. m 5.41
5.65 5.42 0 0
0
Q L
Configuration A2 Throat>,
Convergent Divergent
b-1) I I 1 I l l l a 1.3 1.2 1.1 1.0 1.1 1.2 1.3 1.4 1.5 1.6
Ratio of area at axial station within nozzle to throat area, AXIAt
Top side wall
2. 173 1.515
-+- 1.008
+.= 1.104 1.258
Solid symbols denote upstream of nozzle throat
-.5 0 .5
Right flaps Z%ax
'SI'T.7
' .5 1.0
pS'pT,7
Bottom side wall
+ 1.104 -Q- 1.258
+ 1.W8 k
n - .5 VI
1.0 (b-2) -.5 0 .5
ZIZmax Ib-1) At wall centerlines.
(b) In ternal expansion area ratio, AeIAt, L5; nozzle pressure ratio. P T , 7 1 P ~ 25.
Figure 19. - Continued.
(b-2) Across stream at various axial stations x.
17

.9
.a
.7
Configuration A2
h +- 0 .2 VI
C L
Test nozzle Static pressure PT 7 A, Divergent at wall center- A 5 flapangle.
l ine of - o d e
deg
0 Model C-9 Flaps 6. 10 1.40 5. 40
6.10 1.40 5.40 U Model C-9 Side wall
0 PD-CDA2 Rightflaps 5.98 1.51 5.78 Left flaps Top side wall
fref. 21
kef. 2)
5.63 -e - n Bottom side wall
Solid symbols denote P0/PT, 7
\
\ , -. \ r Panel joints, r ight flaps
-
Ideal. one dimensional./ ‘fp Q
Q Cooling slots, left flaps .6- isentropic; 7- ~4 -J
Throat Convergent Divergent
1 1 1 1 1 1 g o - m
0 Model C-9 Flaps 9.74 L40 5.40
.9 rY Model C-9 Side wall 9.74 1.40 5.40 fref. 21
. Right flaps 14 16 1.52 5.92 5.75
N
0 z
4 p Panel joints, r ight flaps
Q Q Q Cooling slots, left flaps
. 5 t \ \ 0
Throat \
convergent t- Divergent
0 L l l l l l l l l l 1.4 1.3 1.2 1.1 1.0 1.1 1.2 1.3 1.4 1.5 1.6
(c) At wall centerl iner internal expansion area ratio, AeIAt. 1.5; nozzle pressure
(dl At wall centerl iner internal expansion area ratio, AeIAt. 1.5; nozzle pressure
Ratio of area at axial station within nozzle to throat area, AJAt
ratio. PT,71Po, 6.0.
ratio, PT,7/Po. 140. Figure 19. -Continued.
18

I I Test nozzle Static pressure Divergent
at wall center- - p$i 2 flapangle. l ine of - %I.
d w
0 Model C-5 Flaps 9.10 L80 10.73
d Model C-5 Sidewall 9.10 L80 10.73
0 20-CDA3 Rightflaps 9.03 L79 8.94
a Bottom side wall 3 -\ Solid symbols denote Po/PT.7
- '.( isentropic; 7 - 1.4
(ref. a (ref. 21
Left flaps 8.79 Top side wall
,- Ideal, one dimensional.
\ @ 9 Panel joints, r ight flaps
Q Q Q Cooling slots, left flaps
I I I I I 1 - 10
s
' ,,r Ideal. one i U 'y, isentropic:
Right flaps Left flaps Top side wall Bottom side wall
dimensional. , y - 1.4
9
1 4 r
4
229 1471 I 14%
Panel joints, r ight flaps
. 6 1 ), Q Q Q Cooling slot. left flaps
I I I I I I I 1.4 L 2 LO 1.2 1.4 1.6 1.8 20 2.2 2 4
Ratio of area at axial station wi th in nozzle to throat area. A,IAt
(e) At wall centerl inen internal expansion area ratio, AeIA+ 1.8: nozzle
(f) At wall center l ine i internal expansion area ratio, AeIAt. 2.3: nozzle pressure ratio, PT 71P0 9.0.
pressure ratio, PT,71P0 140.
Figure 19. - Concluded.
19

Test nozzle Static pressure PT,7 5 Divergent f lap angle.
od. deg
0 Model C-11 Flaps L75 1.25 5.38
at wal l center- - po l i n e of -
(ref. 2l
(ref. 2) d Model C-11 Side wall L15 1.5 5.38
2D-CD 61 Right flaps 1.65 1. a0 2.15 Left flaps 2.87 Top side wall
a : I Bottom side wal l .\ Solid symbols denote Po/PT,7
W -\
-- -- -1 '.
1-1) I 1.20
r P a n e l joints, r i g h t f laps
Configuration B1
1.15 1.10 1.05 1.M) 1.05 1.10 1.15 1.20 1.25 Ratio of area at axial station w i th in nozzle to throat area, AxIAt
Top side wall A d A t n .
1.0
Solid symbols denote upstream
L .5 1.036 n VI
Left flaps Right flaps
1.0 .5 0
Representation of nozzle rear view
(a-2)
0 .5 1.0 pS1pT,7
Bottom side wall pS1pT,7
Or h I
ZIZmax (a-1) At wall centerlines.
(a-2) Across stream at var ious axial stations x. la) Nozzle pressure ratio, PT, 71P,,, 1.6.
Figure 20. - Nozzle wall-static-to-total-pressure ra t io profi les at t h roa t area At of 903 cm2 (140 in2) and in te rna l expansion area rat io AeIAt of 1.2.
20

.9
Test nozzle Static pressure PT,7 A, Divergent at wal l center- - p,, q f lapangle.
air, deg
l ine of -
0 Model C-11 Flaps 2001.25 5.38 (ref. 2)
Iref. 21 Model C-11 Side wall 2 . 0 0 1 . 3 5.38
0 ZD-CD B1 Right flaps 2.01 1.19 2 7 2 CB Left flaps 2.74
Top side wall Bottom side wall
Solid symbols denote PolPT,7
--- -1 n I\
Ideal, one d imens ionazhx 9 4 Panel joints, r igh t flaps isentropic; y - 1.4 -> '\,
Q Q Q Cooling slots, left flaps
\? T
. 3 Configuration B1
1 I 3 f .2 a
0 Model C-11 Flaps 2.50 1. 25 5.38 lref. 21
0 ModeiC-11 Sidewal l 2.50 1. a 5.38 (ref. 21
Right flaps 2.56 1. 20 2.97 2.73
n n Bottom side wall
- -
- ;:;--< Ideal, one dimensional,,,' \ 9 9 Panel joints, r igh t flaps isentropic; y = 1 . 4 - 1
Q Q c w l i n g slots, left flaps
.5
. 4
. 3
. 2 I C ' I 1.25 1.20 1.15 1.10 1.05 1.00 1.05 1.10 1.15 1.20 1.25
Ratio of area at axial station w i th in nozzle to throat area, AxIAt
Ib) At wall centerlines: nozzle pressure ratio, PT 7/Pg. 2.0. IC) At wall centerlines: nozzle pressure ratio, Pi71P0, 2.6.
F igure 20. - Continued.
21

h . 9 I Test nozzle Static pressure PT,7 A_” Divergent
at wal l center- - flapangle. l ine of - Pd.
de9
0 Model C-11 Flaps 3.77 1. 25 5.38
0 Model C-11 Side wal l 3.77 1. 25 5.38 (ref. 2)
(ref. 2) ,! I n PD-CD E1 Riqht flaos 3.49 1.20 2.97
L e i flaps 2.74 Top side wal l Bottom side wal l n
Solid symbols denote PoIPT, 7 \
\ . -.
9 4 Panel joints, r i g h t flaps
Q Q Coolingslots. le f t f laps
Ideal. one dimensional,,,’‘ ‘ isentropic; y = 1 . 4 - 2
0
Configuration 8 1 Convergent
Id) At wall centerl ines: nozzle pressure ratio, PT,71Pg. 3.5.
F igure 20. - Continued.
i
22

Test nozzle Static pressure PT,7 A, Divergent at wall center- - ,q flap angle.
l ine of - us deg
0 Model C-11 Flaps 431 1.25 5.38
d Model C-11 Side wal l 431 1.a 5.38 (ref. 2)
(ref. 2) 0 PO-CO B1 Rightf laps 452 L21 3.14
Left flaps 2.82 Top side wal l Bottom side wal l
Solid symbols denote PoIPT, 7 -. -\
-- I+. \
Idea,, one dimensional,,//"'^,, 9\" p 4 Panel joints. r i g h t flaps
'f Q Q Q Cooling slots, left flaps isentropic; y - 1.4-1
P '9
:: . 3 Configuration 6 1 P
5 I 1
1.25 1. M 1. 15 1. 10 1.05 1. Ratio of area at axial station w i th in nozzle to throat area, A,/At
Top side wal l A x 1 4
1.317 Solid symbols denote upstream of nozzle throat I-- h ' O F T 'z
Left flaps
1.0 . 5 0 pS1pT.7
~
Representation of nozzle rear view
Bottom side wall
Right flaps
0 .5 1.0 pS/pT.7
(e-2)
1. o9a 1.086
1. ooo
1.0 -.5 0 .5
ZIZmax (e-1) At wall centerlines.
(e-2) Across stream at various axial stations x. (e) Nozzle pressure ratio, PT,7/P,,, 45.
Figure 20. - Continued.
23
Test nozzle Static pressure PT,7 A, Divergent - q f lap angle, at wal l center- l ine of - %.
deg
0 Model C-11 Flaps 6.12 1. a 5.38
6.12 1. 2S 5.38 0 Model C-11 Side wall (ref. 2)
(ref 2)
.a h
c- - n LL .7 0-
5 E 2
v)
a3 L
;
5 c c L .= 0
- - m
N - : z"
0 2DlCD 6 1 Right flaps 6.03 1.20 -3 .W : I n Bottom side wal l
Solid symbols denote P0IPT, 7
Ideal. one dimensional, /"\ 4 9 Panel joints, r i g h t flaps
Left flaps 3.80 1 1 : Top side wall g--- 0 -- -. \ .\ .\ , -
Q Q Cooling slots, left f laps \
. 6 - isentropic; 7 - 1.4-1 ' \
. 5 -
.4- QQ
. 3 - Configuration B 1 T iroat 7, -d,
\ 0
Divergent c . 1 LLL s I - . I-" - . . I . . 1 . 1 - _ 1 . I
Convergent
1.25 L20 1.15 1.10 LO5 l.W 1.05 1.10 1.15 1.20 1.25 Ratio of area at axial station w i t h i n nozzle to throat area, Ax!$
( f ) At wall cen te r l i ne r nozzle pressure ratio, PT, 7 1 P ~ . 6.0.
F igure 20. - Concluded.
24

Test nozzle Static pressure Pr A, Dlvergent at wall center- & flap angle.
% dql
l ine of -
0 Model C-11 Flaps 4 3 1 1.3 5.38
0 Model C-11 Sidewall 4 3 1 1.3 5.38 (ref. 2)
@ 9 Panel joints, r ight flaps
Q Cooling slots, left flaps Q
I . ~ I_.- I 125 1.20 1 1 5 1.10 1.05 l.W 1.05 1.10 1.15 L20 1.25
Ratio of area at axial station wi th in nozzle to throat area, AxlAt
Left flaps
Top side wall
1.0 AxIAt
Solid symbols denote upstream 2’- VI . 5 b 1.041 1. W3 of nozzle throat
1. 102 n
0- -.5 0 .5
82
1.0 . 5 0 ‘SIPT,7
(a-2)
ZIZmax
-
Representation of nozzle rear view
Bottom side wall
O r
Right flaps
d . 5 1.0
pSfpT,7
Z‘Zmax la-1) At wall centeriines.
(a-21 Across streamlines at various axial stations x (a) Internal expansion area ratio, AeIAt. 1.2: nozzle pressure ratio, PTa7fP@ 44
Figure 21. - Nozzle wall-static-to-total-pressure ratio profiles at throat area 4 of 1129 cm2 1175 in2).
I I
25
1 1 1 1 1 1 1 l 1 I 111 11111111

Test nozzle Static pressure PT,7 A, Divergent at wall center- - po ~7 flap angle.
4. deg
d Model C-9 Flaps 6.1ol.m 5.m
l ine of -
lref. a 0 Model C-9 Sidewall 6 1 0 1 4 0 5.40
lref. 2) 0 2D-CO C2 Right flaps
n Bottom side wall
Left flaps Top side wall
I 8.86 8.95 0 0 \ pT.7 9o 3 Panel joints, r ight flaps
.7 3 Cooling slots, left flaps
.6 I
I I
Ideal, one dimensional., isentropic; y - 1.4--'
. 5
.- e
Configuration C2 m L a Throat 7 -
4 .lt-) , 2 14 1.3 1.2 1.1 1.0 1.1 1.2 1.3 1.4 1.5 1 6
I 0 Model C-10 Flaps 9.27 1.80 1425
d Model C-10 Side wal l 9.27 1.80 1425
I converqent + Divergent
L I I L . I J - ._ L o L
- -
(ref. 21
lref. 21 z
0 20-CD C3 Right flaps 8.96 1.79 1426 Left flaps 14 33 Top side wall Bottom side wal l 1 1 :
4 9 Panel joints, r ight flaps
r Ideal. one dimensional,
Throat 7
Convergent Divergent
0 L t I I I I I L 4 1.2 1.0 1.2 1.4 1.6 1.8 2.0
Ratio of area at axial station within nozzle to throat area. A,IAt
(b) At wall centerl iner internal expansion area ratio, A,I&, 1.5, nozzle pressure - . ratio, PT 7lPg. 6.1.
ratio, PT,71P~, 9.0. IC) At wall h e r l i n e r internal expansion area ratio, AeIAt, 18: nozzle pressure
Figure 21. - Continued.
26

Test nozzle Static pressure PT,7 3 Divergent flapangle. at wal l center- -
po line d -
0 ED-CD C4 Rightflaps U.90 230 23.71 I I q7, Left flaps Tap side wall
n Bottom side wall
r Ideal, one dimensional, sentr; y - 1.4
- Solid symbol denote PdPT,7
- Panel joints, r ight flaps 4
id-11 i I I I I I 12 1.4 1.2 1.0 1.2 1.4 1.6 1.8 20 2.2 2 4
Ratio of area at axial station wi th in nozzle to throat area, AxIAt
lop side wail
1 f l - A J A t -. - ':" Solid symbols denote upstream
of nozzlethroat VI 1.220 a
Left flaps
. 5 0 pSIpT.7
I cr;ho I 1.618 0 -.5 0 .5
ZIzmax Right flaps
Representation of nozzle rear vi eu
Bottom side wall
r 2.263
0 . 5 1.0 pS'pT,7
1.618 5.5e ;: 1.322
I d 4 1.0 -.5 0 . 5
Z'Z,X Id-11 At wall centerlines.
Id-21 Across stream at various axial stations x (dl In ternal expansion area rat io AeIA, d 2.3; nozzle pressure rat io PT,71Po
Figure 21. - Concluded.
of 13.9.
I:
27

nozzle was mounted in the facility (side walls on top and bottom). The wall centerline profile plots include scale- model data from reference 2 for comparison with the full-scale data. The ideal one-dimensional, isentropic pressure ratio expressed by equation ( 5 ) is shown by the dashed lines. The locations of surface discontinuities due to the design of the cooling panels on the divergent flaps are also shown in the figures. The across-stream profile plots are a composite of four plots, one for each of the four walls arranged around a representation of a rear view of the nozzle. Because of the adjustable nozzle configuration some of the side-wall static-pressure- measuring orifices were covered by the flaps at the lower area settings. At a throat area of 710 cm2 (110 inz), for example, only the centerline orifices provided data on the side walls (figs. 19(a-2) and (b-2)).
To assist in the visualization of the complex three- dimensional flow fields, additional isometric plots of the wall static-pressure profiles are presented in figures 22 and 23. Figure 22 is an isometric of the curved ideal profile, which is assumed to be uniform across the width of the nozzle. In figure 23(a) profiles for a typical high- performance data point (from figs. 21(a-1) and (a-2)) are shown superimposed on the ideal isentropic curved plane. Figures 23(b) and (c) show data from a high- and a low- nozzle-pressure-ratio test condition, respectively.
In figure 23 the data points along the centerlines are connected by straight lines. The across-stream profiles
u
1.
Figure 22 - Isometric plot of theoretical onedimensional isentropic wall-static-to-total- pressure ratio profile. Internal expansion area ratio AeIAt of 1.2
28
. 8
.6
. 4
. 2
Y'Ymax i 0
are faired in where possible and extrapolated to the edges so that the axial profiles at the edges can be drawn in. In some cases where actual measurements were not available near both edges, symmetry was assumed in drawing the lines. In other cases a pressure on the adjacent surface (usually near the corner) was assumed to exist on the other side of the corner. These points are indicated by the tailed symbols. Some of the profiles near the throat are estimated (fig. 23(b), e.g.) from trends in other tests where pressure meashements were available.
A number of characteristic trends are indicated by the profiles in figures 19 to 23. The basic centerline profiles along the flaps at the various nozzle pressure ratios are typical for any convergent-divergent nozzle whether axisymmetric or nonaxisymmetric (refs. 2 and 12). All flap pressure profiles show evidence of local shocks or pressure recovery from local overexpansion. These phenomena occur at or near the throat plane and near discontinuities in the flap walls. For example, even though the pressure ratio (4.5) for the data shown in figure 19(a-1) was near the value for peak performance for that area ratio (1.2), a large overexpansion occurred followed by a pressure recovery near the throat on both right and the left flaps. Another pressure rise, which could result from shocks triggered by the discontinuities, occurred downstream of the wall discontinuities (at symbols labeled 2) on the divergent flaps. (Note the axial displacement of the right and left sides.)
Although the flap centerline data show overexpansion (below the theoretical ideal) near the throat, the side-wall centerline data near the throat show a local underexpansion (above the ideal). The scale-model data show the same trend but lower in magnitude. This characteristic was consistent for all the data. Further insight can be obtained from the side-wall plots of figure 21(a-2) and the isometric of the same data point in figure 23(a), where wall static pressures were available in the corners near the throat. Considerable nonlinearity of wall pressure profiles exists on both the side walls and the flaps at the throat plane. The nonlinearity is even more pronounced for the low-nozzle-pressure-ratio example in figure 23(c). This figure also indicates an inversion of the throat profile a short distance downstream of the throat. Although the overall pressure ratio of the nozzle for the test point of figure 23(c) was below the critical for choked flow, some of the local static-pressure levels indicated that the flow could have reached sonic velocity locally.
The across-stream pressure profiles are relatively flat across the full width of the divergent flaps except near the throat, as indicated in the last paragraph. Some pressure dropoff occurred near the flap edges downstream of the trailing edge of the side walls, as would be expected (most clearly seen in fig. 23(a)). The side-wall profiles, however, show some curvature at other axial stations especially at high operating nozzle pressure ratios (fig. 23(b)).
f

Ideal Solid symbols denote upstream of throat Tailed symbols denote data transposed from adjacent surface
---
+-- - -4
Trai l ing edge of .8 ps/pT,7 left divergent flap
(a) High-performance data point: internal expansion area ratio, Ae/At, 1.2; throat area, At, 113 cm2 1175 id): nozzle pressure ratio, PTJ/PO, 4.4. (b) High-area-ratio, high-pressure-ratio data point: internal expansion area ratio, Ae/At. 2 3; throat area, At, 1129 cm2 (175 in2); nozzle pressure ratio, PT,7/Po, 13.9.
Figure 23. -Isometric plots of typical wall-static-to-total-pressure rat io profiles.

Solid symbols denote upstream of nozzle throat Tailed symbols denote data transposed from adajcent surfaces
1.3
1. 5
1.2- (I8 . U P*/PT,7 1.0
(Cl
(c) Overexpanded low-pressure-ratio data point: internal expansion area ratio, Ae/At,
Figure 23. - Concluded.
1. 4 throat area, At, 903cm2(140 in2]; nozzle pressure ratio, P T , ~ / P ~ . 1.6.
Even though the wall static-pressure profiles show characteristics that deviate considerably from theoretical, the thrust performance remained high for most configurations. The axial component of an integration of the pressure over the surface areas would probably confirm the high thrust leve!s because the regions of low pressure are offset in general by regions of high pressure. Such an integration was not done for the data reported because there were not enough pressure measurements for accurate results.
The effect of the nonideal pressure gradients on other performance parameters such as the coolant flows required remains to be determined.
Summary of Results An air-cooled, nonaxisymmetric, two-dimensional,
convergent-divergent research exhaust nozzle was tested
on a 585-13 turbojet engine in an altitude test facility over a range of nozzle pressure ratios from 1.6 to 14.0. Dry baseline axial thrust performance was determined for three nozzle throat areas and a range of area ratios from 1.2 to 2.3. The data analysis included corrections in the performance for coolant flows that bypassed the nozzle throat and for seal leakages. The corrected data were compared with theory and scale-model data. The significant results were as follows:
1 . Above a nozzle pressure ratio of 4.0 the peak
for all configurations except one high-divergence-angle configuration.
2. Maximum gross thrust coefficient occurred at an internal expansion area ratio of 1.5 for both the maximum and minimum nozzle throat areas tested.
3 . Below a nozzle pressure ratio of 4.0 maximum gross thrust coefficients decreased with decreases in nozzle pressure ratio to as low as 0.958 at a nozzle pressure ratio of 2.5 for the minimum tested area ratio of 1.2.
4. The corrected thrust data were in good agreement with one-dimensional theory and scale-model data over the full range of nozzle pressure ratio for most configurations. The poorest agreement occurred at a high (23.7") divergent flap angle (up to 4 percent below ideal) and for low-area-ratio configurations (2 percent below ideal).
5 . The nozzle discharge coefficients were constant above a nozzle pressure ratio of 5.0, with values of 0.965 for a dry-cruise nozzle throat area setting and 0.957 for a maximum-afterburning nozzle throat area setting. These values are about 2 percentage points lower than the scale- model results.
6 . Wall static-pressure profile data indicated that strong three-dimensional flow effects occurred near the throat plane and along the divergent flaps near wall surface discontinuities. These flow effects were more pronounced than those occurring in smooth-walled scale models.
7. The magnitude of the data corrections indicated that substantial thrust penalties could result from coolant bypass flow and leakage.
corrected gross thrust coefficient was 0.985 or higher i
Lewis Research Center National Aeronautics and Space Administration Cleveland, Ohio, January 24, 1983
30

Appendix A Symbols
aeea effective leakage area discharge coefficient gross thrust coefficient increment in C., specific heat at constant pressure test cell coolant flow drag force air friction drag at labyrinth seal gross thrust analytical ideal isentropic gross thrust measured gross thrust ideal gross thrust ideal thrust of bypass coolant flow labyrinth seal pressure forces measured thrust from load cells installation spring force inlet momentum and pressure force (eq. (2)) fuel-air ratio gravitational constant Mach number mass flow rate, W/g pressure differential pressure computed static pressure at exit area measured wall static pressure gas constant radius temperature velocity flow rate coolant flow to transition liner coolant flow to left convergent flap coolant flow to left divergent flap coolant flow to pivot section coolant flow to reverser sectior. coolant flow to right convergent flap coolant flow to right divergent t a p coolant flow to side walls
leakage flow from convergent flap leakage flow from forward hinges leakage flow from divergent flap leakage flow from piston ring seal leakage flow from reverser section leakage flow from throat hinges axial distance along nozzle flow path across-stream distance along width of nozzle
across-stream distance along side walls convergent flap angle to engine centerline divergent flap angle to engine centerline specific heat ratio density
flaps
Subscripts: C coolant e G gas I leak m measured max maximum P inlet plenum S static condition T total condition t X axial station within nozzle 0 ambient test cell
Engine stations: 1 airflow-measuring station 2 compressor inlet 3 compressor exit 5 turbine exit 7 nozzle inlet 8 nozzle throat 9 nozzle exit
Superscript :
nozzle exit (engine station 9)
nozzle throat (engine station 8)
* critical
31

Appendix Is Leakage Corrections
The postrun leakage calibration was performed with the air supply and nozzle hardware at ambient test cell temperature conditions. The pressure differential APl was varied to include the range encountered in the hot- flow nozzle tests. The amount of actual leakage during the hot-flow tests, however, is a function not only of the pressure differential, but also of the temperature of the leakage flow. In addition, the leakage calculation requires determination of whether the leaks are flowing with subsonic or sonic velocity at the leakage area and whether the leakage is greater or less than the coolant flow supplied internally to the nozzle upstream of the throat.
When the calculated leakage flow was less than the measured internal coolant flow upstream of the nozzle throat (tests 127 and 164 in table IV), the analysis assumed that only film-cooling air was flowing through the leak (assumption 3 in Analysis). This assumption was used because about 90 percent of the coolant (W,J and
Wc,r in fig. 9) entering the system upstream of the nozzle throat was also upstream of the reverser section, where 73.7 percent of the seal length was located (table 11). The reverser section was also close to the film-cooling slot, where the reverser section coolant Wc,r was discharged along the wall. The temperature of this flow, measured at the inlet to the slot, was used for calculating the leakage air density. Some hot gas, however, was mixed with the transition liner coolant Wc,l, which was injected along the wall further upstream (fig. 9).
When the calculated leakage was greater than the measured internal coolant flow upstream of the nozzle throat (test 198 in table IV), the temperature of the leakage flow was adjusted to account for the hot gas that was also flowing through the leak along with the cooling air.
After the temperature and flow rate of the leakage were known, the nozzle throat flow rate and temperature were determined. When the calculated leakage was less
9
TABLE I V . - TYPICAL LEAKAGE RESULTS
Nozz le expans ion a r e a r a t i o , AJAt N o z z l e p r e s s u r e r a t i o , PT,~ /Po
C o o l a n t f l o w , p e r c e n t W7:
I n t e r n a l , ups t ream o f T r a n s i t i o n l i n e r , R e v e r s e s e c t i o n , %,r P i v o t s e c t i o n , L e f t c o n v e r g e n t l % p , wC,,,f 1 /6 o f s i d e w a l l , %
I n t e r n a l , downstream o f A (bypass around ) - le!t d i v e r g e n t flap,%,, I d f
E x t e r n a l o v e r b o a r d d i s c h a r g e (bypass around At)
!! ' S w S u b t o t a l
R i g h t c o n v e r g e n t f l a p , WC,,,f R i g h t d i v e r g e n t f l a p , Wc,rdf 5 / 6 o f s i d e w a l l , Wc
I T o t a l c o o l a n t f l o w , W,, p e r c e n t W7
' "Sub t o t a1
.Leak d i f f e r n t i a l p ressu re ,
E f f e c t i v e l eakage area, AI. cm2 ( i n 2 ) Hot-gas tempera tu re , T , K ( O R )
C o o l a n t tem e r a t u r e (a$ %,r s l o t ) ,
Computed leakage tempera tu re ,
Nozz 1 e t h r o a t t empera tu re ,
Leakage f l o w r a t e , M I , p e r c e n t w7
API, N / c Z ( p s i d )
Tc, K (OR!
TI, K ( O R )
T s K ( O R )
127
903 (140) 1.2
3.49
5.35 3.49 0.38 0.37 0.25 v;84
0.75
0.36 0.76 1.28 m
12.99
9.4 (13.6)
51.3 7.95 702 [1296/
313 (564
313 (564)
714 (1285)
7.94
T e s t
164
1129 (175) 1.5
6.OE
5.32 3.48 0.40 0.38 0.26 Ka? 0.77
0.38 0.77 1.28 2x3
13.04
7.4 (10.7)
306 (550
306 (550)
i99 (1079)
5.52
198
710 (110) 1.5
5.98
5.48 4.05 0.56 0.38 0.27
m;T4
0.72
0.37 0.72 1.37 2 x 6
13.92
16.9 (24.5)
i7.2 8.87
337 (607
417 (750)
946 (1702)
11.84
946 117021
C'
32
~~ . .. . .... .

than the coolant flow, the coolant that did not leak was assumed anaiytically to be completely mixed with the hot gas. The resulting value of Tf (lower than T7) was computed from a heat balance by using variable properties. If the leakage was greater than the coolant flow, the nozzle throat flow rate was adjusted for the hot gas flowing out the leak, but the temperature remained at the T7 value.
through both the nozzle throat and the leakage area had been determined, a corrected gross thrust coefficient was computed by using these adjusted values for evaluating
contributions of the overboard and bypass coolant flows were included as previously discussed in Analysis.
A logic diagram of the computations is shown in figure 24. The sequence of the computations and equations used is outlined in the following paragraphs.
The inputs required are listed in figure 24, where the temperature, pressure, fuel-air ratio, flow rate, and thrust are measured values. The effective leakage area A1 was determined from the calibration, and the ideal thrust of the bypass coolant flows F,,c,ext was separately computed from the pressure, temperature, and flow rate of the bypass flow.
I 1 ii er
I , When the adjusted temperatures and flow rates
t 1: 1 the ideal thrust F, in equation (3). The ideal thrust
Inputs:
Tc. T7, Ifla+,
‘T.C. ‘T.79 ‘0’ “L wc. w7. w3. A h Fg. nv Fi, c, ext
Since the solutions are iterative, initial first-try values are needed for the leakage temperature TI and specific heat of the nozzle throat flow Cp,f. For first try: TI= T, and C P , ~ = Cp,7.
The properties of the leakage flow are determined in block A (fig. 24), where
- Leak properties:
‘P, 1 = f(TZ) Find W l subsonic 4 initialize
C
The critical flow static pressure Pt,r is computed to compare with the ambient test cell pressure Po for determining whether the leak is sonic or subsonic.
J
where PT,[ is the average of four wall static pressures in the region of the reverser-blockers. The sonic flow test occurs at block B. If the leakage flow is subsonic (block
c
33

C), the leakage flow rate is computed as follows:
If the leakage flow is sonic (block D), the following equations are used:
v*=
The difference between the leakage and coolant flow is determined at block E. The test flag at block F is used to ensure that the iteration for a mixed (coolant and hot gas) TI is completed before continuing to the nozzle throat calculations (used when the leakage is greater than the coolant flow). The flow test is made at block G and branches to block H when W l l W,, where TI is determined by a heat balance:
A test for convergence occurs at block I. If TI is not converged within 1 deg K, the calculations for blocks A to E are repeated with new properties in each loop until convergence does occur.
After TI has converged, the calculation branches to block J, where the nozzle throat conditions are constant for this case. Set Tt= T7 and ( f / ~ ) ~ = Cf/a)7 and the throat flow rate is
w,= w7+ w,- w/
I The output-corrected thrust parameters at block K are computed as follows:
When the test at block G indicates that the leakage flow WI is less than the coolant flow W,, the calculation branches to block L, where the nozzle throat flow conditions are determined.
w,= w,+ w,- w,
The nozzle throat temperature T, is calculated at block M, but an iteration is required since the specific heat is a function of the temperature Tt being computed.
1
The iteration occurs through the convergence test at block N to block 0, where a new value of specific heat Cp,t is computed:
CP, t =f [ Tt, Cf/a 1 tl
When Tt has converged within 1 deg K, the calculation branches to block K, where the output-corrected thrust parameters are computed as previously described.
The sensitivity of the calculated gross thrust coefficient to the two experimental measurements (AI and TI) that have the greatest uncertainty in accuracy of measurement (see assumptions in Analysis) was calculated for the three typical test points in table IV and is tabulated in table V.
In general, these sensitivity factors indicate that the probable accuracy of the corrected thrust performance in figures 13 to 17 is within &0.5 percent for variables used in the leakage correction. Additional error, however, could be attributed to measured thrust errors.
34

TABLE V. - SENSITIVITY OF GROSS THRUST COEFFICIENT
TO LEAKAGE PARAMETERS
I n c r e m e n t i n g r o s s t h r u s t c o e f f i c i e n t , A C
Fo
E f f e c t i v e l e a k a g e a r e a : A / + 10 p e r c e n t +0.007 +0.005 +0.006 A, - 10 p e r c e n t I -.005 I -.OM I -.007 I
Leakage t e m p e r a t u r e : TI + 50 deg K (+90 deg R ) - e 0 0 5 -.005 TI - 50 deg K (-90 deg R ) I ;:88: I +.oo5 1 +.003 I
I 1 I I I
!
35

References
1. Capone, F.J.: The Nonaxisymmetric Nozzle-It is For Real. AIAA Paper No. 79-1810, Aug. 1979.
2. Berrier, B. L.; and Re, R. J.: Effect of Several Geometric Parameters on the Static Internal Performance of Three Nonaxisymmetric Nozzle Concepts. NASA TP-1468, 1979.
3. Re, R. J.; and Berrier, B. L.: Static Internal Performance of Single Expansion-Ramp Nozzles with Thrust Vectoring and Reversing.
4. Mason, M. L.; Putnam, L. E.; and Re, R. J.: Effect of Throat Contouring on Two-Dimensional Converging-Diverging Nozzles at Static Conditions. NASA TP-1704, 1980.
5 . Yetter, J. A.; and Leavirt, L. D.: Effects of Sidewall Geometry on the Installed Performance of Nonaxisymmetric Convergent- Divergent Exhaust Nozzles. NASA TP-1771, 1980.
6. Hutchinson, R.A.; et al.: Investigation of Advanced Thrust- Vectoring Exhaust Systems for High Speed Propulsive Lift. AIAA Paper No. 80-1159, July 1980.
NASA TP-1962, 1982.
7. Capone, F. J.: Aeropropulsive Characteristics of Twin Nonaxi- symmetric Vectoring Nozzles Installed with Forward-Swept and Aft-Swept Wings. NASA TP-1778, 1981.
8. Capone, F. J.; Hunt, B. L.; and Poth, G. E.: Subsonic/Supersonic Nonvectored Aeropropulsive Characteristics of Nonaxisymmetric Nozzles Installed on an F-18 Model. AIAA Paper No. 81-1445, July 1981.
9. Bare, A. E.; Berrier, B. L.; and Capone, F. J.: Effect of Simulated In-Flight Thrust Reversing on Vertical-Tail Loads of F-18 and F-15 Airplane Models. NASA TP-1890, 1981.
10. Nash, D. 0.; Wakeman, T. G.; and Palcza, J. L.: Structural and Cooling Aspects of the ADEN Nonaxisymmetric Exhaust Nozzle. ASME Paper No. 77-GT-110, 1977.
11. Ames Research Staff: Equations, Tables, and Charts for Compressible Flow. NASA TR-1135, 1953.
12. Shapiro, A.H.: The Dynamics and Thermodynamics of Com- pressible Fluid Flow. Vol. I. Ronald Press Co., 1953, pp. 139-143.
36

1. Report No. I NASA TP-2171
- . - -~ (Suggested by Author(s1 )
Nonaxisymmetric nozzles; Thrust-vectoring nozzles; Thrust-reversing nozzles; Nozzle thrust performance; Exhaust nozzle leakage
2. Government Accession No. I
18. Distribution Statement Unclassified - unlimited STAR Category 07
3. Recipient's Catalog No. I
19. Security Classif. (of this report)
Unclassified
L
4. Title and Subtitle THRUST PERFORMANCE OF A VARIABLE-GEOMETRY, NONAXISYMMETRIC, TWO-DIMENSIONAL, CONVERGENT- DIVERGENT EXHAUST NOZZLE ON A TURBOJET ENGINE AT ALTITUDE
7. Author(s)
David M. Straight and Richard R. Cullom
9. Performing Organization Name and Address National Aeronautics and Space Administration Lewis Research Center Cleveland, Ohio 44135
. _ _ -
20. Security Classif. (of this page)
Unclassified
12. Sponsoring Agency Name and Address National Aeronautics and Space Administration Washington, D. C. 20546
5. Report Date June 1983
6. Performing Organization Code
5 0 5 4 3 - 2 2
8. Performing Organization Report No.
E-1451 10. Work Unit No.
11. Contract or Grant No.
13. Type of Report and Period Covered I Technical Paper 14. Sponsoring Agency Code
i . .. . .~ . .
16. Abstract
A variable-geometry, low-aspect-ratio, nonaxispmetric, two-dimensional, convergent-divergent exhaust nozzle was tested at simulated altitude on a turbojet engine to obtain baseline axial, dry- thrust performance over wide ranges of operating nozzle pressure ratios, throat areas, and internal expansion area ratios. The thrust data showed good agreement with theory and scale-model test results after the data were corrected for seal leakage and coolant losses. Wall static-pressure profile data were also obtained and compared with one-dimensional theory and scale-model data. The pressure data indicate greater three-dimensional flow effects in the full-scale tests than with models. The leakage and coolant penalties were substantial, and the method to determine them is included.
* For sale by the National Technical Information Service, Springfield, Virginia 22161
22. Price'
A03 ~~ -
N A S A - L a n g l e y , 1 9 8 3

National Aeronautics and Space Administration
Washington, D.C. 20546 Official Business Penalty for Private Use, $300
T H I R D - C L A S S BULK R A T E Postage and Fees Paid National Aeronautics and Space Administration N A S A 4 5 1
m
I
POSTMASTER: I f Undeliverable (Section 158 Postal Manual) Do Not Return