through DISCIPLINE, DIVERSIFICATION Information/Q3... · 2015-11-25 · STABILITY, GROWTH &...
23
STABILITY, GROWTH & SECURITY through DISCIPLINE, DIVERSIFICATION & SCALE Debt Investor Presentation As at September 30, 2015 unless otherwise noted A final base shelf prospectus containing important information relating to the securities described in this document has been filed with the securities regulatory *authorities in each of the provinces of Canada. A copy of the final base shelf prospectus, any amendment to the final base shelf prospectus and any applicable shelf prospectus supplement that has been filed, is required to be delivered with this document. This document does not provide full disclosure of all material facts relating to the securities offered. Investors should read the final base shelf prospectus, any amendment and any applicable shelf prospectus supplement for disclosure of those facts, especially risk factors relating to the securities offered, before making an investment decision. November 18, 2015
Transcript of through DISCIPLINE, DIVERSIFICATION Information/Q3... · 2015-11-25 · STABILITY, GROWTH &...

STABILITY, GROWTH &SECURITY
through
DISCIPLINE, DIVERSIFICATION
& SCALEDebt Investor PresentationAs at September 30, 2015 unless otherwise noted
A final base shelf prospectus containing important information relating to the securities described in this document has been filed with the securities regulatory *authorities in each of the provinces of Canada. A copy of the final base shelf prospectus, any amendment to the final base shelf prospectus and any applicable shelf prospectus supplement that has been filed, is required to be delivered with this document.
This document does not provide full disclosure of all material facts relating to the securities offered. Investors should read the final base shelf prospectus, any amendment and any applicable shelf prospectus supplement for disclosure of those facts, especially risk factors relating to the securities offered, before making an investment decision.
November 18, 2015

STABILITY, GROWTH & SECURITY through DISCIPLINE, DIVERSIFICATION & SCALE 2
Caution Regarding Forward-looking Statements
This document contains forward-looking information within the meaning of applicable securities laws (also known
as forward-looking statements) including, among others, statements relating to the objectives of H&R REIT and H&R Finance
Trust, strategies to achieve those objectives, H&R’s beliefs, plans, estimates, intentions, and similar statements concerning anticipated
future events, results, circumstances, performance or expectations that are not historical facts including, the amount of distributions to
unitholders. Forward-looking statements generally can be identified by words such as "outlook", "objective", "may", "will", "expect", "intend",
"estimate", "anticipate", "believe", "should", "plans", "project", "budget" or "continue" or similar expressions suggesting future outcomes or
events. Such forward-looking statements reflect H&R’s current beliefs and are based on information currently available to management. These
statements are not guarantees of future performance and are based on H&R’s estimates and assumptions that are subject to risks and
uncertainties, including those discussed in H&R’s materials filed with the Canadian securities regulatory authorities from time to time, which
could cause the actual results and performance of H&R to differ materially from the forward-looking statements contained in this news release.
Those risks and uncertainties include, among other things, risks related to: prices and market value of securities of H&R; real property ownership;
availability of cash for distributions; restrictions pursuant to the terms of indebtedness; liquidity; credit risk and tenant concentration; interest
rate and other debt related risk; tax risk; ability to access capital markets; dilution; lease rollover risk; construction risks; joint arrangements risk;
currency risk; unitholder liability; co-ownership interest in properties; competition for real property investments; environmental matters and
changes in legislation, indebtedness of H&R, the REIT’s plans to build on the strategic alliance with CrestPSP, the expected occupancy of the
REIT’s project in Long Island City, NY, the REIT’s exposure to the Alberta office market and the opportunity to subdivide and remerchandise space
formerly rented by Target. Material factors or assumptions that were applied in drawing a conclusion or making an estimate set out in the
forward-looking statements include that the general economy is stable; local real estate conditions are stable; interest rates are relatively stable;
and equity and debt markets continue to provide access to capital. H&R cautions that this list of factors is not exhaustive. Although the forward-
looking statements contained in this news release are based upon what H&R believes are reasonable assumptions, there can be no assurance
that actual results will be consistent with these forward-looking statements. All forward-looking statements in this news release are qualified by
these cautionary statements. These forward-looking statements are made as of today, and H&R, except as required by applicable law, assumes
no obligation to update or revise them to reflect new information or the occurrence of future events or circumstances.

STABILITY, GROWTH & SECURITY through DISCIPLINE, DIVERSIFICATION & SCALE 3
Overview H&R REIT is a fully diversified REIT owning high quality office,
retail, industrial and residential properties across Canada and the United States
2nd largest REIT in Canada with a market cap of $6.1 billion Rated BBB (high) by DBRS – one of only 4 REITS in Canada to
achieve this rating Consistently strong occupancy, exceeding 96% since 1997 Average return to unitholders since inception of 14% 12 of the top 15 tenants have investment grade credit ratings
and comprise 42% of gross revenue Fully internalized and aligned management CEO and founders own approximately 6% of the REIT
Strong balance sheet with 45% debt to asset ratio and ~$1.7B of unencumbered properties
67% FFO payout ratio Average commercial lease term of 10.1 years, one of the
longest in the industry Average interest rate of 4.7% on mortgages with an average
term to maturity of 6.1 years
3
STABILITY, GROWTH & SECURITY through DISCIPLINE, DIVERSIFICATION & SCALE 4
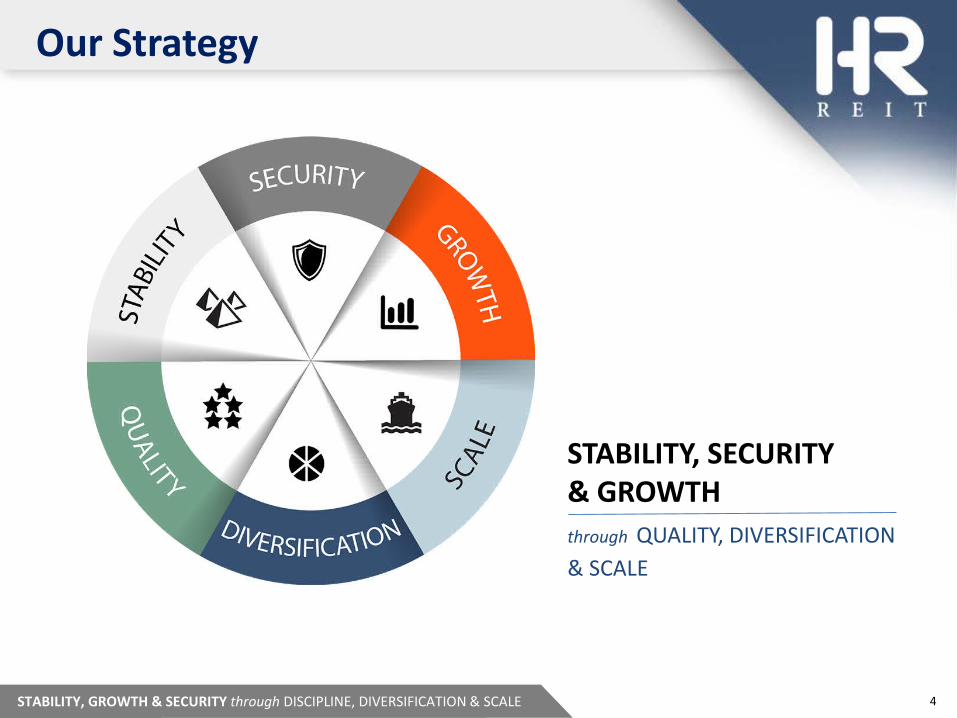
Our Strategy
STABILITY, SECURITY & GROWTHthrough QUALITY, DIVERSIFICATION& SCALE

STABILITY, GROWTH & SECURITY through DISCIPLINE, DIVERSIFICATION & SCALE 5
H&R REITCEO – Tom Hofstedter CFO – Larry Froom• 512 properties (46.6M sq. ft.)• Total investment properties – C$13.5 billion• Market cap.- C$6.1 billion• Fully internalized management• DBRS rating – BBB(high) - stable
Critical Mass Across Property Segments
OFFICE (51%)(1)
COO – Nathan Uhr• 39 properties• 13.5M sq. ft.• Direct ownership• Canada & U.S.
RETAIL (39%)(1)
• Three retail platformsINDUSTRIAL (8%)(1)
COO – Nathan Uhr• 105 properties• 11.9M sq. ft.• 100 properties are owned ~ 50/50
with PSP & Crestpoint• Canada & U.S.
RESIDENTIAL (2%)(1)
COO – Philippe Lapointe• 5 U.S. properties• 1,808 units• 4th property under
development ($1.2B in Long Island City, 50% JV with Tishman Speyer)
COO – Pat Sullivan• 31 Canadian
properties• 8.8M sq. ft.• 5 properties are
owned ~ 50/50 with Montez Corp.
H&R Retail
COO – Nathan Uhr• 131 properties• 7.9M sq. ft.• Direct ownership• Canada & U.S.
(45+87 properties)
CEO – Tom Karet• 201 U.S. properties• 2.9M sq. ft.• 33.6% ownership
(1) % of fair value(2) Square feet is based on the Trusts’ interests of net leasable area.
STABILITY, GROWTH & SECURITY through DISCIPLINE, DIVERSIFICATION & SCALE 6
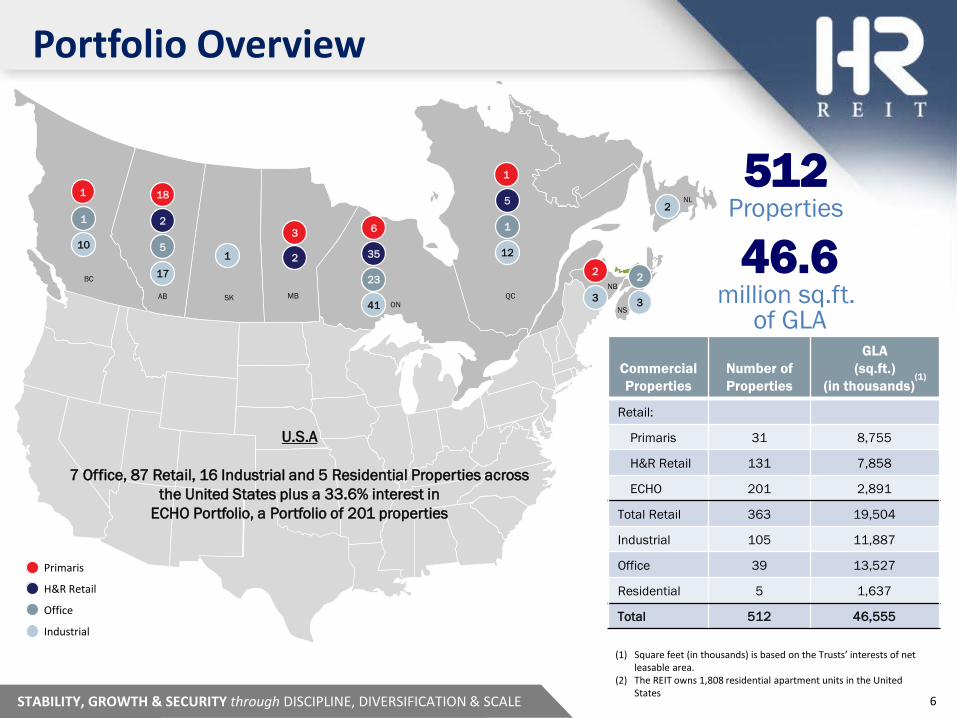
Portfolio Overview
2
5
17
1
1
103
22
3
2
2
3
6
35
23
41
1
5
1
121
BC
AB MBNB
NL
NSON
QCSK
Primaris
H&R Retail
Office
Industrial
Commercial Properties
Number of Properties
GLA (sq.ft.)
(in thousands)(1)
Retail:
Primaris 31 8,755
H&R Retail 131 7,858
ECHO 201 2,891
Total Retail 363 19,504
Industrial 105 11,887
Office 39 13,527
Residential 5 1,637
Total 512 46,555
512Properties
46.6million sq.ft.
of GLA
18
U.S.A
7 Office, 87 Retail, 16 Industrial and 5 Residential Properties across the United States plus a 33.6% interest in
ECHO Portfolio, a Portfolio of 201 properties
(1) Square feet (in thousands) is based on the Trusts’ interests of net leasable area.
(2) The REIT owns 1,808 residential apartment units in the United States

STABILITY, GROWTH & SECURITY through DISCIPLINE, DIVERSIFICATION & SCALE 7
Office53%
Primaris (retail) 21%
ECHO (U.S. retail)
4%
H&R Retail 14%
Industrial 8%
Office51%
Primaris (retail)23%
ECHO (U.S. retail)
5%
H&R Retail11%Industrial
8%
Residential2%
Portfolio Diversification
$13.9billion
$207million
Properties by Asset Class
Fair Value of Investment Properties(1)
(As at September 30, 2015)
Properties by Geography
Same-Asset Property Operating Income(1)(2)(3)
(For the quarter ended September 30, 2015)
Ontario34%
United States28%
Other Canadian Provinces
10%
Alberta28%
$207million
Ontario33%
United States27%
Other Canadian Provinces
10%
Alberta30%
$13.9billion
(1) Includes equity accounted investments.(2) Property operating income is calculated before finance costs and
excludes realty taxes accounted for under IFRIC 21.(3) “Same-asset” refers to those properties owned by the REIT for the 21-month period ending September 30, 2015.

STABILITY, GROWTH & SECURITY through DISCIPLINE, DIVERSIFICATION & SCALE 8
Alberta Exposure
8
Primaris: Alberta all store sales (excluding anchor tenants) was
strong at $576 per square foot for the rolling twelve months ended August 31, 2015
(1) Includes equity accounted investments. (2) Property operating income is calculated before finance costs and excludes realty taxes accounted for under IFRIC 21.
Office62%
Retail33%
Industrial5%
$57.9M
STABILITY, GROWTH & SECURITY through DISCIPLINE, DIVERSIFICATION & SCALE
Alberta TotalProperty Operating Income(1)(2)
(For the quarter ended September 30, 2015)
Alberta OfficeProperty Operating Income(1)(2)
(For the quarter ended September 30, 2015)
TCPL Tower – 19%(TCPL – A(low) rated)
Lease Expiry 2031
Telus Tower – 7%Other – 2%
$35.8M
Trophy properties with high quality office tenants committed to long term leases Retail continues to show strong sales performance
The Bow – 72%(Encana – BBB rated)
Lease Expiry 2038
STABILITY, GROWTH & SECURITY through DISCIPLINE, DIVERSIFICATION & SCALE 9
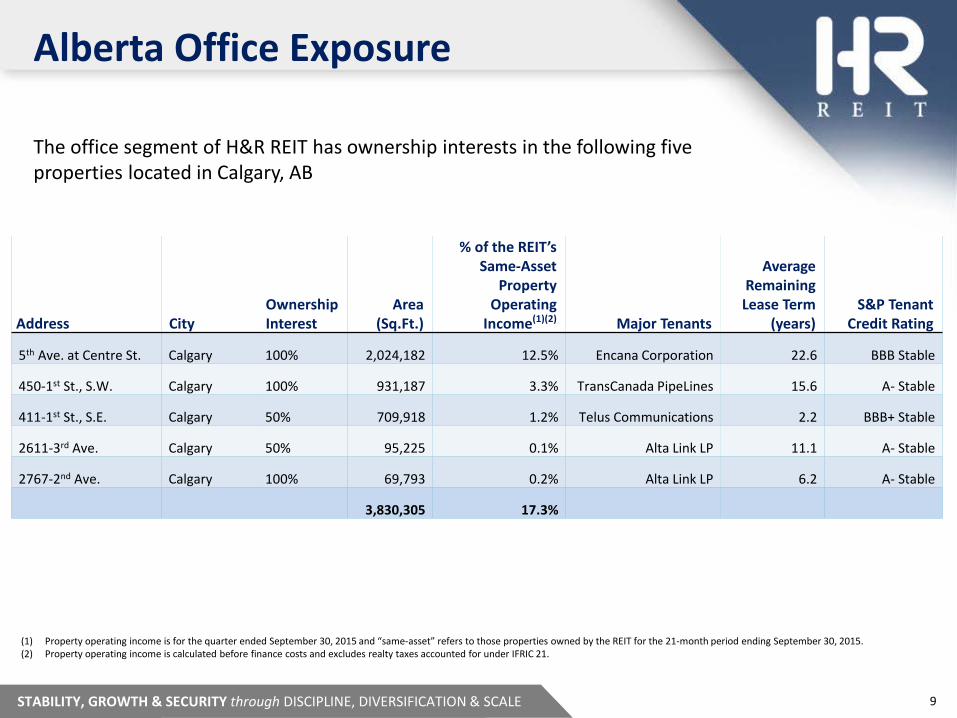
Alberta Office Exposure
Address CityOwnership Interest
Area (Sq.Ft.)
% of the REIT’s Same-Asset
Property Operating
Income(1)(2) Major Tenants
Average Remaining Lease Term
(years)S&P Tenant
Credit Rating
5th Ave. at Centre St. Calgary 100% 2,024,182 12.5% Encana Corporation 22.6 BBB Stable
450-1st St., S.W. Calgary 100% 931,187 3.3% TransCanada PipeLines 15.6 A- Stable
411-1st St., S.E. Calgary 50% 709,918 1.2% Telus Communications 2.2 BBB+ Stable
2611-3rd Ave. Calgary 50% 95,225 0.1% Alta Link LP 11.1 A- Stable
2767-2nd Ave. Calgary 100% 69,793 0.2% Alta Link LP 6.2 A- Stable
3,830,305 17.3%
The office segment of H&R REIT has ownership interests in the following five properties located in Calgary, AB
(1) Property operating income is for the quarter ended September 30, 2015 and “same-asset” refers to those properties owned by the REIT for the 21-month period ending September 30, 2015. (2) Property operating income is calculated before finance costs and excludes realty taxes accounted for under IFRIC 21.

STABILITY, GROWTH & SECURITY through DISCIPLINE, DIVERSIFICATION & SCALE 10
Institutional Quality Assets - Office
Scotia Plaza | Toronto
2 Gotham Centre | New York Corus Quay | Toronto
Place Bell | Ottawa
Hess Tower | Houston
The Bow | Calgary

STABILITY, GROWTH & SECURITY through DISCIPLINE, DIVERSIFICATION & SCALE 11
Institutional Quality Assets – Industrial & Retail
Orchard Park | Kelowna Sunridge | Calgary Dufferin Mall | Toronto Canadian Tire | Brampton
Unilever | Mississauga

STABILITY, GROWTH & SECURITY through DISCIPLINE, DIVERSIFICATION & SCALE 12
Top 15 Tenants by Revenue(1)
Tenant Industry
% of Rental Income(2)
from InvestmentProperties
Number of Locations
REIT owned
sq.ft. (in 000’s)
Average Lease Term to Maturity
(years)(3)Credit Ratings
(S&P)
Encana Corporation Energy 11.6% 2 2,086 22.3 BBB Stable
Bell Canada Telecommunications 7.8 27 2,542 9.8 BBB+ Stable
Hess Corporation Energy 5.1 1 845 -(6) BBB Stable
TransCanada Pipelines Limited Energy 3.6 1 931 15.6 A-Stable
Giant Eagle, Inc. Grocery 3.2 181 1,996 13.8 Not Rated
New York City Department of Health Government 3.2 1 670 15.2 AA Stable
Canadian Tire Corporation(4) General Merchandise 2.5 21 2,625 9.7 BBB+ Stable
Bank of Nova Scotia Financial Institutions 2.3 7 477 9.3 A+ Negative
Telus Communications Telecommunications 2.2 18 619 5.1 BBB+ Stable
Rona Inc. Home Improvement 1.9 15 1,914 4.3 BB+ Stable
Corus Entertainment Inc. Media 1.6 1 472 17.4 BB+ Stable
Canadian Imperial Bank of Commerce Financial Institutions 1.6 9 550 8.6 A+ Negative
Nestle Canada and USA Multi-national Food 1.5 4 1,265 2.9 AA StableOntario Realty Corporation and Other Ontario Agencies(5) Government 1.1 3 351 3.6 A+ Stable
Shell Oil Products Energy 1.1 17 223 6.6 AA- Negative
50.3% 308 17,566 13.1(1) Includes equity accounted investments.(2) The percentage of rentals from investment properties is based on estimated annualized gross revenue excluding straight-lining of contractual rent and capital expenditure recoveries.(3) Average lease term to maturity is based on net rent.(4) Canadian Tire Corporation includes Canadian Tire, Mark’s Work Warehouse, Sport Chek, Atmosphere and Sports Experts. (5) Other Ontario Agencies include: Legal Aid Ontario, Ontario Lottery and Gaming Corporation, Liquor Control Board of Ontario and Hydro One Networks.(6) Due to the confidentiality under the tenant lease, the term is not disclosed.
• Long-term leases with high quality investment grade tenants• Tenants well diversified by industry

STABILITY, GROWTH & SECURITY through DISCIPLINE, DIVERSIFICATION & SCALE 13
18 Years of Stable Occupancy
Consistently strong and stable occupancy in excess of 97% since 1997
STABILITY, GROWTH & SECURITY through DISCIPLINE, DIVERSIFICATION & SCALE
98.0% 98.0%
99.0% 99.0% 99.0% 99.0% 99.0%99.4% 99.3%
99.6% 99.7%
98.9% 99.0% 98.9%99.1%
98.7%
98.1%(1)
97.8%
90.0%
91.0%
92.0%
93.0%
94.0%
95.0%
96.0%
97.0%
98.0%
99.0%
100.0%
1997 1998 1999 2000 2001 2002 2003 2004 2005 2006 2007 2008 2009 2010 2011 2012 2013 2014
(1) Due to acquisition of Primaris.

STABILITY, GROWTH & SECURITY through DISCIPLINE, DIVERSIFICATION & SCALE 14
Limited Lease Rollover(1)(2)
Low-risk rollover schedule Well diversified by property and geography
Average remaining lease term of 10.1 years, one of the longest in the industry
14
* For the balance of the year.
(1) Includes the Trusts’ interests in equity accounted investments.(2) Excludes residential properties.
1%
5%5%
8%9%
6%
2015* 2016 2017 2018 2019 2020
Office Primaris (Retail) H&R Retail ECHO (Retail) Industrial
STABILITY, GROWTH & SECURITY through DISCIPLINE, DIVERSIFICATION & SCALE 15
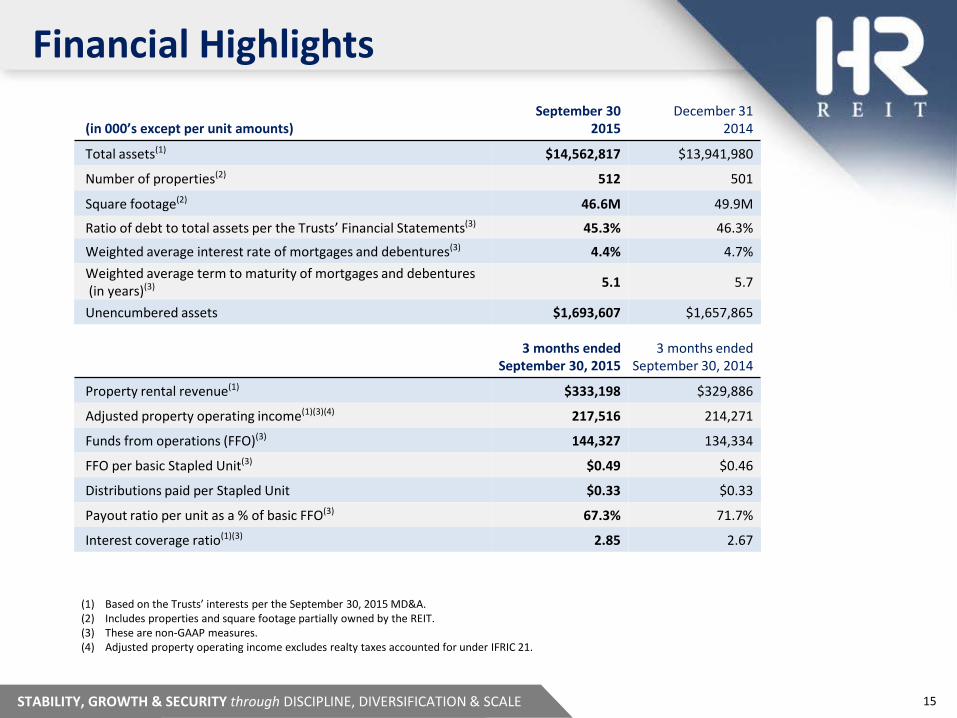
Financial Highlights
(in 000’s except per unit amounts)September 30
2015December 31
2014
Total assets(1) $14,562,817 $13,941,980
Number of properties(2) 512 501
Square footage(2) 46.6M 49.9M
Ratio of debt to total assets per the Trusts’ Financial Statements(3) 45.3% 46.3%
Weighted average interest rate of mortgages and debentures(3) 4.4% 4.7%Weighted average term to maturity of mortgages and debentures(in years)(3) 5.1 5.7
Unencumbered assets $1,693,607 $1,657,865
3 months ended September 30, 2015
3 months ended September 30, 2014
Property rental revenue(1) $333,198 $329,886
Adjusted property operating income(1)(3)(4) 217,516 214,271
Funds from operations (FFO)(3) 144,327 134,334
FFO per basic Stapled Unit(3) $0.49 $0.46
Distributions paid per Stapled Unit $0.33 $0.33
Payout ratio per unit as a % of basic FFO(3) 67.3% 71.7%
Interest coverage ratio(1)(3) 2.85 2.67
(1) Based on the Trusts’ interests per the September 30, 2015 MD&A.(2) Includes properties and square footage partially owned by the REIT.(3) These are non-GAAP measures.(4) Adjusted property operating income excludes realty taxes accounted for under IFRIC 21.
STABILITY, GROWTH & SECURITY through DISCIPLINE, DIVERSIFICATION & SCALE 16
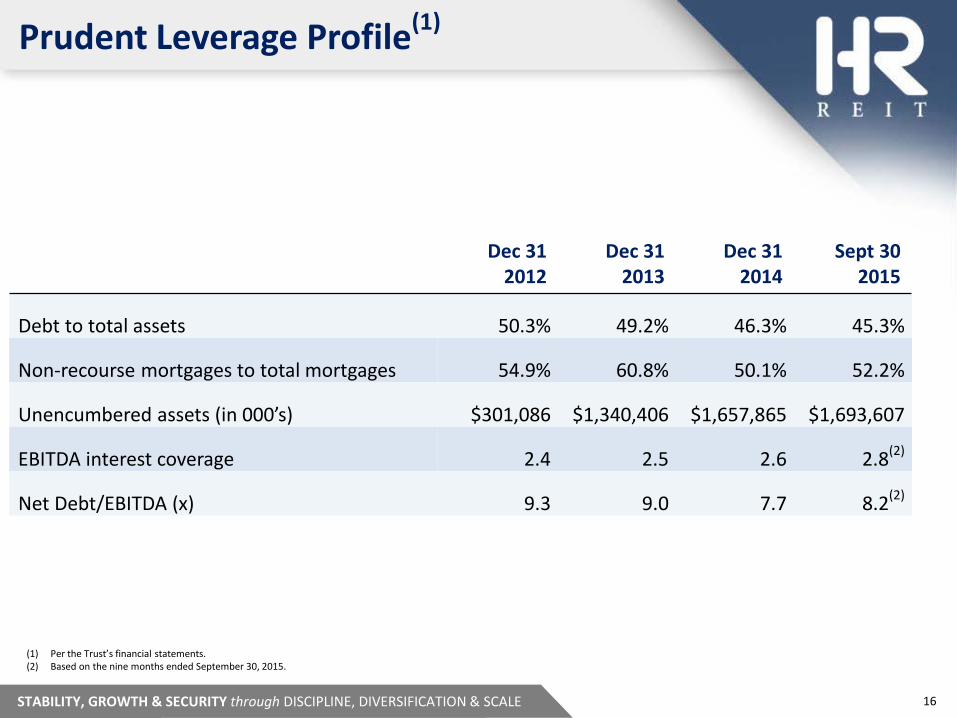
Prudent Leverage Profile(1)
Dec 31 2012
Dec 31 2013
Dec 31 2014
Sept 30 2015
Debt to total assets 50.3% 49.2% 46.3% 45.3%
Non-recourse mortgages to total mortgages 54.9% 60.8% 50.1% 52.2%
Unencumbered assets (in 000’s) $301,086 $1,340,406 $1,657,865 $1,693,607
EBITDA interest coverage 2.4 2.5 2.6 2.8(2)
Net Debt/EBITDA (x) 9.3 9.0 7.7 8.2(2)
(1) Per the Trust’s financial statements.(2) Based on the nine months ended September 30, 2015.

STABILITY, GROWTH & SECURITY through DISCIPLINE, DIVERSIFICATION & SCALE 17
Well Staggered Debt Maturities
Weighted Average Interest Rate* - 4.4% Weighted Average Term* - 5.1 years
$45.6$174.9 $169.9 $168.1 $161.9 $152.7 $131.0
$67.3 $49.2 $42.5$74.0
$317.7$406.4
$118.8
$325.1 $400.8
$648.7
$592.5
$304.8
$45.1
$75.0
$74.4
$99.7
$235.0
$180.0 $175.0 $566.3$200.0
$175.0
$0
$100
$200
$300
$400
$500
$600
$700
$800
$900
$1,000
**2015 2016 2017 2018 2019 2020 2021 2022 2023 2024
Mortgage Amortization Mortgage Principal on Maturity Convertible Debentures Senior Unsecured Debentures
% of Total 5.3% 11.2% 11.3% 13.9% 10.3% 12.4% 9.9%11.7% 5.3% 1.3%
* Per the Trust’s interests** For the balance of the year
$Millions
$354.6
$747.6 $751.3
$927.6
$687.0
$828.2$779.7
$659.8
$354.0
$87.6

STABILITY, GROWTH & SECURITY through DISCIPLINE, DIVERSIFICATION & SCALE 18
Significant Liquidity
Liquidity ($ millions) Limit Used Available
Cash and cash equivalents $ - $ - $34.4
Operating facility #1 300.0 144.8 155.2
Operating facility #2 200.0 0.4 199.6
Operating facility #3 9.8 9.8 -
Operating facility #4 15.0 9.2 5.8
Total $395.0
STABILITY, GROWTH & SECURITY through DISCIPLINE, DIVERSIFICATION & SCALE 19
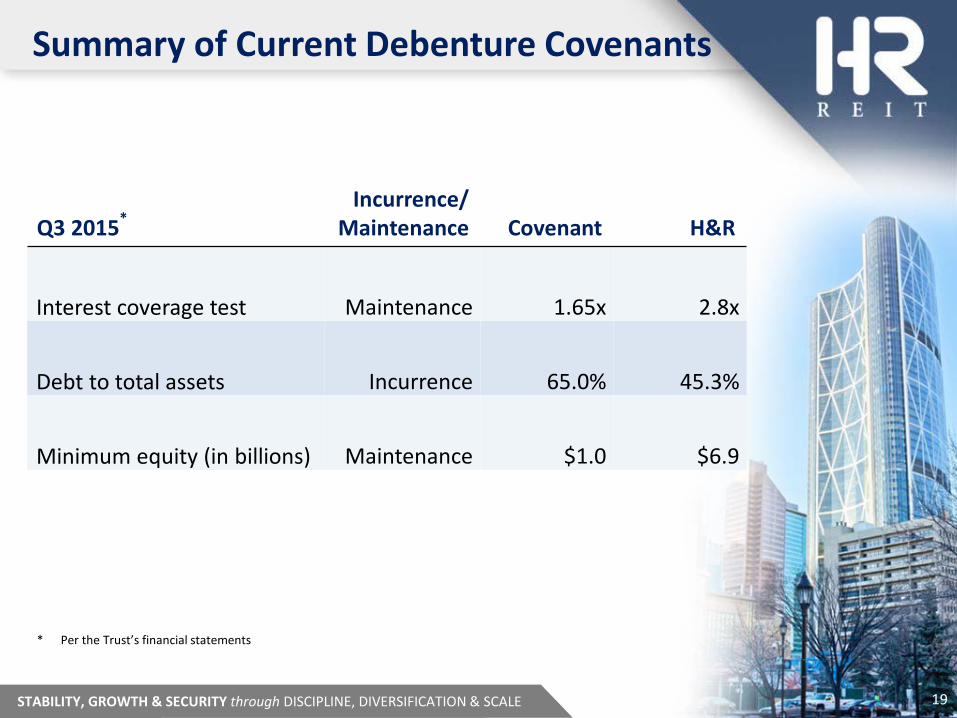
Summary of Current Debenture Covenants
Q3 2015*Incurrence/
Maintenance Covenant H&R
Interest coverage test Maintenance 1.65x 2.8x
Debt to total assets Incurrence 65.0% 45.3%
Minimum equity (in billions) Maintenance $1.0 $6.9
19
* Per the Trust’s financial statements
STABILITY, GROWTH & SECURITY through DISCIPLINE, DIVERSIFICATION & SCALE 20
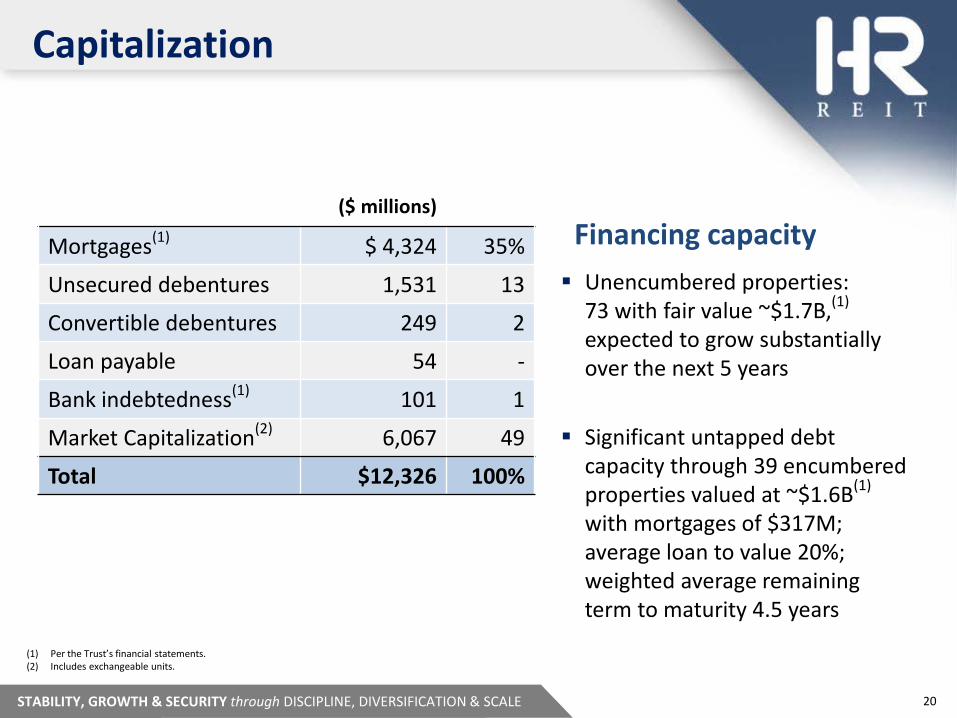
Capitalization
($ millions)
Mortgages(1) $ 4,324 35%
Unsecured debentures 1,531 13
Convertible debentures 249 2
Loan payable 54 -
Bank indebtedness(1) 101 1
Market Capitalization(2) 6,067 49
Total $12,326 100%
Unencumbered properties: 73 with fair value ~$1.7B,(1)
expected to grow substantially over the next 5 years
Significant untapped debt capacity through 39 encumbered properties valued at ~$1.6B(1)
with mortgages of $317M; average loan to value 20%; weighted average remaining term to maturity 4.5 years
Financing capacity
(1) Per the Trust’s financial statements.(2) Includes exchangeable units.

STABILITY, GROWTH & SECURITY through DISCIPLINE, DIVERSIFICATION & SCALE 21
Illustrative Repositioning of Balance Sheet
($ Millions)(1)September 30,
2015 Illustrative
Repositioning
Mortgages $4,324 ($1,336) $2,988
Unsecured debentures 1,531 1,155 2,686
Convertible debentures 249 - 249
Loan payable 54 (54) -
Bank indebtedness 101 235 336
Market capitalization* 6,067 - 6,067
$12,326 - $12,326
Unencumbered assets 1,694 3,496 5,190
Unencumbered assets/ unsecured debt 1.1x 1.9x
The table below assumes that all mortgages maturing to the end of 2020 are replaced with unsecured debt and the Series H Senior Debentures that matured in October 2015 were repaid using bank indebtedness
21
* Includes exchangeable units.
(1) Per the Trust’s financial statements.
STABILITY, GROWTH & SECURITY through DISCIPLINE, DIVERSIFICATION & SCALE 22
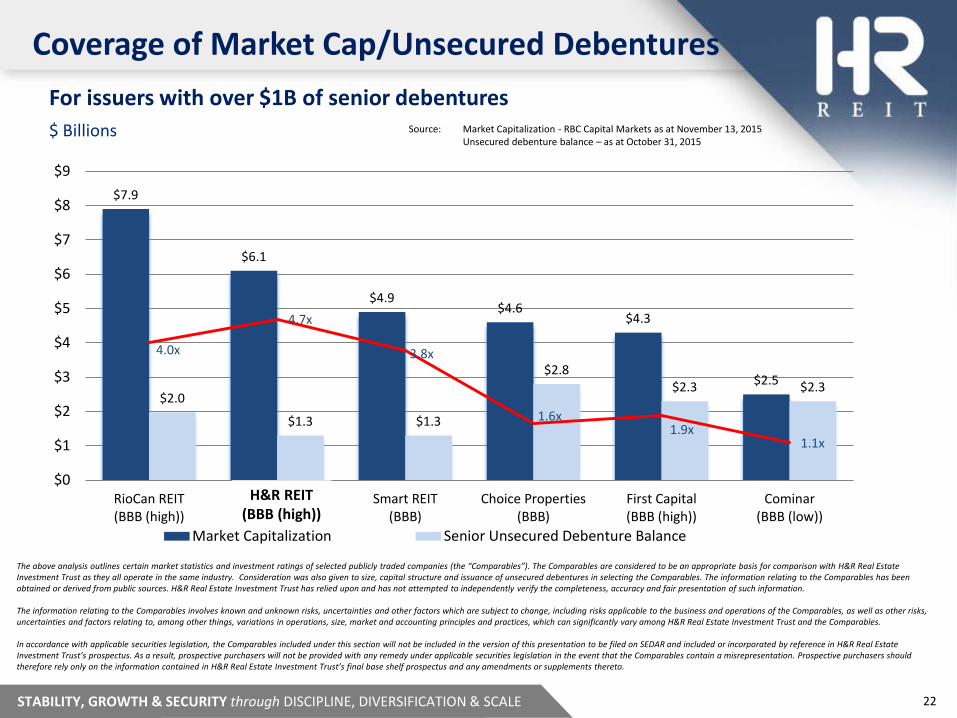
Coverage of Market Cap/Unsecured Debentures
$7.9
$6.1
$4.9$4.6
$4.3
$2.5$2.0
$1.3 $1.3
$2.8$2.3 $2.3
4.0x
4.7x
3.8x
1.6x1.9x
1.1x
$0
$1
$2
$3
$4
$5
$6
$7
$8
$9
RioCan REIT(BBB (high))
H&R REIT (BBB(high))
Smart REIT(BBB)
Choice Properties(BBB)
First Capital(BBB (high))
Cominar(BBB (low))
Market Capitalization Senior Unsecured Debenture Balance
$ Billions Source: Market Capitalization - RBC Capital Markets as at November 13, 2015Unsecured debenture balance – as at October 31, 2015
For issuers with over $1B of senior debentures
The above analysis outlines certain market statistics and investment ratings of selected publicly traded companies (the “Comparables”). The Comparables are considered to be an appropriate basis for comparison with H&R Real Estate Investment Trust as they all operate in the same industry. Consideration was also given to size, capital structure and issuance of unsecured debentures in selecting the Comparables. The information relating to the Comparables has been obtained or derived from public sources. H&R Real Estate Investment Trust has relied upon and has not attempted to independently verify the completeness, accuracy and fair presentation of such information.
The information relating to the Comparables involves known and unknown risks, uncertainties and other factors which are subject to change, including risks applicable to the business and operations of the Comparables, as well as other risks, uncertainties and factors relating to, among other things, variations in operations, size, market and accounting principles and practices, which can significantly vary among H&R Real Estate Investment Trust and the Comparables.
In accordance with applicable securities legislation, the Comparables included under this section will not be included in the version of this presentation to be filed on SEDAR and included or incorporated by reference in H&R Real Estate Investment Trust’s prospectus. As a result, prospective purchasers will not be provided with any remedy under applicable securities legislation in the event that the Comparables contain a misrepresentation. Prospective purchasers should therefore rely only on the information contained in H&R Real Estate Investment Trust’s final base shelf prospectus and any amendments or supplements thereto.
H&R REIT(BBB (high))
STABILITY, GROWTH & SECURITY through DISCIPLINE, DIVERSIFICATION & SCALE 23
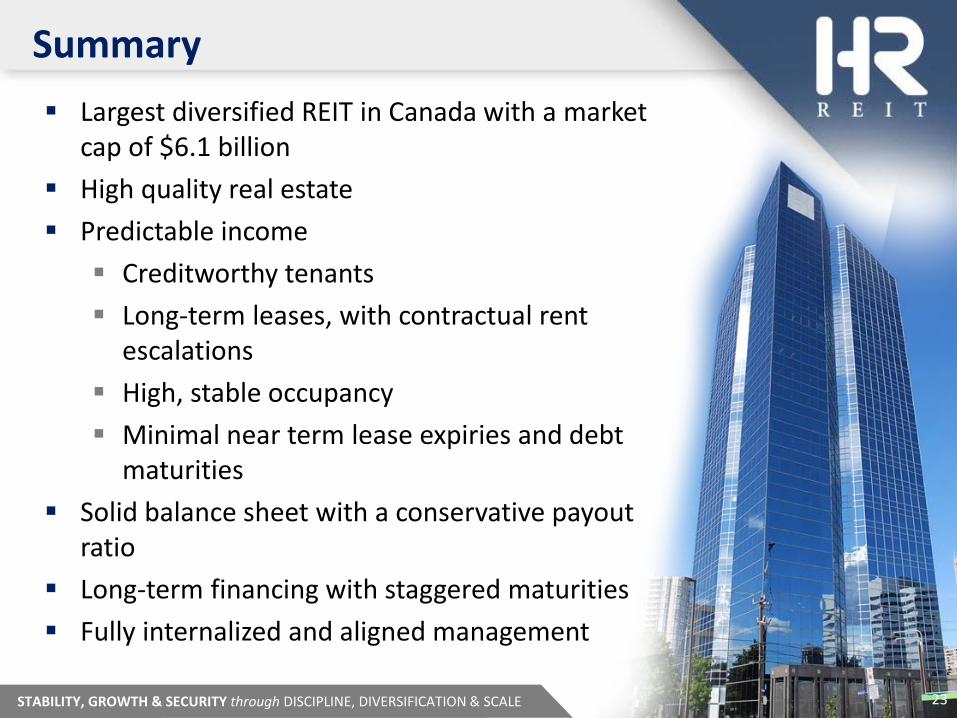
Summary Largest diversified REIT in Canada with a market
cap of $6.1 billion High quality real estate Predictable income Creditworthy tenants Long-term leases, with contractual rent
escalations High, stable occupancy Minimal near term lease expiries and debt
maturities Solid balance sheet with a conservative payout
ratio Long-term financing with staggered maturities Fully internalized and aligned management
23