
Thresholds of secondary organic aerosol formation by ozonolysis of monoterpenes measured in a...
17
Thresholds of secondary organic aerosol formation by ozonolysis of monoterpenes measured in a laminar flow aerosol reactor Franc - ois Bernard, Ivan Fedioun, Fabrice Peyroux, Alain Quilgars, Ve ´ ronique Da ¨ ele, Abdelwahid Mellouki n Institut de Combustion, Ae´rothermique, Re ´activite´ et Environnement, Centre National de la Recherche Scientifique (ICARE-CNRS), 1C, Avenue de la Recherche Scientifique, 45071 Orle´ans cedex 02, France article info Article history: Received 8 April 2011 Received in revised form 20 August 2011 Accepted 22 August 2011 Available online 31 August 2011 Keywords: Flow reactor Monoterpenes Ozonolysis Secondary organic aerosol Nucleation threshold abstract The reactions of ozone with a series of monoterpenes (a-pinene, sabinene, limonene and myrcene) were investigated in a novel flow reactor dedicated to the investigation of secondary organic aerosol (SOA) formation. Rate constants for the gas phase reactions and nucleation thresholds were determined at T 296 K, P 764 Torr under dry conditions (dew point r 33 1C) and in absence of OH radicals scavenger and seed particles. Comparison with the literature as well as data from a simulation chamber showed good agreement. The experiments also show that the novel flow reactor improves the accuracy in evaluating the nucleation thresholds during the ozonolysis of monoterpenes and show that aerosol flow reactor is a useful tool to study the SOA nucleation step. Given as an upper limit, the nucleation thresholds obtained are (in molecule cm 3 /ppb): a-pinene, 3.9 10 10 /1.56; sabinene, 6.2 10 9 /0.26; limonene, 1.1 10 10 /0.43 and myrcene 2.1 10 10 /0.83. & 2011 Elsevier Ltd. All rights reserved. 1. Introduction Terrestrial vegetation has the largest contribution to Volatile Organic Compounds (VOCs) burden in the atmosphere (Guenther et al., 1995), isoprene and monoterpenes being the dominant on a global scale. Once emitted, these VOCs undergo chemical oxidation through reactions with ozone, OH and NO 3 radicals to form secondary products impacting strongly the tropospheric chemical composition (Atkinson & Arey, 2003). Oxidation reactions may lead to the formation of compounds with low volatility, able to nucleate and/or partition onto the pre-existing particles or even form new particles (Seinfeld & Pandis, 1998). Over the past decade, numerous field campaigns have shown the occurrence of nucleation events at different locations all over the world (Kulmala et al., 2004a). Through these observations, different nucleation mechanisms have been proposed such as, ion-induced nucleation (Enghoff & Svensmark, 2008), homogeneous nucleation for iodine containing compounds (O’Dowd et al., 2002a; Burkholder et al., 2004) and organic compounds (Hoppel et al., 2001; Burkholder et al., 2007), heterogeneous nucleation involving organic vapours able to condense on pre-existing particles (O’Dowd et al., 2002b; Kulmala et al., 2004b) and binary H 2 O/H 2 SO 4 (Kulmala & Laaksonen, 1990) and ternary H 2 O/H 2 SO 4 /NH 3 (Kulmala et al., 2000) nucleation. Secondary organic aerosols (SOA) formation has been observed in the atmosphere in forest, rural and urban areas (Kavouras & Stephanou, 2002; Volkamer et al., 2006; Zhang et al., 2007; Slowik et al., 2010) and intensively studied in laboratory over the recent years. Specific investigations have been conducted in order to identify the VOC precursors of SOA and the influence of environmental parameters (temperature, relative humidity, light and the presence of other gases Contents lists available at SciVerse ScienceDirect journal homepage: www.elsevier.com/locate/jaerosci Journal of Aerosol Science 0021-8502/$ - see front matter & 2011 Elsevier Ltd. All rights reserved. doi:10.1016/j.jaerosci.2011.08.005 n Corresponding author. Tel.: þ33 238257612; fax: þ33 238696004. E-mail address: [email protected] (A. Mellouki). Journal of Aerosol Science 43 (2012) 14–30
-
Upload
francois-bernard -
Category
Documents
-
view
213 -
download
0
Transcript of Thresholds of secondary organic aerosol formation by ozonolysis of monoterpenes measured in a...

Contents lists available at SciVerse ScienceDirect
Journal of Aerosol Science
Journal of Aerosol Science 43 (2012) 14–30
0021-85
doi:10.1
n Corr
E-m
journal homepage: www.elsevier.com/locate/jaerosci
Thresholds of secondary organic aerosol formation by ozonolysisof monoterpenes measured in a laminar flow aerosol reactor
Franc-ois Bernard, Ivan Fedioun, Fabrice Peyroux, Alain Quilgars,Veronique Daele, Abdelwahid Mellouki n
Institut de Combustion, Aerothermique, Reactivite et Environnement, Centre National de la Recherche Scientifique (ICARE-CNRS),
1C, Avenue de la Recherche Scientifique, 45071 Orleans cedex 02, France
a r t i c l e i n f o
Article history:
Received 8 April 2011
Received in revised form
20 August 2011
Accepted 22 August 2011Available online 31 August 2011
Keywords:
Flow reactor
Monoterpenes
Ozonolysis
Secondary organic aerosol
Nucleation threshold
02/$ - see front matter & 2011 Elsevier Ltd. A
016/j.jaerosci.2011.08.005
esponding author. Tel.: þ33 238257612; fax
ail address: [email protected] (A. Mell
a b s t r a c t
The reactions of ozone with a series of monoterpenes (a-pinene, sabinene, limonene
and myrcene) were investigated in a novel flow reactor dedicated to the investigation of
secondary organic aerosol (SOA) formation. Rate constants for the gas phase reactions
and nucleation thresholds were determined at T�296 K, P�764 Torr under dry
conditions (dew point r�33 1C) and in absence of OH radicals scavenger and seed
particles. Comparison with the literature as well as data from a simulation chamber
showed good agreement. The experiments also show that the novel flow reactor
improves the accuracy in evaluating the nucleation thresholds during the ozonolysis
of monoterpenes and show that aerosol flow reactor is a useful tool to study the SOA
nucleation step. Given as an upper limit, the nucleation thresholds obtained are
(in molecule cm�3/ppb): a-pinene, 3.9�1010/1.56; sabinene, 6.2�109/0.26; limonene,
1.1�1010/0.43 and myrcene 2.1�1010/0.83.
& 2011 Elsevier Ltd. All rights reserved.
1. Introduction
Terrestrial vegetation has the largest contribution to Volatile Organic Compounds (VOCs) burden in the atmosphere(Guenther et al., 1995), isoprene and monoterpenes being the dominant on a global scale. Once emitted, these VOCsundergo chemical oxidation through reactions with ozone, OH and NO3 radicals to form secondary products impactingstrongly the tropospheric chemical composition (Atkinson & Arey, 2003). Oxidation reactions may lead to the formation ofcompounds with low volatility, able to nucleate and/or partition onto the pre-existing particles or even form new particles(Seinfeld & Pandis, 1998). Over the past decade, numerous field campaigns have shown the occurrence of nucleationevents at different locations all over the world (Kulmala et al., 2004a). Through these observations, different nucleationmechanisms have been proposed such as, ion-induced nucleation (Enghoff & Svensmark, 2008), homogeneous nucleationfor iodine containing compounds (O’Dowd et al., 2002a; Burkholder et al., 2004) and organic compounds (Hoppel et al.,2001; Burkholder et al., 2007), heterogeneous nucleation involving organic vapours able to condense on pre-existingparticles (O’Dowd et al., 2002b; Kulmala et al., 2004b) and binary H2O/H2SO4 (Kulmala & Laaksonen, 1990) and ternaryH2O/H2SO4/NH3 (Kulmala et al., 2000) nucleation.
Secondary organic aerosols (SOA) formation has been observed in the atmosphere in forest, rural and urban areas(Kavouras & Stephanou, 2002; Volkamer et al., 2006; Zhang et al., 2007; Slowik et al., 2010) and intensively studied inlaboratory over the recent years. Specific investigations have been conducted in order to identify the VOC precursors ofSOA and the influence of environmental parameters (temperature, relative humidity, light and the presence of other gases
ll rights reserved.
: þ33 238696004.
ouki).

F. Bernard et al. / Journal of Aerosol Science 43 (2012) 14–30 15
and seed particles) on their SOA mass formation potential (Hoffmann et al., 1997; Griffin et al., 1999; Cocker et al.,2001a,b; Presto et al., 2005a,b; Kroll et al., 2006; Lee et al., 2006a,b; Pathak et al., 2007). However, these formationprocesses remain an unresolved issue and more information about chemical and physical properties of nucleation agentsare still required (Kanakidou et al., 2005; Hallquist et al., 2009).
In particular, it has been shown that SOA are formed via nucleation of atmospheric organic vapours on pre-existingparticles observed in various rural environments where the organic fraction represents the major part of the observednano-particles (Kulmala et al., 2004a). Therefore, various laboratory studies have been performed to investigate thenucleation potential of different nucleation precursor reactions using mainly atmospheric simulation chamber undercontrolled conditions (i.e. temperature, pressure, composition of gas mixture, irradiation). However, from the beginning ofthe reaction, aerosols undergo condensation and coagulation limiting the observation time in the first steps of theoxidation processes. In this regard, the flow reactor is a useful tool to accurately observe nucleation processes. It allowsstudying SOA formation potential from the first steps of the reaction. One of the advantages of this device is to generateparticles under continuous flow with similar physical and chemical properties under fixed and controlled conditions(initial concentrations, temperature, pressure and reaction time). The other advantage is the possibility to conductinvestigations at low reaction time enabling to have access to the early stages of the reaction. Beyond the nucleationprocess studies, aerosol flow tube allows to obtain data on the aerosol mass yield under different conditions (temperature,relative humidity, in the presence of OH radical or/and Criegee scavengers) (Bonn & Moortgat, 2002, 2003; Jonsson et al.,2006, 2008a,b; von Hessberg et al., 2009). Although flow reactor studies permit an in-depth comprehension of SOAformation processes, only few studies have reported the SOA formation potential of new particles as function of theconsumed concentration of relevant atmospheric species (Koch et al., 2000; Berndt et al., 2003; Lee & Kamens, 2005).
The aim of the present work was to evaluate the SOA formation potential (in terms of number) from the ozonolysis offour monoterpenes: a-pinene, sabinene, limonene and myrcene and at later stage, to obtain the nucleation thresholds. Thisstudy did not aim at reproducing the previous results but rather to determine if the formation potential of aerosolsthrough the reaction the ozone (and OH radicals) is higher than expected and thus lowering the nucleation thresholdsthrough the use of a suitable set-up. A newly developed laminar flow reactor was used to conduct this study. In order tovalidate the flow reactor experimental conditions, pseudo-first order kinetic studies have been performed and the derivedresults have been compared to those obtained using atmospheric simulation chamber and to literature data. Therefore, therate constants of the reactions of ozone with a-pinene, sabinene, myrcene and limonene obtained in this work werefurther used to estimate the SOA number formation potentials. The results from this work are compared with those fromthe literature when available.
2. Experimental methods
2.1. Flow reactor
SOA formation studies have been performed under controlled conditions using an aerosol flow tube recently developedat ICARE-CNRS laboratory. The experimental set-up is a combination of a laminar aerosol flow tube and a condensationparticle counter (Fig. 1). The reactor consists of a vertical 100 cm long with 10 cm i.d. made of Pyrex glass and a movableinjector (110 cm length and 1.2 cm i.d.). Reaction time (or residence time, t) was varied by adjusting the position of themovable mixing plunger relatively to the sampling point at the bottom of the reactor. The organic compounds were dilutedin N2 (typically a�0.05%) and stored in a Pyrex reservoir. Synthetic air and N2 (the bath gases) passed through HEPA filters(TSI) in order to eliminate the particles which could be present in the gas cylinders. Ozone is generated through thephotolysis of oxygen using a Hg Pen-ray lamp. Mixing ratio of ozone in the reactor is controlled by varying the ratio ofsynthetic air and N2 flows. It is introduced into the flow reactor, separately from the monoterpenes, through the movableinjector. Its concentration is measured at the outlet of the reactor by an ozone monitor based on UV absorption (model49C, Thermo Environmental Instruments Inc or Horiba APOA-360). Experiments have been performed at T�296 K,P�764 Torr and with a dew point r�33 1C (relative humidity r1%). Relative humidity and temperature arecontinuously recorded at the outlet of the reactor using a combined probe (Vaisala HMT330 series transmitters). Inaddition, temperature is also measured inside the mixing plunger using a thermocouple.
In the reactor, the ‘‘ozone flow’’ (2.8 L min�1) through the injector is composed of synthetic air and ozone diluted in N2.The ‘‘external flow’’ (1.8 L min�1) is a mixture of synthetic air/monoterpenes. Both flows are rapidly mixed under aturbulent regime, within less than 1 s, in a ‘‘mixing zone’’ positioned at the end of the movable injector. All flows aremonitored with calibrated mass flow controllers (Celerity and Bronkhorst models). The pressure in the reactor is controlledby pressure transducer/controller and a regulation valve (Bronkhorst high-Tech, 5 L min�1) enabling to adjust the outlettotal flow in order to obtain the desired pressure in the reactor. Gas or aerosol samples are collected through an orificecentred at the bottom of the reactor with an inner diameter of 2.3 cm. In the configuration of this experimental set-up,the residence time from the sampling orifice to the instrument (condensation particle counter and ozone analyser)was estimated to be o1 s. The outlet flow is pumped by a dry vacuum pump (Boc Edwards, XDS 10). All the parameters(P, T, ozone concentration and flows) are acquired using a computer equipped with National Instrument A/D Boards andcan be viewed in real time using Labview software (Laview 7.1).

Vaccumpump
Pressure controller
Movable injector
Mixing zone
Hg Pen-ray
lamp
Temperatureandrelative
humidity probe
Regulationvalve
EXTE
RN
AL
FLO
W
O3 / air
N2
HEPA Filter
HEPA FilterAir
Monoterpene/N2
Ozone monitor
Condensation Particle Counter
OZO
NE
FLO
Wx = L
x = 0
Fig. 1. Schematic of the flow tube reactor set-up configured for particle number measurement.
F. Bernard et al. / Journal of Aerosol Science 43 (2012) 14–3016
One of the most critical aspects of this type of experimental systems is the residence time in the reactor. In the study,it has been determined experimentally by nebulising a NaCl solution through the flow reactor using an atomizer (TSIModel 3076) with a reservoir containing an aqueous solution of sodium chloride (0.1 g cm�3). Two condensation particlecounters (CPC, TSI 3022A and TSI 3010) were used to measure the residence time. The first CPC was sampling from theentrance to the inlet of the mixing plunger while the second one was sampling from the outlet of the flow reactor. Theresidence time has been characterised for every 10 cm from 30 to 80 cm. Experiments have been repeated for differentpositions of the movable injector. The residence time results from the average of at least six measurements (theuncertainty is one-standard deviation on the average, 1s). The distance between the movable inlet and the outlet of thereactor was varied and the residence time of NaCl particles in the flow tube versus the distance of the mixing zone tosampling point was recorded. The flow velocity, Ve¼(1.5770.04) cm s�1, was determined from the linear fit to the data(Fig. 2). Additional run was made by inversing the position of both CPCs in order to observe the influence of sampling flowon the measured residence time. In our experimental conditions, the total flow rate was 4.6 L min�1. This leads to aReynolds number Re�107 (52000) and a Knudsen number of 6.6�10–7, corresponding to a laminar and viscous flow.
These experimental derived values have been compared to numerical simulations using the FLUENT 6.3.26 software.The numerical procedure and the results are described hereafter. Fig. 3 shows the computational domain and the mesh forthe 2D, axi-symmetric flow simulations. In the sampling region, the mesh is unstructured except near the solid walls

Position of the movable injector (cm)0
Res
iden
ce ti
me
(s)
0
10
20
30
40
50
60
70
Experimental fitCPC 3022A (inlet) - CPC 3010 (outlet)CPC 3010 (inlet) - CPC 3022A (outlet) Computed fitNumerical simulation (Fluent)
10 20 30 40 50 60 70 80 90 100
Fig. 2. Experimental and computed residence times of NaCl particles as function of the position of the movable mixing plunger in the flow reactor.
The inserted graph shows an example of particle counting for one experiment for 80 cm length. Black dot represents one measurement at 40 cm where
the position of CPCs Model 3022A and Model 3010 was inversed.
sampling orifice
(to the flow analyzer)x = 0L = 20, 40, 60 and 80 cm x = -2.2 cm
excess co-flow
x = L
reactor axis
Pyrex wall reactor
exit of themixing plunger
(injectionof reactants)
end of the sampling cone
Fig. 3. Sketch of the mesh and the computational domain for the simulation of the flow reactor.
F. Bernard et al. / Journal of Aerosol Science 43 (2012) 14–30 17
where rectangular cells are used to properly describe the boundary layer. In the reactor, the mesh is fully structured.Calculations have been made using the 2nd order upwind implicit pressure-based solver, and the SIMPLE algorithm forpressure–velocity coupling. The fluid is assumed to be air with constant properties (density, r¼1.225 kg m�3; viscosity,m¼1.7894�10�5 kg m�1 s�1). Boundary conditions are:
�
no-slip on solid walls; � imposed mass flow rate Qm¼9.392�10–5 kg s�1 at the inlet at x¼L (Qv¼4.6 L min�1); � constant pressure Pco-flow¼Pref¼760 Torr at the excess co-flow outlet; � constant pressure Psampl at the sampling orifice.The pressure difference DP¼Pco-flow�Psampl is adjusted to achieve the desired sampling mass flow rate. Simulationshave been performed for four positions of the movable injector L¼20, 40, 60 and 80 cm, covering the working distance forthe position of the mixing plunger, and for three different sampling flow rates Qsampl¼0.40, 0.55 and 1.25 L min�1. Theseflow rates have been chosen as representative from sampling flow of instruments which are usually connected at theoutlet of the reactor: Scanning Mobility Particle Sizer (0.4 L min�1), CPC Model 3010 (0.55 L min�1) and CPC Model 3022A(1.25 L min�1). The pressure differences obtained (in Torr) are 9.23�10–3, 1.40�10–2 and 4.66�10–2 corresponding tothe requested different flow rates 0.40, 0.55 and 1.25 L min�1, respectively. The pressure difference values do not dependon the positions of the movable injector and the sampling flow rate does not influence significantly the inlet total pressure.In each case, convergence to residuals below 10–8 is obtained after about 450 iterations, and the mass balance accuracy isbelow 10–12 kg s�1.
In the reactor, velocity profiles set-up about 3 diameters downstream from the inlet. They exhibit the parabolic shape ofa laminar pipe flow. In order to compute the residence time of reactants, fluid particles are released numerically from cellcentres at the inlet (20 cells), and are followed in a lagrangian description until they leave the computational domain,either captured by the sampling cone or ejected with the co-flow. Particles are numbered from #1 in the near-wall cell to#20 in the near-axis cell. Fig. 4 shows the flow streamlines, i.e. the particles trajectories in the case L¼40 cm,Qsampl¼0.55 L min�1. Three particles enter the sampling cone, #18, #19 and #20. In the case Qsampl¼0.40 L min�1, onlytwo are captured (#19 and #20), and at the higher sampling mass flow rate Qsampl¼1.25 L min�1, five particles arecaptured from #16 to #20. The residence time of a particle is obtained from the hodograph x(t), as the time at which the

Fig. 4. Example of Lagrangian trajectories of numerical particles released from the inlet with Qsampl¼0.55 L min�1 where particles #18, #19 and #20 are
captured by the sampling cone. For Qsampl¼1.25 L min�1, particles #16–#20 are captured by the sampling cone.
0 5 10 15 20 25 30 35 40 45Residence time (s)
-10
0
10
20
30
40
Pos
ition
x o
n th
e tu
be a
xis
(cm
)
19 20 21 22 23 24 25 26 27 28 29 30
-3
-2
-1
0
1
2
Fig. 5. Example of hodograph x(t) of particles released from the inlet with L¼40 cm and Qsampl¼0.55 L min�1.
F. Bernard et al. / Journal of Aerosol Science 43 (2012) 14–3018
particle crosses the line x¼�2.2 cm which corresponds to the end of the sampling cone. Fig. 5 gives an illustration of themethod. The residence time of particles should theoretically increase linearly with L, if the sampling flow rate is smallcompared to the overall flow rate. However, sampling flow rates are not negligible and induce an acceleration of the flowat the sampling cone inlet. Hence, for a given position L, the residence time decreases slightly with increasing the samplingflow rate, and the effect is more important for small L. Increasing the sampling flow rate from 0.4 to 1.25 L min�1
decreases the residence time of 1.5% (resp. 1.6%) for L¼80 cm, and of 5.5% (resp. 5.8%) for L¼20 cm, for particle #19 (resp.#20). They are almost the same for the two considered particles and vary linearly with the tube length. Fig. 2 comparesthese numerical data with the experimentally measured residence times and shows that the agreement is quite good withthe average velocity recovered within 18% of accuracy.
During the SOA formation studies, experiments have been performed with a CPC Model 3022A in inlet high flow mode(1.25 L min�1) leading to a diameter of the sampling flow estimated to 3.7 cm. According to numerical simulations, this impliesthat more particles are captured by the sampling cone. However, as shown in Fig. 2, changing the sampling flow at the outlet ofthe reactor agreed with numerical simulation and does not change the residence time obtained from a statistical point of view.
2.2. ICARE simulation chamber
The ICARE chamber has been described in detail elsewhere (Bernard et al., 2010), therefore, only a brief description isgiven here. Experiments were carried out in a 7300 L Teflon chamber in the dark at 30372 K and 760 Torr total pressure ofdry purified air (o–29 1C of dew point). Rapid mixing of reactants was ensured within 1–2 min using a set of two fansmade of Teflon fitted into the chamber. After each experiment, the chamber was flushed with purified air for at least 12 h.Reactants were introduced into the chamber via liquid phase by streaming purified air (gently heated when necessary).Temperature and relative humidity data were recorded by a combined sensor (T870-Series T800, Dostmann electronic).Reactants were monitored by in situ Fourier Transform Infra Red absorption spectroscopy (Nicolet 5700 Magna FT-IRspectrometer) coupled to a white-type mirror system resulting of an optical path of about 148 m.

F. Bernard et al. / Journal of Aerosol Science 43 (2012) 14–30 19
3. Chemicals
The origin of the chemicals and their stated purity levels are: a-pinene (Sigma Aldrich, 98%), sabinene (Interchim,499%), limonene (Fluka, Z98%), myrcene (Sigma Aldrich, 90%), cyclohexene (Fluka, 99%), cis-cyclooctene (Aldrich, 95%)and cyclohexane (Riedel-de Haen, 99.5%). For the flow tube experiments, chemicals were further purified by repeated cyclefreeze in liquid nitrogen, pump and thaw cycles and fractional distillation before use.
4. Results and discussion
4.1. Kinetic measurements
The experiments have been conducted using both systems: flow reactor and simulation chamber. Initial conditions ofexperiments have been designed in accordance with the quantification limit of analytical instruments, leading to theexpected rate constants with a good accuracy. One does not need to use ambient concentrations to determine reactionsrate constants.
4.1.1. Flow reactor
Experiments were performed under pseudo-first order conditions where the organic reactant was introduced in higherexcess compared to that of ozone. During the kinetics experiments, ozone concentration was measured at various reactiontimes by adjusting the position of the movable mixing plunger, in the presence and in the absence of the reactant. Thedecrease of ozone concentration can be expressed as � ln[O3]t¼k0MEAS� t� ln[O3]0 where [O3]t and [O3]0, represent theconcentrations of ozone (in molecule cm�3), at a reaction time t and the initial one, respectively, k0MEAS, the pseudo-firstorder rate constant of the ozonolysis reaction with the studied monoterpene (in s�1), and t, the reaction time (in second).For each concentration of monoterpene, � ln[O3]t¼ f(t) is constructed from which the pseudo-first order k0MEAS rateconstant is extracted by applying a least square analysis on the experimental data sets and corrected for radial diffusion(see below). The procedure is repeated for different concentrations of the compound. A plot of k0 ¼ f([monoterpenes]0)permits to obtain the bimolecular rate constant of the ozonolysis reaction, k. The quoted error on the rate constant wasderived from the uncertainty on the slope corresponding to one-standard deviation (1s).
The following initial conditions were used to derive the rate constants for the reactions of ozone with the fourinvestigated monoterpenes: [monoterpene]0¼(2.1�29.7)�1013 molecule cm�3; [O3]0¼(1.4�5.5)�1012 molecule cm�3
and reaction time t¼17–48 s. Ozone loss on the wall of the reactor in absence of the organic compounds has beenestimated before each kinetic run. In our experimental conditions where [monoterpene]0b[O3]0, the rate constants werederived from the loss of ozone. This latter may be subject to diffusion processes, its diffusion coefficient in air (DO3-Air) wasestimated to be 0.164 cm2 s�1 at 293 K (Massman, 1998). The plug-flow approximation where
k0MEAS � R2
DO3-Airr1:5 ð1Þ
with k0MEAS is the measured pseudo-first order rate constant (in s�1), R is the inner radius of the flow tube (in cm) and DO3-Air
is the diffusion coefficient of ozone in air (in cm2 s�1) can be applied to experimental system for k0MEASr9.84�10–3 s�1 andthe concentration of ozone is homogeneous all over the flow section. For k0MEAS49.84�10–3 s�1, the measured pseudo-firstorder rate constant has been corrected for radial diffusion using the formula: k0 ¼k0MEAS� (1þDeff� k0MEAS/Ve2) withDO3-Air,eff ¼DO3-AirþR2 � Ve2=ð48� DO3-AirÞwhere DO3-Air,eff is the effective diffusion coefficient, preferred to DO3-Air (Kaufman,1984). The correction factor applied to k0MEAS for the studied monoterpenes ranged from 1.03 to 1.14. Furthermore, the valueof k0 �DO3-Air/Ve2 (where k0MEAS, DO3-Air and Ve are defined above) is found to be 2.9�10�3
51 (k0MEAS, max¼4.4�10–2 s�1)which indicates that axial diffusion can be considered negligible in our conditions and therefore, k0MEAS has not beencorrected.
The pseudo-first order rate constant of ozone loss is kW(O3)¼(874)�10–4 s�1 in the absence of any organic reactant.In the presence of the organic compounds, k0 has been measured to be (0.4–5.0)�10–2 s�1. � ln[O3]t¼ f(t) relationshipwas then applied to the experimental data sets for the series of the studied monoterpenes to derive the kinetic parameters.Fig. 6 displays an example of the ozone concentration at different reaction times in the presence of differentconcentrations of sabinene. Fig. 7 shows the plot of the pseudo-first order rate constant k0 as function of sabineneconcentration. Pseudo-first order fits for studied monoterpenes show a good linearity (0.74or2o0.96). Bimolecular rateconstants, k, were deduced from the least-square analysis on the experimental data and the quoted error corresponds toone-standard deviation on the slope (1s). The use of large excess of monoterpenes over ozone ([Monoterpene]0/D[O3]ranged from 22 to 97) enables to make secondary ozone reactions such as with OH radicals and HO2 negligible(O3 reactions with OH and HO2 not being extremely fast compared to that with monoterpenes (k(O3þOH)¼7.3�10–14 andk(O3þHO2)¼2.0�10–15 cm3 molecule�1 s�1, (Atkinson et al., 2004))). Unsaturated intermediates (such as 4-methylenehex-5-enal and 3-isopropenyl-6-oxo-heptanal originating respectively from myrcene and limonene oxidations) could also react withozone but will not affect the ozone concentrations in our conditions because of their low concentrations and low reaction rateconstants compared to those with monoterpenes (k4-methylenehex-5-enal¼(1.4670.12)�10–17 cm3 molecule�1 s�1 (Baker et al.,2004) and k3-isopropenyl-6-oxo-heptanal¼(8.372.2)�10–18 cm3 molecule�1 s�1 (Calogirou et al., 1999)).

10
1
2
3
4
5
0.90.80.70.6
0.5
0.4
[O3]
t (/1
012 m
olec
ule
cm-3
)
= 9.8 × 1013 = 1.3 × 1014 = 2.5 × 1014 = 2.6 × 10¹⁴
[Sabinene]0(in molecule cm-3)
t (s)15 20 25 30 35 40 45 50 55
Fig. 6. Reaction of ozone with sabinene: example of pseudo-first order plots obtained at 29771 K.
0[sabinene] (/1013 molecule cm-3)
0.000
0.005
0.010
0.015
0.020
0.025
Pse
udo-
first
ord
er ra
te c
onst
ant,
k' (s
-1)
5 10 15 20 25 30 35
Fig. 7. Reaction of ozone with sabinene: pseudo-first order constant as function of concentration of sabinene from the ozonolysis reaction at 29771 K
and 76273 Torr.
F. Bernard et al. / Journal of Aerosol Science 43 (2012) 14–3020
Experimental conditions and measured values of k0 are listed in Table 1. The rate constants (in cm3 molecule�1 s�1)obtained for the investigated reactions at 29772 K and 76574 Torr are the following:
a-pineneþO3-Products k¼ ð1:170:1Þ � 10216
sabineneþO3-Products k¼ ð6:272:1Þ � 10217
limoneneþO3-Products k¼ ð3:870:3Þ � 10216
myrceneþO3-Products k¼ ð5:771:6Þ � 10216
4.1.2. Simulation chamber experiments
Measurements of the rate constants were conducted using the well established relative rate method. Kinetic datawere derived by monitoring the loss of monoterpenes relative to one reference compound. The references used in this

Table 1Initial conditions and results obtained from the absolute measurements of rate constants for a series of monoterpenes by reaction with ozone at
29772 K and 76574 Torr.
Monoterpenes Structure T (K) [monoterpene]/1013 (molecule cm�3) (k071s)/10–2 (s�1)
a-Pinene 295 5.80 0.4370.13
295 8.29 0.8770.12
296 10.3 0.7570.26
296 13.3 1.2770.07
296 15.4 1.3770.20
296 21.4 2.6470.24
296 24.8 2.1270.18
296 29.7 3.2870.17
k¼(1.170.1)�10–16 cm3 molecule�1 s�1
Sabinene 296 9.73 0.5370.13
298 12.8 0.9570.24
296 24.3 1.8570.56
297 24.6 1.1470.26
297 25.5 1.6970.37
k¼(6.272.1)�10–17 cm3 molecule�1 s�1
Limonene 296 2.10 0.6570.14
298 3.28 0.8570.17
296 3.31 1.1570.27
297 4.04 1.3170.14
297 5.00 1.8170.21
299 6.35 1.7870.23
297 6.99 2.5370.33
297 10.1 3.7370.63
k¼(3.870.3)�10–16 cm3 molecule�1 s�1
Myrcene 298 2.68 1.3370.15
297 3.58 1.1570.34
298 4.46 2.8270.52
296 6.45 2.3070.31
298 8.68 4.9771.28
k¼(5.771.6)�10–16 cm3 molecule�1 s�1
F. Bernard et al. / Journal of Aerosol Science 43 (2012) 14–30 21
study are cis-cyclooctene, kO3¼3.86�10–16 cm3 molecule�1 s�1 (Cusick & Atkinson, 2005) and cyclohexene, kO3
¼
8.1�10–17 cm3 molecule�1 s�1 (Calvert et al., 2000). These references are suitable for FT-IR analysis where a weakoverlapping of IR bands is observed between the studied compounds and references. The loss rates of monoterpene andreference compounds in absence of ozone, kL(monoterpene) and kL(ref), (in s�1), respectively, were measured before eachrun and the values obtained have been considered in the treatment of the data. Providing that the monoterpenes and thereferences were lost only by reaction with ozone and by dilution, and then it can be shown that
ln½monoterpene�0½monoterpene�t
� ��kLðmonoterpeneÞ � t¼
kmonoterpene
krefln½ref �0½ref �t
� ��kLðrefÞ � t
� �ð2Þ
where [monoterpene]0, [monoterpene]t, [ref]0 and [ref]t are the concentrations of the monoterpene and reference at timest0 and t, and kmonoterpene and kref are the rate constants for reactions of monoterpene and the reference with O3. Plots of(ln([monoterpene]0/[monoterpene]t)�kL(monoterpene)� t) versus (ln([ref]0/[ref]t)�kL(ref)� t) pass through the originand have a slope of kmonoterpene/kref.. Reactants and reference compounds were monitored by FT-IR spectroscopy usingabsorption features over the following wavenumber ranges (cm�1): a-pinene, 756–809; sabinene, 840–900; limonene865–917/820–772; myrcene 870–930, cis-cyclooctene, 730–782 and cyclohexene, 1106–1172/841–952. The experimentswere conducted in the presence of excess of cyclohexane to avoid secondary reactions with OH radicals which could beformed through the ozonolysis reactions (Paulson et al., 1999; Aschmann et al., 2002). The experiments have beenrepeated to enable us to derive averaged ratios for kmonoterpene/kRef.. One to two runs have been performed for the sameinitial conditions. The quoted uncertainties on the obtained rate constants originate from the uncertainties associated tothe value of the slope (one-standard deviation, 1s).
Initial concentrations (in molecule cm�3) were: [monoterpenes]0¼(1.9�3.6)�1013, [references]0¼(1.8�5.2)�1013 and[cyclohexane]0�6.3�1015. Preliminary checks consisted in observing temporal behaviour of monoterpenes and referencecompound in the presence of an excess of cyclohexane for a duration of 45 min to 2 h which enables to determine their loss ratesin absence of ozone. These loss rates were found to be in the range (1.0–2.0)�10–5 s�1 for terpenes and (1.0–1.8)�10–5 s�1 forthe reference compounds. After addition of ozone to the gas mixtures, the loss of the reactants due to the ozonolysis was found toaccount for Z96% for terpenes and Z97% for the references. The durations of the runs in presence of all reactants were between10 and 30 min depending on the reactivity of terpenes leading to a total consumption ranging from 14% to 99% for terpenes andreference compounds. Linear square analysis of the data gives the results shown in Table 2. The measured rate constants ratios
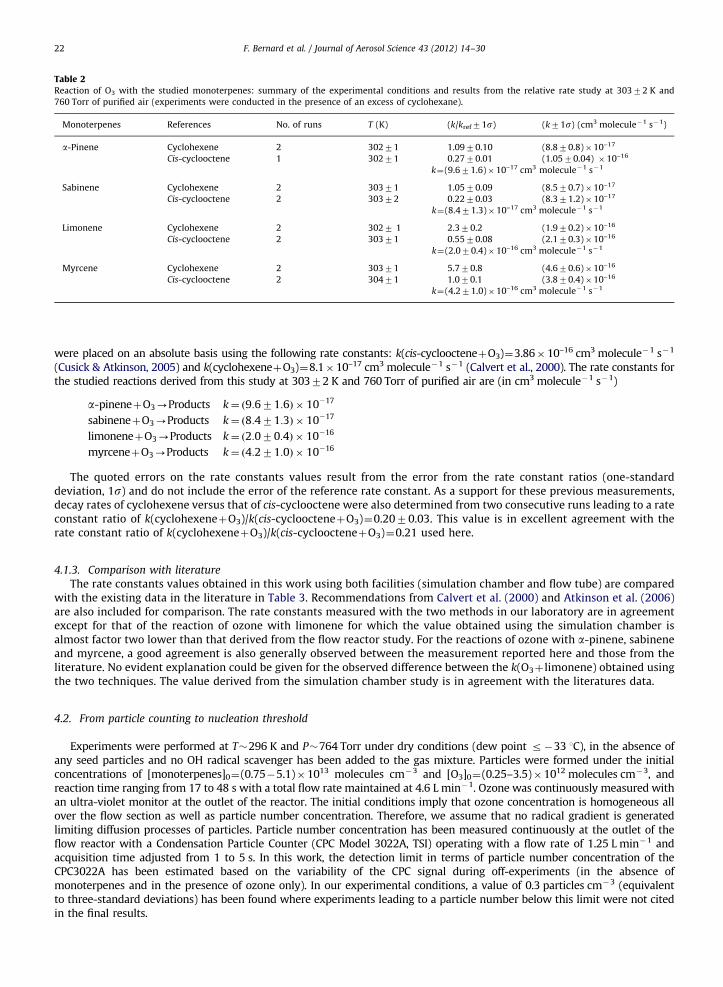
Table 2Reaction of O3 with the studied monoterpenes: summary of the experimental conditions and results from the relative rate study at 30372 K and
760 Torr of purified air (experiments were conducted in the presence of an excess of cyclohexane).
Monoterpenes References No. of runs T (K) (k/kref71s) (k71s) (cm3 molecule�1 s�1)
a-Pinene Cyclohexene 2 30271 1.0970.10 (8.870.8)�10–17
Cis-cyclooctene 1 30271 0.2770.01 (1.0570.04) �10–16
k¼(9.671.6)�10–17 cm3 molecule�1 s�1
Sabinene Cyclohexene 2 30371 1.0570.09 (8.570.7)�10–17
Cis-cyclooctene 2 30372 0.2270.03 (8.371.2)�10–17
k¼(8.471.3)�10–17 cm3 molecule�1 s�1
Limonene Cyclohexene 2 3027 1 2.370.2 (1.970.2)�10–16
Cis-cyclooctene 2 30371 0.5570.08 (2.170.3)�10–16
k¼(2.070.4)�10–16 cm3 molecule�1 s�1
Myrcene Cyclohexene 2 30371 5.770.8 (4.670.6)�10–16
Cis-cyclooctene 2 30471 1.070.1 (3.870.4)�10–16
k¼(4.271.0)�10–16 cm3 molecule�1 s�1
F. Bernard et al. / Journal of Aerosol Science 43 (2012) 14–3022
were placed on an absolute basis using the following rate constants: k(cis-cycloocteneþO3)¼3.86�10–16 cm3 molecule�1 s�1
(Cusick & Atkinson, 2005) and k(cyclohexeneþO3)¼8.1�10–17 cm3 molecule�1 s�1 (Calvert et al., 2000). The rate constants forthe studied reactions derived from this study at 30372 K and 760 Torr of purified air are (in cm3 molecule�1 s�1)
a-pineneþO3-Products k¼ ð9:671:6Þ � 10217
sabineneþO3-Products k¼ ð8:471:3Þ � 10217
limoneneþO3-Products k¼ ð2:070:4Þ � 10216
myrceneþO3-Products k¼ ð4:271:0Þ � 10216
The quoted errors on the rate constants values result from the error from the rate constant ratios (one-standarddeviation, 1s) and do not include the error of the reference rate constant. As a support for these previous measurements,decay rates of cyclohexene versus that of cis-cyclooctene were also determined from two consecutive runs leading to a rateconstant ratio of k(cyclohexeneþO3)/k(cis-cycloocteneþO3)¼0.2070.03. This value is in excellent agreement with therate constant ratio of k(cyclohexeneþO3)/k(cis-cycloocteneþO3)¼0.21 used here.
4.1.3. Comparison with literature
The rate constants values obtained in this work using both facilities (simulation chamber and flow tube) are comparedwith the existing data in the literature in Table 3. Recommendations from Calvert et al. (2000) and Atkinson et al. (2006)are also included for comparison. The rate constants measured with the two methods in our laboratory are in agreementexcept for that of the reaction of ozone with limonene for which the value obtained using the simulation chamber isalmost factor two lower than that derived from the flow reactor study. For the reactions of ozone with a-pinene, sabineneand myrcene, a good agreement is also generally observed between the measurement reported here and those from theliterature. No evident explanation could be given for the observed difference between the k(O3þ limonene) obtained usingthe two techniques. The value derived from the simulation chamber study is in agreement with the literatures data.
4.2. From particle counting to nucleation threshold
Experiments were performed at T�296 K and P�764 Torr under dry conditions (dew point r�33 1C), in the absence ofany seed particles and no OH radical scavenger has been added to the gas mixture. Particles were formed under the initialconcentrations of [monoterpenes]0¼(0.75�5.1)�1013 molecules cm�3 and [O3]0¼(0.25–3.5)�1012 molecules cm�3, andreaction time ranging from 17 to 48 s with a total flow rate maintained at 4.6 L min�1. Ozone was continuously measured withan ultra-violet monitor at the outlet of the reactor. The initial conditions imply that ozone concentration is homogeneous allover the flow section as well as particle number concentration. Therefore, we assume that no radical gradient is generatedlimiting diffusion processes of particles. Particle number concentration has been measured continuously at the outlet of theflow reactor with a Condensation Particle Counter (CPC Model 3022A, TSI) operating with a flow rate of 1.25 L min�1 andacquisition time adjusted from 1 to 5 s. In this work, the detection limit in terms of particle number concentration of theCPC3022A has been estimated based on the variability of the CPC signal during off-experiments (in the absence ofmonoterpenes and in the presence of ozone only). In our experimental conditions, a value of 0.3 particles cm�3 (equivalentto three-standard deviations) has been found where experiments leading to a particle number below this limit were not citedin the final results.

Table 3Rate constants values for the reactions of ozone with the investigated monoterpenes: the data obtained in this
work and those from the literature.
Reaction Rate constant,
k (cm3 molecule�1 s�1)
T (K) Reference
a-PineneþO3 (1171)�10–17 29671 This work (flow reactor)
(9.671.6)�10–17 30271 This work (smog chamber)
(9.070.6)�10–17 303.270.1 Tillmann et al. (2009)
(9.071.8)�10–17 298 Atkinson et al. (2006)
(10.670.9)�10–17 295 Witter et al. (2002)
(8.4170.74)�10–17 298 Khamaganov & Hites (2001)
(9.7171.06)�10–17 29672 Atkinson et al. (1990a)
(8.2071.24)�10–17 29772 Nolting et al. (1988)
(8.471.9)�10–17 29672 Atkinson et al. (1982)
14.5�10–17 29571 Grimsrud et al. (1975)
(3373)�10–17 298 Japar et al. (1974)
16�10–17 294 Ripperton et al. (1972)
SabineneþO3 (6.272.1)�10–17 29771 This work (flow reactor)
(8.471.3)�10–17 30372 This work (smog chamber)
(8.372.5)�10–17 298 Calvert et al. (2000)
(8.6170.94)�10–17 29672 Atkinson et al. (1990a)
(8.0770.83)�10–17 29672 Atkinson et al. (1990b)
LimoneneþO3 (3.870.3)�10–16 29771 This work (flow reactor)
(2.070.4)�10–16 30472 This work (smog chamber)
(2.570.3)�10–16 295 Witter et al. (2002)
(2.1370.15)�10–16 298 Khamaganov & Hites (2001)
(2.070.5)�10–16 298 Calvert et al. (2000)
(2.0170.07)�10–16 29672 Shu & Atkinson (1994)
3.5�10–16 297.3 Zhang et al. (1994)
(2.0970.22)�10–16 29671 Atkinson et al. (1990a)
6.49�10–16 29571 Grimsrud et al. (1975)
MyrceneþO3 (5.771.6)�10–16 29871 This work (flow reactor)
(4.271.0)�10–16 30472 This work (smog chamber)
(3:85þ0:29�0:27 )�10–16 298 Daekyun et al. (2011)
(4.870.6)�10–16 295 Witter et al. (2002)
(4.8570.78)�10–16 29672 Atkinson et al. (1990a)
12.5�10–16 29571 Grimsrud et al. (1975)
F. Bernard et al. / Journal of Aerosol Science 43 (2012) 14–30 23
The concentration of consumed monoterpenes (D[monoterpene]) has been calculated according to the decrease of theozone concentration based on the kinetic pseudo-first order conditions ([monoterpene]0b[O3]0) as follows:
D½O3� ¼ ½O3�0 � ð1�expð�k½monoterpene�0tÞÞ ð3Þ
It is known that the reaction of ozone with the investigated monoterpenes leads to the formation of OH radicals(33–80%) (Atkinson et al., 1992, 2006; Aschmann et al., 2002). This had to be taken account since OH is highly reactivetowards these monoterpenes and hence may contribute to their total loss in our experimental system (k(mono-terpenesþOH)¼(0.5�2)�10�10 cm3 molecule�1 s�1 (Atkinson et al., 1986, 1990b, 2006). Consequently, the calculationof the consumed concentration of monoterpene, D[monoterpene], has been calculated according to
D½monoterpene� ¼ ð1þaOHÞ �D½O3� ð4Þ
with aOH, the OH formation yield from the ozonolysis reaction. Estimation of standard deviation of the consumedconcentration of monoterpene, sD[monoterpene], for a time t is established as follows:
sD½monoterpene� ¼D½O3� � ðsaOHþð1þaOHÞ � ðAþBÞÞ ð5Þ
with A¼s½O3 �0
½O3�0and B¼
k½monoterpene�0t
expðk½monoterpene�0tÞ�1
� ��
sk
kþ
s½monoterpene�0
½monoterpene�0þst
t
� �
where saOH, s½O3 �0, sk and st are the corresponding standard deviations for the OH formation yield, the initial concentration
of ozone, the rate constant of ozonolysis reaction and the reaction time, respectively. The rate constants of the ozonolysisreactions used to estimate the consumed fraction of monoterpene are based on the present study and OH radical formationyields are for a-pinene (0.8070.12) taken from IUPAC recommendation (Atkinson et al., 2006), and for sabinene(0.3370.05), limonene (0.6770.10) and myrcene (0.6370.09), values are extracted from Aschmann et al. (2002).Therefore, aerosols observed in our system could be due to the reaction of monoterpenes with both ozone and OH radicals.We have estimated that the contribution of OH radicals to the consumption rate of monoterpene represents up to 44% fora-pinene, 25% for sabinene, 40% for limonene and 39% for myrcene.

F. Bernard et al. / Journal of Aerosol Science 43 (2012) 14–3024
Fig. 8 shows a typical number concentration of particles formed over the course of a-pinene ozonolysis reaction. Ozoneis introduced first in the flow reactor and the particle background monitored for at least 3 h. The particle number increasesfew minutes after the addition of the monoterpene to the gas mixture in the reactor. This delay might be attributed to atreatment of the inner reactor surface. Once this ‘‘treatment’’ completed, the number concentration of particles (N) reachesa levelling-off maintained constant during the course of the run. Between two runs, the flow reactor is cleaned up byflowing ozone until a residual concentration of particles of 10�2–10�1 particles cm�3. For any wall loss, particles shoulddisplace for a distance of 3.15 cm from the sampling orifice for a sampling flow of 1.25 L min�1. With a diffusioncoefficient of particles, D¼5.5�10–4 cm2 s�1 for a particle size distribution centred at 10 nm (Baron & Willeke, 2001) andthe maximum residence time t¼48 s, particles will displace only for a distance of 0.23 cm which makes diffusion lossesnot significant in our system. In addition, coagulation process affects particle number concentration over a period of timeaccording to Nt¼N0/(1þN0Kt), with N0 and Nt the number of particles (cm�3) at times t0 and t, respectively, and K, thecoagulation coefficient (cm�3 s�1). Using K¼9�10�10 cm3 s�1 for a size particle diameter centred at 10 nm (Seinfeld &Pandis, 1998), under the most unfavourable conditions (t¼48 s and N0¼106 particles cm�3), it has been found that 4% ofthe particle number concentration will be lost by coagulation process. It should be mentioned that as lower the residencetime and aerosol production are, coagulation process becomes negligible. No surface artefact for ozone reaction has beenobserved in contrary to the reactions of OH and NO3 radicals (Bonn & Moortgat, 2002).
Number concentrations of SOA have been measured for different initial concentrations of the reactants and consumedconcentrations of monoterpenes. The number of particles formed for an experiment results from the average obtainedfrom 5 to 15 min time interval associated with a one-standard deviation (1s) as given in Table 4 for a-pinene. Reacted
13:03Time [hh:mm]
0
50
100
150
200
250
300
350
SO
A nu
mbe
r con
cent
ratio
n, N
(cm
-3)
1.0
1.2
1.4
1.6
1.8
[O3]
(/10
12 m
olec
ule
cm-3
)
Introduction of α-pinene Stop introductionof α-pinene
Ozone
NSOA
13:20 13:36 13:53 14:10 14:26 14:43
Fig. 8. Example of SOA formation produced from the ozonolysis of a-pinene ([a-pinene]0¼9.8�1012 molecules cm�3) in the flow reactor (t¼17 s).
Table 4Initial conditions and the results obtained on particle formation studied from the ozonolysis of a-pinene (no OH scavenger has been used) at 29671 K
and 764.470.3 Torr.
Exp. T (K) [a-pinene]0/1013
(molecule cm�3)
[O3]0/1012
(molecule cm�3)
t (s) D[a-pinene]/1010
(molecule cm�3)
N71s (cm�3)
1 295.0 5.11 3.30 4872 124.7743.1 (9.9170.28)�105
2 295.2 5.10 3.41 3672 99.1736.5 (2.0070.06)�106
3 295.4 5.08 3.46 1771 49.6719.0 (4.1070.03)�105
4 296.1 2.83 1.20 4872 26.579.6 (2.8070.08)�105
5 296.0 2.83 1.22 2671 15.075.6 (8.9670.12)�104
6 297.1 1.52 1.75 2671 11.774.3 (1.6870.08)�103
7 294.5 1.71 1.14 2671 8.673.2 (6.7170.23)�103
8 295.7 1.70 1.30 2371 8.673.2 (6.3570.19)�103
9 297.1 1.50 1.85 1771 8.073.2 (2.9570.04)�103
10 296.9 0.98 1.87 2371 7.272.7 (2.4670.04)�103
11 297.3 1.12 1.02 2671 5.171.9 13973
12 295.0 0.98 1.73 1771 5.072.0 168710
13 294.9 0.99 1.48 2071 5.072.0 471
14 295.5 0.98 1.61 1771 4.671.8 3472
15 297.2 1.03 1.03 2171 3.871.5 13.570.5
16 297.5 1.03 1.00 2071 3.571.4 0.3470.10
17 295.9 0.98 1.00 1971 3.271.3 5.1470.62
18 296.3 0.98 0.99 1871 3.071.2 4.9470.52
19 296.9 0.98 0.99 1871 3.071.2 0.3270.18
20 295.7 0.98 0.91 1971 2.971.1 4274
21 295.7 0.98 0.97 1771 2.871.1 0.7670.48

F. Bernard et al. / Journal of Aerosol Science 43 (2012) 14–30 25
monoterpenes concentration ranged from 4.5�109 to 1.25�1012 molecule cm�3. Uncertainty (one-standard deviation,1s) on the consumed fraction of monoterpene on the whole studied monoterpenes ranges from 22% to 61%. The profiles ofparticle formation efficiency versus the consumed concentration of monoterpenes (log N¼ f(D[monoterpene])) aredisplayed in Figs. 9–12. The data obtained are compared with the existing ones reported in the literature (Koch et al.,2000; Berndt et al., 2003; Bonn & Moortgat, 2003; Lee & Kamens, 2005). The results of Koch et al. (2000) were based onsimulation chamber experiment whereas those of Berndt et al. (2003) and Lee & Kamens (2005) were performed in flowreactor. The obtained data from Koch et al. (2000) have been compared using the same rate constants and OH formationyields as those used in this work.
For all studied monoterpenes, number concentration of particles formed increases exponentially for higher consumedfraction of monoterpenes and reaches a plateau around 105–106 particles cm�3. Fig. 13 compares the SOA formationefficiency for a low consumption of monoterpene. It appears that among the studied monoterpenes, sabinene andlimonene have higher SOA formation potential than myrcene and a-pinene.
Nucleation thresholds for each monoterpene were extracted from the plot of log N¼ f(D[monoterpene]), summarised inTable 5 and compared to the existing data from literature. The nucleation thresholds are given as upper limits obtainedfrom the lowest amount of consumed monoterpene for which particles were observed, where its absolute error is added.As given in Table 5, the nucleation threshold values obtained here were found to be lower than the previously reported
0
1x10⁷
SO
A nu
mbe
r con
cent
ratio
n, N
(cm
-3)
This workKoch et al. (2000)Berndt et al. (2003)Berndt et al. (2003)Berndt et al. (2003)Lee and Kamens (2005)
1x10⁶
1x10⁵
1x10⁴
1x10³
1x10²
1x101
1x100
1x10⁻¹
1x10⁻²
Δ [α-pinene] (/1010 molecule cm-3)30 60 90 120 150 180 210 240
01x10-21x10-11x1001x1011x1021x1031x1041x105
2 4 6 8 10 12 14
Fig. 9. Particle number formed as function of consumed concentration of a-pinene through reaction with ozone. Dotted line corresponds to the
nucleation threshold calculated by Bonn & Moortgat (2003) (5.0�1010 molecule cm�3). Results of Berndt et al. (2003) are obtained for initial
concentration of a-pinene (in molecule cm�3): (�) 1.75�1013, (&) 4.4�1012 and (,) 1.2�1012. The inserted graph shows a zoom from low
concentrations of consumed a-pinene.
01x10-1
1x100
1x101
1x10²
1x10³
1x10⁴
1x10⁵
1x10⁶
SO
A nu
mbe
r con
cent
ratio
n, N
(cm
-3)
This workKoch et al. (2000)
Δ [sabinene] (/109 molecule cm-3)20 40 60 80 100 120 140
Fig. 10. Particle number formed as function of consumed concentration of sabinene through reaction with ozone. Dotted line corresponds to the
nucleation threshold calculated by Bonn & Moortgat (2003) (3.1�1010 molecule cm�3).

01x10-1
1x100
1x101
1x10²
1x10³
1x10⁴
1x10⁵
1x10⁶
SO
A nu
mbe
r con
cent
ratio
n, N
(cm
-3)
This workKoch et al. (2000)
Δ [limonene] (/1010 molecule cm-3)5 10 15 20 25 30 35
Fig. 11. Particle number formed as function of consumed concentration of limonene through reaction with ozone. Dotted line corresponds to the
nucleation threshold calculated by Bonn & Moortgat (2003) (4.5�1010 molecule cm�3).
01x100
1x101
1x10²
1x10³
1x10⁴
1x10⁵
1x10⁶
1x10⁷
SO
A nu
mbe
r con
cent
ratio
n, N
(cm
-3)
Δ [myrcene] (/1010 molecule cm-3)
20 40 60 80 100 120
Fig. 12. Particle number formed as function of consumed concentration of myrcene through reaction with ozone.
F. Bernard et al. / Journal of Aerosol Science 43 (2012) 14–3026
ones for a-pinene, sabinene and limonene (Koch et al., 2000; Berndt et al., 2003; Bonn & Moortgat, 2003; Lee & Kamens,2005). However, it has to be underlined that the interpretation of the data has to take into account the type of CPCs used indifferent studies since they may have serious variations in the cutoff sizes. This work provides the first result for SOAcounting from the ozonolysis of myrcene.
The value given by Bonn & Moortgat (2003) originated from the FACSIMILE model based on the experimental results ofKoch et al. (2000). Koch et al. (2000) used a CPC Model 3010 (D50¼10.9 nm, (Heim et al., 2004)) whereas Berndt et al.(2003) used a UCPC Model 3025 (D50¼3.1 nm, (Kesten et al., 1991)). The determination of the 50% counting efficiencydiameter (D50) was performed using NaCl aerosol. Indeed, the use of ultrafine particle counter such as 3025 model whichhas a particle cutoff diameter (D50) of 3.1 nm would allow to measure higher number of particles and for lower consumedconcentration of monoterpenes (and the nucleation threshold). As shown in Table 5, a disagreement is observed between

0
SO
A nu
mbe
r con
cent
ratio
n, N
(cm
-3)
10-1
100
101
102
103
104
105
sabinenelimonenemyrcene
Δ [monoterpenes] (/1010 molecule cm-3)1 2 3 4 5 6 7 8 9 10
�-pinene
Fig. 13. Comparison of SOA number concentration formed in the flow reactor from the ozonolysis of a-pinene, sabinene, limonene and myrcene for low
concentration of consumed monoterpene.
Table 5Values of nucleation thresholds obtained from SOA particle counting from the ozonolysis of
monoterpenes performed in the flow reactor. Experiments were performed at T�296 K,
P�764 Torr and dew point r�33 1C, in the absence of any OH scavenger and seed particles.
Monoterpenes Structure SOA nucleation thresholds
(molecule cm�3 (ppb))
Reference
a-Pinene 3.9�1010 (1.56) This work
5.0�1010 (2.1)a Bonn & Moortgat (2003)a
3�1011 (12) Berndt et al. (2003)
Sabinene 6.2�109 (0.26) This work
3.1�1010 (1.3)a Bonn & Moortgat (2003)a
Limonene 1.1�1010 (0.43) This work
4.5�1010 (1.9)a Bonn & Moortgat (2003)a
Myrcene 2.1�1010 (0.83) This work
a Calculated value from the experiments of Koch et al. (2000); Koch et al. (2000) used a CPC
Model 3010 (D50¼10.9 nm, (Heim et al., 2004)); Berndt et al. (2003) used a UCPC Model 3025
(D50¼3.1 nm, (Kesten et al., 1991)). In the present work, we used a CPC Model 3022A
(D50¼8.3 nm, (Ankilov et al., 2002)).
F. Bernard et al. / Journal of Aerosol Science 43 (2012) 14–30 27
the nucleation thresholds reported in different studies. This could be at least partly due the use of different models of CPCs(the one used in this work is Model 3022A, D50¼8.3 nm, (Ankilov et al., 2002)). Another explanation for this disagreementis the use of wide range of alkene/ozone ratios. Indeed, this work has been performed under initial ratio of 5–43 whereasthe previous studies were: Koch et al. (2000), 0.02–1.23; Berndt et al. (2003), 0.3–1.6; Lee & Kamens (2005), 12–51. Asreported, alkene/ozone ratio could control the concentration of transient species (i.e. RO2) which are known to play a keyrole in particle formation (Wolf et al., 2009).

F. Bernard et al. / Journal of Aerosol Science 43 (2012) 14–3028
The nucleation threshold from the ozonolysis of a-pinene obtained in this work (3.9�1010 molecule cm�3) is in goodagreement with that reported by Bonn & Moortgat (2003) (5.0�1010 molecule cm�3). Berndt et al. (2003) proposed3�1011 molecule cm�3 as a conversion limit. It should be noted that Berndt et al. (2003) observed a dependence of theconversion limit with the initial concentration of a-pinene which remains unexplained so far. Moreover, the results fromthis work show the same trend as from the data reported by Bonn & Moortgat (2003) for a-pinene, sabinene and limonene.Therefore, monoterpenes can be ordered with respect to their SOA formation potential: a-pineneomyrceneo limoneneosabinene. The results from this study indicate that sabinene is the most important SOA precursor among the studiedmonoterpenes in contrast to a-pinene which is the least efficient in the SOA formation.
5. Conclusions
The aerosol flow reactor recently developed in our laboratory combined to a CPC has been used to study the secondaryorganic aerosol formation during the ozonolysis of a series of monoterpenes (a-pinene, sabinene, limonene and myrcene).The experiments were conducted in absence of OH radical scavenger and seed particles. The data obtained enabled us toevaluate the aerosol formation thresholds which were compared with the existing literature data. The present workconstitutes the first study on the aerosol formation threshold through the ozonolysis of myrcene and reports thresholdvalues lower than those obtained in previous investigations for the ozonolysis of a-pinene, sabinene and limonene. Thenucleation thresholds determined here were found to be r1.6 ppb and the trend observed for the studied monoterpenesagrees with that observed in the literature (Bonn & Moortgat, 2003).
However, the sensitivity of the particle counters used in this type of work is one of the limited criteria in the accuracy ofthe assessment of nucleation thresholds. Indeed, it should be mentioned that, nucleation threshold is apprehended as anobservation threshold where atmospheric particles nucleate with a particle size diameter lower than 3 nm and the particlecutoff diameter of CPC used (D50¼8.3 nm, (Ankilov et al., 2002)). Accurate conversion limit data could be obtained by moresensitive particle counter by the use for example of ion mobility spectrometers which can be extended to 0.4 nmcorresponding to molecular ion range diameter (Kulmala et al., 2004a).
Using the set-up developed in our laboratory, future work will consist in evaluating the dependence of SOA nucleationthreshold in more realistic conditions (e.g. at different relative humidity, in presence of other species such as NOX and SO2).These parameterizations using experimental data would be necessary in evaluating the VOC contribution to SOA formationin remote and polluted areas and further to enrich air quality models.
Acknowledgements
This work was supported by the EU-FP7 project EUROCHAMP 2 and the French Program of Atmospheric Chemistry(CHAT-LEFE) of CNRS. Authors thank Dr. A. Sadezky and Dr. A. Le Person for their contribution in the early stage of thedevelopment of the aerosol flow tube. Thanks are also due to Pr. J.-F. Doussin for lending us the CPC Model 3010 and theatomizer (TSI Model 3076) for the determination of residence time of particles in the flow reactor.
References
Ankilov, A., Baklanov, A., Colhoun, M., Enderle, K.H., Gras, J., Julanov, Y., Kaller, D., Lindner, A., Lushnikov, A.A., Mavliev, R., McGovern, F., O’Connor, T.C.,Podzimek, J., Preining, O., Reischl, G.P., Rudolf, R., Sem, G.J., Szymanski, W.W., Vrtala, A.E., Wagner, P.E., Winklmayr, W., & Zagaynov, V. (2002). Particlesize dependent response of aerosol counters. Atmospheric Research, 62, 209–237.
Aschmann, S.M., Arey, J., & Atkinson, R. (2002). OH radical formation from the gas-phase reactions of O3 with a series of terpenes. AtmosphericEnvironment, 36, 4347–4355.
Atkinson, R., Winer, A.M., & Pitts, J.N., Jr. (1982). Rate constants for the gas phase reactions of O3 with the natural hydrocarbons isoprene and a- andb-pinene. Atmospheric Environment, 16, 1017–1020.
Atkinson, R., Aschmann, S.M., & Pitts, J.N., Jr. (1986). Rate constants for the gas-phase reactions of the OH radical with a series of monoterpenes at29471 K. International Journal of Chemical Kinetics, 18, 287–299.
Atkinson, R., Hasegawa, D., & Aschmann, S.M. (1990a). Rate constants for the gas-phase reactions of O3 with a series of monoterpenes and relatedcompounds at 29672 K. International Journal of Chemical Kinetics, 22, 871–887.
Atkinson, R., Aschmann, S.M., & Arey, J. (1990b). Rate constants for the gas-phase reactions of OH and NO3 radicals and O3 with sabinene and camphene at29672 K. Atmospheric Environment, 24A, 2647–2654.
Atkinson, R., Aschmann, S.M., Arey, J., & Shorees, B. (1992). Formation of OH radicals in the gas phase reactions of O3 with a series of terpenes. Journal ofGeophysical Research, 97, 6065–6073.
Atkinson, R., & Arey, J. (2003). Gas-phase tropospheric chemistry of biogenic volatile organic compounds: a review. Atmospheric Environment, 37,S197–S219.
Atkinson, R., Baulch, D.L., Cox, R.A., Crowley, J.N., Hampson, R.F., Hynes, R.G., Jenkin, M.E., Rossi, M.J., & Troe, J. (2004). Evaluated kinetic andphotochemical data for atmospheric chemistry: Volume I—gas phase reactions of OX, HOX, NOX and SOX species. Atmospheric Chemistry and Physics, 4,1461–1738.
Atkinson, R., Baulch, D.L., Cox, R.A., Crowley, J.N., Hampson, R.F., Hynes, R.G., Jenkin, M.E., Rossi, M.J., & Troe, J. (2006). Evaluated kinetic andphotochemical data for atmospheric chemistry: Volume II—gas phase reactions of organic species. Atmospheric Chemistry and Physics, 6, 3625–4055.
Baker, J., Arey, J., & Atkinson, R. (2004). Kinetics of the gas-phase reactions of OH radicals, NO3 radicals and O3 with three C7-carbonyls formed from theatmospheric reactions of myrcene, ocimene and terpinolene. Journal of Atmospheric Chemistry, 48(3), 241–260.
Baron, P.A., & Willeke, B. (2001). Aerosol measurements: principles, techniques, and applications (2nd edition). ISBN: 0-471-35636-0.Bernard, F., Eglunent, G., Daele, V., & Mellouki, A. (2010). Kinetics and products of the gas-phase reactions of ozone with methyl methacrylate, methyl
acrylate and ethyl acrylate. Journal of Physical Chemistry A, 114(32), 8376–8383.

F. Bernard et al. / Journal of Aerosol Science 43 (2012) 14–30 29
Berndt, T., Boge, O., & Stratmann, F. (2003). Gas-phase ozonolysis of a-pinene: gaseous products and particle formation. Atmospheric Environment, 37,3933–3945.
Bonn, B., & Moortgat, G.K. (2002). New particle formation during a- and b-pinene oxidation by O3, OH and NO3, and the influence of water vapour:particle size distribution studies. Atmospheric Chemistry and Physics, 2, 183–196.
Bonn, B., & Moortgat, G.K. (2003). Sesquiterpene ozonolysis: origin of atmospheric new particle formation from biogenic hydrocarbons. GeophysicalResearch Letters, 30(11), 1585.
Burkholder, J.B., Curtius, J., Ravishankara, A.R., & Lovejoy, E.R. (2004). Laboratory studies of the homogeneous nucleation of iodine oxides. AtmosphericChemistry and Physics, 4, 19–34.
Burkholder, J.B., Baynard, T., Ravishankara, A.R., & Lovejoy, E.R. (2007). Particle nucleation following the O3 and OH initiated oxidation of a-pinene andb-pinene between 278 and 320 K. Journal of Geophysical Research, 112, D10216.
Calogirou, A., Jensen, N.R., Nielsen, C.J., Kotzias, D., & Hjorth, J. (1999). Gas-phase reactions of nopinone, 3-isopropenyl-6-oxo-heptanal, and 5-methyl-5-vinyltetrahydrofuran-2-ol with OH, NO3, and ozone. Environmental Science and Technology, 33(3), 453–460.
Calvert, J.G., Atkinson, R., Kerr, J.A., Madronich, S., Moortgat, G.K., Wallington, T.J., & Yarwood, G. (2000). The mechanisms of atmospheric oxidation of thealkenes. Oxford University Press: New York.
Cocker, D.R., III, Clegg, S.L., Flagan, R.C., & Seinfeld, J.H. (2001a). The effect of water on gas–particle partitioning of secondary organic aerosol. Part I:a-pinene/ozone system. Atmospheric Environment, 35, 6049–6072.
Cocker, D.R., III, Mader, B.T., Kalberer, M., Flagan, R.C., & Seinfeld, J.H. (2001b). The effect of water on gas–particle partitioning of secondary organicaerosol: II. m-xylene and 1,3,5-trimethylbenzene photooxidation systems. Atmospheric Environment, 35, 6073–6085.
Cusick, R.D., & Atkinson, R. (2005). Rate constants for the gas-phase reactions of O3 with a series of cycloalkenes at 29672 K. International Journal ofChemical Kinetics, 37, 183–190.
Daekyun, K., Stevens, P.S., & Hites, R.A. (2011). Rate constants for the gas phase reactions with OH and O3 with b-ocimene, b-myrcene, and a- andb-farnesene as a function of temperature. Journal of Physical Chemistry A, 115(4), 500–506.
Enghoff, M.B., & Svensmark, H. (2008). The role of atmospheric ions in aerosol nucleation—a review. Atmospheric Chemistry and Physics, 8, 4911–4923.Griffin, R.J., Cocker, D.R., III, Flagan, R.C., & Seinfeld, J.H. (1999). Organic aerosol formation from the oxidation of biogenic hydrocarbons. Journal of
Geophysical Research, 104, 3555–3567.Grimsrud, E.P., Westberg, H.H., & Rasmussen, R.A. (1975). Atmospheric reactivity of monoterpene hydrocarbons, NOX photooxidation and ozonolysis.
International Journal of Chemical Kinetics Symposium, 1, 183.Guenther, A., Hewitt, N.C., Erickson, D., Fall, R., Geron, C., Graedel, T., Harley, P., Klinger, L., Lerdau, M., McKay, W.A., Pierce, T., Scholes, B., Steinbrecher, R.,
Tallamraju, P., Taylor, J., & Zimmerman, P. (1995). A global model of natural volatile organic compound emissions. Journal of Geophysical Research, 100,8873–8892.
Hallquist, M., Wenger, J.C., Baltensperger, U., Rudich, Y., Simpson, D., Claeys, M., Dommen, J., Donahue, N.M., George, C., Goldstein, A.H., Hamilton, J.F.,Herrmann, H., Hoffmann, T., Iinuma, Y., Jang, M., Jenkin, M.E., Jimenez, J.L., Kiendler-Scharr, A., Maenhaut, W., McFiggans, G., Mentel, T.F., Monod, A.,Prevot, A.S.H., Seinfeld, J.H., Surratt, J.D., Szmigielski, R., & Wildt, J. (2009). The formation, properties and impact of secondary organic aerosol: currentand emerging issues. Atmospheric Chemistry and Physics, 9, 5155–5235.
Heim, M., Kasper, G., Reischl, G.P., & Gerhart, C. (2004). Performance of a new commercial electrical mobility spectrometer. Aerosol Science and Technology,38, 3–14.
Hoffmann, T., Odum, J.R., Bowman, F., Collins, D., Klockow, D., Flagan, R.C., & Seinfeld, J.H. (1997). Formation of organic aerosols from the oxidation ofbiogenic hydrocarbons. Journal of Atmospheric Chemistry, 26, 189–222.
Hoppel, W., Fitzgerald, J., Frick, G., Caffrey, P., Pasternack, L., Hegg, D., Gao, S., Leaitch, R., Shantz, N., Cantrell, C., Albrechcinski, T., Ambrusko, J., & Sullivan,W. (2001). Particle formation and growth from ozonolysis of a-pinene. Journal of Geophysical Research, 106, 27603–27618.
Japar, S.M., Wu, C.H., & Niki, H. (1974). Rate constants for the gas phase reaction of ozone with a-pinene and terpinolene. Environmental Letters, 7,245–249.
Jonsson, A., Hallquist, M., & Ljungstrom, E. (2006). Impact of humidity on the ozone Initiated oxidation of limonene, D3-carene, and a-pinene.Environmental Science and Technology, 40, 188–194.
Jonsson, A., Hallquist, M., & Ljungstrom, E. (2008a). Influence of OH scavenger on the water effect on secondary organic aerosol formation from ozonolysisof limonene, D3-carene, and a-pinene. Environmental Science and Technology, 42, 5938–5944.
Jonsson, A., Hallquist, M., & Ljungstrom, E. (2008b). The effect of temperature and water on secondary organic aerosol formation from ozonolysis oflimonene, D3-carene and a-pinene. Atmospheric Chemistry and Physics, 8, 6541–6549.
Kanakidou, M., Seinfeld, J.H., Pandis, S.N., Barnes, I., Dentener, F.J., Facchini, M.C., Van Dingenen, R., Ervens, B., Nenes, A., Nielsen, C.J., Swietlicki, E., Putaud,J.P., Balkanski, Y., Fuzzi, S., Horth, J., Moortgat, G.K., Winterhalter, R., Myhre, C.E.L., Tsigaridis, K., Vignati, E., Stephanou, E.G., & Wilson, J. (2005).Organic aerosol and global climate modelling: a review. Atmospheric Chemistry and Physics, 5, 1053–1123.
Kaufman, F. (1984). Kinetics of elementary radical reactions in the gas phase. Journal of Physical Chemistry, 88, 4909–4917.Kavouras, I.G., & Stephanou, E.G. (2002). Direct evidence of atmospheric secondary organic aerosol formation in forest atmosphere through
heteromolecular nucleation. Environmental Science and Technology, 36, 5083–5091.Kesten, J., Reineking, A., & Porstendorfer, J. (1991). Calibration of a TSI Model 3025 ultrafine condensation particle counter. Aerosol Science and Technology,
15, 107–111.Khamaganov, V.G., & Hites, R.A. (2001). Rate constants for the gas-phase reactions of ozone with isoprene, a- and b-Pinene, and limonene as a function of
temperature. Journal of Physical Chemistry A, 105, 815–822.Koch, S., Winterhalter, R., Uherek, E., Kolloff, A., Neeb, P., & Moortgat, G.K. (2000). Formation of new particles in the gas-phase ozonolysis of
monoterpenes. Atmospheric Environment, 34, 4031–4042.Kroll, J.H., Ng, N.L., Murphy, S.M., Flagan, R.C., & Seinfeld, J.H. (2006). Secondary organic aerosol formation from isoprene photooxidation. Environmental
Science and Technology, 40, 1869–1877.Kulmala, M., & Laaksonen, A. (1990). Binary nucleation of water-sulfuric acid system: comparison of classical theories with different H2SO4 saturation
vapor pressures. Journal of Physical Chemistry, 93, 696–701.Kulmala, M., Pirjola, L., & Makela, J.M. (2000). Stable sulphate clusters as a source of new atmospheric particles. Nature, 404, 66–69.Kulmala, M., Vehkamaki, H., Petaja, T., Dal Maso, M., Lauri, A., Kerminen, V.-M., Birmili, W., & McMurry, P.H. (2004a). Formation and growth rates of ultra-
fine atmospheric particles: a review of observations. Journal of Aerosol Science, 35, 143–176.Kulmala, M., Kerminen, V.-M., Anttila, T., Laaksonen, A., & O’Dowd, C.D. (2004b). Organic aerosol formation via sulphate cluster activation. Journal of
Geophysical Research, 109, D04205.Lee, A., Goldstein, A.H., Keywood, M.D., Gao, S., Varutbangkul, V., Bahreini, R., Ng, N.L., Flagan, R.C., & Seinfeld, J.H. (2006a). Gas-phase products and
secondary aerosol yields from the ozonolysis of ten different terpenes. Journal of Geophysical Research, 111, 1–18.Lee, A., Goldstein, A.H., Kroll, J.H., Ng, N.L., Varutbangkul, V., Flagan, R.C., & Seinfeld, J.H. (2006b). Gas-phase products and secondary aerosol yields from
the photooxidation of 16 different terpenes. Journal of Geophysical Research, 111, 1–25.Lee, S., & Kamens, R.M. (2005). Particle nucleation from the reaction of a-pinene and O3. Atmospheric Environment, 39, 6822–6832.Massman, W.J. (1998). A review of the molecular diffusivities of H2O, CO2, CH4, CO, O3, SO2, NH3, N2O, NO, and NO2 in air, O2 and N2 near STP. Atmospheric
Environment, 32, 1111–1127.Nolting, F., Behnke, W., & Zetzsch, C. (1988). A smog chamber for studies of the reactions of terpenes and alkanes with ozone and OH. Journal of
Atmospheric Chemistry, 6, 47–59.

F. Bernard et al. / Journal of Aerosol Science 43 (2012) 14–3030
O’Dowd, C.D., Jimenez, J.L., Bahreini, R., Flagan, R.C., Seinfeld, J.H., Hameri, K., Pirjola, L., Kulmala, M., Jennings, S.G., & Hoffmann, T. (2002a). Marine aerosolformation from biogenic iodine emissions. Nature, 417, 632–636.
O’Dowd, C.D., Aalto, P., Hameri, K., Kulmala, M., & Hoffmann, T. (2002b). Atmospheric particles from organic vapours. Nature, 416, 497–498.Pathak, R.K., Presto, A.A., Lane, T.E., Stanier, C.O., Donahue, N.M., & Pandis, S.N. (2007). Ozonolysis of a-pinene: parameterization of secondary organic
aerosol mass fraction. Atmospheric Chemistry and Physics, 7, 3811–3821.Paulson, S.E., Chung, M.Y., & Hasson, A.S. (1999). OH radical formation from the gas-phase reaction of ozone with terminal alkenes and the relationship
between structure and mechanism. Journal of Physical Chemistry A, 103, 8125–8138.Presto, A.A., Huff Hartz, K.E., & Donahue, N.M. (2005a). Secondary organic aerosol production from terpene ozonolysis. 2. Effect of NOX concentration.
Environmental Science and Technology, 39, 7046–7054.Presto, A.A., Huff Hartz, K.E., & Donahue, N.M. (2005b). Secondary organic aerosol production from terpene ozonolysis—1. Effect of UV radiation.
Environmental Science and Technology, 39, 7036–7045.Ripperton, L.A., Jeffries, H.E., & White, O. (1972). Formation of aerosols by reaction of ozone with selected hydrocarbons. Advances in Chemistry Series, 113,
219–231.Seinfeld, J.H., & Pandis, S.N. (1998). Atmospheric chemistry and physics. From Air Pollution to Climate Change, John Wiley: New York.Shu, Y., & Atkinson, R. (1994). Rate constants for the gas-phase reactions of O3 with a series of terpenes and OH radical formation from the O3 reactions
with sesquiterpenes at 29672 K. International Journal of Chemical Kinetics, 26, 1193–1205.Slowik, J.G., Stroud, C., Bottenheim, J.W., Brickell, P.C., Chang, R.Y.W., Liggio, J., Makar, P.A., Martin, R.V., Moran, M.D., Shantz, N.C., Sjostedt, S.J.,
van Donkelaar, A., Vlasenko, A., Wiebe, H.A., Xia, A.G., Zhang, J., Leaitch, W.R., & Abbatt, J.P.D. (2010). Characterization of a large biogenic secondaryorganic aerosol event from eastern Canadian forests. Atmospheric Chemistry and Physics, 10, 2825–2845.
Tillmann, R., Saathoff, H., Brauers, T., Kiendler-Scharr, A., & Mentel, T.F. (2009). Temperature dependence of the rate coefficient for the a-pinene reactionwith ozone in the range between 243 K and 303 K. Physical Chemistry Chemical Physics, 11, 2323–2328.
Volkamer, R., Jimenez, J.L., San Martini, F., Dzepina, K., Zhang, Q., Salcedo, D., Molina, L.T., Worsnop, D.R., & Molina, M.J. (2006). Secondary organic aerosolformation from anthropogenic air pollution: rapid and higher than expected. Geophysical Research. Letters, 33, L17811.
von Hessberg, C., von Hessberg, P., Poschl, U., Bilde, M., Nielsen, O.J., & Moortgat, G.K. (2009). Temperature and humidity dependence of secondary organicaerosol yield from the ozonolysis of b-pinene. Atmospheric Chemistry and Physics, 9, 3583–3599.
Witter, M., Berndt, T., Boge, O., Stratmann, F., & Heintzenberg, J. (2002). Gas-phase ozonolysis: rate coefficients for a series of terpenes and ratecoefficients and OH yields for 2-methyl-2-butene and 2,3-dimethyl-2-butene. International Journal of Chemical Kinetics, 34, 394–403.
Wolf, L., Suhm, M.A., & Zeuch, T. (2009). Suppressed particle formation by kinetically controlled ozone removal: revealing the role of transient-specieschemistry during alkene ozonolysis. Angewandte Chemie, 48, 2231–2235.
Zhang, J., Wilson, W.E., & Lioy, P.J. (1994). Indoor air chemistry: formation of organic acids and aldehydes. Environmental Science and Technology, 28,1975–1982.
Zhang, Q., Jimenez, J.L., Canagaratna, M.R., Allan, J.D., Coe, H., Ulbrich, I., Alfarra, M.R., Takami, A., Middlebrook, A.M., Sun, Y.L., Dzepina, K., Dunlea, E.,Docherty, K., DeCarlo, P.F., Salcedo, D., Onasch, T., Jayne, J.T., Miyoshi, T., Shimono, A., Hatakeyama, S., Takegawa, N., Kondo, Y., Schneider, J., Drewnick,F., Borrmann, S., Weimer, S., Demerjian, K., Williams, P., Bower, K., Bahreini, R., Cottrell, L., Griffin, R.J., Rautiainen, J., Sun, J.Y., Zhang, Y.M., & Worsnop,D.R. (2007). Ubiquity and dominance of oxygenated species in organic aerosols in anthropogenically-influenced Northern Hemisphere midlatitudes.Geophysical Research Letters, 34, L13801.