Threshold of Sustainability for Tourism Within …iits/unwto2012/Drumm.pdfThreshold of...
40
Threshold of Sustainability for Tourism Within Protected Areas Andy Drumm https://www.facebook.com/DrummSustainableTourismConsulting October 6 - 18, 2012
Transcript of Threshold of Sustainability for Tourism Within …iits/unwto2012/Drumm.pdfThreshold of...

Threshold of Sustainability for Tourism Within Protected Areas
Andy Drumm
https://www.facebook.com/DrummSustainableTourismConsulting
October 6 - 18, 2012

Tourism market trends Implications for biodiversity conservation and
protected areas Characterization of tourism – Recreational v
Nature-focused Dealing with tourism threats Financial Sustainability The Threshold of Sustainability for Tourism in
Protected Areas Belize Case Study


International Tourism: The largest transfer of resources from rich to poor Three Quarters of these journeys originate
in high or upper-middle income countries. 40% end in a developing country
destination In 2007 international tourists spent US$295
billion in developing countries (three times the level of official development assistance).

•Galapagos, Ecuador has more than tripled visitor numbers to 170,000 in last 15 years •Eduardo Avaroa Reserve in Bolivia rose from 8,000 in 1999 to 65,000 in 2007 •Torres del Paine, Chile - From several thousand a year in the 1990s to 117,000 in 2006 • In 2006,Colombia experienced a 35% increase in Park visitation Amacayacu NP: 65% (‘05), 17% (‘06); Tayrona NP: 75%
So where are they all going?


Infrastructure Design: Kapawi Eco-lodge, Ecuador

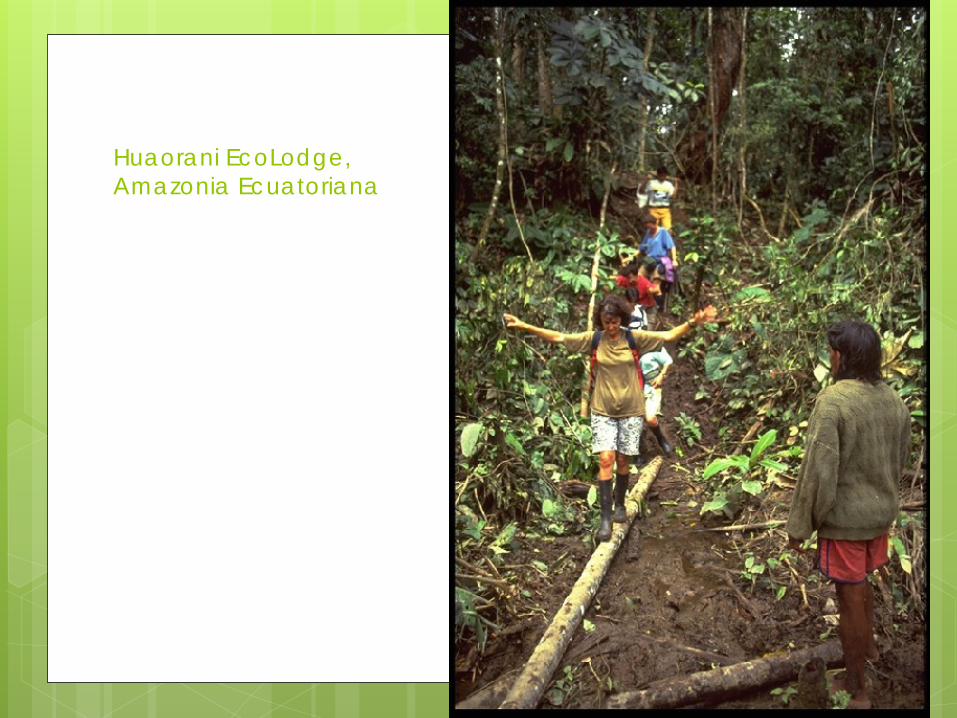
Huaorani EcoLodge, Amazonia Ecuatoriana

Cofan Indigenous Community, Ecuador
Baja California Sur, Mexico

Ejemplos Exitosos
Canaima NP, Venezuela
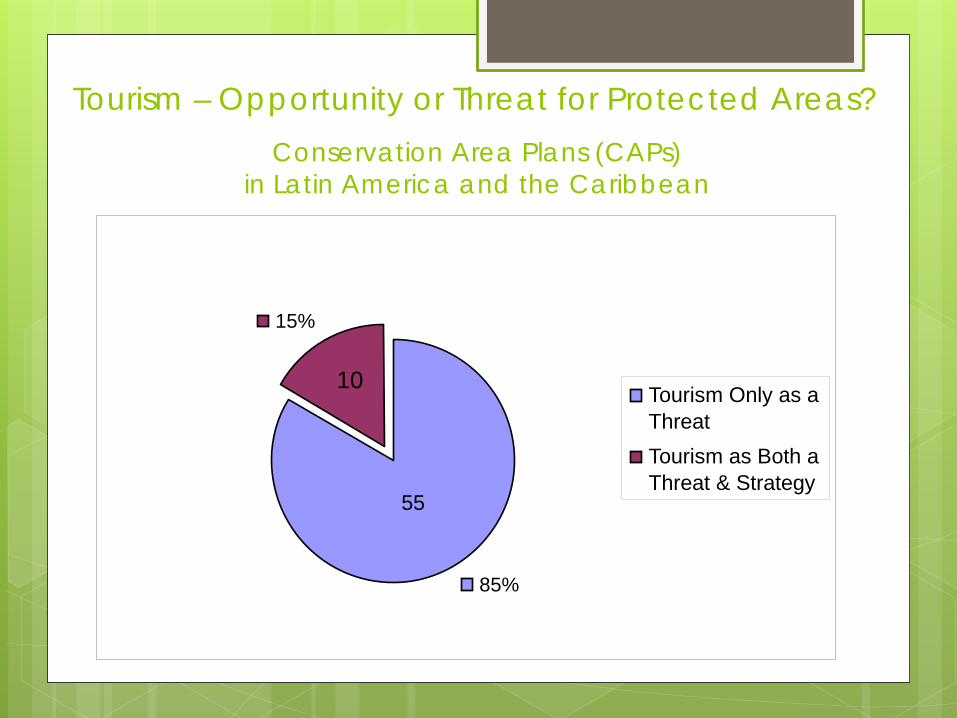
Conservation Area Plans (CAPs) in Latin America and the Caribbean
85%
15%
Tourism Only as a Threat Tourism as Both a Threat & Strategy
10
55
Tourism – Opportunity or Threat for Protected Areas?

Peru •Receives approx. $800 million annually from international tourism •71% of international visitors go to protected areas (PromPeru) •SINAPE received $1.7 million from tourism fees in 2005 •For $1 of investment in AP $146 generated in tourist spending
Country Case Studies
Ecuador Received approx. $400 million in 2006 from international tourism
•60-80% of int’l visitors go to Pas
•SNAP recv’d approx. $900k from tourism fees in 2006 (new reg 2010) Belize •20% of GDP is tourism generated. 60% plus of int’l visitors go to PAs

From Studies of the financial sustainability of protected area systems. Tourism’s Contribution to: National Systems Investment of Protected Areas in PA tourism management Ecuador $900,000 $250,000 Peru $1,700,000 $160,000 Bolivia $600,000 $200,000 Belize $8.6 million $450,000
The Economics of Protected Area Tourism
The National Economy $370 million $800 million $150 million $250 million
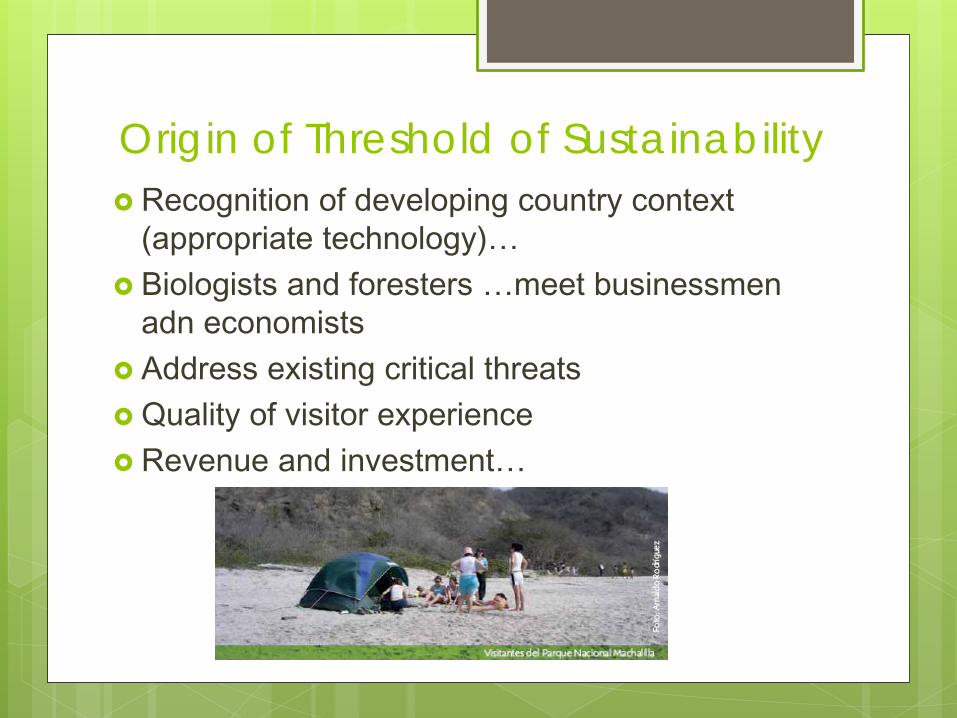
Origin of Threshold of Sustainability Recognition of developing country context
(appropriate technology)… Biologists and foresters …meet businessmen
adn economists Address existing critical threats Quality of visitor experience Revenue and investment…

The Threshold of Sustainability Process

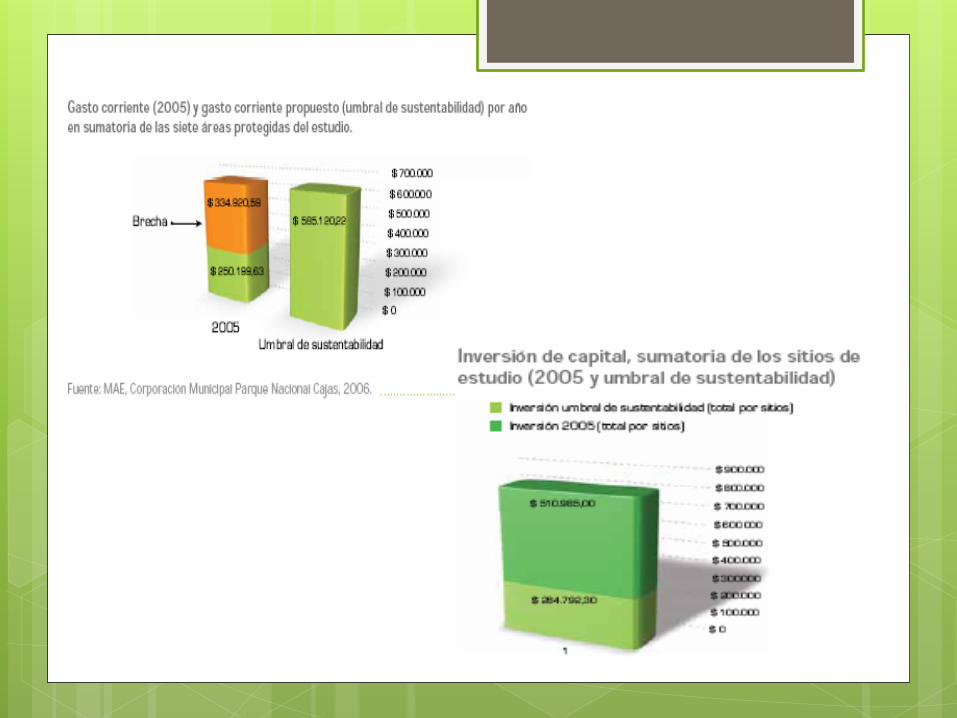
Determining the real cost of tourism management
Sustainable Financing Strategy for the Belize National Protected Areas
System
Belmopan, October 21st 2011
SUSTAINABLE FINANCE FOR THE IMPLEMENTATION OF THE BELIZE NATIONAL PROTECTED AREAS SYSTEM PLAN, COST OF THE SYSTEM AND ECONOMIC
VALUATION PROJECT

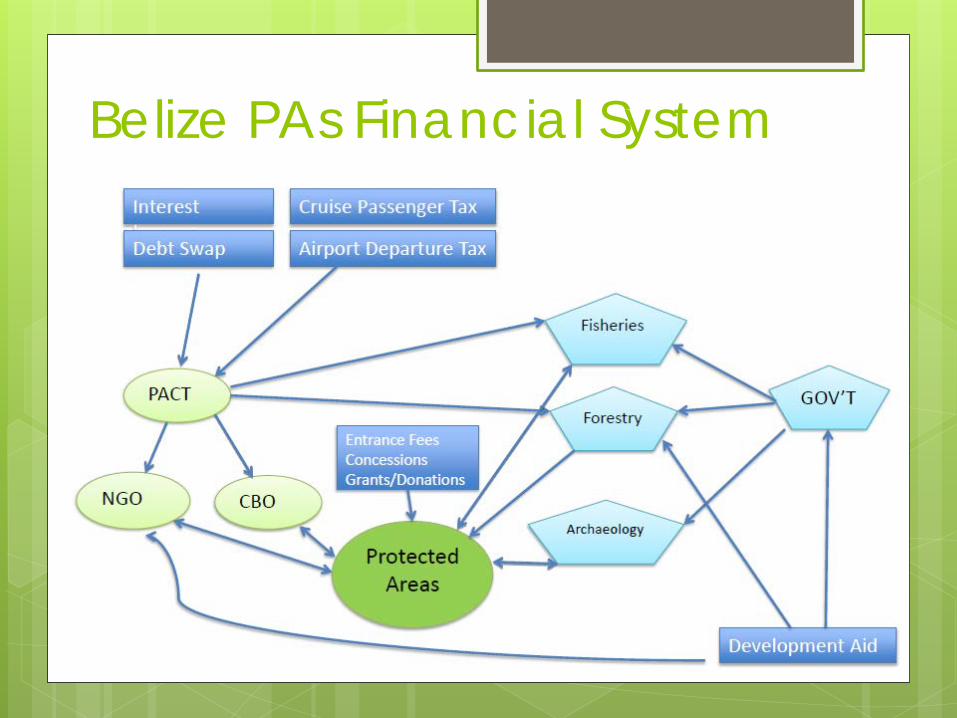
Belize PAs Financial System

The Key Numbers An estimated US$8.9 million was spent in total on the protected area system in 2010 Basic level of funding is US$18.5 million per year Optimal level of funding is US$28.3 million The financial gap for a Basic scenario is US$10.2 million per year and US$ 19.4 million
for an Optimal scenario.

Financial Gap by Program Area

Tourism Programme budgets

The Threshold of Sustainability for Tourism

Visitor Responsivenesss to Entrance Fees

Ecosystem Services: Tourism

Optimize Existing Revenue Sources Government commits to increasing allocations. Increase average entrance fees significantly Develop an action plan for a fee revision both
increase existing fees and find new ones. Increase Commissions on the Cruise Passenger Tax
to 25% Increase Conservation Fee to between US$7.50-
US$10 Establish the technical basis for determining the
price of fishing licenses and forestry concessions.
Install international cooperation unit at NPAS

Improve tourism entrance fee system
Standardize and simplify entrance fees Simplify purchase transactions
Establish vending points Accept credit card payments / Web-based payment Multi-site passes Extended validty
Outsource fee collection Review time preferences of market segments

Moderate Improvement / Basic Management

User Fees
Health of Protected Area
StrongD dDemand Sustainable
Visitation
Virtuous Cycle of Tourism User Fees Positive feedback loop between tourism impacts and conservationf
Proportional to Costof Managing Impacts& Ability to Pay
Visitor UseBalancedwith Impacts
TourismManagementCapacity


www.facebook.com/DrummSustainableTourismConsulting

Adding it up...
PA System Tourism Mngmt. ToS (basic) Revenue Budget
Ecuador: $1 millon $0.25m $0.5m Brazil: $7 millones $3.5 m Peru: $800k $0.2m $1.5m Bolivia: $500k $0.1m $0.3m Colombia $400k $1.5m Chile Argentina $8 millones $3.0m
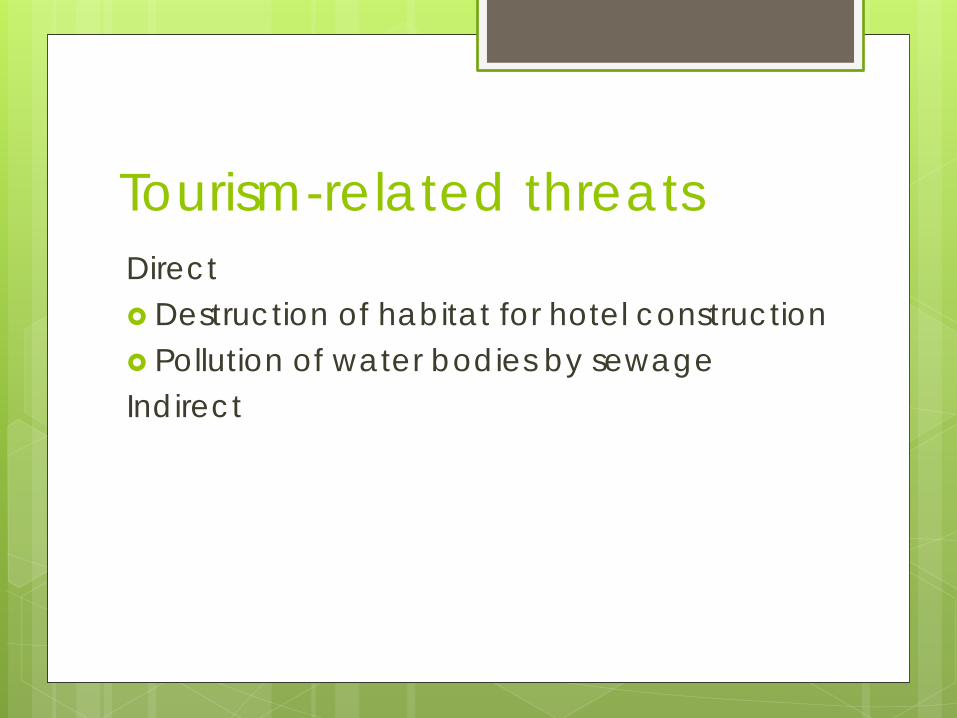
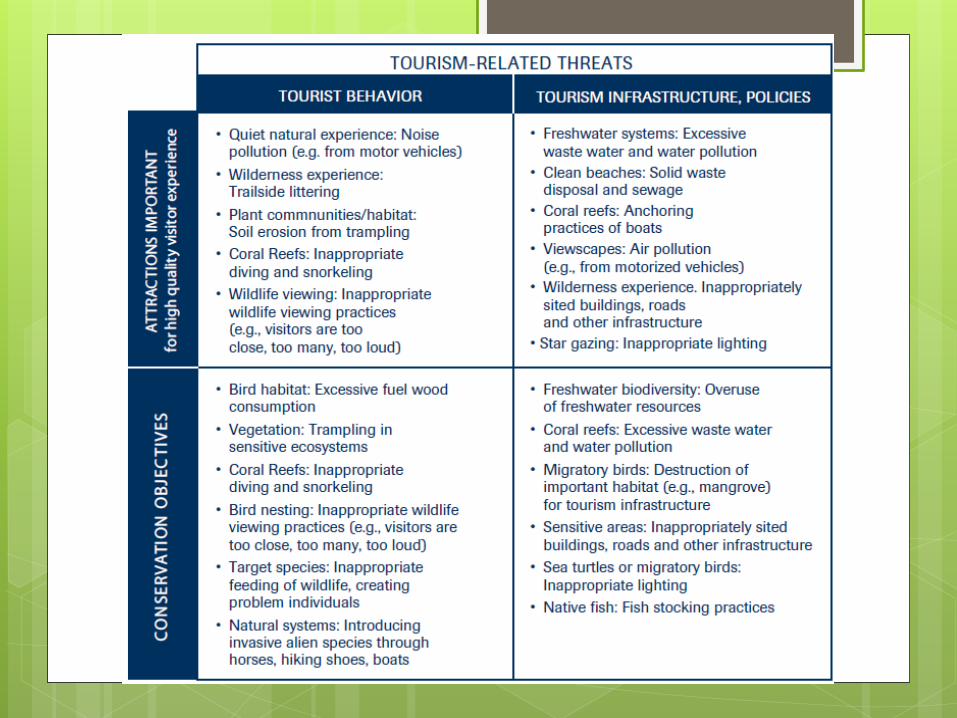
Tourism-related threats Direct Destruction of habitat for hotel construction Pollution of water bodies by sewage Indirect

CBD Programme of Work on Protected Areas (PoWPA) PoWPA provides a framework for international
action in 140 countries PoWPA objectives to which tourism can contribute: Financial sustainability, Management capacity, Sharing benefits with local communities