Three-Year Study of Tour de France Modeling John Eric Goff Lynchburg College CS-AAPT Fall 2005 –...
19
Three-Year Study of Tour de France Modeling John Eric Goff Lynchburg College CS-AAPT Fall 2005 – American Center for Physics College Pa November 5, 2005
-
Upload
john-oneal -
Category
Documents
-
view
215 -
download
1
Transcript of Three-Year Study of Tour de France Modeling John Eric Goff Lynchburg College CS-AAPT Fall 2005 –...

Three-Year Study of Tour de France Modeling
John Eric GoffLynchburg College
CS-AAPT Fall 2005 – American Center for Physics College Park, MD
November 5, 2005

History of Research
• Ben Hannas (LC ’03) – Computational Physics Course Project (Spring ’03)
• Ideas from Giordano’s Computational Physics• Ben Modeled Two Stages of 2001 Tour de
France for Project• After May ’03 Graduation, Ben and I Modeled
Entire 2003 Tour de France• American Journal of Physics (May 2004)• Ben and I Modeled Entire 2004 Tour de France• European Journal of Physics (February 2005)• Contacted by Richmond Times-Dispatch and
Asked to Model 2005 Tour de France
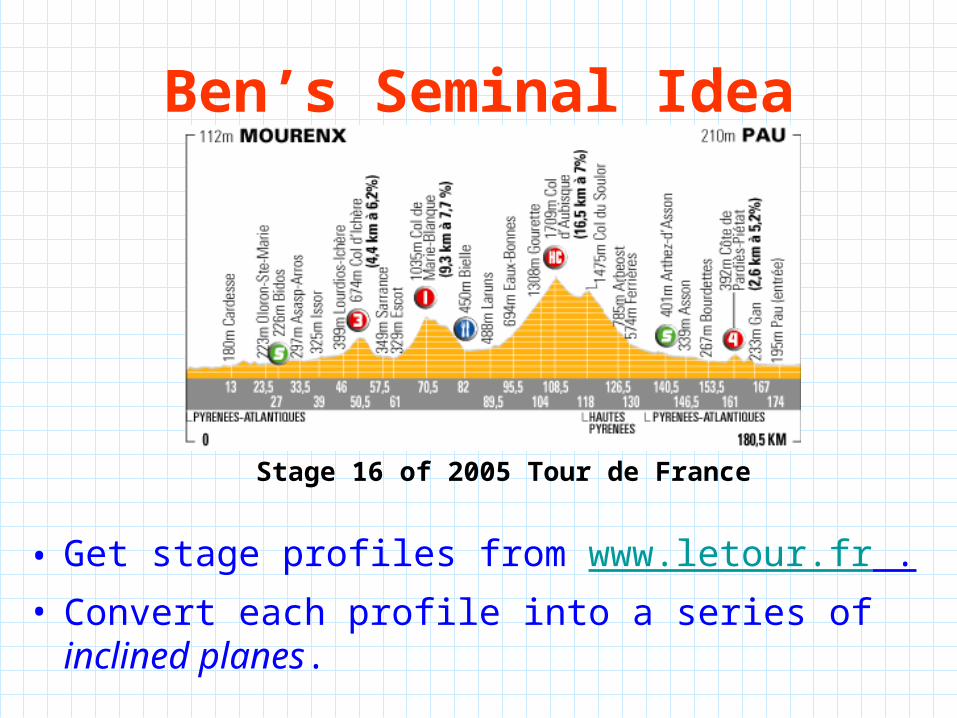
Ben’s Seminal Idea
• Get stage profiles from www.letour.fr .• Convert each profile into a series of inclined
planes.
Stage 16 of 2005 Tour de France

Forces on Bike-Rider Combo
• Weight: W = mg
• Normal Force: FN = mg cosθ
• Biker’s Force: Fb = Pb/v
• Retarding Forces: FR = FD + Fr
FD = CDAv2/2 (Drag Force)
Fr = μrFN (Rolling Friction)

Physicists LOVE the Inclined Plane!

Parameters
• Bike-Rider Mass: m = 77 kg
• Coefficient of Rolling Friction: μr = 0.003
• Air Density: = 1.2 kg/m3
• Drag Coefficient ● Cross-Sectional Area:
CDA = 0.35 m2 (θ ≥ 0, uphill)
CDA = 0.25 m2 (θ < 0, downhill)

Biker’s Power Output
• 2003 Tour de France

Biker’s Power Output
• 2004 Tour de France
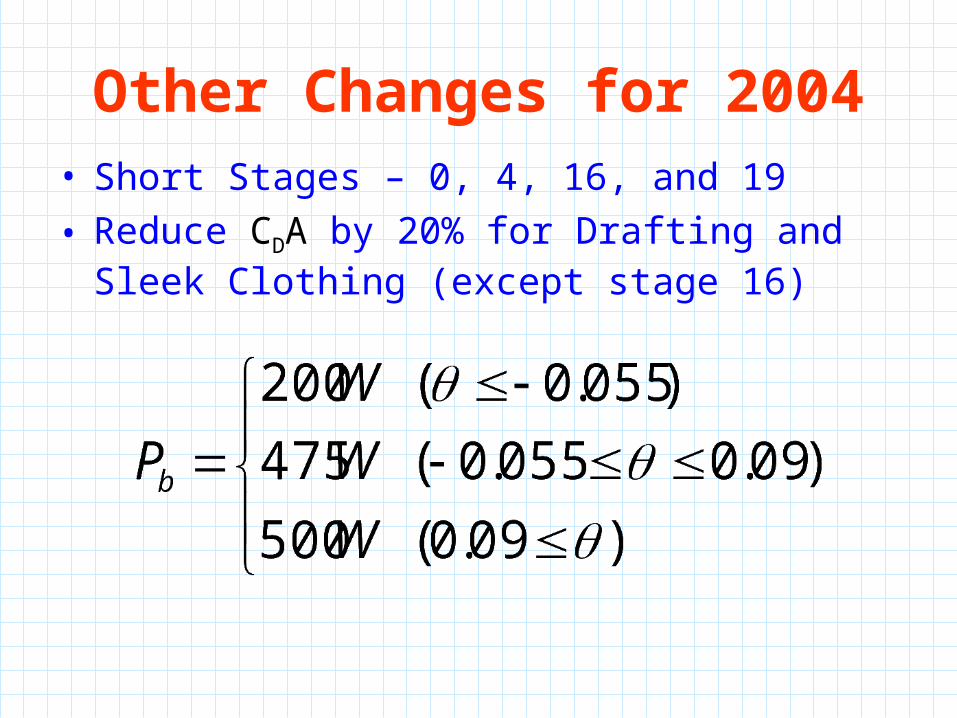
Other Changes for 2004• Short Stages – 0, 4, 16, and 19
• Reduce CDA by 20% for Drafting and Sleek Clothing (except stage 16)

Model Successes
Actual ModelDifferenc
e%
2003 82h 33’ 53” 82h 32’ 37” - 01’ 16” - 0.03%
2004 82h 47’ 07” 82h 44’ 38” - 02’ 29” - 0.05%
2003(2004 model
)
82h 33’ 53” 84h 01’ 34” 1h 27’ 41” 1.77%

Angles for 2005 Tour de France
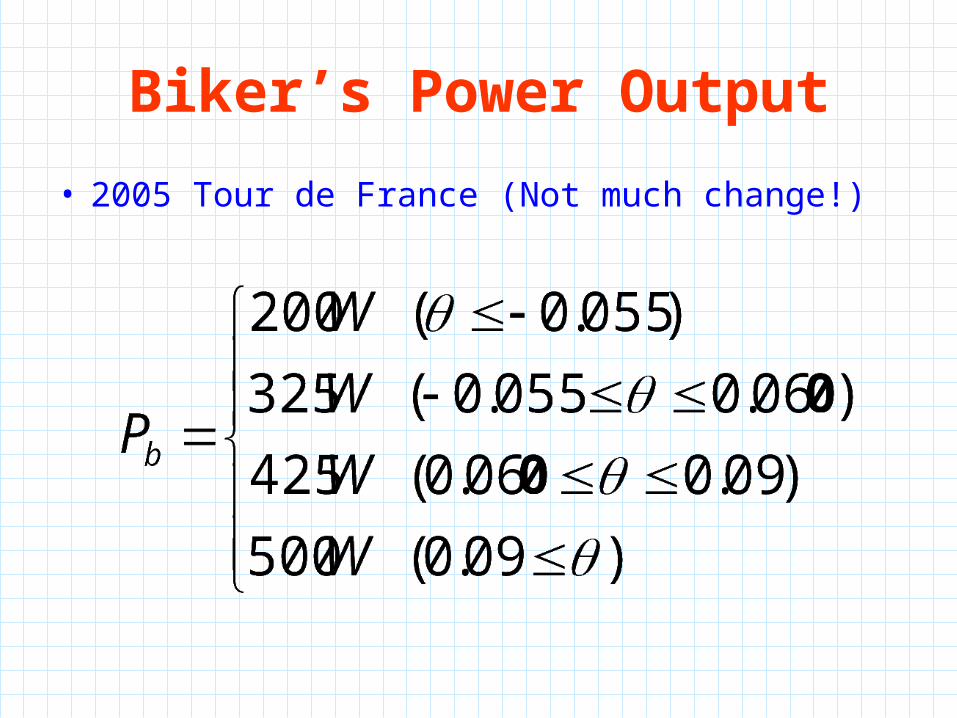
Biker’s Power Output
• 2005 Tour de France (Not much change!)

On to 2005’s Tour de France
Stage Actual ModelDifferenc
e%
1 0h 20’ 51” 0h 21’ 59” 0h 01’ 08” 5.44%
2 3h 51’ 31” 4h 16’ 51” 0h 25’ 20” 10.94%
3 4h 36’ 09” 4h 57’ 23” 0h 21’ 14” 7.69%
4 1h 10’ 39” 1h 18’ 23” 0h 07’ 44” 10.95%
5 3h 46’ 00” 4h 18’ 31” 0h 32’ 31” 14.39%
6 4h 12’ 52” 4h 45’ 29” 0h 32’ 37” 12.90%
We are too slow!!!

What Happened?!?
• Tailwinds permeated the first week of the race.
• Wind speeds measured in the 10-20 mph (16-32 km/hr) range.
• Easy way to account for tailwind – increase power input.
• How much???

Add Power from Tailwind
• Terminal speed reached when forward force matches sum of retarding forces.
• Tailwind means biker’s speed relative to air goes down.
• Only considering the dominate air drag:
Pb ~ vt3
• Add about 50W to main 325W power.

Stage Actual Model Difference %
1 0h 20’ 51” 0h 21’ 59” 0h 01’ 08” 5.44%
2 3h 51’ 31” 4h 04’ 05” 0h 12’ 34” 5.43%
3 4h 36’ 09” 4h 42’ 43” 0h 06’ 34” 2.38%
4 1h 10’ 39” 1h 18’ 23” 0h 07’ 44” 10.95%
5 3h 46’ 00” 4h 05’ 43” 0h 19’ 43” 8.72%
6 4h 12’ 52” 4h 30’ 49” 0h 17’ 57” 7.10%
7 5h 03’ 45” 5h 04’ 44” 0h 00’ 59” 0.32%
8 5h 03’ 54” 5h 21’ 13” 0h 17’ 19” 5.70%
9 4h 08’ 20” 4h 00’ 41” - 0h 07’ 39” - 3.08%
10 4h 50’ 35” 5h 01’ 39” 0h 11’ 04” 3.81%
11 4h 47’ 38” 4h 26’ 26” - 0h 21’ 12” - 7.37%
Results

Stage Actual Model Difference %
12 4h 20’ 06” 4h 12’ 43” - 0h 07’ 23” - 2.84%
13 3h 43’ 14” 3h 55’ 34” 0h 12’ 20” 5.52%
14 5h 43’ 43” 5h 37’ 48” - 0h 05’ 55” - 1.72%
15 6h 06’ 38” 5h 34’ 42” - 0h 31’ 56” - 8.71%
16 4h 38’ 40” 4h 39’ 00” 0h 00’ 20” 0.12%
17 5h 41’ 19” 5h 22’ 59” - 0h 18’ 20” - 5.37%
18 4h 37’ 36” 4h 36’ 08” - 0h 01’ 28” - 0.53%
19 3h 33’ 04” 3h 37’ 44” 0h 04’ 40” 2.19%
20 1h 11’ 46” 1h 06’ 06” - 0h 05’ 40” - 7.90%
21 3h 40’ 57” 3h 08’ 13” - 0h 32’ 44” - 14.81%
TOTAL 85h 09’ 17” 84h 49’ 22” - 0h 19’ 55” - 0.40%
Results (continued)
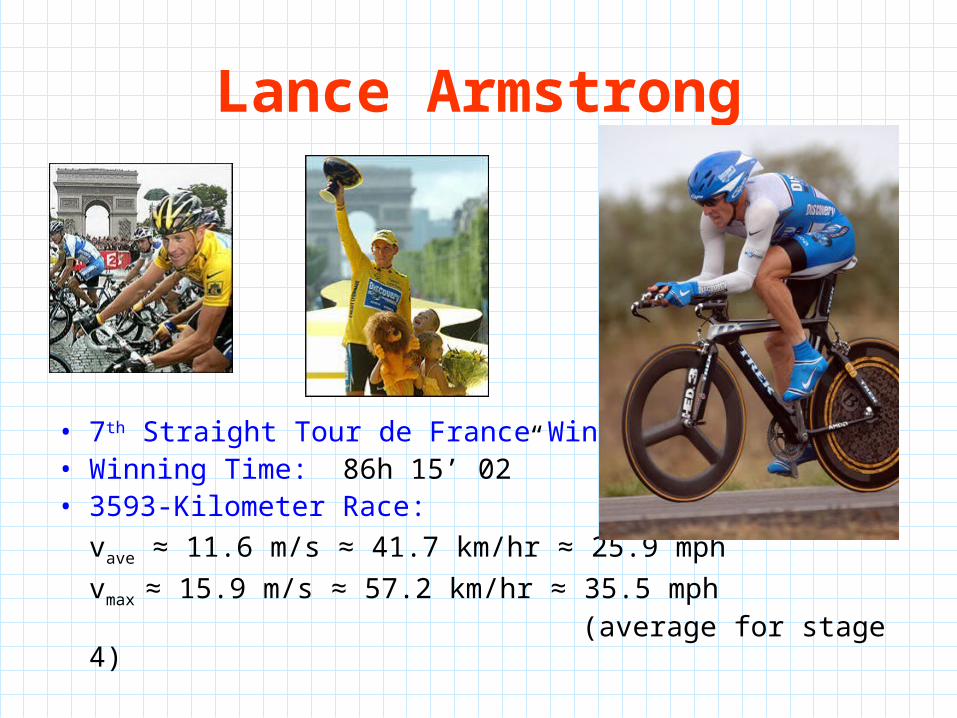
Lance Armstrong
• 7th Straight Tour de France Win!• Winning Time: 86h 15’ 02” • 3593-Kilometer Race:
vave ≈ 11.6 m/s ≈ 41.7 km/hr ≈ 25.9 mph
vmax ≈ 15.9 m/s ≈ 57.2 km/hr ≈ 35.5 mph (average for stage 4)

Other Tour Races in 2004(Use 2004 Model)
Race Actual ModelDifferenc
e%
Giro(stage 1)
3h 41’ 56” 3h 30’ 21” 0h 11’ 35” - 5.22%
Paris-Tours
(stage 3)5h 33’ 03” 5h 49’ 10” 0h 16’ 07” 4.84%
Liege-Bastogne
-Liege(stage 2)
6h 20’ 09” 6h 10’ 52” - 0h 09’ 17” - 2.44%
Thanks Brett Taylor at Radford University!