Threat Landscape Report Q4 2016 - Fortinet | … · THREAT LANDSCAPE REPORT Q4 2016. 2 ... Holiday...
31
THREAT LANDSCAPE REPORT Q4 2016
Transcript of Threat Landscape Report Q4 2016 - Fortinet | … · THREAT LANDSCAPE REPORT Q4 2016. 2 ... Holiday...
THREATLANDSCAPEREPORTQ4 2016
2
TABLE OF CONTENTS
Foreword . . . . . . . . . . . . . . . . . . . . . . . . . . . . . . . . . . . . . . . . . . . . . . . . .3
Q4 2016 Highlights and Key Findings . . . . . . . . . . . . . . . . . . . . . . . . . . .4
Sources and Measures . . . . . . . . . . . . . . . . . . . . . . . . . . . . . . . . . . . . . .5
Infrastructure Trends . . . . . . . . . . . . . . . . . . . . . . . . . . . . . . . . . . . . . . . .7
Global Threat Landscape . . . . . . . . . . . . . . . . . . . . . . . . . . . . . . . . . . . .10
Exploits . . . . . . . . . . . . . . . . . . . . . . . . . . . . . . . . . . . . . . . . . . . . . . . .11
Mini Focus: IoT . . . . . . . . . . . . . . . . . . . . . . . . . . . . . . . . . . . . . . . . . .13
Malware . . . . . . . . . . . . . . . . . . . . . . . . . . . . . . . . . . . . . . . . . . . . . . . .14
Mini Focus: Mobile Malware . . . . . . . . . . . . . . . . . . . . . . . . . . . . . . . .16
Botnets . . . . . . . . . . . . . . . . . . . . . . . . . . . . . . . . . . . . . . . . . . . . . . . .17
Mini Focus: Ransomware . . . . . . . . . . . . . . . . . . . . . . . . . . . . . . . . . .19
Regional Threat Landscapes . . . . . . . . . . . . . . . . . . . . . . . . . . . . . . . . .20
Industry Threat Landscapes . . . . . . . . . . . . . . . . . . . . . . . . . . . . . . . . . .23
Exploratory Analysis: Holiday Threat Trends . . . . . . . . . . . . . . . . . . . . .26
Conclusion and Recommendations . . . . . . . . . . . . . . . . . . . . . . . . . . . .28
TABLE OF CONTENTS
3
FOREWORD
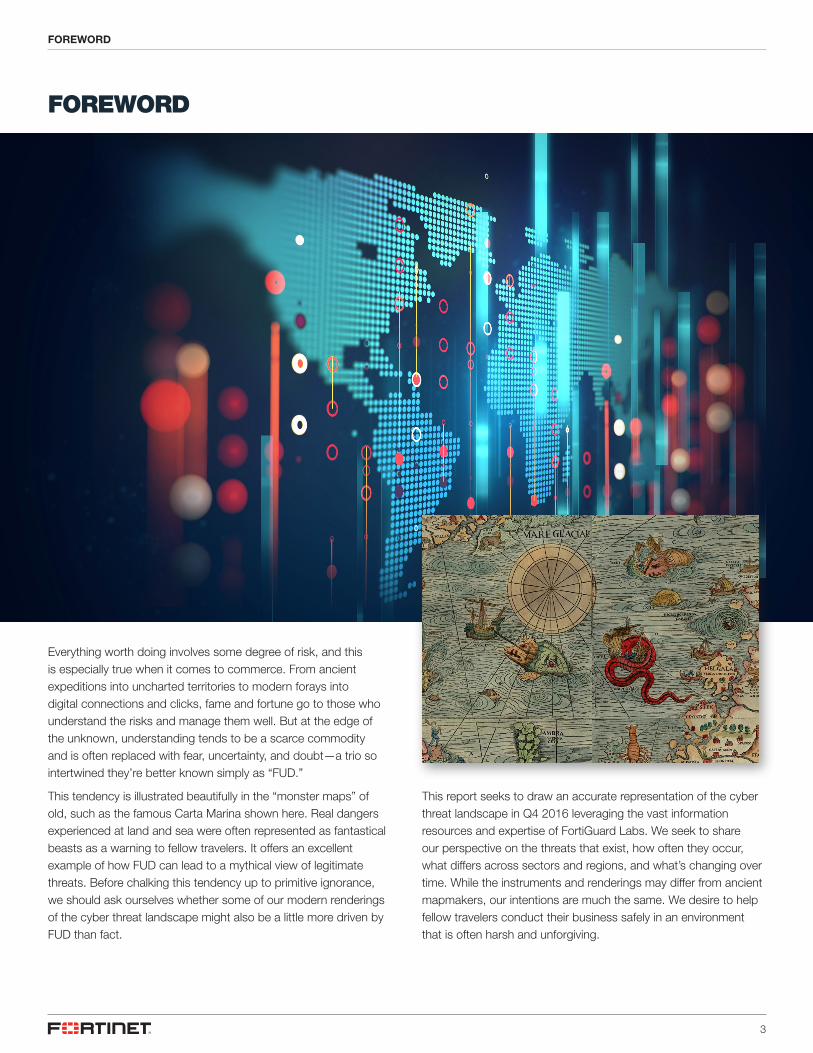
Everything worth doing involves some degree of risk, and this is especially true when it comes to commerce. From ancient expeditions into uncharted territories to modern forays into digital connections and clicks, fame and fortune go to those who understand the risks and manage them well. But at the edge of the unknown, understanding tends to be a scarce commodity and is often replaced with fear, uncertainty, and doubt—a trio so intertwined they’re better known simply as “FUD.”
This tendency is illustrated beautifully in the “monster maps” of old, such as the famous Carta Marina shown here. Real dangers experienced at land and sea were often represented as fantastical beasts as a warning to fellow travelers. It offers an excellent example of how FUD can lead to a mythical view of legitimate threats. Before chalking this tendency up to primitive ignorance, we should ask ourselves whether some of our modern renderings of the cyber threat landscape might also be a little more driven by FUD than fact.
This report seeks to draw an accurate representation of the cyber threat landscape in Q4 2016 leveraging the vast information resources and expertise of FortiGuard Labs. We seek to share our perspective on the threats that exist, how often they occur, what differs across sectors and regions, and what’s changing over time. While the instruments and renderings may differ from ancient mapmakers, our intentions are much the same. We desire to help fellow travelers conduct their business safely in an environment that is often harsh and unforgiving.
FOREWORD
4
Q4 2016 HIGHLIGHTS AND KEY FINDINGS
Q4 2016 HIGHLIGHTS & KEY FINDINGS
The last few months of 2016 had more than their fair share of storms and a few confirmed monsters as well. Here
are some highlights we spotted during Q4.
DOUBLING DOWN. Sailing into Q4 2016, the industry was reeling from a 1-2 combo of the largest data
breach and largest DDoS attack in history. Before Q4 was halfway done, both record-setting events had not
only been broken but doubled.
OH HAI, MIRAI. News that this record-setting DDoS attack used an army of everyday devices drove the
Internet of Things (IoT) security buzz to a fever pitch. Release of the source code behind it all immediately
boosted Mirai botnet activity by 25x, one of the biggest week-over-week surges we saw all quarter. And it
would climb to 5x that amount before the year was out.
FROM RUSSIA WITH LOVE. Drama surrounding the U.S. presidential “election hacking” affair continued
through Q4. We shared an analysis on campaign-themed malware and trolls back in November, so we
won’t reopen the polls on that topic in this report.
DARING EXPLOITS. We tracked an average of 10.7 unique application exploits per organization. About
nine in 10 firms detected critical or high-severity exploits.
OLD IS NEW. A full 86% of firms registered attacks attempting to exploit vulnerabilities that were
over a decade old. Almost 40% of them saw exploits against CVEs from the previous millennium.
MALWARE MAFIA. Two malware families, Nemucod and Agent, went on a crime spree in Q4. A staggering
81.4% of all malware samples captured belonged to just these two families. The Nemucod family is
infamously affiliated with ransomware.
LOCK IT UP. Outside these top families, the most prominent uptick in malware volume over the quarter was
the Locky ransomware.
RAN WHERE? Our records show that 36% of organizations detected botnet activity related to ransomware.
It was present in all regions and sectors, but we found it particularly widespread in healthcare institutions.
GOING MOBILE. Mobile malware accounted for 1.7% of all malware volume and was reported by about
one in five organizations. That’s up a fair margin from where we’ve seen it in the past.
GLOBAL MOBILE. We found substantial regional differences in mobile malware. It was observed by 36% of
African organizations, compared to only 8% in Europe.
NOT NOTHING BOTNET. We detected an average of 6.7 unique active botnet families per organization.
This was highest in the Middle East, Africa, and Latin America.
FEARS AND PEERS. Analysis into sector threat landscapes finds that it’s more about the threats than the
industry AND that it’s more about the industry than the threats. You’ll have to read the section to untangle
that paradox.
SEASONS GREED-INGS. Calendars of criminal exploit activity for the retail/hospitality and educational
sectors show interestingly different Q4 seasonal threat patterns.
Aside from that, we venture into all manner of Q4 2016 threats from global, regional, sector, and organizational
perspectives in the pages ahead.

SOURCES &MEASURES
6
SOURCES AND MEASURES
Like seafarers of yore, who used various signs and instruments to assess their position and conditions around them, we also have ways of maintaining situational awareness in our domain. The findings in this report represent the collective intelligence of FortiGuard Labs, drawn from Fortinet’s vast array of network devices/sensors within production environments. This comprises billions of threat events and incidents observed in live production environments around the world from October 1 through December 31, 2016. All data was anonymized and contains no identifiable information on any entity represented in the sample.
As one might imagine, this intelligence offers excellent views of the cyber threat landscape from many perspectives. This report focuses on three central and complementary aspects of
Exploits Application exploits described in this report were collected primarily via network IPS. This dataset offers a view into attacker reconnaissance activities to identify vulnerable systems and attempts to exploit those vulnerabilities.
Malware Malware samples described in this report were collected via perimeter devices, sandboxes, or endpoints. For the most part, this dataset represents the weaponization or delivery stages of an attack rather than successful installation in target systems.
Botnets Botnet activity described in this report was collected via network devices. This dataset represents command and control (C2) traffic between compromised internal systems and malicious external hosts.
VOLUMEMeasure of overall frequency or proportion. The total number or percentage of observations of a threat event.
PREVALENCEMeasure of spread or pervasiveness across groups. The percentage of reporting organizations1 that observed the threat event at least once.
INTENSITYMeasure of daily volume or frequency. The average number of observations of a threat event per organization per day.
SOURCES AND MEASURES
that landscape, namely application exploits, malicious software (malware), and botnets.
In addition to these different aspects of the threat landscape, we use three measures to describe and interpret what the data tells us. You’ll regularly see the terms volume, prevalence, and intensity used throughout this report, and our usage of these terms will always conform to the definitions provided here.
The figures in this report include a large number of threats. We provide brief descriptions of some, but you will undoubtedly desire more information than we’re able to supply here. Consider
FortiGuard Labs’ Encyclopedia your trusted map while navigating these pages.
1 The phrase, “of reporting organizations” is an important distinction. We can only measure prevalence among organizations reporting threat activity. So, for instance, when Figure 5 shows a prevalence of 49% for the Slammer worm, it doesn’t mean half of all firms in the world. It means 49% of firms reporting back malware events observed Slammer.
INFRASTRUCTURETRENDS
8
INFRASTRUCTURE TRENDS
Before venturing into detailed analysis of the Q4 threat landscape, it’s worth bearing in mind that all the exploits, malware, and botnets we discuss do not happen in a vacuum. We can learn a lot about adversaries by studying threats, but we also see reflections of their targets in the same data. Threats evolve over time as
applications, technologies, configurations, controls, and behaviors change (and vice versa). It makes sense, therefore, to consider infrastructure trends and how they relate to and shape the threat landscape.
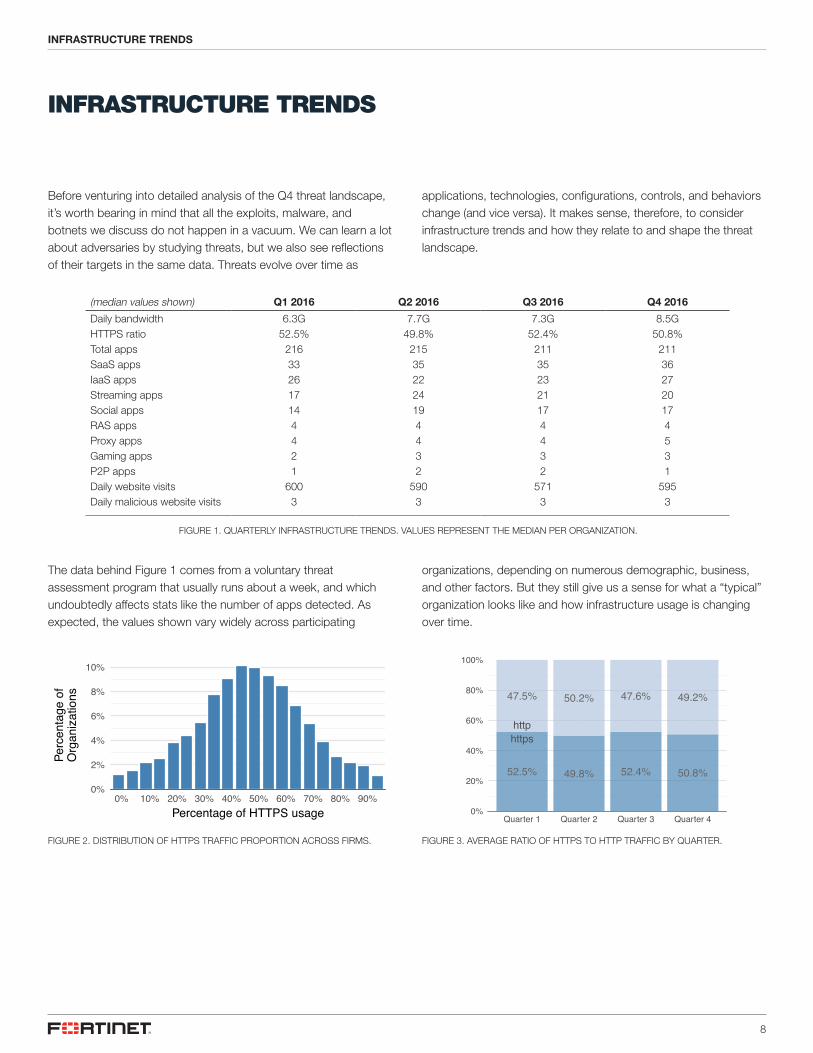
(median values shown) Q1 2016 Q2 2016 Q3 2016 Q4 2016
Daily bandwidth 6.3G 7.7G 7.3G 8.5GHTTPS ratio 52.5% 49.8% 52.4% 50.8%Total apps 216 215 211 211SaaS apps 33 35 35 36IaaS apps 26 22 23 27Streaming apps 17 24 21 20Social apps 14 19 17 17RAS apps 4 4 4 4Proxy apps 4 4 4 5Gaming apps 2 3 3 3P2P apps 1 2 2 1Daily website visits 600 590 571 595Daily malicious website visits 3 3 3 3
FIGURE 1. QUARTERLY INFRASTRUCTURE TRENDS. VALUES REPRESENT THE MEDIAN PER ORGANIZATION.
The data behind Figure 1 comes from a voluntary threat assessment program that usually runs about a week, and which undoubtedly affects stats like the number of apps detected. As expected, the values shown vary widely across participating
organizations, depending on numerous demographic, business, and other factors. But they still give us a sense for what a “typical” organization looks like and how infrastructure usage is changing over time.
0%
2%
4%
6%
8%
10%
0% 10% 20% 30% 40% 50% 60% 70% 80% 90%Percentage of HTTPS usage
Perc
enta
ge o
fO
rgan
izat
ions
FIGURE 2. DISTRIBUTION OF HTTPS TRAFFIC PROPORTION ACROSS FIRMS.
httpshttp
52.5% 49.8% 52.4% 50.8%
47.5% 50.2% 47.6% 49.2%
0%
20%
40%
60%
80%
100%
Quarter 1 Quarter 2 Quarter 3 Quarter 4
FIGURE 3. AVERAGE RATIO OF HTTPS TO HTTP TRAFFIC BY QUARTER.
INFRASTRUCTURE TRENDS
9
HTTPS traffic usage is an important trend to monitor because, while good for privacy, it presents challenges to detecting threats that often hide in encrypted communications. We expected to see a steady shift to HTTPS, but Figure 1 shows fluctuation around 50%. Figure 2 illustrates how that ratio varies across firms and is a reminder that there are some that encrypt nearly everything and some almost nothing. Such movements tend to play out over longer time periods, so we’ll continue monitoring this one.
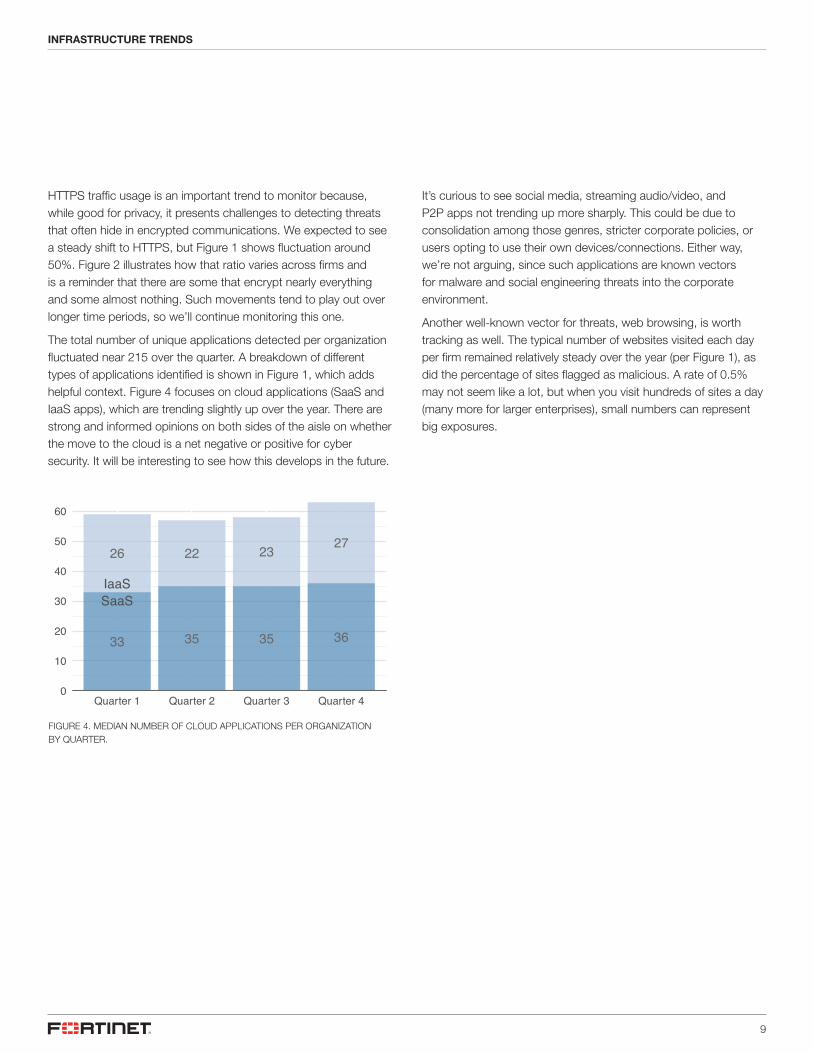
The total number of unique applications detected per organization fluctuated near 215 over the quarter. A breakdown of different types of applications identified is shown in Figure 1, which adds helpful context. Figure 4 focuses on cloud applications (SaaS and IaaS apps), which are trending slightly up over the year. There are strong and informed opinions on both sides of the aisle on whether the move to the cloud is a net negative or positive for cyber security. It will be interesting to see how this develops in the future.
SaaSIaaS
33 35 35 36
26 22 23 27
0
10
20
30
40
50
60
Quarter 1 Quarter 2 Quarter 3 Quarter 4
FIGURE 4. MEDIAN NUMBER OF CLOUD APPLICATIONS PER ORGANIZATION BY QUARTER.
It’s curious to see social media, streaming audio/video, and P2P apps not trending up more sharply. This could be due to consolidation among those genres, stricter corporate policies, or users opting to use their own devices/connections. Either way, we’re not arguing, since such applications are known vectors for malware and social engineering threats into the corporate environment.
Another well-known vector for threats, web browsing, is worth tracking as well. The typical number of websites visited each day per firm remained relatively steady over the year (per Figure 1), as did the percentage of sites flagged as malicious. A rate of 0.5% may not seem like a lot, but when you visit hundreds of sites a day (many more for larger enterprises), small numbers can represent big exposures.
INFRASTRUCTURE TRENDS
GLOBAL THREATLANDSCAPE
11
GLOBAL THREAT LANDSCAPE
EXPLOITS
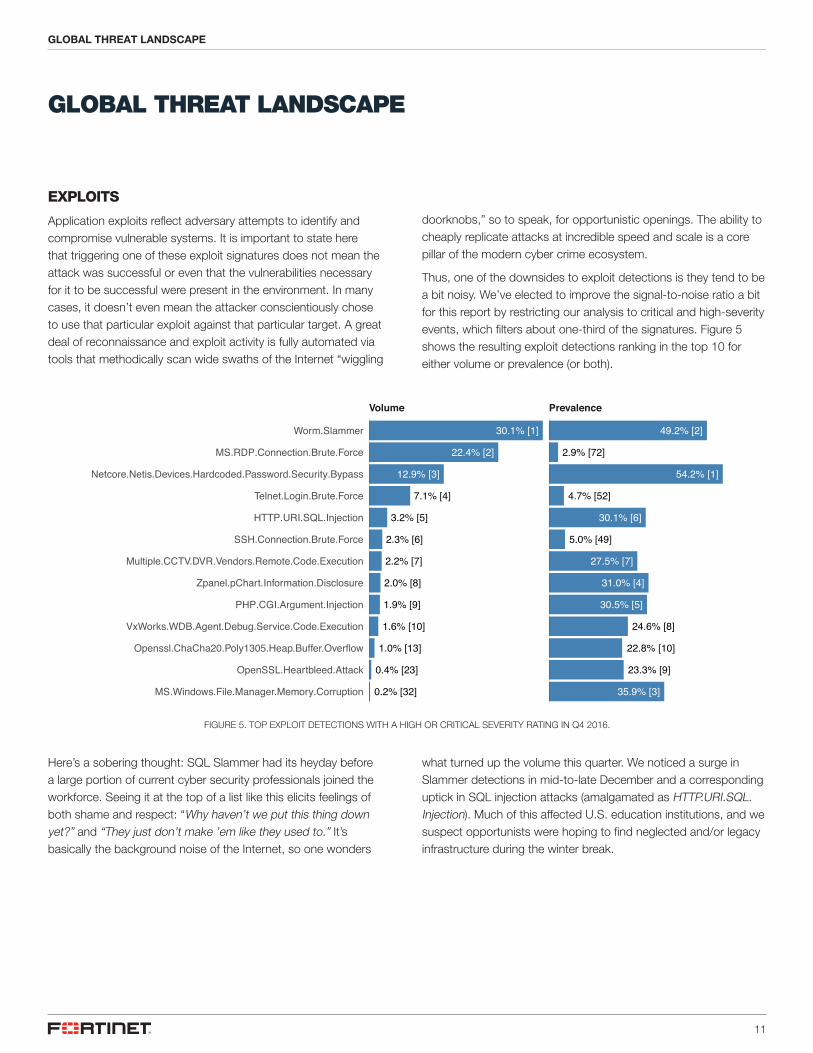
Application exploits reflect adversary attempts to identify and compromise vulnerable systems. It is important to state here that triggering one of these exploit signatures does not mean the attack was successful or even that the vulnerabilities necessary for it to be successful were present in the environment. In many cases, it doesn’t even mean the attacker conscientiously chose to use that particular exploit against that particular target. A great deal of reconnaissance and exploit activity is fully automated via tools that methodically scan wide swaths of the Internet “wiggling
FIGURE 5. TOP EXPLOIT DETECTIONS WITH A HIGH OR CRITICAL SEVERITY RATING IN Q4 2016.
doorknobs,” so to speak, for opportunistic openings. The ability to cheaply replicate attacks at incredible speed and scale is a core pillar of the modern cyber crime ecosystem.
Thus, one of the downsides to exploit detections is they tend to be a bit noisy. We’ve elected to improve the signal-to-noise ratio a bit for this report by restricting our analysis to critical and high-severity events, which filters about one-third of the signatures. Figure 5 shows the resulting exploit detections ranking in the top 10 for either volume or prevalence (or both).
30.1% [1]
22.4% [2]
12.9% [3]
7.1% [4]
3.2% [5]
2.3% [6]
2.2% [7]
2.0% [8]
1.9% [9]
1.6% [10]
1.0% [13]
0.4% [23]
0.2% [32]
49.2% [2]
2.9% [72]
54.2% [1]
4.7% [52]
30.1% [6]
5.0% [49]
27.5% [7]
31.0% [4]
30.5% [5]
24.6% [8]
22.8% [10]
23.3% [9]
35.9% [3]
Volume Prevalence
MS.Windows.File.Manager.Memory.Corruption
OpenSSL.Heartbleed.Attack
Openssl.ChaCha20.Poly1305.Heap.Buffer.Overflow
VxWorks.WDB.Agent.Debug.Service.Code.Execution
PHP.CGI.Argument.Injection
Zpanel.pChart.Information.Disclosure
Multiple.CCTV.DVR.Vendors.Remote.Code.Execution
SSH.Connection.Brute.Force
HTTP.URI.SQL.Injection
Telnet.Login.Brute.Force
Netcore.Netis.Devices.Hardcoded.Password.Security.Bypass
MS.RDP.Connection.Brute.Force
Worm.Slammer
Here’s a sobering thought: SQL Slammer had its heyday before a large portion of current cyber security professionals joined the workforce. Seeing it at the top of a list like this elicits feelings of both shame and respect: “Why haven’t we put this thing down yet?” and “They just don’t make ’em like they used to.” It’s basically the background noise of the Internet, so one wonders
what turned up the volume this quarter. We noticed a surge in Slammer detections in mid-to-late December and a corresponding uptick in SQL injection attacks (amalgamated as HTTP.URI.SQL.Injection). Much of this affected U.S. education institutions, and we suspect opportunists were hoping to find neglected and/or legacy infrastructure during the winter break.
GLOBAL THREAT LANDSCAPE
12
Ranking #2 in volume but last in prevalence is an exploit indicating attempted brute force attacks on Microsoft Remote Desktop Protocol (RDP). It launches RDP requests at a rate of 200 times every 10 seconds, which explains the high volume. Reversing the scale at #3 in prevalence but last in volume is a signature tied to a Memory Corruption vulnerability in Windows File Manager that allows a remote attacker to execute arbitrary code within vulnerable applications via a crafted jpg file.
Also worthy of mention due to its high ranking in both volume and prevalence is the detection of a Security Bypass vulnerability in Netcore/Netis devices. This is due to a single, hard-coded password in the router’s firmware, which attackers can compromise by sending a special request to a specified UDP port. This signature has been incorporated into various vulnerability scanners with widespread usage. We suspect the numerous triggers for this exploit relate to the huge DDoS attacks against KrebsOnSecurity.com (September) and Dyn (October) that were conducted on the backs of compromised IoT and other devices. Attackers are likely looking to build their own armies of “things,” and we don’t see this trend slowing down anytime soon. See the Mini Focus below for more on the topic of IoT.
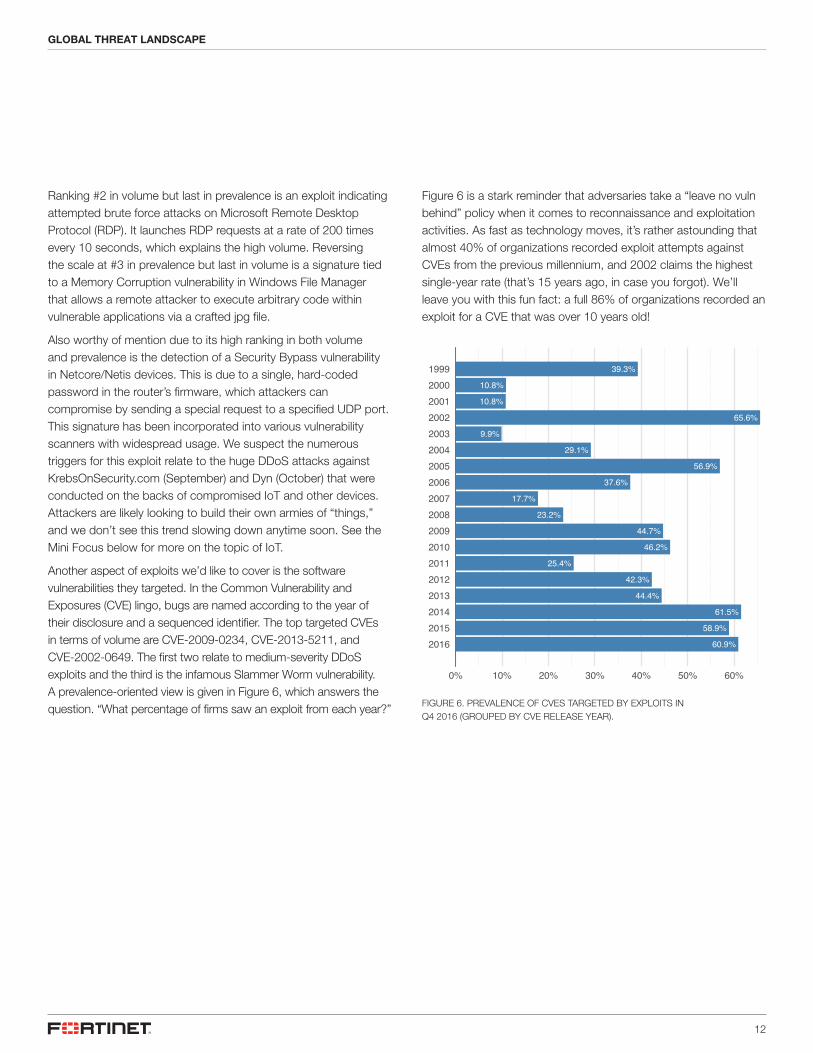
Another aspect of exploits we’d like to cover is the software vulnerabilities they targeted. In the Common Vulnerability and Exposures (CVE) lingo, bugs are named according to the year of their disclosure and a sequenced identifier. The top targeted CVEs in terms of volume are CVE-2009-0234, CVE-2013-5211, and CVE-2002-0649. The first two relate to medium-severity DDoS exploits and the third is the infamous Slammer Worm vulnerability. A prevalence-oriented view is given in Figure 6, which answers the question. “What percentage of firms saw an exploit from each year?”
Figure 6 is a stark reminder that adversaries take a “leave no vuln behind” policy when it comes to reconnaissance and exploitation activities. As fast as technology moves, it’s rather astounding that almost 40% of organizations recorded exploit attempts against CVEs from the previous millennium, and 2002 claims the highest single-year rate (that’s 15 years ago, in case you forgot). We’ll leave you with this fun fact: a full 86% of organizations recorded an exploit for a CVE that was over 10 years old!
39.3%
10.8%
10.8%
65.6%
9.9%
29.1%
56.9%
37.6%
17.7%
23.2%
44.7%
46.2%
25.4%
42.3%
44.4%
61.5%
58.9%
60.9%
199920002001200220032004200520062007200820092010201120122013201420152016
0% 10% 20% 30% 40% 50% 60%
FIGURE 6. PREVALENCE OF CVES TARGETED BY EXPLOITS IN Q4 2016 (GROUPED BY CVE RELEASE YEAR).
GLOBAL THREAT LANDSCAPE
13
MINI FOUCS: IoT
MINI FOCUS: IoT
When the TV series Battlestar Galactica gave the nickname
“toasters” to the evil Cylon civilization, who knew that armies of
everyday appliances would become a real thing in the real world?
While we haven’t yet seen the first toaster attack, home DVRs,
cameras, printers, and routers have definitely begun to rise up
against us as part of the collective of connected devices known as
the Internet of Things (IoT).
While the thought of strangers hacking into your home security
camera is certainly unnerving, there’s another aspect to IoT
security that affects individuals and organizations outside your
10
100
1k
10k
100k
1m
10m
100m
1b
AUG SEP OCT NOV DEC JAN
VOLU
ME
RouterTelephony DVR/NVR Printer IP Camera NAS
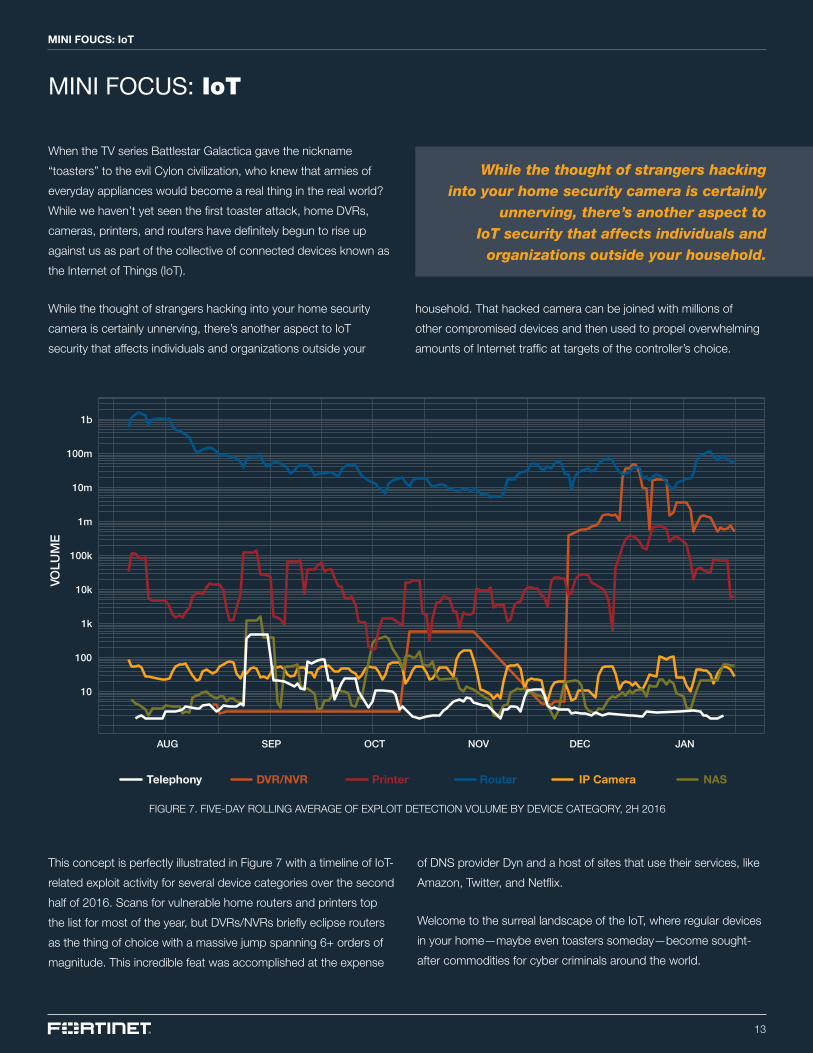
This concept is perfectly illustrated in Figure 7 with a timeline of IoT-
related exploit activity for several device categories over the second
half of 2016. Scans for vulnerable home routers and printers top
the list for most of the year, but DVRs/NVRs briefly eclipse routers
as the thing of choice with a massive jump spanning 6+ orders of
magnitude. This incredible feat was accomplished at the expense
FIGURE 7. FIVE-DAY ROLLING AVERAGE OF EXPLOIT DETECTION VOLUME BY DEVICE CATEGORY, 2H 2016
While the thought of strangers hacking into your home security camera is certainly
unnerving, there’s another aspect to IoT security that affects individuals and
organizations outside your household.
of DNS provider Dyn and a host of sites that use their services, like
Amazon, Twitter, and Netflix.
Welcome to the surreal landscape of the IoT, where regular devices
in your home—maybe even toasters someday—become sought-
after commodities for cyber criminals around the world.
household. That hacked camera can be joined with millions of
other compromised devices and then used to propel overwhelming
amounts of Internet traffic at targets of the controller’s choice.
14
MALWARE
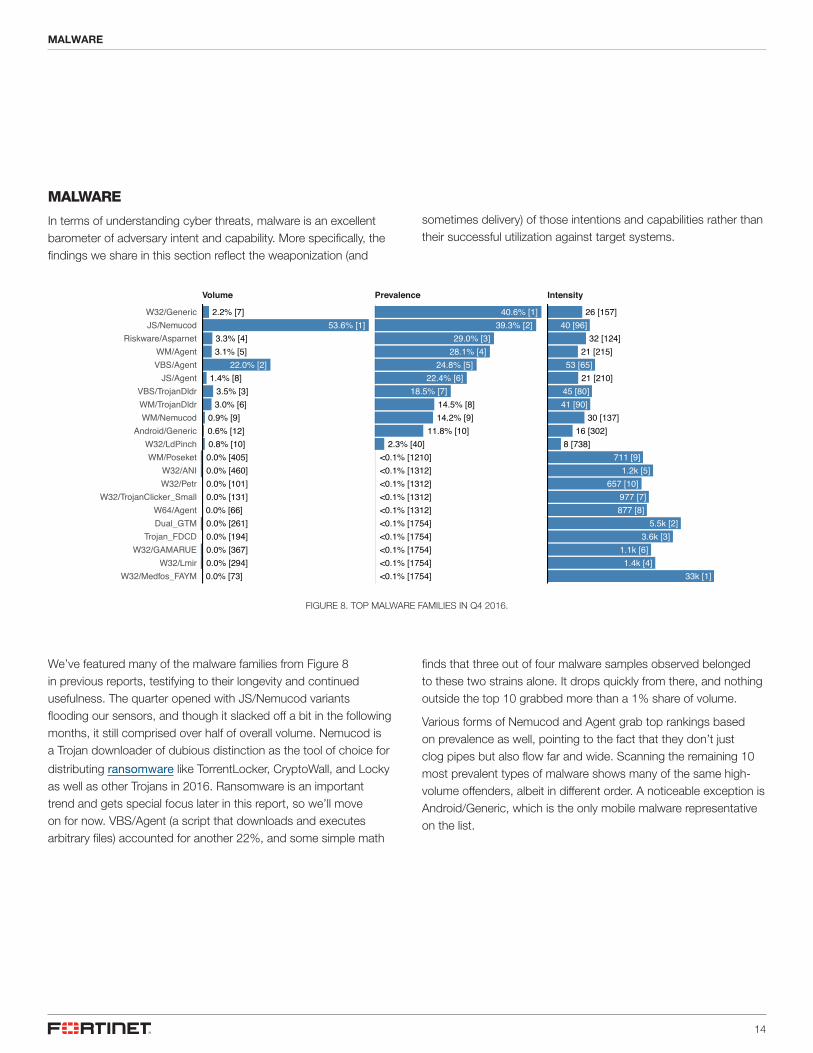
In terms of understanding cyber threats, malware is an excellent barometer of adversary intent and capability. More specifically, the findings we share in this section reflect the weaponization (and
FIGURE 8. TOP MALWARE FAMILIES IN Q4 2016.
sometimes delivery) of those intentions and capabilities rather than their successful utilization against target systems.
We’ve featured many of the malware families from Figure 8 in previous reports, testifying to their longevity and continued usefulness. The quarter opened with JS/Nemucod variants flooding our sensors, and though it slacked off a bit in the following months, it still comprised over half of overall volume. Nemucod is a Trojan downloader of dubious distinction as the tool of choice for
distributing ransomware like TorrentLocker, CryptoWall, and Locky as well as other Trojans in 2016. Ransomware is an important trend and gets special focus later in this report, so we’ll move on for now. VBS/Agent (a script that downloads and executes arbitrary files) accounted for another 22%, and some simple math
finds that three out of four malware samples observed belonged to these two strains alone. It drops quickly from there, and nothing outside the top 10 grabbed more than a 1% share of volume.
Various forms of Nemucod and Agent grab top rankings based on prevalence as well, pointing to the fact that they don’t just clog pipes but also flow far and wide. Scanning the remaining 10 most prevalent types of malware shows many of the same high-volume offenders, albeit in different order. A noticeable exception is Android/Generic, which is the only mobile malware representative on the list.
2.2% [7]53.6% [1]
3.3% [4]3.1% [5]
22.0% [2]1.4% [8]
3.5% [3]3.0% [6]
0.9% [9]0.6% [12]0.8% [10]0.0% [405]0.0% [460]0.0% [101]0.0% [131]0.0% [66]0.0% [261]0.0% [194]0.0% [367]0.0% [294]0.0% [73]
40.6% [1]39.3% [2]
29.0% [3]28.1% [4]
24.8% [5]22.4% [6]
18.5% [7]14.5% [8]14.2% [9]
11.8% [10]2.3% [40]
<0.1% [1210]<0.1% [1312]<0.1% [1312]<0.1% [1312]<0.1% [1312]<0.1% [1754]<0.1% [1754]<0.1% [1754]<0.1% [1754]<0.1% [1754]
26 [157]40 [96]
32 [124]21 [215]
53 [65]21 [210]
45 [80]41 [90]
30 [137]16 [302]
8 [738]711 [9]
1.2k [5]657 [10]
977 [7]877 [8]
5.5k [2]3.6k [3]
1.1k [6]1.4k [4]
33k [1]
Volume Prevalence Intensity
W32/Medfos_FAYMW32/Lmir
W32/GAMARUETrojan_FDCD
Dual_GTMW64/Agent
W32/TrojanClicker_SmallW32/PetrW32/ANI
WM/PoseketW32/LdPinch
Android/GenericWM/NemucodWM/TrojanDldrVBS/TrojanDldr
JS/AgentVBS/AgentWM/Agent
Riskware/AsparnetJS/NemucodW32/Generic
MALWARE
15
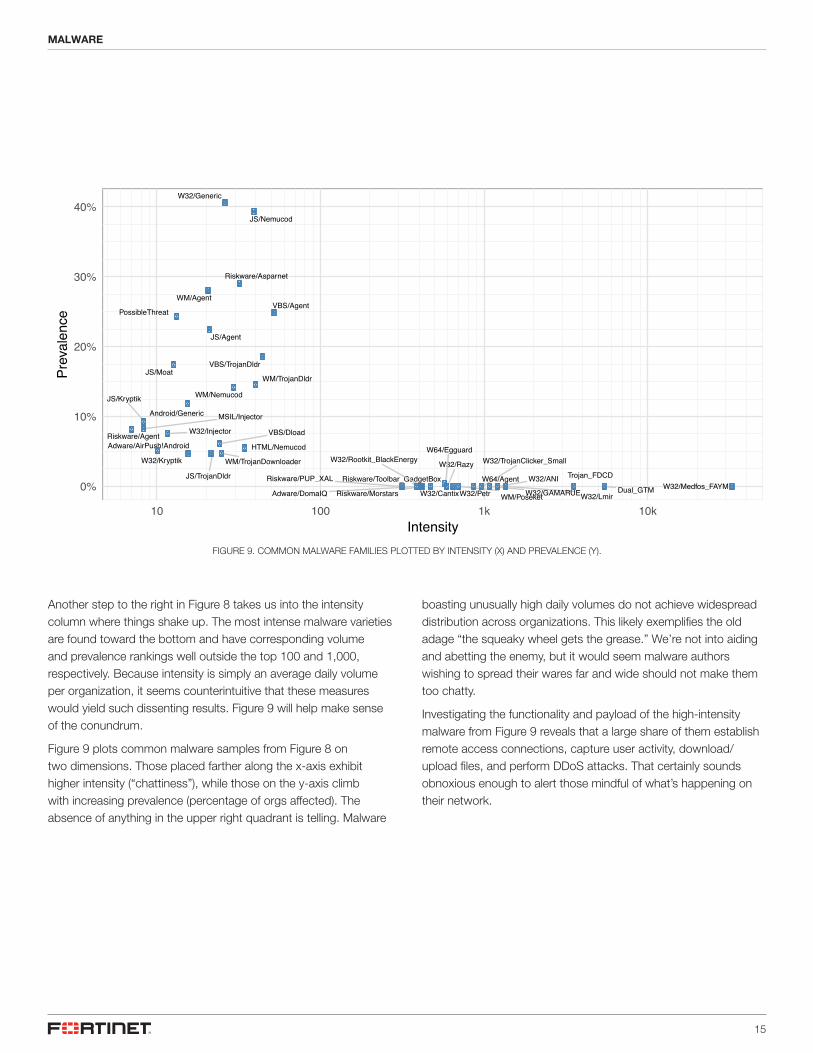
FIGURE 9. COMMON MALWARE FAMILIES PLOTTED BY INTENSITY (X) AND PREVALENCE (Y).
Another step to the right in Figure 8 takes us into the intensity column where things shake up. The most intense malware varieties are found toward the bottom and have corresponding volume and prevalence rankings well outside the top 100 and 1,000, respectively. Because intensity is simply an average daily volume per organization, it seems counterintuitive that these measures would yield such dissenting results. Figure 9 will help make sense of the conundrum.
Figure 9 plots common malware samples from Figure 8 on two dimensions. Those placed farther along the x-axis exhibit higher intensity (“chattiness”), while those on the y-axis climb with increasing prevalence (percentage of orgs affected). The absence of anything in the upper right quadrant is telling. Malware
boasting unusually high daily volumes do not achieve widespread distribution across organizations. This likely exemplifies the old adage “the squeaky wheel gets the grease.” We’re not into aiding and abetting the enemy, but it would seem malware authors wishing to spread their wares far and wide should not make them too chatty.
Investigating the functionality and payload of the high-intensity malware from Figure 9 reveals that a large share of them establish remote access connections, capture user activity, download/upload files, and perform DDoS attacks. That certainly sounds obnoxious enough to alert those mindful of what’s happening on their network.
Adware/AirPush!Android
Adware/DomaIQ
Android/Generic
Dual_GTM
HTML/Nemucod
JS/Agent
JS/Kryptik
JS/Moat
JS/Nemucod
JS/TrojanDldr
MSIL/Injector
PossibleThreat
Riskware/Agent
Riskware/Asparnet
Riskware/Morstars
Riskware/PUP_XAL Riskware/Toolbar_GadgetBox Trojan_FDCD
VBS/Agent
VBS/Dload
VBS/TrojanDldr
W32/ANI
W32/Cantix
W32/Generic
W32/Injector
W32/Kryptik
W32/LmirW32/Medfos_FAYM
W32/Petr
W32/RazyW32/Rootkit_BlackEnergy W32/TrojanClicker_Small
W64/Agent
W64/Egguard
WM/Agent
WM/Nemucod
WM/Poseket
WM/TrojanDldr
WM/TrojanDownloader�
�
�
�
�
�
�
�
�
�
�
�
�
�
�� � �
�
�
�
�� �
�
�
�
� ���� ���
�
�
�
�
�
W32/GAMARUE0%
10%
20%
30%
40%
10 100 1k 10kIntensity
Prev
alen
ceMALWARE
16
MINI FOCUS: MOBILE MALWARE
2 http://www .pewglobal .org/2016/02/22/smartphone-ownership-and-internet-usage-continues-to-climb-in-emerging-economies/
MINI FOCUS: MOBILE MALWARE
Mobile malware is not a new topic for either security vendors or
practitioners. It has made various “top concerns” lists for years,
which has helped to breed several different types of solutions
aimed at different aspects of the problem. But there has been
debate about how big that problem really is and whether it’s more a
platform issue than a mobile one. We’ll leave the debating to others
and simply stick to sharing some data.
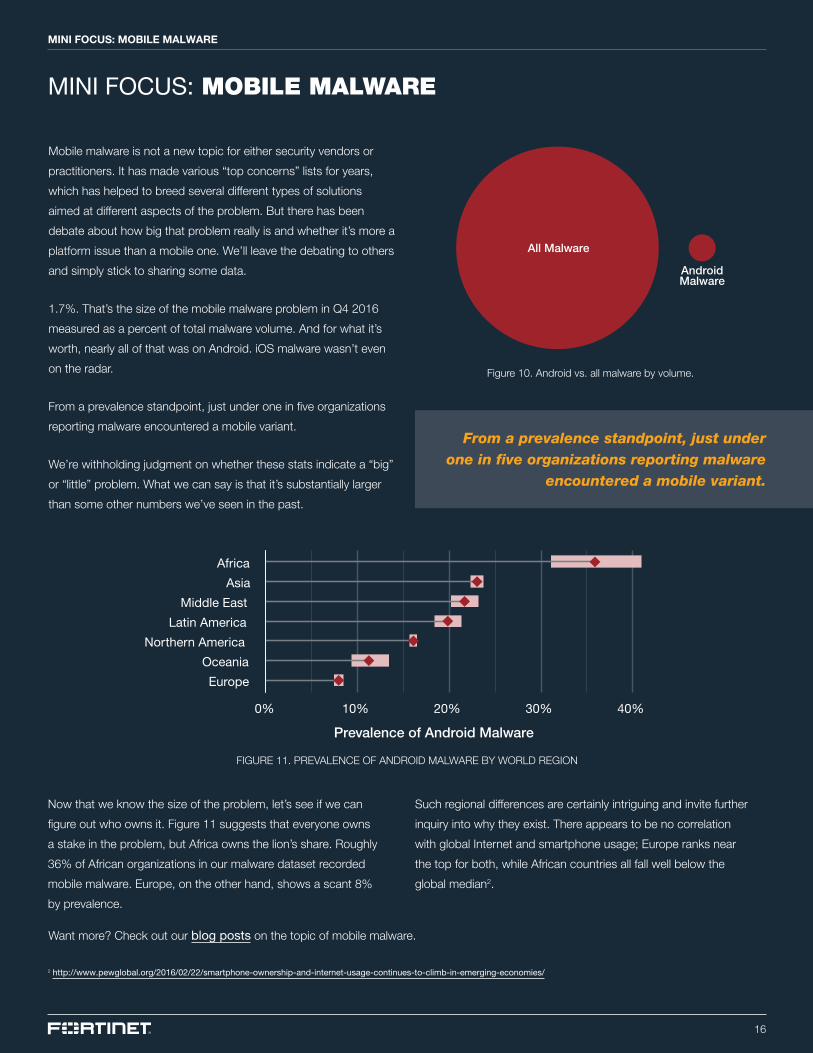
1.7%. That’s the size of the mobile malware problem in Q4 2016
measured as a percent of total malware volume. And for what it’s
worth, nearly all of that was on Android. iOS malware wasn’t even
on the radar.
From a prevalence standpoint, just under one in five organizations
reporting malware encountered a mobile variant.
We’re withholding judgment on whether these stats indicate a “big”
or “little” problem. What we can say is that it’s substantially larger
than some other numbers we’ve seen in the past.
FIGURE 11. PREVALENCE OF ANDROID MALWARE BY WORLD REGION
Figure 10. Android vs. all malware by volume.
All Malware
AndroidMalware
Europe
Oceania
Northern America
Latin America
Middle East
Asia
Africa
0% 10% 20% 30% 40%
Prevalence of Android Malware
Now that we know the size of the problem, let’s see if we can
figure out who owns it. Figure 11 suggests that everyone owns
a stake in the problem, but Africa owns the lion’s share. Roughly
36% of African organizations in our malware dataset recorded
mobile malware. Europe, on the other hand, shows a scant 8%
by prevalence.
Such regional differences are certainly intriguing and invite further
inquiry into why they exist. There appears to be no correlation
with global Internet and smartphone usage; Europe ranks near
the top for both, while African countries all fall well below the
global median2.
Want more? Check out our blog posts on the topic of mobile malware.
From a prevalence standpoint, just under one in five organizations reporting malware
encountered a mobile variant.
17
BOTNETS
Whereas malware and exploit data typically provide a pre-compromise view of the threat landscape, botnet traffic lets us cross over into post-compromise territory. Whether a compromised host is phoning home, downloading piggyback malware, or receiving instructions from its owner, active botnets in a corporate environment mean something went wrong. And for that reason, this dataset is a great indicator of threats that represent a hit for adversaries and a miss for defenders.
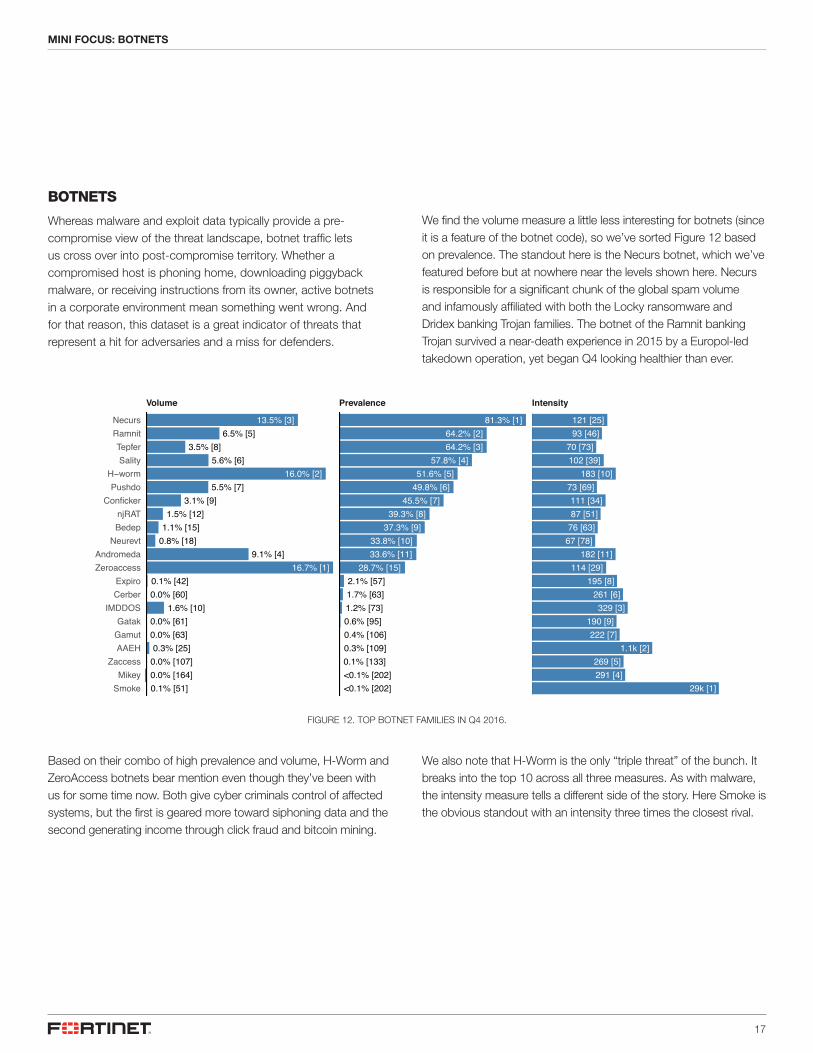
FIGURE 12. TOP BOTNET FAMILIES IN Q4 2016.
We find the volume measure a little less interesting for botnets (since it is a feature of the botnet code), so we’ve sorted Figure 12 based on prevalence. The standout here is the Necurs botnet, which we’ve featured before but at nowhere near the levels shown here. Necurs is responsible for a significant chunk of the global spam volume and infamously affiliated with both the Locky ransomware and Dridex banking Trojan families. The botnet of the Ramnit banking Trojan survived a near-death experience in 2015 by a Europol-led takedown operation, yet began Q4 looking healthier than ever.
13.5% [3]6.5% [5]
3.5% [8]5.6% [6]
16.0% [2]5.5% [7]
3.1% [9]1.5% [12]
1.1% [15]0.8% [18]
9.1% [4]16.7% [1]
0.1% [42]0.0% [60]
1.6% [10]0.0% [61]0.0% [63]0.3% [25]
0.0% [107]0.0% [164]0.1% [51]
81.3% [1]64.2% [2]64.2% [3]
57.8% [4]51.6% [5]
49.8% [6]45.5% [7]
39.3% [8]37.3% [9]
33.8% [10]33.6% [11]
28.7% [15]2.1% [57]1.7% [63]1.2% [73]0.6% [95]0.4% [106]0.3% [109]0.1% [133]<0.1% [202]<0.1% [202]
121 [25]93 [46]
70 [73]102 [39]
183 [10]73 [69]111 [34]87 [51]
76 [63]67 [78]
182 [11]114 [29]
195 [8]261 [6]329 [3]
190 [9]222 [7]
1.1k [2]269 [5]291 [4]
29k [1]
Volume Prevalence Intensity
SmokeMikey
ZaccessAAEHGamutGatak
IMDDOSCerberExpiro
ZeroaccessAndromeda
NeurevtBedepnjRAT
ConfickerPushdoH−worm
SalityTepfer
RamnitNecurs
Based on their combo of high prevalence and volume, H-Worm and ZeroAccess botnets bear mention even though they’ve been with us for some time now. Both give cyber criminals control of affected systems, but the first is geared more toward siphoning data and the second generating income through click fraud and bitcoin mining.
We also note that H-Worm is the only “triple threat” of the bunch. It breaks into the top 10 across all three measures. As with malware, the intensity measure tells a different side of the story. Here Smoke is the obvious standout with an intensity three times the closest rival.
MINI FOCUS: BOTNETS
18
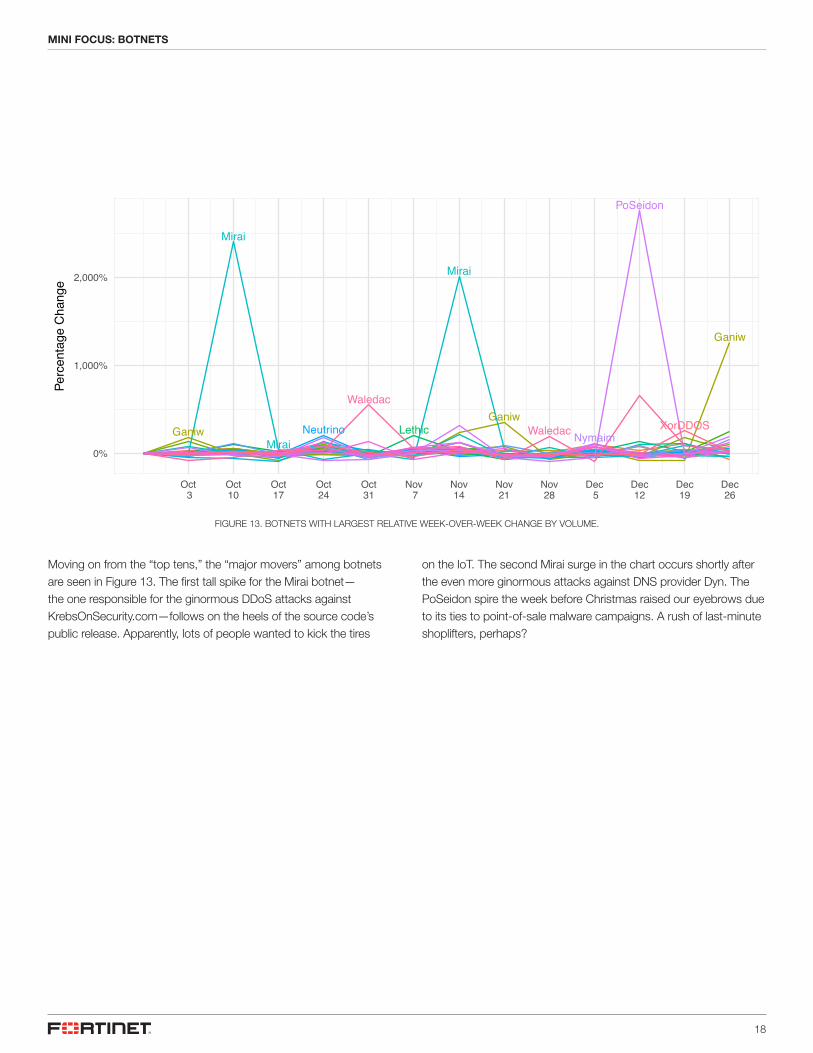
FIGURE 13. BOTNETS WITH LARGEST RELATIVE WEEK-OVER-WEEK CHANGE BY VOLUME.
Moving on from the “top tens,” the “major movers” among botnets are seen in Figure 13. The first tall spike for the Mirai botnet—the one responsible for the ginormous DDoS attacks against KrebsOnSecurity.com—follows on the heels of the source code’s public release. Apparently, lots of people wanted to kick the tires
on the IoT. The second Mirai surge in the chart occurs shortly after the even more ginormous attacks against DNS provider Dyn. The PoSeidon spire the week before Christmas raised our eyebrows due to its ties to point-of-sale malware campaigns. A rush of last-minute shoplifters, perhaps?
GaniwGaniw
Ganiw
Lethic
Mirai
Mirai
Mirai
Neutrino Nymaim
PoSeidon
Waledac
Waledac XorDDOS
0%
1,000%
2,000%
Oct 3
Oct10
Oct17
Oct24
Oct31
Nov 7
Nov14
Nov21
Nov28
Dec 5
Dec12
Dec19
Dec26
Perc
enta
ge C
hang
eMINI FOCUS: BOTNETS
19
MINI FOCUS: RANSOMWARE
3 One distinctive feature of the Locky ransomware family is that it uses filename extensions borrowed from Norse, and later, Egyptian, mythology (e.g., .aesir).
4 https://media .scmagazine .com/documents/258/bitsight_insights_-_the_rising_64469 .pdf
MINI FOCUS: RANSOMWARE
It’s no secret that ransomware ran somewhere in Q4 2016, but have
you ever wondered exactly where it ran? If so, this mini focus will
bring you up to speed.
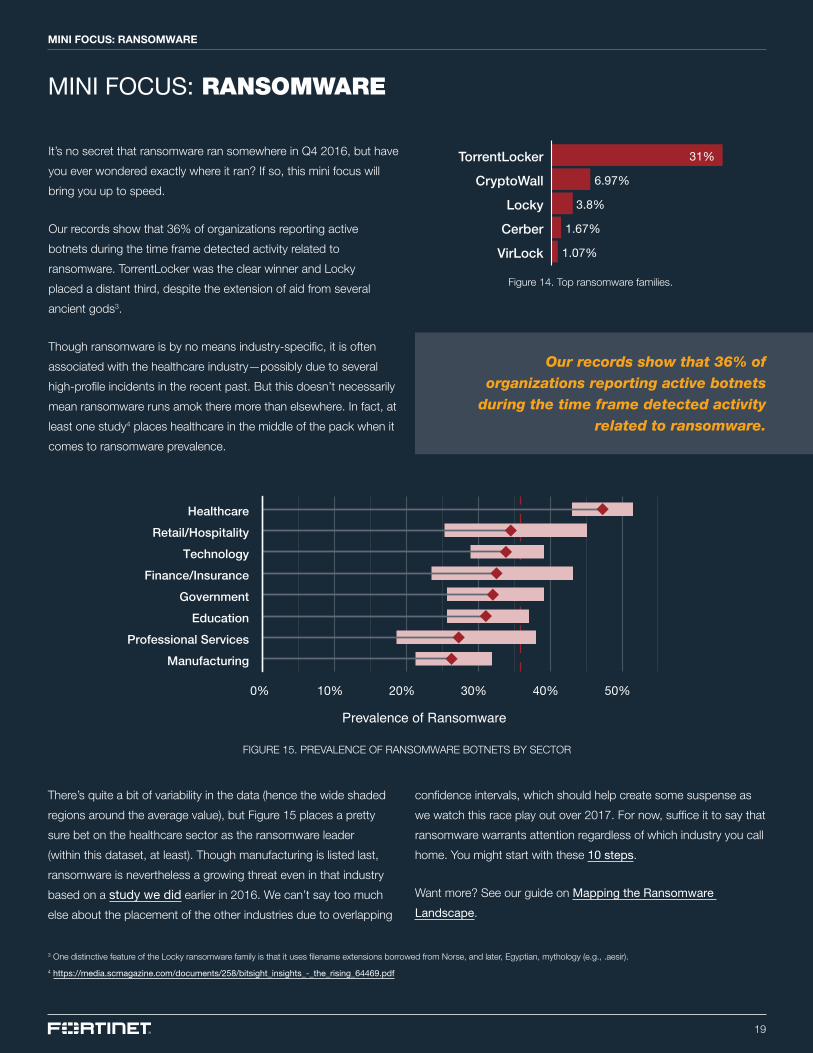
Our records show that 36% of organizations reporting active
botnets during the time frame detected activity related to
ransomware. TorrentLocker was the clear winner and Locky
placed a distant third, despite the extension of aid from several
ancient gods3.
Though ransomware is by no means industry-specific, it is often
associated with the healthcare industry—possibly due to several
high-profile incidents in the recent past. But this doesn’t necessarily
mean ransomware runs amok there more than elsewhere. In fact, at
least one study4 places healthcare in the middle of the pack when it
comes to ransomware prevalence.
There’s quite a bit of variability in the data (hence the wide shaded
regions around the average value), but Figure 15 places a pretty
sure bet on the healthcare sector as the ransomware leader
(within this dataset, at least). Though manufacturing is listed last,
ransomware is nevertheless a growing threat even in that industry
based on a study we did earlier in 2016. We can’t say too much
else about the placement of the other industries due to overlapping
FIGURE 15. PREVALENCE OF RANSOMWARE BOTNETS BY SECTOR
Figure 14. Top ransomware families.
31%
6.97%
3.8%
1.67%
1.07%VirLock
Cerber
Locky
CryptoWall
TorrentLocker
Manufacturing
Professional Services
Education
Government
Finance/Insurance
Technology
Retail/Hospitality
Healthcare
0% 10% 20% 30% 40% 50%
Prevalence of Ransomware
confidence intervals, which should help create some suspense as
we watch this race play out over 2017. For now, suffice it to say that
ransomware warrants attention regardless of which industry you call
home. You might start with these 10 steps.
Want more? See our guide on Mapping the Ransomware
Landscape.
Our records show that 36% of organizations reporting active botnets
during the time frame detected activity related to ransomware.
REGIONAL THREATLANDSCAPES
21
REGIONAL THREAT LANDSCAPES
To this point, we’ve taken a global perspective in examining the cyber threat landscape in Q4 2016. While this gives an accurate overall view of threats during the period, what was actually observed undoubtedly varies across different vantage points around the globe. This section seeks to remedy that by highlighting a few regional comparisons.
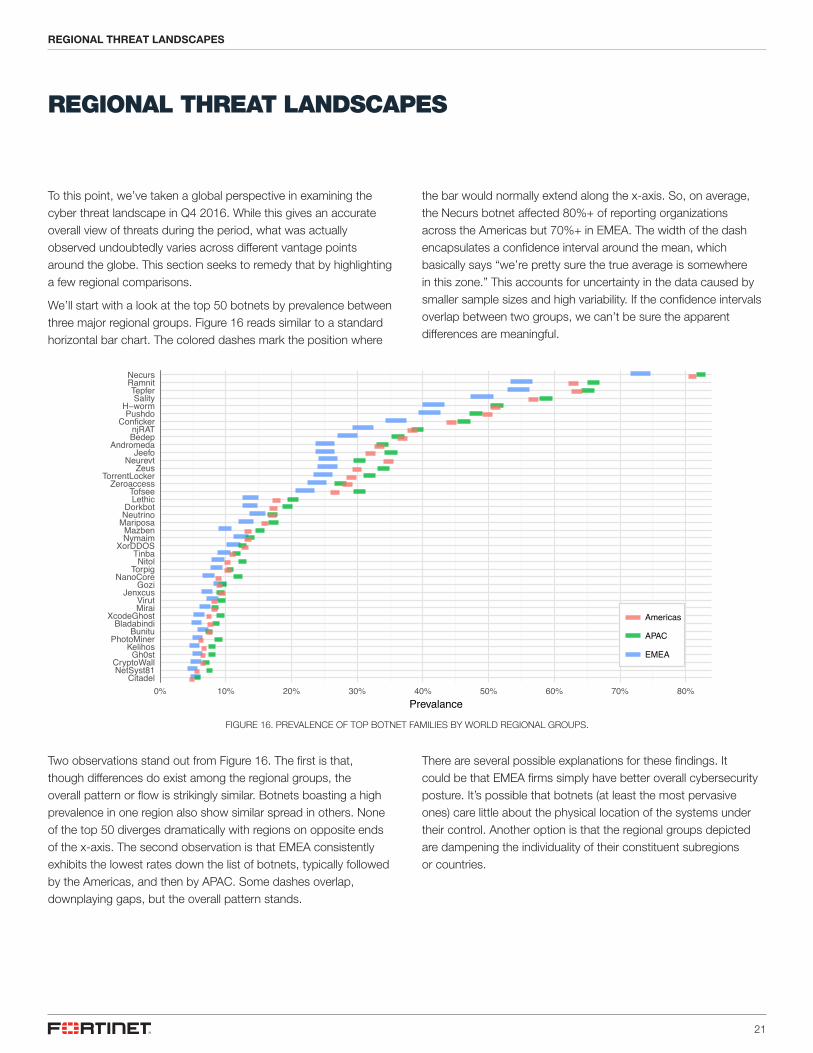
We’ll start with a look at the top 50 botnets by prevalence between three major regional groups. Figure 16 reads similar to a standard horizontal bar chart. The colored dashes mark the position where
FIGURE 16. PREVALENCE OF TOP BOTNET FAMILIES BY WORLD REGIONAL GROUPS.
the bar would normally extend along the x-axis. So, on average, the Necurs botnet affected 80%+ of reporting organizations across the Americas but 70%+ in EMEA. The width of the dash encapsulates a confidence interval around the mean, which basically says “we’re pretty sure the true average is somewhere in this zone.” This accounts for uncertainty in the data caused by smaller sample sizes and high variability. If the confidence intervals overlap between two groups, we can’t be sure the apparent differences are meaningful.
Two observations stand out from Figure 16. The first is that, though differences do exist among the regional groups, the overall pattern or flow is strikingly similar. Botnets boasting a high prevalence in one region also show similar spread in others. None of the top 50 diverges dramatically with regions on opposite ends of the x-axis. The second observation is that EMEA consistently exhibits the lowest rates down the list of botnets, typically followed by the Americas, and then by APAC. Some dashes overlap, downplaying gaps, but the overall pattern stands.
There are several possible explanations for these findings. It could be that EMEA firms simply have better overall cybersecurity posture. It’s possible that botnets (at least the most pervasive ones) care little about the physical location of the systems under their control. Another option is that the regional groups depicted are dampening the individuality of their constituent subregions or countries.
CitadelNetSyst81CryptoWall
Gh0stKelihos
PhotoMinerBunitu
BladabindiXcodeGhost
MiraiVirut
JenxcusGozi
NanoCoreTorpig
NitolTinba
XorDDOSNymaimMazben
MariposaNeutrinoDorkbot
LethicTofsee
ZeroaccessTorrentLocker
ZeusNeurevt
JeefoAndromeda
BedepnjRAT
ConfickerPushdoH−worm
SalityTepfer
RamnitNecurs
0% 10% 20% 30% 40% 50% 60% 70% 80%Prevalance
Americas
APAC
EMEA
REGIONAL THREAT LANDSCAPES
22
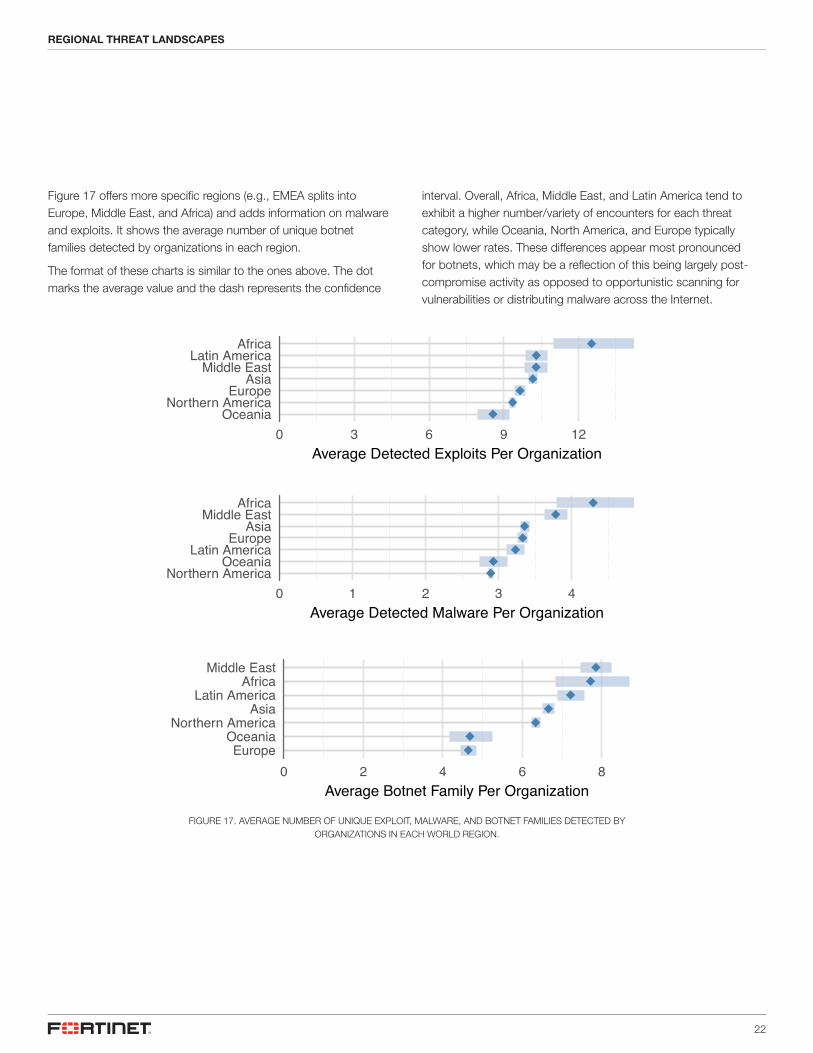
Figure 17 offers more specific regions (e.g., EMEA splits into Europe, Middle East, and Africa) and adds information on malware and exploits. It shows the average number of unique botnet families detected by organizations in each region.
The format of these charts is similar to the ones above. The dot marks the average value and the dash represents the confidence
OceaniaNorthern America
EuropeAsia
Middle EastLatin America
Africa
0 3 6 9 12Average Detected Exploits Per Organization
Northern AmericaOceania
Latin AmericaEurope
AsiaMiddle East
Africa
0 1 2 3 4Average Detected Malware Per Organization
EuropeOceania
Northern AmericaAsia
Latin AmericaAfrica
Middle East
0 2 4 6 8Average Botnet Family Per Organization
FIGURE 17. AVERAGE NUMBER OF UNIQUE EXPLOIT, MALWARE, AND BOTNET FAMILIES DETECTED BY ORGANIZATIONS IN EACH WORLD REGION.
interval. Overall, Africa, Middle East, and Latin America tend to exhibit a higher number/variety of encounters for each threat category, while Oceania, North America, and Europe typically show lower rates. These differences appear most pronounced for botnets, which may be a reflection of this being largely post-compromise activity as opposed to opportunistic scanning for vulnerabilities or distributing malware across the Internet.
REGIONAL THREAT LANDSCAPES
INDUSTRY THREATLANDSCAPES
24
INDUSTRY THREAT LANDSCAPES
Industry roundtables. Peer comparisons. Intelligence-sharing consortia. Sector-based regulations. A great deal of cyber security focus and effort is predicated upon the belief that different industries have different threat profiles that necessitate different—or at least tailored—defensive strategies. And there’s pretty good evidence out there supporting that these differences do indeed exist. However, enumerating what those differences are, understanding why they exist, and deciding how to adjust policy and practice accordingly remain among the security field’s core challenges.
In approaching our analysis of industry threat landscapes, there are a hundred different angles we could take and a hundred different options for each of those. We’re going to pick two for now that
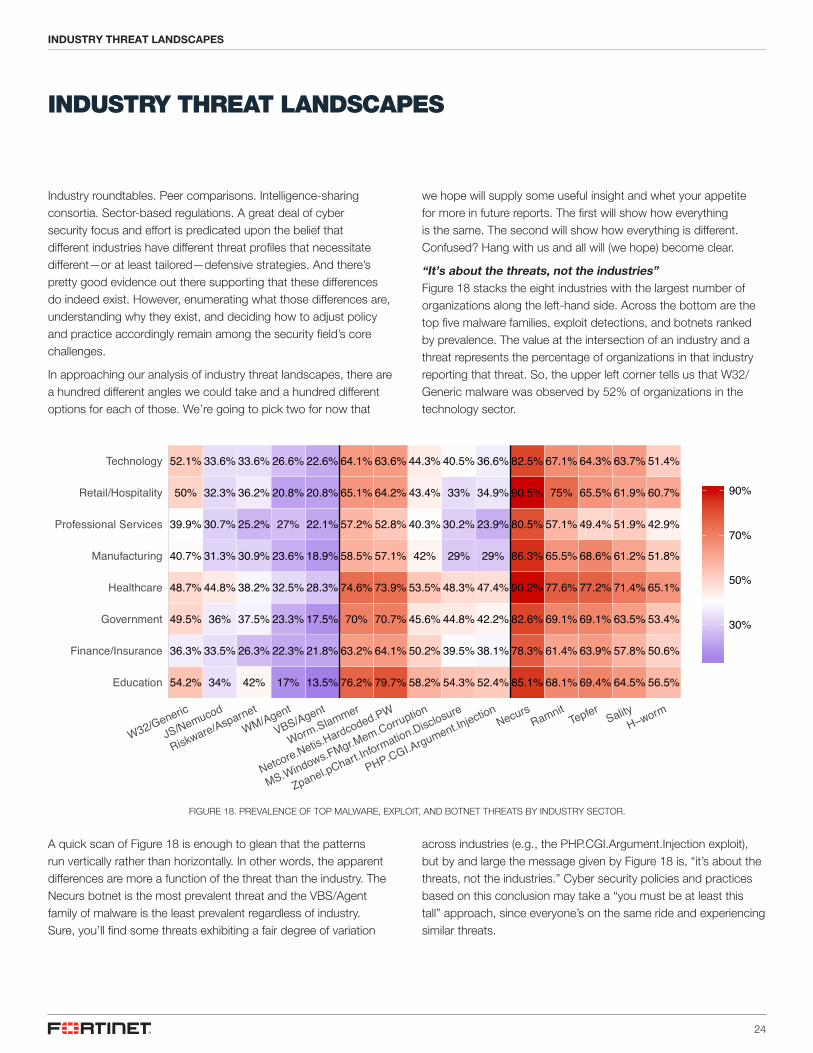
FIGURE 18. PREVALENCE OF TOP MALWARE, EXPLOIT, AND BOTNET THREATS BY INDUSTRY SECTOR.
we hope will supply some useful insight and whet your appetite for more in future reports. The first will show how everything is the same. The second will show how everything is different. Confused? Hang with us and all will (we hope) become clear.
“It’s about the threats, not the industries” Figure 18 stacks the eight industries with the largest number of organizations along the left-hand side. Across the bottom are the top five malware families, exploit detections, and botnets ranked by prevalence. The value at the intersection of an industry and a threat represents the percentage of organizations in that industry reporting that threat. So, the upper left corner tells us that W32/Generic malware was observed by 52% of organizations in the technology sector.
A quick scan of Figure 18 is enough to glean that the patterns run vertically rather than horizontally. In other words, the apparent differences are more a function of the threat than the industry. The Necurs botnet is the most prevalent threat and the VBS/Agent family of malware is the least prevalent regardless of industry. Sure, you’ll find some threats exhibiting a fair degree of variation
across industries (e.g., the PHP.CGI.Argument.Injection exploit), but by and large the message given by Figure 18 is, “it’s about the threats, not the industries.” Cyber security policies and practices based on this conclusion may take a “you must be at least this tall” approach, since everyone’s on the same ride and experiencing similar threats.
34% 42% 13.5%54.2% 17%
33.5% 26.3% 21.8%36.3% 22.3%
36% 37.5% 17.5%49.5% 23.3%
44.8% 38.2% 28.3%48.7% 32.5%
31.3% 30.9% 18.9%40.7% 23.6%
30.7% 25.2% 22.1%39.9% 27%
32.3% 36.2% 20.8%50% 20.8%
33.6% 33.6% 22.6%52.1% 26.6%
58.2%79.7% 52.4%76.2% 54.3%
50.2%64.1% 38.1%63.2% 39.5%
45.6%70.7% 42.2%70% 44.8%
53.5%73.9% 47.4%74.6% 48.3%
42%57.1% 29%58.5% 29%
40.3%52.8% 23.9%57.2% 30.2%
43.4%64.2% 34.9%65.1% 33%
44.3%63.6% 36.6%64.1% 40.5%
56.5%85.1% 68.1% 64.5%69.4%
50.6%78.3% 61.4% 57.8%63.9%
53.4%82.6% 69.1% 63.5%69.1%
65.1%90.2% 77.6% 71.4%77.2%
51.8%86.3% 65.5% 61.2%68.6%
42.9%80.5% 57.1% 51.9%49.4%
60.7%90.5% 75% 61.9%65.5%
51.4%82.5% 67.1% 63.7%64.3%
Education
Finance/Insurance
Government
Healthcare
Manufacturing
Professional Services
Retail/Hospitality
Technology
W32/Generic
JS/Nemucod
Riskware/Asparnet
WM/Agent
VBS/Agent
Worm.Slammer
Netcore.Netis.Hardcoded.PW
MS.Windows.FMgr.Mem.Corruption
Zpanel.pChart.Information.Disclosure
PHP.CGI.Argument.InjectionNecurs
RamnitTepfer
SalityH−w
orm
30%
50%
70%
90%
INDUSTRY THREAT LANDSCAPES
25
“It’s about the industries, not the threats”
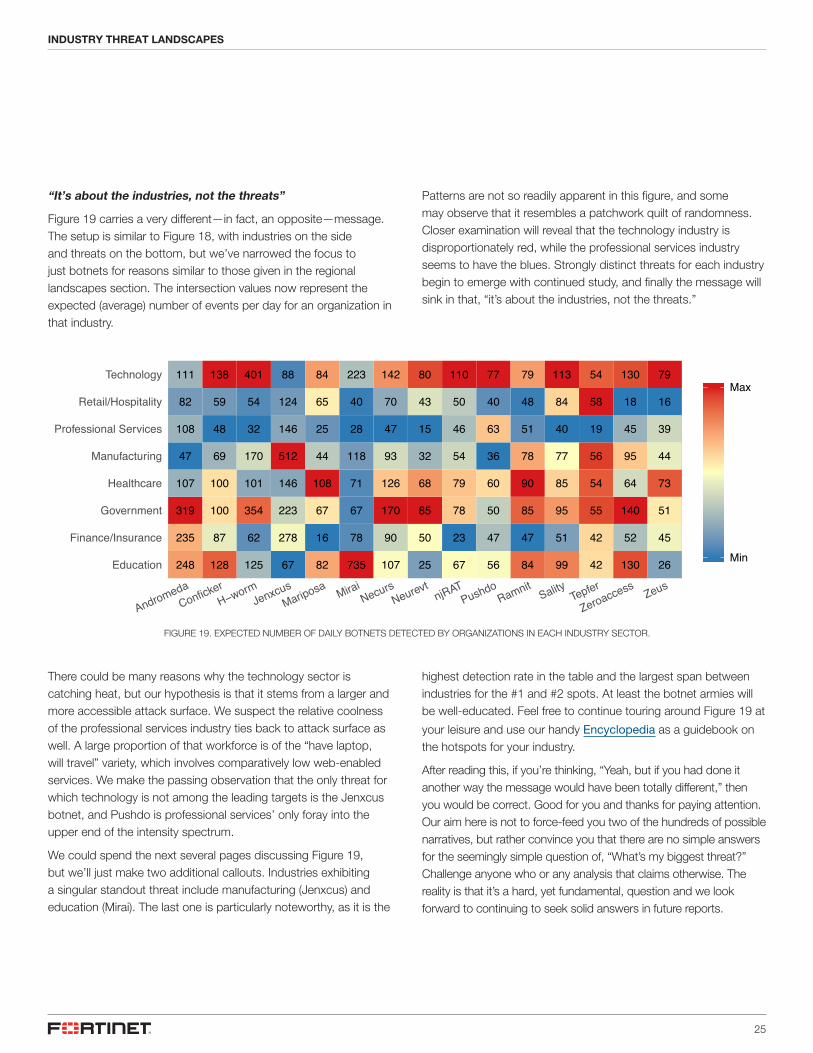
Figure 19 carries a very different—in fact, an opposite—message. The setup is similar to Figure 18, with industries on the side and threats on the bottom, but we’ve narrowed the focus to just botnets for reasons similar to those given in the regional landscapes section. The intersection values now represent the expected (average) number of events per day for an organization in that industry.
FIGURE 19. EXPECTED NUMBER OF DAILY BOTNETS DETECTED BY ORGANIZATIONS IN EACH INDUSTRY SECTOR.
Patterns are not so readily apparent in this figure, and some may observe that it resembles a patchwork quilt of randomness. Closer examination will reveal that the technology industry is disproportionately red, while the professional services industry seems to have the blues. Strongly distinct threats for each industry begin to emerge with continued study, and finally the message will sink in that, “it’s about the industries, not the threats.”
There could be many reasons why the technology sector is catching heat, but our hypothesis is that it stems from a larger and more accessible attack surface. We suspect the relative coolness of the professional services industry ties back to attack surface as well. A large proportion of that workforce is of the “have laptop, will travel” variety, which involves comparatively low web-enabled services. We make the passing observation that the only threat for which technology is not among the leading targets is the Jenxcus botnet, and Pushdo is professional services’ only foray into the upper end of the intensity spectrum.
We could spend the next several pages discussing Figure 19, but we’ll just make two additional callouts. Industries exhibiting a singular standout threat include manufacturing (Jenxcus) and education (Mirai). The last one is particularly noteworthy, as it is the
highest detection rate in the table and the largest span between industries for the #1 and #2 spots. At least the botnet armies will be well-educated. Feel free to continue touring around Figure 19 at
your leisure and use our handy Encyclopedia as a guidebook on the hotspots for your industry.
After reading this, if you’re thinking, “Yeah, but if you had done it another way the message would have been totally different,” then you would be correct. Good for you and thanks for paying attention. Our aim here is not to force-feed you two of the hundreds of possible narratives, but rather convince you that there are no simple answers for the seemingly simple question of, “What’s my biggest threat?” Challenge anyone who or any analysis that claims otherwise. The reality is that it’s a hard, yet fundamental, question and we look forward to continuing to seek solid answers in future reports.
248
235
319
107
47
108
82
111
128
87
100
100
69
48
59
138
125
62
354
101
170
32
54
401
67
278
223
146
512
146
124
88
82
16
67
108
44
25
65
84
735
78
67
71
118
28
40
223
107
90
170
126
93
47
70
142
25
50
85
68
32
15
43
80
67
23
78
79
54
46
50
110
56
47
50
60
36
63
40
77
84
47
85
90
78
51
48
79
99
51
95
85
77
40
84
113
42
42
55
54
56
19
58
54
130
52
140
64
95
45
18
130
26
45
51
73
44
39
16
79
Education
Finance/Insurance
Government
Healthcare
Manufacturing
Professional Services
Retail/Hospitality
Technology
AndromedaConficker
H−worm
JenxcusMariposa Mirai
NecursNeurevt
njRATPushdo
RamnitSality Tepfer
ZeroaccessZeus
Min
Max
INDUSTRY THREAT LANDSCAPES
EXPLORATORY ANALYSIS:HOLIDAY THREAT TRENDS
27
EXPLORATORY ANALYSIS: HOLIDAY THREAT TRENDS
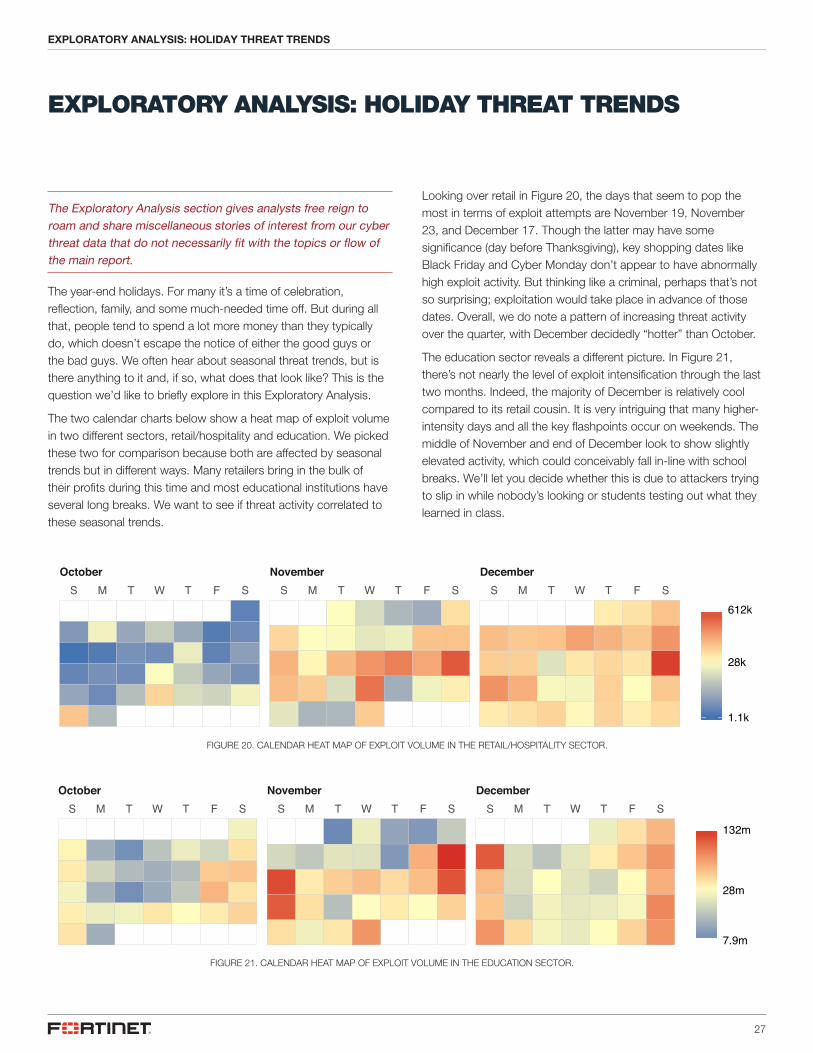
The Exploratory Analysis section gives analysts free reign to roam and share miscellaneous stories of interest from our cyber threat data that do not necessarily fit with the topics or flow of the main report .
The year-end holidays. For many it’s a time of celebration, reflection, family, and some much-needed time off. But during all that, people tend to spend a lot more money than they typically do, which doesn’t escape the notice of either the good guys or the bad guys. We often hear about seasonal threat trends, but is there anything to it and, if so, what does that look like? This is the question we’d like to briefly explore in this Exploratory Analysis.
The two calendar charts below show a heat map of exploit volume in two different sectors, retail/hospitality and education. We picked these two for comparison because both are affected by seasonal trends but in different ways. Many retailers bring in the bulk of their profits during this time and most educational institutions have several long breaks. We want to see if threat activity correlated to these seasonal trends.
FIGURE 20. CALENDAR HEAT MAP OF EXPLOIT VOLUME IN THE RETAIL/HOSPITALITY SECTOR.
Looking over retail in Figure 20, the days that seem to pop the most in terms of exploit attempts are November 19, November 23, and December 17. Though the latter may have some significance (day before Thanksgiving), key shopping dates like Black Friday and Cyber Monday don’t appear to have abnormally high exploit activity. But thinking like a criminal, perhaps that’s not so surprising; exploitation would take place in advance of those dates. Overall, we do note a pattern of increasing threat activity over the quarter, with December decidedly “hotter” than October.
The education sector reveals a different picture. In Figure 21, there’s not nearly the level of exploit intensification through the last two months. Indeed, the majority of December is relatively cool compared to its retail cousin. It is very intriguing that many higher-intensity days and all the key flashpoints occur on weekends. The middle of November and end of December look to show slightly elevated activity, which could conceivably fall in-line with school breaks. We’ll let you decide whether this is due to attackers trying to slip in while nobody’s looking or students testing out what they learned in class.
October November DecemberS M T W T F S S M T W T F S S M T W T F S
1.1k
28k
612k
October November DecemberS M T W T F S S M T W T F S S M T W T F S
7.9m
28m
132m
FIGURE 21. CALENDAR HEAT MAP OF EXPLOIT VOLUME IN THE EDUCATION SECTOR.
EXPLORATORY ANALYSIS: HOLIDAY THREAT TRENDS
CONCLUSION &RECOMMENDATIONS
29
CONCLUSION AND RECOMMENDATIONS
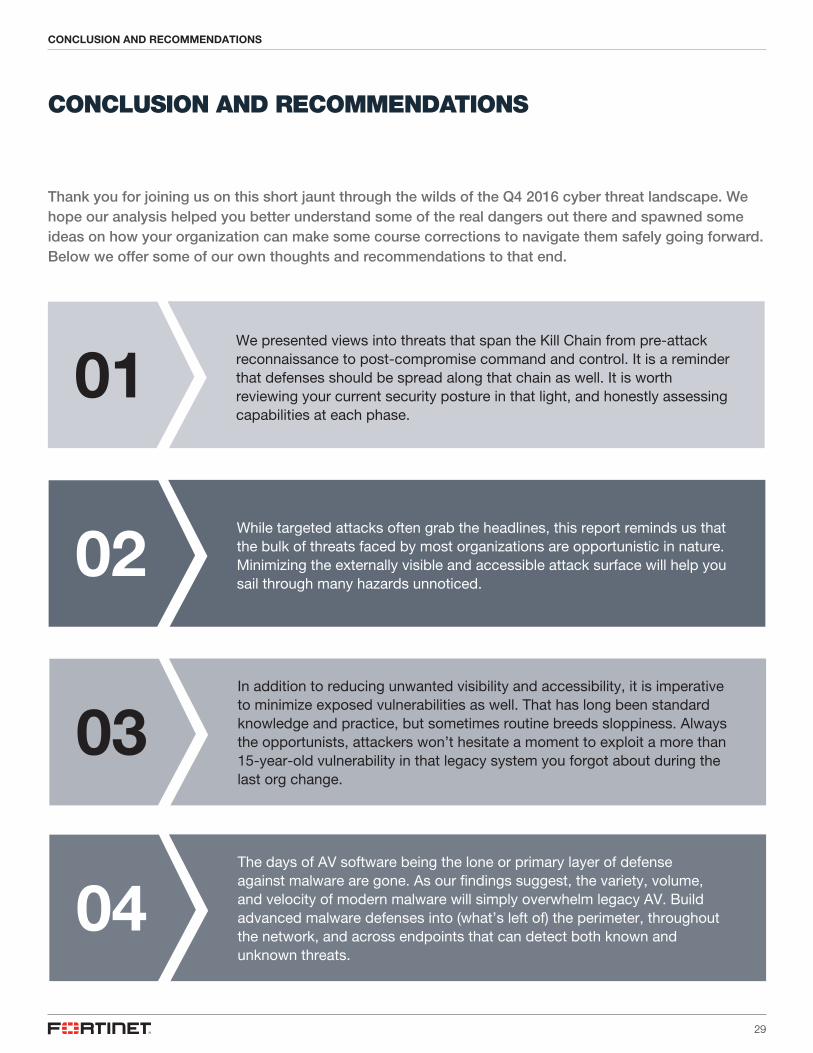
Thank you for joining us on this short jaunt through the wilds of the Q4 2016 cyber threat landscape. We hope our analysis helped you better understand some of the real dangers out there and spawned some ideas on how your organization can make some course corrections to navigate them safely going forward. Below we offer some of our own thoughts and recommendations to that end.
01We presented views into threats that span the Kill Chain from pre-attack reconnaissance to post-compromise command and control . It is a reminder that defenses should be spread along that chain as well . It is worth reviewing your current security posture in that light, and honestly assessing capabilities at each phase .
02While targeted attacks often grab the headlines, this report reminds us that the bulk of threats faced by most organizations are opportunistic in nature . Minimizing the externally visible and accessible attack surface will help you sail through many hazards unnoticed .
03In addition to reducing unwanted visibility and accessibility, it is imperative to minimize exposed vulnerabilities as well . That has long been standard knowledge and practice, but sometimes routine breeds sloppiness . Always the opportunists, attackers won’t hesitate a moment to exploit a more than 15-year-old vulnerability in that legacy system you forgot about during the last org change .
04The days of AV software being the lone or primary layer of defense against malware are gone . As our findings suggest, the variety, volume, and velocity of modern malware will simply overwhelm legacy AV . Build advanced malware defenses into (what’s left of) the perimeter, throughout the network, and across endpoints that can detect both known and unknown threats .
CONCLUSION AND RECOMMENDATIONS
30
06We saw that ransomware prevalence varies across firms, but affects all industries and regions to some degree . This is a complex threat that won’t go away with simplistic approaches . See our ten-step program for our take on how to protect your organization against ransomware .
07Our findings pertaining to botnets serve as a reminder that monitoring what’s going out of your network is just as important as knowing what’s coming in (likely more so) . Protecting all hosts and users from all inbound threats is an impossible task, but severing C2 communications at key chokepoints in your network through a combination of smart tools and good intel is much more achievable .
08When it comes to understanding your organization’s threat landscape, it’s healthy to remember two things: 1 . yours is more similar to that of others than you probably think, and 2 . yours is different from others in ways you may not have thought about . Understanding which strategies, tactics, and intel you can borrow from others and which can safely be set aside is valuable knowledge that will guide you well .
09Watch for future versions of this report . We’ll be publishing it on a quarterly basis, and we have a lot of great data we look forward to sharing . To keep tabs on the threat landscape between quarters, sign up for our weekly FortiGuard intel briefs and bookmark our blog .
05Protecting against mobile malware is particularly challenging because devices are not shielded on the internal network, frequently joining public networks, and often are not under corporate ownership or control . Mobile security strategies must assume these things to be true and yet still thwart malware through mobile application controls and malware protections integrated into the network .
CONCLUSION AND RECOMMENDATIONS

Copyright © 2017 Fortinet, Inc. All rights reserved. Fortinet®, FortiGate®, FortiCare® and FortiGuard®, and certain other marks are registered trademarks of Fortinet, Inc., and other Fortinet names herein may also be registered and/or common law trademarks of Fortinet. All other product or company names may be trademarks of their respective owners. Performance and other metrics contained herein were attained in internal lab tests under ideal conditions, and actual performance and other results may vary. Network variables, different network environments and other conditions may affect performance results. Nothing herein represents any binding commitment by Fortinet, and Fortinet disclaims all warranties, whether express or implied, except to the extent Fortinet enters a binding written contract, signed by Fortinet’s General Counsel, with a purchaser that expressly warrants that the identified product will perform according to certain expressly-identified performance metrics and, in such event, only the specific performance metrics expressly identified in such binding written contract shall be binding on Fortinet. For absolute clarity, any such warranty will be limited to performance in the same ideal conditions as in Fortinet’s internal lab tests. Fortinet disclaims in full any covenants, representations, and guarantees pursuant hereto, whether express or implied. Fortinet reserves the right to change, modify, transfer, or otherwise revise this publication without notice, and the most current version of the publication shall be applicable. Fortinet disclaims in full any covenants, representations, and guarantees pursuant hereto, whether express or implied. Fortinet reserves the right to change, modify, transfer, or otherwise revise this publication without notice, and the most current version of the publication shall be applicable.
GLOBAL HEADQUARTERSFortinet Inc.899 Kifer RoadSunnyvale, CA 94086United StatesTel: +1.408.235.7700www.fortinet.com/sales
EMEA SALES OFFICE905 rue Albert Einstein06560 ValbonneFranceTel: +33.4.8987.0500
APAC SALES OFFICE300 Beach Road 20-01The ConcourseSingapore 199555Tel: +65.6513.3730
LATIN AMERICA HEADQUARTERSSawgrass Lakes Center13450 W. Sunrise Blvd., Suite 430Sunrise, FL 33323Tel: +1.954.368.9990