THOR-GP input to HSE Annual Statistics 2013/2014 · ‘THOR-GP denominator method ... The THOR-GP...
18
1 THOR-GP input to HSE Annual Statistics 2015/2016 Note on methods used for calculating incidence rates and ‘caveats’ in interpretation Louise Hussey, Centre for Occupational & Environmental Health (COEH), The University of Manchester 31 st May 2016 Summary Introduction For the 2016 THOR-GP annual statists (2015 data) provided to HSE, the same ‘THOR-GP denominator method’ has been used as in the previous year. In 2014 (2013 data) methods used to calculate incidence rates or work-related ill-health for the HSE’s annual statistics changed from the previously used ‘Labour Force Survey (LFS) denominator method’ to the ‘THOR-GP denominator method’. The LFS denominator method required the THOR-GP numerator (number of cases of work- related ill-health reported to participating GPs) to be extrapolated to estimate the numerator for the whole of GB; this was then divided by the number of persons employed according to the LFS. This method also incorporated an adjustment for differences in core/sample reporting rates. This was used whilst methods were developed to more precisely define the size and employment characteristics of the THOR-GP population denominator (i.e. the patients registered with THOR-GPs’ practices). The THOR-GP denominator method involves linking the THOR-GPs’ postcodes to census area data to provide information from which to characterise a practice population. The ‘methods and caveats’ document which accompanied the 2014 (2013 data) annual statistics showed how incidence rates derived using the more precise population characteristics of the THOR-GP denominator method were higher than those calculated using the LFS denominator method used in previous years. This is due mainly to the adjustment made (of 2.7) for the core:sample reporting rate ratio used in the statistics provided in previous years. This document describes the method used to calculate THOR-GP incidence rates using the THOR-GP denominator method and discusses caveats that need to be considered when interpreting the data. Methods The THOR-GP population denominator method is based on characterising a census geographical area of similar size to the national average practice size. The nearest geographical area in population magnitude to this is the Middle Layer Super Output Area (MLSOAs) for England/Wales and the Intermediate Geography (IG) area for Scotland. The MLSOA and IG codes for all THOR-GPs participating in 2015 were linked to tables giving the total population of each area and employment by industrial section and major occupational group. The size of the each practice list was found from published datasets and adjusted to only include the proportion of the population
-
Upload
nguyenmien -
Category
Documents
-
view
215 -
download
1
Transcript of THOR-GP input to HSE Annual Statistics 2013/2014 · ‘THOR-GP denominator method ... The THOR-GP...
1
THOR-GP input to HSE Annual Statistics 2015/2016
Note on methods used for calculating incidence rates and ‘caveats’ in
interpretation
Louise Hussey, Centre for Occupational & Environmental Health (COEH), The
University of Manchester 31st May 2016
Summary
Introduction
For the 2016 THOR-GP annual statists (2015 data) provided to HSE, the same
‘THOR-GP denominator method’ has been used as in the previous year. In 2014
(2013 data) methods used to calculate incidence rates or work-related ill-health for
the HSE’s annual statistics changed from the previously used ‘Labour Force Survey
(LFS) denominator method’ to the ‘THOR-GP denominator method’. The LFS
denominator method required the THOR-GP numerator (number of cases of work-
related ill-health reported to participating GPs) to be extrapolated to estimate the
numerator for the whole of GB; this was then divided by the number of persons
employed according to the LFS. This method also incorporated an adjustment for
differences in core/sample reporting rates. This was used whilst methods were
developed to more precisely define the size and employment characteristics of the
THOR-GP population denominator (i.e. the patients registered with THOR-GPs’
practices). The THOR-GP denominator method involves linking the THOR-GPs’
postcodes to census area data to provide information from which to characterise a
practice population. The ‘methods and caveats’ document which accompanied the
2014 (2013 data) annual statistics showed how incidence rates derived using the
more precise population characteristics of the THOR-GP denominator method were
higher than those calculated using the LFS denominator method used in previous
years. This is due mainly to the adjustment made (of 2.7) for the core:sample
reporting rate ratio used in the statistics provided in previous years.
This document describes the method used to calculate THOR-GP incidence rates
using the THOR-GP denominator method and discusses caveats that need to be
considered when interpreting the data.
Methods
The THOR-GP population denominator method is based on characterising a census
geographical area of similar size to the national average practice size. The nearest
geographical area in population magnitude to this is the Middle Layer Super Output
Area (MLSOAs) for England/Wales and the Intermediate Geography (IG) area for
Scotland. The MLSOA and IG codes for all THOR-GPs participating in 2015 were
linked to tables giving the total population of each area and employment by industrial
section and major occupational group. The size of the each practice list was found
from published datasets and adjusted to only include the proportion of the population
2
that were employed. This now more accurate population size was then applied to the
proportional distribution by industry and occupational group to give the population
size within each section of the workforce of the THOR-GP denominator. The
population for England/Wales and Scotland were then totalled to give the GB THOR-
GP population.
Usually only one GP in each THOR-GP practice participates in the scheme.
Therefore it was necessary to estimate the proportion of the practice study
population covered by participating GPs. All THOR-GPs were therefore sent a
questionnaire asking how many sessions they undertook each week, and how many
sessions all the GPs in their practice undertook in total; this gave an estimate of the
proportion of practice consultations covered by the THOR-GP participants, which
was then used to adjust the population size derived above.
In 2015 all THOR-GPs were reporting on a sample basis (i.e. one randomly allocated
month a year). Annual totals were estimated by multiplying these cases by 12. These
estimated totals were adjusted by the reporter response rate. Incidence rates per
100,000 persons per annum were calculated by dividing this adjusted numerator by
the THOR-GP denominator and multiplying by 100,000. These individual industrial
incidence rates were weighted to adjust for any differences in employment between
the THOR-GP population and the population of GB (according to the LFS).
Results
In total there were 210 GB GPs participating in THOR-GP in 2015. Estimates of the
employed population size were applied to the proportional industrial distribution
derived from Census 2011 data based on the MLSOA and IGs of each practice
postcode to give an adjusted workforce size for each industrial section. When
THOR-GPs (in 2013) were asked about the number of sessions carried out in their
general practice, it emerged that in total THOR-GPs covered approximately an
average 17% of their practices’ populations. The THOR-GP population in 2015 was
therefore then multiplied by 0.17 to give the population denominator covered by
participating GPs (166,252 persons).
THOR-GP participants reported 1,548 estimated cases of work-related ill-health to
the scheme in 2015. In order to calculate incidence rates, these cases are adjusted
by reporter response rate (58%), divided by the corresponding denominator and
multiplied by 100,000. The overall rate of incidence was 1,605 per 100,000 persons
employed per annum. A GB adjusted rate was calculated (1,633 per 100,000
persons employed per annum) by taking the average incidence rate of each industry
weighted by the proportional breakdown of the GB workforce according to the LFS.
Incidence rates for work-related ill-health were highest in agriculture, forestry &
fishing (5072), transport & storage (3042) and arts, entertainment, service activities
& other industries (2782).
3
Discussion
This document describes the methodology used to calculate incidence rates for the
2015 (2015 data) annual statistical submission to the HSE. This is the third year that
the statistics have been produced using the ‘THOR-GP Denominator Method’.
There are assumptions that have to be made with the THOR-GP denominator
method which are likely to lead to some biases. As previously discussed, the THOR-
GP coverage of 17% was applied uniformly across all the practices meaning some of
the practices populations will be over-represented and others will be under-
represented. This method of estimating the denominator is also based on ecological
methods i.e. individuals registered with participating practices are not necessarily
employed as the Census area data suggests. There are also recognised
uncertainties (also as previously discussed) with the accuracy of the numerator with
the disparity shown in core:sample reporting. These uncertainties are in the process
of being investigated and the results of these analyses were reported in a document
submitted to HSE in July 2015. Analyses included within this document lead to the
conclusion that the ‘true’ incidence rate of work-related ill-health from cases reported
from general practice is somewhere between that determined by ‘core’ reporting and
‘sample’ reporting, but probably closer to the latter.
Caveats in interpretation
There are a number of issues that should be considered when interpreting the data;
the main considerations are as follows;
The data has some figures that may be small in number, therefore we would strongly
caution against drawing conclusions on proportions or rates based on small
numbers. The numbers of ‘actual’ cases on which the estimates are based are
therefore provided with all tables to permit the reader to be better informed in making
judgements based on the incidence information.
The difference between reporting rates for sample and core GP reporters has been
previously shown to be a factor of three. The reasons for this difference are unclear,
but may be related to multiple consultations at GP level and the fact that these may
be dealt with by different practice members. We have previously noted and reported
on the difference in incidence estimates based on sampling intervals. Further work is
in hand to clarify the reasons for this difference. Measures have been put in place by
amending the web portal to further reduce the risk of GPs reporting prevalent cases.
The number of cases reported by THOR-GPs has been adjusted by the GP
response rates and assumes that the rate and nature of cases of non-responders
would be the same as among those that did respond.
The sickness absence information has been factored up by 61% to adjust for the
estimated under-reporting (based on retrospective audits) of sickness absence days.
4
1. Introduction
Since 2006, incidence rates of work-related ill-health have been calculated from
THOR-GP data using the ‘Labour Force Survey (LFS) denominator method’(1). This
involves adjusting the numerator for GP response and for any part-time practice,
calculating the number of cases reported per participating GP and multiplying this
number by the number of GPs (full-time equivalent) in Great Britain (GB) to
extrapolate THOR-GP data to national figures. This estimated numerator is then
divided by LFS denominator data. A detailed description of the LFS denominator
method can be found in Appendix 1.
Initially, most THOR-GPs participated as core reporters (i.e. reporting every month of
the year), however in 2010 the majority of reporters changed to sample reporting (i.e.
one randomly assigned month a year) (core:sample ratio 1:4). Since 2011, all
reporters have been participating on a sample basis. It was found that this change to
sample reporting had a marked effect on incidence rates producing incidence
estimates almost three times that of core reporting. The reason for this disparity is
not known for certain, however it is likely to be either a result of over-reporting by
sample reporters (by submitting prevalent cases or harvesting cases from outside
their reporting month) or under-reporting by core participants as a manifestation of
fatigue (2). Most likely it is as a result of a combination of both of these factors. The
factors influencing the differences in core and sample reporting are discussed in a
report due to be submitted to HSE in July 2015 (3). Analyses included within this
document lead to the conclusion that the ‘true’ incidence rate of work-related ill-
health from cases reported from general practice is somewhere between that
determined by ‘core’ reporting and ‘sample’ reporting, but probably closer to the
latter. In order to bring rates in line with figures calculated from predominately core
reporting, from 2010 sample cases were weighted by dividing by 2.7 (core:sample
reporting ratio) as an interim adjustment.
The LFS denominator method was used whilst methods were developed to more
precisely define the size and employment characteristics of the THOR-GP population
denominator (i.e. the patients registered with THOR-GPs’ practices). Linking
patients’ postcodes to census area data can provide information from which to
characterise a practice population, including demographic and employment data. In
the absence of personal information, denominator characterisation based on linking
patients’ postcodes in this way is considered to be the ‘gold standard’ method but it
has often been reported that these individual patient data are not easily accessible to
researchers (4;5). In the absence of patient postcode data, population characteristics
based on the postcode of the practice are often used (4-7).
A study was conducted to compare population estimates based on patient and
practice postcode and results showed that in the absence of patient postcode data, it
is satisfactory to use practice postcode data (8). As a result of the completion of this
work, the HSE Annual Statistics submission in 2014 (for 2013 data) and
5
subsequently the submissions for 2015 (for 2014 data) and 2016 (for 2015 data)
were conducted using the more precise THOR-GP denominator method.
The ‘methods and caveats’ document that accompanied the 2014 (2013 data)
annual statistics showed how incidence rates derived using the more precise
population characteristics of the THOR-GP denominator method were higher than
those calculated using the LFS denominator method used in previous years. This is
due mainly to the adjustment made (of 2.7) for the core:sample reporting rate ratio
used in the statistics provided in previous years (9).
This document describes the method used to calculate THOR-GP incidence rates
using the THOR-GP denominator method and discusses issues/caveats that need to
be considered when interpreting the data.
2. Methods
2.1 The Denominator
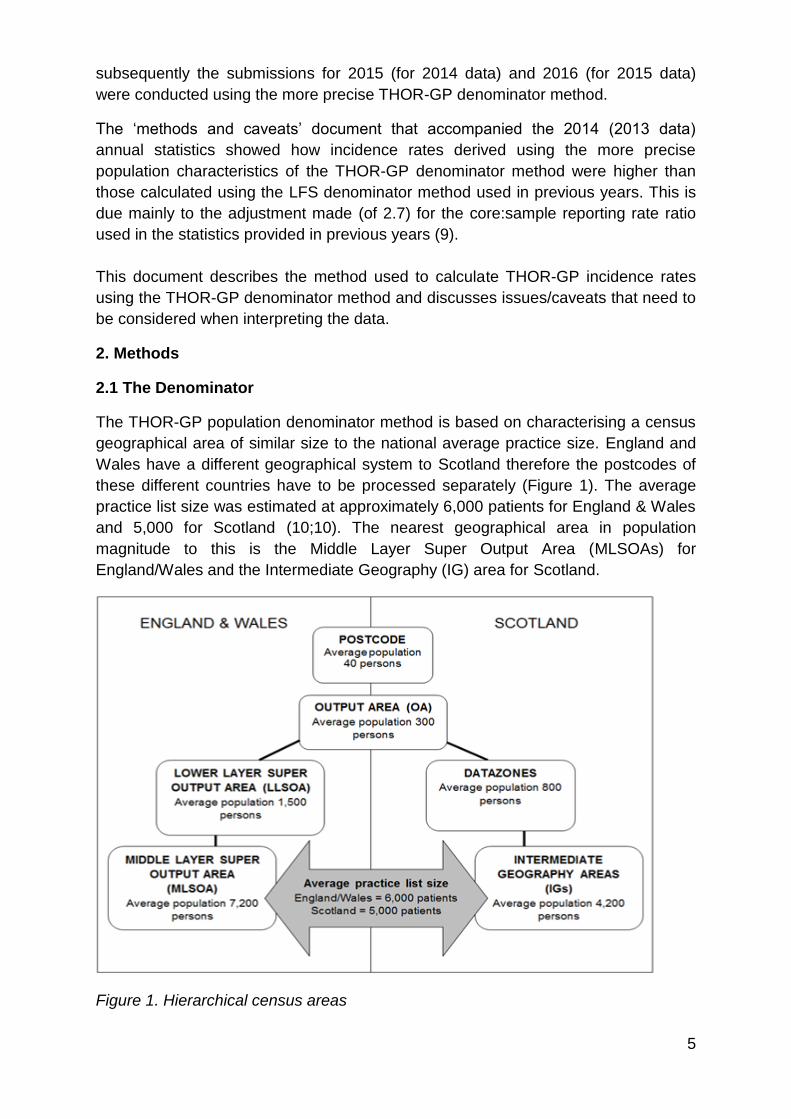
The THOR-GP population denominator method is based on characterising a census
geographical area of similar size to the national average practice size. England and
Wales have a different geographical system to Scotland therefore the postcodes of
these different countries have to be processed separately (Figure 1). The average
practice list size was estimated at approximately 6,000 patients for England & Wales
and 5,000 for Scotland (10;10). The nearest geographical area in population
magnitude to this is the Middle Layer Super Output Area (MLSOAs) for
England/Wales and the Intermediate Geography (IG) area for Scotland.
Figure 1. Hierarchical census areas
6
The postcode of the main practice address of all GP participants in 2015 was
selected from the database. Some practices had branch surgeries, however only the
postcode of the main practice was used; the inclusion of branch surgeries has been
found to have little effect on results in other work (7). The MLSOA and IG codes
were found for each practice postcode. Lists of MLSOA and IG codes were linked to
tables downloaded from the Office for National Statistics (ONS) and Scotland’s
Census 2011 web sites (11;12) giving the total population of each area and
employment by industrial section and major occupational group. Ten (nine in
England/Wales and one in Scotland) of the participating GP practices had two
THOR-GP reporters, for these practices, the corresponding MLSOAs or IG areas
were included twice.
Previous research (8) has shown that although this method estimates well the
industrial distribution of the THOR-GP population, it is not so accurate at estimating
the size of the population. Therefore the size of each practice list was found from
published datasets (13-15). The resulting population was for all patients, whereas
the THOR-GP population denominator is limited to those within employment. In order
to adjust for this, the proportion of the population within each MLSOA and IG area in
employment was calculated from the downloaded Census 2011 datasets
(employment by industry, occupational group and total residents of each MLSOA
and IG area). The proportion for each MLSOA or IG area was applied to the
population of registered patients for the corresponding practice to give a total
employed population. This now more accurate population size was then applied to
the proportional distribution by industry to give the population size within each
industrial section of the THOR-GP denominator. The population for England/Wales
and Scotland were then totalled to give the GB THOR-GP population.
Usually only one of the GPs in each THOR-GP practice participates in the scheme.
Therefore it was necessary to estimate the proportion of the practice study
population covered by participating GPs. For example, a practice may have four GPs
of whom only one reports to THOR-GP; additionally these four GPs will undertake a
different number of clinical sessions per week. In 2013 all participating GPs were
therefore sent a questionnaire asking how many sessions they undertook each
week, and how many sessions all the GPs in their practice undertook in total; this
gave an estimate of the proportion of practice consultations covered by the THOR-
GP participants, which was then used to adjust the population size derived above.
2.2 Calculation of incidence rates
In 2015 all THOR-GPs were reporting on a sample basis (i.e. one randomly allocated
month a year). Annual totals were estimated by multiplying these cases by 12. These
estimated totals were adjusted by the reporter response rate. Incidence rates per
100,000 persons per annum were calculated by dividing this adjusted numerator by
the THOR-GP denominator (as determined in section 2.1 above) and multiplying by
100,000.
7
The THOR-GP population may be slightly different in its employment characteristics
than the GB population. Therefore in order to calculate the incidence rates for GB as
a whole required by the HSE, it is necessary to adjust the overall rate of incidence
for this. For example, when calculating rates for specific diagnostic categories; if the
THOR-GP population had a higher proportion (than the GB population) of its
population working within service public sector industries known to have higher rates
of work-related mental-ill health diagnoses (16); this would be reflected in the results
with an increased overall rate of these psychological conditions in the population. In
order to adjust for this, data from the THOR-GP population would have to be
weighted by the proportional distribution by industry in the GB workforce according to
LFS data.
3. Results
3.1 The Denominator
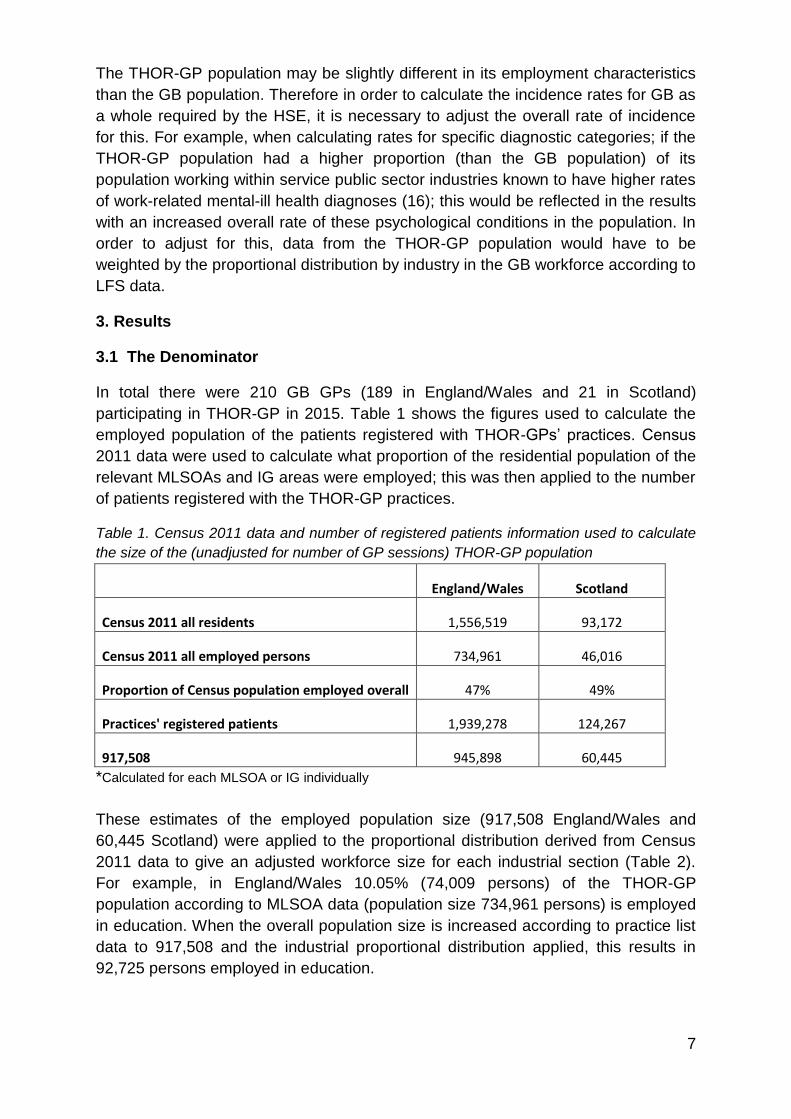
In total there were 210 GB GPs (189 in England/Wales and 21 in Scotland)
participating in THOR-GP in 2015. Table 1 shows the figures used to calculate the
employed population of the patients registered with THOR-GPs’ practices. Census
2011 data were used to calculate what proportion of the residential population of the
relevant MLSOAs and IG areas were employed; this was then applied to the number
of patients registered with the THOR-GP practices.
Table 1. Census 2011 data and number of registered patients information used to calculate
the size of the (unadjusted for number of GP sessions) THOR-GP population
England/Wales Scotland
Census 2011 all residents 1,556,519 93,172
Census 2011 all employed persons 734,961 46,016
Proportion of Census population employed overall 47% 49%
Practices' registered patients 1,939,278 124,267
917,508 945,898 60,445
*Calculated for each MLSOA or IG individually
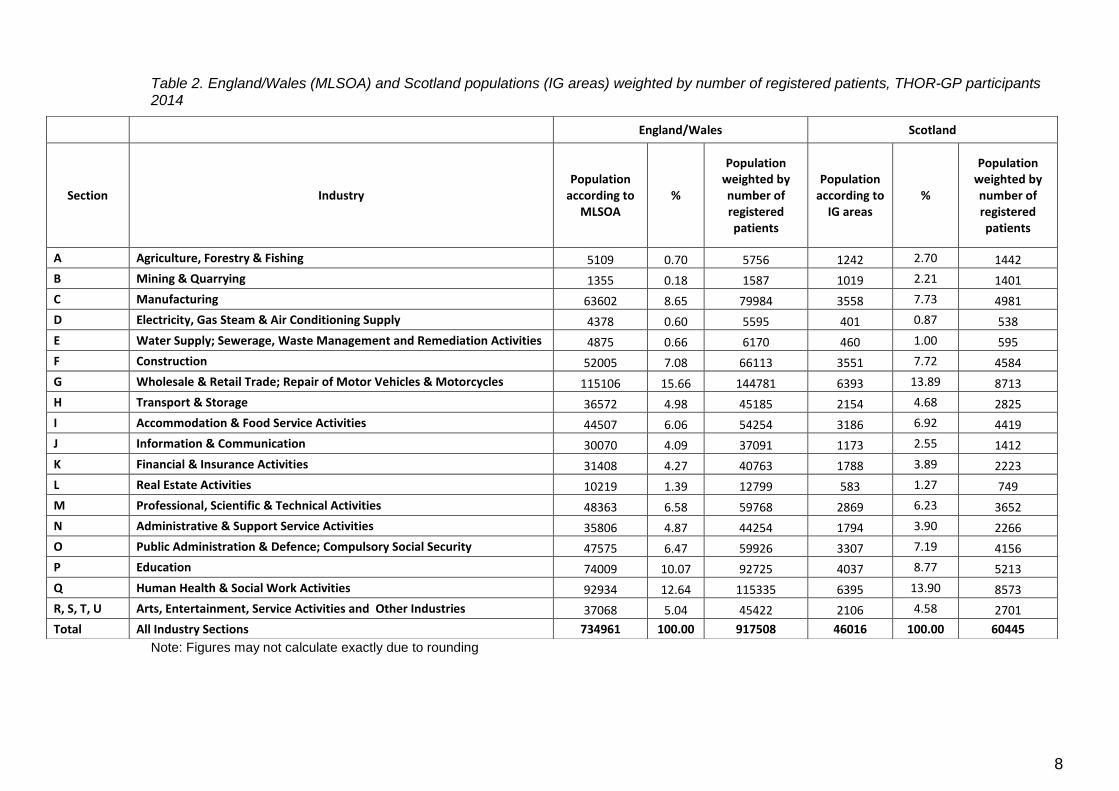
These estimates of the employed population size (917,508 England/Wales and
60,445 Scotland) were applied to the proportional distribution derived from Census
2011 data to give an adjusted workforce size for each industrial section (Table 2).
For example, in England/Wales 10.05% (74,009 persons) of the THOR-GP
population according to MLSOA data (population size 734,961 persons) is employed
in education. When the overall population size is increased according to practice list
data to 917,508 and the industrial proportional distribution applied, this results in
92,725 persons employed in education.
8
Table 2. England/Wales (MLSOA) and Scotland populations (IG areas) weighted by number of registered patients, THOR-GP participants 2014
Note: Figures may not calculate exactly due to rounding
England/Wales Scotland
Section Industry Population
according to MLSOA
%
Population weighted by number of registered patients
Population according to
IG areas %
Population weighted by number of registered patients
A Agriculture, Forestry & Fishing 5109 0.70 5756 1242 2.70 1442
B Mining & Quarrying 1355 0.18 1587 1019 2.21 1401
C Manufacturing 63602 8.65 79984 3558 7.73 4981
D Electricity, Gas Steam & Air Conditioning Supply 4378 0.60 5595 401 0.87 538
E Water Supply; Sewerage, Waste Management and Remediation Activities 4875 0.66 6170 460 1.00 595
F Construction 52005 7.08 66113 3551 7.72 4584
G Wholesale & Retail Trade; Repair of Motor Vehicles & Motorcycles 115106 15.66 144781 6393 13.89 8713
H Transport & Storage 36572 4.98 45185 2154 4.68 2825
I Accommodation & Food Service Activities 44507 6.06 54254 3186 6.92 4419
J Information & Communication 30070 4.09 37091 1173 2.55 1412
K Financial & Insurance Activities 31408 4.27 40763 1788 3.89 2223
L Real Estate Activities 10219 1.39 12799 583 1.27 749
M Professional, Scientific & Technical Activities 48363 6.58 59768 2869 6.23 3652
N Administrative & Support Service Activities 35806 4.87 44254 1794 3.90 2266
O Public Administration & Defence; Compulsory Social Security 47575 6.47 59926 3307 7.19 4156
P Education 74009 10.07 92725 4037 8.77 5213
Q Human Health & Social Work Activities 92934 12.64 115335 6395 13.90 8573
R, S, T, U Arts, Entertainment, Service Activities and Other Industries 37068 5.04 45422 2106 4.58 2701
Total All Industry Sections 734961 100.00 917508 46016 100.00 60445
9
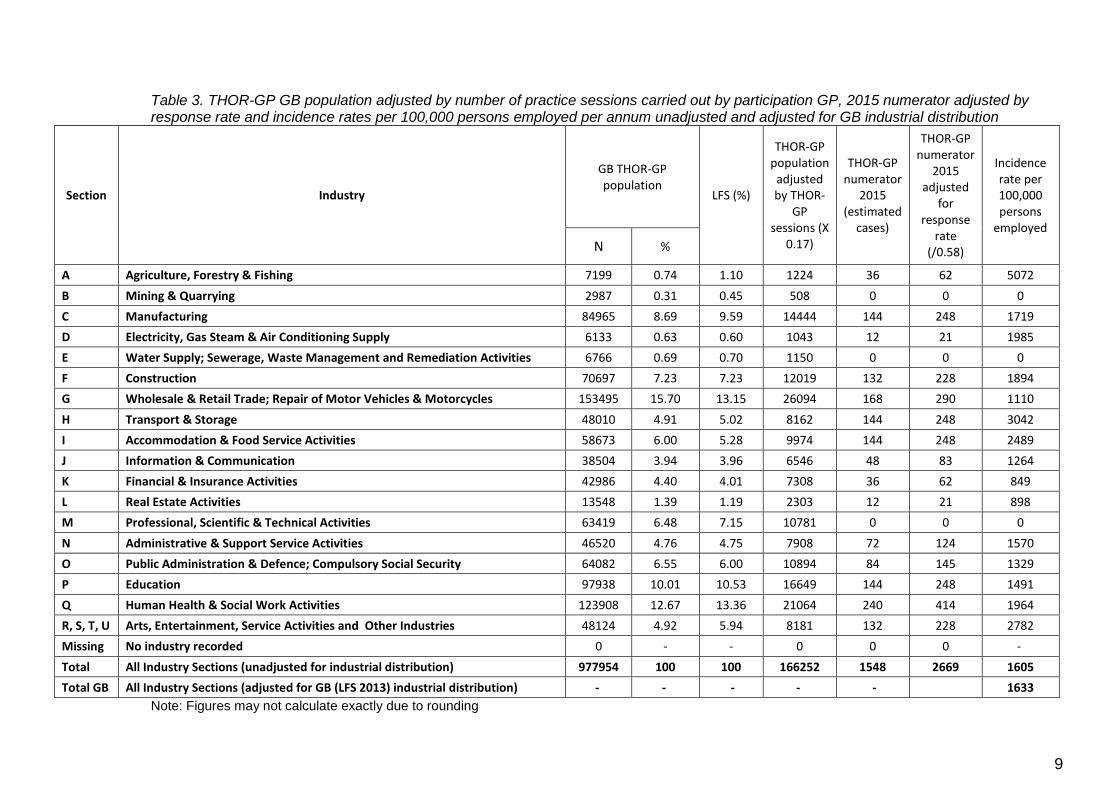
Table 3. THOR-GP GB population adjusted by number of practice sessions carried out by participation GP, 2015 numerator adjusted by response rate and incidence rates per 100,000 persons employed per annum unadjusted and adjusted for GB industrial distribution
Section Industry
GB THOR-GP population
LFS (%)
THOR-GP population
adjusted by THOR-
GP sessions (X
0.17)
THOR-GP numerator
2015 (estimated
cases)
THOR-GP numerator
2015 adjusted
for response
rate (/0.58)
Incidence rate per 100,000 persons
employed
N %
A Agriculture, Forestry & Fishing 7199 0.74 1.10 1224 36 62 5072
B Mining & Quarrying 2987 0.31 0.45 508 0 0 0
C Manufacturing 84965 8.69 9.59 14444 144 248 1719
D Electricity, Gas Steam & Air Conditioning Supply 6133 0.63 0.60 1043 12 21 1985
E Water Supply; Sewerage, Waste Management and Remediation Activities 6766 0.69 0.70 1150 0 0 0
F Construction 70697 7.23 7.23 12019 132 228 1894
G Wholesale & Retail Trade; Repair of Motor Vehicles & Motorcycles 153495 15.70 13.15 26094 168 290 1110
H Transport & Storage 48010 4.91 5.02 8162 144 248 3042
I Accommodation & Food Service Activities 58673 6.00 5.28 9974 144 248 2489
J Information & Communication 38504 3.94 3.96 6546 48 83 1264
K Financial & Insurance Activities 42986 4.40 4.01 7308 36 62 849
L Real Estate Activities 13548 1.39 1.19 2303 12 21 898
M Professional, Scientific & Technical Activities 63419 6.48 7.15 10781 0 0 0
N Administrative & Support Service Activities 46520 4.76 4.75 7908 72 124 1570
O Public Administration & Defence; Compulsory Social Security 64082 6.55 6.00 10894 84 145 1329
P Education 97938 10.01 10.53 16649 144 248 1491
Q Human Health & Social Work Activities 123908 12.67 13.36 21064 240 414 1964
R, S, T, U Arts, Entertainment, Service Activities and Other Industries 48124 4.92 5.94 8181 132 228 2782
Missing No industry recorded 0 - - 0 0 0 -
Total All Industry Sections (unadjusted for industrial distribution) 977954 100 100 166252 1548 2669 1605
Total GB All Industry Sections (adjusted for GB (LFS 2013) industrial distribution) - - - - - 1633
Note: Figures may not calculate exactly due to rounding
10
3.2 Calculation of incidence rates
THOR-GP participants reported 1548 estimated cases of work-related ill-health to
the scheme in 2015. Table 3 shows how this breaks down by industry. In order to
calculate incidence rates, these cases are adjusted by the reporter response rate of
58% (/0.58), divided by the corresponding denominator and multiplied by 100,000 (to
give an incidence rate expressed as new cases per 100,000 persons per year). A
GB adjusted rate for all cases is calculated by taking the average incidence rate of
each industry weighted by the proportional breakdown of the GB workforce
according to the LFS 2015.
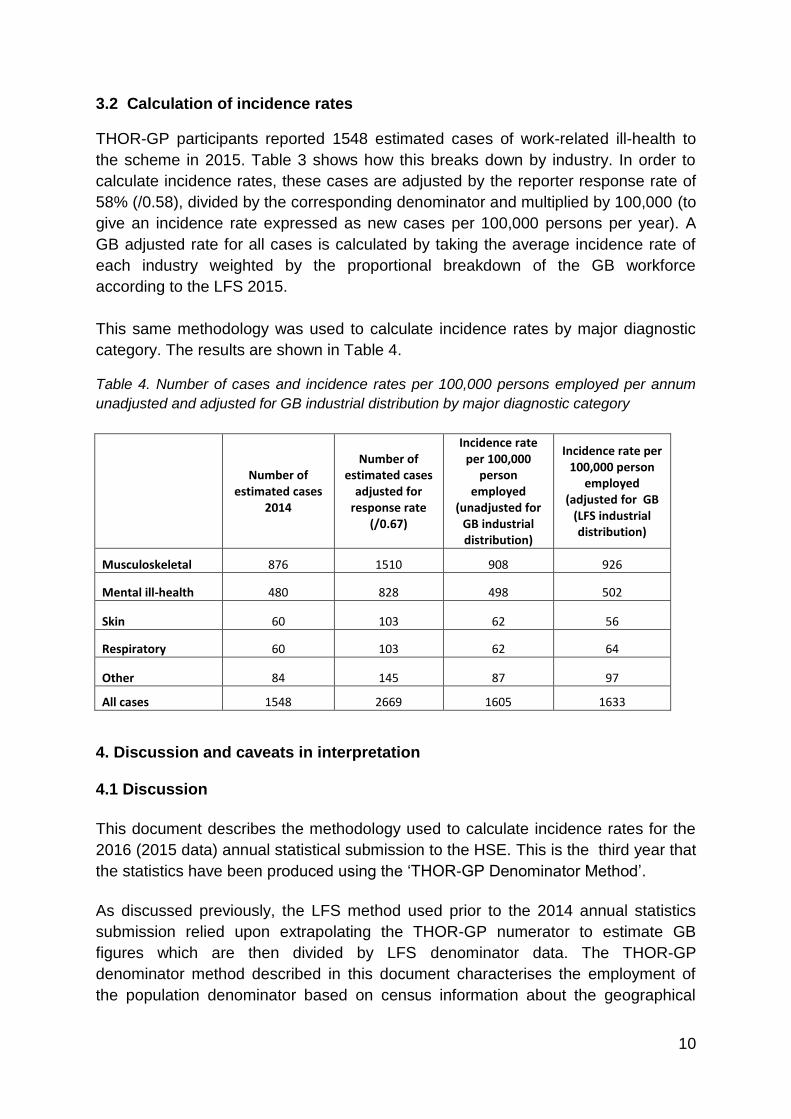
This same methodology was used to calculate incidence rates by major diagnostic
category. The results are shown in Table 4.
Table 4. Number of cases and incidence rates per 100,000 persons employed per annum
unadjusted and adjusted for GB industrial distribution by major diagnostic category
Number of
estimated cases 2014
Number of estimated cases
adjusted for response rate
(/0.67)
Incidence rate per 100,000
person employed
(unadjusted for GB industrial distribution)
Incidence rate per 100,000 person
employed (adjusted for GB
(LFS industrial distribution)
Musculoskeletal 876 1510 908 926
Mental ill-health 480 828 498 502
Skin 60 103 62 56
Respiratory 60 103 62 64
Other 84 145 87 97
All cases 1548 2669 1605 1633
4. Discussion and caveats in interpretation 4.1 Discussion
This document describes the methodology used to calculate incidence rates for the
2016 (2015 data) annual statistical submission to the HSE. This is the third year that
the statistics have been produced using the ‘THOR-GP Denominator Method’.
As discussed previously, the LFS method used prior to the 2014 annual statistics
submission relied upon extrapolating the THOR-GP numerator to estimate GB
figures which are then divided by LFS denominator data. The THOR-GP
denominator method described in this document characterises the employment of
the population denominator based on census information about the geographical
11
areas where the participants’ practices are based. It is also able to estimate well the
size of the population through published practice list size data, again using census
information to estimate what proportion of these registered patients are employed.
Incidence rates based on the THOR-GP population are then weighted to adjust for
any differences in industrial employment to give rates for GB as a whole.
There are assumptions that have to be made with the THOR-GP denominator
method which are likely to lead to some biases. As previously discussed, the THOR-
GP coverage of 17% was applied uniformly across all the practices meaning some of
the practices populations will be over-represented and others will be under-
represented. This method of estimating the denominator is also based on ecological
methods i.e. individuals registered with participating practices are not necessarily
employed as the Census area data suggests. There are also recognised
uncertainties (also as previously discussed) with the accuracy of the numerator with
the disparity shown in core:sample reporting.
4.2 Caveats in interpretation
There are a number of issues that should be considered when interpreting the data
as the following describes.
The data has some figures that may be small in number, especially when broken
down by industrial sectors, we would strongly caution against drawing conclusions
on proportions or rates based on small numbers. The number of actual cases on
which the incidence rate estimates are based are included in all tables to enable the
reader to be guided as regards the reliability of the estimates.
At the start of THOR-GP data collection, all participating GPs reported incident cases
every month (core reporters), thus permitting the rapid collection of relatively large
incident datasets for analysis and interpretation. As the scheme progressed, in
common with other THOR schemes, an increasing proportion (now 100%) of GPs
were asked to report incident data during only one randomly selected month of the
year (sample reporters). This helped to contain costs and also to reduce the potential
of GPs to 'fatigue' in their reporting. In line with the practice in the specialist THOR
schemes, estimates for the number of cases seen by the reporting group as a whole
were calculated by multiplying the case numbers reported by sample reporters by
12. However, from 2010, it became apparent when applying this approach to the
data, that the reporting rate per reporting month was much higher for sample
reporters than for core reporters.
Previously published work by us in relation to occupational physicians’ reporting (2)
in the OPRA scheme (a sister scheme of THOR-GP) showed that incidence rates
based on sample reporting were modestly (26%) higher than those based on core
reporting, to a degree that was plausibly ascribable to lower levels of under-reporting
12
in sample reporters. We concluded that it is not possible to be certain which type of
reporting (core or sample) gave estimates nearer the true incidence. However the
results of the study showed that the incidence for core reporters declines throughout
the year suggesting that these reporters might find the assembling and reporting of
cases every month an onerous task. Therefore the, evidence in respect of
occupational physicians reporting in OPRA suggests that incidence rates based on
sample reporting may be closer to the ‘true’ incidence. However sample reporting
may contain a degree of telescoping bias. The difference between reporting rates for
sample and core GP reporters in THOR-GP was much larger (than it was for
occupational physicians reporting); a factor of nearly threefold. The reasons for this
difference are unclear, but may be related to multiple consultations at GP level and
the fact that these may be dealt with by different practice members with ‘incident’
reports being recorded by the THOR-GP. Therefore, it can be argued that incidence
rates based on sample reports (as is the case in these data) may be over-estimated.
Further work is submitted to HSE in 2015 also concluded that sample reporting may
be closer to the true incidence (3). Measures have been put in place to help reduce
the risk of GPs reporting prevalent cases. When a GP reports a case they are
required to check a box confirming that they understand the guidelines about
reporting incident cases; it is hoped that this will reinforce the requirements for
THOR-GP case eligibility and make them consider more carefully whether the case
they are about submit is truly incident.
The number of cases reported by THOR-GPs has been adjusted by the GP
response rates and assumes that the rate and nature of incident cases seen by non-
responders would be the same as among those that did respond. It is difficult to
conclude how this assumption may influence the incidence estimates without
knowing the reasons for non-response. If reporters fail to submit a response because
they had nothing to report, incidence would be overestimated. However if,
alternatively, there is no response due to a reporter being too busy, they may well
have seen relevant cases which are not included in the data. Incidence rates might
therefore be underestimated.
In this study (and in other studies using geographical area based on census data),
the classifications are based on ecological methods and some error at an individual
level is inherent e.g. individuals registered with participating practices may not
necessarily be employed as the census area data suggests. Also, a number of the
practices included had branch surgeries, but only the MLSOA of the main practice
was used in population estimates based on practice postcode. However, as stated
previously, the inclusion of branch surgeries was found to have little effect on results
in other work (7). There may also be some inaccuracies incurred due to the doubling
up of the MLSOAs/IG areas where there were two participating THOR-GPs in a
single practice. GPs in a practice are unlikely to have an equal share in the patient
workload; however this was applied to a very small sample (5%) of the participating
practices.
13
The sickness absence information has been factored up to adjust for a 61%
estimated under-reporting of sickness absence days. This arises from auditing of
sickness absence data provided by participating GPs. A paper outlining this work
has recently been accepted by Occupational Medicine and is currently in press (17).
To date 22% of all sickness absence cases have been audited and results from
these have estimated that the total number of days sickness absence certified
reported with the case submissions is approximately 39% of the days certified until
the end of the actual sick leave. Participating GPs are asked to continue to submit
information on further sickness absence issued to previously reported cases and the
continuation of this may be difficult especially in cases of the long term sick. The
audit data has consistently shown this level of under-estimation, therefore the
sickness absence data has been adjusted to reflect this (as well as by reporter
response rate). However caution has to be applied to the interpretation of these. The
number of days sickness absence in GB is calculated by dividing the number of days
reported by participating GPs (adjusted by response rate and under-reporting) and
dividing this by the THOR-GP population denominator (166,252 persons) to obtain a
figure for the number of days absence per person in the THOR-GP population. This
is then multiplied by the number of persons employed in GB according to the LFS to
give an estimated figure for the national population.
14
Reference List
1. Hussey L. Methods and caveats relating to the calculation of incidence rates from THOR-GP data 2011. Available at: http://www.hse.gov.uk/statistics/calculation-thor-gp-data.pdf. Accessed April 25, 2012.
2. McNamee R. Time-sampled versus continuous-time reporting for measuring incidence. Epidemiology 2010;21:376.
3. Hussey L, McNamee R, Gittins M et al. Calculating incidence rates of work-related ill-health from caess reported from general practice. Centre for Occupational & Environmental Health, The University of Manchester, 2015.
4. Strong M, Maheswaran R, Pearson T et al. A method for modelling GP practice level deprivation scores using GIS. 6:38 Edition. 2007.
5. Griffin T, Peters T, Sharp D et al. Validation of an improved area-based method of calculating general practice-level deprivation. 63 Edition. 2010:746-51.
6. Mclean G, Guthrie B, Watt G et al. Practice postcode versus patient population: a comparison of data sources in England and Scotland. 7:37 Edition. 2008.
7. Strong M, Maheswaran R, Pearson T. A comparison of methods for calculating general practice level socioeconomic deprivation. 5:29 Edition. 2006.
8. Hussey L, McNamee R, Turner S et al. Characterising the size and employment of a GP study population; practice versus patient postcode? 2014.
9. Hussey L. THOR-GP input to HSE Annual Statistics 2013/2014. Note on methods used for calculating incidence rates and 'caveats' in interpretation 2014. Available at: http://www.hse.gov.uk/statistics/calculation-thor-gp-data.pdf.
10. Average Practice List Sizes in the UK. The NHS Information Centre. October 2008. The Health and Social Care Information Centre, 2008.
11. Neighbourhood Statistics 2014. Available at: http://www.neighbourhood.statistics.gov.uk/dissemination/LeadHome.do?m=0&s=1404471313528&enc=1&nsjs=true&nsck=false&nssvg=false&nswid=1280.
12. Scotland's Census 2011 2014. Available at: http://www.scotlandscensus.gov.uk/r2-downloadable-files.
13. Numbers of Patients Registered at a GP Practice - October 2013 2014. Available at: http://www.hscic.gov.uk/catalogue/PUB11818.
14. Registered patients and number of GPs by practice 2014. Available at: http://wales.gov.uk/statistics-and-research/general-medical-practitioners/?lang=en.

15
15. Practices and their populations 2014. Available at: http://www.isdscotland.org/Health-Topics/General-Practice/Workforce-and-Practice-Populations/Practices-and-Their-Populations/.
16. Hussey L, Turner S, Thorley K et al. Work-related sickness absence as reported by UK general practitioners. Occup Med 2012;62:105-11.
17. Hussey L, Thorley K, Agius R. Reporting and prediction of work-related sickness absence by general practitioners . Occupational medicine 2016;In Press.
16
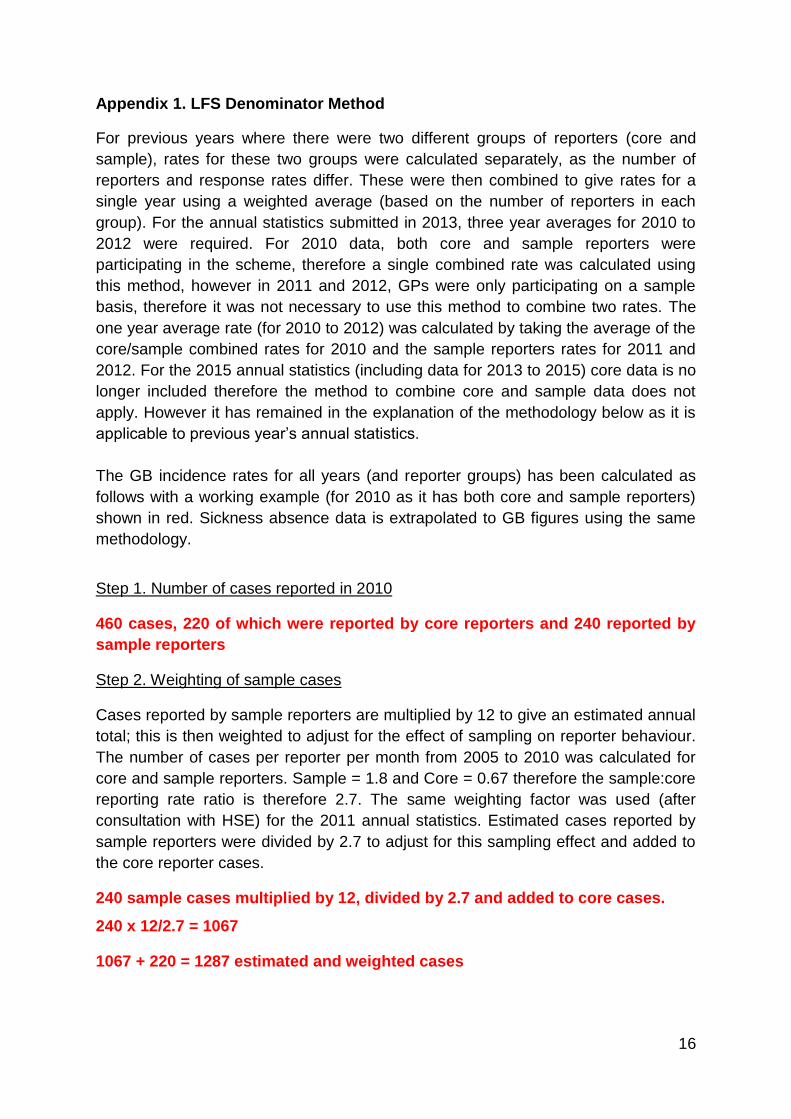
Appendix 1. LFS Denominator Method
For previous years where there were two different groups of reporters (core and
sample), rates for these two groups were calculated separately, as the number of
reporters and response rates differ. These were then combined to give rates for a
single year using a weighted average (based on the number of reporters in each
group). For the annual statistics submitted in 2013, three year averages for 2010 to
2012 were required. For 2010 data, both core and sample reporters were
participating in the scheme, therefore a single combined rate was calculated using
this method, however in 2011 and 2012, GPs were only participating on a sample
basis, therefore it was not necessary to use this method to combine two rates. The
one year average rate (for 2010 to 2012) was calculated by taking the average of the
core/sample combined rates for 2010 and the sample reporters rates for 2011 and
2012. For the 2015 annual statistics (including data for 2013 to 2015) core data is no
longer included therefore the method to combine core and sample data does not
apply. However it has remained in the explanation of the methodology below as it is
applicable to previous year’s annual statistics.
The GB incidence rates for all years (and reporter groups) has been calculated as
follows with a working example (for 2010 as it has both core and sample reporters)
shown in red. Sickness absence data is extrapolated to GB figures using the same
methodology.
Step 1. Number of cases reported in 2010
460 cases, 220 of which were reported by core reporters and 240 reported by
sample reporters
Step 2. Weighting of sample cases
Cases reported by sample reporters are multiplied by 12 to give an estimated annual
total; this is then weighted to adjust for the effect of sampling on reporter behaviour.
The number of cases per reporter per month from 2005 to 2010 was calculated for
core and sample reporters. Sample = 1.8 and Core = 0.67 therefore the sample:core
reporting rate ratio is therefore 2.7. The same weighting factor was used (after
consultation with HSE) for the 2011 annual statistics. Estimated cases reported by
sample reporters were divided by 2.7 to adjust for this sampling effect and added to
the core reporter cases.
240 sample cases multiplied by 12, divided by 2.7 and added to core cases.
240 x 12/2.7 = 1067
1067 + 220 = 1287 estimated and weighted cases
17
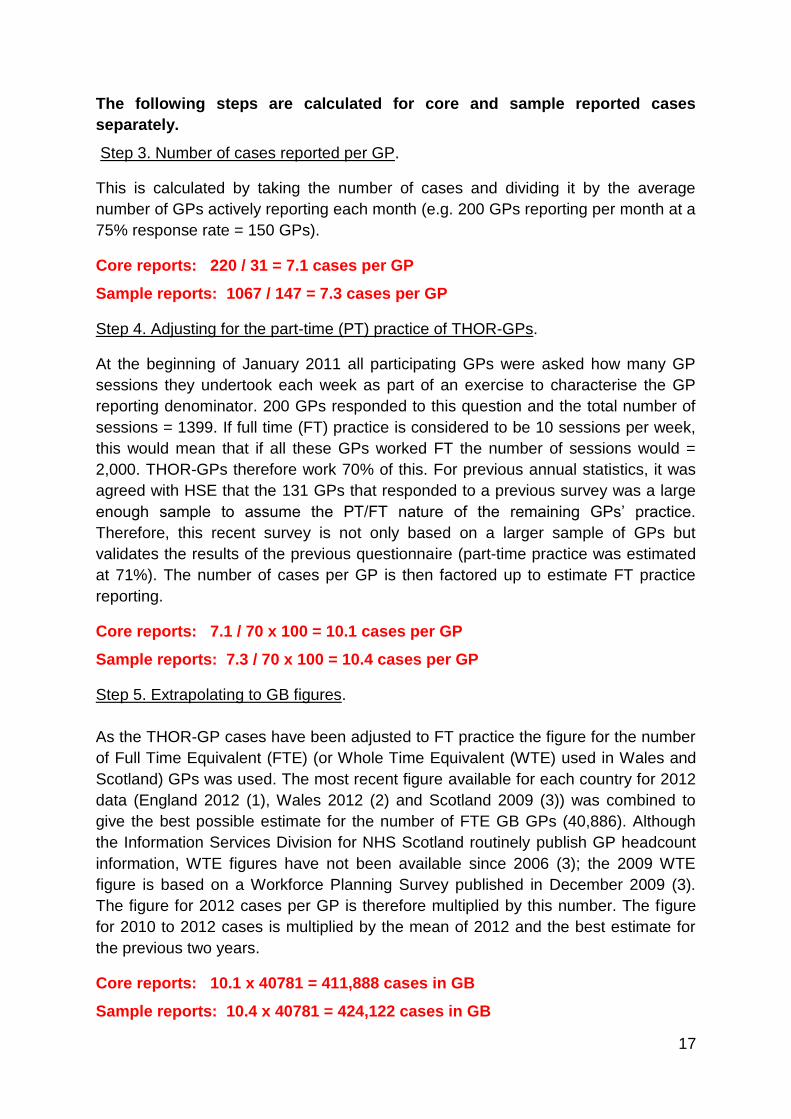
The following steps are calculated for core and sample reported cases
separately.
Step 3. Number of cases reported per GP.
This is calculated by taking the number of cases and dividing it by the average
number of GPs actively reporting each month (e.g. 200 GPs reporting per month at a
75% response rate = 150 GPs).
Core reports: 220 / 31 = 7.1 cases per GP
Sample reports: 1067 / 147 = 7.3 cases per GP
Step 4. Adjusting for the part-time (PT) practice of THOR-GPs.
At the beginning of January 2011 all participating GPs were asked how many GP
sessions they undertook each week as part of an exercise to characterise the GP
reporting denominator. 200 GPs responded to this question and the total number of
sessions = 1399. If full time (FT) practice is considered to be 10 sessions per week,
this would mean that if all these GPs worked FT the number of sessions would =
2,000. THOR-GPs therefore work 70% of this. For previous annual statistics, it was
agreed with HSE that the 131 GPs that responded to a previous survey was a large
enough sample to assume the PT/FT nature of the remaining GPs’ practice.
Therefore, this recent survey is not only based on a larger sample of GPs but
validates the results of the previous questionnaire (part-time practice was estimated
at 71%). The number of cases per GP is then factored up to estimate FT practice
reporting.
Core reports: 7.1 / 70 x 100 = 10.1 cases per GP
Sample reports: 7.3 / 70 x 100 = 10.4 cases per GP
Step 5. Extrapolating to GB figures.
As the THOR-GP cases have been adjusted to FT practice the figure for the number
of Full Time Equivalent (FTE) (or Whole Time Equivalent (WTE) used in Wales and
Scotland) GPs was used. The most recent figure available for each country for 2012
data (England 2012 (1), Wales 2012 (2) and Scotland 2009 (3)) was combined to
give the best possible estimate for the number of FTE GB GPs (40,886). Although
the Information Services Division for NHS Scotland routinely publish GP headcount
information, WTE figures have not been available since 2006 (3); the 2009 WTE
figure is based on a Workforce Planning Survey published in December 2009 (3).
The figure for 2012 cases per GP is therefore multiplied by this number. The figure
for 2010 to 2012 cases is multiplied by the mean of 2012 and the best estimate for
the previous two years.
Core reports: 10.1 x 40781 = 411,888 cases in GB
Sample reports: 10.4 x 40781 = 424,122 cases in GB
18
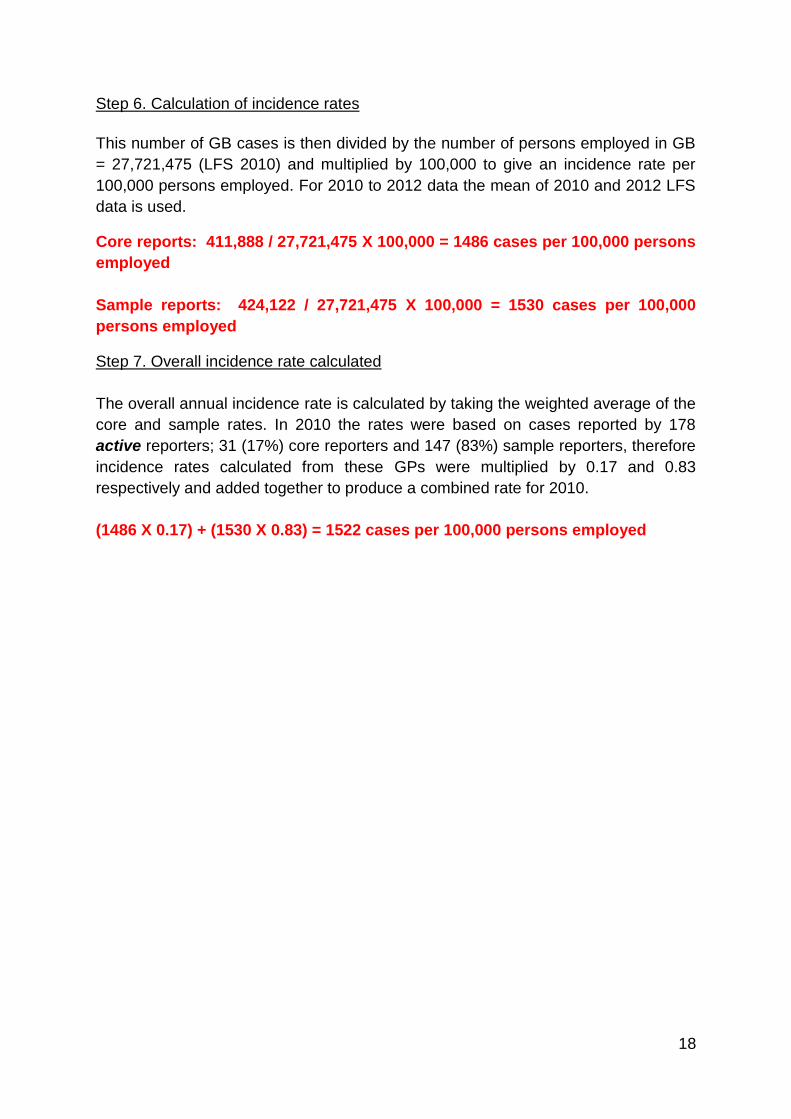
Step 6. Calculation of incidence rates
This number of GB cases is then divided by the number of persons employed in GB
= 27,721,475 (LFS 2010) and multiplied by 100,000 to give an incidence rate per
100,000 persons employed. For 2010 to 2012 data the mean of 2010 and 2012 LFS
data is used.
Core reports: 411,888 / 27,721,475 X 100,000 = 1486 cases per 100,000 persons
employed
Sample reports: 424,122 / 27,721,475 X 100,000 = 1530 cases per 100,000
persons employed
Step 7. Overall incidence rate calculated
The overall annual incidence rate is calculated by taking the weighted average of the
core and sample rates. In 2010 the rates were based on cases reported by 178
active reporters; 31 (17%) core reporters and 147 (83%) sample reporters, therefore
incidence rates calculated from these GPs were multiplied by 0.17 and 0.83
respectively and added together to produce a combined rate for 2010.
(1486 X 0.17) + (1530 X 0.83) = 1522 cases per 100,000 persons employed