Thomas Young, IRPA & OI Advisory Board Member
30
MARKET BRIEFING AND TRENDS www.outsourcing.com www.IRPAnetwork.com Thomas Young, IRPA & OI Advisory Board Member March 2014
Transcript of Thomas Young, IRPA & OI Advisory Board Member
MARKET BRIEFING AND TRENDS
www.outsourcing.com www.IRPAnetwork.com
Thomas Young, IRPA & OI Advisory Board Member
March 2014
PO
LAR S
HIFT IN
THE R
ELATIO
N O
F TEC
HN
OLO
GY &
LA
BO
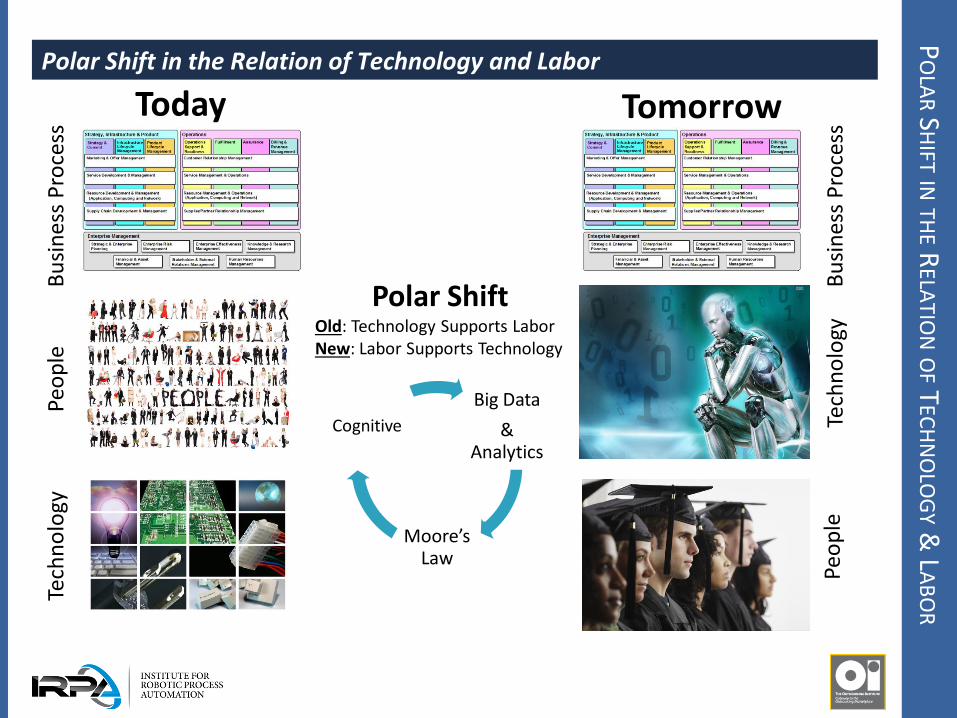
R Polar Shift in the Relation of Technology and Labor
Bu
sin
ess
Pro
cess
Te
chn
olo
gy
Peo
ple
Bu
sin
ess
Pro
cess
Te
chn
olo
gy
Peo
ple
Big Data
& Analytics
Moore’s Law
Cognitive
Polar Shift Old: Technology Supports Labor New: Labor Supports Technology
Today Tomorrow
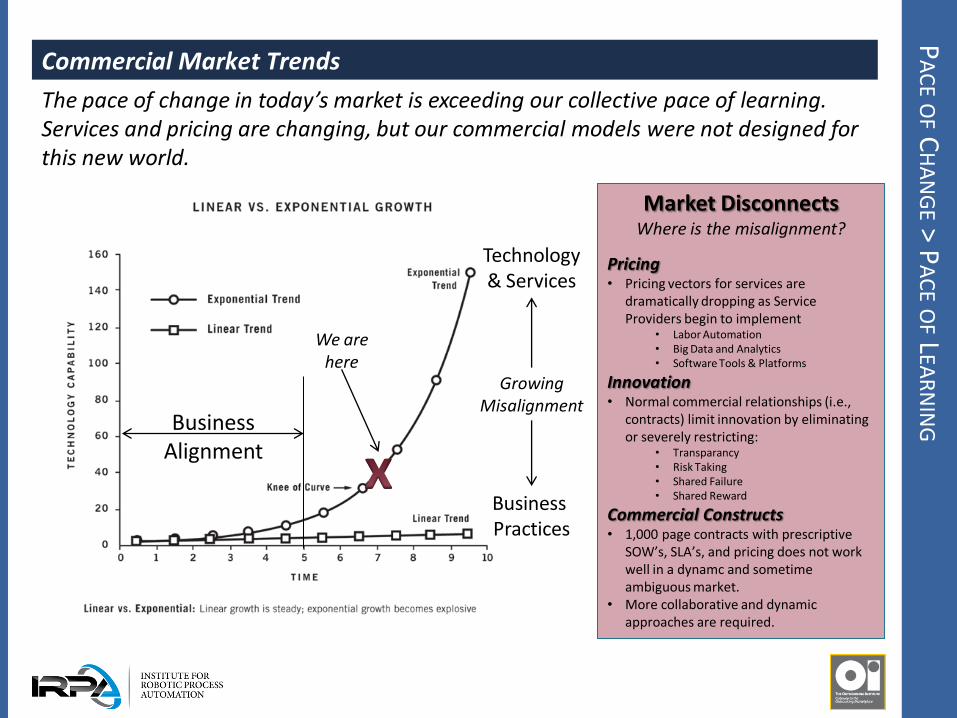
The pace of change in today’s market is exceeding our collective pace of learning. Services and pricing are changing, but our commercial models were not designed for this new world.
Business Alignment
Technology & Services
Business Practices
We are here
Growing Misalignment
Market Disconnects Where is the misalignment?
Pricing • Pricing vectors for services are
dramatically dropping as Service Providers begin to implement
• Labor Automation • Big Data and Analytics • Software Tools & Platforms
Innovation • Normal commercial relationships (i.e.,
contracts) limit innovation by eliminating or severely restricting:
• Transparancy • Risk Taking • Shared Failure • Shared Reward
Commercial Constructs • 1,000 page contracts with prescriptive
SOW’s, SLA’s, and pricing does not work well in a dynamc and sometime ambiguous market.
• More collaborative and dynamic approaches are required.
PA
CE O
F CH
AN
GE >
PA
CE O
F LEA
RN
ING
Commercial Market Trends
EV
OLU
TION
OF TH
E BU
YING E
CO
SYSTEM
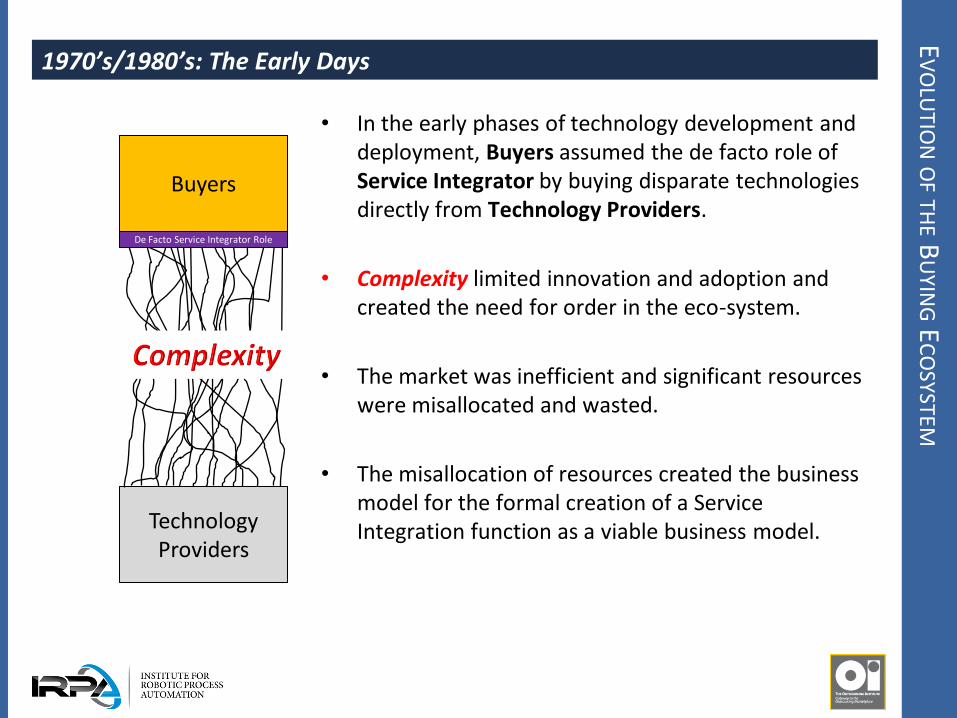
1970’s/1980’s: The Early Days
• In the early phases of technology development and deployment, Buyers assumed the de facto role of Service Integrator by buying disparate technologies directly from Technology Providers.
• Complexity limited innovation and adoption and created the need for order in the eco-system.
• The market was inefficient and significant resources were misallocated and wasted.
• The misallocation of resources created the business model for the formal creation of a Service Integration function as a viable business model.
Buyers
Technology Providers
De Facto Service Integrator Role
EV
OLU
TION
OF TH
E BU
YING E
CO
SYSTEM
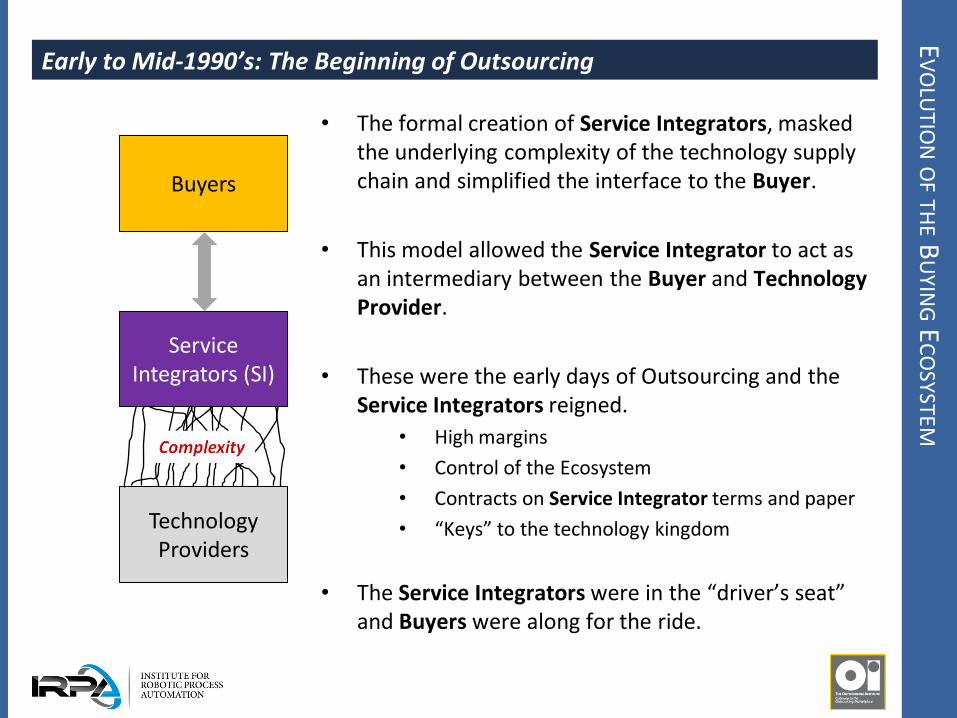
Early to Mid-1990’s: The Beginning of Outsourcing
• The formal creation of Service Integrators, masked the underlying complexity of the technology supply chain and simplified the interface to the Buyer.
• This model allowed the Service Integrator to act as an intermediary between the Buyer and Technology Provider.
• These were the early days of Outsourcing and the Service Integrators reigned.
• High margins
• Control of the Ecosystem
• Contracts on Service Integrator terms and paper
• “Keys” to the technology kingdom
• The Service Integrators were in the “driver’s seat” and Buyers were along for the ride.
Technology Providers
Buyers
Service Integrators (SI)
EV
OLU
TION
OF TH
E BU
YING E
CO
SYSTEM
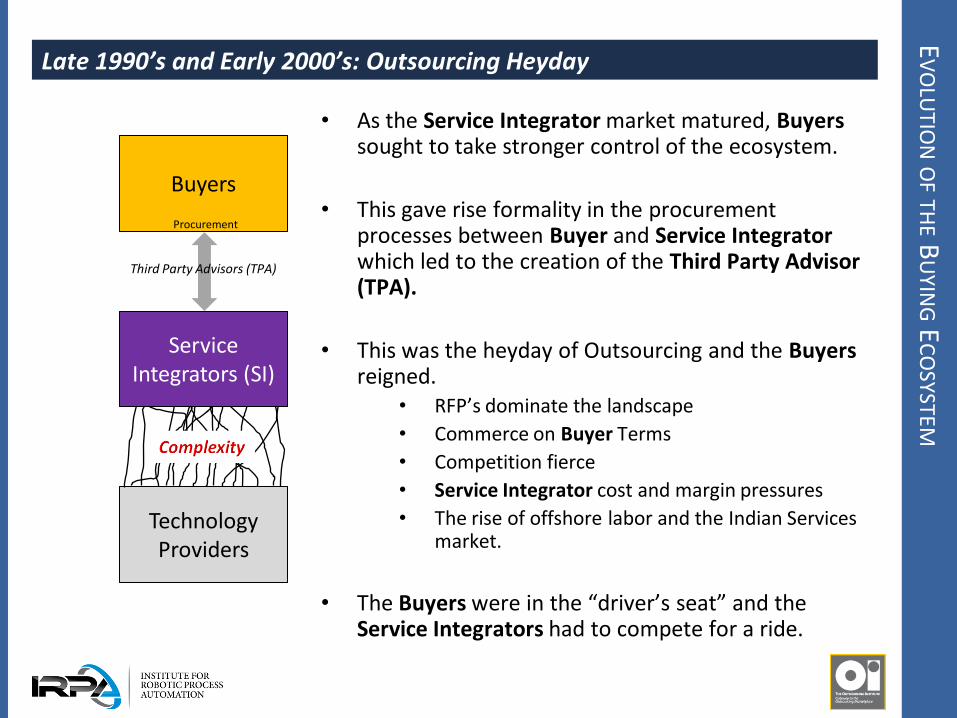
Late 1990’s and Early 2000’s: Outsourcing Heyday
• As the Service Integrator market matured, Buyers sought to take stronger control of the ecosystem.
• This gave rise formality in the procurement processes between Buyer and Service Integrator which led to the creation of the Third Party Advisor (TPA).
• This was the heyday of Outsourcing and the Buyers reigned.
• RFP’s dominate the landscape
• Commerce on Buyer Terms
• Competition fierce
• Service Integrator cost and margin pressures
• The rise of offshore labor and the Indian Services market.
• The Buyers were in the “driver’s seat” and the Service Integrators had to compete for a ride.
Technology Providers
Buyers
Service Integrators (SI)
Procurement
Third Party Advisors (TPA)
EV
OLU
TION
OF TH
E BU
YING E
CO
SYSTEM
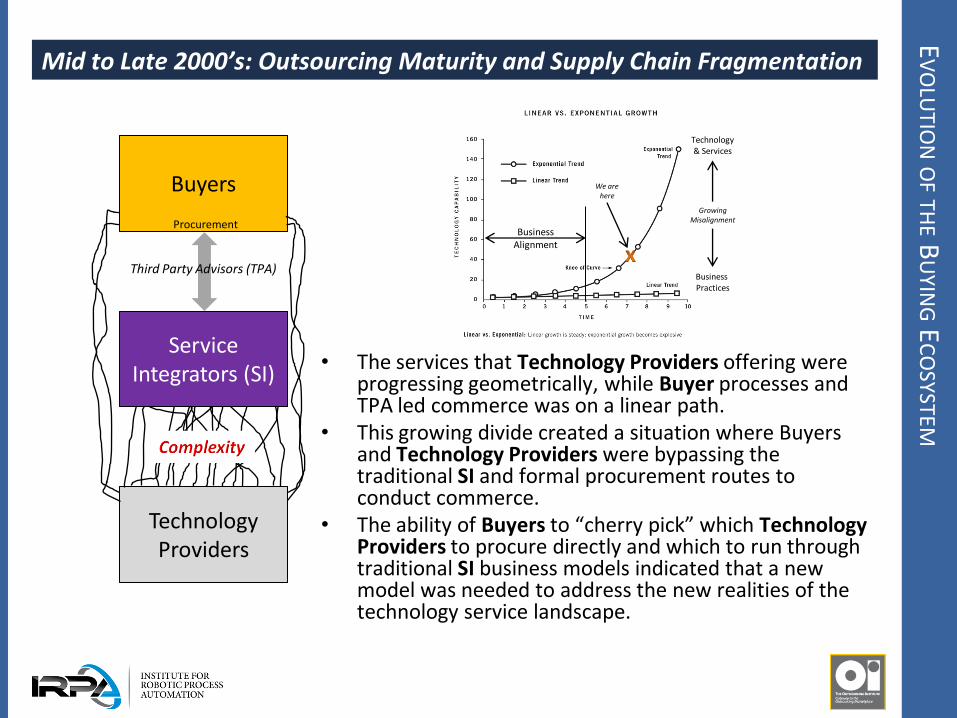
Mid to Late 2000’s: Outsourcing Maturity and Supply Chain Fragmentation
• The services that Technology Providers offering were
progressing geometrically, while Buyer processes and TPA led commerce was on a linear path.
• This growing divide created a situation where Buyers and Technology Providers were bypassing the traditional SI and formal procurement routes to conduct commerce.
• The ability of Buyers to “cherry pick” which Technology Providers to procure directly and which to run through traditional SI business models indicated that a new model was needed to address the new realities of the technology service landscape.
Technology Providers
Buyers
Service Integrators (SI)
Procurement
Third Party Advisors (TPA)
Business Alignment
Technology & Services
Business Practices
We are here
Growing Misalignment
EV
OLU
TION
OF TH
E BU
YING E
CO
SYSTEM
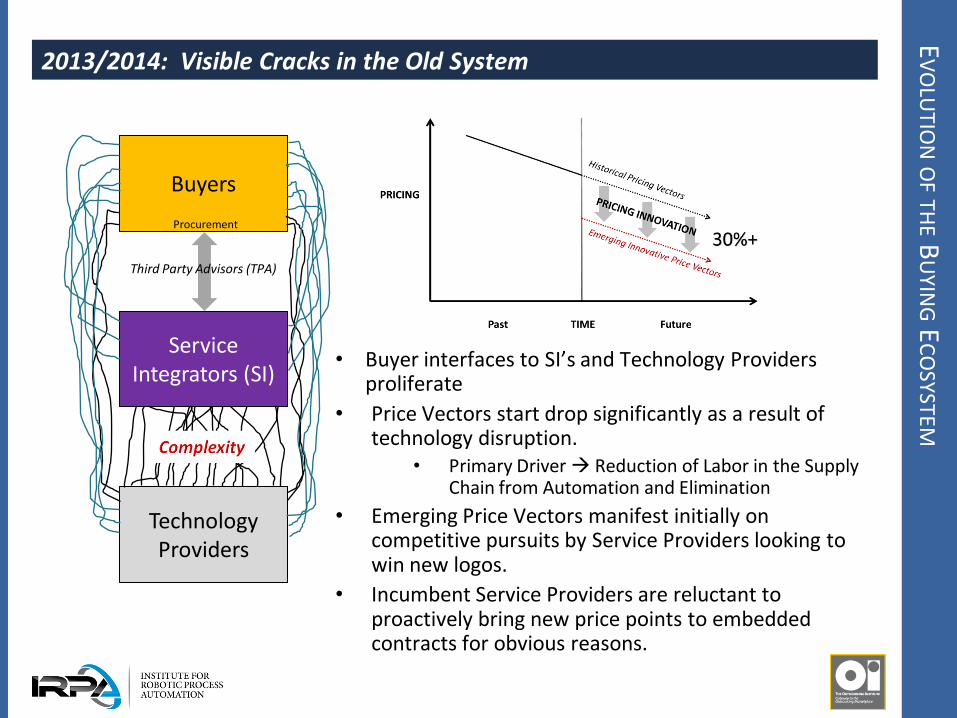
2013/2014: Visible Cracks in the Old System
Technology Providers
Buyers
Service Integrators (SI)
Procurement
Third Party Advisors (TPA)
• Buyer interfaces to SI’s and Technology Providers proliferate
• Price Vectors start drop significantly as a result of technology disruption.
• Primary Driver Reduction of Labor in the Supply Chain from Automation and Elimination
• Emerging Price Vectors manifest initially on competitive pursuits by Service Providers looking to win new logos.
• Incumbent Service Providers are reluctant to proactively bring new price points to embedded contracts for obvious reasons.
IBM
GLO
BA
L TEC
HN
OLO
GY S
ERV
ICES
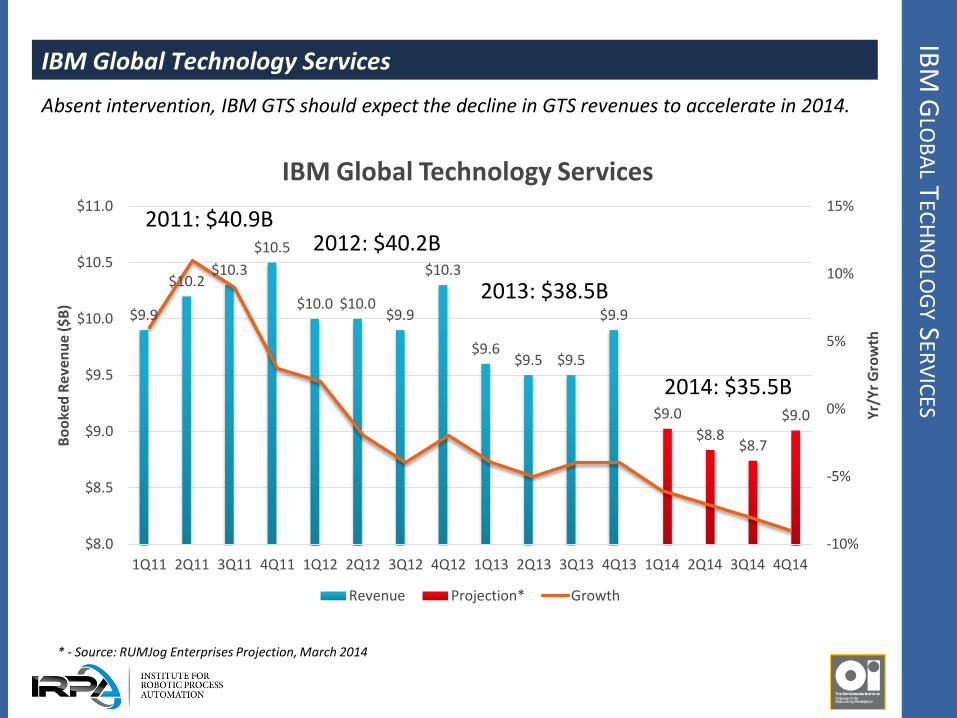
IBM Global Technology Services
Absent intervention, IBM GTS should expect the decline in GTS revenues to accelerate in 2014.
$9.9
$10.2 $10.3
$10.5
$10.0 $10.0 $9.9
$10.3
$9.6 $9.5 $9.5
$9.9
$9.0
$8.8 $8.7
$9.0
-10%
-5%
0%
5%
10%
15%
$8.0
$8.5
$9.0
$9.5
$10.0
$10.5
$11.0
1Q11 2Q11 3Q11 4Q11 1Q12 2Q12 3Q12 4Q12 1Q13 2Q13 3Q13 4Q13 1Q14 2Q14 3Q14 4Q14
Yr/
Yr
Gro
wth
Bo
oke
d R
even
ue
($B
)
IBM Global Technology Services
Revenue Projection* Growth
2013: $38.5B
2014: $35.5B
* - Source: RUMJog Enterprises Projection, March 2014
2012: $40.2B 2011: $40.9B

HP
EN
TERP
RISE S
ERV
ICES
HP Enterprise Services
Absent intervention, HP Enterprise Services will decline to quarterly revenues below $5.0B starting in 3Q14 and incur and operating loss in 3Q and 4Q 2014.
$6.2
$6.6 $6.7
$6.8
$6.4
$6.6 $6.4 $6.4
$5.9 $6.0
$5.8 $5.8
$5.6
$5.3
$5.0
$4.6
-8%
-6%
-4%
-2%
0%
2%
4%
6%
8%
$4.0
$4.5
$5.0
$5.5
$6.0
$6.5
$7.0
1Q11 2Q11 3Q11 4Q11 1Q12 2Q12 3Q12 4Q12 1Q13 2Q13 3Q13 4Q13 1Q14 2Q14 3Q14 4Q14
Yr/
Yr
Gro
wth
Bo
oke
d R
even
ue
($B
)
HP Enterprise Services
Revenue Projection* Growth
2013: $23.5B
2012: $25.7B 2011: $26.3B
2014: $20.6B
* - Source: RUMJog Enterprises Projection, March 2014
TR
END
S IN TH
E TEC
HN
OLO
GY S
OU
RC
ING M
AR
KET
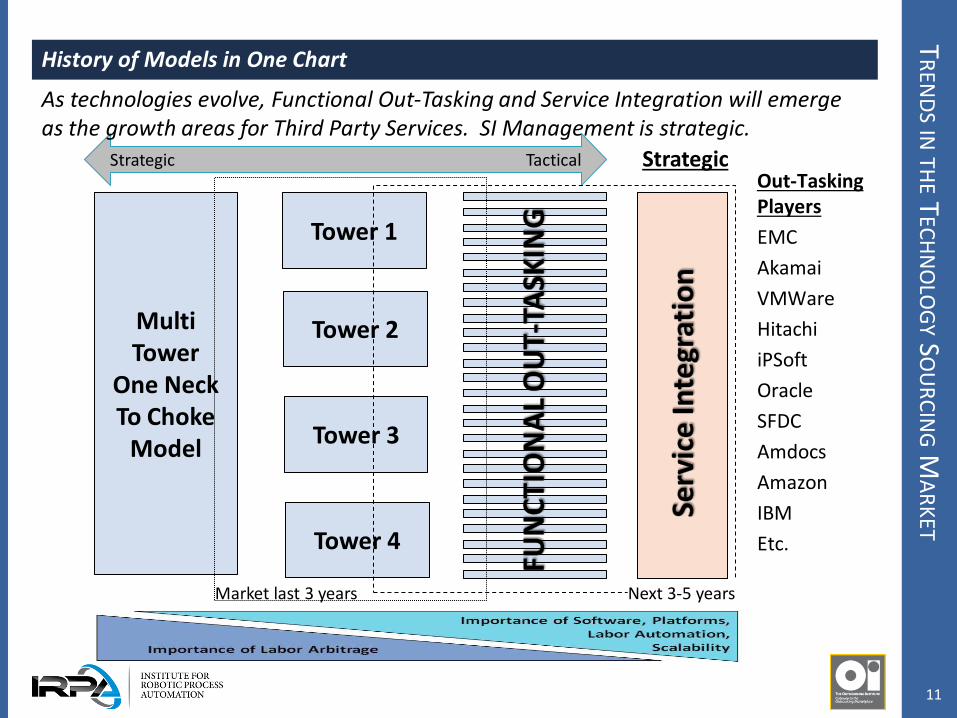
History of Models in One Chart
Out-Tasking Players
EMC
Akamai
VMWare
Hitachi
iPSoft
Oracle
SFDC
Amdocs
Amazon
IBM
Etc.
Multi Tower
One Neck To Choke
Model
Tower 2
Tower 3
Tower 4
Market last 3 years
Strategic Tactical
Tower 1
Next 3-5 years
Strategic
11
As technologies evolve, Functional Out-Tasking and Service Integration will emerge as the growth areas for Third Party Services. SI Management is strategic.
FU
NC
TION
AL O
UT-T
ASK
ING
: WH
AT’S TH
E BIG D
EAL
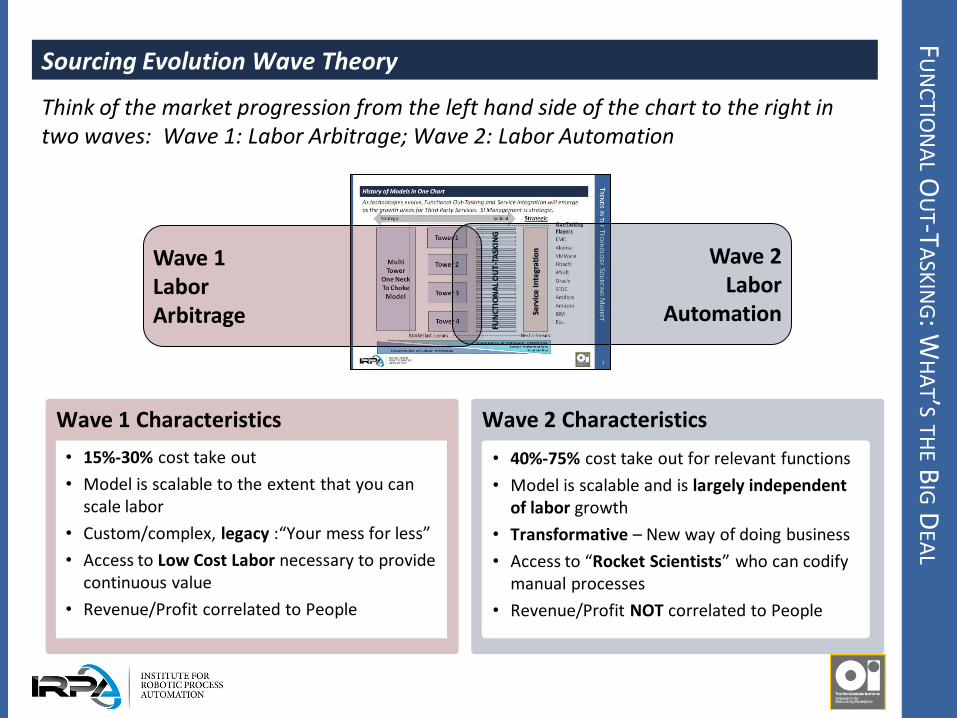
Sourcing Evolution Wave Theory
Think of the market progression from the left hand side of the chart to the right in two waves: Wave 1: Labor Arbitrage; Wave 2: Labor Automation
Wave 2 Characteristics Wave 1 Characteristics
• 15%-30% cost take out
• Model is scalable to the extent that you can scale labor
• Custom/complex, legacy :“Your mess for less”
• Access to Low Cost Labor necessary to provide continuous value
• Revenue/Profit correlated to People
• 40%-75% cost take out for relevant functions
• Model is scalable and is largely independent of labor growth
• Transformative – New way of doing business
• Access to “Rocket Scientists” who can codify manual processes
• Revenue/Profit NOT correlated to People
Wave 1 Labor Arbitrage
Wave 2 Labor
Automation
EC
ON
OM
ICS O
F THE F
UTU
RE
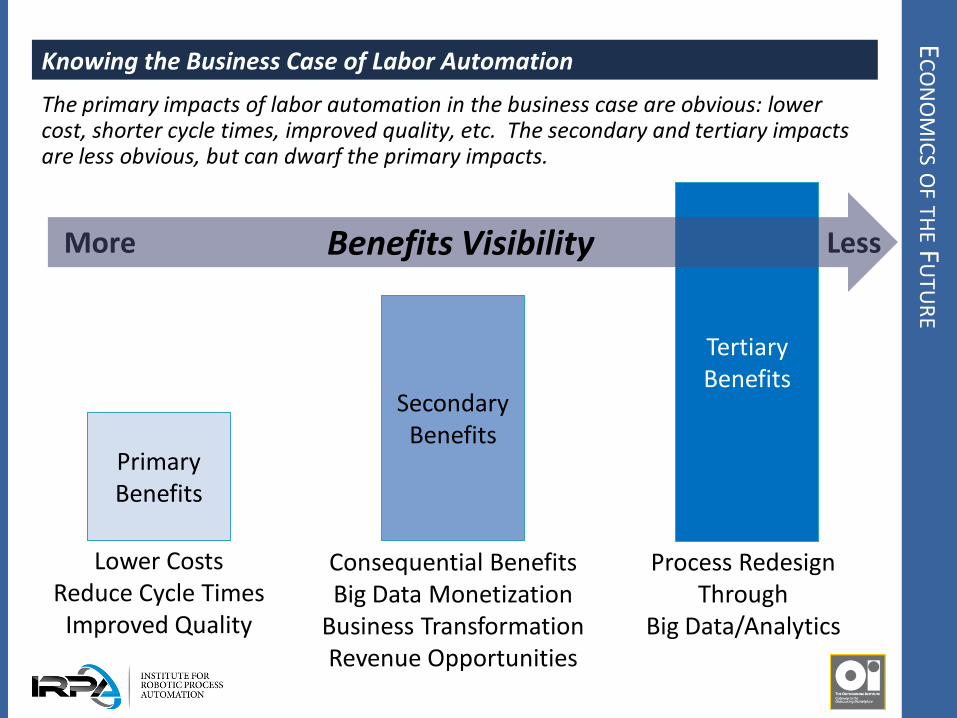
Knowing the Business Case of Labor Automation
Primary Benefits
Secondary Benefits
Lower Costs Reduce Cycle Times
Improved Quality
Consequential Benefits Big Data Monetization
Business Transformation Revenue Opportunities
Tertiary Benefits
Process Redesign Through
Big Data/Analytics
More Less Benefits Visibility
The primary impacts of labor automation in the business case are obvious: lower cost, shorter cycle times, improved quality, etc. The secondary and tertiary impacts are less obvious, but can dwarf the primary impacts.

EV
OLU
TION
OF TH
E BU
YING E
CO
SYSTEM
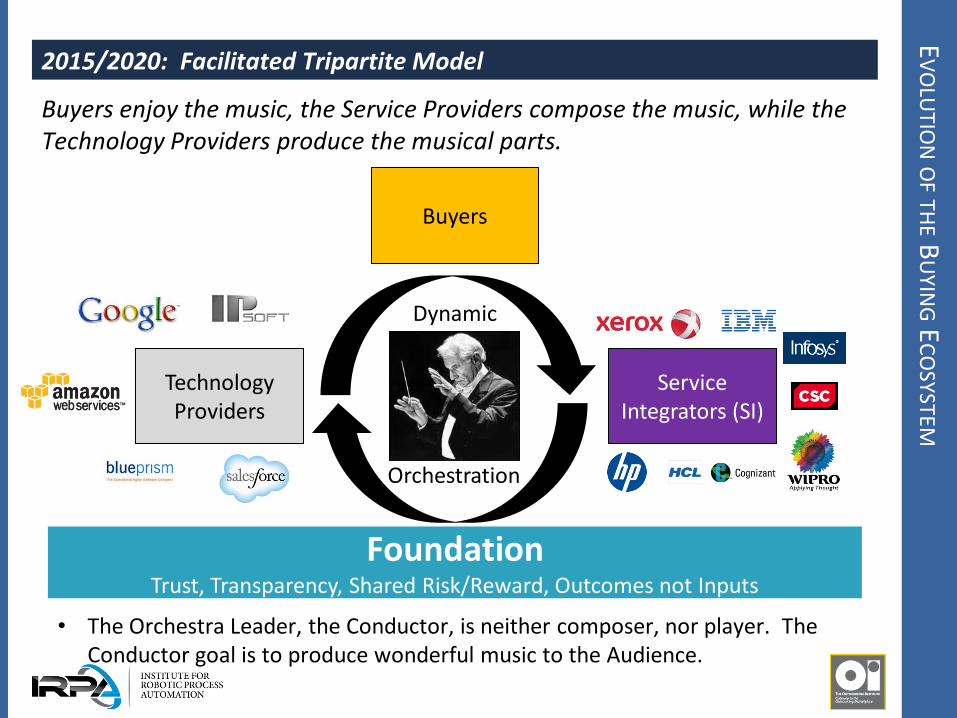
2015/2020: Facilitated Tripartite Model
Technology Providers
Buyers
Service Integrators (SI)
Foundation Trust, Transparency, Shared Risk/Reward, Outcomes not Inputs
Dynamic
Orchestration
• The Orchestra Leader, the Conductor, is neither composer, nor player. The Conductor goal is to produce wonderful music to the Audience.
Buyers enjoy the music, the Service Providers compose the music, while the Technology Providers produce the musical parts.
SO
UR
CIN
G SU
CC
ESS IN A D
YNA
MIC M
AR
KET
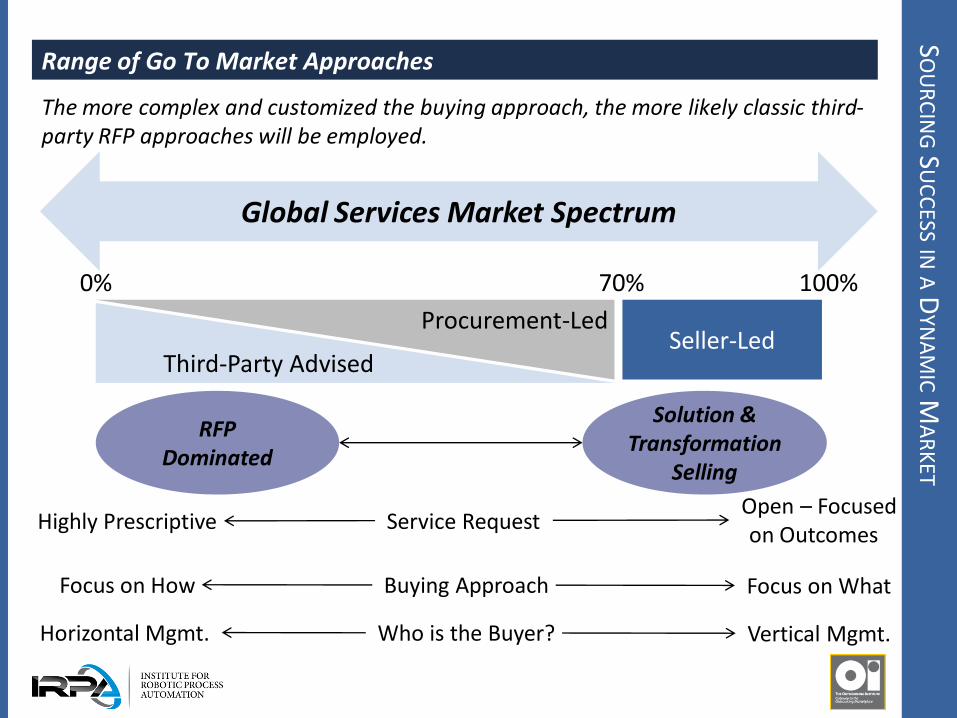
Range of Go To Market Approaches
The more complex and customized the buying approach, the more likely classic third-party RFP approaches will be employed.
Global Services Market Spectrum
Third-Party Advised Seller-Led
Procurement-Led
70% 0% 100%
RFP Dominated
Solution & Transformation
Selling
Highly Prescriptive Open – Focused
on Outcomes Service Request
Focus on How Focus on What Buying Approach
Horizontal Mgmt. Vertical Mgmt. Who is the Buyer?
SO
UR
CIN
G SU
CC
ESS IN A D
YNA
MIC M
AR
KET
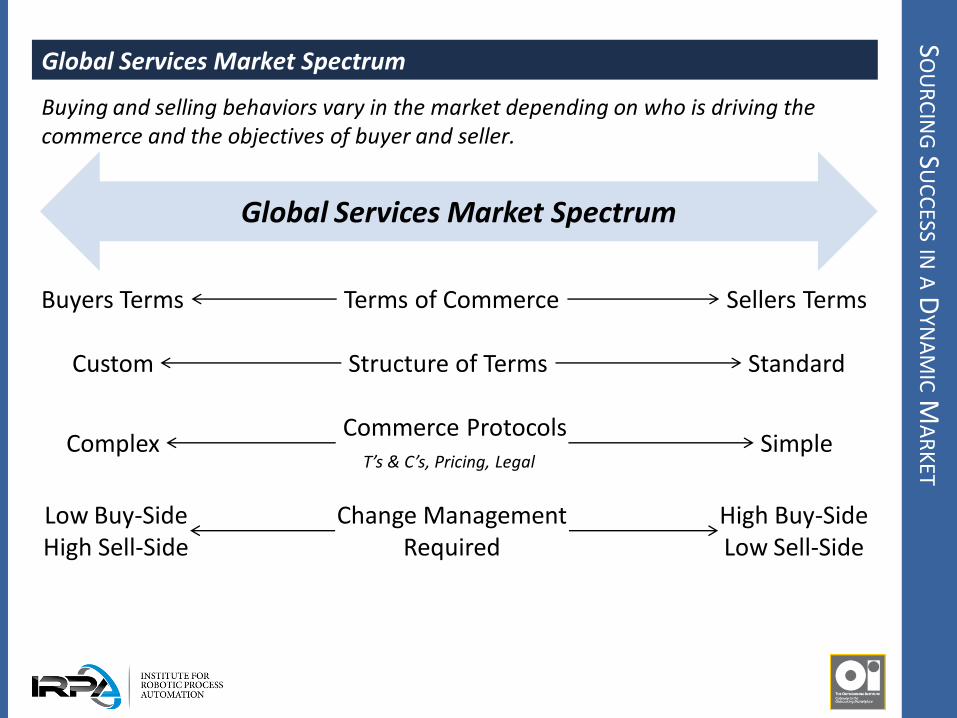
Global Services Market Spectrum
Buying and selling behaviors vary in the market depending on who is driving the commerce and the objectives of buyer and seller.
Global Services Market Spectrum
Buyers Terms Sellers Terms
Custom Standard
Complex Simple
Low Buy-Side High Sell-Side
High Buy-Side Low Sell-Side
Terms of Commerce
Structure of Terms
Commerce Protocols T’s & C’s, Pricing, Legal
Change Management Required
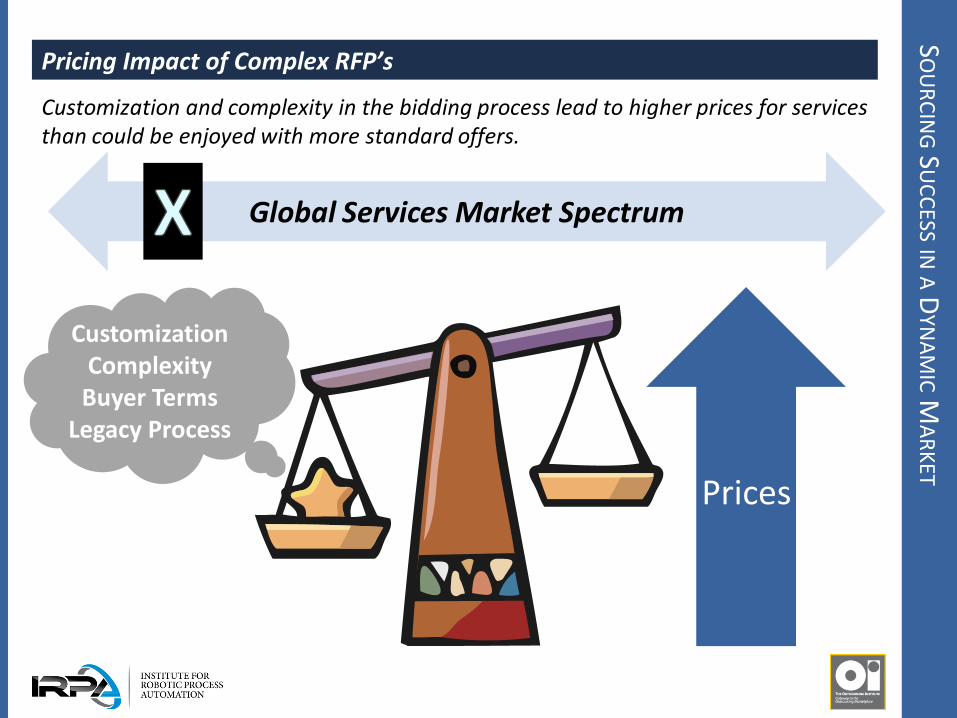
Pricing Impact of Complex RFP’s
Customization and complexity in the bidding process lead to higher prices for services than could be enjoyed with more standard offers.
SO
UR
CIN
G SU
CC
ESS IN A D
YNA
MIC M
AR
KET
Global Services Market Spectrum
Customization Complexity
Buyer Terms Legacy Process
Prices
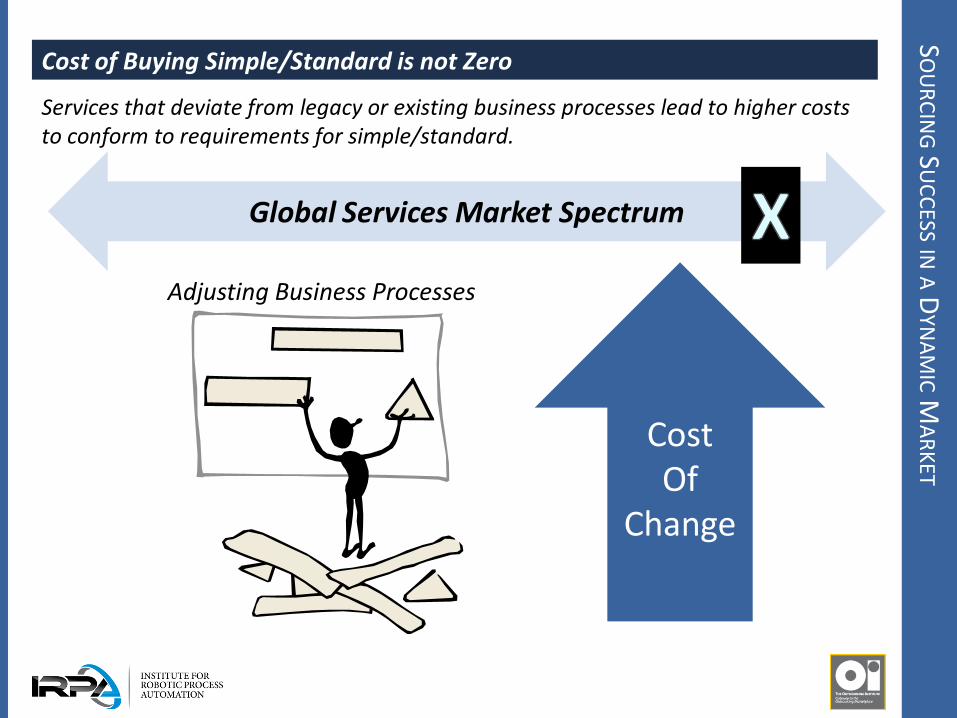
Cost of Buying Simple/Standard is not Zero
Services that deviate from legacy or existing business processes lead to higher costs to conform to requirements for simple/standard.
SO
UR
CIN
G SU
CC
ESS IN A D
YNA
MIC M
AR
KET
Global Services Market Spectrum
Cost Of
Change
Adjusting Business Processes
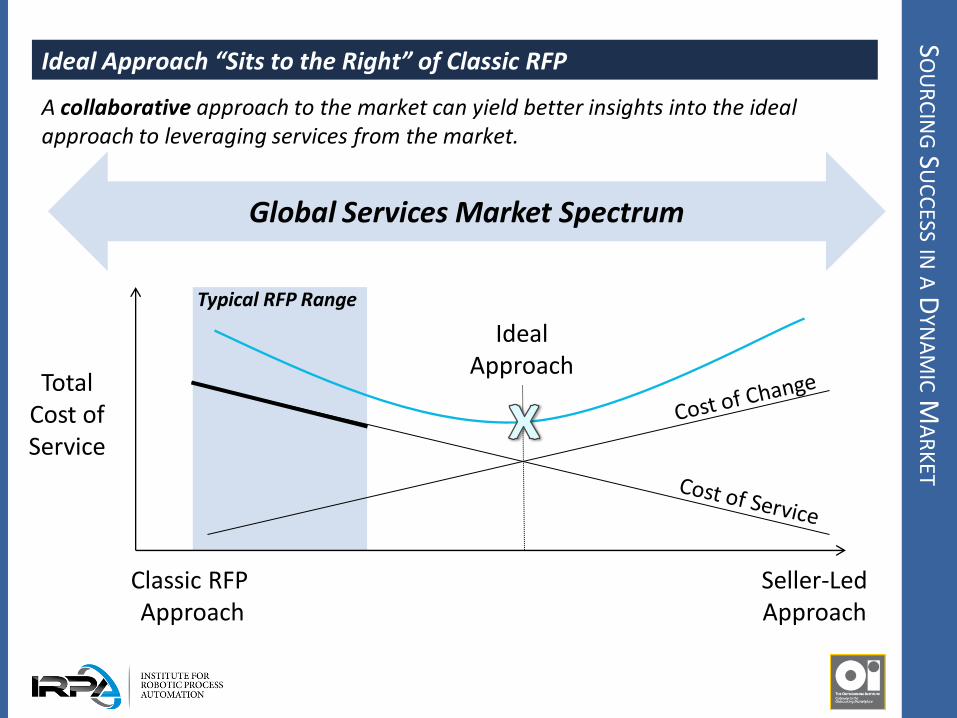
Ideal Approach “Sits to the Right” of Classic RFP
A collaborative approach to the market can yield better insights into the ideal approach to leveraging services from the market.
SO
UR
CIN
G SU
CC
ESS IN A D
YNA
MIC M
AR
KET
Global Services Market Spectrum
Total Cost of Service
Classic RFP Approach
Seller-Led Approach
Ideal Approach
Typical RFP Range
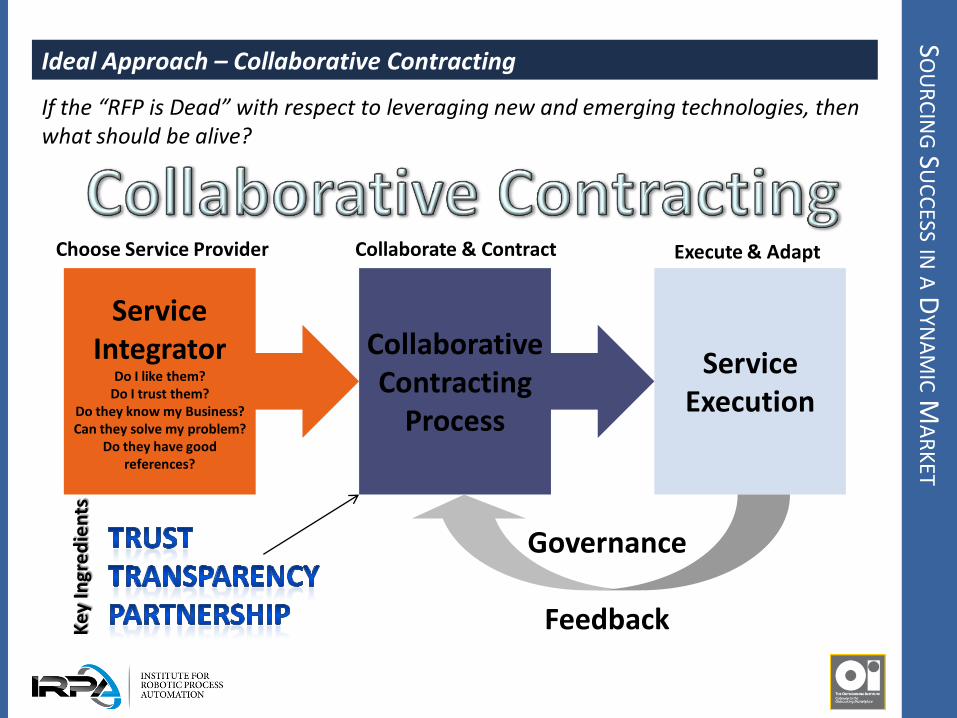
Ideal Approach – Collaborative Contracting
If the “RFP is Dead” with respect to leveraging new and emerging technologies, then what should be alive?
SO
UR
CIN
G SU
CC
ESS IN A D
YNA
MIC M
AR
KET
Service Integrator
Do I like them? Do I trust them?
Do they know my Business? Can they solve my problem?
Do they have good references?
Collaborative Contracting
Process
Service Execution
Governance
Feedback
Choose Service Provider Collaborate & Contract Execute & Adapt
Key
Ingr
ed
ien
ts
CO
LLAB
OR
ATIV
E CO
NTR
AC
TING
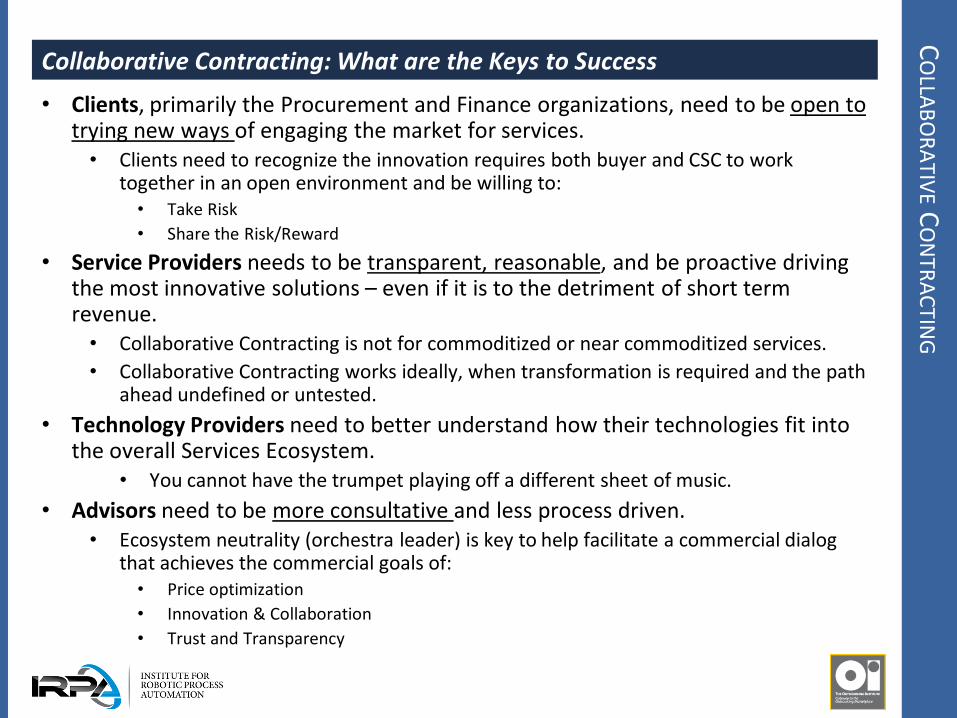
Collaborative Contracting: What are the Keys to Success
• Clients, primarily the Procurement and Finance organizations, need to be open to trying new ways of engaging the market for services. • Clients need to recognize the innovation requires both buyer and CSC to work
together in an open environment and be willing to: • Take Risk
• Share the Risk/Reward
• Service Providers needs to be transparent, reasonable, and be proactive driving the most innovative solutions – even if it is to the detriment of short term revenue. • Collaborative Contracting is not for commoditized or near commoditized services.
• Collaborative Contracting works ideally, when transformation is required and the path ahead undefined or untested.
• Technology Providers need to better understand how their technologies fit into the overall Services Ecosystem.
• You cannot have the trumpet playing off a different sheet of music.
• Advisors need to be more consultative and less process driven. • Ecosystem neutrality (orchestra leader) is key to help facilitate a commercial dialog
that achieves the commercial goals of: • Price optimization
• Innovation & Collaboration
• Trust and Transparency
CO
LLAB
OR
ATIV
E CO
NTR
AC
TING
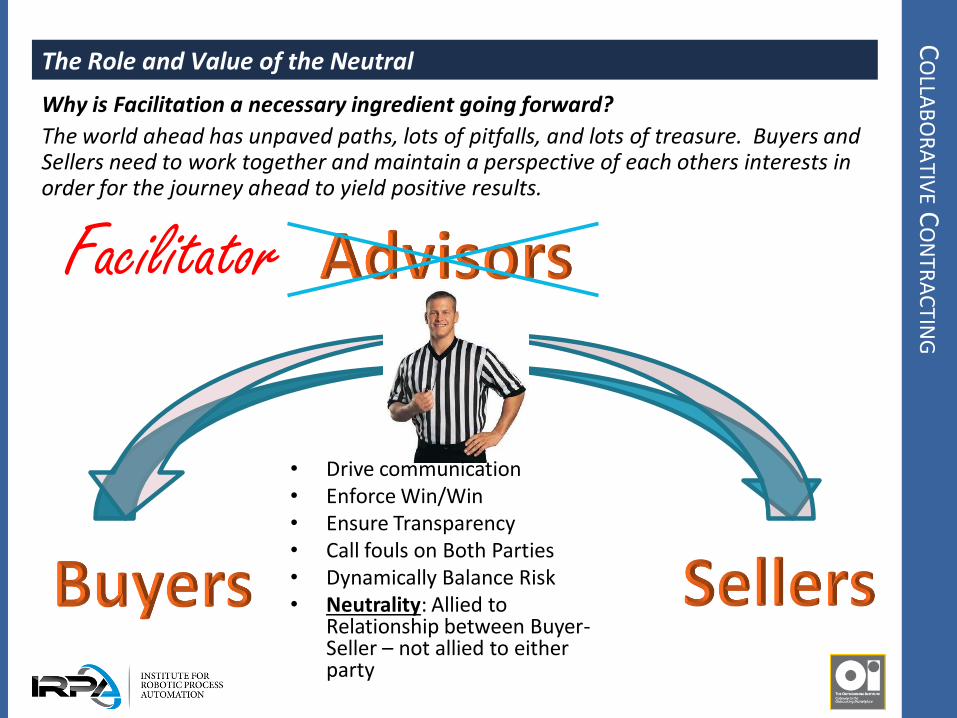
The Role and Value of the Neutral
• Drive communication • Enforce Win/Win • Ensure Transparency • Call fouls on Both Parties • Dynamically Balance Risk • Neutrality: Allied to
Relationship between Buyer-Seller – not allied to either party
Facilitator
Why is Facilitation a necessary ingredient going forward?
The world ahead has unpaved paths, lots of pitfalls, and lots of treasure. Buyers and Sellers need to work together and maintain a perspective of each others interests in order for the journey ahead to yield positive results.

TH
E RO
AD A
HEA
D
CO
GN
ITIVE T
ECH
NO
LOG
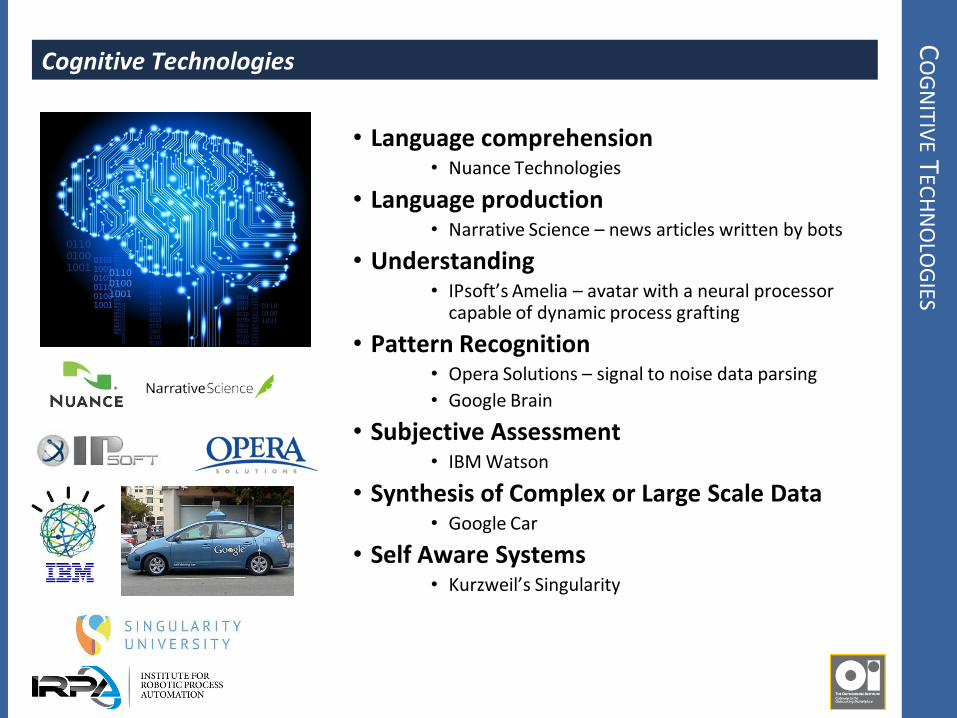
IES Cognitive Technologies
• Language comprehension • Nuance Technologies
• Language production • Narrative Science – news articles written by bots
• Understanding • IPsoft’s Amelia – avatar with a neural processor
capable of dynamic process grafting
• Pattern Recognition • Opera Solutions – signal to noise data parsing
• Google Brain
• Subjective Assessment • IBM Watson
• Synthesis of Complex or Large Scale Data • Google Car
• Self Aware Systems • Kurzweil’s Singularity
INN
OV
ATIO
N F
OR
MU
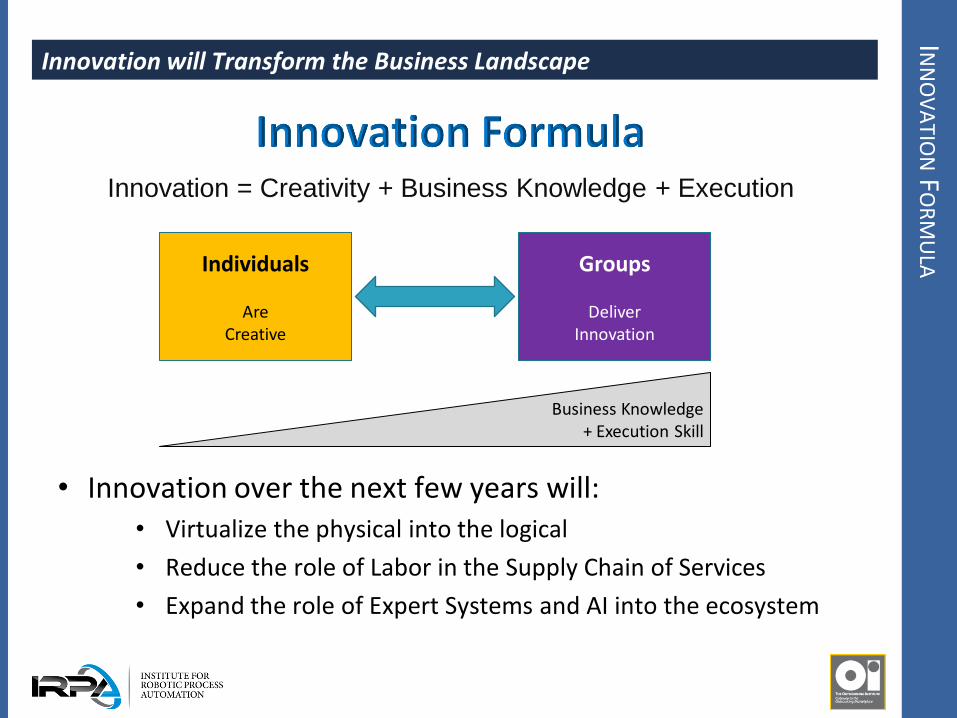
LA Innovation will Transform the Business Landscape
Individuals
Are Creative
Groups
Deliver Innovation
Business Knowledge + Execution Skill
Innovation = Creativity + Business Knowledge + Execution
• Innovation over the next few years will: • Virtualize the physical into the logical
• Reduce the role of Labor in the Supply Chain of Services
• Expand the role of Expert Systems and AI into the ecosystem
ZER
O C
ON
CEP
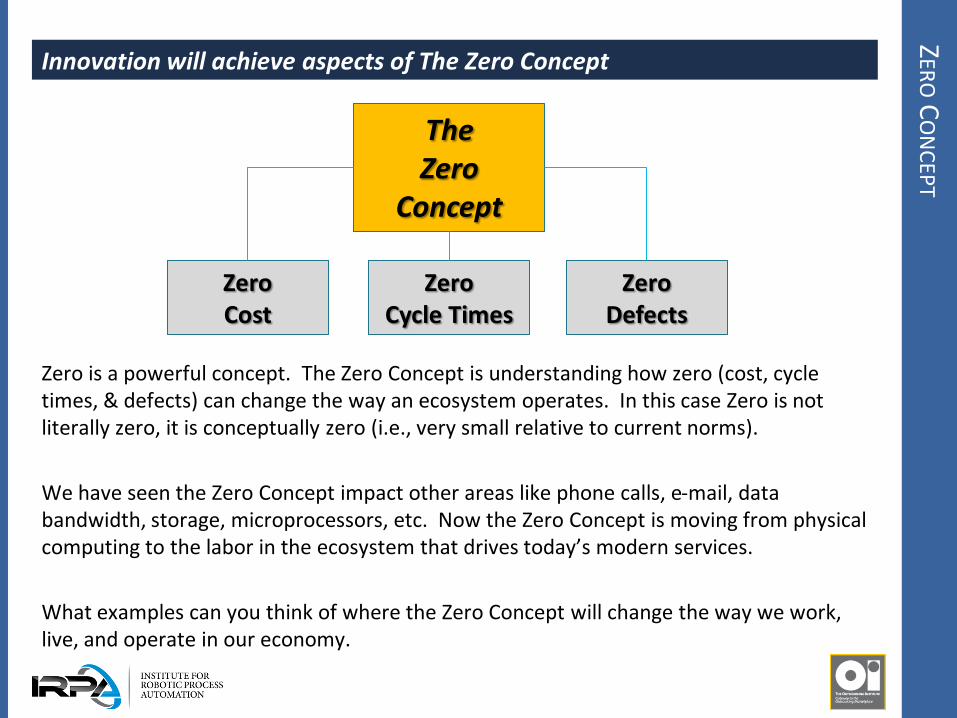
T Innovation will achieve aspects of The Zero Concept
Zero is a powerful concept. The Zero Concept is understanding how zero (cost, cycle times, & defects) can change the way an ecosystem operates. In this case Zero is not literally zero, it is conceptually zero (i.e., very small relative to current norms).
We have seen the Zero Concept impact other areas like phone calls, e-mail, data bandwidth, storage, microprocessors, etc. Now the Zero Concept is moving from physical computing to the labor in the ecosystem that drives today’s modern services.
What examples can you think of where the Zero Concept will change the way we work, live, and operate in our economy.
The Zero
Concept
Zero Cost
Zero Cycle Times
Zero Defects
AU
TOM
ATIO
N
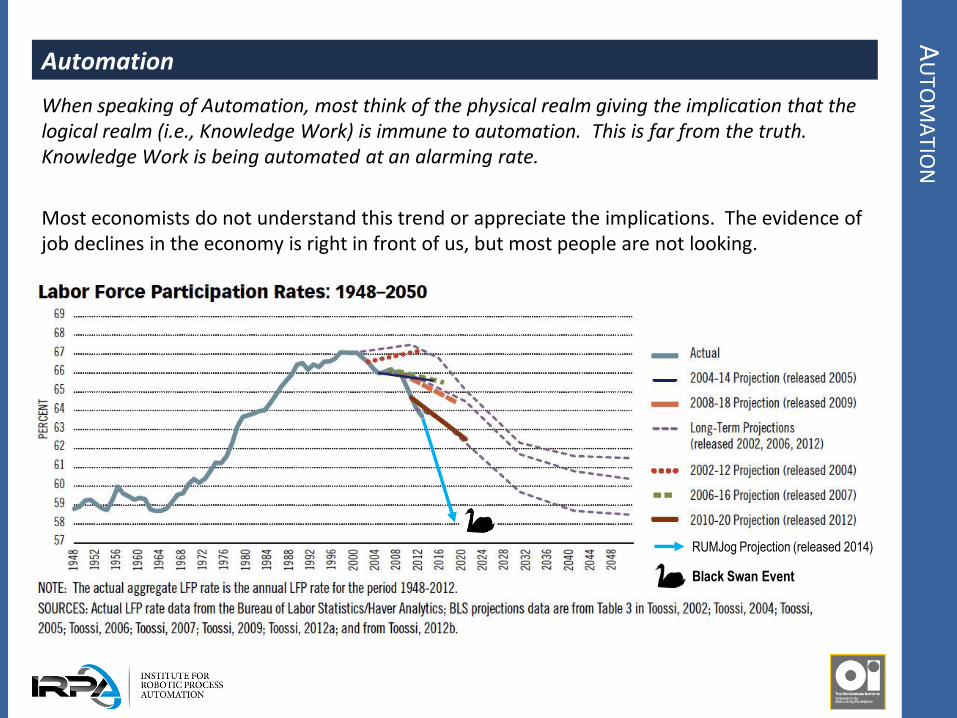
Automation
When speaking of Automation, most think of the physical realm giving the implication that the logical realm (i.e., Knowledge Work) is immune to automation. This is far from the truth. Knowledge Work is being automated at an alarming rate.
Most economists do not understand this trend or appreciate the implications. The evidence of job declines in the economy is right in front of us, but most people are not looking.
RUMJog Projection (released 2014)
Black Swan Event
CO
NC
LUSIO
N
Conclusion
• The changes that we have seen in the Technology Services markets has challenged our current business models and paradigms.
• Old playbooks are not yielding new results.
• The pace of change is accelerating, and gaps in our processes and knowledge will increase at an alarming rate.
• People need to end most of their sentences in question marks, not periods.
• All participants in the ecosystem need to be open to changing their approach to engaging in commerce.
• Collaboration, trust, and transparency are going to be foundational elements to success in an undefined future market.
• No ones knows for sure how the markets will progress, but it is safe to say that a status quo paradigm is wrong.
• Be open to change, take risk, accept failure, and ty again.
KEEP IN
FOR
MED –
STA
Y CO
NN
ECTED
Please Visit Us
www.IRPAnetwork.com
www.outsourcing.com
Tom Young [email protected]
30
Join the IRPA and OI networks to get the latest trends, expert interviews, best practices and commentary from thought leaders.
Frank Casale [email protected]


![IRPA guidance on implementation of eye dose …33FC6658-43C3-4DB4-B062...01 mai 2016 [Édition 1, volume 1] INTERNATIONAL RADIATION PROTECTION ASSOCIATION 4 IRPA GUIDANCE ON IMPLEMENTATION](https://static.fdocuments.us/doc/165x107/5ecd80276feee40e4273d82d/irpa-guidance-on-implementation-of-eye-dose-33fc6658-43c3-4db4-b062-01-mai-2016.jpg)