Thomas Vanhamel KMI / IRM - euroforecaster.org · KMI / IRM Vrijdag 26 oktober 2018 1. Contents of...
31
2017-2018 drought in Belgium Thomas Vanhamel KMI / IRM Vrijdag 26 oktober 2018 1
Transcript of Thomas Vanhamel KMI / IRM - euroforecaster.org · KMI / IRM Vrijdag 26 oktober 2018 1. Contents of...
2017-2018 drought in Belgium
Thomas Vanhamel
KMI / IRM
Vrijdag 26 oktober 2018 1

Contents of this presentation
1. Introduction
2. 2017-2018 drought in Belgium, some (climatological) data and maps
3. Products and potential developments in light of a cooperation between KMI and HIC (Flemish hydrological service)
2
The big picture
Drought is a complex and creeping phenomenon that receives more and more attention. Future climate scenarios indicate a possibility for more (and possibly more severe) droughts in summer time (in Belgium), together with more concentrated and severe precipitation in summer. Increasing “competition” for water: agriculture, industry, domestic use, ... Without adaptations, our vulnerability could increase. Drought monitoring and forecasting is a crucial step in adaptation.
3
2017-2018 drought in large part of Europe: causes
Persistent anticyclonic conditions over Europe caused a shift of the trajectories of depressions to the north / south.
This was especially the case during vulnerable times: the growing season of plants (spring / summer).
2017: more during spring
2018: end spring until summer
In 2018, the dry spell was accompanied with anomalous high temperatures, causing increased evapotranspiration
5

Some anecdotical info (press articles etc)
Some impacts…
6
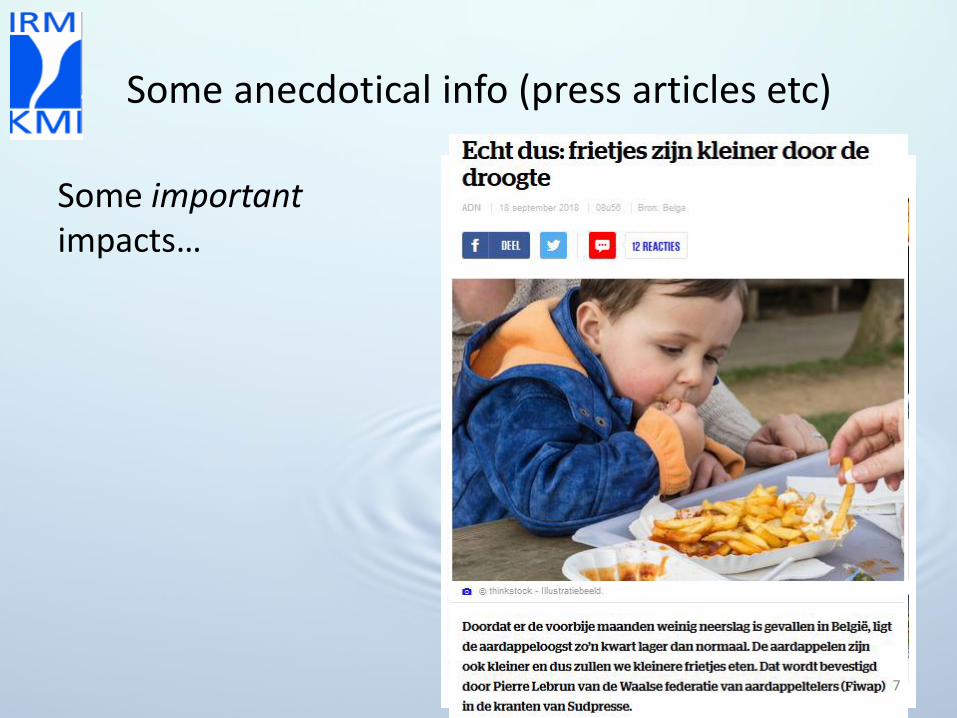
Some anecdotical info (press articles etc)
Some important impacts…
7
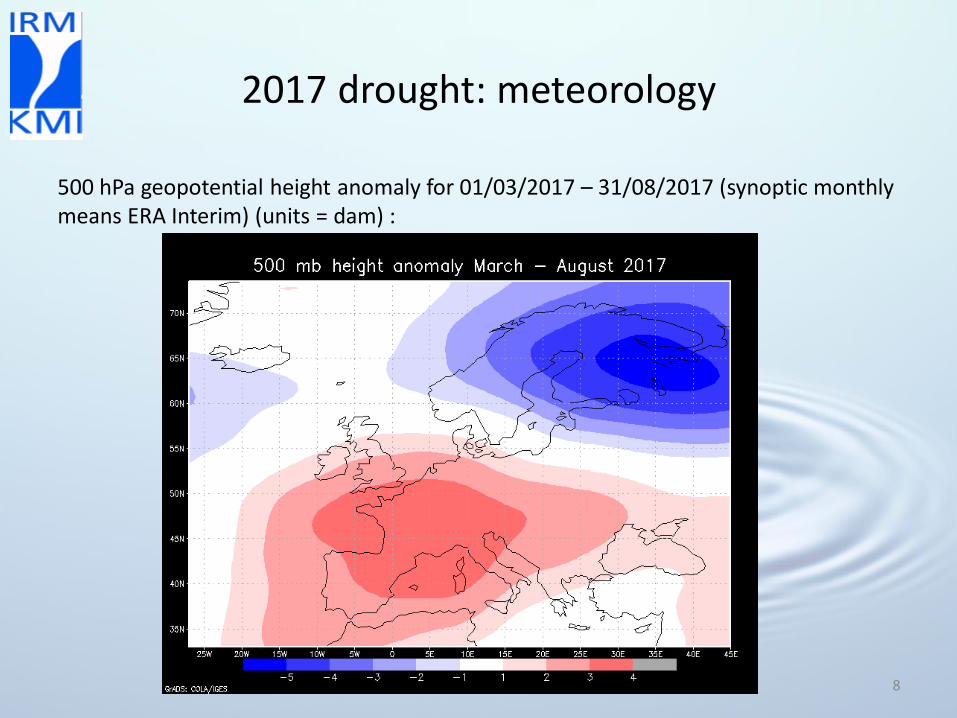
2017 drought: meteorology
500 hPa geopotential height anomaly for 01/03/2017 – 31/08/2017 (synoptic monthly means ERA Interim) (units = dam) :
8

2017 drought observations: cumulative precipitation in Uccle
9
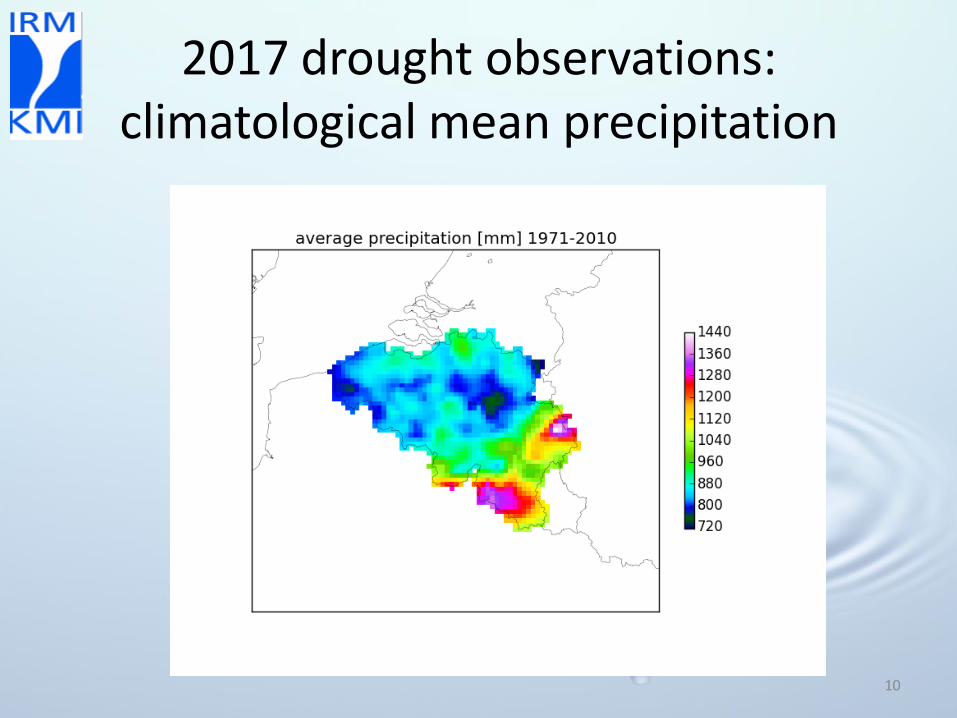
2017 drought observations: climatological mean precipitation
10
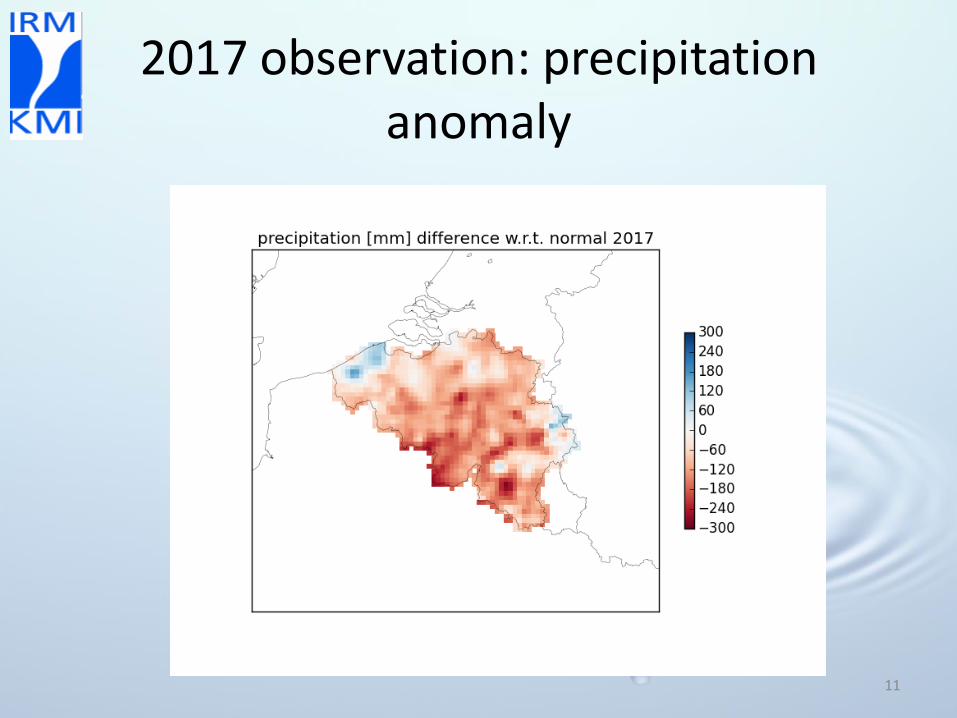
2017 observation: precipitation anomaly
11

2018 drought: meteorology
500 hPa geopotential height anomaly for 01/04/2018 – 31/10/2018 (synoptic monthly means ERA Interim) (units = dam) :
12

2018 drought observations: cumulative precipitation in Uccle
13

2018 observation: precipitation anomaly
14

August 2018: drought + heatwave
The unusual warm period began in April and continued into the summer, bringing 2 heat waves in july (15 days in duration) and july/august (10 days).
Combined effect of lack of precipitation and high temperatures in large part of W-Europe →
Source: C3S 15
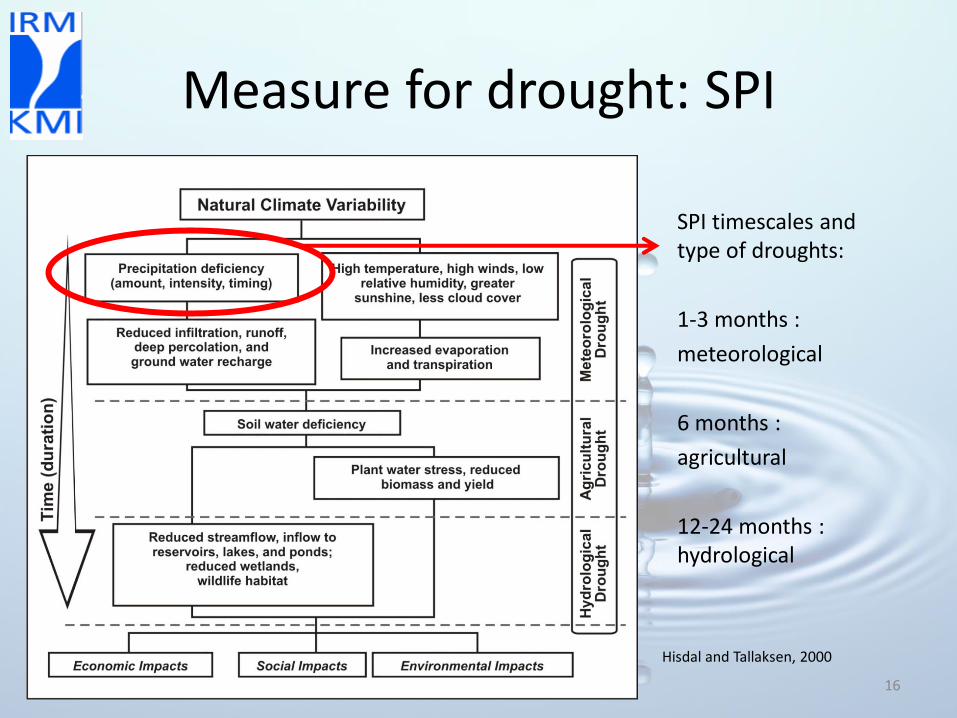
Measure for drought: SPI
SPI timescales and type of droughts:
1-3 months :
meteorological
6 months :
agricultural
12-24 months : hydrological
Hisdal and Tallaksen, 2000
16

Drought monitoring @ KMI
• SPI is calculated daily and shown on our website
• Since March 2018, KMI delivers SPI to Waterbouwkundig Laboratorium (contacts are ongoing; more products to be deliverd in short term)
17
Drought comitee
Recently (Sept. 2017), the Flemish government has appointed a comitee concerning droughts.
• Coördinatiecommissie Integraal Waterbeleid (CIW): droogtecommisie
• Several institutes deliver products concerning droughts / water quality (RMI delivers SPI, products by other institutes are e.g. river discharge, water quality, Oxygen-concentration, ...)
• The comitee decides on the “status” of the drought
• Advising and monitoring role
• Streamlining of measurements (e.g. limitations to using drinking water): local governments decide on restrictions
18

Drought comitee
19
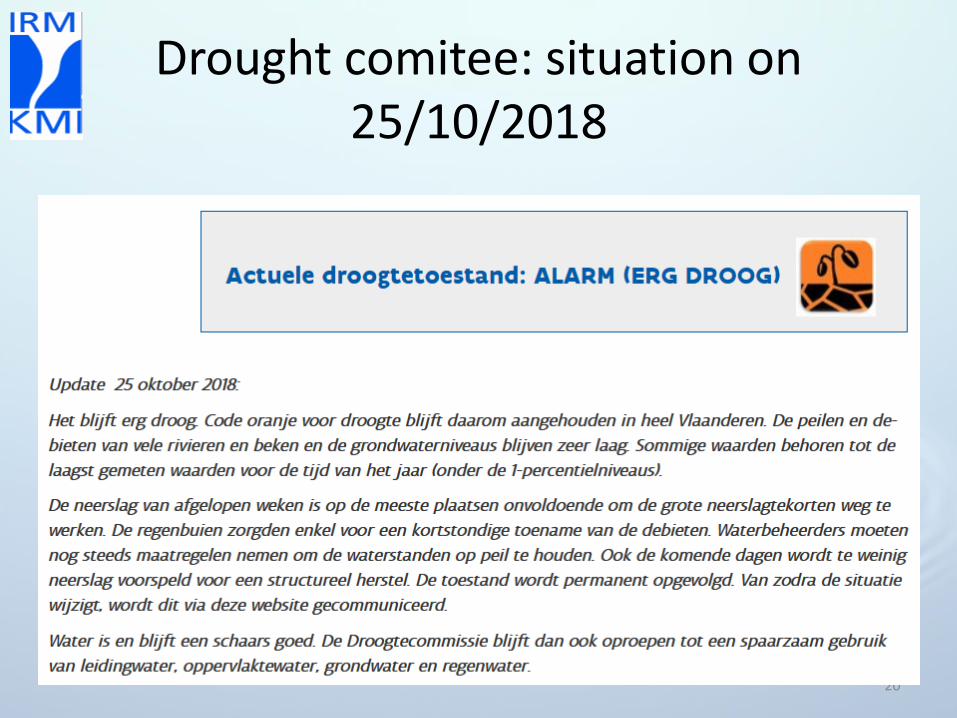
Drought comitee: situation on 25/10/2018
20

Drought index RMI: input
A gridded database is available in our database with climatological observations over Belgium (“Climate Grid”)
• Climate Grid has a horizontal resolution of ~ 5 km x 5 km
• Daily temporal resolution
• Constructed with spatial interpolated observations (SYNOP, AWS, other networks, auxillary data like Meteosat, etc …). On a day-to-day basis, the dataset is investigated wether there exist spatial dependency (e.g. correlation temperature – altitude). This is exploited in the interpolation.
• Parameters: precipitation, min and max temperature, relative humidity, evapotranspiration, …
21

Input data
Climate Grid:
grid points and the polygons of the basins →
22 Source: wikipedia

Definition SPI
Horion et al., 2012 23
Procedure
• For each basin, a climatological reference of the precipitation (1981-2010) is calculated (alpha and beta parameters of the gamma-distribution estimated with a maximum likelihood method)
• For each basin, recent basin-precipitation is queried (3, 6 and 12 months). SPI for each lag is calculated by transforming the gamma-distribution to a normal distribution and comparing the cumulative precipitation to the normalized distribution.
24
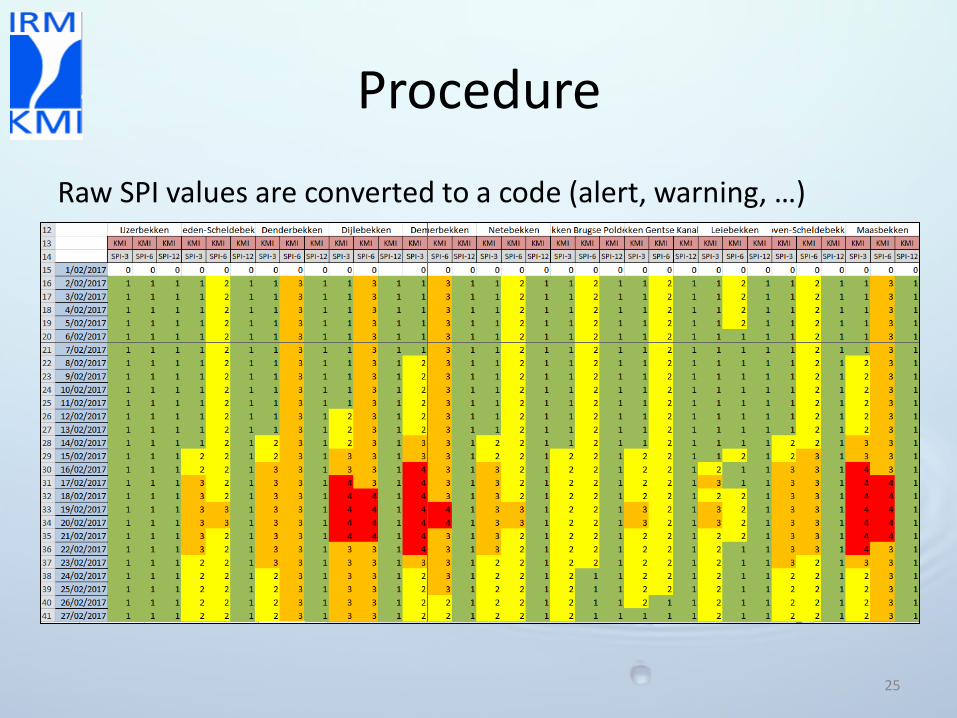
Procedure
Raw SPI values are converted to a code (alert, warning, …)
25

Examples of 2017
26
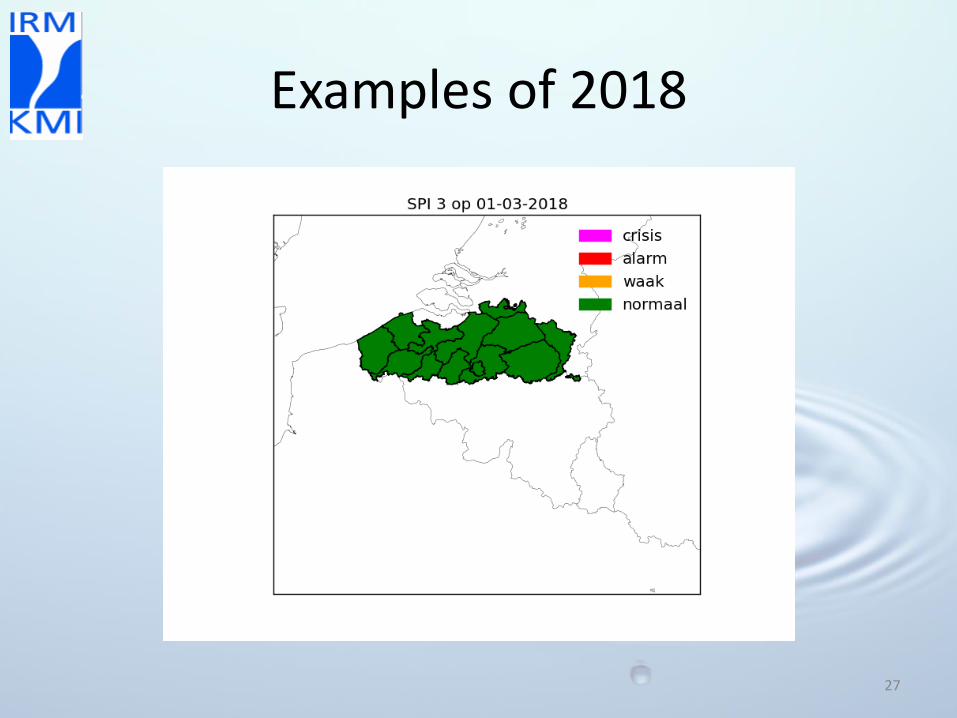
Examples of 2018
27
Further developments in the KMI – HIC cooperation (2019)
• Deliver the products automatically (SPI, QPE and other radar products, pluviometric quality controls, forecast products)
• Investigate further improvements (e.g. for SPI / forecast products) : – Add evapotranspiration: SPEI – Extend basin areas outside Flanders (Wallonia and France =>
data needed) – Look for other indices that might be more suiteable than SP( E )I – Use of NWP model-data: forecast of drought index – Use of NWP model-data: drought indicators (soil moisture etc) – Develop derived products: e.g. drought guidance / outlook
based on ECMWF extended range / long range forecasts
28

Other drought indices to consider (Handbook of Drought Indicators and Indices)
29
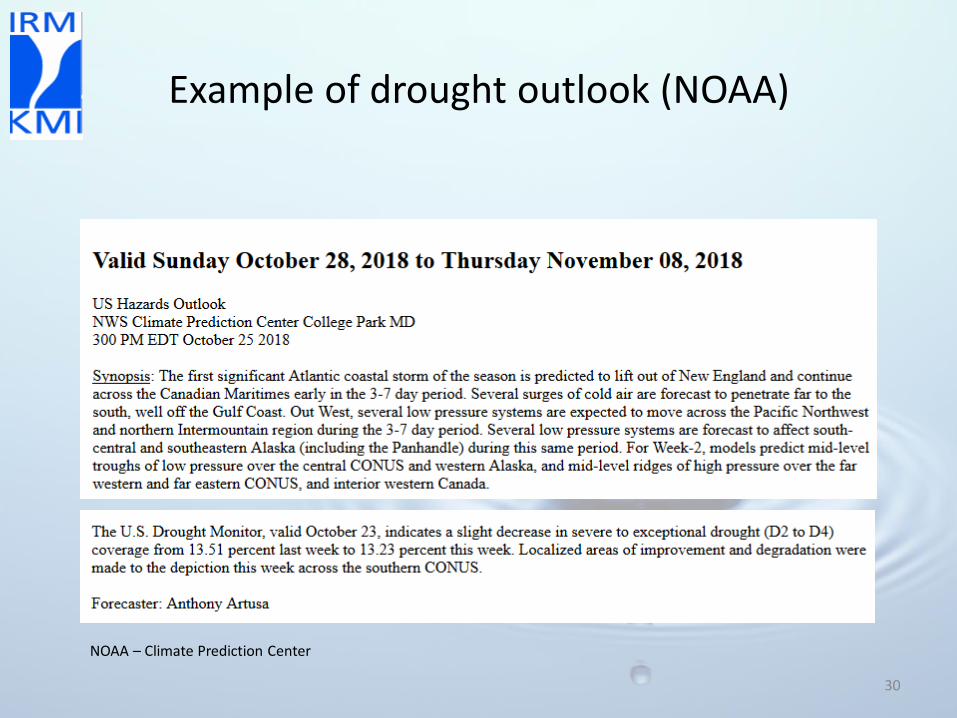
Example of drought outlook (NOAA)
NOAA – Climate Prediction Center
30

Drought outlook: ECMWF extended range
31

Conclusions
• The impacts of drought receive more and more attention by media, governments, …
• The (meteorological) drivers of drought initiate the proces, but as duration and intensity increases, the problem gets more and more complex and intertwined with other fields => inter-disceplenary work is crucial
• Potential for developments: – Cooperation with other fields (hydrology, agronomy, energy, …): establishing
contacts and networks
– Meteorological basis needed: national meteorological services can add value here
– Increasing accuracy of extended range forecasts
32