THOMAS JEFFERSON INSTITUTE FOR PUBLIC POLICY · The Thomas Jefferson Institute for Public Policy is...
19
VIRGINIA June 2016 Timothy J. Considine, Ph.D.* Principal Investigator Natural Resource Economics, Inc. EVALUATING THE COSTS AND BENEFITS OF RENEWABLE ENERGY PORTFOLIO STANDARDS FOR VIRGINIA October 2016 Timothy J. Considine, Ph.D.* Principal Investigator Natural Resource Economics, Inc. THOMAS JEFFERSON INSTITUTE FOR PUBLIC POLICY
Transcript of THOMAS JEFFERSON INSTITUTE FOR PUBLIC POLICY · The Thomas Jefferson Institute for Public Policy is...
Impact of Federal Transfers on State and Local Own-Source Spending 1Impact of Federal Transfers on State and Local Own-Source Spending 89
VIRGINIAJune 2016
Timothy J. Considine, Ph.D.*Principal Investigator
Natural Resource Economics, Inc.
EVALUATING THE COSTS
AND BENEFITS OF RENEWABLE ENERGY
PORTFOLIO STANDARDS FOR VIRGINIA
October 2016
Timothy J. Considine, Ph.D.*Principal Investigator
Natural Resource Economics, Inc.
THOMAS JEFFERSON INSTITUTE FOR PUBLIC POLICY

Dr. Timothy J. Considine is a Distinguished Professor of Energy Economics with the School of Energy Resources and the Department of Economics and Finance at the University of Wyoming. This report was prepared under a consulting agreement between Natural Resource Economics, Inc. and the Interstate Policy Alliance. The opinions, findings, and conclusions expressed in the report are those of the author and are not necessarily those of the University of Wyoming or the Interstate Policy Alliance.
Thomas Jefferson Institute for Public Policy
The Thomas Jefferson Institute for Public Policy is a non-partisan
research and education organization devoted to improving the lives of the people of Virginia. The Institute was organized in Virginia in 1996 and, at that time, was the only state and local government focused public policy foundation based on a philosophy of limited government, free enterprise and individual responsibility in the state. It is a “solutions tank” seeking better ways to accomplish the policies and programs currently being undertaken by state and local government – always based on the Institute’s underlying philosophy. The work of the Institute is geared toward educating our political, business and community leadership to the issues facing our society here in Virginia. The Institute offers suggested solutions to the problems facing our commonwealth in a non-partisan manner. The Thomas Jefferson Institute for Public Policy is a fully approved foundation by the Internal Revenue Service. It is designated a 501 (c) 3 organization and contributions are tax-deductible under the law. Individuals, corporations, foundations and associations are invited to contribute to the Thomas Jefferson Institute and participate in our programs. For more information on the programs and publications of the Thomas Jefferson Institute for Public Policy, please contact:
Thomas Jefferson Institute for Public Policy 9035 Golden Sunset Lane
Springfield, Virginia 22153 703/440-9447
This paper, “Evaluating the Costs and Benefits of Renewable Energy Portfolio Standards for Virginia” does not necessarily reflect the views of the Thomas Jefferson Institute for Public Policy nor its Board of Directors. Nothing in this study should be construed as an attempt to hinder or aid any legislation.
1
Foreword The newly enacted Renewable Portfolio Standards (RPS) require Virginia’s utilities to
produce a specific amount of electricity from renewable energy sources such as solar and wind.
The Thomas Jefferson Institute participated in a research study that included several states to look at the costs to our consumers and to our economy as Virginia reaches to achieve these RPS goals. The full study can be found at this link for those interested in other states: https://www.researchgate.net/publication/304581173_Costs_Benefits_of_Renewable_Energy_Portfolio_Standards
The Executive Summary is for the entire study but provides important information to
help the ready understand the impact of these new regulations. Following that Executive Summary is the Virginia-specific information from that study. It is this information that is most important to those of us here in the Old Dominion.
For Virginia, the federal mandate is to produce 6% of our electricity by 2025 from
renewable sources of energy. The state expects to reach this goal mostly through the use of solar energy. The goal is that 83% of that six percent figure will come from solar and the rest from wind.
The cost of achieving this six percent figure is significant, as the price of producing
renewable energy rises. In order to reach this goal, Virginia electric rates on consumers will increase, five percent in 2016, another 10% by 2025, and between seven percent and nine percent each year thereafter.
As this study states, “These significant rate increases reflect low capacity utilization rates
for wind and solar in Virginia and RPS generation displacing low cost coal and natural gas fired electric power generation.” What this means is that because Virginia has produced a vast majority of its electricity from coal, gas and nuclear generation, these projected increased costs are due from the need to build new energy plants and these costs are significant.
The ambitious Virginia RPS goal of producing 6 percent of our electricity from renewable sources by 2025 imposes significant costs on the economy of Virginia. The existing renewable energy portfolio standard raises electricity costs that on balance result in a net reduction in the state’s value added and employment even after accounting for the economic stimulus from building and operating renewable energy facilities. The costs of this mandated 6% goal will be borne by the consumers – individuals and businesses. So less money will be available to purchase items for our families and less money will be available for creating new jobs by our businesses. As Virginia struggles to create jobs and entice businesses to our state that are not tied to federal government spending, to put this additional burden on them for no appreciable impact on the environment seems counter-productive.

2
The end of the Virginia analysis is this concluding statement:
“From a global perspective, therefore, renewable energy portfolio standards in Virginia are an inefficient means to address global climate change. The incremental costs of environmental improvement from RPS in Virginia are significant because the state generates more than 95 percent of its power from low-cost coal, gas, and nuclear generation.”
This Renewal Portfolio Standard will cost Virginia jobs and increase our electricity bills. It will harm our ability for economic growth and have insignificant impact on the climate or our environment. This federally mandated “standard” is another federal requirement that harms our long-term ability to strengthen our economy and compete in a world that grows more competitive each and every day. This study is presented in an effort to bring some important facts to the table in order to create better and productive public policy in this area. We hope that is does so.
Michael W. Thompson, Chairman & President Thomas Jefferson Institute for Public Policy October 2016

1
Executive Summary
Renewable Portfolio Standards (RPS), now existing in 29 states and the District of Columbia, require utilities to provide a certain percentage of electricity consumption from wind, solar, and other forms of renewable energy. Federal policies, such as the wind production tax credit and the solar investment tax credit, also promote the production of wind and solar power. Given the widespread use of rate of return regulation based upon average cost pricing, the costs of these policies are less than transparent. Moreover, to the extent that these policies drive up electricity prices, output and employment could be adversely affected. The objective of this study is to understand and estimate these costs and economic impacts.
Central to this effort is the estimation of the opportunity costs of higher cost, intermittent
renewable power in terms of the foregone electricity from lower cost, deployable fossil fuel fired electricity. These opportunity costs vary considerably by state based upon the cost of existing capacity and availability of wind and solar resources. Accordingly, this study estimates these costs for the twelve states identified in Figure ES1. The timing and stringency of the RPS goals varies considerably by state. Moreover, there is wide variation in the size and composition of electricity generation for this sample of states.1
Figure ES1: RPS Goals by Stat
To estimate the costs and benefits of RPS, this study develops models of electricity supply and demand for each state. These models are projected using forecasts for coal and natural gas prices out to 2040 from the U.S. Energy Information Administration. The baseline forecast assumes existing electricity production capacity remains in place with new generation requirements met by natural gas integrated
1 The selection of these states is determined by the states expressing an interest in this study to the Interstate Policy Alliance, who sponsored this study.

2
combined cycle (NGCC) plants. (Editor’s note: these plants use in-line generators to take “unused fuel” and produce additional power thus reducing emissions.) The RPS scenario imposes the goals identified in Figure ES1. Average electricity generation costs, power consumption, and retail rates under the baseline and RPS scenarios are then compared.
The costs of RPS policies depend upon the opportunity costs of electricity generation from wind
and solar. For states with a fleet of low cost electricity generation capacity, imposition of RPS could raise electricity costs significantly because higher cost wind and solar generation displace low cost sources of power. While this displacement reduces expenditures on fossil fuels, coal and natural gas plants are cycled (Editor’s note: this is the use of back-up generators powered by carbon fuels to produce electricity quickly when wind velocity slows or cloudy weather occur. The need is for very quick power generation thus emissions are greater.) to accommodate the intermittent generation of renewable generators, which reduces their thermal efficiency and raises generation costs. On the other hand, building more renewable energy plants to meet RPS goals reduces the need to build new NGCC plants. Finally, investments in RPS capacity earn federal tax subsidies. Wind power receives a production tax credit of $23 per megawatt hour (Mwh) while solar plants receive a 30% investment tax credit. Hence, RPS policies contribute to lower federal tax revenues.
These costs are summarized in Figure ES1 for the entire twelve states. For example, in 2016, the
RPS goals involve $5.4 billion in additional expenditures to build and operate the required RPS facilities, $271 million in cycling costs, and $1.8 billion of tax subsidies. These costs are partially offset by $1.478 billion in fossil fuel cost savings and $261 in avoided new NGCC generation costs. Hence, the total net cost of RPS policies is $5.762 billion in 2016. The total net costs of RPS policies reach $8.7 billion in 2025 and increase to $8.9 billion in 2040 after RPS goals are met and the unit costs of solar and wind decline due to technological improvements.
Table ES1: Costs of RPS for Entire 12 State Sample
Millions of 2013 Dollars
2016 2020 2025 2030 2035 2040 Renewable Energy Costs 5,400.0 7,815.2 8,881.6 9,283.8 9,693.2 10,119.0 Cycling Costs 271.1 316.0 339.6 371.9 409.2 452.6 Tax Subsidies 1,830.1 2,672.2 3,098.0 3,287.2 3,485.7 3,698.8 Fossil Fuel Costs -1,478.3 -2,319.5 -2,966.3 -3,493.3 -4,071.0 -4,687.0 New Fossil Fuel Costs -260.7 -462.0 -597.5 -619.6 -642.1 -652.3
Total Net Costs 5,762.2 8,022.0 8,755.4 8,829.9 8,875.0 8,931.1
These higher costs are passed on to customers in the form of higher retail electricity prices, summarized in Table ES2. States with modest RPS goals, such as South Carolina, experience moderate rate increases. Similarly, states meeting their RPS goals with wind, such as Colorado, face rate increases of roughly 6%. On the other hand, states meeting rather ambitious RPS goals with relatively higher cost solar power, such as Oregon, North Carolina, Nevada, Utah, and Virginia incur much steeper electricity rate increases.
Electricity rate increases peak as RPS goals are reached in the early 2020s for most states.
Thereafter, electricity rate increases begin to taper off as the costs of wind and solar decline due to

3
technological improvements. Despite these expected reductions in the cost of wind and solar technology, RPS polices increase prices for electricity.
Table ES2: Impact of RPS Policies on Retail Electricity Prices
Electricity Price Changes in Percent
2016 2020 2025 2030 2035 2040 Colorado 6.12 8.23 7.69 7.32 6.69 5.93 Delaware 11.02 14.50 14.99 12.50 10.14 8.20 North Carolina 10.04 16.06 14.12 12.55 11.03 9.79 New Mexico 6.18 6.77 5.95 5.30 4.54 3.92 Nevada 14.77 15.60 15.14 13.28 11.21 9.12 Oregon 9.41 10.00 11.09 14.13 16.42 18.13 Pennsylvania 2.14 2.56 2.54 2.40 2.25 2.08 Rhode Island 13.61 18.16 16.62 15.55 14.46 13.17 South Carolina 0.39 1.52 2.08 1.97 1.85 1.75 Utah 5.13 9.07 12.78 11.78 10.67 9.47 Virginia 5.45 7.75 9.85 8.76 7.74 6.93
Wisconsin 4.34 4.29 4.01 3.70 3.39 3.08
Many economic studies in the peer-reviewed literature demonstrate that higher energy prices reduce economic growth and employment. Energy is an essential factor of production and consumption activities. Given limited substitution possibilities, higher electricity prices raise business costs and consumer energy bills, which reduces spending on other goods and services. Investments in renewable energy, however, constitute an economic stimulus.
A comparison of these economic impacts is summarized in Table ES3 for the entire twelve states.
For example, in 2025 higher electricity prices associated with RPS policies reduce value added or net economic output by $23.1 billion.2 Investments required for new renewable energy plants increase value added by $668 million. With a small offset from reductions in required NGCC plants to meet load growth, the net reduction in value added is nearly $22.5 billion in 2025. Similarly, gross employment losses are over 160 thousand in 2025 but over 9 thousand jobs are created building and operating new solar and wind capacity to meet RPS goals. But again the net change involves over 150 thousand jobs lost in 2025. Overall, this study finds that the stimulus from building and operating renewable energy facilities are offset by the negative impacts that higher electricity rates have on employment and value added. The estimated losses in value added for each of the twelve states are summarized in Table ES4. The largest losses occur in North Carolina with value added reductions between $3.9 billion in 2016 to more than $6.6 billion in 2025. Losses in annual value added exceed $1 billion in seven other states.
2 Value added is equal to gross output less expenditures on intermediate purchases from other industries and, thereby, provides a measure of the net economic output.

4
Table ES3: RPS Impacts on Value Added and Employment for All States
Millions of 2013 Dollars Value Added 2016 2020 2025 2030 2035 2040
Electric prices -16,779 -22,799 -23,140 -21,555 -19,786 -18,100 RPS Invest. 2,069 1,290 668 432 439 456 NGCC Invest. -146 -34 -22 -2 1 2
Net Change -14,856 -21,543 -22,495 -21,124 -19,346 -17,642
Employment Number of Jobs Electric prices -118,606 -159,094 -161,595 -151,605 -140,199 -129,223 RPS Invest. 29,826 18,332 9,073 5,796 5,870 6,092 NGCC Invest. -1,246 -305 -206 -21 10 15
Net Change -90,026 -141,066 -152,727 -145,830 -134,318 -123,116
Table ES4: RPS Impacts on Value Added by State
Change in Value Added in Millions of 2013 Dollars
2016 2020 2025 2030 2035 2040 Colorado -1,442 -1,996 -1,992 -1,895 -1,730 -1,530 Delaware -603 -812 -839 -715 -578 -466 North Carolina -3,899 -7,145 -6,664 -5,918 -5,196 -4,606 New Mexico -239 -444 -390 -348 -298 -251 Nevada -1,711 -1,792 -1,715 -1,534 -1,287 -1,038 Oregon -1,451 -1,571 -1,636 -2,022 -2,374 -2,636 Pennsylvania -1,226 -1,503 -1,640 -1,545 -1,449 -1,337 Rhode Island -629 -890 -813 -760 -707 -643 South Carolina -63 -198 -349 -318 -298 -283 Utah -662 -1,420 -2,025 -1,964 -1,777 -1,575 Virginia -1,865 -2,655 -3,390 -3,149 -2,778 -2,486 Wisconsin -1,065 -1,116 -1,041 -958 -874 -791
Total -14,856 -21,543 -22,495 -21,124 -19,346 -17,642 The employment impacts of RPS policies are summarized in Table ES5. The jobs lost by state mirror the losses in value added. Again, the magnitudes differ by state depending upon the stringency of the RPS goals, the size of the state, and the technologies available for each state to meet the RPS goals. Solar energy is the main way to attain RPS goals for eastern states due to limited wind resources.
The economic impacts are summarized in Figure ES2 using the present discounted value of lost value added and average annual job losses from 2016 to 2040. The largest losses occur in North Carolina with a cumulative loss in value added of over $106 billion and annual average job losses of more than 37 thousand. The next largest losses occur in Virginia with over $50 billion in lost value added and more than 20 thousand lost jobs per year. Five other states – Colorado, Nevada, Oregon, Pennsylvania, and
5
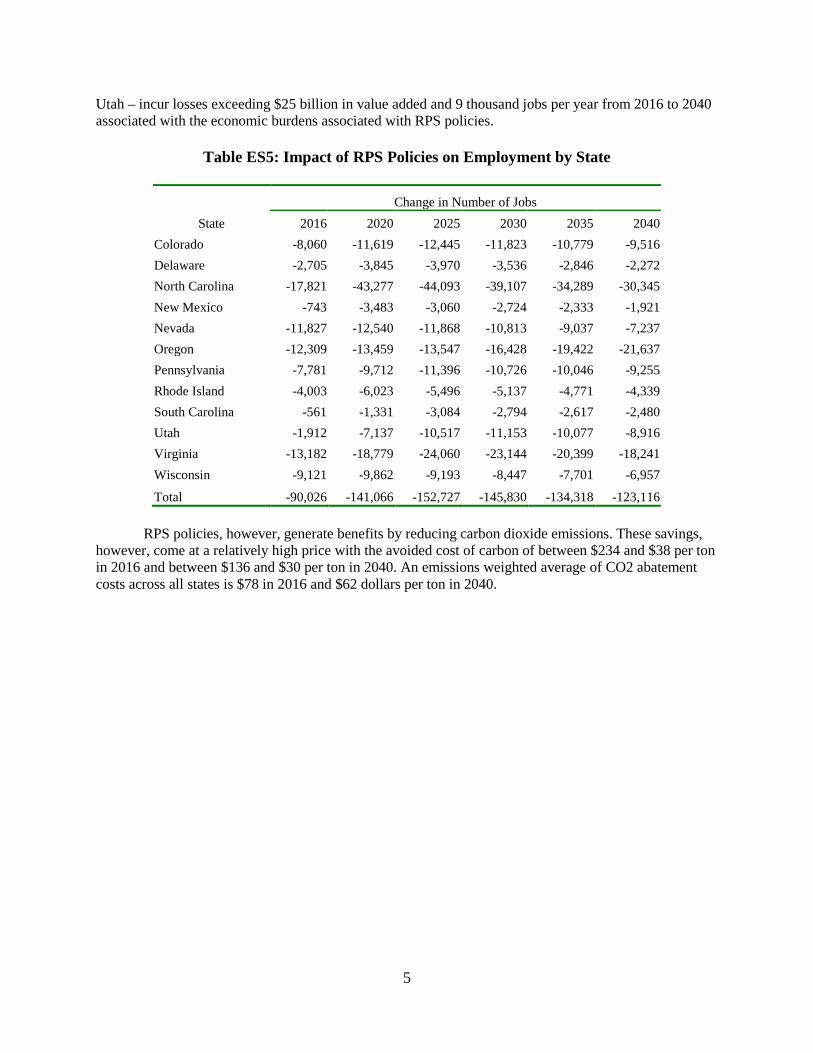
Utah – incur losses exceeding $25 billion in value added and 9 thousand jobs per year from 2016 to 2040 associated with the economic burdens associated with RPS policies.
Table ES5: Impact of RPS Policies on Employment by State
Change in Number of Jobs
State 2016 2020 2025 2030 2035 2040 Colorado -8,060 -11,619 -12,445 -11,823 -10,779 -9,516 Delaware -2,705 -3,845 -3,970 -3,536 -2,846 -2,272 North Carolina -17,821 -43,277 -44,093 -39,107 -34,289 -30,345 New Mexico -743 -3,483 -3,060 -2,724 -2,333 -1,921 Nevada -11,827 -12,540 -11,868 -10,813 -9,037 -7,237 Oregon -12,309 -13,459 -13,547 -16,428 -19,422 -21,637 Pennsylvania -7,781 -9,712 -11,396 -10,726 -10,046 -9,255 Rhode Island -4,003 -6,023 -5,496 -5,137 -4,771 -4,339 South Carolina -561 -1,331 -3,084 -2,794 -2,617 -2,480 Utah -1,912 -7,137 -10,517 -11,153 -10,077 -8,916 Virginia -13,182 -18,779 -24,060 -23,144 -20,399 -18,241 Wisconsin -9,121 -9,862 -9,193 -8,447 -7,701 -6,957
Total -90,026 -141,066 -152,727 -145,830 -134,318 -123,116
RPS policies, however, generate benefits by reducing carbon dioxide emissions. These savings, however, come at a relatively high price with the avoided cost of carbon of between $234 and $38 per ton in 2016 and between $136 and $30 per ton in 2040. An emissions weighted average of CO2 abatement costs across all states is $78 in 2016 and $62 dollars per ton in 2040.

6
Figure ES2: Cumulative Economic Impacts of RPS
Table ES6: Costs of CO2 Reductions using RPS
2013 Dollars per ton State 2016 2020 2025 2030 2035 2040
Colorado 37.92 41.89 40.22 39.79 38.56 36.78 Delaware 105.74 88.83 77.70 68.22 60.16 53.31 North Carolina 199.03 183.27 162.12 147.65 134.22 122.56 New Mexico 45.92 39.80 37.09 35.02 32.46 30.59 Nevada 76.82 56.83 51.17 46.68 42.64 38.66 Oregon 45.89 49.06 45.93 47.68 47.40 46.51 Pennsylvania 44.05 44.21 42.37 41.43 40.50 39.41 Rhode Island 205.42 172.39 156.73 148.99 141.55 133.72 South Carolina 103.38 156.21 133.88 127.07 120.60 115.27 Utah 97.22 85.42 82.54 76.74 71.33 65.94 Virginia 234.91 203.97 181.92 161.71 147.34 136.03 Wisconsin 54.22 51.15 49.46 47.67 45.88 44.06

7
The social cost of carbon estimated by the US Environmental Protection Agency is well below these average avoided emissions costs, suggesting that Renewable Portfolio Standards are a relatively expensive strategy to cut greenhouse gas emissions (see Figure ES3). In summary, this study finds that the economic impacts of Renewable Portfolio Standards vary significantly across states depending upon the goals and the availability of solar and wind resources. Across all states, however, RPS policies increase electricity prices.
RPS investments stimulate economic activity. The negative economic impacts associated with
higher electricity prices, however, offset the economic stimulus from these RPS investments. In many cases, especially for states that must utilize solar energy technology to meet RPS goals, the costs per ton of carbon is much higher than the social cost of carbon estimated by the US federal government. Avoided carbon costs are lower for wind power but still involve net losses in value added and employment. These findings suggest that Renewable Portfolio Standards for the twelve states examined in this study are a costly and inefficient means to reduce greenhouse gas emissions and they reduce economic growth and employment.
Figure ES3: RPS Abatement Costs and the Social Cost of Carbon
8
The Virginia Analysis of EPA’s Renewable Portfolio Standards
(Editor’s Note: this discussion on Virginia is pulled from a larger study that analyses several states and the impact of the Renewal Portfolio Standards now required by the EPA. Thus the numbers on the Tables are from 75 to 80 because that is how they are numbered in the larger study. This Virginia report was “extracted” and reprinted here by the Thomas Jefferson Institute for Public Policy since this Virginia analysis is what concerns us here in the Old Dominion. The full study can be found at this link: file:///C:/Users/Mike/Desktop/RPS%20--%20CostsBenefitsRenewableEnergryPortfolio_Study%20(6).pdf
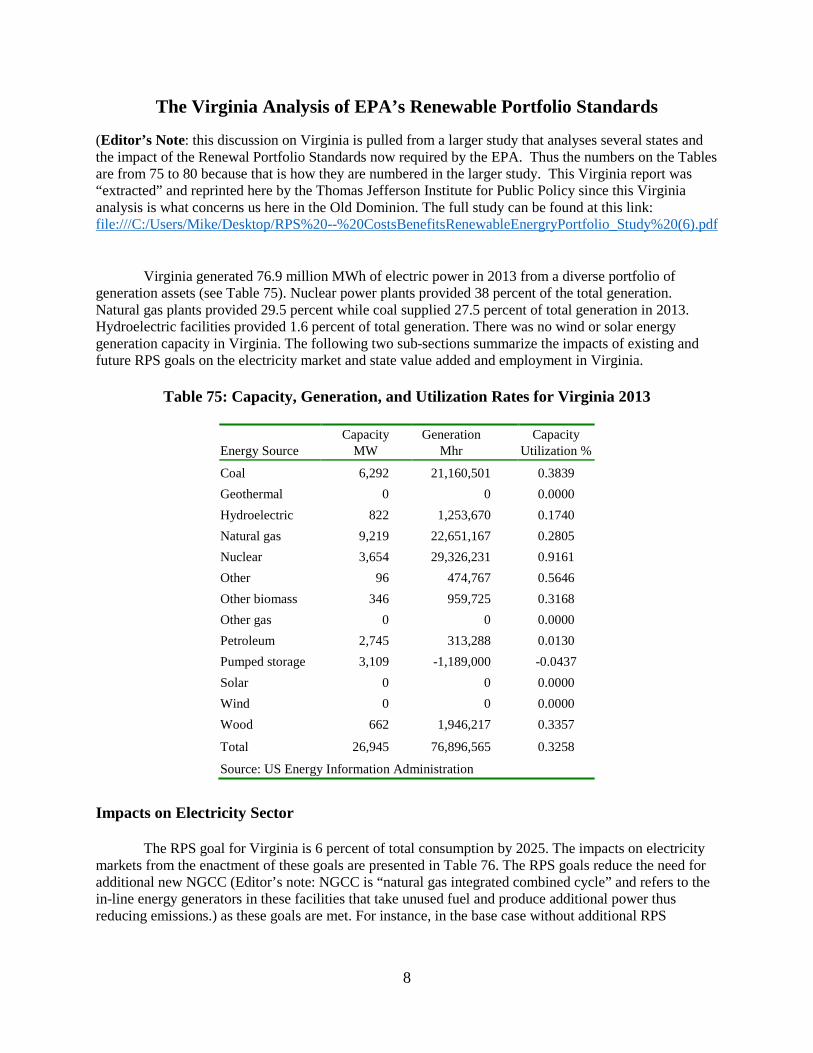
Virginia generated 76.9 million MWh of electric power in 2013 from a diverse portfolio of generation assets (see Table 75). Nuclear power plants provided 38 percent of the total generation. Natural gas plants provided 29.5 percent while coal supplied 27.5 percent of total generation in 2013. Hydroelectric facilities provided 1.6 percent of total generation. There was no wind or solar energy generation capacity in Virginia. The following two sub-sections summarize the impacts of existing and future RPS goals on the electricity market and state value added and employment in Virginia.
Table 75: Capacity, Generation, and Utilization Rates for Virginia 2013
Energy Source Capacity
MW Generation
Mhr Capacity
Utilization %
Coal 6,292 21,160,501 0.3839 Geothermal 0 0 0.0000 Hydroelectric 822 1,253,670 0.1740 Natural gas 9,219 22,651,167 0.2805 Nuclear 3,654 29,326,231 0.9161 Other 96 474,767 0.5646 Other biomass 346 959,725 0.3168 Other gas 0 0 0.0000 Petroleum 2,745 313,288 0.0130 Pumped storage 3,109 -1,189,000 -0.0437 Solar 0 0 0.0000 Wind 0 0 0.0000 Wood 662 1,946,217 0.3357
Total 26,945 76,896,565 0.3258
Source: US Energy Information Administration
Impacts on Electricity Sector
The RPS goal for Virginia is 6 percent of total consumption by 2025. The impacts on electricity markets from the enactment of these goals are presented in Table 76. The RPS goals reduce the need for additional new NGCC (Editor’s note: NGCC is “natural gas integrated combined cycle” and refers to the in-line energy generators in these facilities that take unused fuel and produce additional power thus reducing emissions.) as these goals are met. For instance, in the base case without additional RPS

9
capacity, new NGCC capacity required to balance the market is 214 MW in the base case and under the RPS incremental NGCC capacity required is 200.3 MW in 2025 (see Table 76).
Solar power provides more than 83 percent of new capacity to meet RPS in Virginia with the remainder met by new wind generating plants. RPS wind and solar capacity to meet the RPS goals are 83.2 and 227.8 MW respectively in 2016 and 153 and 419 MW respectively in 2025. The electricity generation from these new facilities rises from 3.5 million MWh in 2016 to 9.8 million MWh in 2040 (see Table 76). As expected, new NGCC generation is lower in the RPS scenario than the base case.
The increases in average electricity costs from new RPS capacity additions are 15.6 percent in
2016, 23 percent in 2020, and over 20 percent after 2025 (see Table 76). With legacy costs average electricity rates in Virginia increase over 5 percent in 2016 due to renewable energy portfolio standards. After 2016, rates increase almost 10 percent in 2025 and increase between 7 to 9 percent thereafter compared to the base case without RPS standards. These significant rate increases reflect low capacity utilization rates for wind and solar in Virginia and RPS generation displacing low cost coal and natural gas fired electric power generation.
Table 76: Impacts of RPS on Virginia Electricity Market
Megawatts
2016 2020 2025 2030 2035 2040 New NGCC Capacity
Without RPS 0.0 0.0 214.0 221.7 230.6 249.4 With RPS 0.0 0.0 200.3 220.9 232.9 251.3
New RPS Capacity Wind 83.2 121.5 153.0 24.1 25.4 27.4 Solar 227.8 332.7 419.2 66.0 69.6 75.1
Million Megawatt hours New NGCC Generation
Without RPS 3.7 3.5 11.6 19.6 28.1 37.1 With RPS 3.3 2.4 10.0 17.9 26.4 35.5
Legacy RPS Generation 0.0 0.0 0.0 0.0 0.0 0.0 New RPS Generation 3.5 5.4 8.3 8.8 9.3 9.8
Percentage Changes from Base Case Average Costs 15.59 23.15 28.60 25.01 21.69 19.32 Electricity Consumption -0.33 -0.78 -1.13 -1.18 -1.08 -0.97 Average Rates 5.45 7.75 9.85 8.76 7.74 6.93
Average Rates + Legacy Costs 5.45 7.75 9.85 8.76 7.74 6.93
The decomposition of RPS costs for the Virginia electricity sector appears in Table 77. Net RPS legacy costs are zero because there was no existing wind and solar capacity in Virginia in 2013. The costs associated with adding new RPS capacity to reach the RPS goals also appear in Table 77. The direct costs to achieve 6 percent of electricity consumption supplied by renewable energy are $510.7 million in 2016 and rise to over $1.1 billion in 2020 and subsequent years (see Table 77). After adding cycling costs (Editor’s note: these are the costs for back-up power generators using carbon fuel to produce electricity

10
quickly when the wind slows down or heavy cloud cover blocks the sun. Because of the need for quick ‘speed up’ of these plants the emissions generated are greater.) and deducting for fossil fuel and NGCC capacity costs, the net costs to meet the RPS goal are $534 million in 2016, $748 million in 2020, $1 billion in 2025, and over $833 million per year thereafter. With subsidies, the total costs of Virginia’s renewable energy portfolio standards are $712 million in 2016, $1 billion in 2020, $1.4 billion in 2025 and more than $1.2 billion per year from 2030 to 2040 (see Table 77).
Table 77: Costs of Virginia RPS
Millions of 2013 Dollars
2016 2020 2025 2030 2035 2040 RPS Legacy Costs
Direct 0.0 0.0 0.0 0.0 0.0 0.0 Cycling Costs 0.0 0.0 0.0 0.0 0.0 0.0 less Fuel Costs 0.0 0.0 0.0 0.0 0.0 0.0 Net RPS Legacy Costs 0.0 0.0 0.0 0.0 0.0 0.0
New RPS Costs Direct 510.7 760.5 1,101.9 1,100.7 1,101.4 1,102.8 Cycling Costs 4.7 5.6 8.1 8.3 8.6 9.5 less Fuel Costs -33.1 -14.7 53.6 120.1 178.1 225.1 less NGCC Costs 14.7 31.9 50.4 56.6 56.5 53.4 Net New RPS Costs 533.8 748.9 1,006.0 932.4 875.4 833.8
RPS Tax Subsidies 179.0 265.3 383.2 380.7 378.9 377.4 Total RPS Cost 712.8 1,014.2 1,389.2 1,313.1 1,254.2 1,211.2
Million Tons CO2 Reductions 3.03 4.97 7.64 8.12 8.51 8.90
2013 Dollars per ton of CO2 Reduced Direct RPS Costs 175.92 150.61 131.73 114.83 102.83 93.65 Subsidy Costs 58.99 53.36 50.18 46.88 44.51 42.38
Total Costs 234.91 203.97 181.92 161.71 147.34 136.03 The RPS policies in Virginia reduce carbon dioxide (CO2) emissions by 3 million tons in 2016 to over 8.9 million tons per year by 2040 (see Table 77). The direct costs per ton of avoided emissions (Direct RPS Costs) are $175.92 per ton in 2016, $150.61 per ton in 2020, $131.73 per ton in 2025 and $93.65 per ton in 2040. Tax subsidies (Subsidy Costs) are nearly $60 per ton in 2020 and remain over $42 per ton in 2040. The total costs of avoided carbon emissions, therefore, are $234.91 per ton in 2016, $203.97 per ton in 2020 and gradually decline to $136.03 per ton in 2040 (see Table 77). These large unit costs of carbon emission reductions reflect the low capacity utilization rates for wind and solar in Virginia. Another factor is the predominance of low cost coal and natural gas capacity in total generation. These RPS carbon abatement costs are far above the EPA social cost of carbon of $12 to $24 per ton, assuming a 5 percent discount rate (Editor’s note: discount rate reflects that a dollar today is worth more than a dollar in the future due to inflation or due to individual time rate of preference – what good is $1.00 to me in ten years if I am dead!), suggesting that RPS policies in Virginia are an inefficient greenhouse gas emission strategy. Under a 3 percent discount rate, EPA’s social cost of carbon is around
11
$40 per ton in 2016 and gradually increases to $60 per ton in 2040. So from a global cost-benefit perspective, adopting RPS policies in Virginia is not cost effective. There are also economic impacts resulting from higher electricity rates that lead to losses in economic output and employment. These impacts are now presented and discussed. Economic Impacts
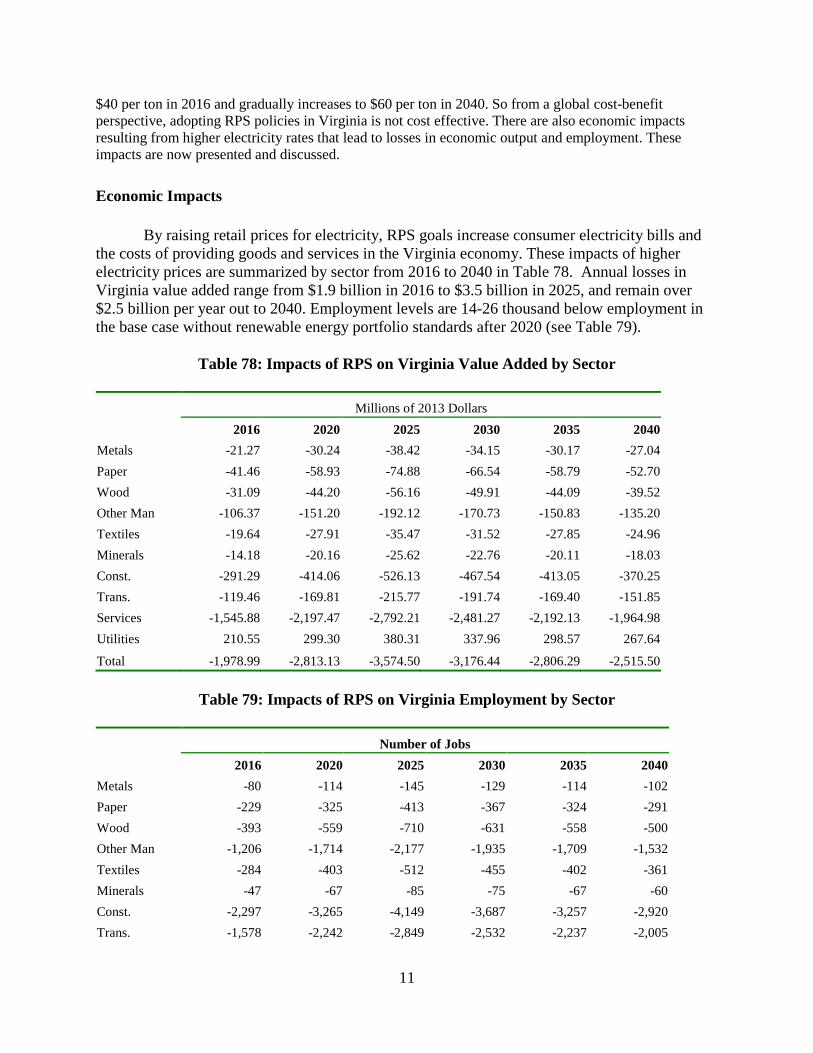
By raising retail prices for electricity, RPS goals increase consumer electricity bills and the costs of providing goods and services in the Virginia economy. These impacts of higher electricity prices are summarized by sector from 2016 to 2040 in Table 78. Annual losses in Virginia value added range from $1.9 billion in 2016 to $3.5 billion in 2025, and remain over $2.5 billion per year out to 2040. Employment levels are 14-26 thousand below employment in the base case without renewable energy portfolio standards after 2020 (see Table 79).
Table 78: Impacts of RPS on Virginia Value Added by Sector Millions of 2013 Dollars
2016 2020 2025 2030 2035 2040 Metals -21.27 -30.24 -38.42 -34.15 -30.17 -27.04 Paper -41.46 -58.93 -74.88 -66.54 -58.79 -52.70 Wood -31.09 -44.20 -56.16 -49.91 -44.09 -39.52 Other Man -106.37 -151.20 -192.12 -170.73 -150.83 -135.20 Textiles -19.64 -27.91 -35.47 -31.52 -27.85 -24.96 Minerals -14.18 -20.16 -25.62 -22.76 -20.11 -18.03 Const. -291.29 -414.06 -526.13 -467.54 -413.05 -370.25 Trans. -119.46 -169.81 -215.77 -191.74 -169.40 -151.85 Services -1,545.88 -2,197.47 -2,792.21 -2,481.27 -2,192.13 -1,964.98 Utilities 210.55 299.30 380.31 337.96 298.57 267.64
Total -1,978.99 -2,813.13 -3,574.50 -3,176.44 -2,806.29 -2,515.50
Table 79: Impacts of RPS on Virginia Employment by Sector Number of Jobs
2016 2020 2025 2030 2035 2040 Metals -80 -114 -145 -129 -114 -102 Paper -229 -325 -413 -367 -324 -291 Wood -393 -559 -710 -631 -558 -500 Other Man -1,206 -1,714 -2,177 -1,935 -1,709 -1,532 Textiles -284 -403 -512 -455 -402 -361 Minerals -47 -67 -85 -75 -67 -60 Const. -2,297 -3,265 -4,149 -3,687 -3,257 -2,920 Trans. -1,578 -2,242 -2,849 -2,532 -2,237 -2,005

12
Services -8,892 -12,640 -16,062 -14,273 -12,610 -11,303 Utilities 363 516 656 583 515 462
Total -14,642 -20,814 -26,447 -23,502 -20,763 -18,612
These losses from higher electricity prices are partially offset by output and employment gains from building and operating electricity capacity needed to meet RPS goals. These different impacts of RPS on Virginia value added and employment are summarized in Table 80. For example, in 2025 RPS investments contributed $188 million in value added and 2.420 jobs in 2020.
Like the other states, the stimulus from RPS investment, however, is not large enough to offset the negative impacts of higher electricity prices. On balance, therefore, net annual losses in value added from Virginia’s RPS goals are $1.8 billion in 2016, $2.6 billion in 2020, $3.4 billion in 2025, and remain over $2.4 billion through the end of the forecast horizon. Employment levels are more than 24 thousand lower in 2025 compared to the base case after 2020 (see Table 80).
Table 80: Net Impacts of RPS on Virginia Value Added and Employment Millions of 2013 Dollars
2016 2020 2025 2030 2035 2040 RPS Invest. 560.20 782.21 932.61 139.13 139.05 142.29 Value Added
Electric prices -1,978.99 -2,813.13 -3,574.50 -3,176.44 -2,806.29 -2,515.50 RPS Invest. 113.62 158.52 188.80 28.13 28.09 28.71 NGCC Invest. 0.00 0.00 -3.86 -0.23 0.66 0.54 Net Change -1,865.37 -2,654.61 -3,389.56 -3,148.54 -2,777.55 -2,486.26
Employment Number of Jobs
Electric prices -14,642 -20,814 -26,447 -23,502 -20,763 -18,612 RPS Invest. 1,460 2,035 2,420 360 359 366 NGCC Invest. 0 0 -32 -2 5 4
Net Change -13,182 -18,779 -24,060 -23,144 -20,399 -18,241 In summary, the costs of avoiding carbon dioxide emissions using renewable portfolio standards in Virginia are much higher than EPA estimates of the social cost of carbon assuming a 5 percent discount rate and even assuming a 3 percent discount rate. From a global perspective, therefore, renewable energy portfolio standards in Virginia are an inefficient means to address global climate change. The incremental costs of environmental improvement from RPS in Virginia are significant because the state generates more than 95 percent of its power from low-cost coal, gas, and nuclear generation. The ambitious RPS goal of 6 percent imposes significant costs on the economy of Virginia. The existing renewable energy portfolio standard raises electricity costs that on balance result in a net reduction in the state’s value added and employment even after accounting for the economic stimulus from building and operating renewable energy facilities.
Thomas Jefferson Institute for Public Policy
Board of Directors
Michael Thompson: Chairman and President: For 25 years Mr. Thompson owned his own marketing company. He has been very active in national, state and local politics as well as a number of state and community organizations, commissions, and committees. Randal C. Teague: Secretary/Treasurer/Counsel: Chairman of the Fund for American Studies and retired Partner in the law firm of Vorys, Sater Seymour and Pease, Mr. Teague is a noted international attorney. John Alderson: President of the John Alderson Insurance Agency William W. Beach: Vice President of Policy Research, Mercatus Center at George Mason Univ James W. Beamer: Managing Dir. for Legislative Outreach at Dominion Resources Services Stephen Cannon: Partner, Constantine Cannon, PC, former Sr. VP of Circuit City Stores Stephan Cassaday: President, Cassaday and Company Rebecca Donatelli: President, Campaign Solutions/Connell Donatelli James W. Dyke Jr: Partner, McGuireWoods and former VA Secretary of Education John Hager: Former Lt. Governor of Virginia Robert L. Hartwell: President, Hartwell Capitol Consulting Alan I. Kirshner: Chairman and CEO of Markel Corporation Joseph Ragan: Retired as Founder and President of Joe Ragan’s Coffee John Rust: Former State Delegate and Partner, Rust and Rust law firm John Ryan: Former Senior Counsel and Director of Gov’t Affairs for Bristol Myers Squibb Robert W. Shinn: President of Public Affairs, Capitol Results Dr. Robert F. Turner: Law professor at the University of Virginia at Charlottesville

“… a wise and frugal government, which shall restrain men from injuring one another, shall leave them otherwise free to regulate their own pursuits of industry and improvement, and shall not take from
the mouth of labor the bread it has earned. This is the sum of good government, and this is necessary to close
the circle of our felicities.”
Thomas Jefferson, 1801
Thomas Jefferson Institute for Public Policy
9035 Golden Sunset Lane ● Springfield, VA 22153 703-440-9447 ● [email protected]
www.thomasjeffersoninst.org