
AIS SAKET This too ‘Shield’ing from the crisis shall pass ...
Upload
marmore-mena-intelligenceCategory
view
214download
0description

Kuwait Financial Centre “Markaz” R E S E A R C H
This Too Shall Pass What can we expect in 2009?
“Prediction is very difficult, especially about the future!”- Niels Bohr The Year That Was: If given a chance, we would like to remove 2008 from the calendar. No one was spared during the year (Appendix-2). Bearish waves swept across the globe right from developed markets to emerging markets. The so-called notion of “decoupling” went for a toss proving the point that globalization is here to stay. Correlations not only converged on the positive zone, but they stayed there for too long to provide any diversification comfort. The scene in the GCC was very ugly with oil price posting a massive retreat from a high of $147/b to less than $40/b thanks to a spate of events including global recession worries. More importantly, the winding up of speculative froth in oil was exacerbated by a global liquidity crisis that left speculators short of cash. While the year started with inflation being the predominant worry, by the end of the year growth replaced that concern. Central banks in the region, in line with other central banks in the world, were busy fire fighting through injecting cash into the system, rescuing banks, and facing other policy dilemmas. The primary market came to a grinding halt in 4Q08 (only 99.9% drop!). The Year That Will Be: The billion dollar question is how will 2009 pan out? Will it mark a revival (like earlier bear periods in 2006/1998) or should we be bracing for yet another year of hard life? This would have been an easy question if only a few factors affected market performance. Hence, we resorted to structuring a 7-force framework that looked at: Economy, Earnings, Valuation, Investor Sentiment, Geo Politics, Liquidity and Regulation. We strongly believe that market direction in general is determined by what really happens to all of these even though it may be impossible to assess the extent of interrelationships among these variables. Through a bottom-up approach, we collated statistics relevant to these variables in order to assess their likely impact on market performance. Our verdict: 2009 will likely exhibit a mixed bag. Qatar and Oman (Positive); Saudi Arabia, Kuwait, & UAE (Neutral); Bahrain (Negative). Investment Themes for 2009: Apart from market assessments, the report also provides five key investment themes that can be put into action for 2009 viz., Volatility, Sector picks, Value hunting, Capital protection & consolidation opportunities. Key Questions: Our pursuit to provide a direction for 2009 would not be complete till we provide certain clues on questions that bother client minds at this point in time. For e.g., Can we expect to see more corporate failures leading to bankruptcies? We are sure there are more questions than answers as we navigate 2009. Wishing all of you best for 2009 !
January 2009 Research Highlights: Reviewing the year that wasand projecting the year thatwill be based on anassessment of various driversthat specifically affect theperformance of GCC stockmarkets. The report alsopresents certain investmentthemes and raises keyquestions along withperspectives. Markaz Research is available on Bloomberg Type “MRKZ” <Go> M.R. Raghu CFA, FRM Head of Research +965 2224 8280 [email protected] Amrith Mukkamala Senior Analyst +965 2224 8281 [email protected] Layla Al-Ammar Investment Analyst +965 2224 8000 Ext: 1205 [email protected] Sarah Alkhalid Assistant Analyst +965 2224 8000 Ext: 1204 [email protected] Kuwait Financial Centre “Markaz” P.O. Box 23444, Safat 13095, Kuwait Tel: +965 2224 8000 Fax: +965 2242 5828 markaz.com
R E S E A R C H January 2009
Kuwait Financial Centre “Markaz”
2
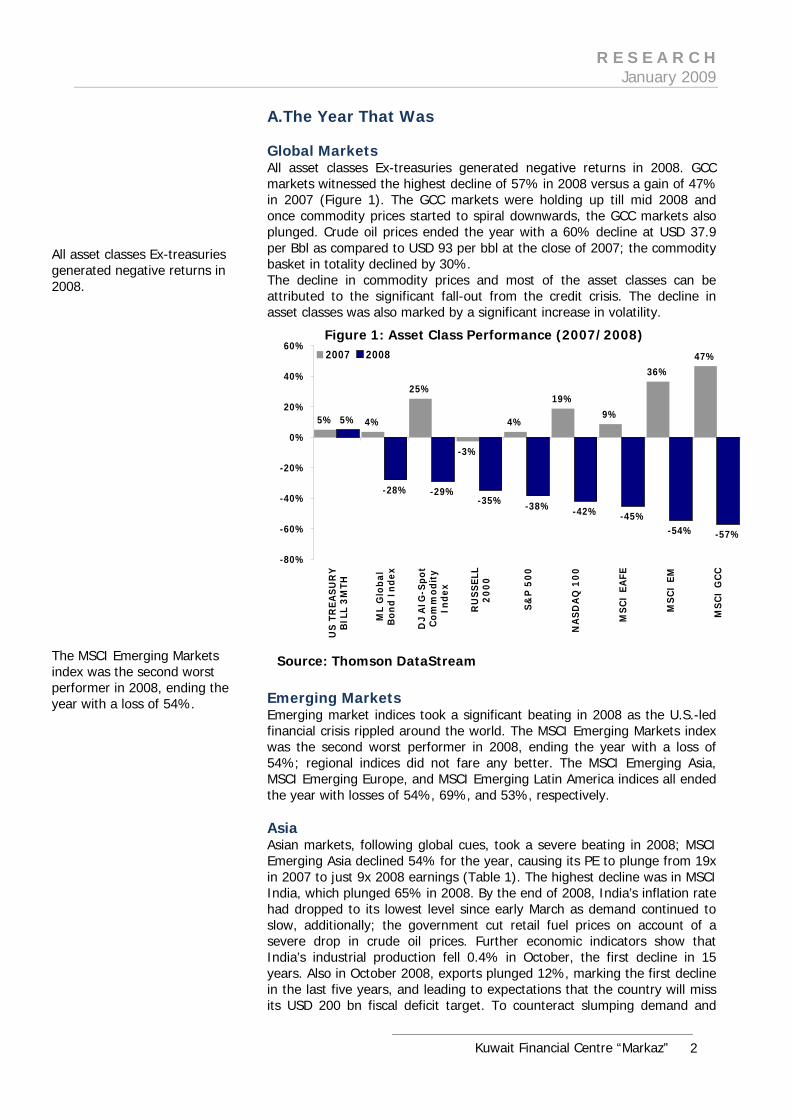
A.The Year That Was Global Markets All asset classes Ex-treasuries generated negative returns in 2008. GCC markets witnessed the highest decline of 57% in 2008 versus a gain of 47% in 2007 (Figure 1). The GCC markets were holding up till mid 2008 and once commodity prices started to spiral downwards, the GCC markets also plunged. Crude oil prices ended the year with a 60% decline at USD 37.9 per Bbl as compared to USD 93 per bbl at the close of 2007; the commodity basket in totality declined by 30%. The decline in commodity prices and most of the asset classes can be attributed to the significant fall-out from the credit crisis. The decline in asset classes was also marked by a significant increase in volatility.
5% 4%
25%
-3%
4%
19%9%
36%47%
5%
-28% -29%-35% -38% -42% -45%
-54% -57%
-80%
-60%
-40%
-20%
0%
20%
40%
60%U
S T
REA
SU
RY
BIL
L 3
MTH
ML
Glo
bal
Bon
d In
dex
DJ
AIG
-Spo
tC
omm
odit
yIn
dex
RU
SS
ELL
20
00
S&
P 5
00
NA
SD
AQ
10
0
MS
CI
EAFE
MS
CI
EM
MS
CI
GC
C
2007 2008
Emerging Markets Emerging market indices took a significant beating in 2008 as the U.S.-led financial crisis rippled around the world. The MSCI Emerging Markets index was the second worst performer in 2008, ending the year with a loss of 54%; regional indices did not fare any better. The MSCI Emerging Asia, MSCI Emerging Europe, and MSCI Emerging Latin America indices all ended the year with losses of 54%, 69%, and 53%, respectively. Asia Asian markets, following global cues, took a severe beating in 2008; MSCI Emerging Asia declined 54% for the year, causing its PE to plunge from 19x in 2007 to just 9x 2008 earnings (Table 1). The highest decline was in MSCI India, which plunged 65% in 2008. By the end of 2008, India’s inflation rate had dropped to its lowest level since early March as demand continued to slow, additionally; the government cut retail fuel prices on account of a severe drop in crude oil prices. Further economic indicators show that India’s industrial production fell 0.4% in October, the first decline in 15 years. Also in October 2008, exports plunged 12%, marking the first decline in the last five years, and leading to expectations that the country will miss its USD 200 bn fiscal deficit target. To counteract slumping demand and
Source: Thomson DataStream
Figure 1: Asset Class Performance (2007/2008)
All asset classes Ex-treasuries generated negative returns in 2008. The MSCI Emerging Markets index was the second worst performer in 2008, ending the year with a loss of 54%.

R E S E A R C H January 2009
Kuwait Financial Centre “Markaz”
3
confidence, the central bank of India cut interest rates three times in the last two months of 2008 in an effort to stimulate growth. India’s GDP growth is expected to slow to 7% in 2009 from 9% or more annually in the previous three years as the global financial turmoil continues to take its toll1. MSCI China lost 52% in 2008; bringing its PE from 27x in 2007 to 10x in 2008. As the U.S. and Europe announced ever-worsening financial and economic news, China's GDP growth slowed to 9% in the third quarter, from 10% in the second quarter and is expected to come in at 9.7% for 20082. The purchasing managers' index (PMI), which monitors production activity, fell to an all-time low of 38.8 in November, while exports fell 2.2%, the first contraction since 20013. As economic indicators in China continued to deteriorate, officials unveiled a US$586 bn stimulus package to reinvigorate slacking growth and boost exports. Table 1: Emerging Asia Market Performance
Country
Market Cap End of 2008
(USD Bn) 2007 2008 PE
2007 PE
2008 MSCI China 318 63 -52 27 10 MSCI Korea 238 30 -56 14 9 MSCI Taiwan 190 5 -49 17 8 MSCI India 114 71 -65 29 11 MSCI Indonesia 26 51 -58 21 9 MSCI Thailand 24 41 -50 14 7 MSCI Malaysia 19 N/A -44 N/A N/A
MSCI Philippines 9 38 -54 15 12 MSCI EM ASIA 973 38 -54 19 9
Source: Thomson DataStream Emerging Europe Emerging European markets saw even more substantial losses in 2008 as contagion from the Euro zone made its way across the continent. MSCI Emerging Europe ended the year with a whopping 69% loss (Table 2). Russia took the brunt of the decline, as plummeting oil prices and an accelerated devaluation of its currency took a severe toll on the country; MSCI Russia plunged 74% in 2008, dropping its PE from 15x in 2007 to a miniscule 3x by the end of 2008. Persistent oil price declines, an accelerated devaluation in its currency (more than 20% against the dollar since August) all exacerbated the decline. As for the economy, Russia’s Federal State Statistics Services office stated that retail sales fell in November for the first time since January while unemployment rose 6.6%, the highest in seven months. Meanwhile, producer prices fell, with the annual rate declining to 4.2% from 17.4% in October, the slowest pace since March 2007. Standard & Poor’s recently cut Russia’s credit rating for the first time in nine years on concern it was wasting reserves defending the currency. Russia is now rated BBB, the second lowest investment grade. The 30-year sovereign dollar-bonds slumped 24 % in 2008, pushing the yield as high as 12.55% in October, the most since December 2001. The rest of Emerging Europe has also been hit hard by the global financial crisis; Iceland announced bankruptcy, while Hungary, Latvia, Ukraine and
1 World Economic Outlook, November 2008, International Monetary Fund 2 International Monetary Fund 3 China Economic Review, January 2009
MSCI China lost 52% in 2008; bringing its PE from 27x in 2007 to 10x in 2008. MSCI Emerging Europe ended the year with a whopping 69% loss.

R E S E A R C H January 2009
Kuwait Financial Centre “Markaz”
4
Belarus all submitted aid requests to the International Monetary Fund (IMF). Table 2: Emerging Europe Market Performance
Country
Market Cap End of 2008
USD Bn 2007 2008 PE
2007 PE
2008 MSCI Russia 99 23 -74 15 3 MSCI Poland 28 23 -56 15 7 MSCI Turkey 26 N/A -63 11 5 MSCI Czech 16 52 -45 24 10 MSCI Hungary 11 13 -62 13 4 MSCI EM Europe 180 28 -69 15 4
Source: Thomson DataStream Latin America Latin America did not prove immune to the fall-out as the MSCI EM LATAM index lost 53% in 2008, a complete reversal, and then some, of its 2007 gain of 47%; pulling its 2008 PE to 9x (Table 3). Latin American equities (in dollar terms) declined by more than 60% from Q3 2008 and are at levels last seen in 20054. While the IMF has downgraded all its forecasts for 2009, it is still expecting a 2.5% growth in Latin America5. Increased unemployment, slowing demand for commodities and tumbling oil prices all contributed to the market fall in Brazil, as the MSCI Brazil index plummeted 58% in 2008, the largest decline in Emerging LatAm. Source: SoursSource: Thomson DataStream Developed Markets (ex. US) 2008 will be a year best forgotten by developed market indices, which saw plummeting stock markets, failing of major institutions and nationalization of others, in addition to industry bailouts. An exceedingly pessimistic sentiment permeated international developed equity markets through the latter half of 2008, with equity valuations having decreased to levels not seen since the 1930’s. Investor behavior forced a windfall of policy responses from the respective authorities; consequently, central banks across the developed world began aggressively cutting rates in the last three months of 2008. The European Central Bank cut rates by 0.75% to 2.5% (though it remains exceedingly high when compared to other
4 State Street Global Markets 5 World Economic Outlook, November 2008, International Monetary Fund
Table 3: Emerging Latin America Market Performance
Country
Market Cap End of 2008
(USD Bn) 2007 2008 PE
2007 PE
2008 MSCI Brazil 226 75 -58 16 8 MSCI Mexico 91 N/A -44 16 12 MSCI Chile 24 21 -37 22 13 MSCI Peru 12 86 -42 15 11 MSCI Colombia 11 13 -28 27 13 MSCI Argentina 2 -5 -55 13 4 MSCI EM LATAM 367 47 -53 16 9

R E S E A R C H January 2009
Kuwait Financial Centre “Markaz”
5
developed nations), the Bank of England cut rates by 1.0 percentage point to 2%, the Bank of Japan has cut its benchmark rate to 0.1%, while the US Federal Reserve has brought rates down to the zero – 0.25% range, in the vein hope of spurring growth in the face of what some believe will be a very painful recession. Most, if not all, developed nations have reconciled themselves to a recession in 2009; in Japan, the credit crisis encouraged investors to return their investments home. The Bank of Japan has also increased purchases of government debt and announced plans to buy commercial paper for the first time as the deepening recession starves companies of funds. In the EU, the aforementioned interest rate decline, which was the largest cut in the ECB’s 10-year history, came amid expectation from the European Commission of a sharp decline in regional growth in 2009. In 2008, the best performing Developed market index was the UK FTSE, which lost 31% (Table 4). The MSCI EAFE, which tracks developed markets excluding the US and Canada, closed the year with a loss of 45%, bringing its PE down to 9x in 2008 from 14x in 2007. Table 4: Developed Markets Performance (ex US)
Country Index
Market Cap End of 2008(USD bn)
2007 2008 PE 07
PE 08
Japan Nikkei 225 2007 -11 -42 18 17
UK FTSE 1605 4 -31 12 8 France CAC 40 1097 1 -43 12 9 Germany DAX 788 22 -40 14 10 Developed Markets (ex. US & Canada)
MSCI EAFE 7762 10 -45 14 9
Source: Excerpt from the Markaz Daily Morning Brief; Thomson DataStream U.S The US market was ruthlessly battered in the latter half of 2008 as each month brought increasingly negative market and economic news; from the failures at Lehman Brothers and Merrill Lynch, to problems with AIG and the nationalization of Freddie Mac and Fannie Mae, all amid a backdrop of ever-worsening economic news. The recent cut in the US Federal Reserve interest rate to zero-0.25% is likely to be sustained as economic indicators show more tough times ahead. The $25 billion bailout of the US auto industry was a positive sign for the market, though some analysts feel it was merely a stop-gap solution to ensure that the industry remained solvent to the end of the year. A failure of the big 3 US automakers would result in 1% reduction in US economic growth in addition to a loss of 1.1 million jobs. Consumer activity showed no signs of picking up during the holiday season; spending by American consumers fell in November for a record fifth month, while home sales and orders for durable goods also declined6. The housing market (where all the trouble started) has not shown signs of recovering any time soon, the National Association of Realtors (NAR) announced that its index of pending home sales declined 4% in November of 2008, to its lowest level since the index’ creation in 2001. Mortgage rates in some parts of the country declined to 50-year lows toward the end of the year.
6 Bloomberg
In 2008, the best performing Developed market index was the UK FTSE, which lost 31%. The MSCI EAFE closed the year with a loss of 45%, bringing its PE down to 9x in 2008 from 14x in 2007.

R E S E A R C H January 2009
Kuwait Financial Centre “Markaz”
6
The Dow Jones Industrial Average was the best performer losing 34% in 2008. The NASDAQ Composite was the worst performer, losing 40% for the year (Table 5). Table 5: US Indices
Index
Market Cap End of 2008(USD Bn)
2007 (%)
2008 (%)
PE 2007
PE 2008
Russell 1000 9,316 4 -39 19 21 S&P 500 7,836 4 -38 20 12 Dow Jones Industrial Average 2,923 6 -34 16 11
NASDAQ Composite 2,534 10 -40 38 32 Russell 2000 879 -3 -35 44 N/A Source: Thomson DataStream, Bloomberg
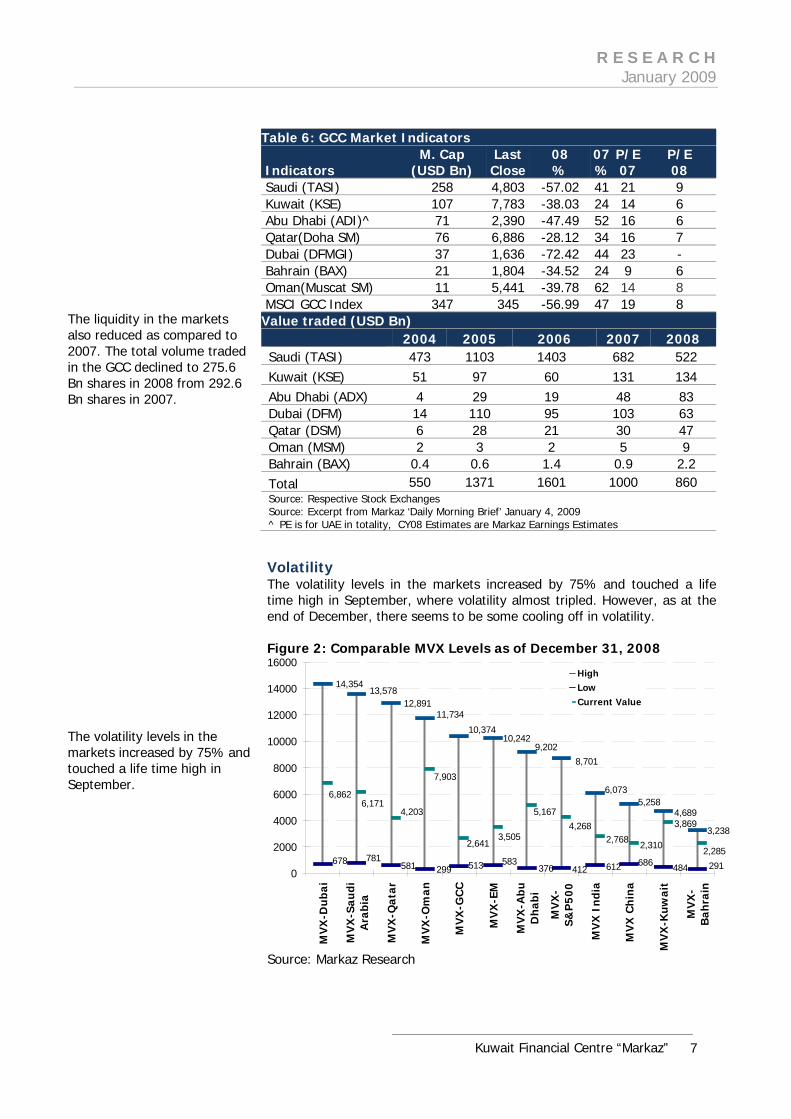
GCC Markets The GCC markets experienced a rollercoaster ride in 2008. The first half of the year was characterized by a boom in property markets and record high prices of oil as well as other commodities that fuelled concerns of high inflation. However, the second half was a contrast, with commodity prices cooling down and crude prices plummeting 70% from their highs of USD147 per barrel in July. Property prices also crashed as the global credit crisis engulfed the financial markets. Consequently, investor sentiment turned negative and the efforts of GCC governments to stimulate the economy and boost investor confidence failed. The UAE markets were amongst the most affected by the global credit crisis of 2008, with Dubai’s DFM shedding 72.4% during the year and Abu Dhabi ADX losing 47.5%; Saudi Arabia’s TASI index declined by 56.5%. The Kuwait Price Index declined 38%. (Table -6) After a positive first half, Kuwait lost ground in the second half of 2008, with all sectoral indices taking a severe beating. The liquidity in the markets also reduced as compared to 2007. The total volume traded in the GCC declined to 275.6 Bn shares in 2008 from 292.6 Bn shares in 2007. The total value traded also declined by 10.6% in 2008 (USD860.3 Bn in 2008 v/s USD962.7 Bn in 2007). (Table – 6)
The Dow Jones Industrial Average lost 34% in 2008. The NASDAQ Composite was the worst performer, losing 40% for the year. The UAE markets were amongst the most affected by the global credit crisis of 2008, with the DFM shedding 72.4% during the year and the ADX losing 47.5%.
R E S E A R C H January 2009
Kuwait Financial Centre “Markaz”
7
Volatility The volatility levels in the markets increased by 75% and touched a life time high in September, where volatility almost tripled. However, as at the end of December, there seems to be some cooling off in volatility. Figure 2: Comparable MVX Levels as of December 31, 2008
8,701
5,2584,689
3,238
13,578
6,073
9,202
14,354
10,242
11,73412,891
10,374
291686 484412299581 376678 781
513 583 612
2,641
4,268
2,3102,285
3,8694,203
6,862
3,505
6,1715,167
2,768
7,903
0
2000
4000
6000
8000
10000
12000
14000
16000
MV
X-D
ub
ai
MV
X-S
aud
iA
rabi
a
MV
X-Q
atar
MV
X-O
man
MV
X-G
CC
MV
X-E
M
MV
X-A
bu
Dh
abi
MV
X-
S&P
500
MV
X I
nd
ia
MV
X C
hin
a
MV
X-K
uwai
t
MV
X-
Bah
rain
HighLowCurrent Value
Source: Markaz Research
Table 6: GCC Market Indicators Indicators
M. Cap (USD Bn)
LastClose
08 %
07 %
P/E 07
P/E 08
Saudi (TASI) 258 4,803 -57.02 41 21 9 Kuwait (KSE) 107 7,783 -38.03 24 14 6 Abu Dhabi (ADI)^ 71 2,390 -47.49 52 16 6 Qatar(Doha SM) 76 6,886 -28.12 34 16 7 Dubai (DFMGI) 37 1,636 -72.42 44 23 - Bahrain (BAX) 21 1,804 -34.52 24 9 6 Oman(Muscat SM) 11 5,441 -39.78 62 14 8 MSCI GCC Index 347 345 -56.99 47 19 8
Value traded (USD Bn) 2004 2005 2006 2007 2008 Saudi (TASI) 473 1103 1403 682 522 Kuwait (KSE) 51 97 60 131 134 Abu Dhabi (ADX) 4 29 19 48 83 Dubai (DFM) 14 110 95 103 63 Qatar (DSM) 6 28 21 30 47 Oman (MSM) 2 3 2 5 9 Bahrain (BAX) 0.4 0.6 1.4 0.9 2.2 Total 550 1371 1601 1000 860 Source: Respective Stock Exchanges Source: Excerpt from Markaz ‘Daily Morning Brief’ January 4, 2009 ^ PE is for UAE in totality, CY08 Estimates are Markaz Earnings Estimates
The liquidity in the markets also reduced as compared to 2007. The total volume traded in the GCC declined to 275.6 Bn shares in 2008 from 292.6 Bn shares in 2007. The volatility levels in the markets increased by 75% and touched a life time high in September.

R E S E A R C H January 2009
Kuwait Financial Centre “Markaz”
8
Correlation Correlations among GCC markets continue to edge higher in tandem with common set of crisis being faced by the markets. However, compared to US markets (S&P 500) correlations continue to be attractive and in certain cases (Kuwait, Oman, Bahrain, & Qatar) continues to be either negative or close to zero. (Table 7 & 8)
Table 7: Short-Term Return Correlation 1Y Correlation (January 2008– December 2008)
Saudi Arabia Kuwait Dubai Abu
Dhabi Qatar Oman Bahrain S&P 500 GEM*
Saudi Arabia 100
Kuwait 17 100 Dubai 33 47 100 Abu Dhabi 32 52 83 100
Qatar 26 53 67 73 100 Oman 26 42 61 64 62 100 Bahrain 11 62 49 54 55 47 100 S&P 500 23 (4) 14 13 1 (2) (1) 100
GEM* 31 18 40 37 31 30 25 48 100
Source: Markaz Research; *: Global Emerging Markets
Table 8: Long-Term Return Correlation 3Y Correlation (January 2006– December 2008)
Saudi Arabia Kuwait Dubai Abu
Dhabi Qatar Oman Bahrain S&P 500
GEM*
Saudi Arabia 100
Kuwait 16 100 Dubai 25 33 100 Abu Dhabi 25 37 68 100 Qatar 13 33 42 49 100 Oman 16 29 41 44 48 100 Bahrain 8 42 30 35 37 35 100 S&P 500 11 (2) 8 8 1 0 0 100
GEM* 16 12 26 24 22 25 16 45 100
Source: Markaz Research; *: Global Emerging Markets Primary Market Scenario The IPO market was buoyant till the first half of 2008. The dollar value of IPO’s was close to double the amount that was raised in the same period in 2007. The total amount of money that was raised in the Mena region in the first half was at USD 9 Bn as compared to USD 3.8 Bn in the second half. As in the secondary markets, the second half of the year made a significant negative impact on the primary market. In terms of dollar value the primary markets witnessed a decline of 9% in 2008 and in terms of issues it witnessed a decline of 25% in the Mena region. At a GCC level, the amounts raised from IPO’s declined by 3% and the number of IPO’s declined from 33 in 2007 to 25 in 2008. (Table – 9)
Correlations among GCC markets continue to edge higher in tandem with common set of crisis being faced by the markets. The total amount of money that was raised in the Mena region in the first half was at USD 9 Bn as compared to USD 3.8 Bn in the second half.

R E S E A R C H January 2009
Kuwait Financial Centre “Markaz”
9
Table 9: IPO Activity 2005 2006 2007 2008
No. of IPO's
Offering size ($mn)
No. of
IPO's
Offering size
($mn) No. of IPO's
Offering size
($mn)
No.of
IPO's
Offering size
($mn) Saudi Arabia 4 1,674 10 2,785 26 4,814 13 9,704
UAE 9 2,759 7 2,733 3 6,559 8 1,288
Kuwait 3 747 1 123 0 - 1 98
Qatar 3 1,112 2 1,355 2 389 1 511
Oman 3 785 1 54 1 156 2 70
Bahrain 3 103 3 1,036 1 69 - -
Total 25 7,181 24 8,087 33 11,989 25 11,672
Source: Zawya IPO Monitor B. The year that will be The most important question is what to expect for 2009. Easier asked than answered! We believe that there area host of factors that confluence the markets. We have identified seven such factors that we feel will directly impact market performance during 2009. Based on its importance, we provide weights to each of these seven factors. (Figure 3). An explanatory description for all the seven factors can be found in Appendix 1. Figure 3: 7-Force Framework
GCC CountryAssessment
Economic Factors
20%
Valuation Attraction
15%
Earnings GrowthPotential
15%
Investor Sentiment
10%
Geo Political Developments
10%
Market Liquidity10%
RegulatoryDevelopments
20%
Source: Markaz Research
We have identified seven factors that we feel will directly impact market performance during 2009.

R E S E A R C H January 2009
Kuwait Financial Centre “Markaz”
10
1. Economic Parameters i. Real GDP Growth Forecast The GCC region is likely to record a growth rate of 3.6% which is significantly lower compared to the golden years of 2000-2008. The GCC level real GDP forecasts for 2009 were revised downwards significantly. The important reason for the same is a marked decline in expected oil production. Among the countries within the GCC, the worst impact is expected to be on Saudi Arabia with a forecasted GDP growth of 2.3% for 2009. This will be a fall from 4.1% GDP growth in 2008. Countries which are still expected to post strong positive growth rates as compared to 2008 are Qatar and Oman with a growth of 10.2% and 5.5%, respectively (Table 10). Qatar has been consistently posting the highest growth in the region historically. The 2000 – 2008 average GDP growth in Qatar has been the highest at 10.62%. Table 10: Real GDP Growth
Real GDP Growth Saudi Arabia Kuwait UAE Qatar Oman Bahrain
Real GDP Growth (2000-2008 Avg) % 4.0 10.6 10.0 10.62 5.7 6.1
Real GDP Growth (2008 e) % 4.1 4.5 5.8 13.50 6.9 5.3
Real GDP Growth (2009 f) % 2.3 2.4 3.1 10.20 5.5 4.7
Score (0-5) 2.00 2.00 2.50 4.50 3.50 3.50 Source: IIF, Markaz research
ii. Inflation Inflation over the past year has been pushed up mainly due to higher commodity prices, high credit growth and the weak US dollar. In 2009 forecasts most of these factors seem to have reversed. Commodity prices have already fallen significantly and credit growth within the GCC is showing a marked slow down. Both these factors are expected to impact inflation rates which were soaring above 10% in 2008. At the GCC level, inflation rates are expected to come down to around the 7.5% - 8% mark in 2009. Among the GCC countries the highest decline in inflation rates is expected to come from Oman and Qatar. Both these countries posted an above 10% inflation rate in 2008 at 12.6% and 16.1%, respectively. For 2009, the inflation rate is expected to cool down to 8% and 10.4%, respectively. (Table 11) Table 11: Inflation
Inflation Saudi Arabia Kuwait UAE Qatar Oman Bahrain
Inflation Rate (2000-2008 Avg) 1.7 3.3 6.1 7.0 2.2 1.4 Inflation (2008 e) annual change 10.0 10.4 14.8 16.1 12.6 3.4 Inflation (2009 f) annual change 7.1 8.4 9.9 10.4 8.0 3.1 Score (0-5) 3.50 3.50 3.50 3.50 4.00 5.00 Source: IIF, Markaz research
The GCC region is likely to enjoy decent growth rates even though they will be lower than the golden years of 2000-2008. At the GCC level, the inflation rates are expected to come down to around the 7.5% - 8% mark in 2009.

R E S E A R C H January 2009
Kuwait Financial Centre “Markaz”
11
iii. Fiscal Balance The GCC region on a whole posted a fiscal surplus of 22% in 2008, thanks to high oil prices on an average. (Oil prices touched a peak of USD 145 per Bbl during the year). Going forward, with the lackluster commodity markets and general global economy on a whole coupled with several production cuts, the revenues are expected to be significantly lower than 2008. The fiscal surplus at a GCC level is expected to come down to 4.7% in 2009. Within the GCC countries, none of the economies are expected to post a growth in the fiscal surplus as a percentage of GDP compared to 2008. Also, two economies - Bahrain and Oman are expected to post a fiscal deficit in 2009. The highest fall in this ratio is in Saudi Arabia, wherein, the fiscal surplus as a percentage of GDP is expected to be lower at 3% as compared to 22% in 2008. Table 12: Fiscal Balance (% to GDP)
Fiscal Balance Saudi Arabia Kuwait UAE Qatar Oman Bahrain
Fiscal Balance (2000-2008 Avg)-% to GDP 10 31 14 9 9 3
Fiscal Balance (2008 e)-% to GDP 22 22 28 15 15 8
Fiscal Balance (2009 f) - % to GDP- 3 4 12 4 -6 -7
Score (0-5) 1.50 1.50 3.00 2.50 0.00 0.00 Source: IIF, Markaz research
iv. Current Account Balance The reduction in revenues is also expected to impact the current account balances negatively. In the year 2008, the GCC economies are expected to post record current account surpluses due to high average oil prices. GCC current account surpluses as a percentage of GDP was at a high of 29% in 2008 with countries like Kuwait and Qatar posting 43% each. However, in 2009, the current account surpluses are expected to decline significantly to 4.6% of GDP in 2009 at a GCC level. At a country level, Saudi Arabia is expected to post the highest decline in current account surplus as a percentage of GDP from 31% in 2008 to 0% in 2009 while Oman is expected to post negative results on this. Table 13: Current Account Balance (% to GDP) Current Account Balance
Saudi Arabia Kuwait UAE Qatar Oman Bahrain
Current Account Balance (2000-2008 Avg) - % to GDP
19 36 14 30 11 9
Current Account Balance (2008 e) - % to GDP
31 43 20 43 12 21
Current Account Balance (2009 f) - % to GDP
0 22 6 12 -12 7
Score (0-5) 0.50 4.00 2.00 3.50 0.00 1.00 Source: IIF, Markaz research
The GCC region on a whole posted a fiscal surplus of 22% in 2008, thanks to high oil prices on an average. The reduction in revenues is also expected to impact the current account balances negatively.

R E S E A R C H January 2009
Kuwait Financial Centre “Markaz”
12
v. Broad money growth The GCC region witnessed acceleration in money supply from 2004 to 2007. However, the scenario in 2008 is pointing towards low money supply growth in line with slowing economy. While the money supply growth in 2008 is still higher compared to long-term average, it is considerably lower compared to the last four years. Among the GCC countries, the UAE is expected to post the highest decline in money supply growth in 2008 as compared to 2007. In 2007, UAE posted a money supply growth of 37%, which was its life time high. This rate of growth is expected to reduce to 17% in 2009. (Table 14)
Table 14: Money Supply Broad Money Growth
Saudi Arabia Kuwait UAE Qatar Oman Bahrain
Average (1998-2002)-% change 7 5 13 8 6 10 2003 7 8 12 16 3 8 2004 19 12 23 21 4 8 2005 12 12 37 43 21 18 2006 19 22 22 38 25 17 2007 20 19 37 33 37 36 2008 16 13 17 28 20 20 Score (0-5) 2.50 2.50 2.50 4.00 3.00 3.50 Source: IIF, Markaz Research
Overall Economic Factors Scores The overall economic scenario is a mixed bag with Saudi Arabia and Oman falling in negative category. Kuwait, UAE and Bahrain fall in neutral while Qatar scores positive in our assessment. (Table 15). Table 15: Economic Factors Scores Overall Scores
Saudi Arabia Kuwait UAE Qatar Oman Bahrain
Economic Growth 2.00 2.00 2.50 4.50 3.50 3.50
Inflation 3.50 3.50 3.50 3.50 4.00 5.00 Fiscal Balance 1.50 1.50 3.00 2.50 0.00 0.00
Current Account Balance
0.50 4.00 2.00 3.50 0.00 1.00
Broad Money Growth 2.5 2.5 2.5 4 3 3.5
Overall Score 2.00 2.70 2.70 3.60 2.10 2.60
Qualitative Assessment Negative Neutral Neutral Positive Negative Neutral
In 2008, UAE posted a money supply growth of 37%, which was its life time high. This rate of growth is expected to reduce to 17% in 2009. The overall scores for the economic scenario continue to be positive.
R E S E A R C H January 2009
Kuwait Financial Centre “Markaz”
13
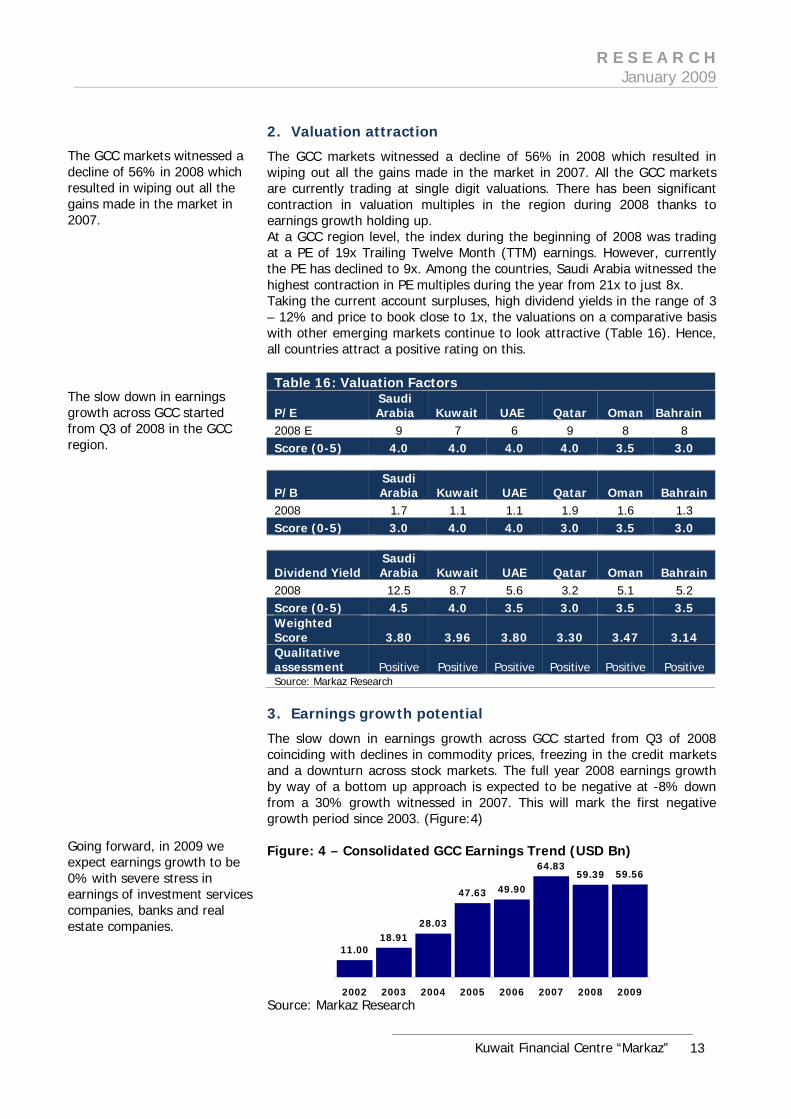
2. Valuation attraction
The GCC markets witnessed a decline of 56% in 2008 which resulted in wiping out all the gains made in the market in 2007. All the GCC markets are currently trading at single digit valuations. There has been significant contraction in valuation multiples in the region during 2008 thanks to earnings growth holding up. At a GCC region level, the index during the beginning of 2008 was trading at a PE of 19x Trailing Twelve Month (TTM) earnings. However, currently the PE has declined to 9x. Among the countries, Saudi Arabia witnessed the highest contraction in PE multiples during the year from 21x to just 8x. Taking the current account surpluses, high dividend yields in the range of 3 – 12% and price to book close to 1x, the valuations on a comparative basis with other emerging markets continue to look attractive (Table 16). Hence, all countries attract a positive rating on this. Table 16: Valuation Factors
P/E Saudi Arabia Kuwait UAE Qatar Oman Bahrain
2008 E 9 7 6 9 8 8 Score (0-5) 4.0 4.0 4.0 4.0 3.5 3.0
P/B Saudi Arabia Kuwait UAE Qatar Oman Bahrain
2008 1.7 1.1 1.1 1.9 1.6 1.3 Score (0-5) 3.0 4.0 4.0 3.0 3.5 3.0
Dividend Yield Saudi Arabia Kuwait UAE Qatar Oman Bahrain
2008 12.5 8.7 5.6 3.2 5.1 5.2 Score (0-5) 4.5 4.0 3.5 3.0 3.5 3.5 Weighted Score 3.80 3.96 3.80 3.30 3.47 3.14 Qualitative assessment Positive Positive Positive Positive Positive Positive Source: Markaz Research
3. Earnings growth potential
The slow down in earnings growth across GCC started from Q3 of 2008 coinciding with declines in commodity prices, freezing in the credit markets and a downturn across stock markets. The full year 2008 earnings growth by way of a bottom up approach is expected to be negative at -8% down from a 30% growth witnessed in 2007. This will mark the first negative growth period since 2003. (Figure:4) Figure: 4 – Consolidated GCC Earnings Trend (USD Bn)
11.0018.91
28.03
47.63 49.90
64.8359.39 59.56
2002 2003 2004 2005 2006 2007 2008 2009 Source: Markaz Research
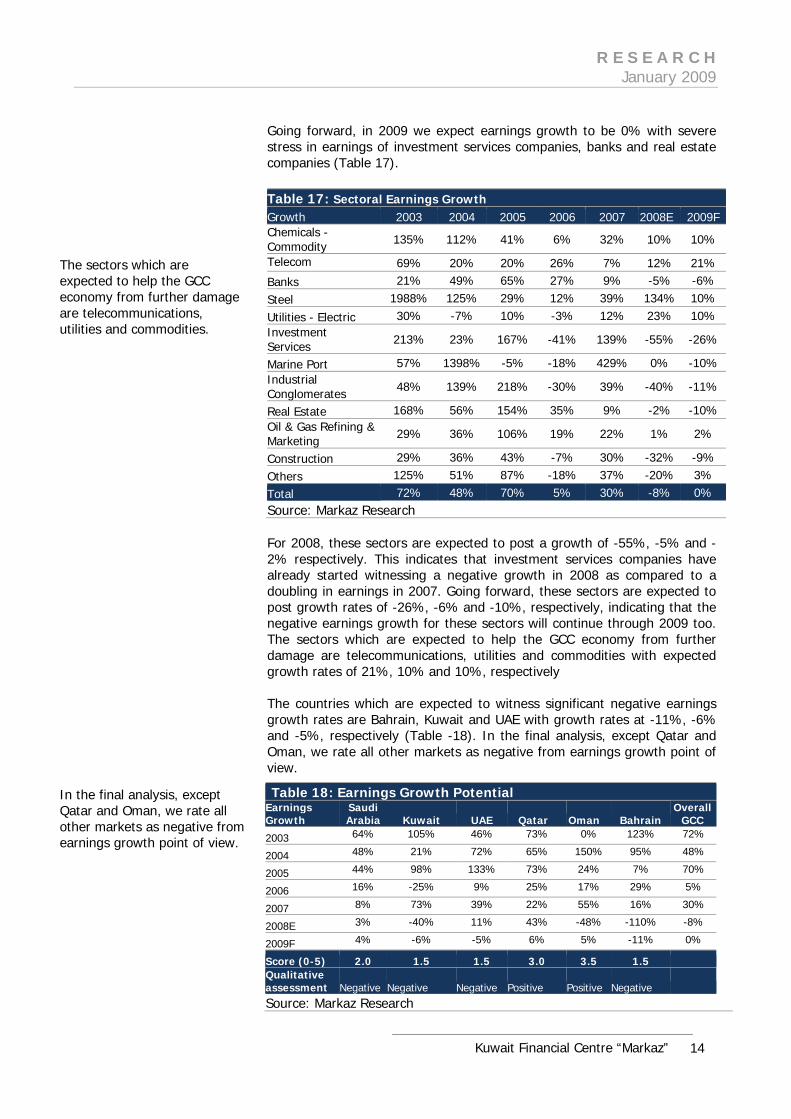
The GCC markets witnessed a decline of 56% in 2008 which resulted in wiping out all the gains made in the market in 2007. The slow down in earnings growth across GCC started from Q3 of 2008 in the GCC region. Going forward, in 2009 we expect earnings growth to be 0% with severe stress in earnings of investment services companies, banks and real estate companies.
R E S E A R C H January 2009
Kuwait Financial Centre “Markaz”
14
Going forward, in 2009 we expect earnings growth to be 0% with severe stress in earnings of investment services companies, banks and real estate companies (Table 17).
Table 17: Sectoral Earnings Growth Growth 2003 2004 2005 2006 2007 2008E 2009F Chemicals - Commodity 135% 112% 41% 6% 32% 10% 10%
Telecom 69% 20% 20% 26% 7% 12% 21%
Banks 21% 49% 65% 27% 9% -5% -6%
Steel 1988% 125% 29% 12% 39% 134% 10%
Utilities - Electric 30% -7% 10% -3% 12% 23% 10% Investment Services 213% 23% 167% -41% 139% -55% -26%
Marine Port 57% 1398% -5% -18% 429% 0% -10% Industrial Conglomerates 48% 139% 218% -30% 39% -40% -11%
Real Estate 168% 56% 154% 35% 9% -2% -10% Oil & Gas Refining & Marketing 29% 36% 106% 19% 22% 1% 2%
Construction 29% 36% 43% -7% 30% -32% -9%
Others 125% 51% 87% -18% 37% -20% 3%
Total 72% 48% 70% 5% 30% -8% 0% Source: Markaz Research For 2008, these sectors are expected to post a growth of -55%, -5% and -2% respectively. This indicates that investment services companies have already started witnessing a negative growth in 2008 as compared to a doubling in earnings in 2007. Going forward, these sectors are expected to post growth rates of -26%, -6% and -10%, respectively, indicating that the negative earnings growth for these sectors will continue through 2009 too. The sectors which are expected to help the GCC economy from further damage are telecommunications, utilities and commodities with expected growth rates of 21%, 10% and 10%, respectively The countries which are expected to witness significant negative earnings growth rates are Bahrain, Kuwait and UAE with growth rates at -11%, -6% and -5%, respectively (Table -18). In the final analysis, except Qatar and Oman, we rate all other markets as negative from earnings growth point of view. Table 18: Earnings Growth Potential Earnings Growth
Saudi Arabia Kuwait UAE Qatar Oman Bahrain
Overall GCC
2003 64% 105% 46% 73% 0% 123% 72%
2004 48% 21% 72% 65% 150% 95% 48%
2005 44% 98% 133% 73% 24% 7% 70%
2006 16% -25% 9% 25% 17% 29% 5%
2007 8% 73% 39% 22% 55% 16% 30%
2008E 3% -40% 11% 43% -48% -110% -8%
2009F 4% -6% -5% 6% 5% -11% 0%
Score (0-5) 2.0 1.5 1.5 3.0 3.5 1.5 Qualitative assessment Negative Negative Negative Positive Positive Negative Source: Markaz Research
The sectors which are expected to help the GCC economy from further damage are telecommunications, utilities and commodities. In the final analysis, except Qatar and Oman, we rate all other markets as negative from earnings growth point of view.

R E S E A R C H January 2009
Kuwait Financial Centre “Markaz”
15
4. Investor Sentiment
We have used the Bayt’s Consumer Confidence Index to determine the sentiment of investors (Table 19). Consumer Confidence Index is survey based and reveals the economic well – being of a country. The index is tracked since 2007 and shows a declining trend till 2008. We expect this trend to continue further taking the current job losses and increasing losses of companies into consideration. Among the tracked countries, UAE shows the highest decline in the confidence index on a YoY basis followed by Kuwait and hence these countries rank negative in our assessment. Qatar is the only country that ranks positive on this. Table 19: Consumer Confidence Bayt Consumer Confidence Index
Saudi Arabia Kuwait UAE Qatar Oman Bahrain
Apr-07 652 635 634 672 NA NA Jul-07 658 640 630 669 NA NA Oct-07 579 609 592 615 NA NA Jan-08 536 538 608 595 NA NA May-08 517 522 549 551 NA 544 Jul-08 504 541 497 549 NA 515 Nov-08 504 520 475 557 NA 526 2008 – 2007 Growth -13% -15% -20% -9% NA -3% Score (0-5) 2.5 1.5 1.5 3 2.5 1.5 Qualitative assessment Neutral Negative Negative Positive Neutral Negative Source: Bayt.com, YouGov Siraj, Markaz Research
5. Geopolitical Developments
The GCC region inherently has a higher geopolitical risk due to its vulnerable neighbors. Economist Intelligence Unit provides ratings of these risks for countries and we have used two of its ratings – Political risk ratings and Economic Structure ratings. All the countries in the GCC are ranked between BBB and B which indicates ratings are susceptible to change due to macro events. UAE is the only country with a political risk rating of A and Qatar and Oman have a similar rating for Economic structure. In the final analysis, all the GCC countries rank positive on this score (Table 20).
The GCC region inherently has a higher geo political risk due to its vulnerable neighbors. In the final analysis, all the GCC countries rank positive on this score.

R E S E A R C H January 2009
Kuwait Financial Centre “Markaz”
16
Table 20: Risk Ratings
Political Risk Saudi Arabia Kuwait UAE Qatar Oman Bahrain
2002 C C C C B C 2003 D C C B B C 2004 D C C B B C 2005 D C C B B C 2006 B BBB BBB BBB BBB BB 2007 B BBB A BBB BBB BB 2008 B BBB A BBB BBB BB Score (0-5) 3.5 3.5 4 3.5 3.5 3.5 Economic Structure Risk
Saudi Arabia Kuwait UAE Qatar Oman Bahrain
2002 B B B B B B 2003 B B B B C B 2004 B B B B B B 2005 B B B B B B 2006 BBB BBB A A A BBB 2007 BBB BBB BBB A A BBB 2008 BBB BBB BBB A A BB Score (0-5) 3.5 3.5 3.5 4 4 3.5 Overall Score 3.50 3.50 3.75 3.75 3.75 3.50 Qualitative Assessment Positive Positive Positive Positive Positive Positive Source: EIU, Markaz Research
6. Market Liquidity
There has been a significant decline in liquidity in the markets since 2006. In 2006, the GCC markets witnessed a total value traded at USD 1.82 Tn. This has consistently declined in 2007 and in 2008. In 2007 the value traded in the GCC exchanges declined by 45% to USD 1,000 Bn and again in 2008 it has further declined by 14% to USD 860 Bn. Among the six GCC markets, the decline in market liquidity can be mainly attributed to the decline in value traded on the Saudi Arabian bourses. (Figure: 5) Figure: 5 – Value Traded Trends (USD Bn)
23 36 62222
552
1371
1826
1000860
2000 2001 2002 2003 2004 2005 2006 2007 2008 Source: Respective stock exchanges
There has been a significant decline in liquidity in the markets since 2006. Among the six GCC markets the decline in market liquidity can be mainly attributed to the decline in value traded on the Saudi Arabian bourses.
R E S E A R C H January 2009
Kuwait Financial Centre “Markaz”
17
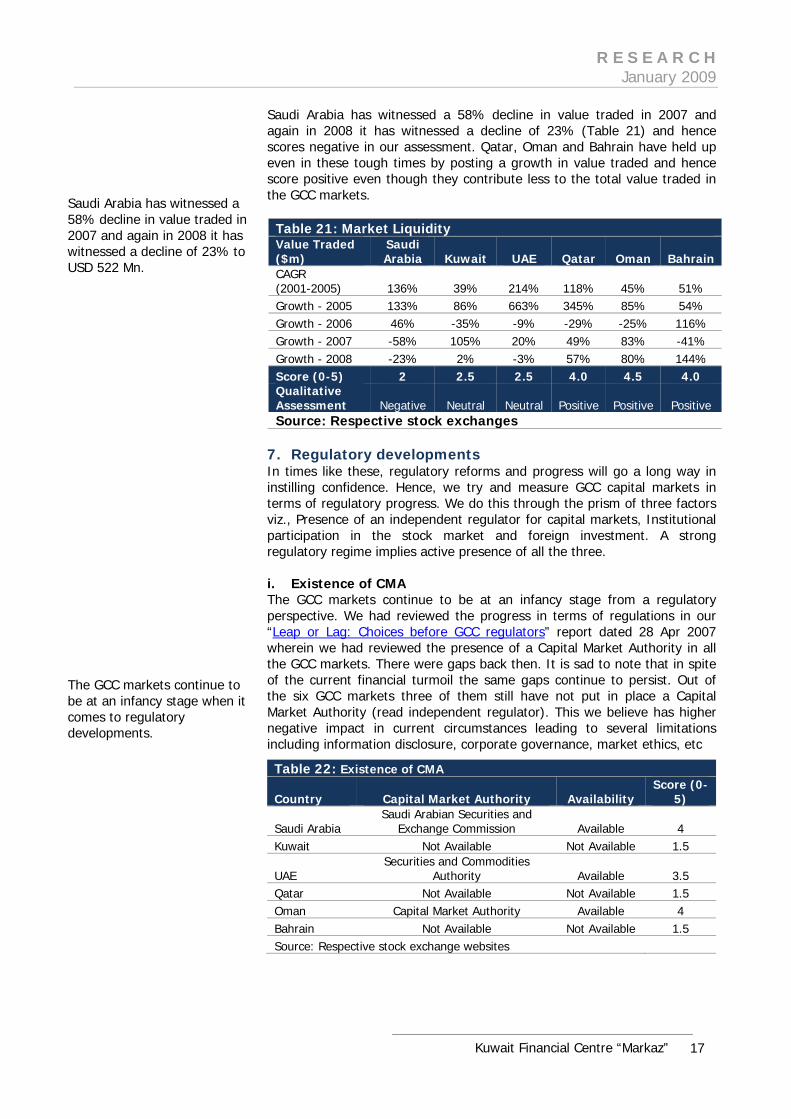
Saudi Arabia has witnessed a 58% decline in value traded in 2007 and again in 2008 it has witnessed a decline of 23% (Table 21) and hence scores negative in our assessment. Qatar, Oman and Bahrain have held up even in these tough times by posting a growth in value traded and hence score positive even though they contribute less to the total value traded in the GCC markets.
Table 21: Market Liquidity Value Traded ($m)
Saudi Arabia Kuwait UAE Qatar Oman Bahrain
CAGR (2001-2005) 136% 39% 214% 118% 45% 51% Growth - 2005 133% 86% 663% 345% 85% 54% Growth - 2006 46% -35% -9% -29% -25% 116% Growth - 2007 -58% 105% 20% 49% 83% -41% Growth - 2008 -23% 2% -3% 57% 80% 144% Score (0-5) 2 2.5 2.5 4.0 4.5 4.0 Qualitative Assessment Negative Neutral Neutral Positive Positive Positive Source: Respective stock exchanges
7. Regulatory developments In times like these, regulatory reforms and progress will go a long way in instilling confidence. Hence, we try and measure GCC capital markets in terms of regulatory progress. We do this through the prism of three factors viz., Presence of an independent regulator for capital markets, Institutional participation in the stock market and foreign investment. A strong regulatory regime implies active presence of all the three. i. Existence of CMA The GCC markets continue to be at an infancy stage from a regulatory perspective. We had reviewed the progress in terms of regulations in our “Leap or Lag: Choices before GCC regulators” report dated 28 Apr 2007 wherein we had reviewed the presence of a Capital Market Authority in all the GCC markets. There were gaps back then. It is sad to note that in spite of the current financial turmoil the same gaps continue to persist. Out of the six GCC markets three of them still have not put in place a Capital Market Authority (read independent regulator). This we believe has higher negative impact in current circumstances leading to several limitations including information disclosure, corporate governance, market ethics, etc
Table 22: Existence of CMA
Country Capital Market Authority Availability Score (0-
5)
Saudi Arabia Saudi Arabian Securities and
Exchange Commission Available 4 Kuwait Not Available Not Available 1.5
UAE Securities and Commodities
Authority Available 3.5 Qatar Not Available Not Available 1.5 Oman Capital Market Authority Available 4 Bahrain Not Available Not Available 1.5 Source: Respective stock exchange websites
Saudi Arabia has witnessed a 58% decline in value traded in 2007 and again in 2008 it has witnessed a decline of 23% to USD 522 Mn. The GCC markets continue to be at an infancy stage when it comes to regulatory developments.
R E S E A R C H January 2009
Kuwait Financial Centre “Markaz”
18
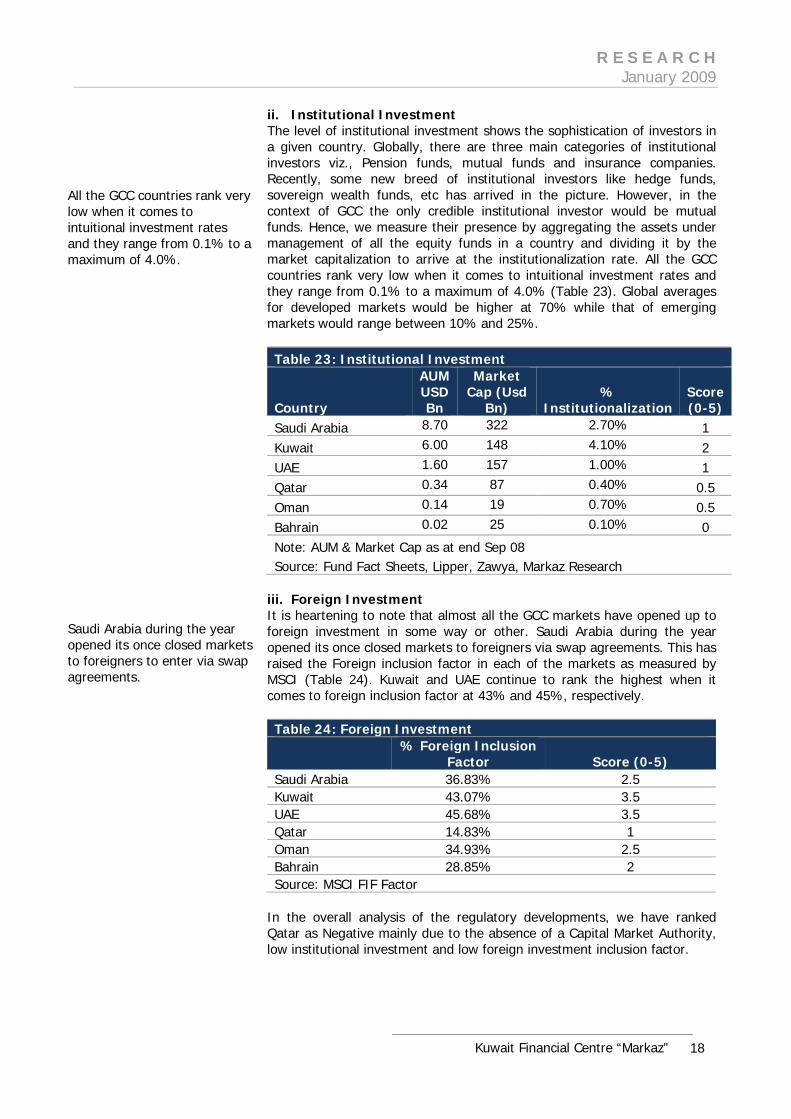
ii. Institutional Investment The level of institutional investment shows the sophistication of investors in a given country. Globally, there are three main categories of institutional investors viz., Pension funds, mutual funds and insurance companies. Recently, some new breed of institutional investors like hedge funds, sovereign wealth funds, etc has arrived in the picture. However, in the context of GCC the only credible institutional investor would be mutual funds. Hence, we measure their presence by aggregating the assets under management of all the equity funds in a country and dividing it by the market capitalization to arrive at the institutionalization rate. All the GCC countries rank very low when it comes to intuitional investment rates and they range from 0.1% to a maximum of 4.0% (Table 23). Global averages for developed markets would be higher at 70% while that of emerging markets would range between 10% and 25%. Table 23: Institutional Investment
Country
AUM USD Bn
Market Cap (Usd
Bn) %
InstitutionalizationScore (0-5)
Saudi Arabia 8.70 322 2.70% 1 Kuwait 6.00 148 4.10% 2 UAE 1.60 157 1.00% 1 Qatar 0.34 87 0.40% 0.5 Oman 0.14 19 0.70% 0.5 Bahrain 0.02 25 0.10% 0 Note: AUM & Market Cap as at end Sep 08 Source: Fund Fact Sheets, Lipper, Zawya, Markaz Research
iii. Foreign Investment It is heartening to note that almost all the GCC markets have opened up to foreign investment in some way or other. Saudi Arabia during the year opened its once closed markets to foreigners via swap agreements. This has raised the Foreign inclusion factor in each of the markets as measured by MSCI (Table 24). Kuwait and UAE continue to rank the highest when it comes to foreign inclusion factor at 43% and 45%, respectively. Table 24: Foreign Investment
% Foreign Inclusion
Factor Score (0-5) Saudi Arabia 36.83% 2.5 Kuwait 43.07% 3.5 UAE 45.68% 3.5 Qatar 14.83% 1 Oman 34.93% 2.5 Bahrain 28.85% 2 Source: MSCI FIF Factor
In the overall analysis of the regulatory developments, we have ranked Qatar as Negative mainly due to the absence of a Capital Market Authority, low institutional investment and low foreign investment inclusion factor.
All the GCC countries rank very low when it comes to intuitional investment rates and they range from 0.1% to a maximum of 4.0%. Saudi Arabia during the year opened its once closed markets to foreigners to enter via swap agreements.

R E S E A R C H January 2009
Kuwait Financial Centre “Markaz”
19
Table 25: Regulatory Development Score
Saudi Arabia Kuwait UAE Qatar Oman Bahrain
Overall Score 2.48 2.31 2.64 0.99 2.31 1.16 Qualitative Assessment Neutral Neutral Positive Negative Neutral Neutral
8. The Final Score
Our view on market attractiveness is summarized in the table below. As per the seven force framework assessment, we tend to be positive for Qatar and Oman while we express a neutral view for Saudi Arabia, Kuwait and UAE and have a negative view on Bahrain (Table 26). Table 26: Final Scores
Title WeightSaudi Arabia Kuwait UAE Qatar Oman Bahrain
Economic Factors 20% 2.00 2.70 2.70 3.60 2.10 2.60
Valuation Attraction 15% 3.80 3.96 3.80 3.30 3.47 3.14
Earnings Growth 15% 2.00 1.50 1.50 3.00 3.50 1.50
Investor Sentiment 10% 2.50 1.50 1.50 3.00 2.50 1.50 Geopolitical Developments 10% 3.50 3.50 3.75 3.75 3.75 3.50
Market Liquidity 10% 2.00 2.50 2.50 4.00 4.50 4.00 Regulatory Developments 20% 2.48 2.31 2.64 0.99 2.31 1.16
Overall Score (0-5) 100% 2.56 2.57 2.64 2.94 3.00 2.35
Market View Neutral Neutral Neutral Positive Positive Negative
Source: Markaz Research
As per the seven force framework assessment, we tend to be positive for Qatar and Oman while we express a neutral view for Saudi Arabia, Kuwait and UAE and have a negative view on Bahrain.

R E S E A R C H January 2009
Kuwait Financial Centre “Markaz”
20
C. Investment Themes for 2009 While the broad theme would be equities (both global and regional) we also consider the following to be interesting ideas to explore: 1. Playing on Volatility
The most important feature of 2008 was the peaking of volatility. The Markaz Volatility Index (MVX) established new peaks especially in high octane markets like Dubai, Saudi Arabia and Qatar (Figure 6). Except Saudi Arabia and Kuwait, all other markets set new historic highs in their volatility during the year (October 2008 to be precise). Figure: 6 – Markaz Volatility Index Levels – End December 2008
8,701
5,2584,689
3,238
13,578
6,073
9,202
14,354
10,242
11,73412,891
10,374
291686 484412299581 376678 781
513 583 612
2,641
4,268
2,3102,285
3,8694,203
6,862
3,505
6,1715,167
2,768
7,903
0
2000
4000
6000
8000
10000
12000
14000
16000M
VX
-Du
bai
MV
X-S
audi
Ara
bia
MV
X-Q
atar
MV
X-O
man
MV
X-G
CC
MV
X-E
M
MV
X-A
bu
Dha
bi
MV
X-
S&P
50
0
MV
X I
nd
ia
MV
X C
hin
a
MV
X-K
uwai
t
MV
X-
Bah
rain
HighLowCurrent Value
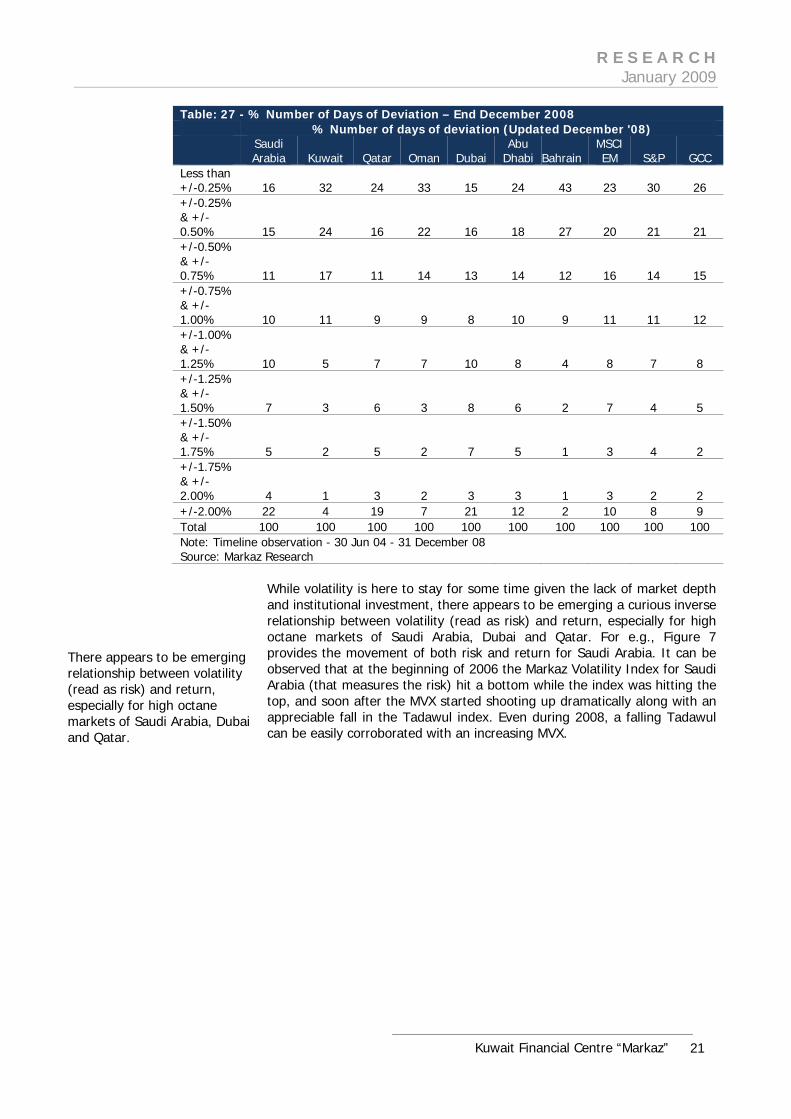
Source: Markaz Research Traditionally, the GCC markets (except Bahrain and Oman) always found themselves very high on volatility. (Table: 27). The large volatility bands for GCC markets compared to other markets signifies the extent of volatility present. It is quite common place in GCC stock markets to witness a single day movement of +/-2% as compared to either emerging markets or developed markets. For e.g., nearly 22% of trading days in Saudi Arabia witnessed a spike of +/-2% while the comparative figure for Emerging markets is 10% and S&P 500 8%. Qatar and Dubai were not far behind. High levels of speculation may cause these volatility spikes.
Except Saudi Arabia and Kuwait, all other markets set new historic highs in their volatility during the year. Traditionally, the GCC markets (except Bahrain and Oman) always found themselves very high on volatility.
R E S E A R C H January 2009
Kuwait Financial Centre “Markaz”
21
Table: 27 - % Number of Days of Deviation – End December 2008 % Number of days of deviation (Updated December '08)
Saudi Arabia Kuwait Qatar Oman Dubai
Abu Dhabi Bahrain
MSCI EM S&P GCC
Less than +/-0.25% 16 32 24 33 15 24 43 23 30 26 +/-0.25% & +/-0.50% 15 24 16 22 16 18 27 20 21 21 +/-0.50% & +/-0.75% 11 17 11 14 13 14 12 16 14 15 +/-0.75% & +/-1.00% 10 11 9 9 8 10 9 11 11 12 +/-1.00% & +/-1.25% 10 5 7 7 10 8 4 8 7 8 +/-1.25% & +/-1.50% 7 3 6 3 8 6 2 7 4 5 +/-1.50% & +/-1.75% 5 2 5 2 7 5 1 3 4 2 +/-1.75% & +/-2.00% 4 1 3 2 3 3 1 3 2 2 +/-2.00% 22 4 19 7 21 12 2 10 8 9 Total 100 100 100 100 100 100 100 100 100 100 Note: Timeline observation - 30 Jun 04 - 31 December 08 Source: Markaz Research
While volatility is here to stay for some time given the lack of market depth and institutional investment, there appears to be emerging a curious inverse relationship between volatility (read as risk) and return, especially for high octane markets of Saudi Arabia, Dubai and Qatar. For e.g., Figure 7 provides the movement of both risk and return for Saudi Arabia. It can be observed that at the beginning of 2006 the Markaz Volatility Index for Saudi Arabia (that measures the risk) hit a bottom while the index was hitting the top, and soon after the MVX started shooting up dramatically along with an appreciable fall in the Tadawul index. Even during 2008, a falling Tadawul can be easily corroborated with an increasing MVX.
There appears to be emerging relationship between volatility (read as risk) and return, especially for high octane markets of Saudi Arabia, Dubai and Qatar.

R E S E A R C H January 2009
Kuwait Financial Centre “Markaz”
22
Figure: 7 – Saudi Arabia Index & MVX Saudi Arabia Trend
02000400060008000
10000120001400016000180002000022000
3-Ja
n-04
14-A
pr-0
420
-Jul
-04
25-O
ct-0
413
-Feb
-05
21-M
ay-0
524
-Aug
-05
7-D
ec-0
522
-Mar
-06
27-J
un-0
63-
Oct
-06
22-J
an-0
729
-Apr
-07
1-Au
g-07
14-N
ov-0
725
-Feb
-08
1-Ju
n-08
6-Se
p-08
24-D
ec-0
8
0
2000
4000
6000
8000
10000
12000
14000
16000Saudi Index (LHS) MVX Saudi (RHS)
Source: Markaz Research We feel that this inverse relationship between risk and return can be intelligently exploited through asset allocation models. Clients can do well to structure asset allocation that will underweight equities during increasing MVX and overweight equities during falling MVX. Our tests on this revealed very superior results.
2. Sector Picks
While playing the asset allocation game from a country perspective is intuitive, it may also be interesting to look at the problem from a sector angle. In light of the latest developments, it is obvious that there are some sectors that are favored and the rest dumped. We did a bottom up assessment to come out with our favored and disfavored list (Table 28)
Table 28: Sector Picks Favored Sectors
Expected Earnings Growth (2009)
Disfavored sectors Expected Earnings Growth (2009)
Telecom 21% Investment Services -25% Chemicals-Commodity
10% Industrial Conglomerates
-11%
Steel 10% Marine Port Services -10%
Utilities 10% Construction Materials -10% Real Estate -9% Banks -6% Oil & Gas Refining 2% Source: Markaz Research
The list of disfavored sectors outnumber the favored ones in line with the current environment. At the top of the favored list is Telecom (a defensive play). Even during 2008, the sector posted a solid 26% growth when the overall earnings growth remained flat for the year. Hence, they have shown tremendous resilience even during tough times. Most of the regional telecom companies have expanded beyond their shores and are buying up growth quite aggressively. However, during 2009 they may slow down their
This inverse relationship between risk and return can be intelligently exploited through asset allocation models. The list of disfavored sectors outnumbers the favored ones in line with the current environment. Most of the regional telecom companies have expanded beyond their shores and are buying up growth quite aggressively.
R E S E A R C H January 2009
Kuwait Financial Centre “Markaz”
23
expansion given the tight liquidity situation although purely organic growth in business should see them through. Surprisingly, we have commodities and steel also figuring in the favored list given the huge drop in commodity prices. We believe that the sharp fall in commodity prices during 2008 will limit the downside from here. Even a small rebound in prices may easily fetch our expected earnings forecast. Of course, the last in our list is a defensive sector i.e., utilities. Top on the list of our disfavored sector list is investment services. This sector heavily depends on the strong performance of capital markets, which may not come through at least during the first half of the year. Also, many of these companies are small caps with weak balance sheets. They may be affected by the liquidity crunch and will find it difficult to come out of it at least during 2009. Industrial conglomerates will also face tough times due to a not so friendly business environment projected for 2009. While real estate and banks find their place down the order (and not up the order) we would view these earnings forecast with more of downward bias than otherwise.
3. Value Hunting
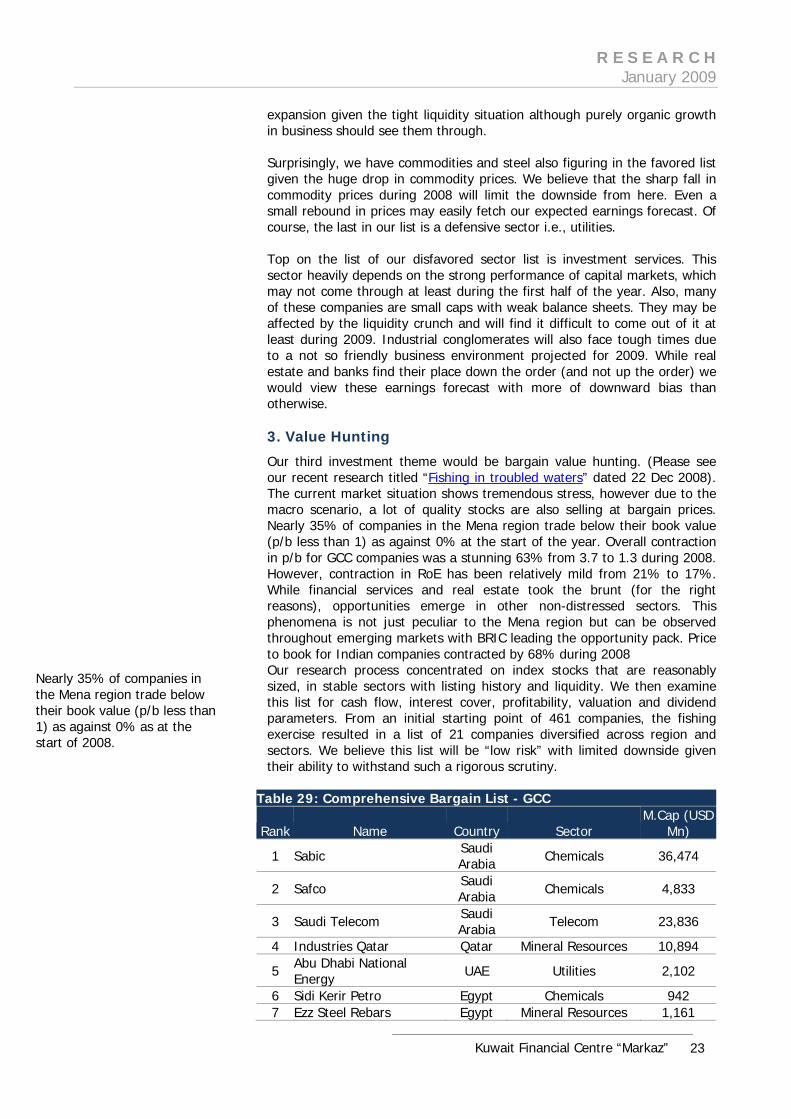
Our third investment theme would be bargain value hunting. (Please see our recent research titled “Fishing in troubled waters” dated 22 Dec 2008). The current market situation shows tremendous stress, however due to the macro scenario, a lot of quality stocks are also selling at bargain prices. Nearly 35% of companies in the Mena region trade below their book value (p/b less than 1) as against 0% at the start of the year. Overall contraction in p/b for GCC companies was a stunning 63% from 3.7 to 1.3 during 2008. However, contraction in RoE has been relatively mild from 21% to 17%. While financial services and real estate took the brunt (for the right reasons), opportunities emerge in other non-distressed sectors. This phenomena is not just peculiar to the Mena region but can be observed throughout emerging markets with BRIC leading the opportunity pack. Price to book for Indian companies contracted by 68% during 2008 Our research process concentrated on index stocks that are reasonably sized, in stable sectors with listing history and liquidity. We then examine this list for cash flow, interest cover, profitability, valuation and dividend parameters. From an initial starting point of 461 companies, the fishing exercise resulted in a list of 21 companies diversified across region and sectors. We believe this list will be “low risk” with limited downside given their ability to withstand such a rigorous scrutiny.
Table 29: Comprehensive Bargain List - GCC
Rank Name Country Sector M.Cap (USD
Mn)
1 Sabic Saudi Arabia Chemicals 36,474
2 Safco Saudi Arabia Chemicals 4,833
3 Saudi Telecom Saudi Arabia Telecom 23,836
4 Industries Qatar Qatar Mineral Resources 10,894
5 Abu Dhabi National Energy UAE Utilities 2,102
6 Sidi Kerir Petro Egypt Chemicals 942 7 Ezz Steel Rebars Egypt Mineral Resources 1,161
Nearly 35% of companies in the Mena region trade below their book value (p/b less than 1) as against 0% as at the start of 2008.

R E S E A R C H January 2009
Kuwait Financial Centre “Markaz”
24
8 Saudi Electric Saudi Arabia Utilities 9,998
9 Agility Kuwait Transportation 2,619
10 Etihad Etisalat Saudi Arabia Telecom 4,349
11 Orascom Telecom Egypt Telecom 4,488 12 Zain Kuwait Telecom 17,005
13 Emirates Telecommunications UAE Telecom 19,733
14 Telecom Egypt Egypt Telecom 4,661
15 Yansab Saudi Arabia Chemicals 2,212
16 Dana Gas UAE Energy 1,078
17 Savola Group Saudi Arabia
Industrial Conglomerates 2,833
18 S. Valley Cement Egypt Mineral Resources 493
19 Emirates Integrated Telecom UAE Telecommunications
Services 2,658
20 Qatar Gas Transport (NAKILAT) Qatar Transportation 2,998
21 Almarai Saudi Arabia Food & Beverages 3,429
Source: Reuters 3000 Xtra, Zawya Investor, Markaz Research
4. Capital Protection
As explained before, the year 2008 can be easily classified as a year of “Risk”. What this means is that risk aversion among investors has increased enormously. Having realized losses ranging from 30% to 70% of their investment value, clients would hesitate to take new risks as they enter 2009. Hence, strategies that can protect capital or at least minimize losses would be favored as an investment theme for 2009. While such capital protected themes have been marketed for a long time for global market products, they are few and far between for regional market exposure. This is primarily due to lack of avenues to execute such a strategy. For e.g., global managers use derivatives (options especially) to achieve their capital protected status. In the absence of derivatives markets (only a limited market exist in Kuwait), managers have shied away from offering capital protected ideas to clients. However, we believe that use of dynamic asset allocation strategies can achieve this objective, though not completely. We favor adopting CPPI (Constant Portfolio Proportion Insurance) technique to pre-define loss limits (say 10% or 20%) and position asset allocation (between equities and cash) in order to drastically minimize risk. Our lab tests show phenomenal results.
5. Consolidation Opportunities
Our final idea rests on Mergers and Acquisitions. These are definitely extraordinary times with extraordinary challenges. The global financial crisis has been gaining in weight and intensity on a daily basis. What started as a liquidity issue has now ballooned into a solvency issue. More than providing necessary liquidity to the financial system, governments all over the world are now worried about enabling companies to stay solvent. In spite of such wishful thinking, the number of companies going bust will certainly be on the rise during 2009 globally and regionally. Portfolio strategies that can identify possible takeover/merger targets in distressed sectors can do well in this environment. While it has been predicted to be a slow year for M&A
We favor adopting CPPI (Constant Portfolio Proportion Insurance) technique to pre-define loss limits (say 10% or 20%) and position asset allocation (between equities and cash) in order to drastically minimize risk. Portfolio strategies that can identify possible takeover/merger targets in distressed sectors can do well in this environment.
R E S E A R C H January 2009
Kuwait Financial Centre “Markaz”
25
globally (due to absence of cash to pursue), that may not be the case in GCC. The region has not experienced so far any major or severe corporate busts in the past. However, this time around a number of small and medium sized companies will be threatened out of existence due to weaker economic conditions, tight liquidity situation and poor positioning from corporate governance point of view. Rapid consolidation in various sectors will leave the strong stronger and the weak weaker. D. Key Questions 1. How low can oil prices go?
Without a doubt the most pertinent question for the GCC states in the coming year is where crude oil prices will be. Crude oil began 2008 at around $96/bbl, gaining steadily through the first half of the year before surging to a life-time high of $147/bbl in July on the back of a plummeting US Dollar and renewed political tension in the Middle East. The US-led global financial crisis caused crude oil to rapidly plummet 74% to its end of 2008 price of $42/bbl. Oil prices closed out 2008 with an annual loss of around 60%, the first annual decline since 2001 and the largest in its history of trading. A weak global economic outlook for 2009; with most of the developing world heading into recessions while demand in growing economies like China and India begins to slacken, does not bode well for oil prices. Energy analysts and various international agencies expect oil prices to rebound to an average of $52/bbl in 2009, with a possible high of $65-$70 towards the end of the year should further OPEC production cuts materialize and political tensions in the region intensify. A quick snap poll among experts by Markaz also revealed an expected average oil price of $65/b for 2009. Given this assessment, we do believe that oil price will not see levels witnessed during 1998 ($10/b) though it may not see the $100/b either. 2. Will the GCC region fall into a recession in 2009?
No, the GCC region will not fall into a recession in 2009. A recession is widely defined as a reduction of a country’s Gross Domestic Product for at least two consecutive quarters, visible through negative real GDP growth. So, while economic activity in the GCC will undoubtedly weaken as those sectors which were booming (e.g. Real Estate and Financial Services) begin to slow and companies begin to feel the full effect of the tightened credit, the economies will nonetheless continue to expand. The IMF is predicting mid-to-high single digit real GDP growth for all GCC countries, with the largest growth expected in Qatar (10.2% for 2009)7. As for the GCC as a whole, the IIF is predicting real GDP growth of 3.6% for 2009, more than half the 5.7% recorded in 2008.
7 The Institute of International Finance
A quick snap poll among experts by Markaz also revealed an expected average oil price of $65/b for 2009. As for the GCC as a whole, the IIF is predicting real GDP growth of 3.6% for 2009.
R E S E A R C H January 2009
Kuwait Financial Centre “Markaz”
26
3. Will 2009 be a year of government spending?
Government spending is the engine of any economy and so, those countries with the ability to continue to spend aggressively in 2009 will be the ones to recover the quickest. GCC governments (notably Saudi Arabia and UAE) have pledged to increase government spending in 2009 in order to boost economic expansion. Fitch believes that Abu Dhabi, Saudi Arabia and Kuwait will likely avoid major cuts to 2009 government spending plans, and will have to be content with running much lower surpluses – in single digit of GDP for Saudi Arabia and Abu Dhabi. It seems likely that GCC governments will allow for some stability to return to oil prices before enacting any adjustments to the budgets. The country most likely to cut government spending is Bahrain on account of its heavy dependence on oil revenues coupled with its low production levels. On the plus side, fiscal budgets are healthier now than they’ve ever been; sovereign balance sheets have strengthened considerably as oil revenue windfalls have been used to substantially lower sovereign debt. Fitch notes that Abu Dhabi and Kuwait's government non-reserve external assets exceeded 200% of GDP at the end of 2007, while Saudi Arabia's were 90% of GDP. Bahrain is in a less enviable position as it has domestic government deposits of up to 20% of GDP, but no publicly disclosed non-reserve external assets8. Saudi Arabia has forecasted a budget deficit of SAR 65 bn ($17.35 billion) in 2009, the first forecasted deficit since 2004. Last year’s budget surplus was forecasted at USD 10.7 bn, however, substantial oil revenue windfalls resulted in a record budget surplus of USD 157.5 bn for 2008. For 2009, government revenues are expected at USD 109 bn (based on an assumed oil price of $36/bbl) while expenditure is expected at USD 126.7 bn. The increase in planned government spending, despite declines in oil prices, is an effort to reassure investors and the private sector alike that the government is determined to push forward with planned infrastructure investments despite global financial woes The fiscal deficit will be financed mainly by drawing on the foreign asset reserves that the Saudi Arabian Monetary Agency (SAMA) has built up over the last year, when the average monthly increase of foreign assets was approximately USD 12 bn in the first ten months of 2008. SAMA’s foreign assets peaked at USD 461 bn in October9. Record oil revenues also helped the Kingdom reduce its public debt to less than 15% of GDP. These are taken as positive signs by industry analysts who believe that the Kingdom’s high foreign asset reserve will assist it in weathering the coming year while another school of analysts goes further by expected the forecasted deficit to turn into an actual surplus for 2009 on expectations that oil prices will be higher than those used to forecast the Kingdom’s budget. Kuwait, as at the end of December 2008, has passed through three quarters of its fiscal year and is expected to post a full year budget surplus of USD 7.3 bn, should oil prices maintain their current level and not fall below $35/bbl10. The average price of Kuwaiti oil for the first nine months of fiscal year 2008 was USD 93.8/bbl, which is nearly double the USD 50/bbl which
8 Fitch, GCC Public Finances and Oil Prices, November 2008 9 Saudi Arabian Monetary Authority, Monthly Statistical Bulletin 10 AlShall Consultancy, AlShall Weekly Economic Report, Volume 18, Issue 52, 4th January 2009
Fiscal budgets are healthier now than they’ve ever been; sovereign balance sheets have strengthened considerably as oil revenue windfalls have been used to substantially lower sovereign debt. Kuwait is expected to post a full year budget surplus of USD 7.3 bn.

R E S E A R C H January 2009
Kuwait Financial Centre “Markaz”
27
is used to estimate the budget. The average price of Kuwaiti oil in December plummeted to approximately USD 36/bbl. The Ministry of Finance announced that actual oil income amounted to USD 61 bn as at the end of November and is expected to earn an additional USD 3.6 bn in December, bringing 9M08 oil income to USD 64.8 bn. Overall government revenue is expected to equal USD 76 bn, with government spending coming in at USD 68.9 bn for fiscal year 2008. The UAE has approved a fiscal budget surplus of USD 11.5 bn for 2009. The Education and services sectors remain the top priority with an allocation of 23% and 37%, respectively, of the 2009 budget. Government spending has increased rapidly in the last six years, averaging 13.5% a year since 2003, and peaking at approximately 24% in 200611. The accelerated spending comes as government revenues increase on the back of high oil prices. The UAE’s consolidated government revenues (including ADIA investment income ADNOC profits) have grown at an average of 36% a year since 2003. It is worth noting that the official budget does not include the portion of Abu Dhabi’s oil revenue which is paid into reserve accounts in addition to income earned on the UAE’s stock of publicly owned foreign assets12. Qatar is set to announce its largest-ever fiscal budget for the year 2009, despite declining oil prices, with a 40% allocation to development projects, especially those pertaining to health, education and housing. The Qatari fiscal budget is based on an assumptive oil price of USD 55/bbl, and so will most likely continue to run a budget surplus, though smaller than those seen in recent years, as the Qatari government continues to spend aggressively. Government spending is expected to increase by roughly 10% in 2009, which is a marked deceleration of past years where government expenditure growth averaged 30% a year (2004 – 2008). Qatar has forecasted that the official fiscal surplus is expected to decline to 1.5% of GDP from 10.4% of GDP in 2008, to recover at 4.3% in 2010. Qatar's GDP in the third quarter of 2008 totalled USD 29 billion, a 63% increase over 3Q07. According to the Qatar Statistics Authority, the oil and gas sector contributed 73% to real GDP. Bahrain’s government revenues remain highly dependent on oil sales, and that is not likely to change going forward; therefore, government spending is expected to be the first victim of decreased oil prices in 2009. The 2009 government budget has not yet been approved; however, it is likely that Bahrain will run a budget deficit in 2009, the first since 2002. Public spending has risen exponentially in the past six years as the government has implemented policies aimed at diversifying the economy, increasing employment of nationals and strengthening infrastructure. Government spending has increased by an average of 12% a year since 200313. Oman is also expected to run a budget deficit of USD 2.1 bn in 2009, representing 5% of the country's GDP and 14% of expected government revenues. Government revenues are expected to equal USD 14.6 bn in 2009 versus USD 14 bn in 2008. Oil revenues, which are calculated on an assumed oil price of $45/bbl, will account for 75% of government revenues.
11 IIF Database 12 Economic Intelligence Unit, UAE Monthly Economic Report, November 2008 13 IIF Database
Government spending has increased rapidly in the last six years, averaging 13.5% a year since 2003, and peaking at approximately 24% in 2006 Bahrain’s government revenues remain highly dependent on oil sales, and that is not likely to change going forward; therefore, government spending is expected to be the first victim of decreased oil prices in 2009.
R E S E A R C H January 2009
Kuwait Financial Centre “Markaz”
28
Government spending for 2009 is forecasted at USD 16.7 bn compared to USD 15 bn in 2008. 4. What happens to the dreams and aspirations of Dubai/Qatar/Bahrain wanting to be global financial centers?
Abundant opportunities, rapidly expanding economies and openness to foreign investing have made Dubai, Qatar, and Bahrain prime investment locations for international investors over the past few years. However, given current global financial woes, these same investors are rapidly running for safer havens as pessimism and a worsening global outlook take hold. As such, we do not believe that these hopes will be squashed for good by the current climate; however, many changes need to be enacted before these countries will be seen as attractive centers for investment, such as increased transparency, stricter regulations, and a more faithful adherence to corporate governance principles. Until these changes come into play in a serious and consistent manner, we would expect these countries, and indeed the GCC as a whole, to be marginalized going forward. 5. Will there be a move towards de-pegging currencies from USD?
In short, no. The forecasted global economic outlook for 2009 is not conducive for such a move, especially since the ever-important oil exports are priced in US dollars. In addition, should any de-pegging occur, it would likely include a move to a basket of currencies containing a majority of US dollars, such as in the case of Kuwait. The strengthening of the US dollar since September is a plus for the GCC as it helps to ease imported inflation, reduce pressure to revalue currencies (on account of rising inflation), in addition to allaying investor fears. However, the new zero-0.25% US interest rate range is incompatible with some GCC nations, such as the UAE, as it discourages saving. All GCC states are expected to retain their current US dollar currency pegs at least through 2010. A GCC single currency has long been in the works; however, lack of concurrence on the functions of a Central Bank including its location, in addition to divergence on inflation parameters has stalled execution of the plan. The formation of a joint GCC monetary policy council is expected in late 2009, which would precede the formation of a GCC central bank, however, given current global and regional financial conditions, we do not expect any of these plans to materialize in 2009. 6. Can we expect to see more corporate failures? In that case, will they be bailed out by the government? What implications does this have for government ownership in companies?
The last three months of 2008 brought with it a slew of corporate news; Kuwait’s Gulf Bank declared losses of over USD 1 bn from derivatives trading, resulting in a government bailout, while in the UAE, Dubai’s two largest mortgage lenders, Amlak Finance and Tamweel, effectively collapsed, were nationalized and forced to merge. These are uncommon occurrences in the region and we do not expect them to increase in 2009. GCC corporations have thrived in a benign environment characterized by loose corporate governance. The environment is no longer benign, liquidity
Many changes need to be enacted before these countries will be seen as attractive centers for investment, such as increased transparency, stricter regulations, and a more faithful adherence to corporate governance principles. Dubai’s two largest mortgage lenders, Amlak Finance and Tamweel, effectively collapsed, were nationalized and forced to merge.

R E S E A R C H January 2009
Kuwait Financial Centre “Markaz”
29
is drying up and lines of credit are freezing; however, corporate governance remains slack. This will prove to be a dangerous combination for many corporations and we expect the weak to fall in such a setting. As for further government bailouts, we do not expect these to occur with the frequency as we’ve seen in the U.S. and Europe. Rather, we would expect to see government bailouts only in certain, vital, sectors which are particularly distressed (such as Real Estate for Dubai) in addition to cases where the company in question constitutes a systemic risk to the country or region (read banks). Our reasoning behind this statement is simply because GCC governments already hold substantial ownership in many companies through their sovereign wealth funds (SWF’s), although the ownership positions vary in their extremity. For instance, the Government of Saudi Arabia holds 45% of its local market on account of its 70% holding in Sabic (The Tadawul’s largest listed company). In the UAE, the Ministry of Finance and Industry holds a 60% stake in Etisalat, while in Abu Dhabi, the Abu Dhabi Investment Authority (ADIA) owns (through ADIC) 73% of National Bank of Abu Dhabi and 65% of Abu Dhabi Commercial Bank. However, increased government ownership may occur in Kuwait, where the government has the least stakes in the local market, only 12% in April 2008, mainly through the Kuwait Investment Authority (KIA), which is the country’s largest SWF. However, in terms of reach, the Public Institute for Social Security (PIFSS) holds the most number of companies, investing in 21 listed stocks, the largest holding of which is its 15% stake in Agility14. Therefore, should there be increased government ownership in Kuwait, it will likely come from KIA, which has already set up a government fund to invest in the local stock market.
14 All ownership stakes represented as of April 2008.
R E S E A R C H January 2009
Kuwait Financial Centre “Markaz”
30
Appendix 1: 7-Force Framework 1. Economic parameters Even though this is a very broad parameter to evaluate, we have taken in five criterions with equal weights to evaluate the attractiveness of the economy. These five parameters are mostly forward looking and the estimates are arrived at by taking into consideration forecast data from International Institute of Finance (IIF). a. Forecasted Real GDP Growth b. Forecasted Inflation c. Forecasted Fiscal balance as % of GDP d. Forecasted Current account balance as % of GDP e. Historical broad money growth trend (M3) 2. Valuation attraction We have considered the levels of valuation on an historical basis (TTM) as of 2008 to arrive at ascertaining the attractiveness of the markets. The valuation parameters used are: a. Price to Earnings b. Price to Book c. Dividend Yield 3. Earnings growth potential Earnings growth potential provides the forecasted earnings expectation for 2009. We have arrived at these forecasts using a bottoms up approach of aggregating earnings data for more than 600 companies listed in GCC stock markets. 4. Investor sentiment We have used the consumer confidence survey results over a period of time provided by Bayt.com to ascertain the trend in investor sentiments. 5. Geopolitical Developments Due to the changing nature of the geo political scenario in the region we have used two different equally weighted parameters provided by EIU to arrive at a score for geo political risk.
a. Political risk b. Economic structure risk
6. Market liquidity Due to the change in liquidity levels in the markets post the credit crisis, we have included this parameter to evaluate attractiveness in terms of liquidity. We have used value traded to ascertain the same. 7. Regulatory developments As the region continues to be in a infancy stage when it comes to regulation, we have ascertained the level of regulatory developments using three equally weighted parameters. a. Existence of a Capital Market Authority b. Level of institutional investment in the markets (AUM/Market cap) c. Foreign Inclusion Factor levels. All the parameters are scored on a scale of 0-5, wherein 0 would mean the lowest score implying negative assessment and 5 would mean the highest implying positive assessment.
We have taken in five criterions with equal weights to evaluate the attractiveness of the economy. We have ascertained the level of regulatory developments using three equally weighted parameters.
R E S E A R C H January 2009
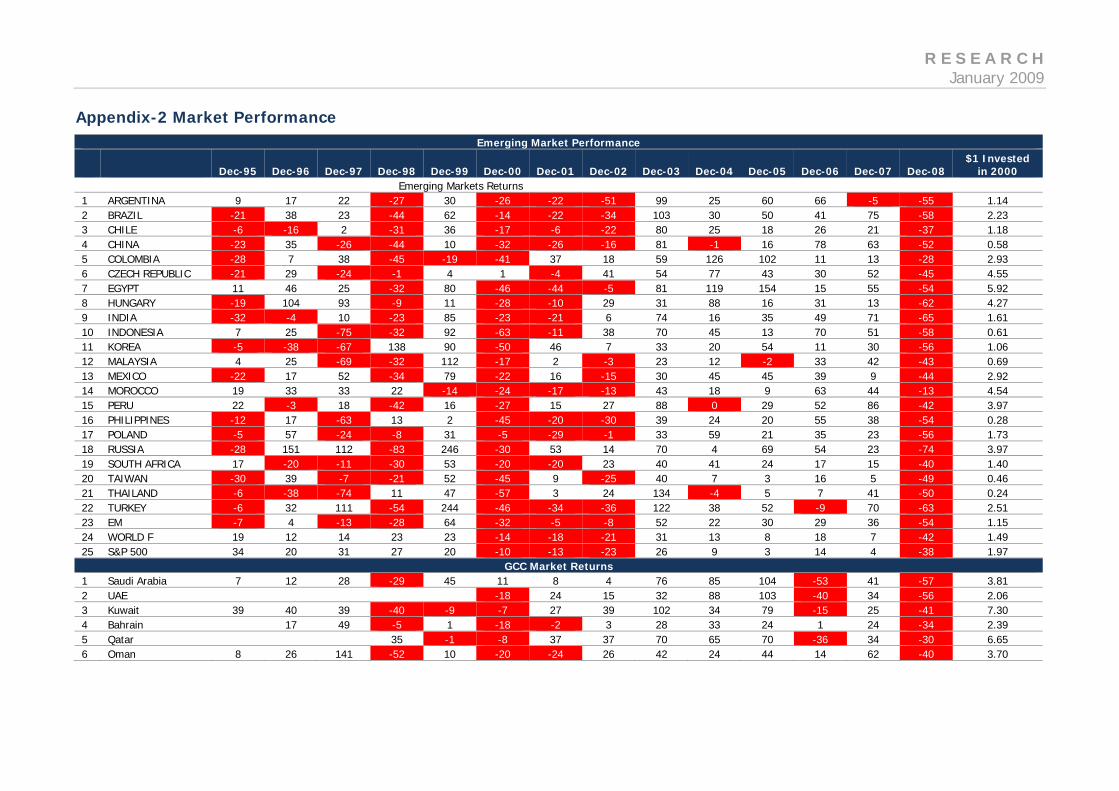
Appendix-2 Market Performance Emerging Market Performance
Dec-95 Dec-96 Dec-97 Dec-98 Dec-99 Dec-00 Dec-01 Dec-02 Dec-03 Dec-04 Dec-05 Dec-06 Dec-07 Dec-08 $1 Invested
in 2000 Emerging Markets Returns
1 ARGENTINA 9 17 22 -27 30 -26 -22 -51 99 25 60 66 -5 -55 1.14 2 BRAZIL -21 38 23 -44 62 -14 -22 -34 103 30 50 41 75 -58 2.23 3 CHILE -6 -16 2 -31 36 -17 -6 -22 80 25 18 26 21 -37 1.18 4 CHINA -23 35 -26 -44 10 -32 -26 -16 81 -1 16 78 63 -52 0.58 5 COLOMBIA -28 7 38 -45 -19 -41 37 18 59 126 102 11 13 -28 2.93 6 CZECH REPUBLIC -21 29 -24 -1 4 1 -4 41 54 77 43 30 52 -45 4.55 7 EGYPT 11 46 25 -32 80 -46 -44 -5 81 119 154 15 55 -54 5.92 8 HUNGARY -19 104 93 -9 11 -28 -10 29 31 88 16 31 13 -62 4.27 9 INDIA -32 -4 10 -23 85 -23 -21 6 74 16 35 49 71 -65 1.61 10 INDONESIA 7 25 -75 -32 92 -63 -11 38 70 45 13 70 51 -58 0.61 11 KOREA -5 -38 -67 138 90 -50 46 7 33 20 54 11 30 -56 1.06 12 MALAYSIA 4 25 -69 -32 112 -17 2 -3 23 12 -2 33 42 -43 0.69 13 MEXICO -22 17 52 -34 79 -22 16 -15 30 45 45 39 9 -44 2.92 14 MOROCCO 19 33 33 22 -14 -24 -17 -13 43 18 9 63 44 -13 4.54 15 PERU 22 -3 18 -42 16 -27 15 27 88 0 29 52 86 -42 3.97 16 PHILIPPINES -12 17 -63 13 2 -45 -20 -30 39 24 20 55 38 -54 0.28 17 POLAND -5 57 -24 -8 31 -5 -29 -1 33 59 21 35 23 -56 1.73 18 RUSSIA -28 151 112 -83 246 -30 53 14 70 4 69 54 23 -74 3.97 19 SOUTH AFRICA 17 -20 -11 -30 53 -20 -20 23 40 41 24 17 15 -40 1.40 20 TAIWAN -30 39 -7 -21 52 -45 9 -25 40 7 3 16 5 -49 0.46 21 THAILAND -6 -38 -74 11 47 -57 3 24 134 -4 5 7 41 -50 0.24 22 TURKEY -6 32 111 -54 244 -46 -34 -36 122 38 52 -9 70 -63 2.51 23 EM -7 4 -13 -28 64 -32 -5 -8 52 22 30 29 36 -54 1.15 24 WORLD F 19 12 14 23 23 -14 -18 -21 31 13 8 18 7 -42 1.49 25 S&P 500 34 20 31 27 20 -10 -13 -23 26 9 3 14 4 -38 1.97
GCC Market Returns 1 Saudi Arabia 7 12 28 -29 45 11 8 4 76 85 104 -53 41 -57 3.81 2 UAE -18 24 15 32 88 103 -40 34 -56 2.06 3 Kuwait 39 40 39 -40 -9 -7 27 39 102 34 79 -15 25 -41 7.30 4 Bahrain 17 49 -5 1 -18 -2 3 28 33 24 1 24 -34 2.39 5 Qatar 35 -1 -8 37 37 70 65 70 -36 34 -30 6.65 6 Oman 8 26 141 -52 10 -20 -24 26 42 24 44 14 62 -40 3.70

R E S E A R C H January 2009
Disclaimer This report has been prepared and issued by Kuwait Financial Centre S.A.K (Markaz), which is regulated by the Central Bank of Kuwait. The report is intended to be circulated for general information only and should not to be construed as an offer to buy or sell or a solicitation of an offer to buy or sell any financial instruments or to participate in any particular trading strategy in any jurisdiction. The information and statistical data herein have been obtained from sources we believe to be reliable but no representation or warranty, expressed or implied, is made that such information and data is accurate or complete, and therefore should not be relied upon as such. Opinions, estimates and projections in this report constitute the current judgment of the author as of the date of this report. They do not necessarily reflect the opinion of Markaz and are subject to change without notice. Markaz has no obligation to update, modify or amend this report or to otherwise notify a reader thereof in the event that any matter stated herein, or any opinion, projection, forecast or estimate set forth herein, changes or subsequently becomes inaccurate, or if research on the subject company is withdrawn. This report does not have regard to the specific investment objectives, financial situation and the particular needs of any specific person who may receive this report. Investors are urged to seek financial advice regarding the appropriateness of investing in any securities or investment strategies discussed or recommended in this report and to understand that statements regarding future prospects may not be realized. Investors should note that income from such securities, if any, may fluctuate and that each security’s price or value may rise or fall. Investors should be able and willing to accept a total or partial loss of their investment. Accordingly, investors may receive back less than originally invested. Past performance is historical and is not necessarily indicative of future performance. Kuwait Financial Centre S.A.K (Markaz) does and seeks to do business, including investment banking deals, with companies covered in its research reports. As a result, investors should be aware that the firm may have a conflict of interest that could affect the objectivity of this report.

R E S E A R C H January 2009
Strategic Research Fishing in Troubled Waters(Dec-08) UAE Outlook (Oct-08) Down and Out: Saudi Stock Outlook (Oct-08) Kuwait Stocks: Fair Value Not Far Away (Sept-08) Mr. GCC Market-Manic Depressive (Sept-08) Global Investment Themes (June-08) To Yield or Not To Yield (May-08) The Golden Portfolio (Apr-08) Banking Sweet spots (Apr-08) The “Vicious Square” Monetary Policy options for Kuwait (Feb-08) Outlook 2008: GCC (Jan-08) China and India: Too Much Too Fast (Oct-07) A Potential USD 140b Industry: Review of Asset Management industry in Kuwait (Sep-07) A Gulf Emerging Portfolio: And Why Not? (Jun-07) To Leap or To Lag: Choices before GCC Regulators (Apr-07) Derivatives Market in GCC (Mar-07) Managing GCC Volatility (Feb-07) GCC for Fundamentalists (Dec-06) GCC Leverage Risk (Nov-06) GCC Equity Funds (Sep-06)
Periodic ResearchTitle Frequency
Markaz Daily Morning Brief Daily Markaz Kuwait Watch Daily KSE Market Weekly Snapshot Weekly KSE Market Weekly Review Weekly International Market Update Weekly Mena Mergers & Acquisitions Monthly Option Market Activity Monthly GCC Asset Allocation & Volatility Monthly GCC Equity Funds Quarterly
Real Estate Saudi Arabia (Sep-08) Abu Dhabi (July-08) Algeria (Mar-08) Jordan (Mar-08) Kuwait (Feb-08) Lebanon (Dec-07) Qatar (Sep-07) Saudi Arabia (Jul-07) U.S.A. (May-07) Syria (Apr-07)
Infrastructure Power Water Airports Seaports Roadways Railways ICT
Sector Research
Markaz Research is available on: Bloomberg Type “MRKZ” <GO>, Thomson Financial, Reuters Knowledge, Zawya Investor & Noozz. To obtain a print copy, kindly contact: Kuwait Financial Centre “Markaz” Client Relations & Marketing Department Tel: +965 2 224 8000 Ext. 1804 Fax: +965 22414499 Postal Address: P.O. Box 23444, Safat, 13095, State of Kuwait Email: [email protected] markaz.com
Markaz Research Offerings

R E S E A R C H January 2009
Bahrain • Gulf Finance House (Oct-08) • Esterad Investment Company
(Aug-08) • Bahrain Islamic Bank (Aug-08) • Ithmaar Bank (July-08) • Tameer (July-08) • Batelco (July-08)
Research Coverage Market Cap as % of total Market cap 29%
Qatar • Qatar Fuel Co. (Dec-08) • Qatar Shipping Co (Dec-08) • Barwa Real Estate Co. (Nov-08) • Qatar Int’l Islamic bank (Nov-08) • Qatar Insurance Co. (Nov-08) • Qatar Telecom (Oct-08) • Qatar Gas Transport Co. (Oct-08) • Doha Bank (Aug-08) • Qatar National Bank (Aug-08) • QEWC (July-08) • QISB (July-08) • Masraf Al-Rayan (Jun-08) • Commercial Bank of Qatar (Jun-08) • Industries Qatar (May-08) Research Coverage Market Cap as % of total Market cap 93%
UAE • Gulf Cement Company (Jan-09) • Abu Dhabi National Hotels (Dec-08) • Dubai Investments (Dec-08) • Arabtec Holding (Dec-08) • Air Arabia ( Nov-08) • Union Properties (Nov-08) • Dubai Islamic bank (Oct-08) • Aldar Properties (Sept-08) • Union National Bank (Aug-08) • Dubai Financial Market (July-08) • Emaar Properties (July-08) • Dana Gas (July-08) • FGB (July-08) • DP World (July-08) • ADCB (Jun-08) • Etisalat (Jun-08) • NBAD (May-08) Research Coverage Market Cap as % of total Market cap 28%
Oman • Galfar Engineering & Cont. (Nov-08) • Oman Telecommunications (Sept-08) • Bank Muscat(Sept-08) • Oman cement (Sept-08) • Raysut Cement Company (Aug-08) • National Bank of Oman (Aug-08) • OIB (July-08)
Research Coverage Market Cap as % of total Market cap 69%
Egypt • Commercial Int’l Bank (Oct-08) • Orascom Telecom (Sep-08) • Mobinil (Sep-08) • Telecom Egypt (Aug-08) • EFG-Hermes (Jun-08)
Research Coverage Market Cap as % of total Market cap 45%
Jordan • Arab Bank (Sept-08) • Cairo Amman Bank (Oct-08) Research Coverage Market Cap as % of total Market cap 39%
Saudi Arabia • Saudi Investment Bank (Jan-09) • Savola Group (Dec-08) • Kingdom Holding Co (Dec-08) • Al Marai Company (Nov-08) • Saudi Kayan Petro Co. (Aug-08) • Al Rajhi Bank (Aug – 08) • Arab National Bank (July-08) • Saudi Telecom Co. (Jun-08) • SAFCO (Jun-08) • Banque Saudi Fransi (Jun-08) • Riyad Bank (Jun-08) • Samba Financial Group (May-08) • Sabic (May-08) Research Coverage Market Cap as % of total Market cap 59%
Company Research
Markaz Research Offerings